Article

Regional New Particle Formation over the Eastern Mediterranean and Middle East

by
Panayiotis Kalkavouras
1,2,
Aikaterini BougiatiotI
2,*,
Tareq Hussein
3,4,
Nikos Kalivitis
1,
Iasonas Stavroulas
1,2,5,
Panagiotis Michalopoulos
2 and
Nikolaos Mihalopoulos
1,2,5,*
1
Environmental Chemical Processes Laboratory, Department of Chemistry, University of Crete, 71003 Heraklion, Greece
2
Institute for Environmental Research & Sustainable Development, National Observatory of Athens, 11810 Athens, Greece
3
Department of Physics, The University of Jordan, Amman 11942, Jordan
4
Institute for Atmospheric and Earth System Research (INAR)/Physics, Faculty of Science, University of Helsinki, PL 64, FI-00014 UHEL Helsinki, Finland
5
Climate & Atmosphere Research Centre (CARE-C), The Cyprus Institute, Nicosia 2121, Cyprus
*
Authors to whom correspondence should be addressed.
Atmosphere 2021, 12(1), 13; https://doi.org/10.3390/atmos12010013
Submission received: 16 November 2020 / Revised: 21 December 2020 / Accepted: 22 December 2020 / Published: 24 December 2020
(This article belongs to the Section Aerosols)

Abstract

:
Atmospheric new particle formation (NPF) events taking place over large distances between locations, featuring similar characteristics, have been the focus of studies during the last decade. The exact mechanism which triggers NPF still remains indefinable, so are the circumstances under which simultaneous occurrence of such events take place in different environments, let alone in environments which are parted by over 1200 km. In this study, concurrent number size distribution measurements were conducted in the urban environments of Athens (Greece) and Amman (Jordan) as well as the regional background site of Finokalia, Crete, all located within a distance of almost 1300 km for a 6-month period (February–July 2017). During the study period Athens and Finokalia had similar occurrence of NPF (around 20%), while the occurrence in Amman was double. When focusing on the dynamic characteristics at each site, it occurs that formation and growth rates at Amman are similar to those at Finokalia, while lower values in Athens can be ascribed to a higher pre-existing particle number at this urban site. By comparing common NPF events there are 5 concomitant days between all three sites, highly related to air masses origin. Additionally, for another 19 days NPF takes place simultaneously between Finokalia and Amman, which also share common meteorological characteristics, adding to a total of 60% out of 41 NPF events observed at Finokalia, also simultaneously occurring in Amman.

1. Introduction

Atmospheric new particle formation (NPF) is a phenomenon involving the nucleation of gas-phase atmospheric components into newly-formed particles, as well as their subsequent growth and coagulation. NPF is well documented throughout various environments [1], and has been found to be important for, amongst other things, modulating the number concentration of particles and cloud condensation nuclei (CCN) into the atmosphere [2,3]. Regional NPF events can be detected when a distinct burst of aerosol particles with diameters below 25 nm occurs, and the newly-formed mode is maintained for several hours [4]. Unlike regional events, during local-scale NPF events an intense appearance of a new mode in the particle number size distribution is observed, however without subsequent growth; these events commonly exhibit strong intensity and limited duration [5]. Although the mechanism of NPF, as well as the temporal (i.e., starting time and duration) and dynamic (i.e., formation and growth rates) properties differ among measuring sites and seasons [6], there are common features between adjoining locations with similar air mass history, suggesting that NPF has a spatial extent over large areas [7,8,9,10]. Hence, it is deemed necessary to perform concurrent submicron particle number size distribution (PNSD) measurements at sites nearby, in order to assess the regional scale of NPF.
A study in Germany reported concomitant NPF events in the city of Leipzig, and three other locations situated 10 to 50 km away for 20 days (May–June 2002), with these events at all four sites characterized by similar intensities [11]. Comparable results can be found over the Scandinavian Peninsula [7]; strong NPF events recorded in Southern and Northern Finland (Hyytiälä and Värriö, respectively), occurred within a spatial scale of 220 km reflecting thus the regional character of NPF. In a study conducted in Amman (Jordan) [12], high probability of NPF was reported when air masses cross over the Eastern Mediterranean reflecting the potential regionality of the phenomenon as part of larger-scale NPF process. In Greece, initial indications on regional-scale NPF phenomena have been observed at two coastal sites (within a distance of 120 km) located in the Aegean Sea (AS) during July 2013 [9]. PNSD measurements showed unambiguous regional NPF events, under a strong-channeled northeastern wind flow in the central AS, with the aerosol particles being formed and growing to bigger sizes 250 km prior to their initial detection. Recently, 35 concurrent events were reported over a 2-year period taking place at urban and regional background sites in Greece separated by 340 km, namely Athens and Finokalia, all associated with air masses originating from the North [10]. All above-mentioned reaffirm the notion that NPF can be a regional-scale phenomenon which evolves within a significant horizontal extent under similar regional-scale meteorological conditions.
The current work follows up on the initial assessment in Greece by [10], using a subset of the data analyzed in Greece and Jordan that covers a common period [10,12], and discusses the homogeneity of NPF events at an even larger, regional scale. Hence, we aim to (i) identify common events between Athens, Finokalia and Amman, locations separated by almost 1300 km, (ii) examine the processes and dynamic characteristics (e.g., formation and growth rates) leading to concurrent NPF at all the three stations and (iii) explore the essential role of meteorology via the air masses path arriving at the stations throughout NPF event days. In order to achieve these objectives, we use simultaneous measurements of aerosol PNSD collected from February 2017 to July 2017 at the above-mentioned areas, and carry out air trajectory FLEXPART simulations for the concurrent NPF days.

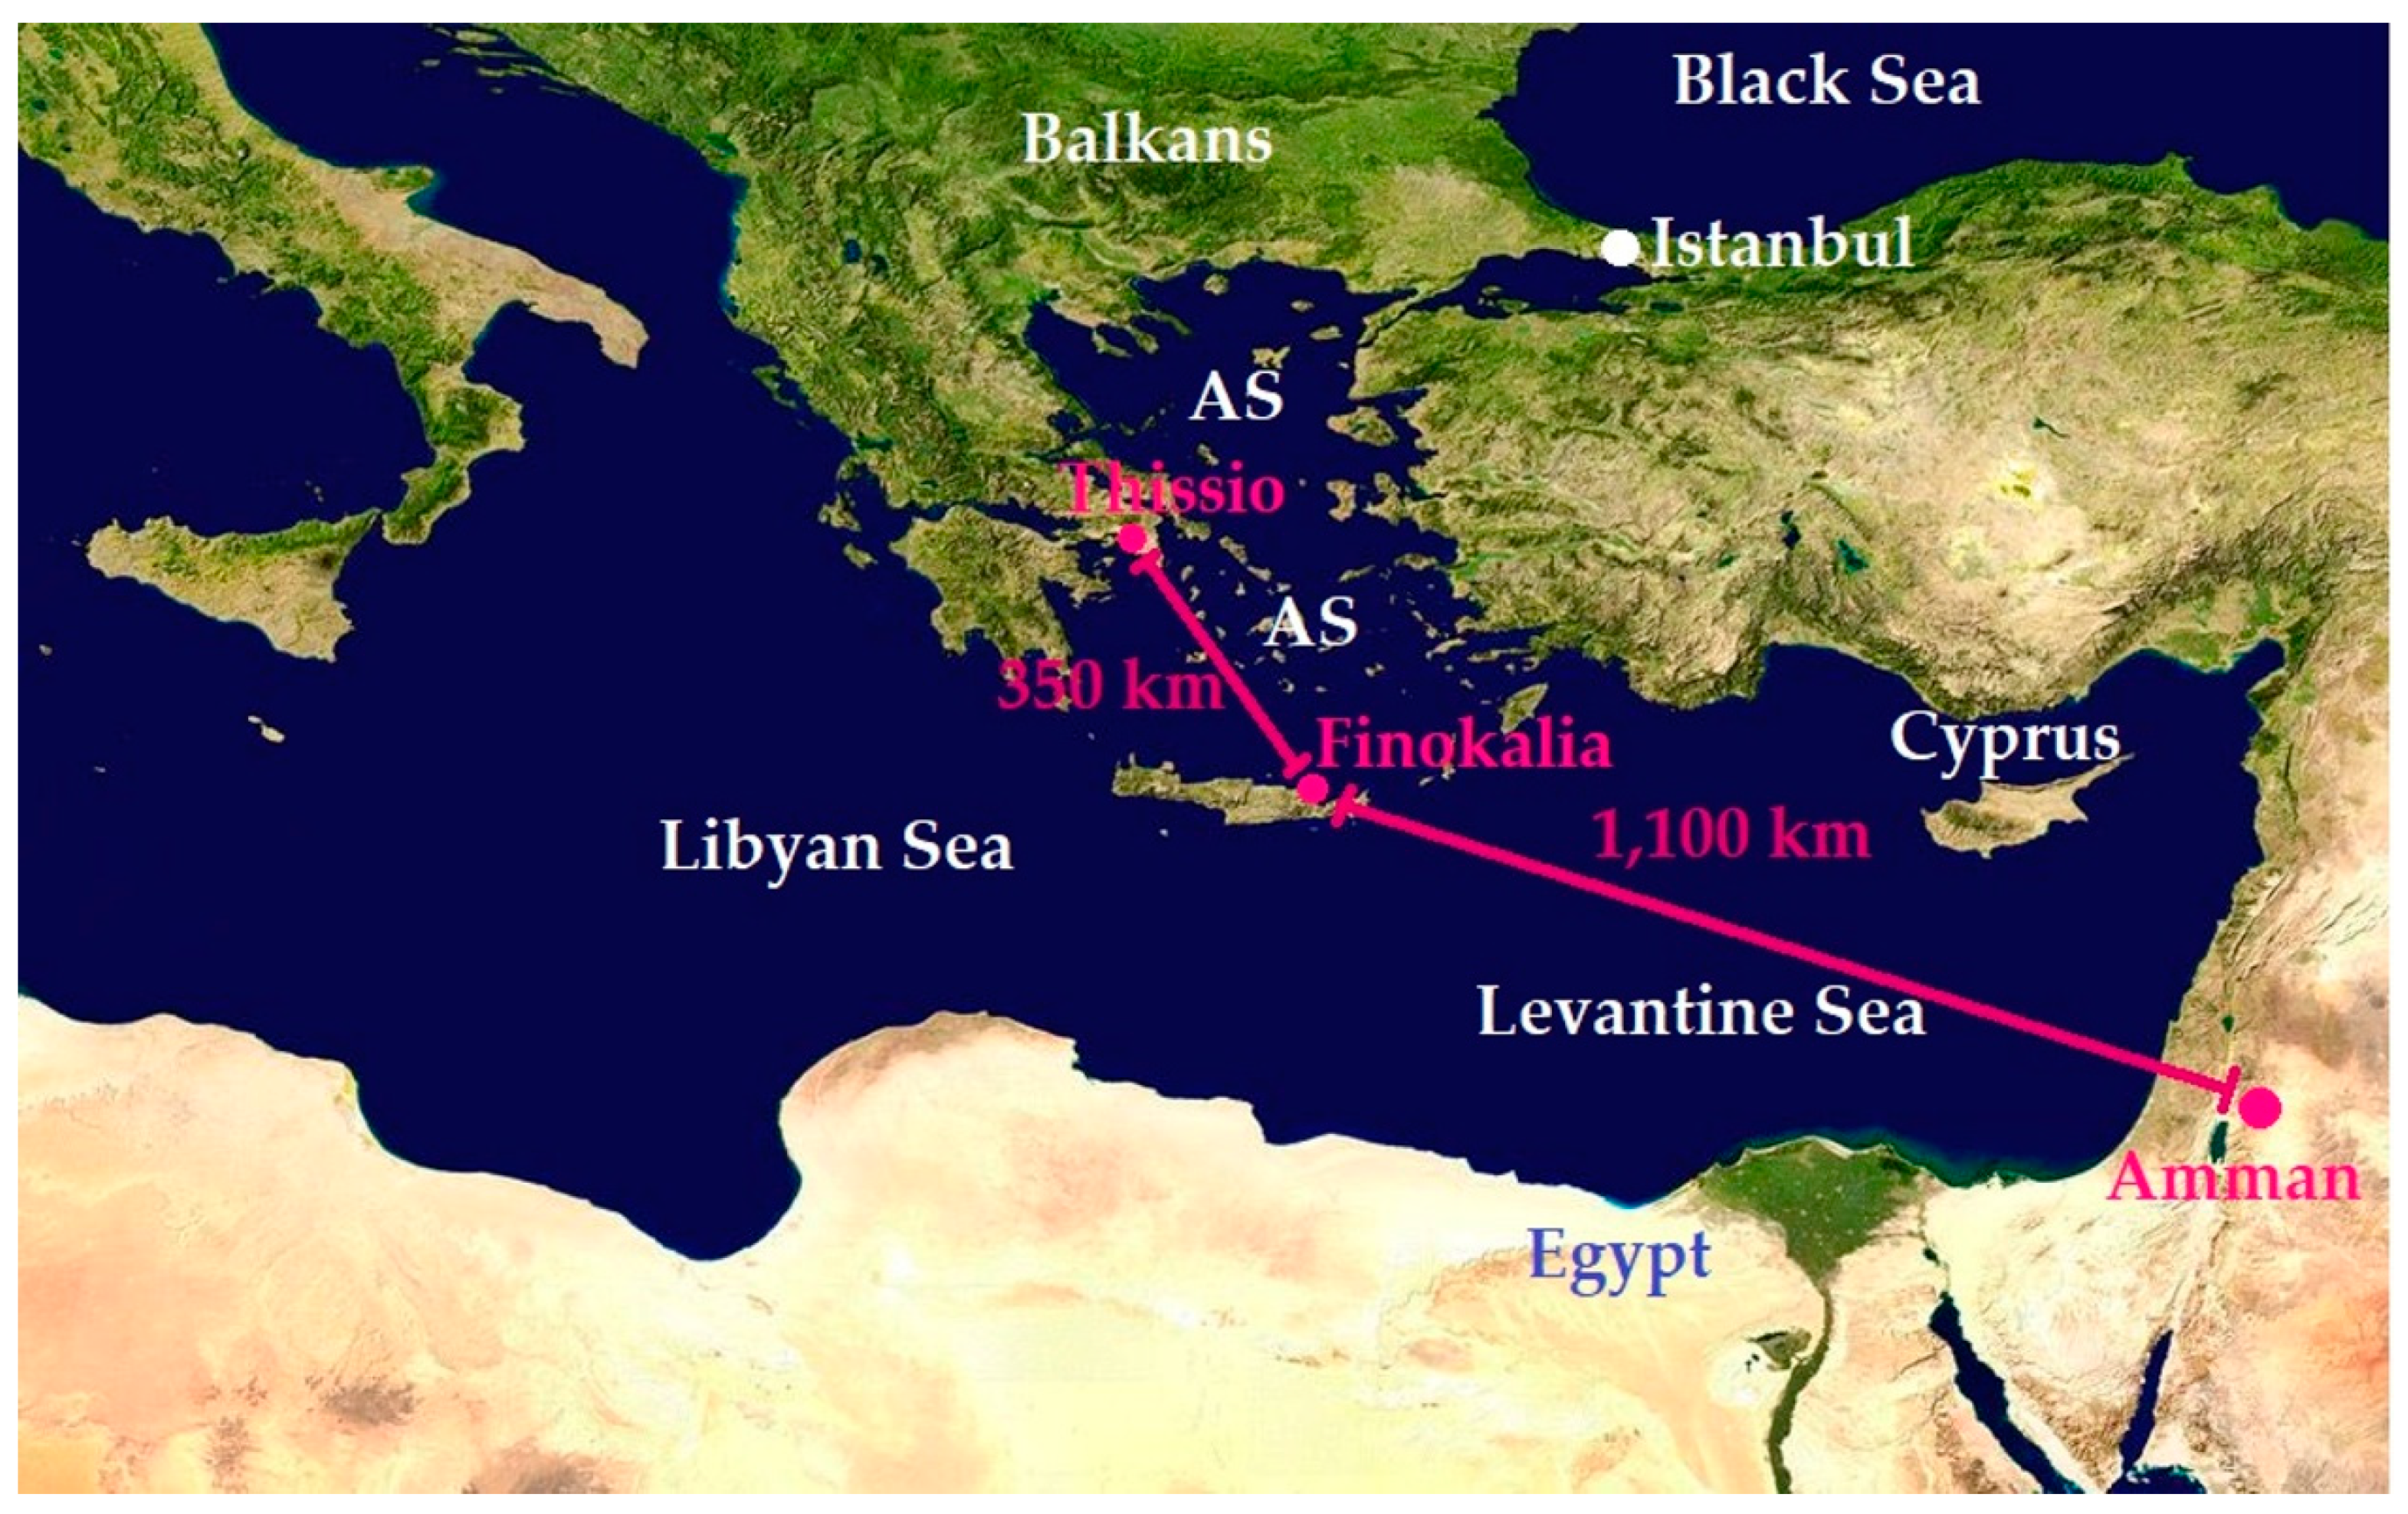
2. Experimental Setup and Data Analysis

2.1. Measurements

This work is based on PNSD measurements at three different locations. The measurement sites were: Thissio (37°97′23″ N, 23°72′5″ E) and Finokalia (35°20′16″ N, 25°40′11″ E) in Greece, and Amman (32°01′26″ N, 35°87′38″ E) in Jordan. Locations of the measuring stations are depicted in Figure 1. The Thissio Air Monitoring Station is located on a hill 105 m above sea level (a.s.l.), at the central premises of the National Observatory of Athens (NOA), in the centre of Athens, Greece. It is considered as a characteristic urban background station and serves as a receptor point of aerosols from several urban and regional sources [13,14,15]. Thissio is not directly affected by traffic emissions, as there are no major roads within a radius of at least 500 m. Finokalia is a remote coastal station situated at an altitude of 250 m a.s.l. in the southeast Mediterranean Sea on the island of Crete, Greece and the station faces the AS within a sector of 270° to 90° [16]. The nearest large urban area is Heraklion, with almost 200,000 inhabitants, located 50 km to the west of the station, therefore the influence from local anthropogenic sources is negligible [17]. Lastly, the station in Amman is located at the Aerosol Laboratory in the Department of Physics, University of Jordan, in the north part of Amman. The station exhibits urban characteristics, since 40% of the total population of Jordan lives in Amman. More details concerning the Amman measuring site can be found in [12].
PNSD measurements at all three sites were carried out using Scanning Mobility Particle Sizers (SMPS). Thissio station hosts a TSI SMPS 3034 for measuring the size distribution of aerosols with diameters in the 10–487 nm range (54 size bins), at a 5-min time resolution [18]. PNSDs were corrected for losses and multiply charged particles by the inversion routine of the Aerosol Instrument Manager software (AIM, TSI version 6.0), and more details can be found in [10]. At Finokalia, a TROPOS-type custom-built SMPS is used to record the particle size distributions from 9–850 nm (71 size bins) [19]. The sampling interval is set to 5 min. The collected PNSDs were corrected for particle losses by diffusion on the various parts of the SMPS according to the recommendations and standard operating procedures of [20]. Finally, a NanoScan SMPS (TSI Model 3910) measured PNSDs every 60 s in Amman, in the 10–420 nm range (13 size bins). The PNSD raw data were 5 min-averaged and more details can be found in [12]. The system used at Finokalia is part of the ACTRIS network (Aerosol, Clouds, and Trace gases Research Infrastructure) and has successfully passed intercomparison tests in 2013 and 2016 [19], while the instrument in Amman was calibrated by the manufacturer prior to the onset of the campaign (June 2016). Finally, the Athens system was transferred at Finokalia and successfully checked against the Finokalias’ instrument for consistency over the same size range prior to the measurement period.

2.2. Data Analysis

The particle number concentrations captured from the SMPS systems were divided into three diameter modes, namely nucleation (with diameters from 10 to 25 nm; Nnucl), Aitken (diameters between 25 and 100 nm; NAit), and accumulation (diameters from 100 to 420 nm; Naccum) mode. It should be noted that 420 nm is the lowest of the highest upper limits of size detection among the SMPSs, and in order to qualitatively compare Naccum between the stations, SMPS measurements covering particles with diameters from 100 to 420 nm were used. The number concentration of particles of each mode at three stations was calculated from the respective SMPS size bins from the given equations:
Ν nucl   =   10 25 n ( d p ) D d p 10 25 Δ N i
Ν Ait   =   25 100 n ( d p ) d d p 25 100 Δ N i
Ν accum   =   100 420 n ( d p ) d d p 100 420 Δ N i
where n(dp) is the aerosol number size distribution, and ∆Ni is its binned approximation. Furthermore, the total number concentration (Ntotal) was calculated by integrating the whole size range of each SMPS.
NPF events were identified using the temporal evolution of the PNSD in conjunction with the respective variation of the geometric mean diameter (Dpg) of nucleation mode particles. Following proposed specific criteria, via visual examination on a daily basis [4], each day was categorized as an event, an undefined or a non-event day. Throughout an NPF event a noteworthy increase in number concentration of particles in the nucleation mode, followed by their consequent growth, is observed for more than one hour, with the temporal evolution of Dpg further advocating the growth pattern. On the contrary, in an undefined event either freshly formed particles appear into the Aitken mode, or nucleation mode particles are observed without nevertheless documenting any signs of growth. In non-event days, no new particles are observed in the nucleation mode throughout the day. It should be noted that, in urban environments such as Thissio and Amman, morning and evening traffic increases Nnucl and this feature is not considered as an NPF event, since the growth requirement is missing. Event days are further separated into two different classes; “class I” and “class II” events. In “class I” events the dynamic properties (i.e., formation and growth rates) of the nucleation mode particles can be retrieved, whereas in “class II” this is not possible since the growth occurs very fast and thus are very limited in time duration. Hence, the dynamic characteristics cannot be applied with accuracy [4]. At this point it should be mentioned that due to the absence of particle concentrations below 10 nm, it is not feasible to observe the initial steps of cluster formation (~3 nm), and NPF phenomena in which new particles are unable to grow beyond 10 nm could not be identified. However, bursts of particles in the size range of 10–25 nm in midday represent thoroughly the growth stage of newly formed clusters implying regional NPF events [21].
In order to understand the NPF process, it is necessary to determine the dynamic properties controlling a “class I” NPF. At all three stations, the growth rate (GR) for particles in the nucleation mode was calculated using the mode-fitting method [22]. Initially, the aerosol size distributions were fitted with lognormal distributions [23], and afterwards the nucleation mode geometric mean diameter (Dpg) was plotted as a function of time, where the slope of a linear fit expresses the GR (see Equation (4)).
GR   =   dD pg dt
The formation rate (J) of particles describes the flux of growing nanoparticles which are capable to reach a certain diameter (Dp) owing to the growth process. According to [24], J can be calculated from:
J   =   dN Dp dt   +   C o a g S Dp   ×   N Dp   +   GR Δ D p   ×   N Dp
where the first term after the equality presents the observed variability in nucleation-mode particles’ number concentration; the second term defines the loss of nucleation-mode particles due to coagulation with larger (above 25 nm) particles; and the third term refers to the growth beyond the under investigation size range (i.e., above 25 nm). In this work, J at 10 nm, for all the three stations, was determined.
Condensation sink (CS) is a significant factor to quantify the condensational growth and potential sink of condensable particles and thus indirectly of newly formed particles, and describes the rate by which vapor molecules condense onto the existing aerosol particles in the atmosphere. Following the developed methodology by [24], CS can be calculated as:
CS   =   2 π D d min d max D p β Μ Ν D p d D p   =   2 π   D   i β Μ   D p i   N i
where D is the diffusion coefficient for H2SO4, βM corresponds to the size-dependent transition correction factor, Dpi is the particle diameter of size class i, and Ni is the particle number concentration for the respective size i. The transitional correction factor was determined [25] as:
β M =   1 + K n   1.33 × K n 2 + 1.71 × K n + 1
where Kn is the Knudsen number, Kn = 2 λ D p with λ the mean free path of the gas molecules in air. In order to ensure qualitative comparisons of CS among the stations, CS is extracted using SMPS data for particles with diameters up to 420 nm.
The survival probability of newly-formed particles describes the competition between their growth and scavenging by pre-existing aerosol particles in the atmosphere, and is approximately equal to the ratio of CS’/GR’ known as “survival parameter” (P) [26]. CS’ is equal to CS/(10−4 s−1) and GR’ is the ratio GR/(1 nm h−1), respectively. An increase in the survival parameter, reflects that the smaller amount of freshly formed particles is going to survive and grow to larger sizes.
Finally, the minimum spatial extent of nucleation events was also estimated at Finokalia using the back-trajectory method [7]. In the analysis, the stations at Thissio and Amman were ruled out of this calculation due to the important concentrations of ultrafine particles (UFP; particles with diameters below 100 nm) in the urban background. For this analysis on each event day at Finokalia, the back-trajectory was initiated at a height of 1 km above ground level (a.g.l.; see below, Section 2.3) at the starting time of the NPF event and computed for each subsequent hour until the growing mode disappears.

2.3. Ancillary Data

In order to examine the regional flow promoting new particle formation, a source-receptor analysis of the air masses ending up over the three measuring stations for each NPF day was carried out using the Lagrangian particle dispersion model FLEXPART (version 10.4) [27]. The release altitude was defined as 1 km above ground level (a.g.l.) for all stations, with the air masses travelling back for 4 days and arrive at the receptor sites at 10:00 (UTC), corresponding to a time interval when the NPF is at full development. The selected height is considered suitable to describe the transport at the limit of the Eastern Mediterranean marine boundary layer, while skipping orographic interferences [28]. FLEXPART simulates particle dispersion releasing 40,000 tracers per site. The functional values obtained correspond to the emission sensitivity (s m3 kg−1), which is related to the air tracers’ residence time in the out-grid cells. FLEXPART identifies with relative accuracy if newly formed particles are produced on-site or are transported from other regions after their subsequent condensational growth. Additionally, the Hybrid Single-Particle Lagrangian Integrated Trajectory (HYSPLIT) model was used to compute an air mass back trajectory and further assisted to evaluate its vertical movement when arriving at 10:00 UTC, at 1 km above the surface of each site [29]. Finally, meteorological parameters (temperature, wind speed, relative humidity (RH), and solar radiation (SR)) were also available for the study and were averaged to 1 h time resolution in order to facilitate comparisons among the three sites.

3. Results and Discussion

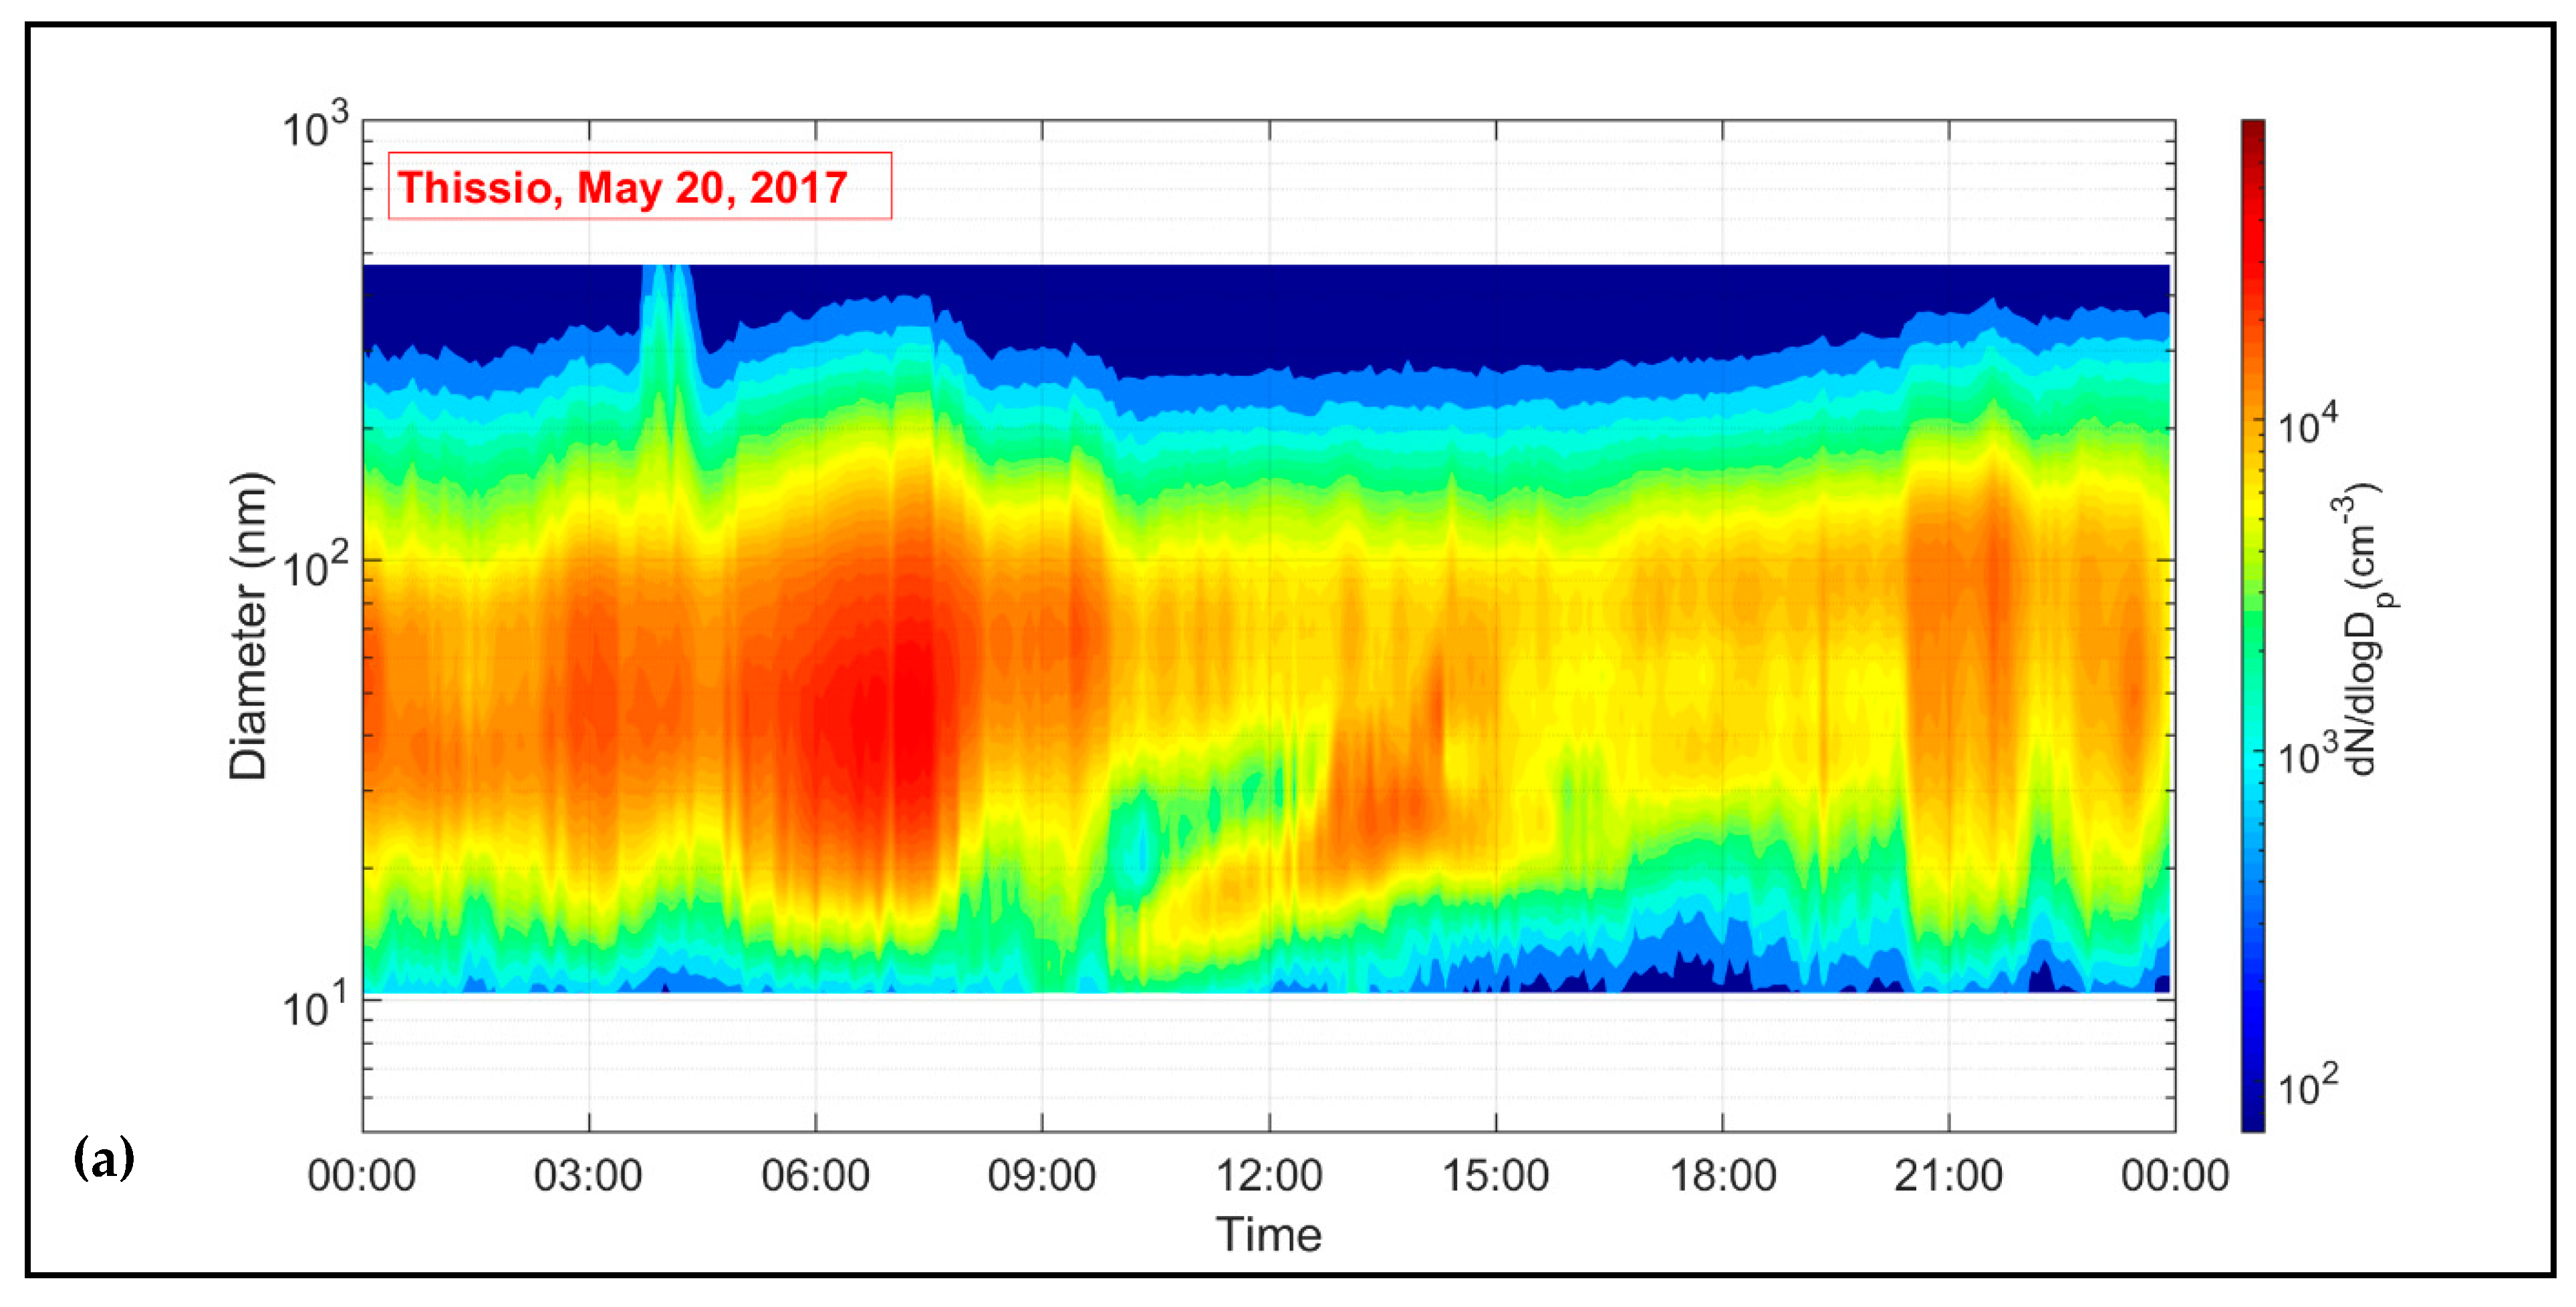
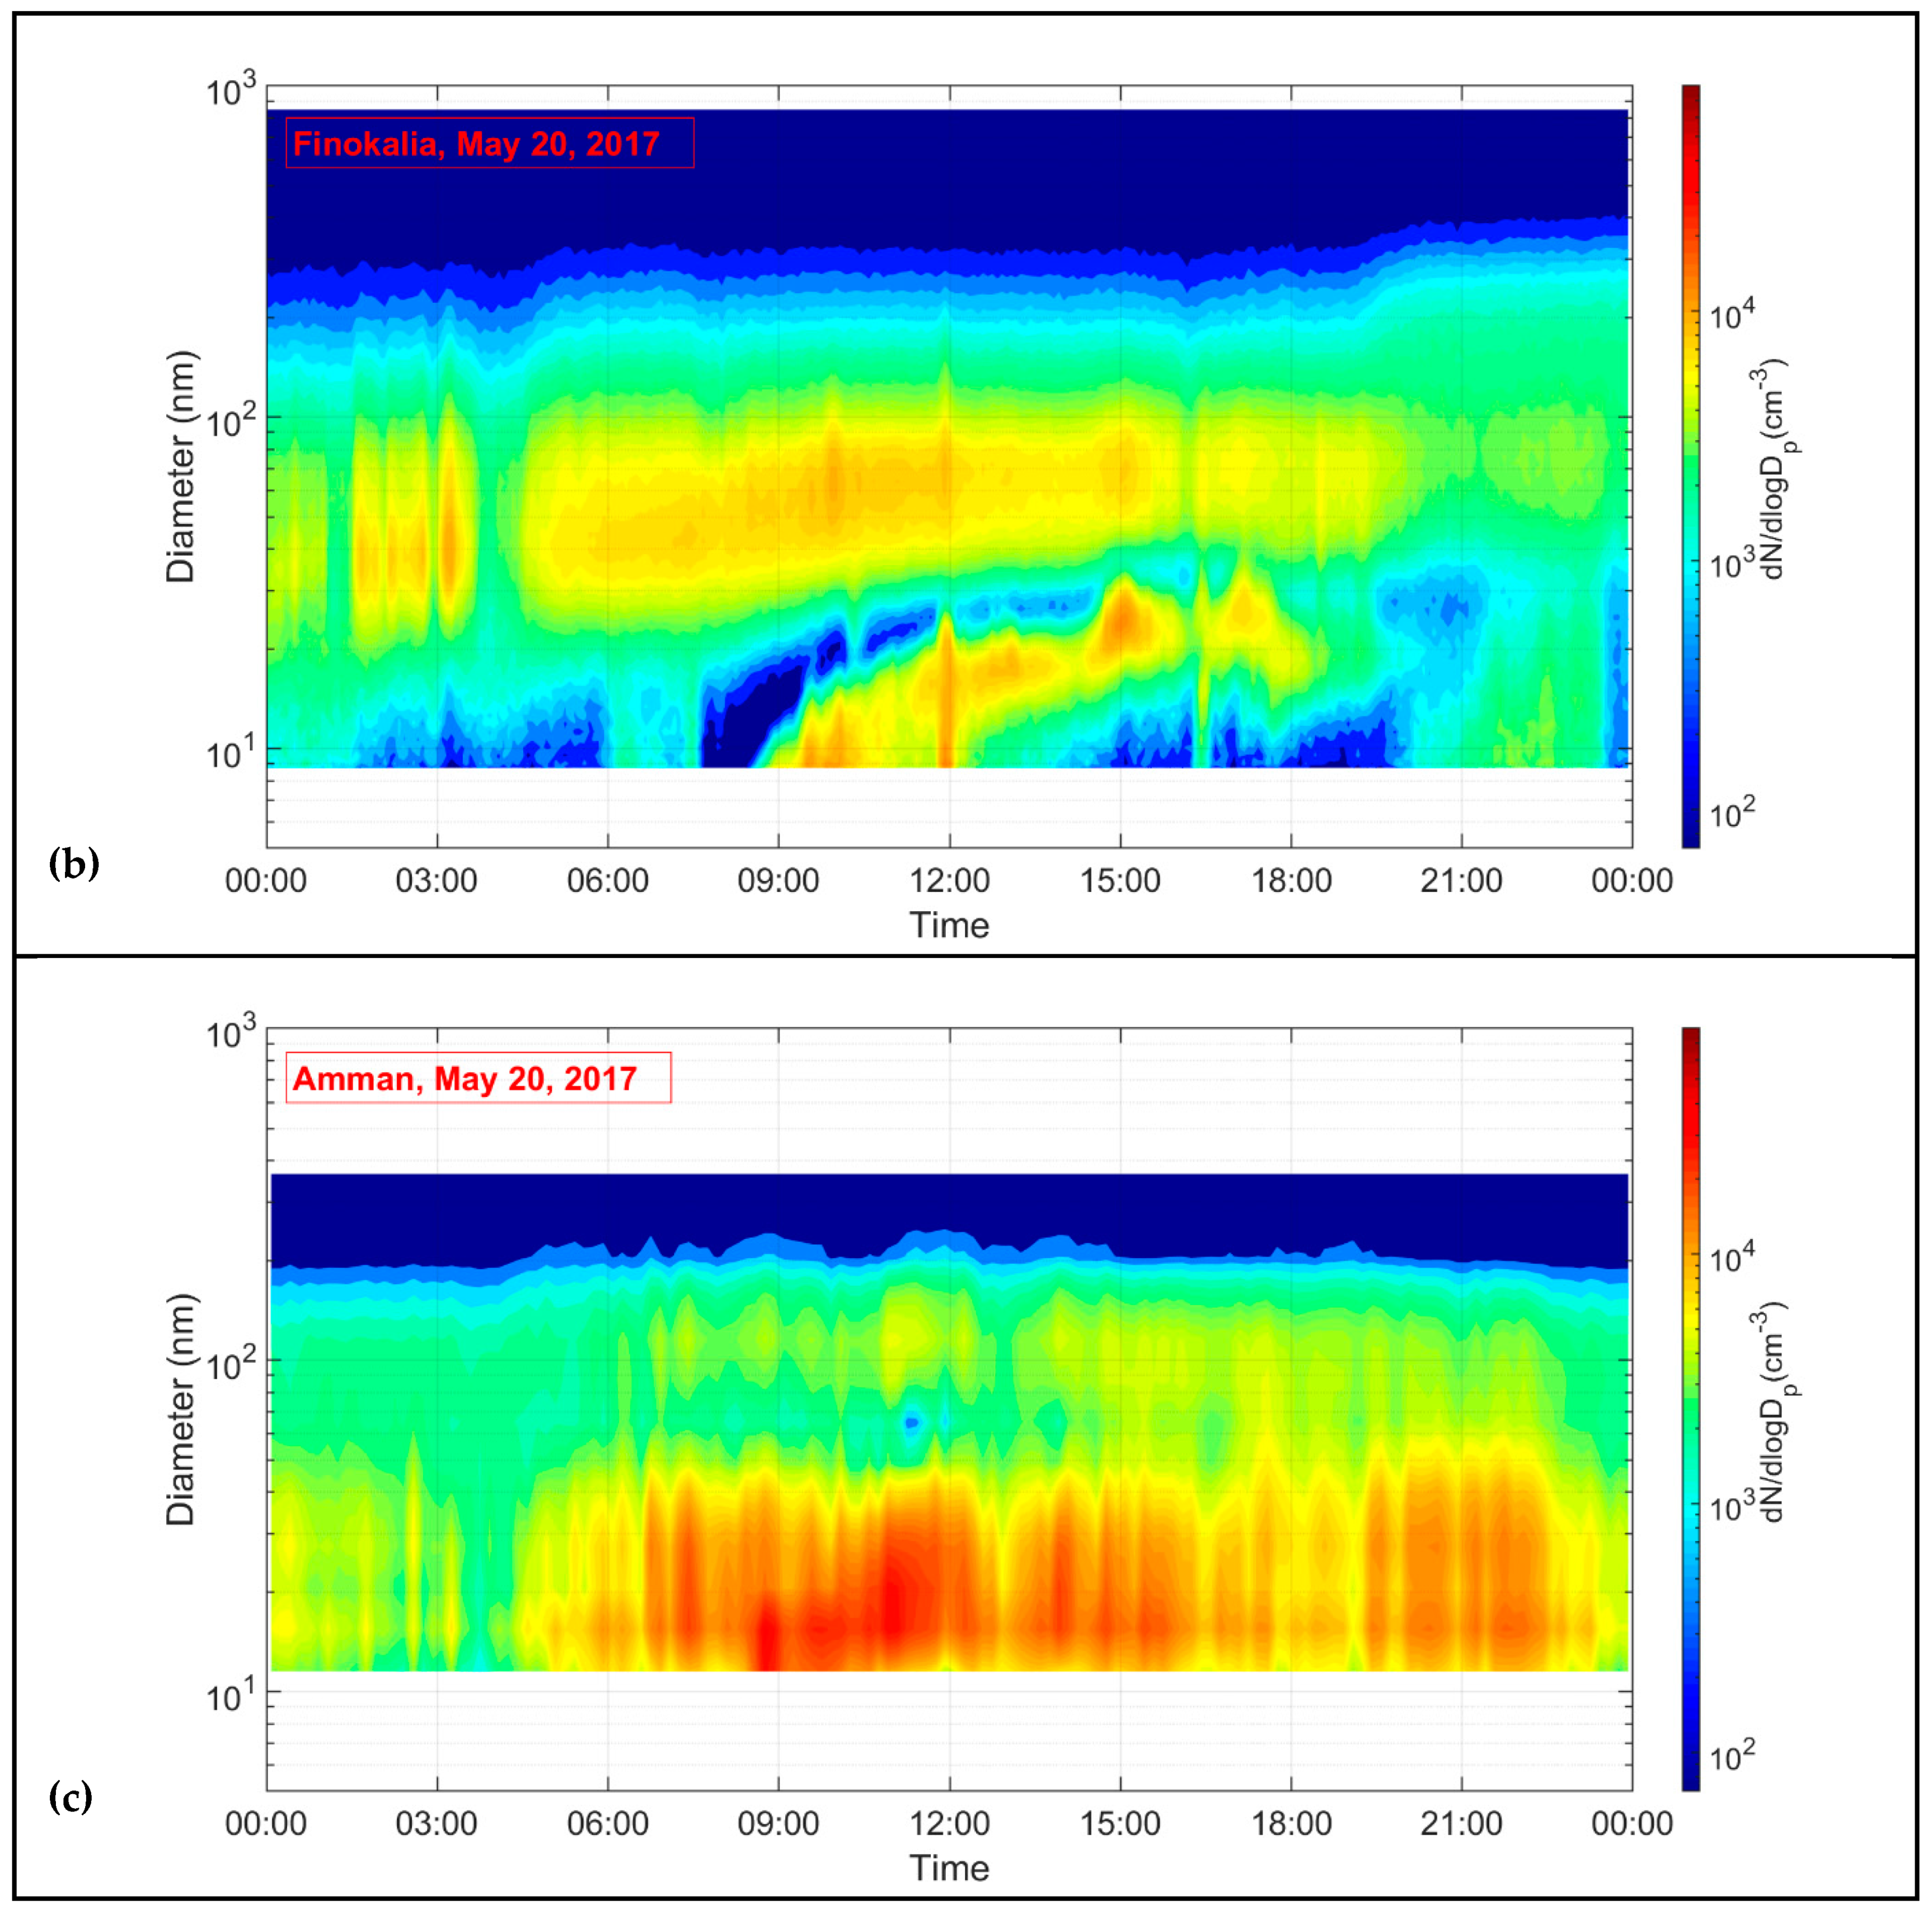
3.1. Particle Number Size Distributions
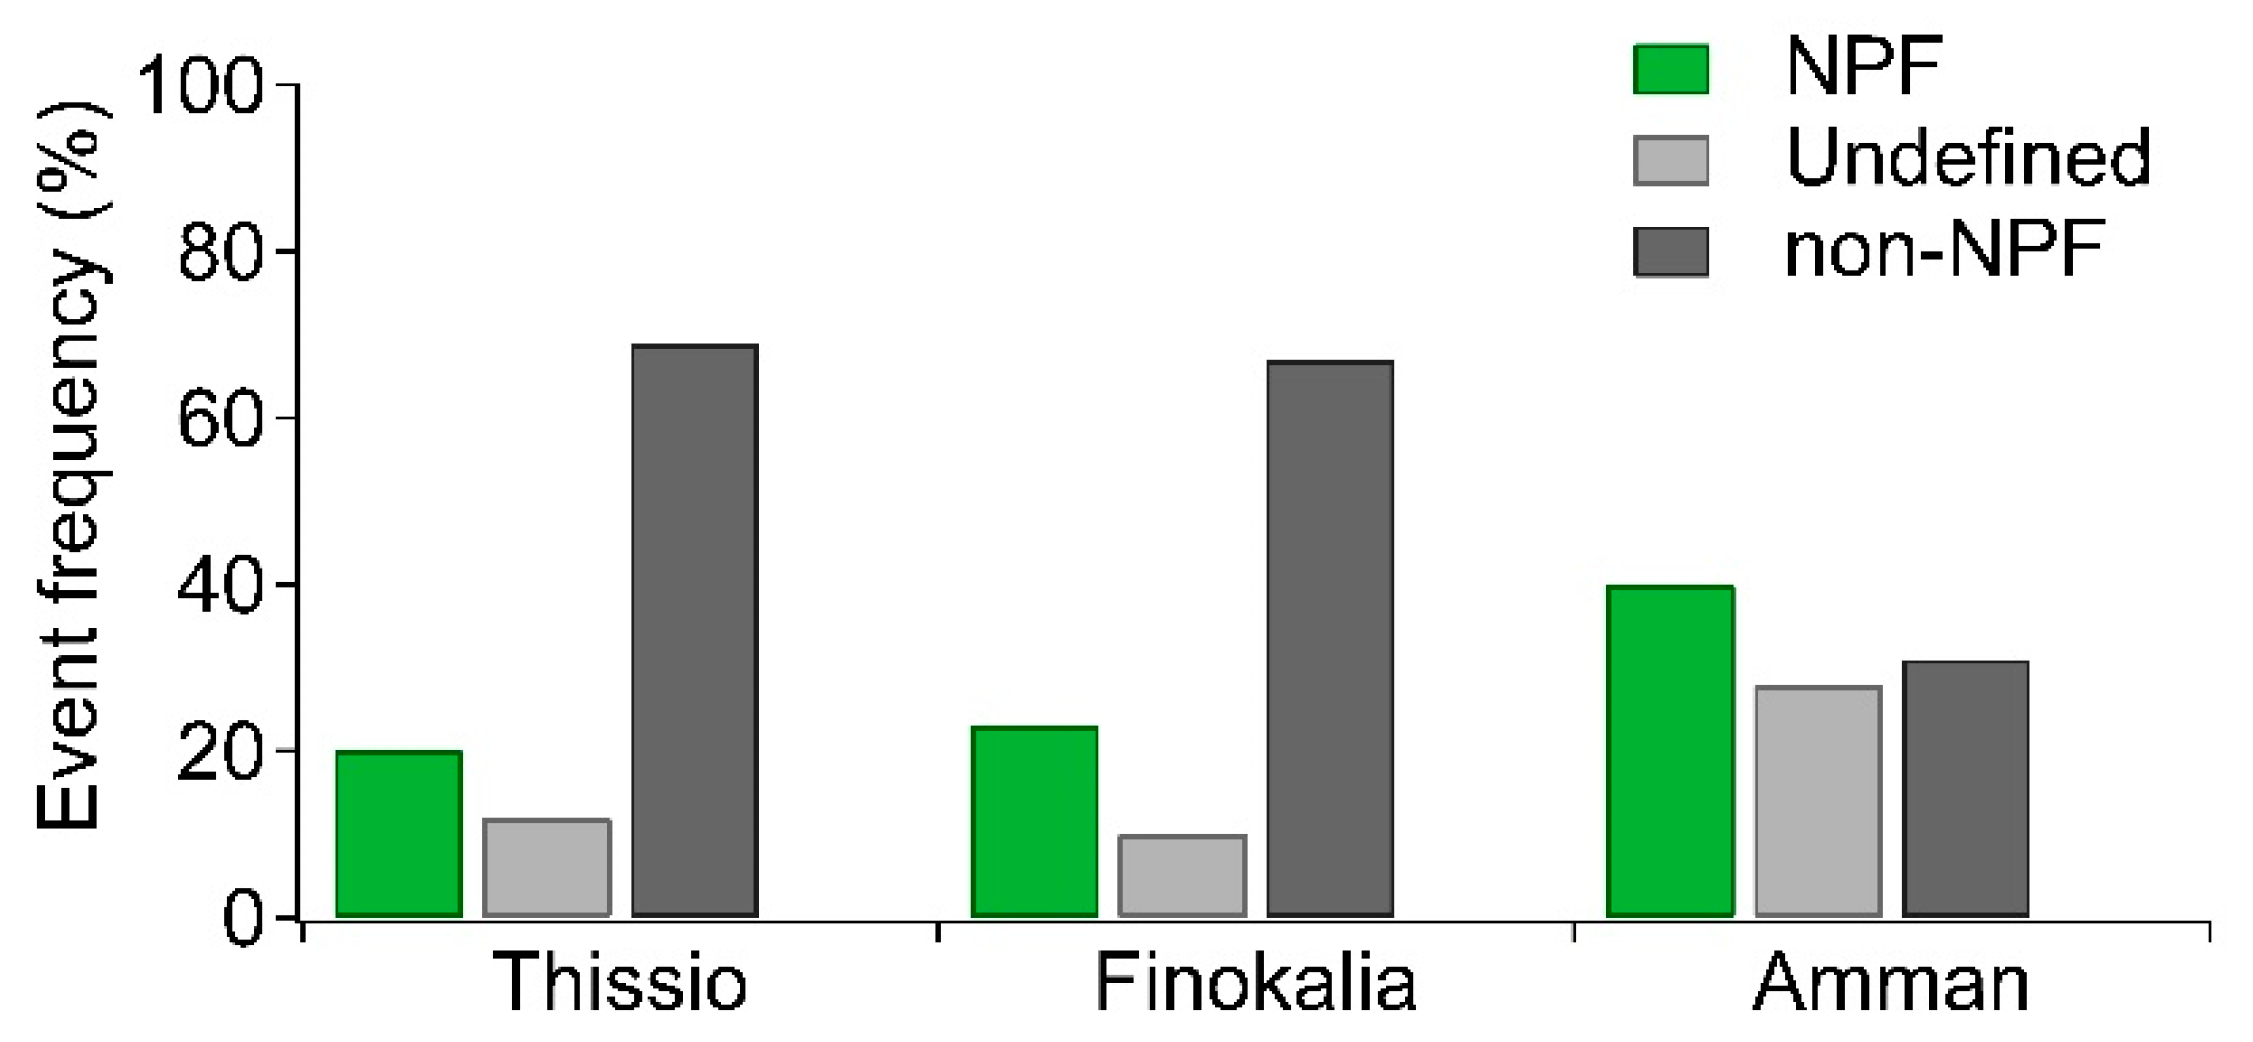
Statistics for the total particle number concentrations (Ntotal) and for particles in the three modes (i.e., Nnucl, NAit, and Naccum) at Thissio, Finokalia, and Amman during the 6-month examined period are summarized in Table S1. As expected, the mean value of total particles was significantly higher at the urban stations compared to the regional background station of Finokalia, owing to the extensive contribution from local anthropogenic emissions. Average Ntotal daily mean values were 8400 and 15,500 cm−3 at Thissio and Amman, respectively, exhibiting a 2.5-fold and 4.5-fold increase, respectively, compared to Finokalia. It should be mentioned that Ntotal was considerably larger in Amman compared to Thissio by almost 85%, and this feature can be related to enhanced urban characteristics prevailing in Amman, since the SMPS was situated close to overcrowded areas (i.e., higher population density), and central roads (i.e., higher traffic density). Ntotal calculated in this study is also consistent with those observed in other urban and remote areas with Mediterranean-type climate. In Granada, Spain the total number concentration for particles below 500 nm was 8500 cm−3 [30], which is almost equal to those at Thissio, and the lower levels calculated at other background Mediterranean environments such as Ispra, Italy [31], were comparable to Finokalia. The higher Ntotal in Amman corresponds well with those recorded at Barcelona, Spain in a year-long measurement campaign [32]. The contribution percentage of each particle’s mode to the total particle number concentration differed from one station to another, due to different particle sources and processes prevailing at the three sites. In particular, nucleation mode particle concentrations showed highest values in Amman (mean 7400 cm−3), followed by Thissio (mean 1400 cm−3) and Finokalia (mean 420 cm−3), and contributed 48, 17, and 12% to the Ntotal, respectively. Particles in the Aitken mode constituted the largest fraction to particle number concentrations at all stations, contributing 65% to Ntotal at Thissio, and 50% each at Finokalia and Amman. The significant amount of NAit, and further of UFP (Nnucl + NAit) in the urban atmosphere, is a result of the extensive anthropogenic emission [33], while in Finokalia it is related to regional sources of pollution originating from the Balkans and central and eastern Europe, enhanced by long-ranged transport [34]. Finally, Naccum had insignificant contribution to the Ntotal in Amman (merely 2%), limited at Thissio (18%), while the highest contribution was observed for Finokalia (almost 40%) supporting our above-mentioned notion about long-range transport.
Comparing the diurnal nucleation mode particle number concentration (Nnucl) at the three sites (Figure 2), a clear pattern is observed at the urban stations; the anthropogenic emissions from vehicular road traffic is illustrated by a Nnucl noteworthy morning peak between 06:00 and 09:00 (Figure 2a,c). In addition, another peak corresponding to the evening rush hour is observed at Thissio after 18:00. It should be noted that during the cold period (February–March) at Thissio there is an equally significant peak during nighttime, where apart from traffic, residential heating is also enhanced [10]. This mixed-source peak is not apparent during the warm season and concentrations are 100% higher than the respective ones from April to July. When considering the whole measurement period in Amman, elevated Nnucl concentrations are usually maintained after 15:00 owing to traffic in association with the decreasing boundary layer mixing height [35]. Due to its regional background character, morning or evening peaks in Nnucl consistent with traffic are not present at Finokalia (Figure 2b). A distinct escalation of Nnucl centered between 09:00 and 15:00 is observed at all stations (Figure 2) and that is due to NPF events [10,12]. The formation of new particles is normally characterized by a sharp burst of Nnucl around noon, indicating thus the importance of photochemistry in NPF initiation. The midday Nnucl concentrations (mean 10,000 cm−3) in Amman are approximately 6 and 17 times larger than those at Thissio and Finokalia (mean 1800 and 600 cm−3, respectively), suggesting stronger NPF events in Amman.
It is obvious that, Nnucl at Finokalia is the lowest because of the lack of local and anthropogenic sources, whilst at Thissio traffic is limited compared to Amman, and hence lower concentrations in the nucleation mode are recorded. In Amman, the major anthropogenic emission part comes from traffic. The composition of traffic fleet is mainly gasoline for passenger cars and diesel for heavy duty vehicles. The diesel in Jordan has a high fraction of sulfur compared to European Union (EU) countries, providing high concentrations of sulphate and sulfur dioxide, which are known to be driving components in NPF and subsequent growth. Furthermore, this extra vehicular activity in Amman enhances the nitrate concentrations, which also seem to contribute significantly to NPF, and thus to the Nnucl [36].

3.2. NPF Events

The NPF classification for all sites is presented in Figure 3 and Table 1. The regularity of NPF days (“class I” and “class II”) from February to July 2017 was almost similar at Thissio and Finokalia (20 vs. 23%, respectively), while in Amman NPF event frequency reaches 40%. Despite the urban character of Amman, the observed doubling in percentage of NPF occurrence in comparison to the urban site of Thissio and especially to the regional background of Finokalia, may suggest higher availability of precursor gases in the Amman urban atmosphere. Additionally, limited pre-existing accumulation mode acting as a condensation sink could also contribute to the elevated frequency of NPF in Amman. From the examined days, a percentage of 30% were described as “undefined” in Amman, signifying that particles in nucleation mode appear but do not continue to grow, whereas a mere 10% of the examined days occurred in Thissio and Finokalia. The highest percentage of NPF occurrence was observed in spring for all sites as presented in Table S2. At Thissio, NPF can occur more often in March (33%) followed by April (28%), while at Finokalia in May (29%) and April (27%), highlighting thus the possible role of biogenic volatile organic compounds (VOCs) during NPF. In Amman, most NPF took place in May (26%) and June (23%), probably due to favorable chemical (e.g., H2SO4 production) and meteorological conditions (e.g., solar radiation, cloudiness, absence of precipitation), since biogenic compounds are minor due to the limited vegetation in the area. The increased solar radiation and clear sky in Amman could enhance the formation of sulfuric acid, which is considered as the main component of atmospheric NPF [37]. SO2 is mainly emitted from the industrial areas in Amman, or transported to Jordan from ship emission plumes of large vessels operating in the Eastern Mediterranean and around the Arabian Peninsula [38] (see later Section 3.3).
In order to study the progression of NPF, the observation of “class I” events is more suitable since the growth of newly formed particles is maintained for several hours. The initiation of an NPF event was determined visually via the diurnal evolution of Nnucl in association with the respective evolution of the aerosol size distribution. In general, as starting time of the event is considered the point when Nnucl starts to appear and increases rapidly (see the gray vertical line in Figure S1a). The gradual increase in the nucleation mode geometric mean diameter in the “banana shape” pattern of the aerosol size distribution further elucidates the beginning of an event, with smallest particles shifting progressively towards larger sizes (Figure S1b). The NPF episode is considered to cease when Nnucl starts to decrease (see the green vertical line in Figure S1a). This temporal space between the two vertical lines is considered as the duration of the event [3]. At Thissio, NPF generally initiates at 10:30 (±55 min) (UTC + 2) and it is commonly maintained for 2 h, while at Finokalia and Amman, located easterly of Thissio, the NPF phenomena are usually recorded before 10:00, and more specifically at 09:50 (±75 min) (UTC + 2) and 09:30 (±70 min) (UTC + 2), respectively, with the formation of new particles taking place for 3 h on average. It is evident that the NPF phenomenon, observed well after sunrise at all three sites, reaffirms the crucial role of photochemistry. The variations regarding the starting time and duration could be ascribed to the different environmental conditions prevailing over the three stations including solar radiation. Thissio exhibited a shorter temporal duration, probably owing to the more polluted background air, as the site was characterized by maximum Naccum values (mean 1600 cm−3; see Table S1), which was 20 and 75% higher than in Finokalia and Amman, respectively. The significant background amount of accumulation mode particles causes an augmentation in the condensation sink, inhibiting thus the particle formation and growth [39]. Indeed, CS throughout the “class I” NPF days was the highest at Thissio (Figure 4a; Table 2) times 2 and 1.5, compared to Finokalia and Amman, suggesting higher particulate load, which limits the NPF occurrence and meanwhile shrinks the duration of an event. Interestingly, despite the difference as a site characterization (urban vs. background), CS at Finokalia was only 23% lower than the one in Amman (6.4 × 10⁻³ vs. 7.9 × 10⁻³ s−1) which could relate to the similar calculated NPF temporal duration. This can further be seen from the differences in the available surface area of the aerosol at the three sites during “class I” NPF events (Figure 5), where the overall average active surface area at Thissio is the highest, while Finokalia and Amman exhibit comparable levels throughout the day. As per above, it is clear that CS alone cannot determine the occurrence or favoring of an NPF event, but other parameters and processes should also be taken into account.
The formation rates (J, Figure 4b and Table 2) at the three sites varied from 0.3 cm−3 s−1 to 5.1 cm−3 s−1, having an average value of 1.7 ± 0.8 cm−3 s−1, 1.9 ± 1.3 cm−3 s−1, and 2.1 ± 1.1 cm−3 s−1 at Thissio, Finokalia, and Amman, respectively. There were no significant differences between the sites. At Thissio and Amman these values are comparable to typical particle formation rates calculated in other urban areas such as Leicester, England (J10 was on average 1.3 cm−3 s−1) [40], Kanpur, India (mean J5 was 1.5 cm−3 s−1) [41], and in Shangai, China (mean J10 was 2.2 cm−3 s−1) [42]. The mean estimated formation rate at Finokalia is within the respective value reported in a long-term analysis at the same site [19]. Growth rates ranged from 2.4 to 8.9 nm h−1 at Thissio (Figure 4c), with an average value of approximately 5 nm h−1 (Table 2), from 3.6 to 10 nm h−1 at Finokalia (Figure 4c), with an average value of about 6 nm h−1 (Table 2), and from 1.9 to 17.7 nm h−1 (Figure 4c) at Amman, with a mean value of 6.7 nm h−1 (Table 2). GRs are in agreement with those documented for urban and coastal background regional environments [19,41]. The polluted background with high CS values seems to be decisive in hindering the formation and growth of a new particle. High levels of pre-existing particles lead to higher available surface area of the aerosol (Figure 5), further affecting the dynamic characteristics. This has already been established for Athens and Finokalia [10], where during NPF days, CS was around 30% lower compared to non-event days. J and GR are somewhat higher in Amman compared to Thissio and Finokalia, indicating that sufficient anthropogenic precursor vapors dominated throughout the formation of a particle and its growth [43]. Conversely, the lowest values of formation and growth rates at Thissio, can be ascribed to the significant pre-existing load within the urban air, as it is capable of uptaking considerable amount of anthropogenic-laden precursor vapors, limiting thus J and GR [44]. However, it should be noted that such limited GR could also be observed at background sites where pre-existing particle concentrations are low owing to the lack of sufficient gaseous precursors [1]. Finokalia, nevertheless, exhibited comparable mean values (within 10%) of both formation and growth rates as those determined for Amman. These values were a consequence of the low CS observed at Finokalia, together with the enhanced photochemical and biogenic activity during spring and summer [19], which produce sufficient condensable species promoting thus the formation and growth processes.
The balance of favoring versus hindering particle formation, effectively linking the condensation sink and calculated growth rates, is reflected in the survival probability, which is expressed using the survival parameter (P). It was found that for the “class I” NPF events, the mean survival parameter was higher at Thissio (Figure 4d; Table 2) ranging between 10 and 42 (average 25 ± 9), followed by Amman ranging from 4 to 43 (average 14 ± 8), and lastly Finokalia with values from 6 to 22 (average 12 ± 5). The P values estimated at the three sites were lower than the value of 50, proposed as threshold for NPF occurrence, but nevertheless fall within value range reported for clean or moderately polluted environments [26]. The larger P calculated at Thissio is driven by the elevated CS values in association with the lowest growth rate, restricting thus the possibility of a newly formed particle to survive and reach greater sizes. The survival parameter decreases when moving from the urban (Amman) to the regional (Finokalia) background, linked to the higher CS observed in Amman, while the difference regarding GR at the two locations is almost insignificant. The comparable P, thus, at Finokalia and Amman could imply that a similar percentage of particles from NPF at both sites, could survive to larger sizes capable to act as cloud condensation nuclei, further modulating the cloud droplet number concentration [3].

3.3. Simultaneous NPF Events

3.3.1. Conditions Favoring Common NPF at All Three Stations

Throughout a typical regional NPF event aerosol particles are formed within the nucleation mode; these freshly formed particles subsequently show signs of growth, with newly-formed particles exhibit similar characteristics within the same air mass over extensive distances [45]. In order to observe regional NPF events at a larger scale, it is necessary to provide PNSD measurements spreading over vast areas. Hence, a broader stationary PNSD measurement network covering areas from hundreds to thousands of kilometers would be helpful to elucidate the spatial extent of NPF processes across the region. Using the PNSD data from the 181 examined days in common, we identified 5 days when intensive NPF events were recorded simultaneously at all 3 stations, during springtime. In fact, 14% and 12% of the total NPF episodes recorded at Thissio and Finokalia, respectively, had also been concurrently observed in Amman. Taking into consideration the large distances between the three stations, approximately 1300 km for the Amman-Thissio pair and 1000 km and 350 for the Amman–Finokalia and Thissio–Finokalia pairs, respectively, a regional and coherent NPF mechanism is regarded as plausible.
Several studies to date (summarized in the introduction) reaffirm the notion that similar air masses over a region affect the concurrency of NPF events over the same area. The source and the circulation of the air masses over the three stations during the common NPF days can be identified through the use of the FLEXPART backward simulations. Mainly the 5 concomitant NPF days at the three stations were favored by air masses, which originated from the North and spent sufficient time over the Eastern Mediterranean, in order to attain the necessary amount of precursors for atmospheric nucleation and growth sustainability. The high probability of NPF associated with northerly air masses has been confirmed both in Jordan and Greece [10,12]. For reference purposes 20 May 2017 is used as an indicative date, when “class I” NPF occurred at all three sites (Figure 6). Figure 7 shows the emissions sensitivity (in s m3 kg−1) for air masses ending up at 1 km a.g.l. over Thissio (Figure 7a), Finokalia (Figure 7b), and Amman (Figure 7c) at 10:00 UTC, originating from 0.25 to 7.00 km, computed for a 96-h period; this 4-day back-trajectories is a sufficient time period to demonstrate the synoptic airflow [46]. It can be seen that the air masses had both continental (Balkans) and marine origin (Black Sea). The airflow appears to have homogenous characteristics for the entire period, and it shows a consistent spatial extension when it crosses continental Greece (Figure 7a), continues on to Crete (Figure 7b), and then shifts to the east over the part of the Levantine Sea (Figure 7c). Crete’s topography steers the prevailing direction of an air mass towards the west-southwest [9], making Finokalia and Amman receptors of eastbound air masses. As derived from the FLEXPART analysis, air masses during their horizontal and vertical transportation could get enriched by biogenic or anthropogenic precursor gases, creating suitable conditions for the promotion of gas-to-particle conversion [47]. Indeed, on 20 May the air masses, prior to their arrival at Thissio, crossed over the Balkans and northern Greece below 1 km a.g.l. (Figure S2a) and potentially got “pumped” with important sulfur-rich precursors from the emissions of large lignite-fired power plants (Figures S3 and S4 ) [48]; the presence of those sulfur precursors can possibly trigger the NPF mechanism. Afterwards, as they progress towards the southern AS to Finokalia (Figure 6b), the air masses may get more burdened with sulfur emissions from shipping as well as from marine dimethylsulfide (DMS) emissions (Figure S4), further promoting atmospheric nucleation [49]. DMS as a prime precursor taking part in NPF observed at coastal stations has been well established in several studies worldwide [50,51]. The role of DMS is further backed up by the calculated minimum spatial extent for this event at Finokalia, extending to a distance of 250 km upwind within the central AS (Figure S5). As air masses progress at a low altitude (approximately 1 km a.g.l.; Figure S2b) and continue their track towards Jordan, passing above Eastern Mediterranean and Egypt (Figure 6c), an area with heavy marine activity, they interact with SO2 contained in the plumes of vessels in the area (Figure S4); SO2 oxidates to sulphuric acid (H2SO4), which further endorses the NPF mechanism. The role of elevated concentrations of SO2 and the importance of H2SO4 thereon in the atmospheric nucleation has been the subject of many studies [37,45]. This long-distance route, which enriches the air masses with considerable amount of precursors, may be an explanation as to why NPF events are significantly intensive over Amman. Regarding the temporal and dynamic properties of the 20 May NPF event, it was estimated that the duration was almost similar among the three stations ranging between 3h and 3h 20min (Table S3), formation and growth rates were found almost equal and the survival parameter presented such similarities, which further strengthens the notion that under these conditions NPF is a homogeneous mechanism over our large examined area.
Similar to 20 May, 3 out of 5 NPF days (namely 23 March; Figure S6, 8 April; Figure S7, and 11 April; Figure S8) exhibited almost identical characteristics, with regards to both origin and course. The minimum spatial extent ranged from 150 to 650 km throughout these remaining 3 NPF events in Finokalia and sprawled from the Cyclades complex to Marmara Sea in the northeast (Figure S5). However, an NPF event on 25 March exhibited different features (Figure S9); although the source region remained the same (Black Sea, and coastal Ukraine and Russia), the air masses showed an alternative pattern. Those which ended up at Thissio and Finokalia followed the typical path already discussed throughout the 20 May, crossing the Black Sea, the great area of Istanbul, northern Greece and AS (Figure S9a,b). However, the air masses with a final destination in Amman traveled above the Turkish mainland and Syria before their arrival in Jordan (Figure S9c). The different route of the back trajectories can be attributed to the synoptic meteorology and mainly to the trough which prevailed at 500 hPa over the Middle East on that day, as a southward expansion of the Siberian anticyclone. That trough facilitated a northern air flow from the Black Sea towards the Middle East, carrying continental aerosols from eastern Turkey and Syria over the measuring site of Amman (Figure S10a). The northern flow over the Middle East was also dominant at the lower troposphere (850 hPa) due to governance of high pressure systems over the Southern and Western Europe and low pressure conditions over the central Arabian Peninsula (Figure S10b). As the air masses travel over Syria and Lebanon (Figure S8c), they were enriched with emissions containing sufficient SO2 from power plants in the area (Figures S3 and S11), promoting thus atmospheric nucleation and growth.
In addition to the significant role of the air mass flow, the duration of an event, the dynamic properties, condensation sink, and survival parameter are all factors worth discussing, since they present interesting findings during the simultaneous occurrence of NPF at the three stations. To that end, we compared those factors with the respective ones when there was no concurrency among the stations. The dates, temporal and dynamic properties, calculated CS and the survival parameter during the 5 common events are compiled in Table S3. As far as duration is concerned, it is observed that the formation of new particles was maintained on average for 1.5 h longer during the 5 common events at all three sites, compared to non-concurrent events. This feature can be attributed to the limited concentrations of condensable compounds which after their oxidation decelerate the formation and growth rate. Indeed, the average J and GR were lower in the 5 common events compared to the respective values when isolated NPF occurred among the stations. In particular, at Thissio by 55% and 50%, respectively, at Finokalia by 40% and 48%, and at Amman by 24% and 20%. The limited dynamic properties in association with the extended duration of an NPF event supports the suggestion that a preservation of precursor species is required, in order for an extended-scale NPF event to be sustained. Moreover, the lower GR together with the moderate CS, had a negative effect on P for all stations throughout the 5 concomitant NPF days. The survival parameter was reduced at a rate of 10% to 45%, indicating that the freshly formed particles had higher probability to survive, as they were capable of growing slowly resulting thus to the common occurrence of NPF at all three stations. Finally, when considering the environmental conditions (RH and SR) it occurs that at Thissio during concurrent NPF events at all three stations, SR was enhanced by 35% compared to days when NPF occurred only in the specific site, while drier conditions prevailed (RH lower by 30%). At Finokalia and Amman there were no significant differences (Mann–Whitney test) in both SR and RH during common NPF days compared to NPF solely observed at each individual site.

3.3.2. Relevant NPF Events at Two Stations (Finokalia and Amman)

In lieu of the above, Finokalia and Amman share a common characteristic since they were regularly both influenced by air masses that follow an eastbound direction, not affecting the Athens site. Furthermore, the similarities between the duration and dynamic properties at those two stations could be a sign that both sites could be receptors of a common NPF mechanism which sprawled over the Eastern Mediterranean and Middle East, covering a region of approximately 1100 km (Figure 1). Additionally, 19 NPF events were identified between Finokalia and Amman at the same day. Thus together with the 5 NPF days previously mentioned, a total of 60% out of the 41 NPF events recognized overall at Finokalia for the examined period, were observed concomitantly at these two stations. The majority of those events (16 out of 19) were classified as “class II” in Finokalia, whereas, in Amman, 10 were considered as “class I” and the remaining 6 as “class II”. The remaining 3 days were classified as follows: 2 days as “class I” and “class II” in Finokalia and Amman, respectively, and 1 as “class I’’ at both stations. The NPF events without a clear condensational growth (“class II”) were presumably related to local conditions, such as meteorological factors, the amount of precursors, or the pre-existing particles prevailing over each examined area.
Figure 8 presents a “representative” case when “class II” and “class I” NPF events occurred on 20 April in Finokalia and Amman, respectively. The event in Amman started after 09:00, and the observed growth indicates that the initial clusters (~3 nm) were formed at another location, away from the examined site, and their subsequent evolution occurred during their transportation to the measurement area [6,21]. The almost concurrent appearance of nucleation mode particles, both in Finokalia and Amman, suggests the advection of aerosol particles in the same air mass. The role of advection over the site was investigated with FLEXPART (Figure 9). The air masses originated mainly from coastal North Africa at high altitudes (2.5 km a.g.l.; Figure S12a), and may transport mineral dust, then travel fast at approximately 2 km a.g.l. (Figure S12a), over the region west of Crete (Libyan Sea), before reaching Amman (Figure 9a). Owing to their high speeds, they spend sufficient time over marine (Libyan Sea) and continental (Crete and Cyprus) source regions, prior to their arrival in Finokalia and Amman.
The air masses tend to mix with local natural and anthropogenic emissions during their transportation, thus enhancing the photochemical production of secondary aerosols [52]. For instance, shipping activity in the area may cause a sulfate enrichment of those air masses (Figure S13), and as a result the loads of mineral dust contribute to the oxidation of SO2 into sulfuric acid, triggering the atmospheric NPF at Finokalia [53]. The probability of NPF associated with dust plumes has been already established, since mineral duct can act as important nucleating and condensing species under heterogeneous photochemical processes [54]. The limited extent of the event (“class II”) occurring at Finokalia on 20 April may be related to the limited existence of precursors. Due to their high altitude travelling in conjunction with the narrow stream they form (Figure 9a), these air masses are influenced by low SO2 and primary particles (Figure S13), and this lack subdues the growth of the event. Passing Crete, before their arrival in Amman these air back trajectories descend to the marine boundary layer (MABL); at these lower altitudes (~1.5 km a.g.l.; Figure S12b), over the area between Cyprus and Egypt (Figure 9b), they find favorable conditions for NPF. Closer to the surface, and already trapped within the MABL, they are further influenced by SO2 and primary particles from shipping and marine biogenic activity around the Arabian Peninsula (Figure S13), promoting NPF.
The critical role of the air masses flow, in association with the degree of precursors throughout the concurrent appearance of NPF events over the Eastern Mediterranean, is revealed anew when “class I” events occurred simultaneously on 5 July at Finokalia and Amman. The air masses stem from the marine and high altitude (4 km a.g.l.; Figures S14 and S15) area south of Italy, then approach the coastline of south Peloponnese, and then descend into lower altitudes (<2 km a.g.l.; Figure S15). These lower moving air masses could associate with intense anthropogenic activity reported in the area of Peloponnese (Megalopoli power plant; Figures S2 and S14) and get enriched with substantial precursor gases of SO2 a couple of hours prior to NPF in Finokalia (Figure S16). During their lower height travel they are affected by local emission sources, which accumulate their aerosol burden. Albeit this particulate load could suppress the NPF mechanism, it has been found that the sufficiency of high precursor vapor concentrations enhance NPF [55], advocating the crucial role of SO2. The “class I” NPF event in Amman on 5 July, was observed approximately 2 h later compared to the one in Finokalia, reflecting the further enhancement of the air masses with sulfur precursors after having passed over the island of Crete. The air back trajectories continue inside the MABL (extending from surface and up to 700 m; Figure S15) over the area between Crete and Cyprus and through to the Egypt–Sinai region (Figure S14), sweeping all the emissions full of SO2 from ships and power plants located within this region (Figure S16). Since the extent to which an air mass is enriched with precursors along its path is directly related on the time it spends over source areas [56], this may explain the more intense NPF event observed in Amman, compared to Finokalia, not only on 5 July, but also throughout all the examined days. Local factors in Amman, including high loads of UFP combined with enhanced precursors from traffic (e.g., high NOx) should also be taken into consideration since they contribute to NPF occurrence [36].

4. Conclusions

New particle formation events were monitored at three sites distanced by almost 1300 km, namely Thissio, and Finokalia, in Greece and Amman, Jordan, over a period of 6 months in order to determine the possibility of regional occurrence of NPF and identify the characteristics leading to such events. In order to do so, first NPF events were identified at all three stations, and subsequently the formation and growth rates, and condensation sinks were estimated. At the two Greek sites NPF occurred with a frequency of around 20% (20% and 23%, respectively) while in Amman NPF frequency was double (40%). The highest frequency was observed during spring (March and April) for all three sites, while in Amman many events also took place during May and June, probably due to photochemical formation of precursors, and enhanced anthropogenic emissions.
The formation rate during the NPF was similar at Thissio and Finokalia (1.7 and 1.9 cm−3 s−1, respectively) while somewhat higher in Amman (2.1 cm−3 s−1), values well within the observed range for urban environments. Estimated growth rates were the lowest at Thissio, followed by Finokalia and Amman, exhibiting averages of 5, 6, and 6.7 nm h−1, respectively. The lowest values for both formation and growth rates at Thissio could be ascribed to a large number of pre-existing particles “trapped” in this urban location, while Finokalia and Amman seem to exhibit comparable mean values (within 10%) of both formation and growth rates. This leads to a higher condensation sink at Thissio, compared to values at Finokalia and Amman.
During the common examined period, 5 concurrent NPF events were identified at all three sites. All 5 events took place during springtime, when air masses originated from the North and spent sufficient time over the Eastern Mediterranean, thus having both continental and marine origin. The common characteristic was the progression of air masses at a low altitude over continental areas, such as Russia and the Balkans, passing through marine environments (Black Sea, Eastern Mediterranean) and becoming enriched in sulfur-rich precursors (SO2, H2SO4, DMS), which further enhances the NPF mechanism. It is also observed that the formation of new particles was maintained 1.5 h longer during the 5 common events compared to non-concurrent event days, possibly related to the lower formation and growth rates during those events.
Finally, as Finokalia and Amman exhibited similar dynamic characteristics, common NPF events were also determined for these two sites. Air flow was of eastbound direction, thus did not affect the Thissio site, with air masses moving progressively from Crete towards Cyprus and over the Levantine Sea before reaching Amman. It occurs that there were 19 more NPF common days between Finokalia and Amman, adding to a total of 60% out of 41 NPF events observed at Finokalia, also occurring in Amman. Most of the observed events occurred under same air mass origin, were characterized as “class II” at Finokalia and “class I” in Amman indicating enrichment with NPF precursors moving eastward. Regional NPF events were, therefore, considered as possible, even over large distances, given a similarity in dynamic characteristics and common air masses history.

Supplementary Materials

The following are available online at https://www.mdpi.com/2073-4433/12/1/13/s1. Table S1. Statistical overview of daily aerosol concentrations in different size ranges for 181 available measurement days (February-July 2017) at Thissio, Finokalia and Amman, respectively, Table S2. Number of NPF and undefined events for each month at Thissio, Finokalia and Amman, respectively from February to July 2017, Table S3. Date, classification, starting time and duration [in the brackets], formation rates (J), growth rates (GR), condensation sink (CS), and survival parameter (P) throughout the 5 simultaneous NPF events at Thissio (This), Finokalia (Fino), and Amman (Amm). The last line corresponds to average±standard deviation for each column. Time is in (UTC + 2), Figure S1. An NPF event recorded at Thissio on 25 March 2017. (a) Temporal evolution of the 5 min resolution number concentrations of particles in size ranged of 10–25 nm (Nnucl), and (b) diurnal evolution of the aerosol size distribution. The blank dots stand for nucleation, the crosses for Aitken, and the black solid stars for accumulation geometric mean diameter (Dpg). The gray vertical line illustrates the NPF start, while the green one the NPF end, respectively. Time is in (UTC + 2), Figure S2. HYSPLIT 96h back-trajectories computed with an end point at (a) Thissio and (b) Amman from the heights of 1 km a.g.l. at 10:00 UTC on 20 May 2017, Figure S3. Map of the extended interest area. Orange triangles represent the exact location of lignite-fired power plants, Figure S4. SO2 emissions on 20 May 2017 over the interest area (EUMETSAT, ACSAF (Atmospheric Composition monitoring); https://acsaf.org/offline_access.html), Figure S5. Boundaries (min; 150 km and max; 650 km) of minimum spatial scale as calculated during the 5 concomitant NPF days, Figure S6. Emission sensitivity (residence time) for air masses arriving over (a) Thissio, (b) Finokalia, and (c) Amman on 23 March 2017 at 10:00 UTC at 1.00 km a.g.l., originating from 0.25 to 7.00 km, Figure S7. Emission sensitivity (residence time) for air masses arriving over (a) Thissio, (b) Finokalia, and (c) Amman on 8 April 2017 at 10:00 UTC at 1.00 km a.g.l., originating from 0.25 to 7.00 km, Figure S8. Emission sensitivity (residence time) for air masses arriving over (a) Thissio, (b) Finokalia, and (c) Amman on 11 April 2017 at 10:00 UTC at 1.00 km a.g.l., originating from 0.25 to 7.00 km, Figure S9. Emission sensitivity (residence time) for air masses arriving over (a) Thissio, (b) Finokalia, and (c) Amman on 25 March 2017 at 10:00 UTC at 1.00 km a.g.l., originating from 0.25 to 7.00 km, Figure S10. Geopotential height synoptic maps on 25 March 2017 at (a) 500 hPa and (b) 850 hPa. https://psl.noaa.gov/data/gridded/data.ncep.reanalysis.html, Figure S11. SO2 emissions on 25 March 2017 over the interest area (EUMETSAT, ACSAF (Atmospheric Composition monitoring); https://acsaf.org/offline_access.html). With orange circle we depict the focus area, Figure S12. HYSPLIT 96h back-trajectories computed with an end point at (a) Finokalia and (b) Amman from the heights of 1 km a.g.l. at 10:00 UTC on 20 May 2017, Figure S13. SO2 emissions on 20 April 2017 over the interest area (EUMETSAT, ACSAF (Atmospheric Composition monitoring); https://acsaf.org/offline_access.html), Figure S14. Emission sensitivity (residence time) for air masses arriving over Amman on 5 July 2017 at 10:00 UTC at 1.00 km a.g.l., originating from 0.25 to 7.00 km, Figure S15. HYSPLIT 144h back-trajectories computed with an end point at Amman from the heights of 1 km a.g.l. at 10:00 UTC on 5 July 2017, Figure S16. SO2 emissions on 5 July 2017 over the interest area (EUMETSAT, ACSAF (Atmospheric Composition monitoring); https://acsaf.org/offline_access.html).

Author Contributions

Conceptualization, N.M. and T.H.; methodology, P.K., T.H.; software analysis, P.K., P.M.; validation, I.S., N.K.; resources, P.K., N.K., T.H.; data curation, P.K., N.K., I.S.; writing—original draft preparation, P.K., A.B.; writing—review and editing, A.B, N.M., T.H., I.S., N.K.; visualization, P.K., A.B., I.S.; supervision, N.M., T.H., A.B. funding acquisition, N.M. All authors have read and agreed to the published version of the manuscript.

Funding

This research was funded by the Operational Programme “Competitiveness, Entrepreneurship and Innovation” (NSRF 2014–2020) and co-financed by Greece and the European Union (European Regional Development Fund) via the project PANhellenic infrastructure for Atmospheric Composition and climatE chAnge (PANACEA; MIS 5021516).

Institutional Review Board Statement

Not applicable.

Informed Consent Statement

Informed consent was obtained from all subjects involved in the study.

Data Availability Statement

The data are available from the corresponding authors upon request.

Acknowledgments

This research has been supported by the project PANhellenic infrastructure for Atmospheric Composition and climatE chAnge (PANACEA; MIS 5021516) which is implemented under the Action Reinforcement of the Research and Innovation Infrastructure, funded by the Operational Programme “Competitiveness, Entrepreneurship and Innovation” (NSRF 2014–2020) and co-financed by Greece and the European Union (European Regional Development Fund). I.S., T.H. and N.M. also acknowledge support by the EMME-CARE project, which has received funding from the European Union’s Horizon 2020 Research and Innovation Programme (grant agreement no. 856612) and the Government of Cyprus. The sole responsibility of this publication lies with the author. The European Union is not responsible for any use that may be made of the information contained therein.

Conflicts of Interest

The authors declare no conflict of interest.

References

  1. Nieminen, T.; Kerminen, V.-M.; Petäjä, T.; Aalto, P.P.; Arshinov, M.; Asmi, E.; Baltensperger, U.; Beddows, D.C.S.; Beukes, J.P.; Collins, D.; et al. Global analysis of continental boundary layer new particle formation based on long-term measurements. Atmos. Chem. Phys. 2018, 18, 14737–14756. [Google Scholar] [CrossRef] [Green Version]
  2. Kalivitis, N.; Kerminen, V.-M.; Kouvarakis, G.; Stavroulas, I.; Bougiatioti, A.; Nenes, A.; Manninen, H.E.; Petäjä, T.; Kulmala, M.; Mihalopoulos, N. Atmospheric new particle formation as a source of CCN in the eastern Mediterranean marine boundary layer. Atmos. Chem. Phys. 2015, 15, 9203–9215. [Google Scholar] [CrossRef] [Green Version]
  3. Kalkavouras, P.; Bougiatioti, A.; Kalivitis, N.; Stavroulas, I.; Tombrou, M.; Nenes, A.; Mihalopoulos, N. Regional new particle formation as modulators of cloud condensation nuclei and cloud droplet number in the eastern Mediterranean. Atmos. Chem. Phys. 2019, 19, 6185–6203. [Google Scholar] [CrossRef] [Green Version]
  4. Dal Maso, M.; Kulmala, M.; Riipinen, I.; Wagner, R.; Hussein, T.; Aalto, P.P.; Lehtinen, K.E.J. Formation and growth of fresh atmospheric aerosols: Eight years of aerosol size distribution data from SMEAR II, Hyytiälä, Finland. Boreal Environ. Res. 2005, 10, 323–336. [Google Scholar]
  5. Dai, L.; Wang, H.L.; Zhou, L.Y.; An, J.L.; Tang, L.L.; Lu, C.S.; Yan, W.L.; Liu, R.Y.; Kong, S.F.; Chen, M.D.; et al. Regional and local new particle formation events observed in the Yangtze River Delta region, China. J. Geophys. Res. Atmos. 2017, 122, 2389–2402. [Google Scholar] [CrossRef]
  6. Kulmala, M.; Vehkamäki, H.; Petäjä, T.; Dal Maso, M.; Lauri, A.; Kerminen, V.-M.; Birmili, W.; McMurry, P.H. Formation and growth rates of ultrafine atmospheric particles: A review of observations. J. Aerosol Sci. 2004, 35, 143–176. [Google Scholar] [CrossRef]
  7. Hussein, T.; Junninen, H.; Tunved, P.; Kristensson, A.; Dal Maso, M.; Riipinen, I.; Aalto, P.P.; Hansson, H.-C.; Swietlicki, E.; Kulmala, M. Time span and spatial scale of regional new particle formation events over Finland and Southern Sweden. Atmos. Chem. Phys. 2009, 9, 4699–4716. [Google Scholar] [CrossRef] [Green Version]
  8. Németh, Z.; Rosati, B.; Zíková, N.; Salma, I.; Bozó, L.; Dameto de España, C.; Schwarz, J.; Ždímal, V.; Wonaschütz, A. Comparison of atmospheric new particle formation events in three Central European cities. Atmos. Environ. 2018, 178, 191–197. [Google Scholar] [CrossRef]
  9. Kalkavouras, P.; Bossioli, E.; Bezantakos, S.; Bougiatioti, A.; Kalivitis, N.; Stavroulas, I.; Kouvarakis, G.; Protonotariou, A.P.; Dandou, A.; Biskos, G.; et al. New particle formation in the southern Aegean Sea during the Etesians: Importance for CCN production and cloud droplet number. Atmos. Chem. Phys. 2017, 17, 175–192. [Google Scholar] [CrossRef] [Green Version]
  10. Kalkavouras, P.; Bougiatioti, A.; Grivas, G.; Stavroulas, I.; Kalivitis, N.; Liakakou, E.; Gerasopoulos, E.; Pilinis, C.; Mihalopoulos, N. On the regional aspects of new particle formation in the Eastern Mediterranean: A comparative study between a background and an urban site based on long term observations. Atmos. Res. 2020, 239, 104911. [Google Scholar] [CrossRef]
  11. Wehner, B.; Siebert, H.; Stratmann, F.; Tuch, T.; Wiedensohler, A.; Petäjä, T.; Dal Maso, M.; Kulmala, M. Horizontal homogeneity and vertical extent of new particle formation events. Tellus 2007, 59, 362–371. [Google Scholar] [CrossRef] [Green Version]
  12. Hussein, T.; Atashi, N.; Sogacheva, L.; Hakala, S.; Dada, L.; Petäjä, T.; Kulmala, M. Characterization of Urban New Particle Formation in Amman—Jordan. Atmosphere 2020, 11, 79. [Google Scholar] [CrossRef] [Green Version]
  13. Grivas, G.; Stavroulas, I.; Liakakou, E.; Kaskaoutis, D.G.; Bougiatioti, A.; Paraskevopoulou, D.; Gerasopoulos, E.; Mihalopoulos, N. Measuring the spatial variability of Black Carbon in Athens during wintertime. Air Qual. Atmos. Health 2019, 12, 1405–1417. [Google Scholar] [CrossRef]
  14. Theodosi, C.; Tsagkaraki, M.; Zarmpas, P.; Grivas, G.; Liakakou, E.; Paraskevopoulou, D.; Lianou, M.; Gerasopoulos, E.; Mihalopoulos, N. Multi-year chemical composition of the fine aerosol fraction in Athens, Greece, with emphasis on the contribution of residential heating in wintertime. Atmos. Chem. Phys. 2018, 18, 14371–14391. [Google Scholar] [CrossRef] [Green Version]
  15. Stavroulas, I.; Bougiatioti, A.; Paraskevopoulou, D.; Grivas, G.; Liakakou, E.; Gerasopoulos, E.; Mihalopoulos, N. Sources and processes that control the submicron organic aerosol in an urban Mediterranean environment (Athens) using high temporal resolution chemical composition measurements. Atmos. Chem. Phys. 2019, 19, 901–919. [Google Scholar] [CrossRef] [Green Version]
  16. Mihalopoulos, N.; Stephanou, E.; Kanakidou, M.; Pilitsidis, S.; Bousquet, P. Tropospheric aerosol ionic composition in the Eastern Mediterranean region. Tellus B 1997, 49, 314–326. [Google Scholar] [CrossRef]
  17. Lelieveld, J.; Berresheim, H.; Borrmann, S.; Crutzen, P.; Dentener, F.; Fischer, H.; Feichter, J.; Flatau, P.; Heland, J.; Holzinger, R.; et al. Global air pollution crossroads over the Mediterranean. Science 2002, 298, 794–799. [Google Scholar] [CrossRef] [Green Version]
  18. Wang, C.S.; Flagan, C.R. Scanning electrical mobility spectrometer. Aerosol Sci. Technol. 1990, 13, 230–240. [Google Scholar] [CrossRef]
  19. Kalivitis, N.; Kerminen, V.-M.; Kouvarakis, G.; Stavroulas, I.; Tzitzikalaki, E.; Kalkavouras, P.; Daskalakis, N.; Myriokefalitakis, S.; Bougiatioti, A.; Manninen, H.E.; et al. Formation and growth of atmospheric nanoparticles in the eastern Mediterranean: Results from long-term measurements and process simulations. Atmos. Chem. Phys. 2019, 19, 2671–2686. [Google Scholar] [CrossRef] [Green Version]
  20. Wiedensohler, A.; Birmili, W.; Nowak, A.; Sonntag, A.; Weinhold, K.; Merkel, M.; Wehner, B.; Tuch, T.; Pfeifer, S.; Fiebig, M.; et al. Mobility particle size spectrometers: Harmonization of technical standards and data structure to facilitate high quality long-term observations of atmospheric particle number size distributions. Atmos. Meas. Tech. 2012, 5, 657–685. [Google Scholar] [CrossRef] [Green Version]
  21. Dada, L.; Chellapermal, R.; Buenrostro Mazon, S.; Paasonen, P.; Lampilahti, J.; Manninen, H.E.; Junninen, H.; Petäjä, T.; Kerminen, V.-M.; Kulmala, M. Refined classification and characterization of atmospheric new-particle formation events using air ions. Atmos. Chem. Phys. 2018, 18, 17883–17893. [Google Scholar] [CrossRef] [Green Version]
  22. Hussein, T.; Martikainen, J.; Junninen, H.; Sogacheva, L.; Wagner, R.; Dal Maso, M.; Riipinen, I.; Aalto, P.P.; Kulmala, M. Observation of regional new particle formation in the urban atmosphere. Tellus B Chem. Phys. Meteorol. 2008, 60, 509–521. [Google Scholar] [CrossRef]
  23. Hussein, T.; Dal Maso, M.; Petaja, T.; Koponen, I.K.; Paatero, P.; Aalto, P.P.; Hameri, K.; Kulmala, M. Evaluation of an automatic algorithm for fitting the particle number size distributions. Boreal Environ. Res. 2005, 10, 337–355. [Google Scholar]
  24. Kulmala, M.; Petäjä, T.; Nieminen, T.; Sipilä, M.; Manninen, H.E.; Lehtipalo, K.; Dal Maso, M.; Aalto, P.; Junninen, H.; Paasonen, P.; et al. Measurement of the nucleation of atmospheric aerosol particles. Nat. Protocol. 2012, 7, 1651–1667. [Google Scholar] [CrossRef]
  25. Fuchs, N.A.; Sutugin, A.G. Highly dispersed aerosol. In International Reviews in Aerosol Physics and Chemistry: Topics in Current Aerosol Research; Hidy, G.M., Brock, J.R., Eds.; Pergamon: New York, NY, USA, 1971. [Google Scholar]
  26. Kulmala, M.; Kerminen, V.-M.; Petäjä, T.; Ding, A.J.; Wang, L. Atmospheric gas-to-particle conversion: Why NPF events are observed in megacities? Faraday Discuss. 2017, 200, 271–288. [Google Scholar] [CrossRef]
  27. Pisso, I.; Sollum, E.; Grythe, H.; Kristiansen, N.I.; Cassiani, M.; Eckhardt, S.; Arnold, D.; Morton, D.; Thompson, R.L.; Groot Zwaaftink, C.D.; et al. The Lagrangian particle dispersion model FLEXPART version 10.4. Geosci. Model Dev. 2019, 12, 4955–4997. [Google Scholar] [CrossRef] [Green Version]
  28. Gong, X.; Wex, H.; Müller, T.; Wiedensohler, A.; Höhler, K.; Kandler, K.; Ma, N.; Dietel, B.; Schiebel, T.; Möhler, O.; et al. Characterization of aerosol properties at Cyprus, focusing on cloud condensation nuclei and ice-nucleating particles. Atmos. Chem. Phys. 2019, 19, 10883–10900. [Google Scholar] [CrossRef] [Green Version]
  29. Stein, A.F.; Draxler, R.R.; Rolph, G.D.; Stunder, B.J.B.; Cohen, M.D.; Ngan, F. NOAA’s HYSPLIT atmospheric transport and dispersion modeling system. Bull. Am. Meteorol. Soc. 2015, 96, 2059–2077. [Google Scholar] [CrossRef]
  30. Casquero-Vera, J.A.; Lyamani, H.; Dada, L.; Hakala, S.; Paasonen, P.; Román, R.; Fraile, R.; Petäjä, T.; Olmo-Reyes, F.J.; Alados-Arboledas, L. New particle formation at urban and high-altitude remote sites in the south-eastern Iberian Peninsula. Atmos. Chem. Phys. Discuss. 2020. in review. [Google Scholar] [CrossRef]
  31. Asmi, A.; Wiedensohler, A.; Laj, P.; Fjaeraa, A.-M.; Sellegri, K.; Birmili, W.; Weingartner, E.; Baltensperger, U.; Zdimal, V.; Zikova, N.; et al. Number size distributions and seasonality of submicron particles in Europe 2008–2009. Atmos. Chem. Phys. 2011, 11, 5505–5538. [Google Scholar] [CrossRef] [Green Version]
  32. Pey, J.; Alastuey, A.; Querol, X.; Rodríguez, S. Monitoring of sources and atmospheric processes controlling air quality in an urban Mediterranean environment. Atmos. Environ. 2010, 44, 4879–4890. [Google Scholar] [CrossRef]
  33. Mejía, J.F.; Morawska, L.; Mengersen, K. Spatial variation in particle number size distributions in a large metropolitan area. Atmos. Chem. Phys. 2008, 8, 1127–1138. [Google Scholar] [CrossRef] [Green Version]
  34. Kalivitis, N.; Kouvarakis, G.; Bougiatioti, A.; Stavroulas, I.; Wiedensohler, A.; Mihalopoulos, N. Five-years of atmospheric aerosol number size distribution measurements in Eastern Mediterranean. Geophys. Res. Abstr. 2014, 16, 15860. [Google Scholar]
  35. Hussein, T.; Dada, L.; Hakala, S.; Petäjä, T.; Kulmala, M. Urban aerosol particle size characterization in Eastern Mediterranean conditions. Atmosphere 2019, 10, 710. [Google Scholar] [CrossRef] [Green Version]
  36. Li, H.; Zhang, Q.; Zheng, B.; Chen, C.; Wu, N.; Guo, H.; Zhang, Y.; Zheng, Y.; Li, X.; He, K. Nitrate-driven urban haze pollution during summertime over the North China Plain. Atmos. Chem. Phys. 2018, 18, 5293–5306. [Google Scholar] [CrossRef] [Green Version]
  37. Yao, L.; Garmash, O.; Bianchi, F.; Zheng, J.; Yan, C.; Kontkanen, J.; Junninen, H.; Mazon, S.B.; Ehn, M.; Paasonen, P.; et al. Atmospheric new particle formation from sulfuric acid and amines in a Chinese megacity. Science 2018, 361, 278–281. [Google Scholar] [CrossRef] [Green Version]
  38. Celik, S.; Drewnick, F.; Fachinger, F.; Brooks, J.; Darbyshire, E.; Coe, H.; Paris, J.-D.; Eger, P.G.; Schuladen, J.; Tadic, I.; et al. Influence of vessel characteristics and atmospheric processes on the gas and particle phase of ship emission plumes: In situ measurements in the Mediterranean Sea and around the Arabian Peninsula. Atmos. Chem. Phys. 2020, 20, 4713–4734. [Google Scholar] [CrossRef] [Green Version]
  39. Vana, M.; Kulmala, M.; Dal Maso, M.; Hõrrak, U.; Tamm, E. Comparative study of nucleation mode aerosol particles and intermediate air ions formation events at three sites. J. Geophys. Res. 2004, 109, D17201. [Google Scholar] [CrossRef] [Green Version]
  40. Hama, S.M.L.; Cordell, R.L.; Kos, G.P.A.; Weijers, E.P.; Monks, P.S. Sub-micron particle number size distribution characteristics at two urban locations in Leicester. Atmos. Res. 2017, 194, 1–16. [Google Scholar] [CrossRef] [Green Version]
  41. Kanawade, V.P.; Tripathi, S.N.; Siingh, D.; Gautam, A.S.; Srivastava, A.K.; Kamra, A.K.; Soni, V.K.; Sethi, V. Observations of new particle formation at two distinct Indian subcontinental urban locations. Atmos. Environ. 2014, 96, 370–379. [Google Scholar] [CrossRef]
  42. Wu, Z.J.; Hu, M.; Liu, S.; Wehner, B.; Bauer, S.; Maßling, A.; Wiedensohler, A.; Petäjä, T.; Dal Maso, M.; Kulmala, M. New particle formation in Beijing, China: Statistical analysis of a 1-year data set. J. Geophys. Res. 2007, 112, D09209. [Google Scholar] [CrossRef]
  43. Hakala, S.; Alghamdi, M.A.; Paasonen, P.; Vakkari, V.; Khoder, M.I.; Neitola, K.; Dada, L.; Abdelmaksoud, A.S.; Al-Jeelani, H.; Shabbaj, I.I.; et al. New particle formation, growth and apparent shrinkage at a rural background site in western Saudi Arabia. Atmos. Chem. Phys. 2019, 19, 10537–10555. [Google Scholar] [CrossRef] [Green Version]
  44. Charron, A.; Birmili, W.; Harrison, R.M. Factors influencing new particle formation at the rural site, Harwell, UK. J. Geophys. Res. 2007, 112, D14210. [Google Scholar] [CrossRef] [Green Version]
  45. Stanier, C.O.; Khlystov, A.Y.; Pandis, S.N. Ambient aerosol size distributions and number concentrations measured during the Pittsburgh Air Quality Study (PAQS). Aerosol Sci. Technol. 2004, 38, 253–264. [Google Scholar] [CrossRef] [Green Version]
  46. Nilsson, E.D.; Paatero, J.; Boy, M. Effects of air masses and synoptic weather on aerosol formation in the continental boundary layer. Tellus B Chem. Phys. Meteorol. 2001, 53, 462–478. [Google Scholar] [CrossRef]
  47. Chen, H.; Hodshire, A.L.; Ortega, J.; Greenberg, J.; McMurry, P.H.; Carlton, A.G.; Pierce, J.R.; Hanson, D.R.; Smith, J.N. Vertically resolved concentration and liquid water content of atmospheric nanoparticles at the US DOE Southern Great Plains site. Atmos. Chem. Phys. 2018, 18, 311–326. [Google Scholar] [CrossRef] [Green Version]
  48. Triantafyllou, A.G. PM10 pollution episodes as a function of synoptic climatology in a mountainous industrial area. Environ. Poll. 2001, 112, 491–500. [Google Scholar] [CrossRef]
  49. Kouvarakis, G.; Mihalopoulos, N. Seasonal variation of dimethylsulfide in the gas phase and of methanesulfonate and non-sea-salt sulfate in the aerosols phase in the Eastern Mediterranean atmosphere. Atmos. Environ. 2002, 36, 929–938. [Google Scholar] [CrossRef]
  50. Leck, C.; Bigg, E.K. New particle formation of marine biological origin. Aerosol Sci. Technol. 2010, 44, 570–577. [Google Scholar] [CrossRef]
  51. O’ Dowd, C.D.; Monahan, C.; Dall’ Osto, M. On the occurrence of open ocean particle production events. Geophys. Res. Lett. 2010, 37, L19805. [Google Scholar] [CrossRef]
  52. Richards, N.A.D.; Arnold, S.R.; Chipperfield, M.P.; Miles, G.; Rap, A.; Siddans, R.; Monks, S.A.; Hollaway, M.J. The Mediterranean summertime ozone maximum: Global emission sensitivities and radiative impacts. Atmos. Chem. Phys. 2013, 13, 2331–2345. [Google Scholar] [CrossRef] [Green Version]
  53. Dupart, Y.; King, S.M.; Nekat, B.; Nowak, A.; Wiedensohler, A.; Herrmann, H.; David, G.; Thomas, B.; Miffre, A.; Rairoux, P.; et al. Mineral dust photochemistry induces nucleation events in the presence of SO2. Proc. Natl. Acad. Sci. USA 2012, 109, 20842–20847. [Google Scholar] [CrossRef] [PubMed] [Green Version]
  54. Nie, W.; Ding, A.; Wang, T.; Kerminen, V.-M.; George, C.; Xue, L.; Wang, W.; Zhang, Q.; Petäjä, T.; Qi, X.; et al. Polluted dust promotes new particle formation and growth. Sci. Rep. 2014, 4, 6634. [Google Scholar] [CrossRef] [PubMed] [Green Version]
  55. Mönkkönen, P.; Koponen, I.K.; Lehtinen, K.E.J.; Hämeri, K.; Uma, R.; Kulmala, M. Measurements in a highly polluted Asian mega city: Observations of aerosol number size distribution, modal parameters and nucleation events. Atmos. Chem. Phys. 2005, 5, 57–66. [Google Scholar] [CrossRef] [Green Version]
  56. Freutel, F.; Schneider, J.; Drewnick, F.; von der Weiden-Reinmüller, S.-L.; Crippa, M.; Prévôt, A.S.H.; Baltensperger, U.; Poulain, L.; Wiedensohler, A.; Sciare, J.; et al. Aerosol particle measurements at three stationary sites in the megacity of Paris during summer 2009: Meteorology and air mass origin dominate aerosol particle composition and size distribution. Atmos. Chem. Phys. 2013, 13, 933–959. [Google Scholar] [CrossRef] [Green Version]
Figure 1. Map of the extended examined area. Pink dots correspond to the locations of the three stations (Background map downloaded from https://www.nationalgeographic.org/media/eastern-mediterranean/last updated 5 December 2011).
Atmosphere 12 00013 g001
Figure 2. Hourly mean diurnal variation of the nucleation mode particle number concentration (Nnucl; cm−3) for each season at (a) Thissio, (b) Finokalia, and (c) Amman over the period February–July 2017. The horizontal dotted lines in red indicate the overall mean value of Nnucl and the shaded area represents the standard deviation from the mean value. Time is in UTC + 2.
Atmosphere 12 00013 g002aAtmosphere 12 00013 g002b
Figure 3. Percentage frequency of NPF, undefined and non-NPF days at Thissio, Finokalia, and Amman sites from February to July 2017.
Atmosphere 12 00013 g003
Figure 4. Average variation of (a) condensation sink, (b) formation rate of nucleation mode particles, (c) growth rate of nucleation mode particles, and (d) survival parameter as calculated during “class I” NPF events at Thissio (gray), Finokalia (red), and Amman (blue) for the period February–July 2017. Whiskers represent 10th and 90th percentiles, box edges are 75th and 25th percentiles, the line in the box is the median, and the solid black square is the mean value.
Atmosphere 12 00013 g004
Figure 5. Calculated average active surface area of aerosol at Thissio, Finokalia, and Amman sites during “class I” NPF events. Time is in (UTC + 2).
Atmosphere 12 00013 g005
Figure 6. Characteristic “class I” new particle formation events occurred at (a) Thissio, (b) Finokalia, and (c) Amman on 20 May 2017. Time is in (UTC + 2).
Atmosphere 12 00013 g006aAtmosphere 12 00013 g006b
Figure 7. Emission sensitivity (residence time) for air masses arriving over (a) Thissio, (b) Finokalia and (c) Amman on 20 May 2017 at 10:00 UTC at 1.00 km a.g.l., originating from 0.25 to 7.00 km. The red triangles represent the exact location of the lignite-fired power plants in the Balkans and north continental Greece.
Atmosphere 12 00013 g007aAtmosphere 12 00013 g007b
Figure 8. Characteristic “class II” and “class I” new particle formation event recorded at (a) Finokalia, and (b) Amman, respectively, on 20 April 2017. Time is in (UTC + 2).
Atmosphere 12 00013 g008
Figure 9. Emission sensitivity (residence time) for air masses arriving over (a) Finokalia and (b) Amman on 20 April 2017 at 10:00 UTC at 1.00 km a.g.l., originating from 0.25 to 7.00 km.
Atmosphere 12 00013 g009
Table 1. Number and percentage frequency of NPF event, undefined, and non-event for 181 available measurement days (February–July 2017) at Thissio, Finokalia and Amman, respectively.
Day
Classification
ThissioFinokaliaAmman
Number of EventsFrequency (%)Number of EventsFrequency (%)Number of EventsFrequency (%)
Total events362041237340
Class I1691263519
Class II201129173821
Undefined211219105128
Non-event12468121675731
Total181100181100181100
Table 2. Average (± standard deviation) condensation sink (CS), particle formation rate (J), particle diameter growth rate (GR), and survival parameter (P) of “class I” NPF events at Thissio, Finokalia, and Amman during the examined period.
ParameterThissioFinokaliaAmman
CS (s−1)(12.0 ± 4.2) × 10−3(6.4 ± 1.4) × 10−3(7.9 ± 2.1) × 10−3
J (cm−3 s−1)1.7 ± 0.81.9 ± 1.32.1 ± 1.1
GR (nm h−1)4.9 ± 2.15.8 ± 2.06.7 ± 3.4
P28 ± 1412 ± 514 ± 8
Publisher’s Note: MDPI stays neutral with regard to jurisdictional claims in published maps and institutional affiliations.

