Abstract
In this study, we analyzed the changes in the average daily, monthly, seasonal, and annual surface air temperatures based on the temperature data obtained from seven stations (1 January 2005–31 December 2019; 15 years) belonging to the central Baltic area (Stockholm, Tallinn, Helsinki, Narva, Pärnu, Tartu, and Võru). The statistical analysis revealed that there was a strong correlation between the daily average surface air temperature of the studied cities (range: 0.95–0.99). We analyzed the frequency distribution of the average surface air temperatures in addition to the Kruskal–Wallis and Dunn’s tests (significance level of 0.05) to demonstrate that the difference in air temperatures between Narva, Tallinn, Tartu, and Stockholm are critical. The Welch’s -test (significance level 0.05), used to study the differences in the average monthly air temperature of the cities in question, showed that the surface air temperatures in Stockholm do not differ from Tallinn air temperatures from May to August. However, the surface air temperatures of Narva were similar to those of Tallinn in September. According to our results, the trends in the changes of monthly average surface air temperatures have a certain course during the year (ranging from 1.8 °C (Stockholm) to 4.5 °C (Võru and Tartu) per decade in February). During the entire study period, in addition to February, the surface air temperature increased in all the studied cities in March, May, June, and December, and the surface air temperature did not increase in January or from July to October. During the study period, the average annual surface air temperature in the cities of the central Baltic area increased by 0.43 °C per decade. The results also confirm that the surface air temperature in the study area is changing differently in different cities. The acceleration of the surface air temperature is very alarming and requires a significant intensification of the measures taken to slow down the temperature rise.
1. Introduction
To forecast climate change and its potential environmental and societal impact, it is important to examine the evolution of changes in various components of the atmosphere. One of the most significant parameters characterizing the condition of the atmosphere is surface air temperature [1,2]. Many researchers have used various methods and modeling techniques and confirmed that global warming is an ongoing phenomenon [3,4,5,6,7,8]. These studies have fueled further interest among various groups of researchers who study the effect of global warming on trends in air temperature [9]. Changes in surface air temperature have a significant effect, direct or indirect, on the ecological balance of the environment, biodiversity, and the extent of environmental pollution. This also affects the functioning of a society, including the functioning of agriculture, and consequently, food supply, healthcare, industry, transport, and other infrastructure components [10,11,12,13,14,15]. Climate change, due to global warming, is having significant societal and economic consequences, which are more severe in some areas than in others. Furthermore, it can have a greater negative impact on certain social groups, for example, the elderly and people with disabilities. Therefore, the member states of the European Union, including Estonia, are developing strategies for the adaptation to climate change [16], which can only be effective when they are based on comprehensive studies of changes in the condition of the atmosphere (including air temperature). Knowing the current condition of the environment and trends in its changes will help predict what developments are to be expected in the upcoming decades, which will have to be considered while drafting strategies on adaptation to changes.
Meteorological studies in the vicinity of the central part of the Baltic Sea have been conducted for quite a long time [17,18,19,20,21,22,23,24,25,26]. This allowed for the evaluation of the regularities of the changes in the condition of the atmosphere of the coastal area both in the long- and short-term [27,28,29,30,31,32,33,34,35,36,37,38,39,40,41]. The change in the thermal regime of the Baltic Sea is extremely important, as it has a significant impact on economic activity, especially during the cold season. In the central part of the Baltic Sea, the formation of ice cover and the extent of its distribution have a particularly strong impact, affecting fishery and port activities and the safety of navigation in Russia, Finland, Estonia, and Sweden [42,43,44].
The changing trend in the surface air temperatures is quite a complicated process to be assessed, which, in addition to its random aspect, has certain temporal and spatial characteristics. Observation places, measurement techniques, and types of equipment have changed over time; therefore, it is very important to analyze the results of the latest more precise measurements of surface air temperatures. Various studies have shown that on average, the increase in surface air temperature in the central Baltic area, reaching as much as 0.5 °C per decade, is faster than that in the Northern Hemisphere [32,33]. Thus, the increase in surface air temperature has primarily taken place in the spring and autumn. Despite the relatively small size of the central Baltic area, we can still observe significant regional differences due to the influence of the Baltic Sea, as well as the Atlantic and Arctic oceans. North Atlantic oscillation plays an important role in the formation of the local climate of the Baltic Sea area (especially from November to April) [26]. Studying surface air temperatures in the central Baltic area will allow the characteristics of climate change to be understood on a regional scale and the nature of global warming can be defined more accurately [33].
2. Materials and Methods
In this study, we aimed to analyze the changes in surface air temperatures and their relationship between cities of the central Baltic area (Tallinn, Narva, Pärnu, Tartu, Võru, Stockholm, and Helsinki) at various time points (daily, monthly, seasonal, and annual) between 2005 and 2019. It is noteworthy that in some cases, the meteorological stations are located outside the city limits in order to eliminate the general thermal effect of the urban environment. For the sake of brevity, hereinafter, we will be using the names of the cities instead of the names of the stations where air temperatures were measured. We selected the area and the specific cities by considering their location in relation to the Baltic Sea and the availability of the long-term results of reliable measurements of air temperature. Figure 1 displays the map of the study area. In the study area, the coastal cities namely, Stockholm, Tallinn, and Narva are located in the west-to-east direction, whereas Helsinki, Tallinn, and Pärnu are located in the north-to-south direction. Tartu and Võru are inland cities located somewhat off the coast of the Baltic Sea. Previous studies show greater differences in the changes in the air temperature of various cities in the area being researched in this study. Tallinn’s location is central in relation to the area being researched; therefore, in many cases, it is reasonable to look for correlation and difference in surface air temperatures in relation to Tallinn’s surface air temperatures.
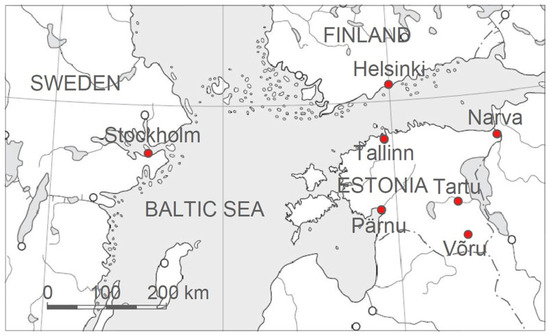
Figure 1.
Map of the central Baltic area.
The operation of meteorological stations in Estonia is coordinated by the Estonian Weather Service (EWS), which publishes the results of meteorological observations in its yearbooks; the latest data available are from the year 2019 [45]. The Tallinn meteorological station began its operation in 1805, and since 1946, air temperatures in Tallinn have been measured by the Tallinn–Harku meteorological station. Narva meteorological station has been operating since 1866. Between 2000 and 2013, the station was in Narva–Jõesuu, and at the end of 2013, the station was moved to Soldina village, which is under the municipal administration of Narva–Jõesuu. Pärnu meteorological station began recording measurements in 1842. In Tartu, meteorological measurements have been recorded since 1865, and since 1964, air temperatures for Tartu have been measured by the Tartu–Tõravere meteorological station. Võru meteorological station has been operating since 1868. The data on the daily average surface air temperatures in Tallinn, Narva, Pärnu, Tartu, and Võru for the period from 1 January 2005 to 31 December 2019 (15 years) has been obtained from the Estonian Environment Agency [46].
Meteorological observation in Stockholm was started in 1754, and the data on daily and monthly average surface air temperatures have been recorded by the old astronomical observatory of Stockholm since 1756. The current observation location in Stockholm is a meteorological station of the national station network operated by the Swedish Meteorological and Hydrological Institute (SMHI). Data on the daily average air temperatures in Stockholm between 2005 and 2019 have been obtained from the database of the Bolin Centre for Climate Research [47].
The oldest meteorological station in Finland is Helsinki–Kaisaniemi, which has been operating since 1844. We obtained the daily average surface air temperature data of Helsinki–Kaisaniemi from 2005 to 2019 from the database of the Finnish Meteorological Service [48]. Table 1 shows the locations of the meteorological stations. Supplementary Material (Table S1) shows the daily average surface air temperatures in the relevant cities of the central Baltic area during the period 2005–2019.

Table 1.
Locations of meteorological stations.
To compare the peculiarities of the changes in air temperatures in the central Baltic area, the daily mean surface air temperatures in central England were used [49,50]. The central England surface air temperature series is the longest existing meteorological record. These daily temperatures are representative of a roughly triangular area of the United Kingdom enclosed by Lancashire, London and Bristol.
The daily, monthly, seasonal, and annual average surface air temperatures were determined as weighted averages based on the data on daily average air temperatures:
where is the average surface air temperature for the period , is the period (date, month, season, or year), and is the number of periods .
To describe changes in the average surface air temperatures, the trend in changes in air temperatures was calculated using the method of least squares [51].
As the area being studied is relatively small, surface air temperatures are mostly influenced by the same synoptic processes. Consequently, surface air temperatures in different cities are not completely independent. Therefore, we used regression analysis to assess the relationship between them.
The formation of specific meteorological conditions depends on a multitude of factors, which makes cause-and-effect relationships difficult to determine, which is only possible in individual-specific situations. Each individual meteorological situation can be regarded as one realization of all kinds of situations in a given location that have a probability of occurrence. In this study, we employed statistical methods to analyze the trend in changes in surface air temperatures as they change to a great extent over time [51,52].
Random variables were characterized by a certain distribution function. Depending on the distribution function, different methods can be used for the assessment and verification of the significance of changes and differences.
Welch’s -test allows changes of values to be tested when the changes being studied correspond to a normal distribution. The correspondence of the distribution of surface air temperatures of a specific period to the normal distribution is verified by Shapiro–Wilk, Jarque–Bera, and Smirnov–Kolmogorov tests [53].
The difference between the average temperatures and , in case the variance of the comparable temperatures is different, can be tested with Welch’s -test, for which the test statistic is calculated using the following equation:
where and are sample sizes, and and are standard deviations of the measured temperatures (samples). The number of degrees of freedom is calculated using the following equation:
There is no significant difference if is the value of the Student’s t-test or critical value of the test statistic corresponding to the significance level or error probability and the number of degrees of freedom .
In cases where the data do not follow the normal distribution, we used the Kruskal–Wallis test to compare the medians of two or more samples of equal or different sizes (temperatures at different measuring points) [54,55]. All observations are ranked together in the test. Each sample is characterized by the sum of ranks. The test statistic is calculated using the following equation:
where is the number of data in sample , is the number of samples, is the size of total data set, and is the sum of ranks in the th sample.
For the null hypothesis (that the medians of all the samples are equal) to be rejected, the calculated must be greater than the critical value of the chi-square distribution at the given significance level. The number of degrees of freedom is determined using the following equation:
A negative result of the Kruskal–Wallis test means that the data being analyzed are not from the same data set. In this case, the medians of different samples (temperatures at different time points) can be compared in pairs with Dunn’s test [56], which compares the mean ranking of different samples , where is the sum of ranks of the th sample, and is the sample size for the th group. To compare sample A to B, the test statistic is calculated using the following equation:
where , and is the standard deviation of .
Dunn’s test can be used to identify the samples that are more similar to each other and group them by similarity. The results can be represented by a diagram, using the critical difference diagrams developed by Demšar [57]. The diagram combines the samples (different measuring points) that do not have a critical difference of temperatures into groups. A sample can be in several different groups at the same time if there are no critical differences.
3. Results and Discussion
3.1. Changes in Average Daily Surface Air Temperatures
3.1.1. Annual Changes in Average Daily Surface Air Temperatures
The annual average daily surface air temperatures changed noticeably during the 15-year study period. Changes in surface air temperature follow a certain course during a year, with the maximum surface air temperatures recorded in July and the minimum in February. Changes in the surface air temperatures in different cities are quite similar, and differences are greater during the winter. Figure 2 shows that the short-term changes in surface air temperatures have occurred synchronously in different cities over most of the time.
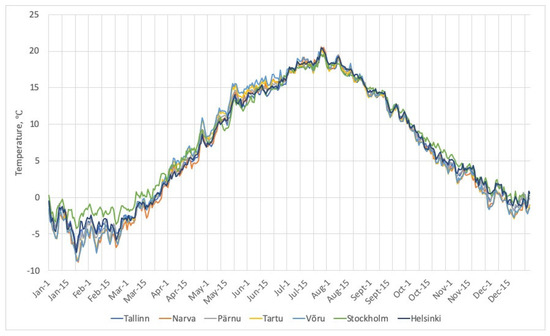
Figure 2.
Annual changes in average daily temperatures as an average of the years 2005–2019.
Table 2 displays the extreme and average values of daily surface air temperatures in the cities of the central Baltic area. The minimum average daily air temperature between 2005 and 2019 was measured in Võru (−28.1 °C), and the maximum average daily air temperature was also recorded in Võru (28.5 °C).
Table 2.
Statistical indicators of air temperatures (°C) in the cities of the central Baltic area from 2005 to 2019.
Figure 3 shows the changes in average daily surface air temperatures (5478 observations in each location) in terms of the frequency of the occurrence of different temperatures. The frequency distribution of the surface air temperature in the cities of the central Baltic area has two local maximums: one at approximately 2 °C and the other at 16 °C. The local minimum temperature between them is about 10 °C. The distribution is asymmetric from the local maximums toward extreme temperatures; a change of about 30 °C is possible toward lower temperatures and of about 12 °C toward higher temperatures. Two local maximum frequencies mean that there are two most probable surface air temperature situations (cool and warm). Frequency distributions in different cities are similar, and the visual shows that the frequency of lower air temperatures in Stockholm is lower than that in the other cities.
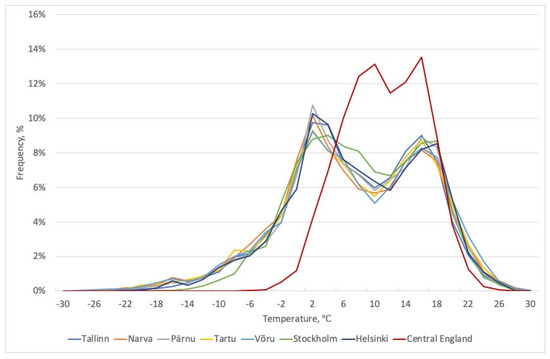
Figure 3.
Frequency distributions of average daily air temperatures during the period 2005–2019. Percentages are calculated for 2 °C intervals.
The frequency distribution of the daily mean air temperatures in central England differs from the frequency distribution in the central Baltic area. At higher temperatures, the frequency distribution practically coincides with the frequency distribution of air temperatures in the central Baltic region, but there is a significant difference in the occurrence of lower air temperatures.
The frequency distribution of the average daily surface air temperatures in the cities of the central Baltic area during the 15-year study period does not correspond to normal distribution, either visually or according to the Jarque–Bera and Smirnov–Kolmogorov tests. Therefore, we used the nonparametric Kruskal–Wallis test to compare the average daily surface air temperatures of the cities. The analysis revealed that the average daily surface air temperatures of all the cities cannot be considered to come from the same data set at the significance level of 0.05 (as the observed value of H (26.75) is higher than the critical value (12.59)), i.e., the surface air temperatures of different cities differ from one another. Using Dunn’s test, we can determine in which cities there is no significant difference between the average daily surface air temperatures during the period 2005–2019. According to the results of Dunn’s test, at the significance level of 0.05, the cities can be divided into two groups (A and B) based on the average daily air temperature, of which Narva (A) and Stockholm (B) differ the most. Figure 4 shows a diagram of the critical differences in surface air temperatures. On the diagram, the cities are ranked according to the mean rank of the variation series. It is interesting to note that three cities (i.e., Pärnu, Võru, and Helsinki) belong to both groups, i.e., their average daily air temperatures do not show a critical difference in the Dunn’s test at the significance level of 0.05 compared to the surface air temperature of any other cities in the central Baltic area.
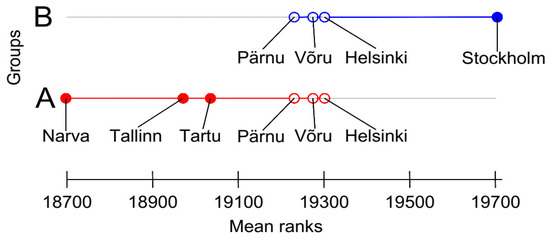
Figure 4.
Division of the cities into groups based on the critical difference (Dunn’s test) in average daily surface air temperatures from 2005 to 2019.
The cities of the central Baltic area in question are located within a small area: the maximum distance between the cities does not exceed 600 km, i.e., they remain within the limits of the average synoptic scale. Consequently, the condition of the atmosphere in these cities can, in many cases, be affected by the same synoptic processes. Therefore, it is important to perform a correlation analysis between the average daily surface air temperatures of the cities in question. As Tallinn is in the center of the study area, we compared the correlations between the average daily surface air temperatures of the different cities with that of Tallinn (Figure 5). The analysis (Table 3) revealed that the strongest correlation between average daily surface air temperatures was between Tallinn and Pärnu (Pearson correlation coefficient 0.990), and the weakest correlation between surface air temperatures was between Tallinn and Stockholm (Pearson correlation coefficient 0.947).
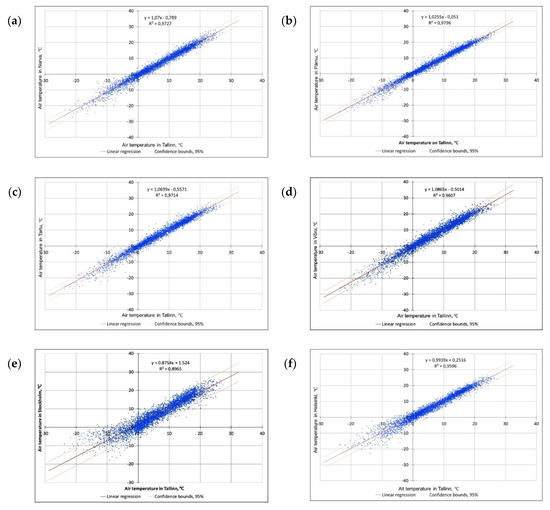
Figure 5.
Correlation of average daily air temperatures in different cities with the average daily air temperature in Tallinn during the period 2005–2019 with a linear regression and 95% confidence bounds: (a)—Narva, (b)—Pärnu, (c)—Tartu, (d)—Võru, (e)—Stockholm, and (f)—Helsinki.
Table 3.
Correlation of the average daily surface air temperatures in the different cities with the average daily air temperature in Tallinn—correlation statistics.
Table 4 presents the regression parameters characterizing the correlations between surface air temperatures in different cities and the average daily air temperature in Tallinn. Changes in surface air temperatures in Narva, Pärnu, Tartu, and Võru have a higher rate than in Tallinn (the slope is greater than 1.0). In Stockholm and Helsinki, the changes in surface air temperatures have a lower rate than those in Tallinn (the slope is less than 1.0). The intercept shows the average daily surface air temperature that is being compared to the average air temperature in Tallinn. The average surface air temperature in Narva, Pärnu, Tartu, and Võru is, respectively, 0.79, 0.05, 0.56, and 0.50 °C lower. The average daily surface air temperature in Stockholm is, on an average, 1.52 °C higher, and in Helsinki, it is 0.25 °C higher. The higher surface air temperature in Stockholm is associated with its proximity to the Atlantic Ocean (Gulf Stream). The reason for the higher surface air temperature in Helsinki, which lies to the north of Tallinn, requires further understanding.
Table 4.
Correlations between the average daily surface air temperatures in the different cities and the average daily air temperature in Tallinn—regression parameters.
3.1.2. Changes in Average Daily Surface Air Temperatures in Different Seasons
Changes in the average daily surface air temperatures in the cities of the central Baltic area in different seasons are characterized by the frequency distributions that are shown in Figure 6, which demonstrates that the changes in air temperatures are virtually coincident in summer (June to August, 1380 observations in each city). In winter (December to February, 1353 observations in each city), Stockholm stands out due to its more moderate temperatures. The most significant differences are in the frequency distributions of surface air temperatures in spring (March to May, 1380 observations in each city) and autumn (September to November, 1365 observations in each city).
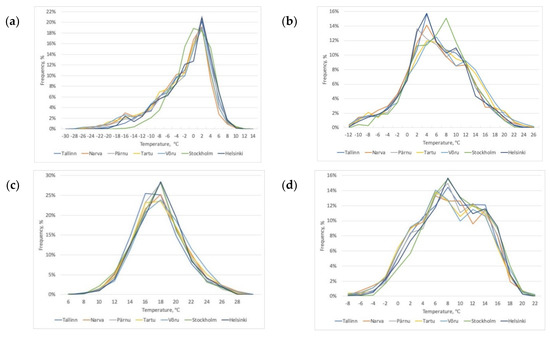
Figure 6.
Frequency distribution of the average daily surface air temperatures during different periods: (a)—December to February, (b)—March to May, (c)—June to August, (d)—September to November. Percentages are calculated for 2 °C intervals.
The frequency distribution of the average daily surface air temperatures in the summer, autumn, and winter did not conform to the normal distribution based on the Jarque–Bera test. Based on the data of Tallinn, Narva, Pärnu, Stockholm, and Helsinki, the frequency distribution of the average daily surface air temperatures in the spring correspond to the normal distribution only based on the Jarque–Bera test and not based on the Shapiro–Wilk test. Therefore, it is appropriate to use the Kruskal–Wallis test instead of Welch’s -test to compare the surface air temperatures of the different seasons.
According to the Kruskal–Wallis test, average daily surface air temperatures in spring (March to May) in the cities of the central Baltic area were not from the same data set at the significance level of 0.05 (since the observed value 43.76 is higher than the critical value 12.59). Using Dunn’s test, we can determine in which cities there was no critical difference between the average daily surface air temperatures during spring from 2005 to 2019. According to the results of the Dunn’s test, the cities can be divided into three groups (A, B, and C) depending on the average daily surface air temperature in the spring, of which Narva and Helsinki (A) and Tartu and Võru (C) differ the most. Figure 7a shows a diagram of the critical difference in spring air temperatures. Dunn’s test shows no critical difference (at the significance level of 0.05) between spring air temperatures in Pärnu, Stockholm, Tartu, and Võru. The same can be said about surface air temperatures in Tallinn, Pärnu, and Stockholm. In addition, there was no significant difference between the air temperatures in Narva, Helsinki, Tallinn, and Pärnu. In spring, surface air temperatures in Pärnu show no critical difference from surface air temperatures in any other city in the central Baltic area.
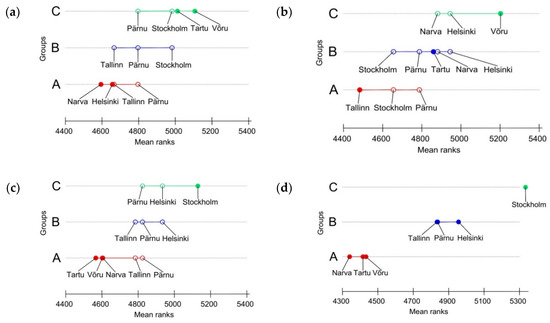
Figure 7.
Division of the cities in the central Baltic area into groups on the basis of the critical difference in average daily surface air temperatures according to the Dunn’s test: (a)—spring, (b)—summer, (c)—autumn, and (d)—winter.
According to the Kruskal–Wallis test, the average daily surface air temperatures in the summer (June to August) in the cities of the central Baltic area are not from the same data set either (since the observed value 54.69 is higher than the critical value 12.59). As a result of the Dunn’s test, the cities can be divided into three groups (A, B, and C) depending on the average daily surface air temperature in the summer, of which Tallinn (A) and Võru (C) differ the most. Figure 7b shows the diagram of the critical difference in summer air temperatures. The surface air temperatures in Tartu (group B) differ significantly from the summer air temperatures in both Tallinn (A) and Võru (C). Unlike in other seasons, surface air temperatures in Stockholm in the summer are among the lowest in the central Baltic area.
According to the Kruskal–Wallis test, average daily surface air temperatures in autumn (September to November) in the cities of the central Baltic area were not from the same data set either (since the observed value 45.59 is higher than the critical value 12.59). Dunn’s test (Figure 7c) revealed that the cities can be divided into three groups (A, B, and C) depending on the average daily surface air temperature in the autumn, of which Tartu and Võru (A) and Stockholm (C) differ the most. In autumn, surface air temperatures in Pärnu show no critical difference from surface air temperatures in any other city in the central Baltic area.
According to the Kruskal–Wallis test, average daily surface air temperatures in winter (December to February) in the cities of the central Baltic area were not from the same data set either (since the observed value 140.58 is higher than the critical value 12.59). Dunn’s test (Figure 7d) revealed that the cities can be divided into three completely different groups (A, B, and C) depending on the average daily surface air temperature in the winter, of which Narva (A) and Stockholm (C) differ the most. In winter, the distribution into groups coincides with the location of the cities in the east-to-west direction. Unlike in other seasons, no city belongs to several groups at the same time in winter. This means that the cities of the central Baltic area can be divided into three significantly different groups depending on the average daily surface air temperatures in the winter.
The distribution of temperatures into groups varies from season to season because of the lack of critical difference. The division of cities in the central Baltic region into groups based on the critical difference in average daily surface air temperature in different months according to the Dunn’s test is presented in the Supplementary Material Figure S1. This might be associated with the varying nature of atmospheric circulation at different seasons and with the impact of the Atlantic Ocean, the Baltic Sea, and the Arctic Ocean.
3.2. Changes in Average Monthly and Annual Air Temperatures
Changes in the surface air temperatures vary greatly from year to year. For example, the difference in average monthly surface air temperatures during the winter months in different years can be as great as 16 °C. In August, these changes are the smallest, staying at around 5 °C. Figure 8 shows the changes in average monthly surface air temperatures during the period 2005–2019. Changes in air temperatures in different years were not synchronous. For example, lower temperatures in were observed in January of 2010, in February of 2013, and in September of 2008. However, the changes in different cities were rather similar.
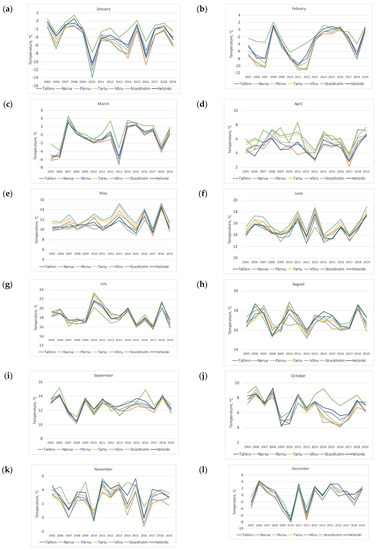
Figure 8.
Changes in the average monthly surface air temperatures from 2005 to 2019: (a)—January, (b)—February, (c)—March, (d)—April, (e)—May, (f)—June, (g)—July, (h)—August, (i)—September, (j)—October, (k)—November, and (l)—December.
Average monthly surface air temperatures in the different cities during the 15-year study period (2005–2019) are quite close to one another despite the high variability of average monthly surface air temperatures (Table 5).
Table 5.
Average monthly and annual surface air temperatures (°C) during the period 2005–2019.
Surface air temperatures changed drastically throughout the year in the different cities. The values were close to each other; therefore, studying the relative difference in surface air temperatures is reasonable. The comparison can be based on the average monthly surface air temperatures in Tallinn due to the city’s central location in the area being studied. Figure 9 shows the difference between the average monthly surface air temperatures in other cities being studied and the average monthly surface air temperature in Tallinn throughout the year.
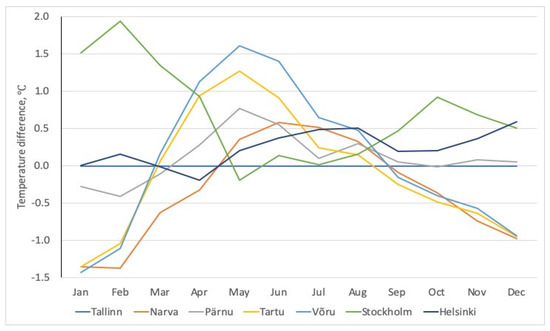
Figure 9.
The difference of average monthly air temperatures from surface air temperatures in Tallinn from 2005 to 2019.
Depending on the nature of changes in the average monthly surface air temperatures, the cities of the central Baltic area can be divided into three groups. The first group comprises Helsinki and Pärnu, where the average monthly surface air temperature does not differ significantly from that of Tallinn, especially in the winter. The second group comprises Tartu, Võru, and Narva, which are characterized by lower temperatures in the winter (up to −1.5 °C), but with equally higher temperatures in the summer than in Tallinn. The third group comprises Stockholm, where the surface air temperature in the winter is up to 2 °C higher than in Tallinn but nearly the same as in Tallinn in the summer.
According to the Jarque–Bera test, the frequency of distribution of the average monthly surface air temperatures corresponds to normal distribution. Therefore, the difference between the average monthly surface air temperatures in Tallinn and in the other cities can be assessed using Welch’s t-test.
To test the null hypothesis (the average monthly surface air temperature in different cities is equal to the surface air temperature in Tallinn in any given month), the test statistic is found using the correlation coefficient (2). The null hypothesis is valid if the value of the test statistic is in the range of to . Figure 10 shows test statistic values for all the cities in different months.
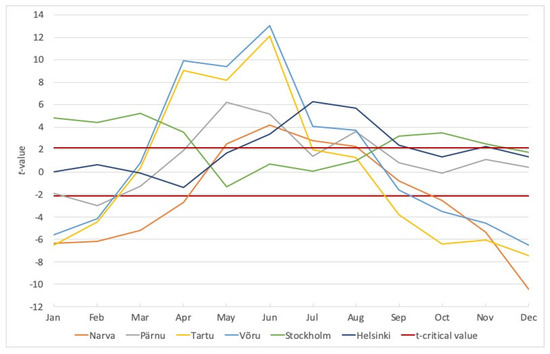
Figure 10.
Testing the hypothesis (surface air temperatures in the different cities are equal to the surface air temperature in Tallinn in any given month) using Welch’s t-test. The hypothesis is valid if the value of the test statistic is in the range of to .
The analysis shows that the average monthly surface air temperatures in Helsinki are the closest to Tallinn air temperatures at the significance set, with the differences practically being noticeable in the summer months alone. Surface air temperatures in Stockholm are not statistically different from those in Tallinn from May to August. Surface air temperatures in Tartu do not differ from those in Tallinn in March, July, and August alone. Surface air temperatures in Võru do not differ from those in Tallinn only in March and August. Surface air temperatures in Narva are only equal to Tallinn air temperatures in September. Surface air temperatures in Pärnu are equal to those in Tallinn from September to January, as well as in March and April.
Average monthly surface air temperatures did not change evenly over time in the studied central Baltic cities. The trends characterizing changes in the average monthly surface air temperature have a certain course during the year (Figure 11). The rate of increase in surface air temperature is slightly different in different cities, but the nature of changes is virtually the same in all the cities. The air temperature increased the most in February, with the increase ranging from 1.8 °C (Stockholm) to 4.5 °C (Võru and Tartu) per decade. In addition to February, during the 15-year study period, the surface air temperature increased in all the studied cities in March, May, June, and December. There was virtually no increase in surface air temperature from July to November. There was no increase in air temperature in January either. Consequently, the changes in surface air temperatures in the central Baltic area are virtually nonexistent during the summer period and are smaller in autumn. Significant changes have occurred in late autumn, late winter, and in spring.
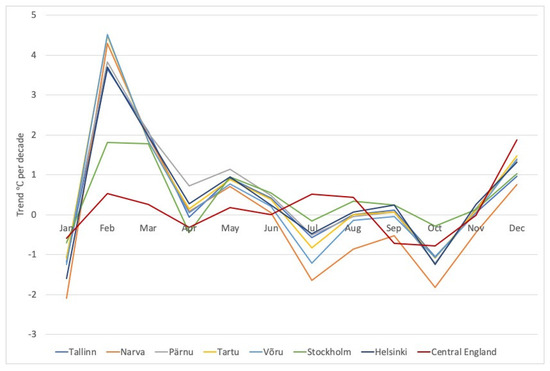
Figure 11.
Trends of average monthly surface air temperatures from 2005 to 2019 in the different cities of the central Baltic area and in central England.
Changes in average monthly surface air temperatures in central England differ significantly from the changes in average monthly air temperatures in the central Baltic area. The monthly average air temperature trends in central England ranged from −0.77 °C per decade to 0.54 °C per decade, except in December where the average monthly air temperature increased by 1.88 °C per decade (Figure 11).
The increase in the average monthly surface air temperatures resulted in an increase in average annual surface air temperature. Although the average annual temperature was lower in some years, it increased steadily during the 15-year study period. The average annual surface air temperature in the cities of the central Baltic area increased by an average of 0.43 °C per decade between 2005 and 2019. The average annual surface air temperature in central England increased significantly less between 2005 and 2019, with an average of 0.12 °C per decade (Figure 12).
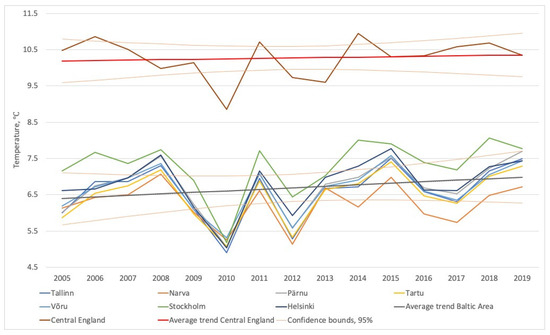
Figure 12.
Changes in the average annual surface air temperatures from 2005 to 2019.
It is noteworthy that 15 years is a relatively short period of time to find a reliable trend but compared to the results of a previous study [28], the trend did not change significantly (approximately 0.4 °C per decade in Tallinn and 0.5 °C per decade in Stockholm and Helsinki).
4. Conclusions
Average daily surface air temperatures in the cities of the central Baltic area differed relatively little between 2005 and 2019. The maximum difference between the daily average temperatures during the 2005–2019 is 1.0 °C, and the frequency distributions of all the average daily surface air temperatures in the period being studied virtually coincide.
Based on the critical difference calculated at the confidence level of 0.05 by Dunn’s test for all the average daily surface air temperatures from 2005 to 2019, the central Baltic cities can be divided into two groups (A and B). Group A comprises Narva, Tallinn, and Tartu with only lower temperatures. Stockholm is the only city in group B. Air temperatures in Pärnu, Võru, and Helsinki are not critically different from the surface air temperatures in Stockholm, Narva, Tallinn, and Tartu.
There is a significant correlation between the average daily surface air temperatures in different cities; the Pearson correlation coefficient ranges from 0.94 (Stockholm) to 0.99 (Narva, Tartu, Võru).
The results of the regression analysis show that there are some differences in the correlation between the daily average surface air temperatures. Changes in surface air temperatures in Narva, Pärnu, Tartu, and Võru are greater (slope from 1.026 to 1.09) than those in Tallinn, whereas changes in the surface air temperature in Stockholm are moderate (slope 0.88). Changes in the surface air temperatures in Helsinki are similar to those in Tallinn (slope 0.99).
Frequency distribution shows that changes in the average daily surface air temperatures virtually coincide in the summer (June to August). In winter (December to February), Stockholm stands out due to its more moderate temperatures.
According to the results of Dunn’s test, the cities of the central Baltic area can be divided into three groups based on the critical difference in surface air temperatures in different seasons. The distribution into groups varies from season to season. Stockholm, where surface air temperatures are generally higher, is one of the cities with the lower surface air temperatures in summer. It is only in the winter that the three groups of cities differ completely from one another. Surface air temperatures in Pärnu in the spring and autumn do not differ critically from the surface air temperatures in any other studied city. Similarly, in the summer and winter, the mean rank of the Pärnu surface air temperatures differs little from the mean of the entire data set, by 43 and 102, respectively.
The annual changes in surface air temperatures vary greatly from year to year. Average monthly surface air temperatures in the winter months vary by up to 16 °C in different years. These changes are the smallest in August and remain at about 5 °C. Changes in surface air temperatures in different years did not happen synchronously. However, changes in different cities were rather similar.
Depending on the nature of the changes in the average monthly surface air temperatures, the cities of the central Baltic area can be divided into three groups. The first group comprises Helsinki and Pärnu, where the average monthly surface air temperature does not differ significantly from that of Tallinn, especially in the winter. The second group comprises Tartu, Võru, and Narva, which are characterized by lower temperatures in the winter (up to −1.5 °C), but with equally higher temperatures in the summer than in Tallinn. It is up to 2 °C warmer in the winter in Stockholm than in Tallinn, but in the summer, the surface air temperatures are quite similar to Tallinn.
Welch’s -test shows that, statistically, average monthly surface air temperatures in Helsinki at the significance level of 0.05 are closest to that of Tallinn, and differences occur practically in the summer months only. Surface air temperature in Stockholm does not differ from that of Tallinn from May to August. Surface air temperature in Tartu does not differ from that of Tallinn in only March, July, and August. Surface air temperature in Võru do not differ from that of in Tallinn in March and August. Surface air temperatures in Narva are only equal to Tallinn air temperatures in September. Air temperatures in Pärnu are equal to Tallinn from September to January and in March and April.
Average monthly surface air temperatures did not change in the same way in different months. The trends characterizing changes in the average monthly surface air temperature have a certain course during the year. The rate of increase in surface air temperature is slightly different in the different cities, but the nature of changes is virtually the same in all the cities. The surface air temperature increased the most in February, with the increase ranging from 1.8 °C (Stockholm) to 4.5 °C (Võru and Tartu) per decade. In addition to February, the surface air temperature increased over the 15-year study period in all the studied cities in March, May, June, and December. There was virtually no increase in surface air temperatures from July to November and in January. Consequently, changes in surface air temperatures are nonexistent during the summer period and are smaller in autumn. Significant changes took place in late autumn, late winter, and in spring.
The increase in the average monthly surface air temperatures resulted in an increase in the average annual surface air temperature. The average annual surface air temperature in the cities of the central Baltic area increased by an average of 0.43 °C per decade between 2005 and 2019.
Changes in the surface air temperature in the cities of the central Baltic coastal area did not occur evenly on either the spatial or the temporal scale. The rate of increase in surface air temperature was higher in Pärnu and Tartu and lower in Narva than that of other cities, where the increase in surface air temperature per decade was 0.59, 0.53, and 0.04 °C, respectively.
It is noteworthy that 15 years is a relatively short period, which does not allow a reliable assessment of climate change; nonetheless, it does confirm the continuing increase in air temperature.
Supplementary Materials
The following are available online at https://www.mdpi.com/2073-4433/12/1/60/s1, Table S1: Daily average air temperatures (°C) in the cities of the central Baltic area during the period 2005–2019. Figure S1: Division of the cities in the central Baltic area into groups on the basis of the critical difference in average daily air temperatures according to the Dunn’s test: (a)—January, (b)—February, (c)—March, (d)—April (e)—May, (f)—June, (g)—July, (h)—August. (i)—September, (j)—October, (k)—November, and (l)—December.
Funding
This research received no external funding.
Conflicts of Interest
The author declares no conflict of interest.
References
- Potter, T.D.; Colman, B.R. (Eds.) The Handbook of Weather, Climate, and Water: Dynamics, Climate, Physical Meteorology, Weather Systems, and Measurements; Wiley & Sons Wiley & Sons, Inc.: Hoboken, NJ, USA, 2003; 973p. [Google Scholar]
- Climate Indicators–Temperature. SMHI. Available online: https://www.smhi.se/en/climate/climate-indicators/climate-indicators-temperature-1.91472 (accessed on 18 February 2020).
- IPCC. Climate Change 2001: The Scientific Basis. In Contribution of Working Group I to the Third Assessment Report of the Intergovernmental Panel on Climate Change; Houghton, J.T., Ding, Y., Griggs, D.J., Noguer, N., van der Linden, P.J., Xiaosu, D., Maskell, K., Johnson, C.A., Eds.; Cambridge University Press: Cambridge, UK, 2001; p. 881. [Google Scholar]
- Hartmann, D.L.; Tank, A.M.K.; Rusticucci, M.; Alexander, L.V.; Brönnimann, S.; Charabi, Y.A.R.; Dentener, F.J.; Dlugokencky, E.J.; Easterling, D.R.; Kaplan, A.; et al. Observations: Atmosphere and surface. In Climate Change 2013: The Physical Science Basis. Contribution of Working Group I to the Fifth Assessment Report of the Intergovernmental Panel on Climate Change; Stocker, T.F., Qin, D., Plattner, G.-K., Tignor, M., Allen, S.K., Boschung, J., Nauels, A., Xia, Y., Bex, V., Midgley, P.M., Eds.; Cambridge University Press: Cambridge, UK, 2013; pp. 159–254. [Google Scholar]
- Jones, P.D.; New, M.; Parker, D.E.; Martin, S.; Rigor, I.G. Surface air temperature and its variations over the last 150 years. Rev. Geophys. 1999, 37, 173–199. [Google Scholar] [CrossRef]
- Fan, Y.; Dool, H. A global monthly land surface air temperature analysis for 1948–present. J. Geophys. Res. 2008, 113, D01103. [Google Scholar] [CrossRef]
- Hansen, J.; Ruedy, R.; Sato, M.; Lo, K. Global surface temperature change. Rev. Geophys. 2010, 48, RG4004. [Google Scholar] [CrossRef]
- Luterbacher, J.; Werner, J.P.; Smerdon, J.E.; Fernández-Donado, L.; González-Rouco, F.J.; Barriopedro, D.; Ljungqvist, F.C.; Büntgen, U.; Zorita, E.; Wagner, S.; et al. European summer temperatures since Roman times. Environ. Res. Lett. 2016, 11, 024001. [Google Scholar] [CrossRef]
- IPCC Special Report Global Warming of 1.5 °C. Available online: https://www.ipcc.ch/report/sr15/ (accessed on 14 August 2020).
- Assessment of Climate Change for the Baltic Sea Basin; Regional Climate Studies. The BACC Author Team; Springer: Berlin/Heidelberg, Germany, 2008; 474p.
- Tarand, A.; Eensaar, A. Air Temperature, Country Case Study on Climate Change Impacts and Adaptation Assessments in the Republic of Estonia; Stockholm Environment Institute-Tallinn: Tallinn, Estonia, 1998; pp. 17–21. [Google Scholar]
- Orviku, K.; Jaagus, J.; Kont, A.; Ratas, U.; Rivis, R. Increasing activity of coastal processes associated with climate change in Estonia. J. Coastal Res. 2003, 19, 364–375. [Google Scholar]
- Kont, A.; Jaagus, J.; Aunap, R. Climate change scenarios and the effect of sea-level rise for Estonia. Glob. Planet. Chang. 2003, 36, 1–15. [Google Scholar] [CrossRef]
- Eensaar, A. Analysis of Fine Particulate Matter Concentrations in the Ambient Air of the Industrial Cities of Northern Estonia. Energy Environ. Eng. 2014, 2, 121–128. [Google Scholar]
- Öğlü, B.; Möls, T.; Kaart, T.; Cremona, F.; Kangur, K. Parameterization of surface water temperature and long-term trends in Europe’s fourth largest lake shows recent and rapid warming in winter. Limnologica 2020, 82, 125777. [Google Scholar] [CrossRef]
- Climate Change Adaption in Estonia. Estonian Environmental Research Centre. Available online: http://www.klab.ee/kohanemine/en/ (accessed on 20 February 2020).
- Moberg, A.; Bergström, H.; Ruiz Krigsman, J.; Svanered, O. Daily air temperature and pressure series for Stockholm (1756–1998). Clim. Chang. 2002, 53, 171–212. [Google Scholar] [CrossRef]
- Moberg, A.; Alexandersson, H.; Bergström, H.; Jones, P.D. Were Southern Swedish summer temperatures before 1860 as warm as measured? Int. J. Climatol. 2003, 23, 1495–1521. [Google Scholar] [CrossRef]
- Tarand, A.; Jaagus, J.; Kallis, A. Eesti Kliima Minevikus Ja Tänapäeval; Tartu Ülikooli Kirjastus: Tartu, Estonia, 2013; 631p. [Google Scholar]
- Tarand, A.; Nordli, P.Ø. The Tallinn temperature series reconstructed back half a millennium by use of proxy data. Clim. Chang. 2001, 48, 189–199. [Google Scholar] [CrossRef]
- Tarand, A. Meteoroloogilised Vaatlused Eestis Enne 1850 Aastat; Teaduse ajaloo küsimusi Eestist: Tallinn, Estonia, 1992; pp. 30–50. [Google Scholar]
- Tarand, A. 200 Aastat Professor CL Carpovi Meteoroloogilistest Vaatlustest; EGS Aastaraamat: Tallinn, Estonia, 1979. [Google Scholar]
- Tarand, A. Tallinnas mõõdetud õhutemperatuuri aegrida. In Publicationes Geophysicales Universitatis Tartuensis; Tartu Ülikooli Kirjastus: Tartu, Estonia, 2003; Volume 93. [Google Scholar]
- Tietäväinen, H.; Tuomenvirta, H.; Venäläinen, A. Annual and seasonal mean temperatures in Finland during the last 160 years based on gridded temperature data. Int. J. Climatol. 2010, 30, 2247–2256. [Google Scholar] [CrossRef]
- Kivinen, S.; Sirpa, R.; Jylhä, K.; Laapas, M. Long-Term Climate Trends and Extreme Events in Northern Fennoscandia (1914–2013). Climate 2017, 5, 16. [Google Scholar] [CrossRef]
- The BACC II Author Team. Second Assessment of Climate Change for the Baltic Sea Basin; Regional Climate Studies; Springer: Cham, Germany; Heidelberg, Germany; New York, NY, USA; Dordrecht, The Netherlands; London, UK, 2015; 501p. [Google Scholar]
- Männik, A.; Zirk, M.; Rõõm, R.; Luhamaa, A. Climate parameters of Estonia and the Baltic Sea region derived from the high-resolution reanalysis database BaltAn65+. Theor. Appl. Climatol. 2015, 122, 19–34. [Google Scholar] [CrossRef]
- Jaagus, J.; Briede, A.; Rimkus, E.; Remm, K. Variability and trends in daily minimum and maximum temperatures and in the diurnal temperature range in Lithuania, Latvia and Estonia in 1951–2010. Theor. Appl. Climatol. 2014, 118, 57–68. [Google Scholar] [CrossRef]
- Kлимaт Taллинa (In Russian: Tallinn Climate); Gidrometeoizdat: Leningrad, Russia, 1982; 266p.
- Kлимaт Пярну (In Russian: Pärnu Climate); Gidrometeoizdat: Leningrad, Russia, 1986; 202p.
- Jaagus, J.; Mändla, K. Climate change scenarios for Estonia based on climate models from the IPCC Fourth Assessment Report. Est. J. Earth Sci. 2014, 63, 166–181. [Google Scholar] [CrossRef]
- Eensaar, A. Temporal and Spatial Variability of Air Temperatures in Estonia during 1756–2014. J. Climatol. 2016, 2016, 1–11. [Google Scholar] [CrossRef]
- Eensaar, A. Peculiarities of Long-Term Changes in Air Temperatures Near the Ground Surface in the Central Baltic Coastal Area. Climate 2019, 7, 22. [Google Scholar] [CrossRef]
- Løvsletten, O.; Rypdal, M. Statistics of Regional Surface Temperatures after 1900: Long-Range versus Short-Range Dependence and Significance of Warming Trends. J. Clim. 2016, 29, 4057–4068. [Google Scholar] [CrossRef]
- Franzke, C. On the statistical significance of surface air temperature trends in the Eurasian Arctic region. Geophys. Res. Lett. 2012, 39, L23705. [Google Scholar] [CrossRef]
- Jaagus, J.; Ahas, R. Space-time variations of climatic seasons and their correlation with the phenological development of nature in Estonia. Clim. Res. 2000, 15, 207–219. [Google Scholar] [CrossRef]
- Karing, P. Õhutemperatuur Eestis; Valgus: Tallinn, Estonia, 1992; 78p. [Google Scholar]
- Jaagus, J. Climatic changes in Estonia during the second half of the 20th century in relationship with changes in large-scale atmospheric circulation. Theor. Appl. Climatol. 2006, 83, 77–88. [Google Scholar] [CrossRef]
- Sepp, M.; Jaagus, J. Frequency of circulation patterns and air temperature variations in Europe. Boreal Environ. Res. 2002, 7, 273–279. [Google Scholar]
- Jylhä, K.; Tuomenvirta, H.; Ruosteenoja, K. Climate change projections for Finland during the 21st century. Boreal Environ. Res. 2004, 9, 127–152. [Google Scholar]
- Jaagus, J. Climatic fluctuations and trends in Estonia in the 20th century and possible climate change scenarios. In Climate Change Studies in Estonia; Stockholm Environment Institute Tallinn Centre: Tallinn, Estonia, 1998; pp. 7–12. [Google Scholar]
- Lépy, É. Baltic Sea ice and environmental and societal implications from the comparative analysis of the Bay of Bothnia and the Gulf of Riga. Fennia 2012, 190, 90–101. [Google Scholar] [CrossRef]
- Dyrcz, C. Analysis of ice conditions in the Baltic Sea and in the Puck Bay. Sci. J. Pol. Nav. Acad. 2017, 210, 13–31. [Google Scholar] [CrossRef]
- Drusch, M. Sea Ice Concentration Analyses for the Baltic Sea and Their Impact on Numerical Weather Prediction. JAMC 2006, 45, 982–994. [Google Scholar] [CrossRef]
- Eesti Meteoroloogia Aastaraamat 2019, Tallinn, Eesti Keskkonnaagentuur. Available online: https://kaur.maps.arcgis.com/apps/MapSeries/index.html?appid=4f118ea1e3954d55ac418d124c0d8662 (accessed on 5 October 2020).
- Estonian Environment Agency. Estonian Weather Service. Available online: http://www.ilmateenistus.ee/teenused/teenuste-tellimine/ (accessed on 19 February 2020).
- Moberg, A. Stockholm Historical Weather Observations—Daily Mean Air Temperatures Since 1756. Available online: https://bolin.su.se/data/data/stockholm_daily_mean_temperature.csv (accessed on 27 February 2020).
- Finnish Meteorological Institute. Available online: http://en.ilmatieteenlaitos.fi/download-observations#!/ (accessed on 1 June 2020).
- Parker, D.E.; Legg, T.P.; Folland, C.K. A new daily Central England Temperature Series, 1772–1991. Int. J. Climatol. 1992, 12, 317–342. [Google Scholar] [CrossRef]
- Met Office Hadley Centre Central England Temperature Data. Available online: https://www.metoffice.gov.uk/hadobs/hadcet/data/download.html (accessed on 25 December 2020).
- Montgomery, D.C.; Runge, R.G. Applied Statistics and Probability for Engineers, 5th ed.; John Wiley & Sons: New York, NY, USA, 2011. [Google Scholar]
- Smith, M.J. Statistical Analysis Handbook; A Comprehensive Handbook of Statistical Concepts, Techniques and Software Tools, 2018 ed.; Issue Version: 2018-3; The Winchelsea Press, Drumlin Publications: Edinburgh, UK, 2018; 631p. [Google Scholar]
- Lowry, R. Concepts and Applications of Inferential Statistics. Online Statistic Textbook. 2008. Available online: http://faculty.vassar.edu/lowry/webtext.html (accessed on 26 March 2020).
- Sprent, P.; Smeeton, N. Applied Nonparametric Statistical Methods, 3rd ed.; Chapman and Hall/CRC: Boca Raton, FL, USA, 2000; 480p. [Google Scholar]
- Kruskal, W.H.; Wallis, W.A. Use of Ranks in One-Criterion Variance Analysis. J. Am. Stat. Assoc. 1952, 47, 583–621. [Google Scholar] [CrossRef]
- Dunn, O.J. Multiple comparisons among means. J. Am. Stat. Assoc. 1961, 56, 52–64. [Google Scholar] [CrossRef]
- Demšar, J. Statistical Comparisons of Classifiers over Multiple Data Sets. J. Mach. Learn. Res. 2006, 7, 1–30. [Google Scholar]


Publisher’s Note: MDPI stays neutral with regard to jurisdictional claims in published maps and institutional affiliations. |
© 2020 by the author. Licensee MDPI, Basel, Switzerland. This article is an open access article distributed under the terms and conditions of the Creative Commons Attribution (CC BY) license (http://creativecommons.org/licenses/by/4.0/).