Article

Different Relationships between Arctic Oscillation and Ozone in the Stratosphere over the Arctic in January and February

Key Laboratory of Meteorological Disasters of China Ministry of Education (KLME), Joint International Research Laboratory of Climate and Environment Change (ILCEC), Collaborative Innovation Center on Forecast and Evaluation of Meteorological Disasters (CIC-FEMD), Nanjing University of Information Science &Technology, Nanjing 210044, China
*
Author to whom correspondence should be addressed.
Atmosphere 2021, 12(2), 129; https://doi.org/10.3390/atmos12020129
Submission received: 14 December 2020 / Revised: 8 January 2021 / Accepted: 11 January 2021 / Published: 20 January 2021
(This article belongs to the Special Issue Ozone and Stratospheric Dynamics)

Abstract

:
We compare the relationship between the Arctic Oscillation (AO) and ozone concentration in the lower stratosphere over the Arctic during 1980–1994 (P1) and 2007–2019 (P2) in January and February using reanalysis datasets. The out-of-phase relationship between the AO and ozone in the lower stratosphere is significant in January during P1 and February during P2, but it is insignificant in January during P2 and February during P1. The variable links between the AO and ozone in the lower stratosphere over the Arctic in January and February are not caused by changes in the spatial pattern of AO but are related to the anomalies in the planetary wave propagation between the troposphere and stratosphere. The upward propagation of the planetary wave in the stratosphere related to the positive phase of AO significantly weakens in January during P1 and in February during P2, which may be related to negative buoyancy frequency anomalies over the Arctic. When the AO is in the positive phase, the anomalies of planetary wave further contribute to the negative ozone anomalies via weakening the Brewer–Dobson circulation and decreasing the temperature in the lower stratosphere over the Arctic in January during P1 and in February during P2.

1. Introduction

The Arctic Oscillation (AO) is the predominantly zonally symmetric mode of atmospheric variability in the extratropical Northern Hemisphere, which is characterized by the sea-saw in sea level pressure (SLP) anomalies between the Arctic and mid-latitudes and is most active in winter [1]. The AO is well-known for its role in influencing the extratropical climate in the Northern Hemisphere [2,3]. For example, some recent studies have shown that the AO during boreal winter may be close related to meridional temperature gradient and mid-latitude westerlies [4], occurrence of blocking [5], intensity of circumpolar jet stream, the location of the storm track [3], strength of subtropical jet in the North Pacific [6], and the extent of Hadley circulation [7], etc.
Besides changes in the tropospheric circulation, AO is also closely related to changes in the stratosphere. The phase shifting of the AO is associated with the changes of polar vortex intensity in the lower stratosphere, that is, the positive (negative) phase of AO corresponds to a strengthened (weakened) polar vortex in the stratosphere [8,9]. Ozone, as a radiatively and chemically active gas in the stratosphere, is closely related to the climate changes in the Northern Hemisphere (e.g., [10,11,12]), especially the polar vortex in the stratosphere [13]. Strong polar vortices can deplete ozone concentrations by impeding the dynamic mixing of the ozone-poor atmosphere over the Arctic and ozone-laden air at mid-latitudes and by chemically promoting the consumption of ozone by ozone-depleting substances (ODSs) [14,15,16]. Recently, Zhang et al. [17] found that the AO could influence the vertical distribution of ozone in the stratosphere in the Northern Hemisphere.
Some previous studies implied that the relationship between the AO and changes of climate in the Northern Hemisphere exhibits interdecadal variation [18,19]. For example, the relationship between the AO and the East Asian winter monsoon was statistically insignificant during 1950–1970 but statistically significant during 1983–2012; the latter significant connection might be related to the upstream extension of the East Asian jet stream (EAJS) [19]. Liu et al. [18] further showed that the relationship between the AO and EAJS is unstable during 1900–2009. The subtropical jet could influence the planetary wave in the stratosphere propagated from the troposphere [20], which could further alter the ozone concentration in the stratosphere over the Arctic by modulating the stratospheric circulation [21]. A question arises as to whether the relationship between the AO and ozone in the lower stratosphere over the Arctic is stable.
In addition, the studies investigating the climate change in middle and late winter often considered the January and February together [22,23]. However, Hu et al. [24] reported that January is a transition month from early winter (November–December) to late winter (February–March) and the data in January is not used when they compare the temperature and planetary wave activities trends in the stratosphere between the early and late winter. Zhou et al. [25] found that trends of the Eliassen–Palm (EP) flux divergence in January is positive, but it is negative in February. The question of the relationships between the AO and ozone in the lower stratosphere over the Arctic in January and February is still unclear.
Using reanalysis datasets, the relationships between the AO and ozone concentrations in the lower stratosphere over the Arctic in January and February are investigated. This paper is organized as follows: the data and methods are introduced in Section 2; the relationship between the AO and ozone concentrations in the lower stratosphere over the Arctic is analyzed in Section 3; the possible underlying mechanisms between the two metrics are elucidated in Section 4; the discussion and conclusions are given in Section 5.

2. Datasets and Methods

2.1. Datasets

The monthly mean temperature, horizontal and vertical wind velocities, geopotential height, SLP and ozone datasets are taken from the National Aeronautics and Space Administration Modern-Era Retrospective Analysis for Research and Applications version 2 (MERRA-2) during 1980–2019, which ranges from the surface to 0.1 hPa in 42 levels with horizontal resolution of 0.5° × 0.625° (latitude × longitude) [26]. We also used the ozone concentration derived from ERA-Interim with 0.25° × 0.25° latitude–longitude grids and 37 pressure levels in the period 1980–2019. The European Centre for Medium-Range Weather Forecasts (ECMWF) interim reanalysis (ERA-Interim) project was started in 2006 by ECMWF [27]. Solar Backscatter Ultraviolet (SBUV) ozone profiles with 21 vertical levels covers 1980–2013, which from backscattered radiance measurements at several different ultraviolet wavelengths [28]. The ozone records derived from the Microwave Limb Sounder (MLS) dataset covers from 82 °S to 82 °N during the period 2005–2019. Ozone concentration of MLS is the standard product obtained from radiances that is measured by the 240 GHz radiometer (version 4.2) [29].
Figure 1 shows the time evolution of the anomalies in ozone concentration in the lower stratosphere over the Arctic region (60–90 °N; 30–300 hPa) in January and February during the period 1980–2019. The concentrations of ozone in the lower stratosphere over the Arctic obtained from the ERA-Interim, SBUV, MERRA-2, and MLS datasets are in good agreement. And the correlation coefficients of ozone anomalies averaged over the Arctic in the lower stratosphere between MERRA2 and ERA-Interim, SBUV and MLS are 0.80, 0.42, 0.92 in January, and 0.89, 0.77, 0.96 in February, respectively. Previous studies have shown that MERRA-2 ozone data compares well with satellite ozone observations in the upper troposphere and stratosphere [30], Therefore, the ozone dataset of MERRA-2 adopted in our paper is enough.
The Oceanic Niño Index (ONI) and AO index during 1980–2019 derived from the National Oceanic and Atmospheric Administration/Earth System Research Laboratory Physical Sciences Division dataset are also used in this article.

2.2. Methods

The empirical orthogonal function (EOF) method has been widely used in meteorology to extract dominant modes of data with complex spatial/temporal structures [31]. It could efficiently decompose the data into many eigenmodes which are always associated with physical processes. The EOF eigenmodes can be ordered in terms of the percentage of the total variance and the first few modes may contain a significant portion of the total variance. We also used the method from North et al. [32] to examine whether eigenvalues are significantly separated.
Following Monier and Weare [33], the changes of ozone concentrations in the lower stratosphere over the Arctic can be accurately diagnosed via the following equation:
χ ¯ t = v ¯ * a χ ¯ φ ω ¯ * χ ¯ z 1 ρ 0 · M + S ¯
M φ = ρ 0 ν χ ¯ ν θ ¯ θ z ¯ χ ¯ z
M z = ρ 0 ω χ ¯ + 1 a ν θ ¯ θ z ¯ χ ¯ φ
where χ ¯ is the zonal mean ozone concentration. ν ¯ * and ω ¯ * are the meridional and vertical transformed Eulerian mean velocities, respectively [34]. a is the radius of the Earth. z is the height and φ is the latitude. ρ 0 is the density of air. · M is the divergence of the eddy flux vector M following Equations (2) and (3). v , θ , and f are the meridional wind, potential temperature, and Coriolis parameter, respectively. The overbars and primes denote the zonal mean and the departure from the zonal mean, respectively. The first two terms in Equation (1) represent the meridional and vertical advection of ozone by the Brewer-Dobson circulation (BDC), respectively. The third term in Equation (1) exhibits the large-scale eddy transport of ozone. S ¯ is the net chemical ozone production term.
Because El Niño–Southern Oscillation (ENSO) is closely related to the AO and ozone in the stratosphere [35,36], we remove the ENSO signal from all variations by linear regression. We also remove the linear trend from all variation to avoid the effects of global warming.

3. Relationship between the AO and Ozone in the Lower Stratosphere over the Arctic

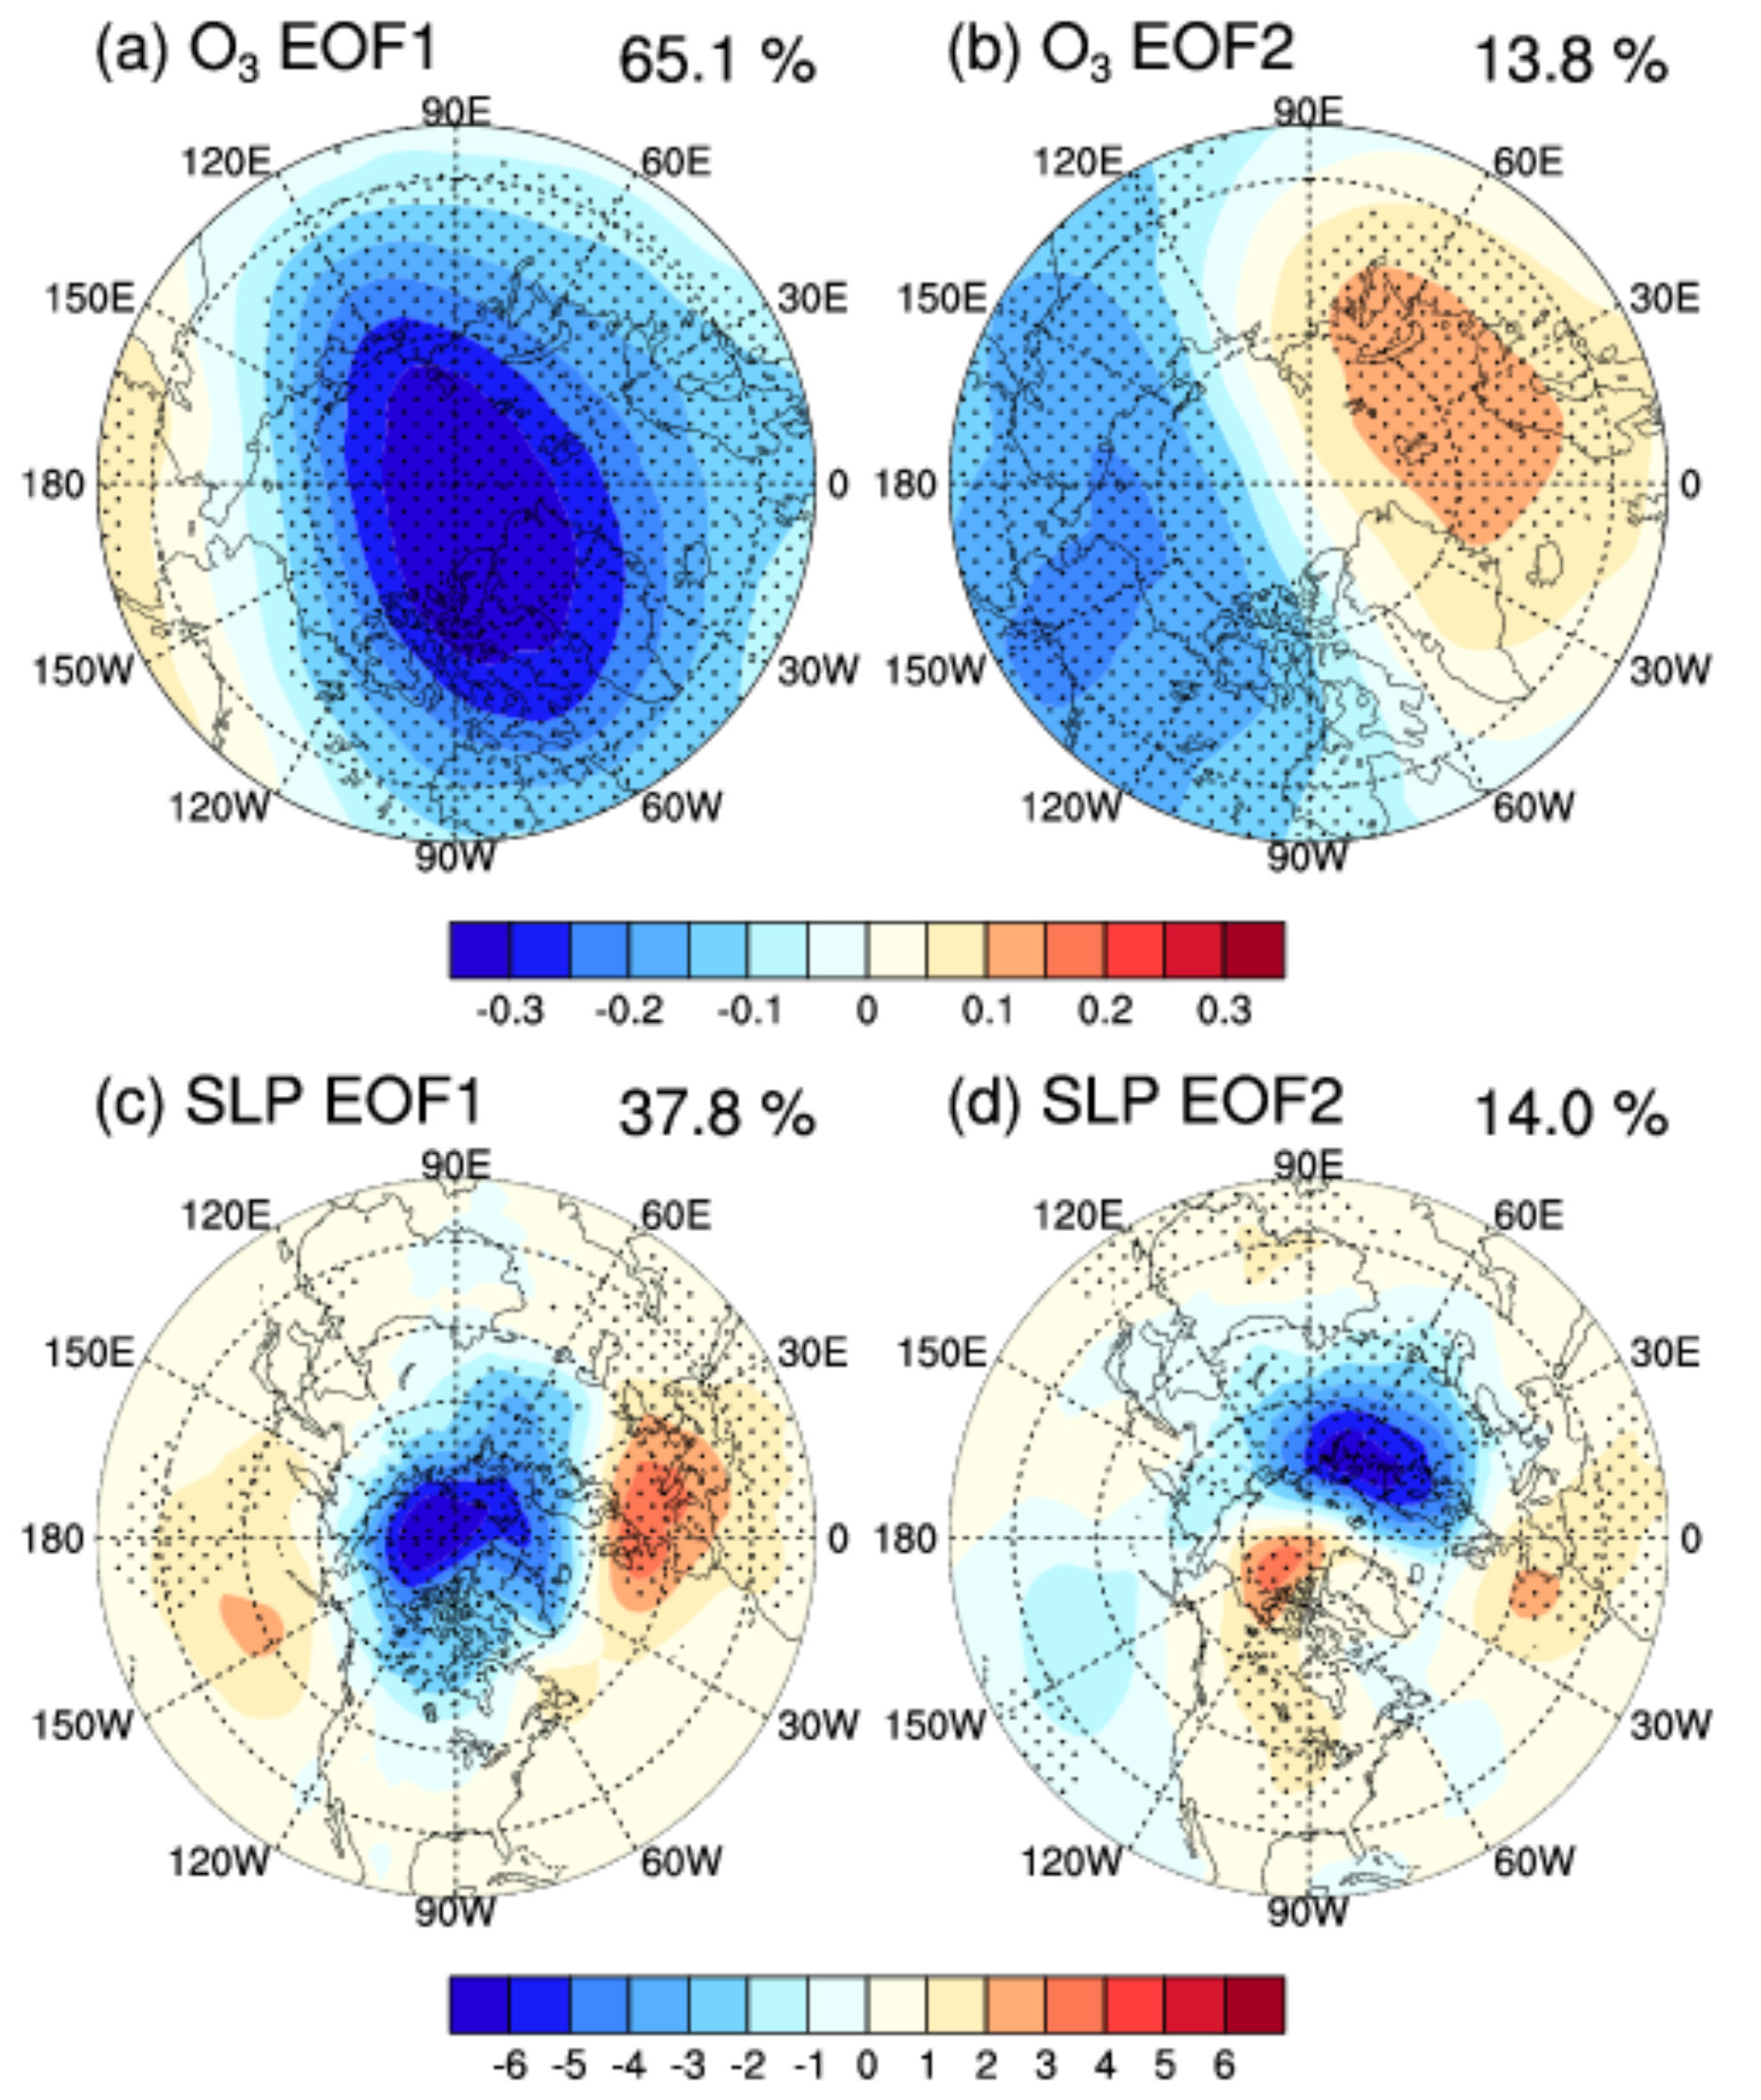
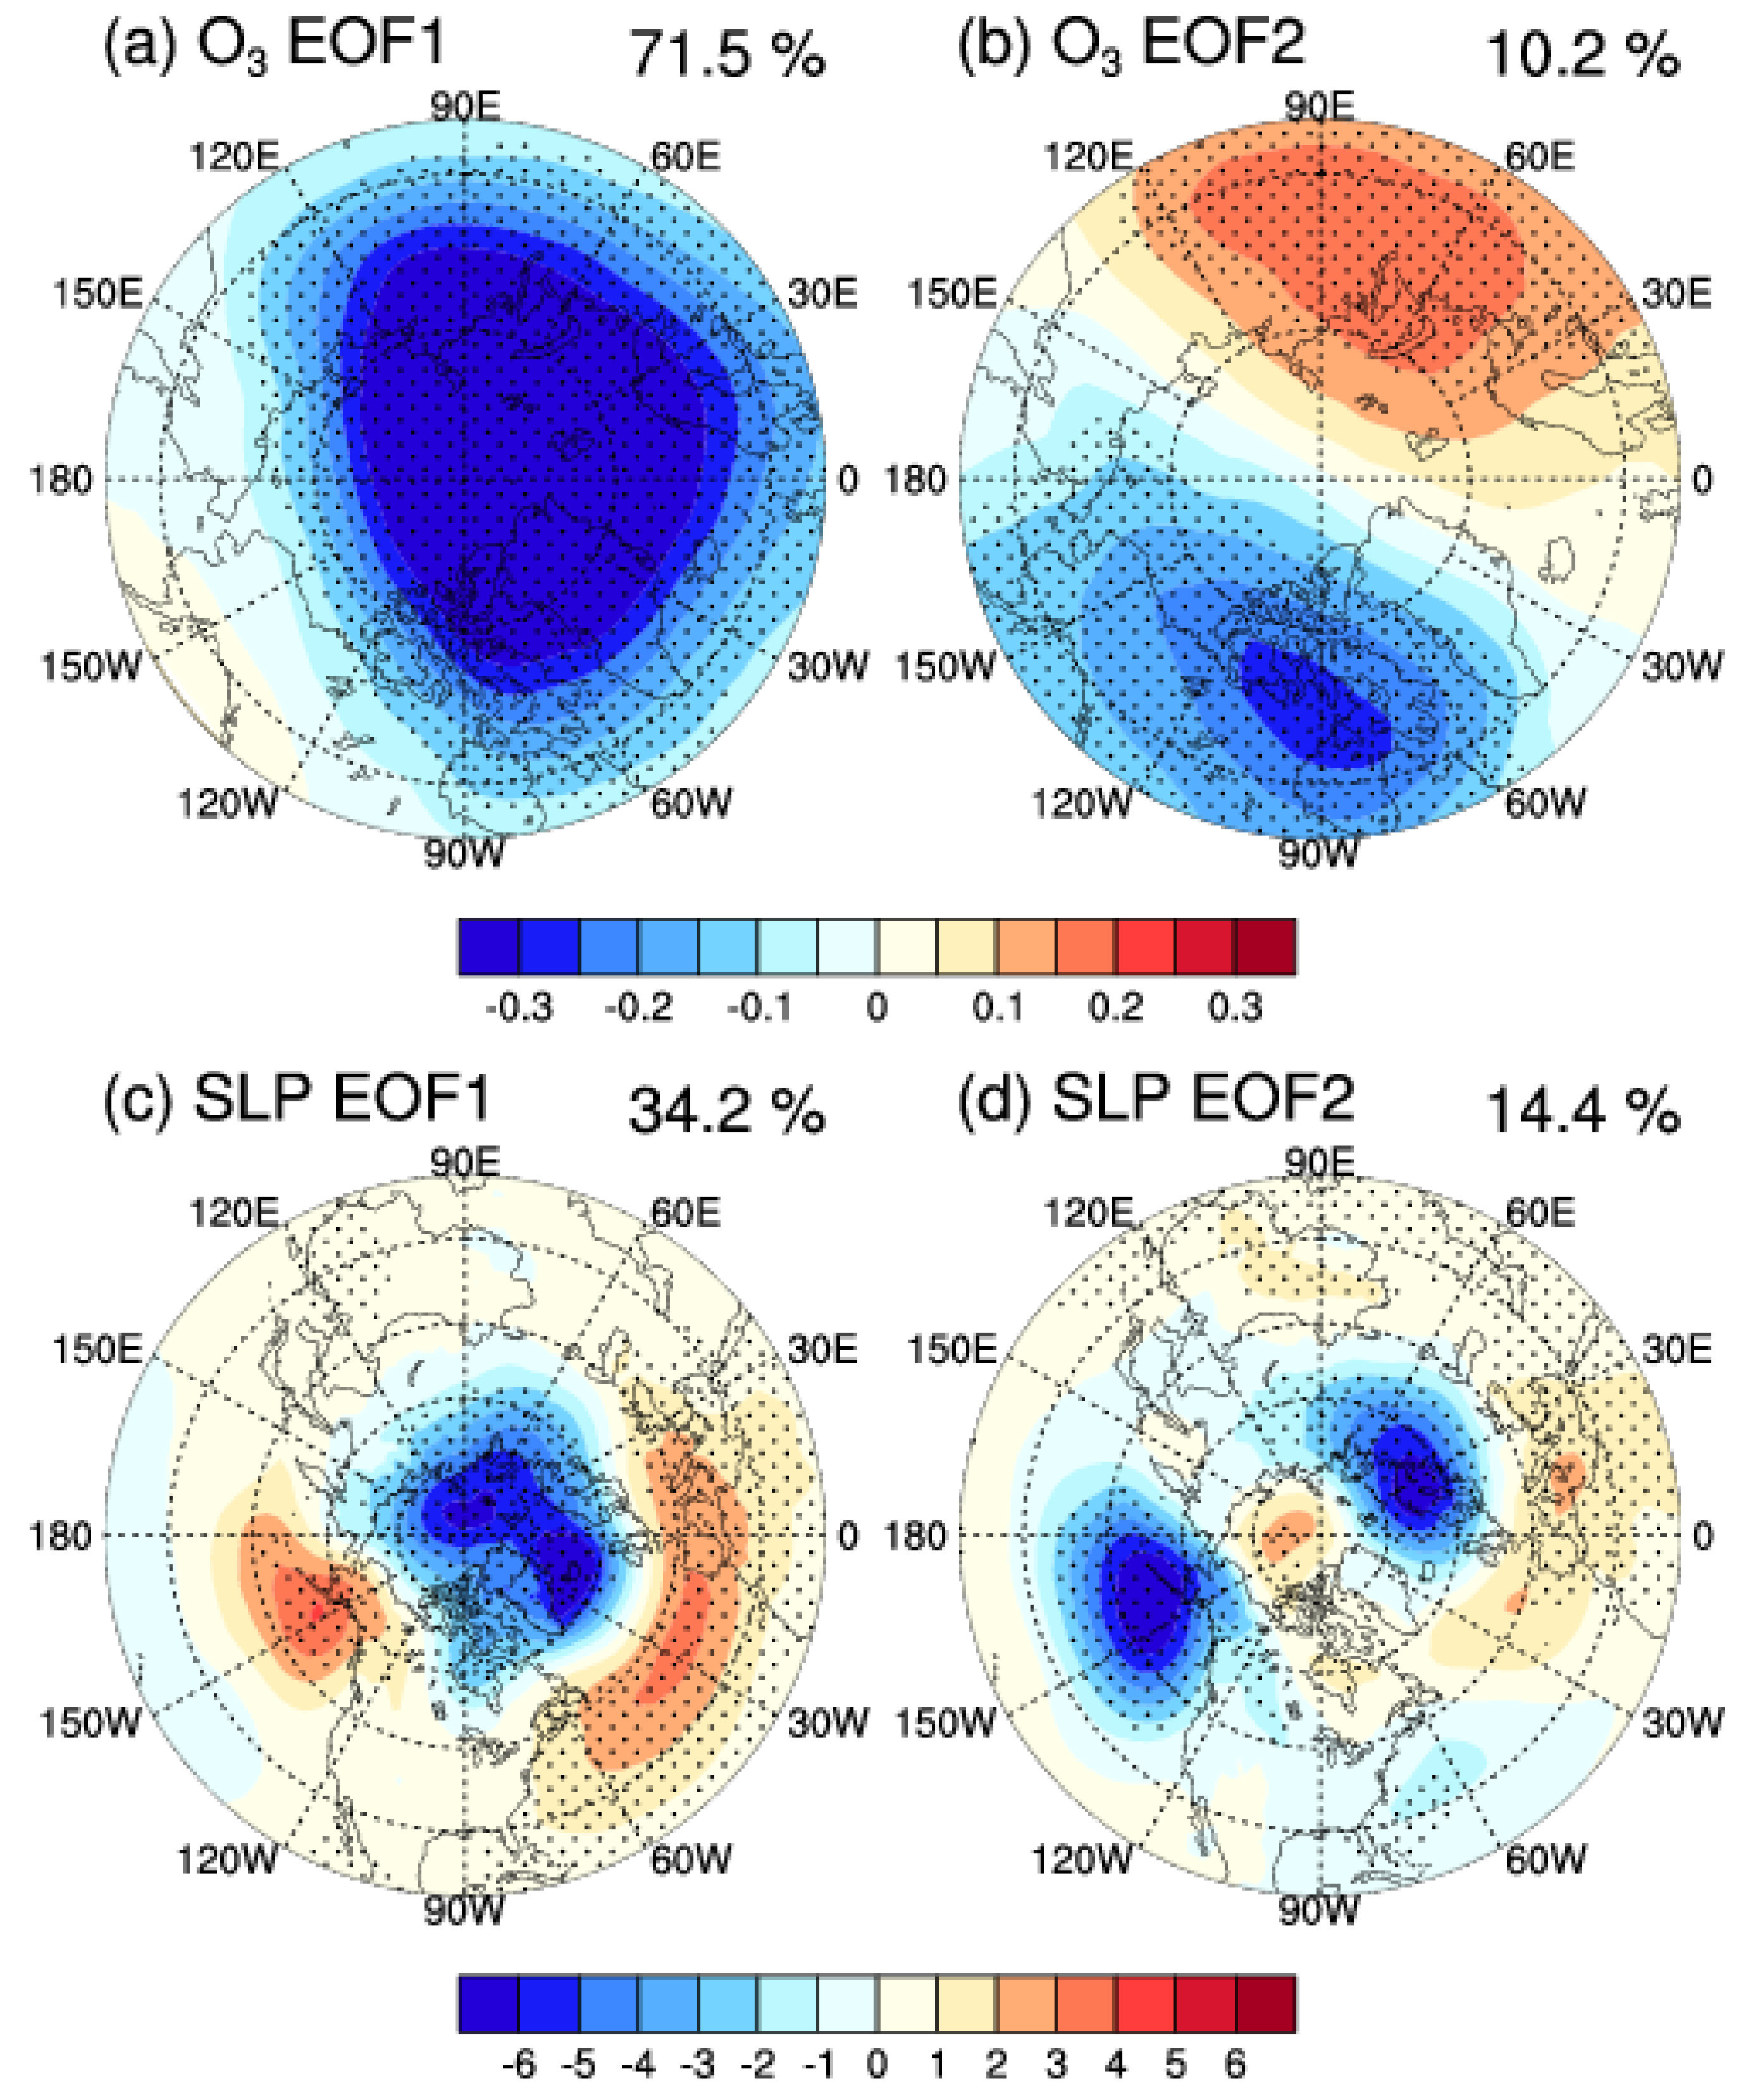
Figure 2a,c show the EOF1 mode of the ozone concentration in the lower stratosphere over the Arctic and SLP in January. The negative ozone anomalies are characterized by a uniform pattern over the Arctic (Figure 2a) and the SLP anomalies exhibit an AO-like pattern with negative SLP anomalies over the Arctic and positive SLP anomalies at mid-latitude (Figure 2c). The correlation coefficient between the first principal component (PC1) of ozone concentrations and SLP is 0.38, significant at the 95% confidence level. The second EOF mode (EOF2) of ozone concentration and SLP are shown in Figure 2b,d, respectively. The wave structure of zonal wavenumber 1 over the Arctic can be observed, but the correlation coefficient between second principal component (PC2) of these two metrics is 0.24, which is insignificant. In February, the EOF1 of ozone concentration and SLP (Figure 3a,c) are similar as that in January and the correlation coefficient of their PC1 is 0.39. The EOF2 of ozone concentration with a wave structure of zonal wavenumber 1 (Figure 3b) is also like that in January. It is worth pointing out that the EOF2 of SLP (Figure 3d) is not significantly separated with its other modes by using the method of North et al. [32]. Either in January or February, the EOF1 of ozone in the lower stratosphere over the Arctic and SLP from ERA-Interim in January and February are consistent with those from MERRA2 (figure not shown). These results suggest that the close relationship between the ozone concentration in the lower stratosphere and SLP in January and February are mainly contributed by their EOF1—that is, there are negative anomalies of ozone in the lower stratosphere over the Arctic during the positive phase of AO.
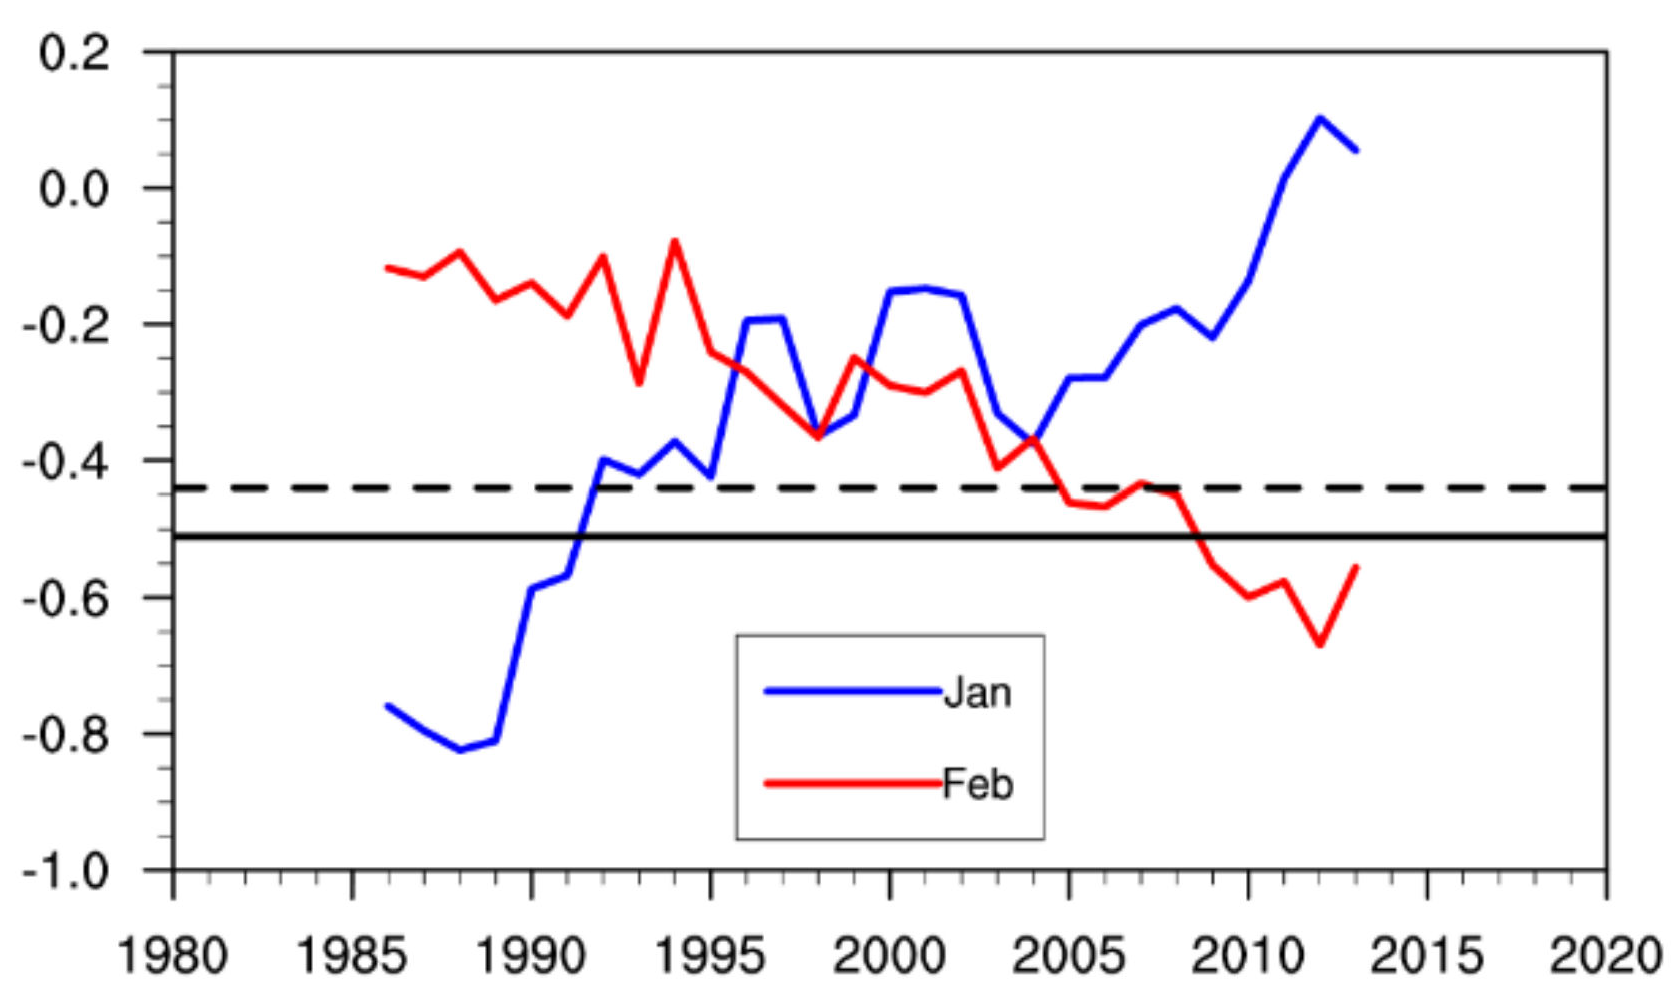
To study the changes of the relationship between the AO and ozone concentration in the lower stratosphere over the Arctic, the 13-year running correlation coefficients between these two metrics in January and February are shown in Figure 4. In January, the 13-year running correlation coefficients between the AO and averaged ozone concentration are significantly negative before the mid-1990s, but they become insignificant afterward. However, in February, the negative coefficients between them are only statistically significant after the mid-2000s. The results in Figure 4 suggest that the relationship between the AO and ozone in the lower stratosphere is unstable and the turning point of the relationship between these two metrics is around 1995 in January and 2007 in February. Therefore, we select two subperiods 1980–1994 (P1) and 2007–2019 (P2) to further examine the relationship between the AO and ozone in the lower stratosphere over the Arctic.
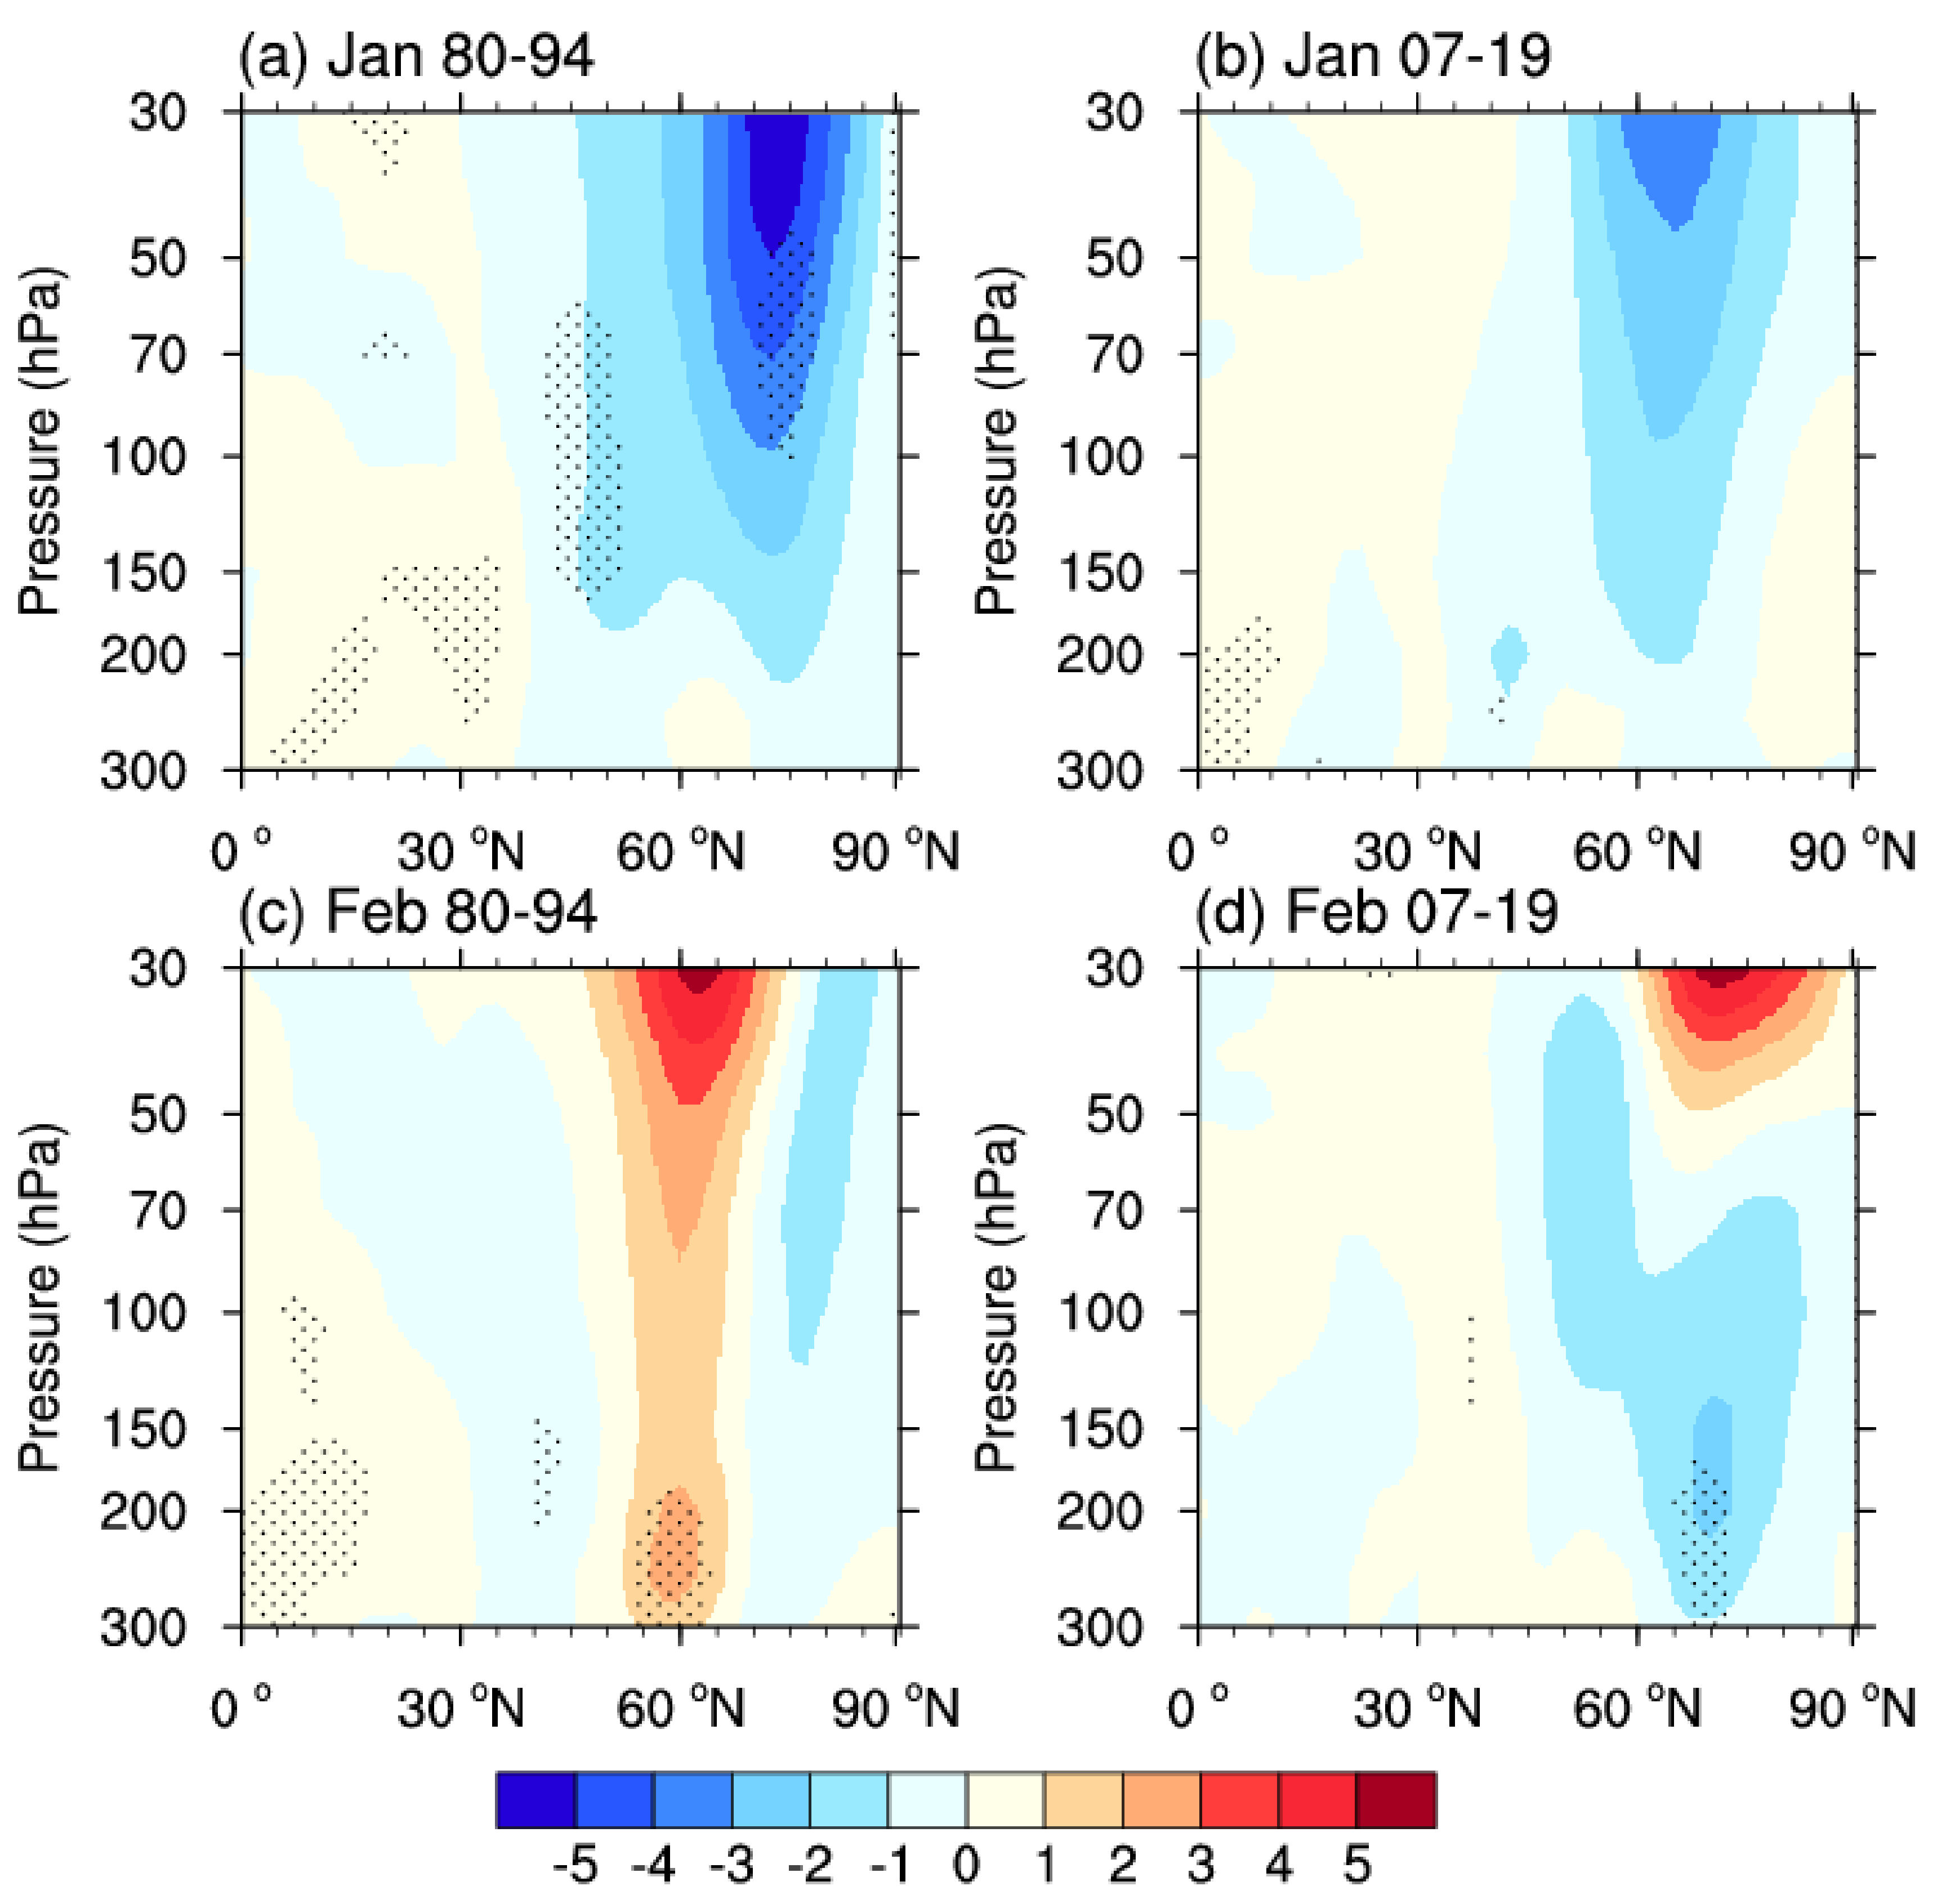
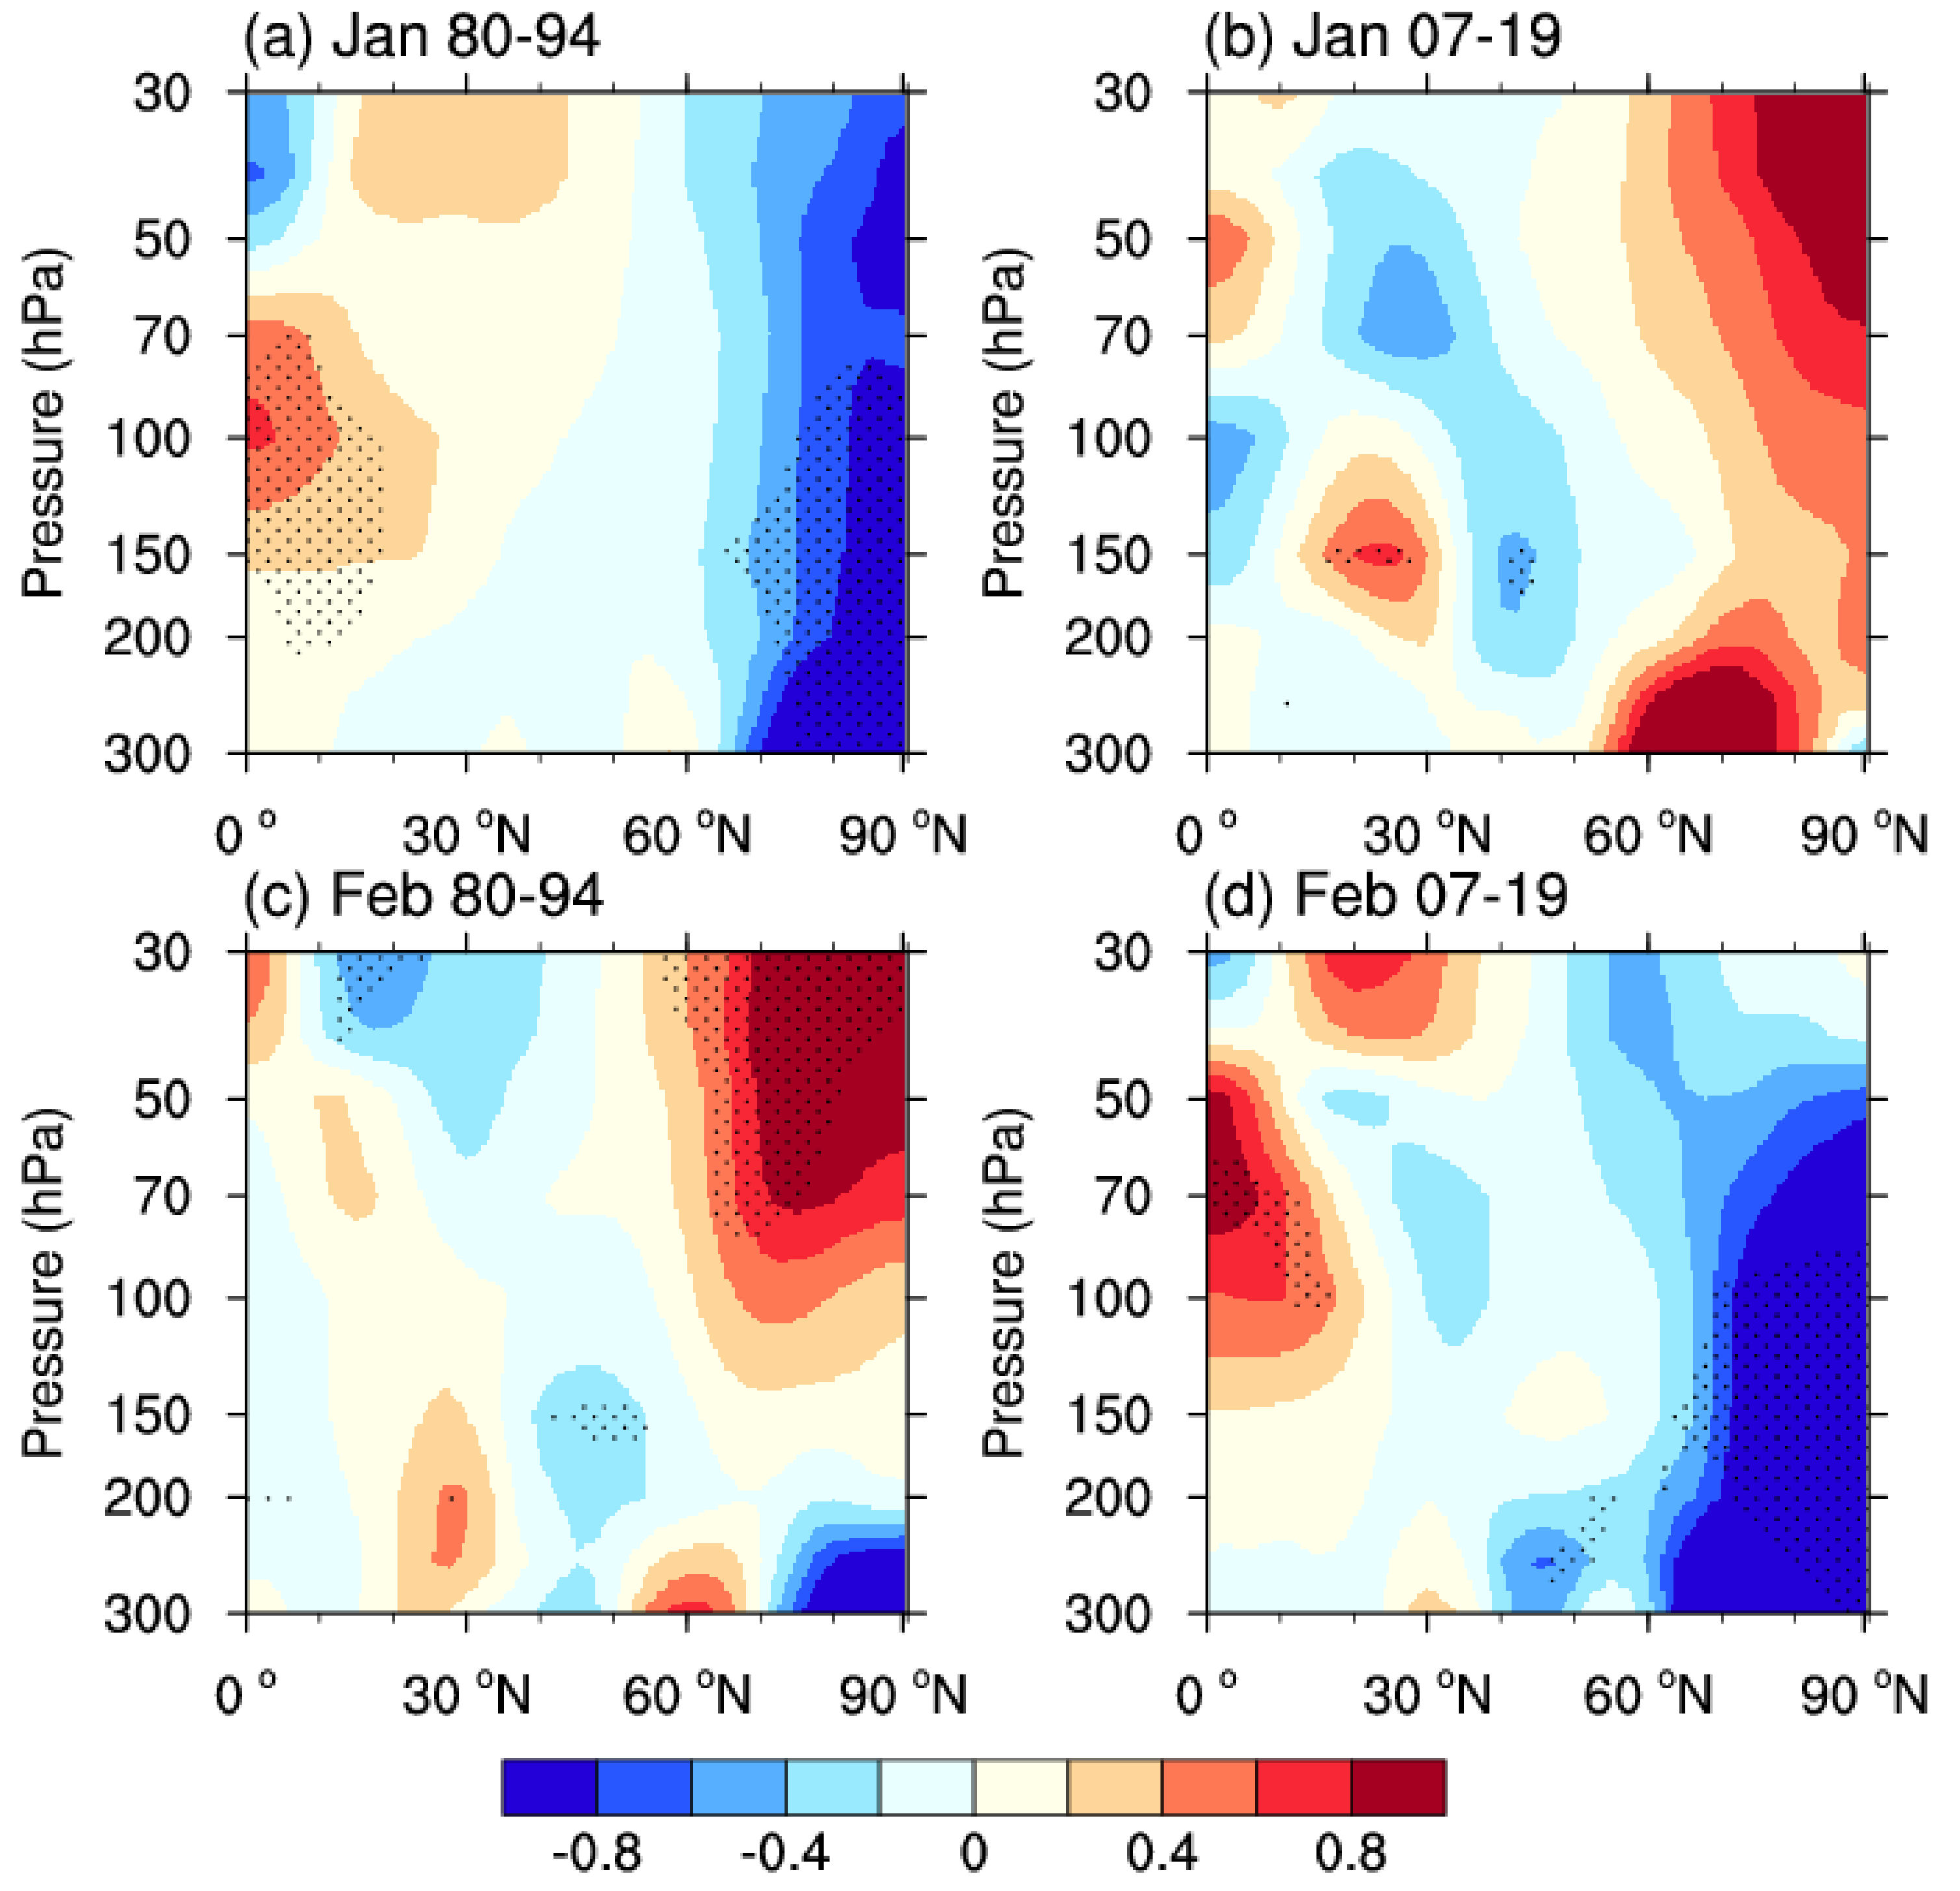
Figure 5 shows the correlation coefficients between the AO index and zonal-mean ozone concentration in January and February during P1 and P2. There are positive ozone anomalies at lower-latitude (100–300 hPa, 10–30 °N) and negative ozone anomalies at mid-latitude (50–300 hPa, 30–60 °N) in the lower stratosphere in each period during the positive phase of AO. However, the patterns in the correlation coefficients between these two metrics over the Arctic in January and February have different features. In January, there are two distinct areas of negative correlation in the mid-stratosphere (~30 hPa, 65–90 °N) and upper troposphere-lower stratosphere (150–300 hPa, 65–90 °N; UTLS) over the Arctic during P1 (Figure 5a). However, there is a center of insignificant positive correlation coefficients between the AO and zonal-mean ozone in lower stratosphere over the Arctic during P2 (Figure 5b). In contrast, the correlation coefficient distributions in February during P2 are similar as that in January during P1 (Figure 5d). The pattern of correlation coefficients between the AO and zonal-mean ozone in the lower stratosphere in January during P1 and February during P2 are similar as that of winter-mean in Zhang et al. [17]. During P1 in February, two centers of insignificant negative correlation in the mid-stratosphere and UTLS and a center of insignificant positive correlation around 60 °N are found (Figure 5c). The results in Figure 2, Figure 3, Figure 4 and Figure 5 suggest that the relationship between the AO and zonal-mean ozone concentration in the lower stratosphere over the Arctic is unstable during 1980–2019 and exhibits subseasonal variation.

4. Underlying Mechanisms

4.1. Changes in the Spatial Pattern of AO

The unstable relationship between the AO and ozone concentration in the lower stratosphere over the Arctic may be associated with changes in the spatial pattern of AO during P1 and P2. Figure 6 displays the regression maps of the SLP upon the AO index. During P1 in January, a typical positive AO signature is observed with robust SLP anomalies in the Arctic, North Pacific, and North Atlantic (Figure 6a). In contrast, the anomalies of SLP are negative over the Arctic and positive in the North Atlantic, which resembles the positive NAO pattern in January during P2 (Figure 6b). The SLP anomalies in the North Pacific are insignificant in January during P2. Similar to Figure 6a,b, the Pacific center of AO is observed in P1 and disappears in P2 in February (Figure 6c,d). Therefore, no matter in January or February, the AO events exhibit the classical spatial pattern during P1 and display NAO-like pattern during P2. We also investigate the pattern of the AO during 1980–1995 (P1) and 2008–2019 (P2), 1980–1993 (P1) and 2006–2019 (P2), respectively (figures not shown). The results during these periods are similar as that in Figure 6. Therefore, the changes of AO pattern do not depend on the period that we select. We could conclude that the unstable relationship between the AO and ozone in the lower stratosphere in January and February is not related to the spatial pattern of AO.

4.2. Anomalies in Wave Propagation

Because both the AO and ozone in the stratosphere are closely related to the wave propagation between the troposphere and stratosphere [37,38,39], Figure 7 displays the regression of eddy heat flux upon the AO index in January and February during P1 and P2. There are negative anomalies of eddy heat flux in the lower stratosphere over the Arctic in every period during positive phase of AO. However, the negative anomalies of eddy heat flux over the Arctic are only statistically significant in January during P1 and February during P2 (Figure 7a,d), which implies that the planetary wave significantly weakens in January during P1 and February during P2. The out-of-phase relationship between the AO and ozone in the lower stratosphere is only significant in January during P1 and February during P2. This indicates that the planetary wave may play a key role in the unstable relationship between the AO and ozone in the lower stratosphere over the Arctic in January and February.
The planetary wave activities in the stratosphere can be controlled by the wave propagation conditions in the upper troposphere and lower stratosphere [40,41]. Chen and Robinson [42] found that the negative anomalies of buoyancy frequency could results in less planetary wave propagating into the stratosphere. The zonal mean buoyancy frequency exhibits a pronounced seasonal cycle, and the buoyancy frequency reached its peak in January [43]. To understand the different responses of eddy heat flux to the AO during different periods, Figure 8 shows the regression of the buoyancy frequency upon the AO index in January and February during P1 and P2. It is apparent that the buoyancy frequency over the Arctic under the positive AO phase conditions in January significantly decreases during P1 and insignificantly increases during P2 (Figure 8a,b). This implies that there are less planetary waves propagating into the stratosphere in January during P1, consistent with the decreases in the eddy heat flux (Figure 7a). However, the pattern of buoyancy frequency anomalies related to the AO in February is different from that in January. In Figure 8c,d, the regressed buoyancy frequency increases during P1 and decreases during P2 over the Arctic. Therefore, the planetary wave is less likely to be propagated into the stratosphere when AO is in the positive phase in February during P2, which is consistent with the decreased upward planetary wave (Figure 7d). Therefore, different responses of the planetary wave propagation to the AO are mainly related to the buoyancy frequency in the lower stratosphere over the Arctic.

4.3. Anomalies in Stratospheric Circulation

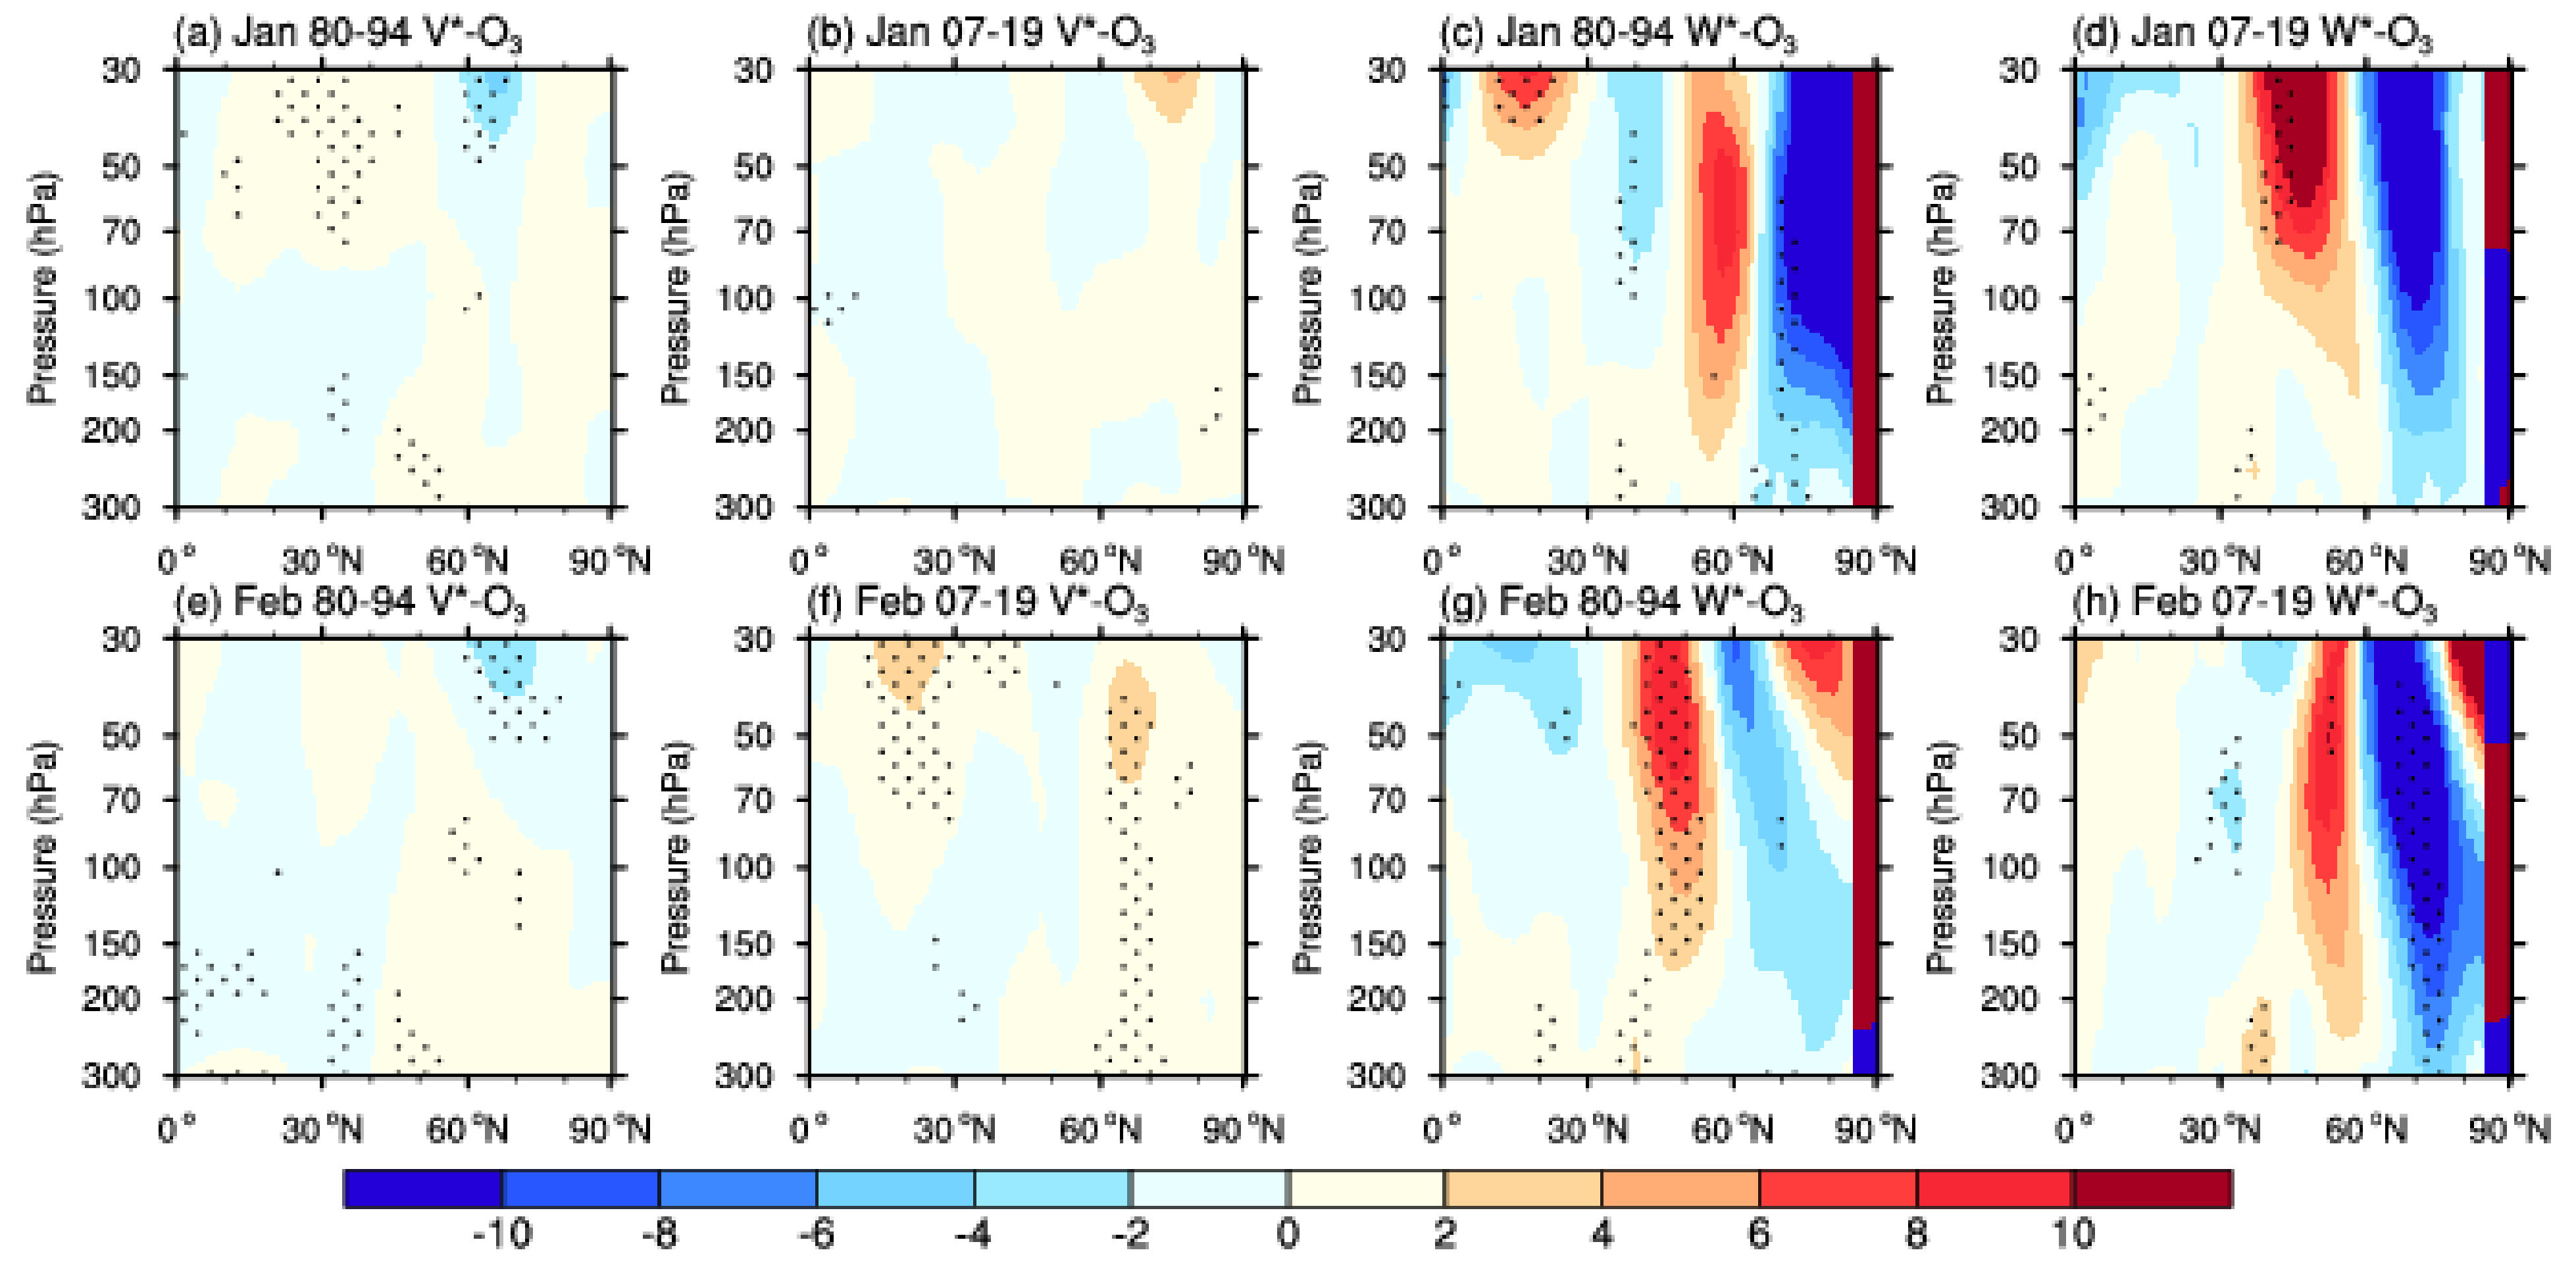
The anomalies of the planetary wave in the lower stratosphere are associated with the changes of BDC [41,44]. Figure 9 displays the regression map of v * and w * of the BDC upon the AO index in January and February during P1 and P2. There are negative anomalies of v * and positive anomalies of w * related to the positive phase of AO in the lower stratosphere, which are out-of-phase with their climatologies over the Arctic in January and February during P1 and P2. However, the anomalies of w * over the Arctic are only significant in January during P1 and in February during P2, indicating that the downwelling of the BDC only significantly weakens in January during P1 and in February during P2 during the positive phase of AO (Figure 9a,c,f,h). The anomalies of BDC are consistent with the anomalies of eddy heat flux in Figure 7.
Figure 10 further displays the changes of ozone caused by v * and w * of BDC related to the AO using the method in Equation (1). When the AO phase is positive, anomalies in the v * of BDC result in the increase of ozone over the Arctic via the reduced transportation from the ozone-poor Arctic to the ozone-rich mid-latitude regions (Figure 10a,b,e,f). Accordingly, there are negative ozone anomalies related to weakened w * of BDC over the Arctic in January during P1 and in February during P2 (Figure 10c,h), which may be associated with the weakened vertical transport from the ozone-rich region in the mid-stratosphere to the ozone-poor region in the lower stratosphere during the positive phase of AO (Figure 10c,d,g,h). It is apparent that w * of BDC plays a more important role in changing ozone concentration in the lower stratosphere than v * of BDC. The distribution of ozone anomalies caused by w * is consistent with the correlation coefficient pattern in Figure 5, which suggests that the BDC is closely related to the out-of-phase relationship between the AO and ozone in the lower stratosphere.
The temperature anomalies related to the changes of planetary wave could also alter the ozone concentration in the lower stratosphere, which is an important condition for the chemical processes related to the depletion of ozone [41,44]. Figure 11 shows the regressed temperature anomalies on the AO index in January and February during P1 and P2. In January, there are significant negative temperature anomalies during P1 and insignificant positive temperature anomalies during P2 in the lower stratosphere over the Arctic (Figure 11a,b). However, in February, the cooling anomalies in the temperature of the lower stratosphere over the Arctic are significant during P2 and insignificant during P1 (Figure 11c,d). The anomalies of temperature are consistent with the ozone anomalies in Figure 5. The significant negative temperature anomalies in Figure 11a,d also indicate a strengthened Arctic vortex anomaly in the lower stratosphere in January during P1 and in February during P2, which may result in the reduction of ozone via heterogeneous reactions and blocking the mixing between the ozone-rich atmosphere at mid-latitudes and the poor-ozone atmosphere in the polar region. These results suggest that both BDC and temperature play an important role in modulating the ozone concentration in the lower stratosphere over the Arctic.

5. Discussion and Conclusions

We study the unstable relationship between the AO and the ozone in the lower stratosphere in January and February throughout 1980–2019 using MERRA-2 dataset. It is found that there are three distinct area of significant negative ozone anomalies in the mid-latitude and UTLS over the Arctic during the positive phase of AO in January during P1 and February during P2. However, the ozone anomalies in the lower stratosphere over the Arctic are insignificant in January during P2 and February during P1. This means that the linkage of the AO with stratospheric ozone could change throughout 1980–2019 and the evolution of this relationship is different in January and February.
We further investigate the underlying dynamical mechanisms of the variable ozone anomalies associated with the AO in January and February, respectively. We found that the changes in spatial structure of AO do not the main reason for the unstable relationship between the AO and ozone in the lower stratosphere over the Arctic in January and February. However, the anomalies of planetary wave related to the positive phase of AO significantly decrease in January during P1 and February during P2, which is consistent with changes in linkage of AO with ozone. During the positive phase of AO, the negative anomalies of planetary wave may be caused by the significant negative anomalies of buoyancy frequency in the corresponding periods. The anomalies of planetary wave further weaken the BDC and decrease the temperature, which further results in negative anomalies of ozone concentration in the lower stratosphere over the Arctic in January during P1 and February during P2 under the condition of positive AO phase.
Some studies investigated the relationship between the AO and the variability of climate in the troposphere in the Northern Hemisphere on interdecadal timescales [17,45,46]. For example, Chen et al. [45] reported that the relationship of AO and East Asian Winter Monsoon is only significant during 1871–1897, 1923–1948 and 1979–2003. Subsequently, Liu et al. [18] found that the relationship between the AO and East Asian jet stream is only significant during 1925–1945 and 1985–2005. Park et al. [46] showed that the relationship between the AO and winter temperature in East Asia is unstable during 1958–2014. These previous studies mainly focused on the links between the AO and tropospheric climate anomalies. A recent study showed the close relationship between the AO and the zonal mean ozone in the lower stratosphere in December-January-February [17], and they investigated the influence of the dynamic transport process and chemical process related to the AO in the lower stratosphere to the distribution of ozone anomalies. In this paper, we further suggested the different interdecadal relationship between the AO and ozone in the lower stratosphere over the Arctic in January and February. These results may have implications for detailed ozone prediction over the Arctic in January and February in the future, respectively. It should be pointed out that we only examine the linkage of the AO and zonal mean ozone concentration in the lower stratosphere. Zhang et al. [47] found that the rate of regional ozone recovery in the Northern Hemisphere is asymmetric. It would be interesting to examine the horizontal structure of the relationship between the AO and ozone in the lower stratosphere in the future. Due to the fact that the ozone dataset only covers 40 years, we do not examine the evolution of the relationship between the AO and ozone in the lower stratosphere over the Arctic in a longer time; it is also necessary to examine this question using the outputs from numerical model in the future.

Author Contributions

Conceptualization, M.L. and D.H.; methodology, M.L.; software, M.L.; validation, M.L. and D.H.; formal analysis, M.L. and D.H.; investigation, M.L. and D.H.; resources, M.L.; data curation, M.L.; writing—original draft preparation, M.L.; writing—review and editing, M.L. and D.H.; visualization, M.L.; supervision, D.H.; project administration, D.H.; funding acquisition, D.H. All authors have read and agreed to the published version of the manuscript.

Funding

This research received no external funding.

Data Availability Statement

Publicly available datasets were analyzed in this study. This data can be found here: The MERRA-2 reanalysis datasets were available online from https://disc.gsfc.nasa.gov/datasets?keywords=MERRA-2. The ERA-Interim reanalysis datasets were available online from https://apps.ecmwf.int/datasets/data/interim-full-moda/levtype=pl/. The ozone datasets from MLS are available at https://disc.gsfc.nasa.gov/datasets/ML2O3_V004/summary?keywords=MLS. The ozone datasets from SBUV is download from https://disc.sci.gsfc.nasa.gov/datasets?keywords=SBUV&page=1. The AO and ONI index are obtained online from https://psl.noaa.gov/data/climateindices/list/.

Acknowledgments

We are grateful to the groups and agencies for providing the datasets used in this study. This work was supported by the National Natural Science Foundation of China (41805031).

Conflicts of Interest

The authors declare no conflict of interest.

References

  1. Thompson, D.W.J.; Wallace, J.M. The Arctic oscillation signature in the wintertime geopotential height and temperature fields. Geophys. Res. Lett. 1998, 25, 1297–1300. [Google Scholar] [CrossRef] [Green Version]
  2. Thompson, D.W.J.; Wallace, J.M.; Hegerl, G.C. Annular Modes in the Extratropical Circulation. Part II Trends. J. Clim. 2000, 13, 1018–1036. [Google Scholar] [CrossRef]
  3. Thompson, D.W.J.; Wallace, J.M. Annular Modes in the Extratropical Circulation. Part I: Month-to-Month Variability. J. Clim. 2000, 13, 1000–1016. [Google Scholar] [CrossRef]
  4. Thompson, D.W.J.; Li, Y. Baroclinic and Barotropic Annular Variability in the Northern Hemisphere. J. Atmos. Sci. 2015, 72, 1117–1136. [Google Scholar] [CrossRef] [Green Version]
  5. Hassanzadeh, P.; Kuang, Z. Blocking variability: Arctic Amplification versus Arctic Oscillation. Geophys. Res. Lett. 2015, 42, 8586–8595. [Google Scholar] [CrossRef] [Green Version]
  6. Ambaum, M.H.P.; Hoskins, B.J.; Stephenson, D.B. Arctic oscillation or North Atlantic oscillation. J. Clim. 2001, 14, 3495–3507. [Google Scholar] [CrossRef] [Green Version]
  7. Hu, D.; Guo, Y.-P.; Tan, Z.-M.; Guan, Z. Interannual Relationship between the Boreal Spring Arctic Oscillation and the Northern Hemisphere Hadley Circulation Extent. J. Clim. 2019, 32, 4395–4408. [Google Scholar] [CrossRef]
  8. Gong, H.; Wang, L.; Chen, W.; Wu, R.; Zhou, W.; Liu, L.; Nath, D.; Lan, X. Diversity of the Wintertime Arctic Oscillation Pattern among CMIP5 Models: Role of the Stratospheric Polar Vortex. J. Clim. 2019, 32, 5235–5250. [Google Scholar] [CrossRef]
  9. Baldwin, M.P.; Dunkerton, T.J. Stratospheric Harbingers of Anomalous Weather Regimes. Science 2001, 294, 581–584. [Google Scholar] [CrossRef]
  10. Xie, F.; Li, J.; Zhang, J.; Tian, W.; Hu, Y.; Zhao, S.; Sun, C.; Ding, R.; Feng, J.; Yang, Y. Variations in North Pacific Sea Surface Temperature Caused by Arctic Stratospheric Ozone Anomalies. Environ. Res. Lett. 2017, 12, 114023. [Google Scholar] [CrossRef] [Green Version]
  11. Xie, F.; Li, J.; Tian, W.; Fu, Q.; Jin, F.F.; Hu, Y.; Zhang, J.; Wang, W.; Sun, C.; Feng, J.; et al. A connection from Arctic stratospheric ozone to El Niño-Southern oscillation. Environ. Res. Lett. 2016, 11, 124026. [Google Scholar] [CrossRef] [Green Version]
  12. Zhang, J.; Tian, W.; Xie, F.; Sang, W.; Guo, D.; Chipperfield, M.; Feng, W.; Hu, D. Zonally asymmetric trends of winter total column ozone in the northern middle latitudes. Clim. Dynam. 2018, 52, 4483–4500. [Google Scholar] [CrossRef] [Green Version]
  13. World Meteorological Organization (WMO). Scientific Assessment of Ozone Depletion: 2014, Global Ozone Research and Monitoring World Meteorological Organization (WMO); Project—Report No. 55; World Meteorological Organization (WMO): Geneva, Switzerland, 2014; p. 416. [Google Scholar]
  14. Douglass, A.R.; Rood, R.B.; Stolarski, R.S. Interpretation of ozone temperature correlations: 2. Analysis of SBUV ozone data. J. Geophys. Res. Atmos. 1985, 90, 10693–10708. [Google Scholar] [CrossRef]
  15. Rood, R.B.; Douglass, A.R. Interpretation of ozone temperature correlations: 1. Theory. J. Geophys. Res. 1985, 90, 5733. [Google Scholar] [CrossRef]
  16. Hartmann, D.L. Some aspects of the coupling between radiation, chemistry, and dynamics in the stratosphere. J. Geophys. Res. 1981, 86, 9631. [Google Scholar] [CrossRef]
  17. Zhang, J.; Xie, F.; Tian, W.; Han, Y.; Zhang, K.; Qi, Y.; Chipperfield, M.; Feng, W.; Huang, J.; Shu, J. Influence of the Arctic Oscillation on the Vertical Distribution of Wintertime Ozone in the Stratosphere and Upper Troposphere over the Northern Hemisphere. J. Clim. 2017, 30, 2905–2919. [Google Scholar] [CrossRef]
  18. Liu, Y.; He, S.; Li, F.; Wang, H.; Zhu, Y. Unstable relationship between the Arctic Oscillation and East Asian jet stream in winter and possible mechanisms. Theor. Appl. Climatol. 2019, 135, 13–27. [Google Scholar] [CrossRef]
  19. Li, F.; Wang, H.; Gao, Y. On the Strengthened Relationship between the East Asian Winter Monsoon and Arctic Oscillation: A Comparison of 1950–1970 and 1983–2012. J. Clim. 2014, 27, 5075–5091. [Google Scholar] [CrossRef]
  20. Hu, D.; Tian, W.; Xie, F.; Shu, J.; Dhomse, S. Effects of Meridional Sea Surface Temperature Changes on Stratospheric Temperature and Circulation. Adv. Atmos. Sci. 2014, 31, 888–900. [Google Scholar] [CrossRef]
  21. Liu, M.; Hu, D.; Zhang, F. Connections between Stratospheric Ozone Concentrations Over the Arctic and Sea Surface Temperatures in the North Pacific. J. Geophys. Res. Atmos. 2020, 125, D031690. [Google Scholar] [CrossRef]
  22. Young, P.J.; Rosenlof, K.H.; Solomon, S.; Sherwood, S.C.; Fu, Q.; Lamarque, J. Changes in Stratospheric Temperatures and Their Implications for Changes in the Brewer–Dobson Circulation, 1979–2005. J. Clim. 2012, 25, 1759–1772. [Google Scholar] [CrossRef] [Green Version]
  23. Efstathiou, M.N.; Varotsos, C.A.; Singh, R.P.; Cracknell, A.P.; Tzanis, C. On the longitude dependence of total ozone trends over middle-latitudes. Int. J. Remote Sens. 2003, 24, 1361–1367. [Google Scholar] [CrossRef]
  24. Hu, Y.; Tung, K.K.; Liu, J. A Closer Comparison of Early and Late-Winter Atmospheric Trends in the Northern Hemisphere. J. Clim. 2005, 18, 3204–3216. [Google Scholar] [CrossRef] [Green Version]
  25. Zhou, S.; Miller, A.J.; Wang, J.; Angell, J.K. Trends of NAO and AO and their associations with stratospheric processes. Geophys. Res. Lett. 2001, 28, 4107–4110. [Google Scholar] [CrossRef]
  26. Rienecker, M.M.; Suarez, M.J.; Gelaro, R.; Todling, R.; Bacmeister, J.; Liu, E.; Bosilovich, M.G.; Schubert, S.D.; Takacs, L.; Kim, G.; et al. MERRA: NASA’s Modern-Era Retrospective Analysis for Research and Applications. J. Clim. 2011, 24, 3624–3648. [Google Scholar] [CrossRef]
  27. Raj, S.T.A.; Ratnam, M.V.; Rao, D.N.; Murthy, B.V.K. Vertical distribution of ozone over a tropical station: Seasonal variation and comparison with satellite (MLS, SABER) and ERA-Interim products. Atmos. Environ. 2015, 116, 281–292. [Google Scholar]
  28. Bhartia, P.K.; McPeters, R.D.; Flynn, L.E.; Taylor, S.; Kramrova, N.A.; Frith, S.; Fisher, B.; de Land, M. Solar Backscatter UV (SBUV) total ozone and profile algorithm. Atmos. Meas. Tech. Discuss. 2012, 5, 5913–5951. [Google Scholar] [CrossRef]
  29. Livesey, N.J.; Read, W.G.; Froidevaux, L.; Lambert, A.; Manney, G.L.; Pumphrey, H.C.; Santee, M.L.; Schwartz, M.J.; Wang, S.; Cofield, R.E. Version 3.3 Level 2 Data Quality and Description Document. JPL D-33509; Jet Propul. Lab.: Pasadena, CA, USA, 2011. [Google Scholar]
  30. Gelaro, R.; Mccarty, W.; Suarez, M.J.; Todling, R.; Molod, A.; Takacs, L.L.; Randles, C.A.; Darmenov, A.; Bosilovich, M.G.; Reichle, R.H. The Modern-Era Retrospective Analysis for Research and Applications, Version 2 (MERRA-2). J. Clim. 2017, 30, 5419–5454. [Google Scholar] [CrossRef]
  31. Kaihatu, J.M.; Handler, R.A.; Marmorino, G.O.; Shay, L.K. Empirical Orthogonal Function Analysis of Ocean Surface Currents Using Complex and Real-Vector Methods. J. Atmos. Ocean. Tech. 1998, 15, 927–941. [Google Scholar] [CrossRef] [Green Version]
  32. North, G.R.; Bell, T.L.; Cahalan, R.F.; Moeng, F.J. Sampling Errors in the Estimation of Empirical Orthogonal Functions. Mon. Weather Rev. 1982, 110, 699. [Google Scholar] [CrossRef]
  33. Monier, E.; Weare, B.C. Climatology and trends in the forcing of the stratospheric ozone transport. Atmos. Chem. Phys. 2011, 11, 6311–6323. [Google Scholar] [CrossRef] [Green Version]
  34. Andrews, D.G.; Holton, J.R.; Leovy, C.B. Middle Atmosphere Dynamics; Academic Press: Cambridge, MA, USA, 1987. [Google Scholar]
  35. Li, F.; Wang, H.; Liu, J. The strengthening relationship between Arctic Oscillation and ENSO after the mid-1990s. Int. J. Clim. 2014, 34, 2515–2521. [Google Scholar] [CrossRef]
  36. Oman, L.D.; Douglass, A.R.; Ziemke, J.R.; Rodriguez, J.M.; Waugh, D.W.; Nielsen, J.E. The ozone response to ENSO in Aura satellite measurements and a chemistry-climate simulation. J. Geophys. Res. Atmos. 2013, 118, 965–976. [Google Scholar] [CrossRef] [Green Version]
  37. Tegtmeier, S.; Rex, M.; Wohltmann, I.; Krüger, K. Relative importance of dynamical and chemical contributions to Arctic wintertime ozone. Geophys. Res. Lett. 2008, 35, 2008GL034250. [Google Scholar] [CrossRef] [Green Version]
  38. Lubis, S.W.; Silverman, V.; Matthes, K.; Harnik, N.; Omrani, N.; Wahl, S. How does downward planetary wave coupling affect polar stratospheric ozone in the Arctic winter stratosphere? Atmos. Chem. Phys. 2017, 17, 2437–2458. [Google Scholar] [CrossRef] [Green Version]
  39. Cohen, J.; Barlow, M.; Kushner, P.J.; Saito, K. Stratosphere–Troposphere Coupling and Links with Eurasian Land Surface Variability. J. Clim. 2007, 20, 5335–5343. [Google Scholar] [CrossRef]
  40. Hu, D.; Guan, Z. Decadal Relationship between the Stratospheric Arctic Vortex and Pacific Decadal Oscillation. J. Clim. 2018, 31, 3371–3386. [Google Scholar] [CrossRef]
  41. Hu, D.; Tian, W.; Xie, F.; Wang, C.; Zhang, J. Impacts of stratospheric ozone depletion and recovery on wave propagation in the boreal winter stratosphere. J. Geophys. Res. Atmos. 2015, 120, 8299–8317. [Google Scholar] [CrossRef] [Green Version]
  42. Chen, P.; Robinson, W.A. Propagation of planetary waves between the troposphere and stratosphere. J. Atmos. Sci. 1992, 49, 2533–2545. [Google Scholar] [CrossRef] [Green Version]
  43. Raddatz, R.L.; Candlish, L.M.; Asplin, M.G.; Barber, D.G. Static Stability of the Troposphere over the Southeastern Beaufort Sea-Amundsen Gulf Region of the Western Maritime Arctic. Atmos. Ocean. 2016, 54, 22–31. [Google Scholar] [CrossRef]
  44. Hu, D.; Guo, Y.; Wang, F.; Xu, Q.; Li, Y.; Sang, W.; Wang, X.; Liu, M. Brewer–Dobson Circulation: Recent-Past and Near-Future Trends Simulated by Chemistry-Climate Models. Adv. Meteorol. 2017, 2017, 2913895. [Google Scholar] [CrossRef] [Green Version]
  45. Chen, D.; Wang, H.; Sun, J.; Gao, Y. Pacific multi-decadal oscillation modulates the effect of Arctic oscillation and El Niño southern oscillation on the East Asian winter monsoon. Int. J. Climatol. 2018, 38, 2808–2818. [Google Scholar] [CrossRef]
  46. Park, H.; Ahn, J. Combined effect of the Arctic Oscillation and the Western Pacific pattern on East Asia winter temperature. Clim. Dynam. 2016, 46, 3205–3221. [Google Scholar] [CrossRef] [Green Version]
  47. Zhang, J.; Tian, W.; Xie, F.; Chipperfield, M.P.; Feng, W.; Son, S.; Abraham, N.L.; Archibald, A.T.; Bekki, S.; Butchart, N.; et al. Stratospheric ozone loss over the Eurasian continent induced by the polar vortex shift. Nat. Commun. 2018, 9, 206. [Google Scholar] [CrossRef] [PubMed] [Green Version]
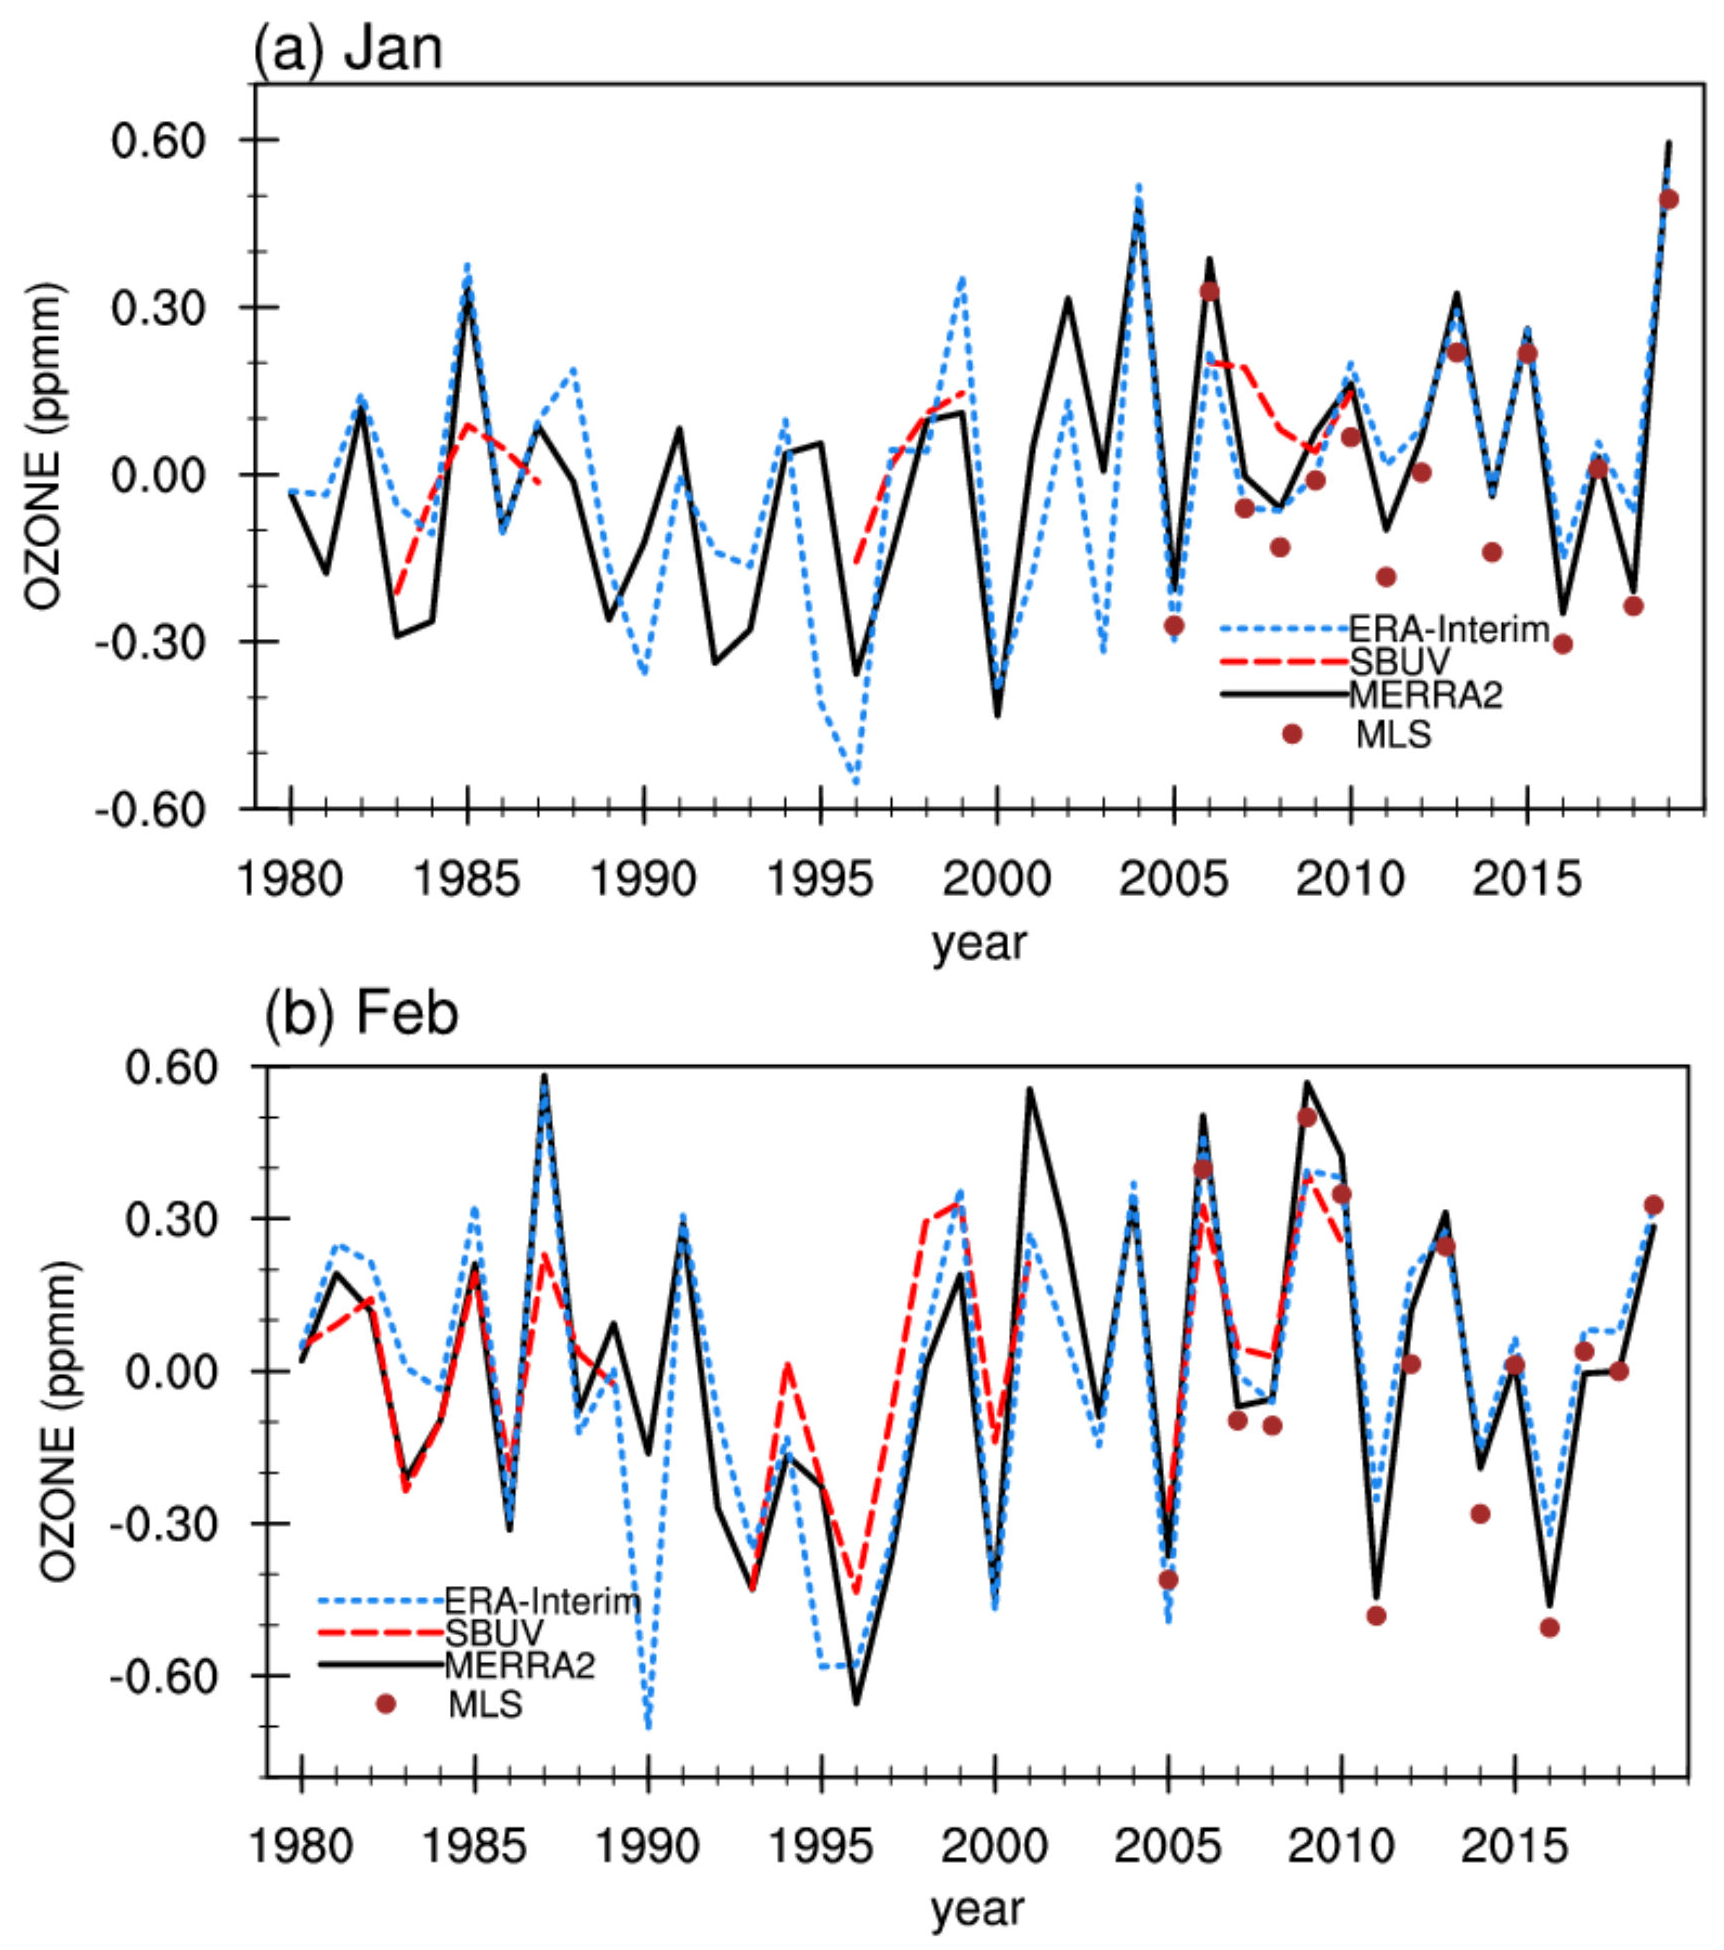
Figure 1. Time series of the anomalies of ozone concentrations (unit: ppmm) in the lower stratosphere over the Arctic (60–90°N; 30–300 hPa) derived from the ERA-Interim (blue), SBUV (red), MERRA-2 (black), and MLS (brown circles) databases in (a) January and (b) February during 1980–2019.
Atmosphere 12 00129 g001
Figure 2. (a,b) Regression maps of the ozone concentration (colored shading; unit: ppmm) averaged from 30 to 300 hPa over 55-90 °N upon the normalized first principal component (PC1) and second principal component (PC2) of ozone concentration averaged from 30 to 300 hPa over 55–90 °N in January during 1980-2019. (c,d) same as (a,b), but for the SLP over 20–90 °N (colored shading; unit: hPa). The values at the top-right corner are the explained variances. The values over the stippled regions are statistically significant at the 95% confidence level.
Atmosphere 12 00129 g002
Figure 3. As in Figure 2, but for the February.
Atmosphere 12 00129 g003
Figure 4. The time evolution of the 13-year running correlation of AO index with the average of ozone concentration in the lower stratosphere over the Arctic in January (blue line) and February (red line) during 1980–2019. The black dashed and solid line denotes the 90% and 95% confidence level based on the two-tailed Student’s t test respectively.
Atmosphere 12 00129 g004
Figure 5. Correlation coefficients between the AO index and zonal mean ozone concentrations from 300 to 10 hPa over the Northern Hemisphere in (a,b) January and (c,d) February during (a,c) 1980–1994 and (b,d) 2007–2019. Values over the stippled regions are statistically significant at the 95% confidence level.
Atmosphere 12 00129 g005
Figure 6. Regression maps of the SLP (shading; units: hPa) on AO index in (a,b) January, and (c,d) February during (a,c) 1980–1994 and (b,d) 2007–2019. The values over the stippled regions are statistically significant at the 95% confidence level.
Atmosphere 12 00129 g006
Figure 7. Anomalies in the eddy heat flux (contours; units: K m s−1) based on the regression of AO index in January during (a) 1980–1994 (b) 2007–2019. (c,d) Same as (a,b), but for the anomalies in February. The values over the stippled regions are statistically significant at the 95% confidence level.
Atmosphere 12 00129 g007
Figure 8. Regression of the buoyancy frequency (s−2) based on the AO index in (a,b) January and (c,d) February during (a,c) 1980–1994 and (b,d) 2007–2019. The values over the stippled regions are statistically significant at the 95% confidence level.
Atmosphere 12 00129 g008
Figure 9. Regression of (a,b) v * (shading: 10−1 m s−1) and (c,d) w * (shading: 10−3 m s−1) on AO index in January during (a,c) 1980–1994 and (b,d) 2007–2019. (eh) Same as (ad), but for the anomalies in February. The line contours represent the climatologies of (a,b,e,f) v * (m s−1) and (c,d,g,h) w * (10−3 m s−1) in corresponding month. The values over the stippled regions are statistically significant at the 95% confidence level.
Atmosphere 12 00129 g009
Figure 10. Regression of ozone anomalies (a,b) v * -produced (ppbm day-1) and (c,d) w * -produced (ppbm day-1) on AO index in January during (a,c) 1980–1994 and (b,d) 2007–2019. (eh) Same as (ad), but for the anomalies in February. The values over the stippled regions are statistically significant at the 95% confidence level.
Atmosphere 12 00129 g010
Figure 11. Regression of the zonal mean temperature (K) based on the AO index in (a,b) January and (c,d) February during (a,c) 1980–1994 and (b,d) 2007–2019. The values over the stippled regions are statistically significant at the 95% confidence level.
Atmosphere 12 00129 g011
Publisher’s Note: MDPI stays neutral with regard to jurisdictional claims in published maps and institutional affiliations.