Article

Correlation between Buoyancy Flux, Dissipation and Potential Vorticity in Rotating Stratified Turbulence

by
Duane Rosenberg
1,*,†,
Annick Pouquet
2,3,† and
Raffaele Marino
4,†
1
288 Harper St., Louisville, CO 80027, USA
2
Laboratory for Atmospheric and Space Physics, University of Colorado, Boulder, CO 80309, USA
3
National Center for Atmospheric Research, P.O. Box 3000, Boulder, CO 80307, USA
4
Laboratoire de Mécanique des Fluides et d’Acoustique, CNRS, École Centrale de Lyon, Université Claude Bernard Lyon 1, INSA de Lyon, F-69134 Écully, France
*
Author to whom correspondence should be addressed.
These authors contributed equally to this work.
Atmosphere 2021, 12(2), 157; https://doi.org/10.3390/atmos12020157
Submission received: 18 November 2020 / Revised: 15 January 2021 / Accepted: 18 January 2021 / Published: 26 January 2021
(This article belongs to the Special Issue Nonlinearities, Turbulence and Chaos in Space and Earth Systems)

Abstract

:
We study in this paper the correlation between the buoyancy flux, the efficiency of energy dissipation and the linear and nonlinear components of potential vorticity, PV, a point-wise invariant of the Boussinesq equations, contrasting the three identified regimes of rotating stratified turbulence, namely wave-dominated, wave–eddy interactions and eddy-dominated. After recalling some of the main novel features of these flows compared to homogeneous isotropic turbulence, we specifically analyze three direct numerical simulations in the absence of forcing and performed on grids of 1024 3 points, one in each of these physical regimes. We focus in particular on the link between the point-wise buoyancy flux and the amount of kinetic energy dissipation and of linear and nonlinear PV. For flows dominated by waves, we find that the highest joint probability is for minimal kinetic energy dissipation (compared to the buoyancy flux), low dissipation efficiency and low nonlinear PV, whereas for flows dominated by nonlinear eddies, the highest correlation between dissipation and buoyancy flux occurs for weak flux and high localized nonlinear PV. We also show that the nonlinear potential vorticity is strongly correlated with high dissipation efficiency in the turbulent regime, corresponding to intermittent events, as observed in the atmosphere and oceans.

1. Introduction

Atmospheric and oceanic flows are complex. The rotation of the Earth together with density stratification at large scale give rise to inertia-gravity waves, and such flows also support turbulent eddies that interact nonlinearly with the waves. The energy input, mostly at large scale, comes from a variety of sources such as solar radiation, surface winds and tides, and this energy has to be dissipated at small scales; but how does it get there? In fact, topography plays an essential role; for example, in the deep ocean, topography has been shown to increase the level of turbulence through breaking of internal waves [1,2,3,4,5]. Moreover, in strongly stratified and inhomogeneous turbulence with low buoyancy Reynolds numbers and in the absence of rotation and forcing, the flow structures consist of localized regions of turbulence, and gravity wave packets travel horizontally from these patches into surrounding quiescent regions, leading to mixing in the flow that is not related only to potential vorticity [6].
Shear instabilities lead to turbulent mixing as well [7,8,9], but it is not clear what happens when shear layers are created self-consistently by the nonlinear dynamics of turbulent flows. The role of an externally imposed shear S has been demonstrated explicitly through the analysis of numerical simulations and observational data [10]; this was done in terms of the shear Richardson number R i S = S 2 / N 2 , with N the Brunt-Väisälä frequency, R i S being a central parameter in classical models of geophysical flows [11,12]. In the presence of rotation, an inverse cascade of energy to the large scales can take place, with the upscale transfer of energy possibly enhanced by shear [13]. The competition between rotation leading to the energy moving to large scales, at a rate ϵ U P and stratification transferring energy to the (small) dissipative scales at a rate ϵ d o w n , has been analyzed recently [14,15]. It can be shown that the ratio of these two flux rates depends on the governing parameters of the problem, namely the Froude and Rossby numbers [15].
Similarly, oceanographic measurements in the vicinity of the Hawaiian ridge indicate the presence of patches of strong dissipation: with N = 10 3 s 1 and u r m s 0.1 ms 1 the rms velocity, the measured kinetic energy dissipation is ϵ V 10 6 W [16]. These data correspond to the dimensional evaluation of dissipation for a length scale of 1 km , which is typical of the tidal excitation due to the bathymetry. With such strong dissipation, the flow recovers isotropy at small scale, at least locally, and indeed the enhanced dissipation is observed on vertical length scales on the order of a kilometer.
In this paper, we examine the link between kinetic energy dissipation, buoyancy flux and the magnitude of both the linear and nonlinear part of potential vorticity (see next section for definitions) through the analysis of joint Probability Distribution Functions (PDFs). We focus on three (fiducial) runs that are characteristic of the three regimes encountered in rotating stratified turbulence (RST), namely regime I dominated by quasi-linear inertia-gravity waves (run rI ), regime II in which there is a competition between these waves and nonlinear eddies due to the advection terms of the hydrodynamics (run rII) and regime III dominated by the nonlinear eddies which can at times be faster than the waves (run rIII). Earlier global studies of these flows within a large parametric study have been presented elsewhere [17,18,19]. The main characteristics of the runs analyzed herein are given in Table 1 in the next section, together with the governing equations and dimensionless parameters. In Section 3 we recall global scaling properties of rotating stratified turbulence, and in Section 4, we analyze joint PDFs of several relevant variables for these three regimes. A discussion and concluding remarks are presented in Section 5.

2. Equations and Numerical Settings

The Boussinesq equations are written below for an incompressible fluid with velocity u = [ u , w ] and temperature fluctuations θ about a mean that is linear in z, in the presence of rotation and gravity but in the absence of forcing:
u t + ω × u + 2 Ω × u = N θ e ^ z P + ν 2 u ,
θ t + u · θ = N w + κ 2 θ ,
· u = 0 ,
with ω = × u the vorticity, P the total pressure, N the Brunt–Väisälä frequency, f = 2 Ω and Ω the imposed rotation frequency; ν and κ are the kinematic viscosity and scalar diffusivity; e ^ z is the unit vector in the vertical direction of the imposed rotation, Ω = Ω z ^ , with gravity, g, in the opposite direction. These equations are written in units such that both u and θ have physical dimensions [ L ] [ T 1 ] per unit mass, whereas the buoyancy b = N θ has, of course, the units of acceleration, [ L ] [ T 2 ] . The periodic domain has length L m a x = 2 π . Wavenumbers thus vary from k m i n = 1 to k m a x = n p / 3 with n p the number of points in all three directions, and using a standard 2/3 de-aliasing method. The boundary conditions are periodic in all three directions. Finally, we take a Prandtl number P r = ν / κ equal to unity (see [21] for an evaluation of the turbulent Prandtl number in a plume, where it is indeed found to be of order unity).
The dimensionless parameters governing the evolution of Rotating Stratified Turbulence (RST) as governed by Equations (1)–(3) are the Reynolds, Froude and Rossby numbers defined as usual as
R e = τ d i s s / τ N L = u r m s L i n t / ν , F r = τ N / τ N L = u r m s / [ L i n t N ] , R o = τ f / τ N L = u r m s / [ L i n t f ] .
They all correspond to ratios of characteristic times, namely the gravity and inertial wave periods τ N = 1 / N , τ f = 1 / f , the nonlinear turn-over time τ N L = L i n t / u r m s and the dissipation time τ d i s s = L i n t 2 / ν . They are all defined and evaluated using large-scale characteristic quantities, with L i n t the integral scale and u r m s the rms velocity. The Froude number can also be seen as the ratio of the typical turbulent velocity to the phase velocity of the gravity waves. Of course, in RST, we actually deal with inertia-gravity waves with a dispersion relation that combines rotation and stratification, and the perpendicular and parallel directions (with respect to the common vertical direction of gravity and the rotation axis). One also defines
R B = R e F r 2 , R I B = ϵ V / [ ν N 2 ] = β R B , β = ϵ V / ϵ D , ϵ D = u r m s 3 / L i n t ,
where, in terms of the strain-rate tensor, s i j = 1 2 ( i v j + j v i ) , ϵ V = 2 ν s i j s i j is the point-wise kinetic energy dissipation rate, and β measures its efficiency against a dimensional evaluation, ϵ D . Finally, the point-wise gradient Richardson number, in the absence of imposed vertical shear, is written as
R i g = N ( N z θ ) / ( z u ) 2 .
The coupling between the velocity and the temperature fields occurs through the buoyancy flux B f defined as
B f = N w θ , B f N = B f B f + ϵ V ;
B f N represents a normalization of the buoyancy flux when compared to kinetic energy dissipation, and both can be defined as well in a point-wise manner.
The invariant of the Boussinesq equations, in the absence of dissipation ( ν = 0 , κ = 0 ), is the total energy E T = E V + E P , with E V = 1 2 | u | 2 the kinetic energy, and E P = 1 2 θ 2 the potential energy. Furthermore, the point-wise potential vorticity defined (neglecting the constant, N f ) as
P V = N ω z + f z θ + ω · θ ,
with ω = × u the vorticity, is also conserved in a Lagrangian sense ( D t P V = 0 with D t = t + u · ).
The code we have used for the simulations is pseudo-spectral and periodic in all three directions. It parallelizes efficiently using a combination of MPI, Open-MP as well as CUDA [22]. It also has a version with non-periodic boundary conditions in the vertical [23]. We take initial conditions that are typical for homogeneous isotropic turbulence (HIT), with zero temperature fluctuations (thus, zero initial potential energy), and velocity modes centered on the large scales, 2 | k 0 | 3 . The total kinetic energy is normalized so that, at t = 0 , u r m s 1 ; isotropy is assumed and the phases are taken randomly. A second set of initial conditions is taken to be in quasi-geostrophic (QG) equilibrium which reflects a balance between pressure gradient, Coriolis and gravity force [18,19]. The QG regime is studied in detail, for example, in [24]; here we rather concentrate on the intermediate regime between the wave-dominated and the nonlinear eddy regimes [20].
The three runs analyzed in this paper are listed in Table 1 with their principal characteristics. They correspond, respectively, to run 5, 32 and 58 of Table 1 in [20] (see also Table I in [18]). All runs are performed for a few turnover times in the absence of external forcing, and grids of 1024 3 points are used. Results from each run presented herein draw mainly from a single snapshot of all fields on the computational domain taken at the peak of dissipation (see [20]). A brief analysis of an additional run is performed here in order to illustrate small-scale behavior of these flows. This stems from a large direct numerical simulation (DNS) on a grid of 4096 3 points in the absence of forcing (see [17] for a rather complete description of the properties of that large run).

3. Scaling Properties of Rotating Stratified Turbulent Flows

How do eddies and waves, at both large and small scales, interact in rotating stratified turbulence? We first recall a few recent results obtained using a large data base of more than 70 runs mainly on grids of 1024 3 points, together with a few other runs at lower resolution, and one data point for a grid of 4096 3 points (run r4k). This set of runs has already been analyzed in [17,18,19,20], and we now summarize some of the major results obtained so far. A table with the main characteristics of all these runs can be found in [18] (see also [17] for an earlier analysis focused on the temporal evolution and on the variation of characteristic time scales of kinetic and potential energy decay with governing parameters). The domain of controlling parameters is large and encompasses values (nearly) adequate for the atmosphere and oceans, except for lower Reynolds numbers as usual for DNS studies.
Turbulence is what couples together the nonlinear eddies and the inertia-gravity waves, leading to a remarkable balance between strong vertical gradients (giving rise to the observed layers in the atmosphere) and strong horizontal eddies or micro-vortices. A striking property of RST is the fact that the effective flow dissipation β (see Equation (5)) scales linearly with the controlling parameter, i.e., the Froude number, measuring how fast gravity waves are, when compared to nonlinear eddies.
This is amply discussed in [18]. The behavior of β with F r delineates three regimes: in regime I, the waves dominate and the dissipation that occurs depends on the Reynolds number. By contrast, in regime III, eddies can be faster than waves, and the flow behaves in ways similar to homogeneous isotropic turbulence, at least at small scales. Note however that there are strong signatures of persistent anisotropy even in that regime, see e.g., [19]. Between regime I and regime III, for an intermediate set of parameters (roughly, 0.01 F r 1 ), the eddies become progressively faster, sharper gradients form allowing for more energy dissipation and a simple phenomenological argument compatible with weak wave turbulence leads to a linear relationship between β and F r in what defines regime II.
We have also shown that there is a narrow interval of parameters in which rotating stratified flows display strong non-Gaussian wings in the vertical velocity w and in the temperature fluctuations, as illustrated in Figure 1 by the kurtosis K W = < w 4 > / < w 2 > 2 of w, as a function of Froude number, F r ; with this definition, a normally distributed vertical velocity will have K W = 3 . The binning is done here in Rossby number, and the colors/symbols are given in the caption. Smaller symbols are for the 1024 3 runs, and larger symbols are for runs with larger viscosity and lower resolution. Finally, the stars indicate quasi-geostrophic initial conditions, in that case all with N / f = 5 ; they are runs (Q12 through Q15, of Table 2 in [18])), with 0.067 F r 0.111 . Thus, there is intermittency of the vertical velocity for rotating stratified flows, as is already the case for non-rotating stratified turbulence, found in the presence of forcing [25,26,27].
The peak observed in Figure 1 occurs for F r 0.07 , a value comparable to that found in [26] in the purely stratified forced case. In the presence of rotation, the effect is particularly notable for the runs (indicated by stars), with initial conditions being in quasi-geostrophic balance. It may be related to the fact that, for these flows, there is no vertical velocity initially; thus, w must be produced by the waves and the nonlinear dynamics occur in abrupt events leading to strong localized dissipation [27]. Note that this intermittency can be modeled in a simple way in the stratified case [25], a result that persists in the presence of rotation as we find here. By contrast, recall that, for HIT, the three components of the velocity are Gaussian [27,28]. Such intense and concentrated dissipative events, much stronger than their surroundings, are observed in the ocean, as in the Hawaiian Ridge or the Puerto-Rico Trench [16,29]. Note that extreme events in the distribution of aerosols in the atmosphere have been observed as well (see for example [30]).
There is of course intermittency also present in the small scales, as measured for example by large skewness and kurtosis of velocity and temperature gradients, with, again, a peak for the same intermediate regime of parameters. This is illustrated in Figure 2 by the normalized PDFs of ω 2 (horizontal component of vorticity, left), and ω · θ (nonlinear component of PV, right) for varying F r (see insets). For small scales, as well as in the large scales represented by velocity, the strongest intermittency with the most developed wings is for intermediate values of the Froude number, with a sufficiently large buoyancy Reynolds number.
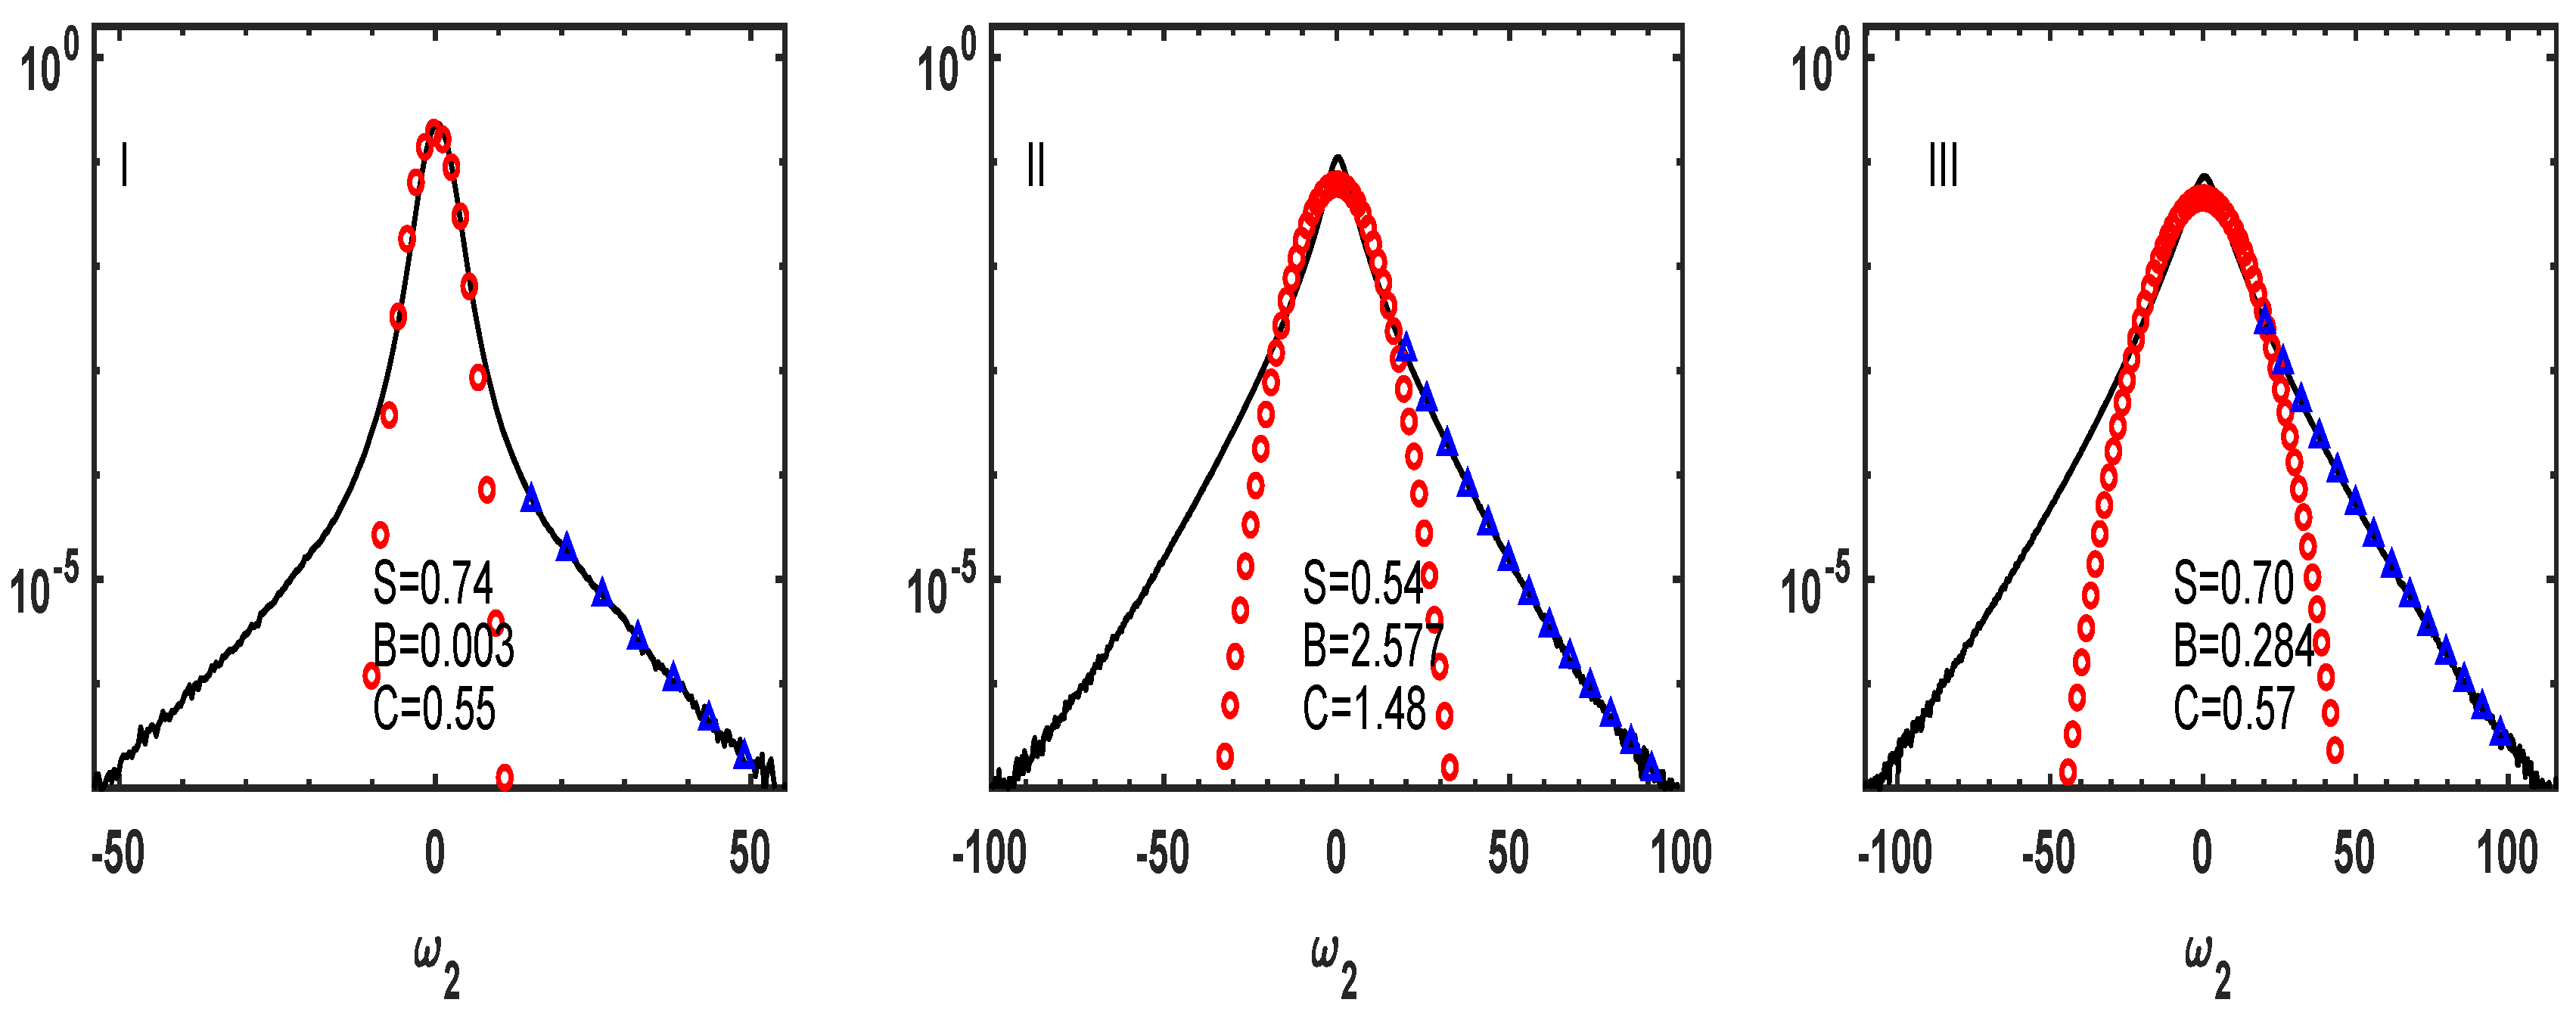
In order to take a closer look at these PDFs, we give them in Figure 3 specifically for the three fiducial runs of Table 1 in terms of the ω 2 (horizontal) component of the vorticity; both Gaussian profiles (red circles; refer to the caption in Figure 3) and exponential fits of the form P ( ω 2 ) = B exp ( C ω 2 S ) are indicated, with blue triangles giving the domain in which the fit is performed. This preliminary analysis indicates a (somewhat) lesser range for ω 2 in regime I, which is mostly dominated by waves. Such stretched-exponential behavior is suggested in many studies as being due to localized turbulence structures, as for shocks occurring in the Burgers equation. We note that the intermediate regime scales differently from the other two, but none of them scales as for the shocks in one-dimensional pressure-less Burgers turbulence, or for models of drift-wave turbulence, for both of which S = 3 / 2 for quadratic nonlinearities and first-order moments [31,32]. Finally, in all cases, we postulate that these exponential wings in the PDFs are directly linked to the presence of strong, vertically sheared structures. Our study differs in several ways from preceding analysie of instantons in various turbulent flows [31,32,33,34,35,36,37]. Namely, it includes stratification and rotation, it includes only decaying flows, and the turbulent domain that appears at scales smaller than the Ozmidov scale (or, in other words, for high buoyancy Reynolds numbers) is not sufficiently resolved (see also Section 5). However, this preliminary analysis does indicate the presence of stretched exponentials, the more detailed analysis of which is left for future work.

4. The Dynamical Behavior of Potential Vorticity

4.1. Global Properties

We now concentrate on properties of potential vorticity, as it relates to other flow diagnostics. PV is an ideal conserved quantity that can be seen, in the framework of Noether’s theorem, as stemming from the symmetry due to the invariance of the Boussinesq equations under the relabeling of Lagrangian particles [38,39]. PV can be decomposed into its linear (L) and nonlinear (NL) parts:
Π L = f z θ N ω z , Π N L = ω · θ , P V = Π L + Π N L .
Note that a time-scale can be associated with P V , namely τ P V = [ P V ] 1 / 2 . We then define the normalized versions of Π L and Π N L as Π 1 and Π 2 :
Π 1 = Π L / ( | Π L | + | Π N L | ) , Π 2 = Π N L / ( | Π L | + | Π N L | ) , | Π 1 | + | Π 2 | = 1
(note that these notations differ from what is used in [40,41]); ω is sometimes called the relative vorticity, f e ^ z the planetary vorticity and ω + f e ^ z the absolute vorticity (see e.g., [42]). PV can actually be measured in the stratosphere [43,44]. It is also shown in [45] that PV conservation plays an important role in the dynamical evolution of stratified turbulence, as for example in tropical cyclones.
Another remark is that the point-wise conservation of PV is not the only strong constraint exerted by the nonlinear dynamics on turbulent flows. There is in fact detailed conservation of total (kinetic + potential) energy for each allowable triadic interaction between (three) Fourier modes. Correspondingly, one can establish a flux conservation in configuration space for each distance | r | in the inertial range, assuming isotropy and homogeneity. This is expressed in terms of exact laws (under several hypotheses) for each point separation | r | entering the argument of velocity correlation functions, such as in the so-called 4/5th law of Kolmogorov [46] for HIT.
Moreover, it was shown using DNS with Taylor–Green initial conditions—corresponding to two counter-rotating vortices—that even though PV is an invariant in stratified flows, it does not undergo a classical cascade ([47]). In particular, its dissipation is not concentrated around the classical dissipative scale (that is, the Kolmogorov scale η = [ ϵ V / ν 3 ] 1 / 4 ) and beyond, but in fact pervades many scales.
Stratified flows are known to support shear layers that go unstable, for example forming Kelvin–Helmoltz (KH) rolls, as observed in the atmosphere, the ocean or in the magnetopause [48,49,50]. We show in Figure 4a thin slice of potential vorticity PV, zooming on a Kelvin–Helmoltz event for the run r4k (see Table 1), at a resolution of 4096 3 points [17]. The zoom encompasses roughly a tenth of the compute box size on the side, and the KH event is barely discernible in terms of PV in the middle top right of the picture (see [17], Figure 10, for the visualization of the vorticity, temperature and gradient Richardson number in the same local view). This is due to the fact that PV emphasizes the small scales, more so than vorticity itself as it combines as well fronts developing in the scalar field. Indeed, PV can reach high values and is typical of small-scale dynamics, involving two derivatives of the basic fields, through the vorticity and the temperature gradient. Also, there are sharp contrasts of signs (purple and red for positive and negative respectively) with an imbrication of structures in this small-scale flow, potentially leading to different types of instabilities.
The relative importance of the different terms in the expression of PV has been measured for the Boussinesq equations [51,52,53]; as expected, the nonlinear part of PV is found by these authors to be negligible when waves are strong enough. On the other hand, when Π N L is large compared to the linear part, one can show that potential vorticity may become important as shear instabilities take place (see, e.g., [53]). PV is conserved point-wise, but its different elements (separating horizontal and vertical components) can undergo huge variations when following a single particle trajectory [53,54].
Using two-point closures of turbulence, which allow for numerical experiments at a high Reynolds number, it was shown in [55] that β (defined in Equation (5)) tends to constant values at high Taylor Reynolds numbers [56], values that may differ for different flows [57], by up to a factor of 5 [58], as in the presence or absence of shear (see also [59,60]). In particular, a relationship is found in [59] between the numerical value of β and the presence or not of stagnation points in the flow. This immediately implies that the efficiency of small-scale dissipation is related to the structure of the large-scale flow that determines its overall topology. In this light, the advantage of the present data base, which is consistent throughout as to the large-scale initial conditions, leaving a clear imprint of the influence of stratification on the dissipation, is also a drawback since the actual values of the dissipation efficiency depend on the overall geometry of the flow set by the large scales.
For example, we already know that, in the presence of a strong shear, dissipation is much more efficient, in particular through the formation of localized fronts and filaments [61]. In fact, one commanding question regarding turbulent flows is whether they are best described through a state of maximal energy dissipation, or of maximum entropy production (see, e.g., [62] and references therein). Rotating stratified flows in general develop sharp gradients with localized dissipative events. For N = 0 , vertical Taylor columns form, but even weak stratification can alter them substantially. Such flows were studied experimentally in [63] using salt for 0 N / f 0.24 with a Rossby number of 9 × 10 3 . The effect of stratification was noticeable with a substantial shortening of the column: already for N / f = 0.07 ( F r 0.13 ), it is reduced by a factor of three. In RST in general, structures are slanted, with an angle depending on the relative value of the stratification and rotation periods, as analyzed in [64] (see also Figure 4). For example, for flows with N / f = L / L (unit Burger number), the layers that form make an angle δ with the horizontal, with tan δ = L / L . Moreover, the layers broaden when rotation increases [65], switching progressively from a vertical buoyancy scale u r m s / N to a vertical QG scale [ f / N ] L i n t . In addition, it can be shown analytically that frontogenesis disappears below a small critical F r , for high rotation or stratification [66], when, on the other hand, strong, anomalous, kinetic and potential energy dissipation takes place in such flows through the formation of intermittent events at small scale.

4.2. Joint Probability Distribution Functions

In order to examine the relationship between dissipation and mixing, we show now joint PDFs of various fields. We define as usual the joint distribution function of two random variables ( u , v ) as the probability of u having value u 0 and v taking simultaneously the value v 0 , that is P J ( u , v ) = P ( u = u 0 , v = v 0 ) . Such joint PDFs are plotted in the next few figures for a variety of variables, with a color bar to the right of each plot indicating the amplitude of the correlation between the two fields, defined as the log of the number of samples in the two-dimensional bin divided by the maximum number in any bin.
In Figure 5, we display the buoyancy flux density w θ against the point-wise Richardson number R i g for the three fiducial runs chosen in this paper; note the change of range for R i g between rI and rII, rIII. For all runs, the highest probability occurs for a zero buoyancy flux, but as the Froude number increases, by roughly a factor 10 between rI and rII, and rII and rIII, the centroid of the joint distribution moves to R i g 0 , with the range of values attained by R i g narrowing: whereas in regime I, the flow is mostly stable, and in regime III the flow is close to instability (be it convective or KH), almost everywhere. One can envision the development of turbulence in these systems as being a spatial propagation of quasi-linear instabilities progressively over the entire flow, leading to secondary instabilities and so forth. In this manner, one could say that the localized turbulent hot-spots at low F r , R I B are increasing in size as F r , R I B increases and that regime III first obtains when the direct surroundings of these different hot-spots become contiguous, and the flow becomes dominated by nonlinear eddies with Kolmogorov spectra and energy dissipation efficiency of the order of that found in HIT.
Figure 6 shows how the efficiency of kinetic energy dissipation β (defined in Equation (5)) varies with point-wise buoyancy flux, in two ways. At the top, β is correlated with the normalized buoyancy flux B f N (see Equation (7)), whereas at the bottom β is given using logarithms in order to display its wide range of values, and it is plotted now against the raw buoyancy flux (divided by N).
Local values of β can be much larger than its average, which should remain close to 1 (from below), by construction. However, note that the dimensional evaluation of dissipation, namely ϵ D , is constructed on the rms value of the overall velocity (and on the overall integral scale). However, in fact, dissipation does occur in highly localized patches of a typical dimension that is smaller than L i n t , and with higher velocities since it is in these patches that the vertical velocity becomes significant (see for example [26] for the purely stratified case). Thus the local dimensional dissipation may be larger, leading to higher local β s. The way higher probabilities populate the space from rI to rII is also significant: it indicates that in the wave regime, most data points in the flow have barely any dissipation, whereas in the regime dominated by turbulent eddies, the highest correlation is for significant efficiency for all values of B f N , but with more at small B f , and with a significant growth of dissipation efficiency for low buoyancy fluxes. In that regard, run rII is clearly transitional. Finally, we note in the bottom plot that the centroid of the distribution moves upward, to higher local (and global) values of the dissipation as the turbulence strengthens from rI to rIII.
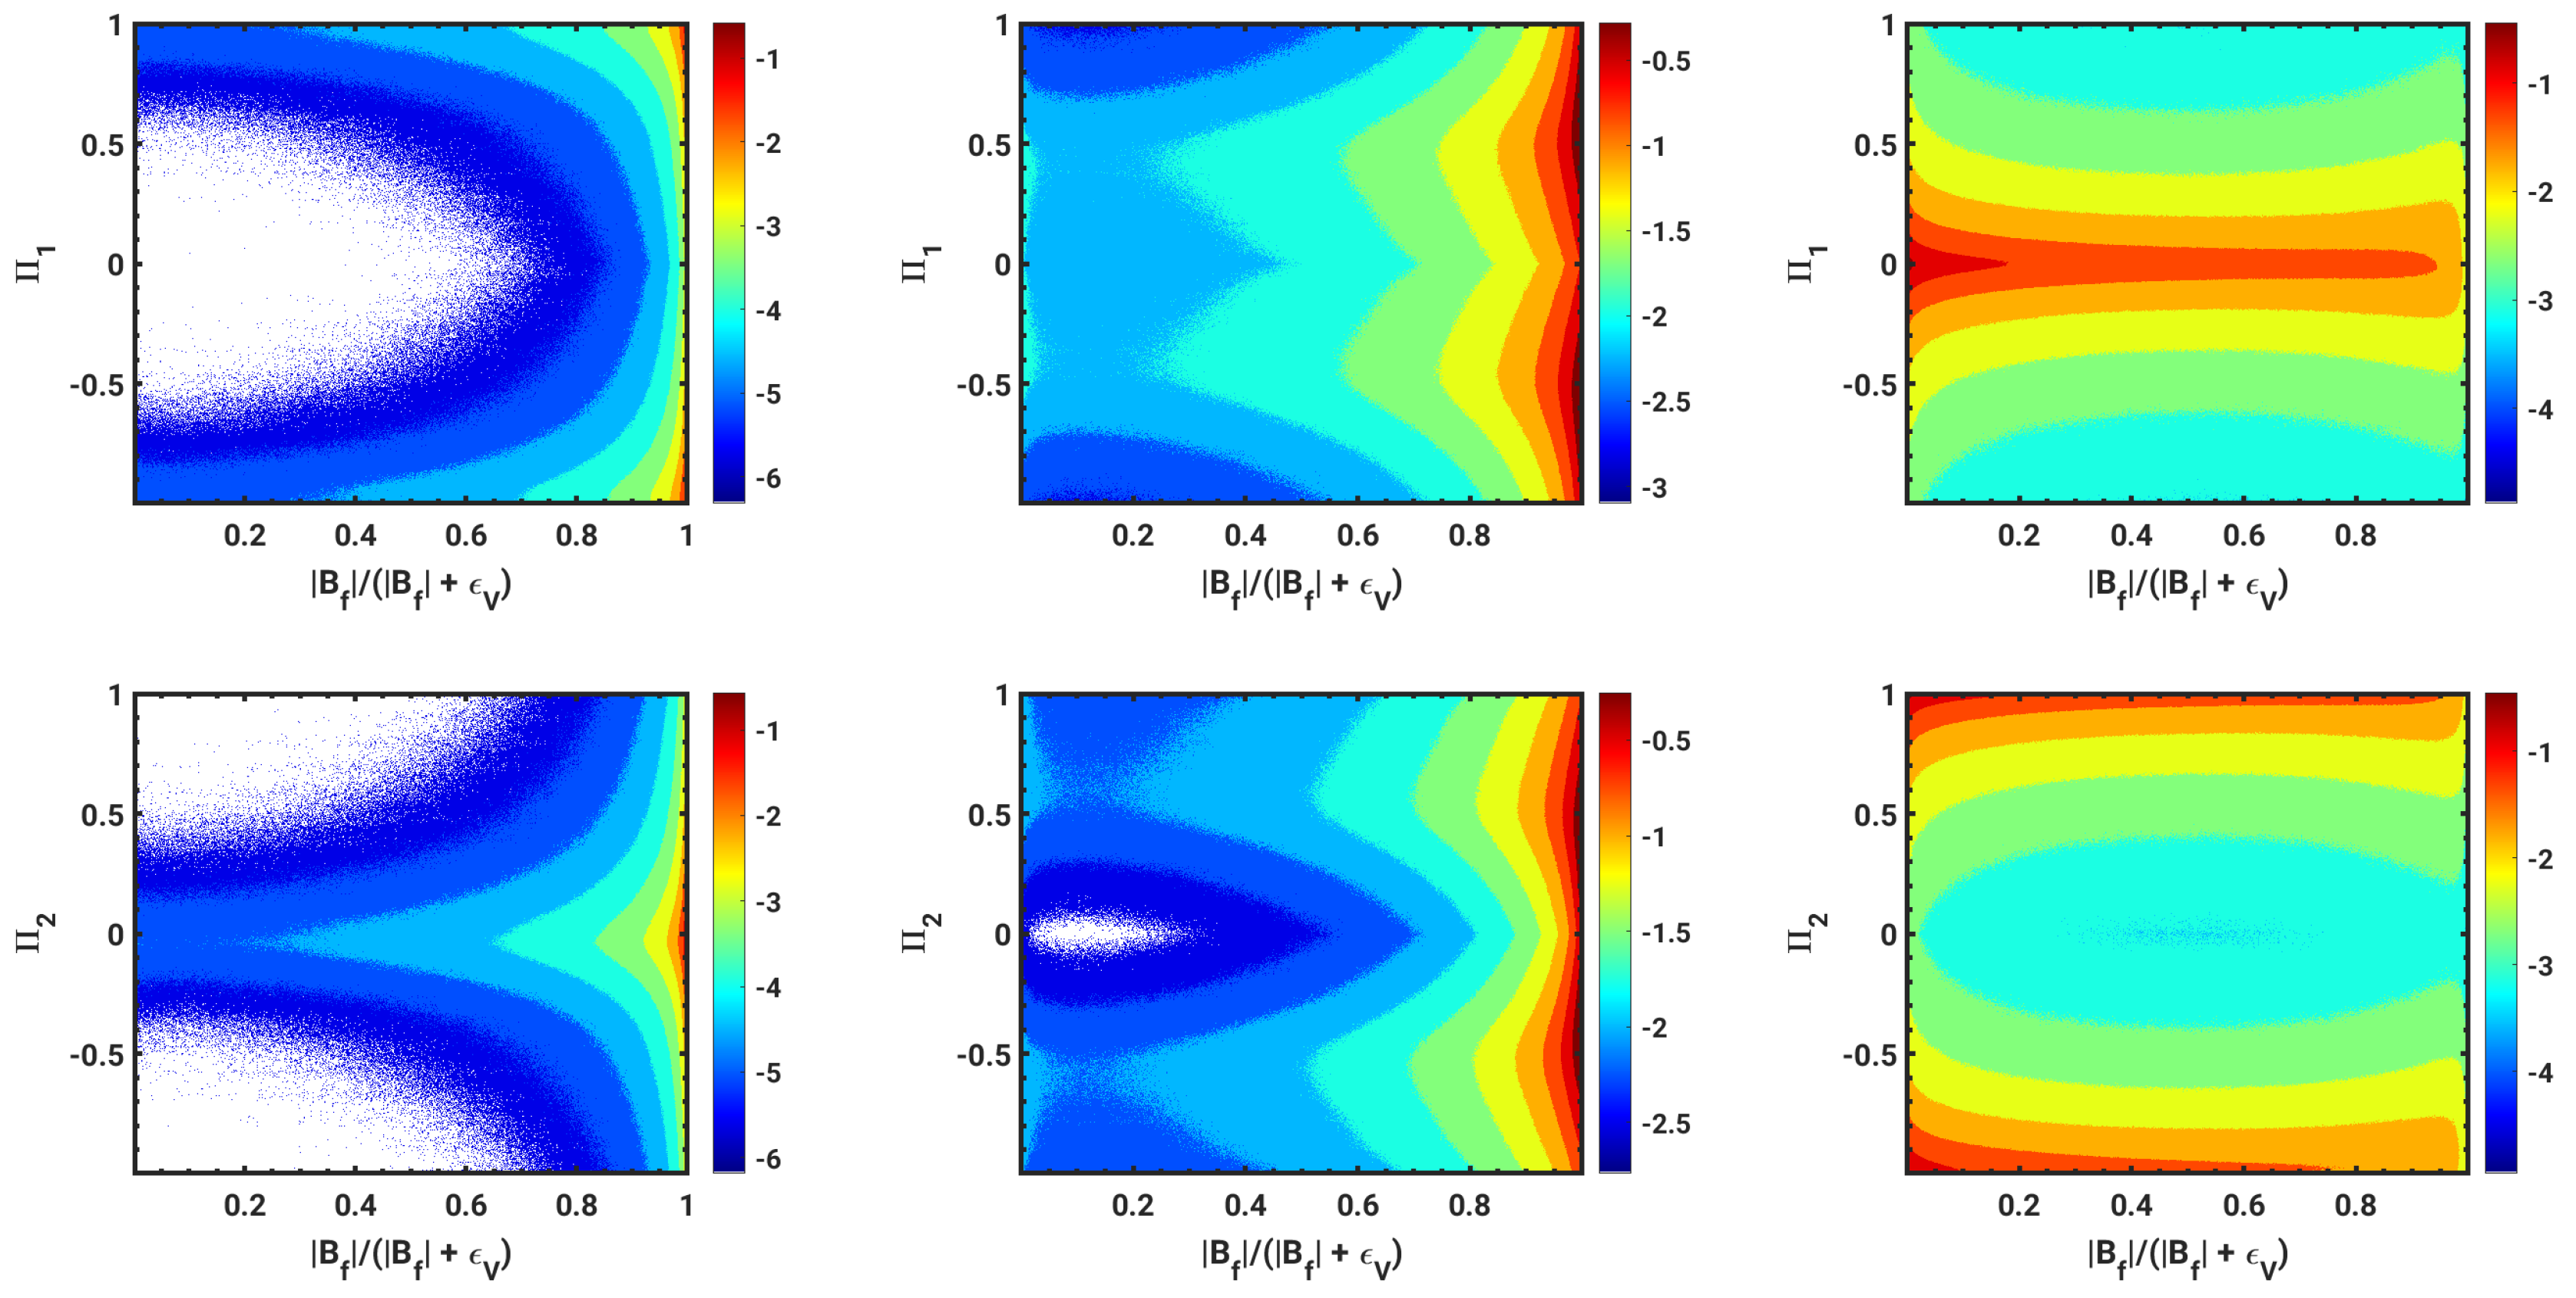
When we plot the joint PDFs of the normalized linear and nonlinear parts of the potential vorticity, Π 1 , Π 2 for the same three runs (see Figure 7, top and bottom respectively) against normalized buoyancy flux, we observe again a drastic change between the wave-dominated and eddy-dominated regimes. Note also that the two plots (for Π 1 , 2 ) give complementary information. For Π 2 , at low Froude number (for rI, left), the highest joint probability corresponds, as expected, to very low kinetic energy dissipation (normalized buoyancy flux close to unity) and zero nonlinear PV. Conversely, for Π 1 , most of the points with high probability lie for B f N 1 , Π 1 ± 1 (in normalized terms). By contrast, for run III for which β has reached a value close to the efficiency of HIT [18], the highest probability for Π 2 is for PV dominated by its nonlinear part and for B f N 0 , although in fact the buoyancy flux takes a large range of values. Run rII, in the intermediate regime, is a combination of these two behaviors, although it does display its highest probability for ϵ V still quite small, with B f N close to unity.
The wavy appearance of the data for rII for PV at high B f N is likely linked to a symmetry between the ± parts of Π 1 , 2 , with extrema at ± 0.5 corresponding to the linear and nonlinear parts of PV balancing each other. This occurs for B f N 1 , that is for low kinetic energy dissipation. For rI, the highest joint probability is for ϵ V 0 , which of course makes sense; for rIII, one finds high joint probability for Π 2 ± 1 , which again is to be expected since Π 1 0 . rII shows characteristics of both the rI and rIII regimes. We can say that whatever the value of the buoyancy flux B f , the highest joint probability is found for Π 1 0 (and consequently Π 2 1 ) for the run in the strongly turbulent regime, and the converse is true in regime I in which waves are fast.
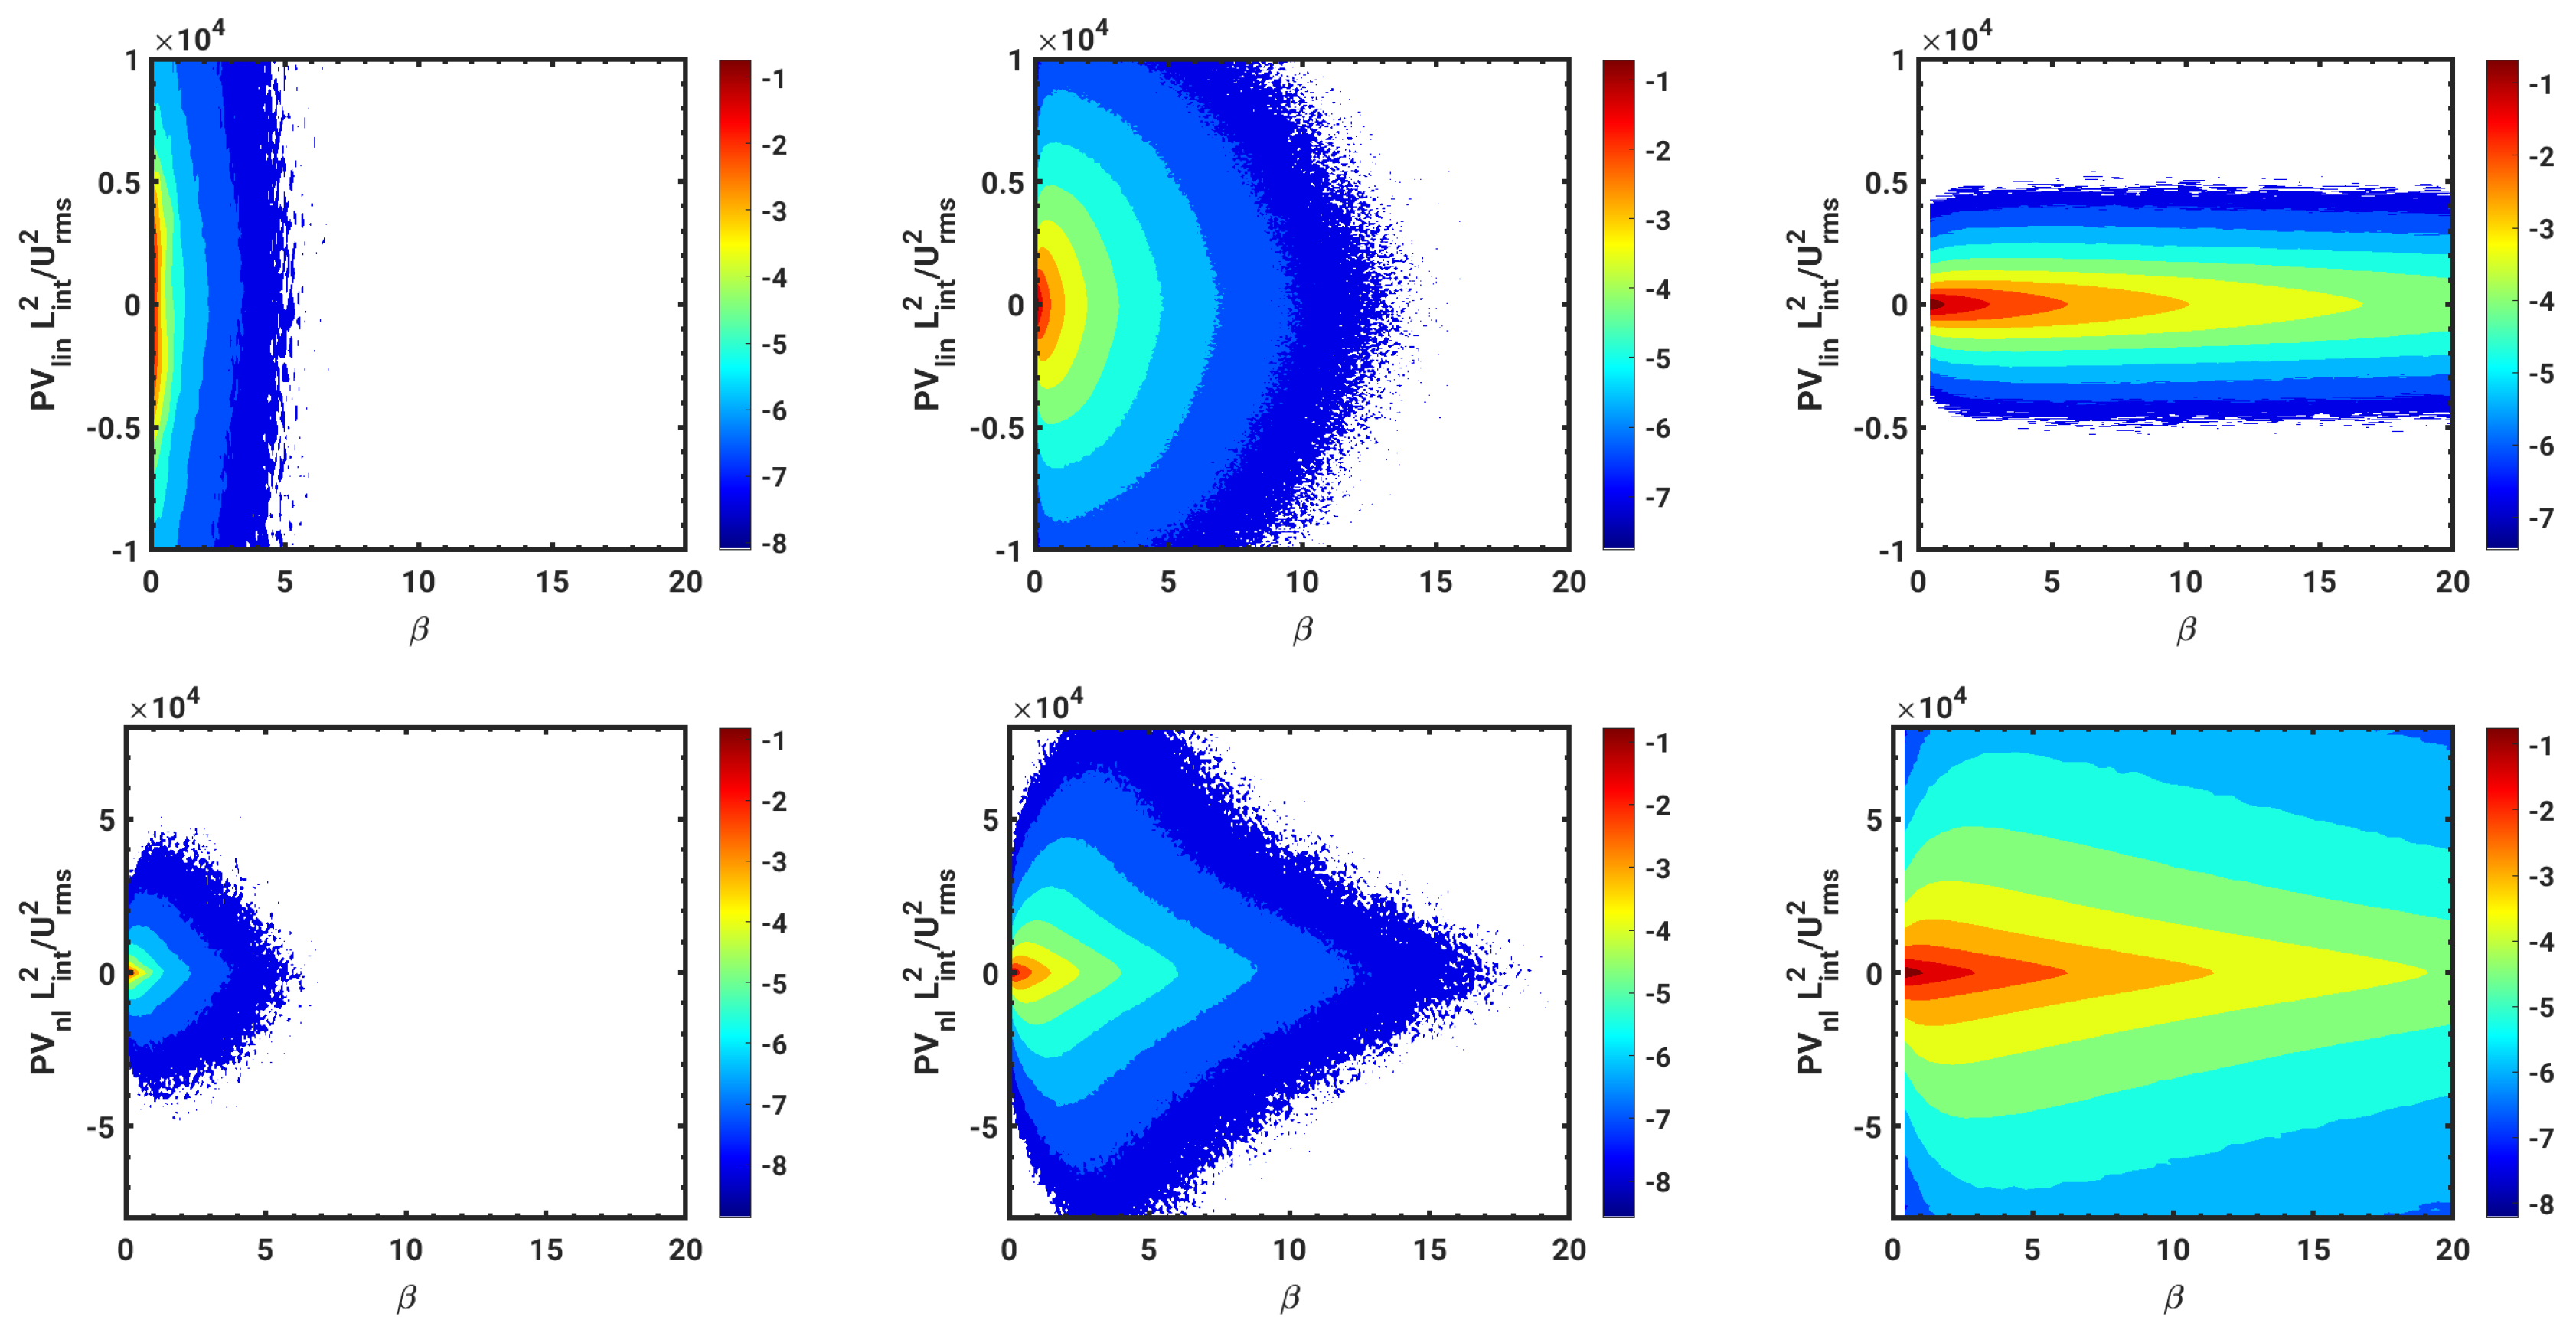
In Figure 8, we present the joint PDFs of the linear (top) and nonlinear (bottom) parts of potential vorticity, each normalized by the square of the turn-over time τ N L built on large-scale fields (rms velocity and integral scale). The highest joint probability, in all cases, takes place for β 0 and P V 0 . As the Froude number progressively grows from run rI (left) to run rIII (right), there are higher values of the efficiency of kinetic energy dissipation that are populated, i.e., more local patches of highly dissipative flow, with the highest probability for rIII as we get closer to the fully turbulent regime. This can be verified by remarking that, taking some fixed value of joint probability, like 10 6 , the level of Π N L increases with Froude number, going from rI to rIII, at the same time that the level of Π L decreases.
Finally, note in Figure 8 that, while the range for β remains the same for all six plots, the scale for the nonlinear PV is a factor of >5 times that of the linear PV. Again, these high values for the nonlinear component correspond to high vorticity and high temperature gradients, with no preferred direction of orientation. It is also noteworthy that nonlinear PV does not reach the whole range of values for the run dominated by the waves (rI, left). In fact, in general, the functional support for the linear PV varies in the opposite sense from the nonlinear PV as we traverse regimes, with that for linear PV decreasing from rI to rIII, while that for nonlinear PV increases. We also note that PV takes strong values for both ± signs, a probable signature of different instabilities such as the symmetric and baroclinic instabilities that can occur within geophysical flows.

5. Discussion and Conclusions

The results presented in this paper show in particular that the nonlinear part of potential vorticity, Π N L = ω · θ , which is weak initially for initial conditions centered on large scales, comes to dominate small-scale dynamics and is strongly correlated with highly efficient local dissipation involving local instabilities. As the Froude number increases, the turbulence becomes stronger, and small-scale gradients form. The point-wise conservation of potential vorticity implies that, when strong gradients form reinforcing Π N L , the linear part of PV has to decrease in the same proportion, explaining the large ratio between the two as observed in Figure 7 and Figure 8.
One of the many remaining issues is whether and how Π N L can be weakened through the orthogonalization of the vorticity and the temperature gradient. Note that in fact there is another invariant of a helical type, I H = A · B with B = × A , where I H involves, this time, potential vorticity gradients [67]. The dynamics of I H were considered in the presence of an imposed vertical shear in [68], where it was shown that it does become weaker through alignment of A and B . The quasi-suppression, in strong local structures, of nonlinearities in turbulent flows is in fact a common feature where, for example, in HIT small-scale filaments of vorticity form in which ω is close to being parallel to u ; thus, the Lamb vector u × ω that represents the nonlinearity of the Navier–Stokes equations to within a pressure term | u | 2 / 2 is negligible, making these filaments long-lived. Other examples of systematic weakening of nonlinear interactions can be found in MHD fluids and plasmas. The issue of the relative orientation of vorticity and temperature gradients is left for future work.
In the presence of a strong imposed vertical shear S and of strong rotation, as controlled by the Richardson and Rossby numbers, it was found in [69] that the baroclinic instability can develop efficiently. Shear and rotation were essential to determine the unstable state that leads to nonlinear mode coupling, and to the formation of strong small-scale gradients, in turn giving rise to localized enhanced dissipation as observed in the atmosphere and in the ocean. PDFs of the linear and nonlinear parts of PV (with a normalization different from what is done here, using τ N instead of τ N L ) are also given in that same paper, where it is observed that they are highly non-Gaussian. Indeed, strong (order unity) negative skewness develops in these flows, significant of strong localized turbulence [69]. The localization of turbulence, both in space and in time, has been studied for many years as it leads, for example, to anomalous scaling of structure functions. There is renewed interest in these issues within the context of instanton theory for both fluids and plasmas [32,33,34,37], and its link to the so-called PQR analysis of the invariants of the velocity gradient matrix [36], following the Vieillefosse model which, in the context of strongly stratified flows, indicates the essential role of convective instabilities [26,54,70].
Furthermore, it was shown in [71] that for HIT, but in the presence of a large-scale imposed anisotropy, the ratio of the dissipation rates estimated with either vertical ( w 3 / L z ) or horizontal ( u 3 / L ) variables are in fact equal, showing that there is a disappearance of the imposed anisotropy when one reaches the small scales, provided the Reynolds number is large enough. The link between anisotropy and the structure of potential vorticity will be the topic of a future paper.
Many other points require further discussion. For example, homogeneous turbulence in the presence of shear can be studied with a combination of rapid distortion theory and DNS. In that case, it can be shown that rotation has a huge impact on the dynamics of a passive scalar such as a chemical tracer, on the velocity-scalar cross-correlation (related to the buoyancy flux w θ ), as well as on the ratio of the turn-over time to the characteristic time associated with the dynamics of the scalar [72]. In our case, the Froude number is quite small for most of the runs, making the scalar interacting in a significant way with the velocity field. On the other hand, when the Froude number becomes close to unity (from below), atmospheric and oceanic constraints (that is, a ratio N / f larger than 5 for the atmosphere and more like 100 for the oceans) lead to a Rossby number that is is too large for rotation to be significant, except in the largest scales, and the scalar becomes passive.
More to the point, in purely stratified flows, for scales smaller than the Ozmidov scale O z = [ ϵ V / N 3 ] 1 / 2 [73], temperature fluctuations become passive, and isotropy and classical (Kolmogorov) scaling in terms of isotropic wavenumber for the kinetic and potential energy spectra are conjectured to recover for a large enough Reynolds number. This was shown clearly in the purely rotating case beyond the so-called Zeman scale (where f replaces N in the above expression), analyzing a DNS run on a grid of 3072 3 points with Re = 27,000, Ro = 0.07) [74]. However, in the presence of both rotation and stratification, the recovery of anisotropy is slow, in particular for the vorticity, a fact which could be attributed to the invariance of PV [19].
There are, of course, several potential limitations to our work. One concerns the Prandtl number P r taken equal to one. However, one can argue that the turbulent Prandtl number is of order unity, as demonstrated analytically using the Renormalization Group formalism for homogeneous isotropic turbulence in [75]. For stratified flows, it was also shown analytically for R i < 0.2 , using the Quasi-Normal Scale Elimination model [76], and it was demonstrated numerically for R B 50 in [77]. Furthermore, one can find a compilation of various atmospheric data sources in [78], where P r is shown to have a limit of one for a Richardson number R i 0.1 , that is when the turbulence becomes energetic. Such a result, in terms of magnetic Prandtl number close to unity, is also present when coupling the velocity to a magnetic field for anisotropic flows [79,80].
We also want to remark that the runs that are the least well resolved numerically (comparing the cut-off frequency and the Kolmogorov dissipation wavenumber) are not those with the highest R B , as could have been expected a priori, since as R B grows, one enters the fully turbulent regime with more efficient and vigorous dissipation at small scales. However, it is shown in [25] for the purely stratified case (see Figure 1 in this paper for RST) that at intermediate values of R B in the so-called saturation regime in which there is a balance between nonlinear advection and buoyancy flux, intermittency, as measured by Probability Density Functions of the fields themselves, have non-Gaussian wings contrary to the HIT case (see also [26,27,81]), thus requiring more numerical resolution to accurately be able to follow the small scales of the intermediate regime.
Analyzing forced flows will give access to longer temporal averages to compute accurately the vertical buoyancy and momentum fluxes. However, one will then have to cope with issues of non-stationarity at small Rossby number. Indeed, it is known that below a critical Rossby number R o c 0.1 , the energy cascade goes predominantly to large scales [82,83] with a linear temporal growth of the kinetic energy, unless a large-scale friction term is present.
Finally, novel numerical methods of decimation, either progressive [84] or fractal [85], as well as new data analysis algorithms in the spirit of artificial intelligence algorithms [86,87], may be found to be of some use in this context. They could help tackle these important problems at the core of the understanding of weather and climate systems.

Author Contributions

All authors contributed equally. All authors have read and agreed to the published version of the manuscript.

Funding

RM acknowledges support from the project “EVENTFUL” (ANR-20-CE30-0011), funded by the French “Agence Nationale de la Recherche”-ANR through the program AAPG-2020.

Institutional Review Board Statement

Not applicable.

Informed Consent Statement

Not applicable.

Data Availability Statement

Data in whole or in part may be requested from authors.

Acknowledgments

We are thankful for a remark made by one of the reviewers. We would like to acknowledge high-performance computing support from Cheyenne (doi:10.5065/D6RX99HX) provided by NCAR’s Computational and Information Systems Laboratory, sponsored by the National Science Foundation. Support for AP, from LASP and in particular from Bob Ergun, is gratefully acknowledged as well.

Conflicts of Interest

The authors declare no conflict of interest.

Abbreviations

The following abbreviations are used in this manuscript:
DNSDirect Numerical Simulations
HITHomogeneous Isotropic Turbulence
KHKelvin-Helmoltz
MHDMagnetohydrodynamic
PDFProbability Distribution Functions
QGQuasi-Geostrophic
RSTRotating Stratified Turbulence

References

  1. Peltier, W.; Clark, T. Nonlinear mountain waves in two and three spatial dimensions. Q. J. R. Meteorol. Soc. 1983, 109, 527–548. [Google Scholar] [CrossRef]
  2. Vallis, G.; Maltrud, M. Generation of mean flows and jets on a beta-plane and over topography. J. Phys. Oceanogr. 1993, 23, 1346–1362. [Google Scholar] [CrossRef] [Green Version]
  3. Winters, K.; Armi, L. Topographic control of stratified flows: Upstream jets, blocking and isolating layers. J. Fluid Mech. 2014, 753, 80–103. [Google Scholar] [CrossRef]
  4. Rhines, P. Geostrophic Turbulence. Ann. Rev. Fluid Mech. 1979, 11, 401–441. [Google Scholar] [CrossRef]
  5. Kunze, E.; Llewellyn-Smith, S. The role of small-scale topography in turbulent mixing of the global ocean. Oceanography 2004, 17, 55–64. [Google Scholar] [CrossRef]
  6. Maffioli, A.; Davidson, P.; Dalziel, S.; Swaminathan, N. The evolution of a stratified turbulent cloud. J. Fluid Mech. 2014, 739, 229–253. [Google Scholar] [CrossRef]
  7. Afanasyev, Y.D.; Peltier, W. The Three-Dimensionalization of Stratified Flow over Two-Dimensional Topography. J. Atmos. Sci. 1998, 55, 19–39. [Google Scholar] [CrossRef]
  8. Geyer, W.; Lavery, A.; Scully, M.; Trowbridge, J. Mixing by shear instability at high Reynolds number. Geophys. Res. Lett. 2010, 37, L22607. [Google Scholar] [CrossRef] [Green Version]
  9. Fritts, D.; Wang, L.; Baumgarten, G.; Miller, A.; Geller, M.; Jones, G.; Limon, M.; Chapman, D.; Didier, J.; Kjellstrand, C.B.; et al. High-resolution observations and modeling of turbulence sources, structures, and intensities in the upper mesosphere. J. Atmos. Sol. Terr. Phys. 2017, 162, 57–78. [Google Scholar] [CrossRef]
  10. Mater, B.; Venayagamoorthy, S. The quest for an unambiguous parameterization of mixing efficiency in stably stratified geophysical flows. Geophys. Res. Lett. 2014, 41, 4646–4653. [Google Scholar] [CrossRef]
  11. Mellor, G.; Yamada, T. Development of a Turbulence Closure Model for Geophysical Fluid Problems. Rev. Geophys. Space Phys. 1982, 20, 851–875. [Google Scholar] [CrossRef] [Green Version]
  12. Lozovatsky, I.; Fernando, H. Mixing efficiency in natural flows. Philos. Trans. A 2013, 371, 20120213. [Google Scholar] [CrossRef]
  13. Brunner-Suzuki, A.M.; Sundermeyer, M.; Lelong, M.P. Upscale Energy Transfer by the Vortical Mode and Internal waves. J. Phys. Oceanogr. 2014, 44, 2446–2469. [Google Scholar] [CrossRef] [Green Version]
  14. Pouquet, A.; Marino, R. Geophysical turbulence and the duality of the energy flow across scales. Phys. Rev. Lett. 2013, 111, 234501. [Google Scholar] [CrossRef] [PubMed] [Green Version]
  15. Marino, R.; Pouquet, A.; Rosenberg, D. Resolving the paradox of oceanic large-scale balance and small-scale mixing. Phys. Rev. Lett. 2015, 114, 114504. [Google Scholar] [CrossRef] [PubMed] [Green Version]
  16. Klymak, J.M.; Pinkel, R.; Rainville, L. Direct Breaking of the Internal Tide near Topography: Kaena Ridge, Hawaii. J. Phys. Oceanogr. 2008, 38, 380–399. [Google Scholar] [CrossRef]
  17. Rosenberg, D.; Pouquet, A.; Marino, R.; Mininni, P. Evidence for Bolgiano-Obukhov scaling in rotating stratified turbulence using high-resolution direct numerical simulations. Phys. Fluids 2015, 27, 055105. [Google Scholar] [CrossRef] [Green Version]
  18. Pouquet, A.; Rosenberg, D.; Marino, R.; Herbert, C. Scaling laws for mixing and dissipation in unforced rotating stratified turbulence. J. Fluid Mech. 2018, 844, 519–545. [Google Scholar] [CrossRef] [Green Version]
  19. Pouquet, A.; Rosenberg, D.; Marino, R. Linking dissipation, anisotropy and intermittency in rotating stratified turbulence. Phys. Fluids 2019, 31, 105116. [Google Scholar] [CrossRef]
  20. Rosenberg, D.; Marino, R.; Herbert, C.; Pouquet, A. Variations of characteristic time-scales in rotating stratified turbulence using a large parametric numerical study. Eur. Phys. J. E 2016, 39, 8. [Google Scholar] [CrossRef] [PubMed]
  21. Craske, J.; Salizzoni, P.; van Reeuwijk, M. The turbulent Prandtl number in a pure plume is 3/5. J. Fluid Mech. 2017, 822, 774–790. [Google Scholar] [CrossRef] [Green Version]
  22. Rosenberg, D.; Mininni, P.D.; Reddy, R.; Pouquet, A. GPU Parallelization of a Hybrid Pseudospectral Geophysical Turbulence Framework Using CUDA. Atmosphere 2020, 11, 178. [Google Scholar] [CrossRef] [Green Version]
  23. Fontana, M.; Bruno, O.P.; Mininni, P.D.; Dmitruk, P. Fourier continuation method for incompressible fluids with boundaries. Comput. Phys. Commun. 2020, 256, 107482. [Google Scholar] [CrossRef]
  24. Dritschel, D.; McKiver, W. Effect of Prandtl’s ratio in geophysical turbulence. J. Fluid Mech. 2015, 777, 569–590. [Google Scholar] [CrossRef] [Green Version]
  25. Rorai, C.; Mininni, P.; Pouquet, A. Turbulence comes in bursts in stably stratified flows. Phys. Rev. E 2014, 89, 043002. [Google Scholar] [CrossRef] [Green Version]
  26. Feraco, F.; Marino, R.; Pumir, A.; Primavera, L.; Mininni, P.; Pouquet, A.; Rosenberg, D. Vertical drafts and mixing in stratified turbulence: Sharp transition with Froude number. Eur. Phys. Lett. 2018, 123, 44002. [Google Scholar] [CrossRef] [Green Version]
  27. Marino, R.; Feraco, F.; Primavera, L.; Pumir, A.; Pouquet, A.; Rosenberg, D. Turbulence generation by large-scale extreme drafts and the modulation of local energy dissipation in stratified flow. Phys. Rev. Lett. 2021. submitted. [Google Scholar]
  28. Ishihara, T.; Gotoh, T.; Kaneda, Y. Study of High Reynolds Number Isotropic Turbulence by Direct Numerical Simulation. Ann. Rev. Fluid Mech. 2009, 41, 165–180. [Google Scholar] [CrossRef]
  29. Van Haren, H.; Gostiaux, L. Where large deep-ocean waves break. Geophys. Res. Lett. 2015, 42, 2351–2357. [Google Scholar] [CrossRef] [Green Version]
  30. Lopez, D.H.; Rabbani, M.R.; Crosbie, E.; Raman, A.; Arellano, A.F.; Sorooshian, A. Frequency and Character of Extreme Aerosol Events in the Southwestern United States: A Case Study Analysis in Arizona. Atmosphere 2016, 7, 1. [Google Scholar] [CrossRef] [Green Version]
  31. Gotoh, T. Probability functions in steady-state Burgers turbulence. Phys. Fluids 1999, 11, 2143–2149. [Google Scholar] [CrossRef]
  32. Kim, E.J.; Anderson, J. Structure based statistical theory of intermittency. Phys. Plasmas 2008, 15, 114506. [Google Scholar] [CrossRef]
  33. Gurarie, V.; Migdal, A. Instantons in the Burgers equation. Phys. Rev. E 1996, 54, 4908–4914. [Google Scholar] [CrossRef] [Green Version]
  34. Falkovich, G.; Kolokolov, I.; Lebedev, V.; Migdal, A. Instantons and intermittency. Phys. Rev. E 1996, 54, 4896–4907. [Google Scholar] [CrossRef] [PubMed] [Green Version]
  35. Grafke, T.; Grauer, R.; Schafer, T. The instanton method and its numerical implementation in fluid mechanics. J. Phys. A 2015, 48, 332015. [Google Scholar] [CrossRef]
  36. Grigorio, L.S.; Bouchet, F.; Pereira, R.M.; Chevillard, L. Instantons in a Lagrangian model of turbulence. J. Phys. A 2017, 50, 055001. [Google Scholar] [CrossRef] [Green Version]
  37. Migdal, A. Clebsch Confinement and Instantons in Turbulence. Int. J. Mod. Phys. A 2020, 35, 2030018. [Google Scholar] [CrossRef]
  38. Bretherton, F.P. A note on Hamilton’s principle for perfect fluids. J. Fluid Mech. 1970, 44, 19–31. [Google Scholar] [CrossRef]
  39. Salmon, R. Hamiltonian fluid mechanics. Ann. Rev. Fluid Mech. 1988, 20, 225–256. [Google Scholar] [CrossRef]
  40. Herbert, C.; Pouquet, A.; Marino, R. Restricted Equilibrium and the Energy Cascade in Rotating and Stratified Flows. J. Fluid Mech. 2014, 758, 374–406. [Google Scholar] [CrossRef] [Green Version]
  41. Herbert, C.; Marino, R.; Pouquet, A.; Rosenberg, D. Waves and vortices in the inverse cascade regime of rotating stratified turbulence with or without rotation. J. Fluid Mech. 2016, 806, 165–204. [Google Scholar] [CrossRef] [Green Version]
  42. Müller, P. Ertel’s potential vorticity theorem in physical oceanography. Rev. Geophys. 1995, 33, 67–97. [Google Scholar] [CrossRef]
  43. McIntyre, M.; Palmer, T. Breaking gravity waves in the stratosphere. Nature 1983, 305, 593–600. [Google Scholar] [CrossRef]
  44. Kurgansky, M.; Tatarskaya, M. The Potential Vorticity Concept in Meteorology: A Review. Izv. Atmos. Ocean. Phys. 1987, 23, 587–606. [Google Scholar]
  45. McIntyre, M.E. Isentropic Distributions of Potential Vorticity and their Relevance to Tropical Cyclone Dynamics. In Tropical Cyclone Disasters: Proceedings of ISCU/WMO International Symposium; Lighthill, J., Zheng, Z., Holland, G., Emanuel, K., Eds.; Beijing University Press: Beijing, China, 1993; pp. 143–156. [Google Scholar]
  46. Kolmogorov, A.N. Dissipation of energy in locally isotropic turbulence. Dokl. Akad. Nauk SSSR 1941, 32, 16–18, [English translation in Proc. Roy. Soc. Lond. A 1991, 434, 15–17]. [Google Scholar]
  47. Herring, J.R.; Kerr, R.; Rotunno, R. Ertel’s Potential Vorticity in Unstratified Turbulence. J. Atmos. Sci. 1994, 51, 35–47. [Google Scholar] [CrossRef] [Green Version]
  48. Wijesekera, H.W.; Dillon, T.M. Shannon entropy as an indicator for turbulent overturns in the oceanic thermocline. J. Geophys. Res. 1997, 102, 3279–3291. [Google Scholar] [CrossRef]
  49. Liu, H.L. On the large wind shear and fast meridional transport above the mesopause. Geophys. Res. Lett. 2007, 34, L08815. [Google Scholar] [CrossRef]
  50. Mare, F.D.; Sorriso-Valvo, L.; Retinò, A.; Malara, F.; Hasegawa, H. Evolution of Turbulence in the Kelvin-Helmholtz Instability in the Terrestrial Magnetopause. Atmosphere 2019, 10, 561. [Google Scholar] [CrossRef] [Green Version]
  51. Bartello, P. Geostrophic adjustment and inverse cascade in rotating stratified turbulence. J. Atmos. Sci. 1995, 52, 4410–4428. [Google Scholar] [CrossRef]
  52. Aluie, H.; Kurien, S. Joint downscale fluxes of energy and potential enstrophy in rotating stratified Boussinesq flows. Eur. Phys. Lett. 2011, 96, 44006. [Google Scholar] [CrossRef] [Green Version]
  53. Waite, M. Potential enstrophy in stratified turbulence. J. Fluid Mech. 2013, 722, R4. [Google Scholar] [CrossRef]
  54. Sujovolsky, N.; Mininni, P. From waves to convection and back again: The phase space of stably stratified turbulence. Phys. Rev. F 2020, 5, 064802. [Google Scholar] [CrossRef]
  55. Bos, W.J.; Shao, L.; Bertoglio, J. Spectral imbalance and the normalized dissipation rate of turbulence. Phys. Fluids 2007, 19. [Google Scholar] [CrossRef] [Green Version]
  56. Sreenivasan, K.R. On the scaling of the turbulence energy dissipation rate. Phys. Fluids 1984, 27, 1048–1049. [Google Scholar] [CrossRef]
  57. Sreenivasan, K.R. An update on the energy dissipation rate in isotropic turbulence. Phys. Fluids 1998, 10, 528–529. [Google Scholar] [CrossRef] [Green Version]
  58. Burattini, P.; Lavoie, P.; Antonia, R.A. On the normalized turbulent energy dissipation rate. Phys. Fluids 2005, 17, 098103. [Google Scholar] [CrossRef] [Green Version]
  59. Goto, S.; Vassilicos, J.C. The dissipation rate coefficient of turbulence is not universal and depends on the internal stagnation point structure. Phys. Fluids 2009, 21, 035104. [Google Scholar] [CrossRef]
  60. Abe, H.; Antonia, R.A. Scaling of normalized mean energy and scalar dissipation rates in a turbulent channel flow. Phys. Fluids 2011, 23, 055104. [Google Scholar] [CrossRef]
  61. Sujovolsky, N.; Mininni, P.; Pouquet, A. Generation of turbulence through frontogenesis in sheared stratified flows. Phys. Fluids 2018, 30, 086601. [Google Scholar] [CrossRef]
  62. Mihelich, M.; Faranda, D.; Paillard, D.; Dubrulle, B. Is turbulence a state of maximum entropy. Entropy 2017, 19, 154. [Google Scholar] [CrossRef]
  63. Davies, P. Experiments on Taylor columns and in rotating stratified fluids. J. Fluid Mech. 1972, 54, 691–717. [Google Scholar] [CrossRef]
  64. Hassanzadeh, P.; Marcus, P.; LeGal, P. The universal aspect ratio of vortices in rotating stratified flows: Theory and simulation. J. Fluid Mech. 2012, 706, 46–57. [Google Scholar] [CrossRef] [Green Version]
  65. Waite, M.; Bartello, P. The transition from geostrophic to stratified turbulence. J. Fluid Mech. 2006, 568, 89–108. [Google Scholar] [CrossRef]
  66. Shakespeare, C.; Taylor, J. A generalized mathematical model of geostrophic adjustment and frontogenesis: Uniform potential vorticity. J. Fluid Mech. 2013, 736, 366–413. [Google Scholar] [CrossRef]
  67. Gibbon, J.; Holm, D. The dynamics of the gradient of potential vorticity. J. Phys. A 2010, 43, 172001. [Google Scholar] [CrossRef]
  68. Pieri, A.; Godeferd, F.S.; Cambon, C.; Dubrulle, B.; Thalabard, S. Cross-Helicity in Rotating Homogeneous Shear-Stratified Turbulence. Phys. Rev. Lett. 2014, 112, 114501. [Google Scholar] [CrossRef] [Green Version]
  69. Pieri, A.B.; Godeferd, F.S.; Cambon, C.; Salhi, A. Non-geostrophic instabilities of an equilibrium baroclinic state. J. Fluid Mech. 2013, 734, 535–566. [Google Scholar] [CrossRef]
  70. Rorai, C.; Rosenberg, D.; Pouquet, A.; Mininni, P. Helicity dynamics in stratified turbulence in the absence of forcing. Phys. Rev. E 2013, 87, 063007. [Google Scholar] [CrossRef] [Green Version]
  71. Bewley, G.; Chang, K.; Bodenschatz, E. On integral length scales in anisotropic turbulence. Phys. Fluids 2012, 24, 061702. [Google Scholar] [CrossRef]
  72. Brethouwer, G. The effect of rotation on rapidly sheared homogeneous turbulence and passive scalar transport. Linear theory and direct numerical simulation. J. Fluid Mech. 2005, 542, 305–342. [Google Scholar] [CrossRef] [Green Version]
  73. Ozmidov, R. On the turbulent exchange in a stably stratified ocean. Izv. Acad. Sci. USSR Atmos. Ocean. Phys. 1965, 1, 853–860. [Google Scholar]
  74. Mininni, P.; Rosenberg, D.; Pouquet, A. Isotropization at small scale of rotating helically driven turbulence. J. Fluid Mech. 2012, 699, 263–279. [Google Scholar] [CrossRef] [Green Version]
  75. Forster, D.; Nelson, D.; Stephen, M. Long-time tails and the large-eddy behavior of a randomly stirred fluid. Phys. Rev. Lett. 1977, 36, 867–870. [Google Scholar] [CrossRef]
  76. Galperin, B.; Sukoriansky, S.; Anderson, P.S. On the critical Richardson number in stably stratified turbulence. Atmos. Sci. Lett. 2007, 8, 65–69. [Google Scholar] [CrossRef]
  77. Salehipour, H.; Peltier, W. Diapycnal diffusivity, turbulent Prandtl number and mixing efficiency in Boussinesq stratified turbulence. J. Fluid Mech. 2015, 775, 464–500. [Google Scholar] [CrossRef]
  78. Zilitinkevich, S.S.; Elperin, T.; Kleeorin, N.; Rogachevskii, I.; Esau, I.; Mauritsen, T.; Miles, M.W. Turbulence energetics in stably stratified geophysical flows: Strong and weak mixing regimes. Q. J. R. Meteorol. Soc. 2008, 134, 793–799. [Google Scholar] [CrossRef] [Green Version]
  79. Garnier, M.; Alemany, A.; Sulem, P.L.; Pouquet, A. Influence of an external magnetic field on large scale Reynolds number MHD turbulence. J. Mécanique 1981, 20, 233–251. [Google Scholar]
  80. Yousef, T.; Brandenburg, A.; Rüdiger, G. Turbulent magnetic Prandtl number and magnetic diffusivity quenching from simulations. Astron. Astrophys. 2003, 411, 321–327. [Google Scholar] [CrossRef]
  81. Clark di Leoni, P.; Mininni, P.D. Absorption of waves by large scale winds in stratified turbulence. Phys. Rev. E 2015, 91, 033015. [Google Scholar] [CrossRef] [PubMed] [Green Version]
  82. Lindborg, E. The effect of rotation on the mesoscale energy cascade in the free atmosphere. Geophys. Res. Lett. 2005, 32, 1–4. [Google Scholar] [CrossRef]
  83. Marino, R.; Rosenberg, D.; Herbert, C.; Pouquet, A. Interplay of waves and eddies in rotating stratified turbulence and the link with kinetic-potential energy partition. EuroPhys. Lett. 2015, 112, 49001. [Google Scholar] [CrossRef] [Green Version]
  84. Meneguzzi, M.; Politano, H.; Pouquet, A.; Zolver, M. A sparse-mode spectral method for the simulations of turbulent flows. J. Comput. Phys. 1996, 123, 32–44. [Google Scholar] [CrossRef]
  85. Lanotte, A.S.; Benzi, R.; Malapaka, S.K.; Toschi, F.; Biferale, L. Turbulence on a Fractal Fourier Set. Phys. Rev. Lett. 2015, 115, 264502. [Google Scholar] [CrossRef] [PubMed]
  86. Ling, J.; Kurzawski, A.; Templeton, J. Reynolds averaged turbulence modelling using deep neural networks with embedded invariance. J. Fluid Mech. 2016, 807, 155–166. [Google Scholar] [CrossRef]
  87. Kutz, J. Deep learning in fluid dynamics. J. Fluid Mech. 2017, 814, 1–4. [Google Scholar] [CrossRef] [Green Version]
Figure 1. Kurtosis (see text for a definition), K W , of the vertical Eulerian velocity, w, as a function of Froude number, in log-lin coordinates with binning in Rossby number. Color/symbols indicate the following intervals: blue triangles for R o [ 0 , 0.3 ] , black circles (or stars) for [ 0.3 , 3 ) , black diamonds for [ 3 , 6 ) , red squares for [ 6 , 10 ) and inverted magenta triangles for [ 10 , ) ; stars are for runs with QG initial conditions.
Atmosphere 12 00157 g001
Figure 2. PDFs of one horizontal component of vorticity, ω 2 (left), and of ω · θ (right), both binned in Froude number F r (see insets for bin values). We observe larger wings at intermediate values of F r ( 0.007 < F r 0.196 ), corresponding to the peak of K W in Figure 1.
Atmosphere 12 00157 g002
Figure 3. Probability Density Functions of the ω 2 (horizontal) component of vorticity, in lin-log coordinates, for runs rI (left), rII (middle) and rIII (right), in the three regimes of rotating stratified turbulence. The S, B and C parameters refer to a stretched exponential fit in the tails, P ( ω 2 ) = B exp ( C ω 2 S ) ; the fit domain is given by blue triangles, and the red circles correspond to Gaussian profiles computed from the distribution mean and standard deviation.
Atmosphere 12 00157 g003
Figure 4. Visualization of potential vorticity in a small portion of the fluid for run r4k on a grid of 4096 3 points. The snapshot is taken at the peak of dissipation, and the magnification is focused on several Kelvin–Helmoltz rolls close to the center and towards the right; the image is approximately 1/10th the size of the cube in the x-z directions, and 1/100th thick (40 layers) in the y direction. Note the juxtaposition of regions of strongly positive (purple) and negative (red) regions of PV.
Atmosphere 12 00157 g004
Figure 5. Joint probability of point-wise buoyancy flux normalized by N, B f ( x ) / N = w ( x ) θ ( x ) , and of gradient Richardson number R i g ( x ) for runs rI, rII and rIII, respectively left, middle and right (see Table 1). Note the extended range of values for R i g in the left panel. AP: Normalized or not, see Equation (7).
Atmosphere 12 00157 g005
Figure 6. Point-wise efficiency of kinetic energy dissipation, β ( x ) , vs. buoyancy flux, for the three fiducial runs. Top: β is in linear coordinates and plotted against the normalized buoyancy flux B f N . Bottom: log β is plotted vs. the buoyancy flux itself normalized by the Brunt-Väisälä frequency, B f / N = w θ . Note the clear increase of β from regime I at left to regime III at right.
Atmosphere 12 00157 g006
Figure 7. Joint PDFs of normalized linear ( Π 1 , top) and nonlinear ( Π 2 , bottom) potential vorticity vs. normalized buoyancy flux, for the same three runs as in the preceding figures.
Atmosphere 12 00157 g007
Figure 8. Joint PDFs of linear (top) and nonlinear (bottom) potential vorticity, both adimensionalized using τ N L 2 = [ L i n t / U r m s ] 2 . Plots are for the three fiducial runs with, as before, rI at left, rII in the middle and rIII at right (see Table 1). Note the different vertical scales between the linear and nonlinear PV.
Atmosphere 12 00157 g008
Table 1. Characteristics of the decay runs analyzed here: Froude and Rossby numbers, F r , R o and their ratio R o / F r = N / f , as well as Reynolds and buoyancy Reynolds numbers, R e , R B (see text for definitions, and see [18,19,20] for more data on the runs). The last line refers to a run on a grid of 4096 3 points analyzed in [17], run r4k. Like run rII, it belongs to the intermediate (second) regime of parameters as defined in [18] for rotating stratified turbulence. The four runs have isotropic random initial conditions centered in the large scales, with zero initial potential energy.
Run ID Fr Ro N / f Re R B
rI (Run 5 in [18])0.00730.22530.713,9450.75
rII (Run 32 in [18])0.0733.0441.712,21165.2
rIII (Run 58 in [18])0.892.22.547083760
r4k ( 4096 3 grid points) [17]0.0240.1554,00032
Publisher’s Note: MDPI stays neutral with regard to jurisdictional claims in published maps and institutional affiliations.