Review

Atmospheric Deposition and Element Accumulation in Moss Sampled across Germany 1990–2015: Trends and Relevance for Ecological Integrity and Human Health

1
ÖKO-DATA— Ecosystem Analysis and Environmental Data Management, Lessingstraße 16, 16356 Ahrensfelde, Germany
2
Landscape Ecology, University of Vechta, P.O.B. 1553, 49364 Vechta, Germany
3
PlanWerk, Unterdorfstraße 3, 63667 Nidda, Germany
*
Author to whom correspondence should be addressed.
Atmosphere 2021, 12(2), 193; https://doi.org/10.3390/atmos12020193
Submission received: 14 January 2021 / Revised: 22 January 2021 / Accepted: 26 January 2021 / Published: 31 January 2021

Abstract

:
Deposition of N and heavy metals can impact ecological and human health. This state-of-the-art review addresses spatial and temporal trends of atmospheric deposition as monitored by element accumulation in moss and compares heavy metals Critical Loads for protecting human health and ecosystem’s integrity with modelled deposition. The element accumulation due to deposition was measured at up to 1026 sites collected across Germany 1990–2015. The deposition data were derived from chemical transport modelling and evaluated with regard to Critical Loads published in relevant legal regulations. The moss data indicate declining nitrogen and HM deposition. Ecosystem and human health Critical Loads for As, Ni, Zn, and Cr were not exceeded in Germany 2009–2011. Respective Critical Loads were exceeded by Hg and Pb inputs, especially in the low rainfall regions with forest coverage. The Critical Load for Cu was exceeded by atmospheric deposition in 2010 in two regions. Human health Critical Loads for Cd were not exceeded by atmospheric deposition in 2010. However, the maximum deposition in 2010 exceeded the lowest human health Critical Load. This impact assessment was based only on deposition but not on inputs from other sources such as fertilizers. Therefore, the assessment should be expanded with regard to other HM sources and specified for different ecosystem types.

1. Introduction

Emissions of elements from natural and anthropogenic sources come down to earth as wet, occult [1,2], or dry deposition at locations distant from their origin where they accumulate in biomass and soils [3]. The geographical pattern of element deposition and accumulation is influenced by chemical and physical element characteristics, meteorological and topographical conditions, land use, and vegetation structure. Potential impacts on human health and ecosystems integrity through heavy metal (HM) accumulation in food chains, and acidification and eutrophication of soils and limnic ecosystems [4,5,6] are intended to be avoided through the Convention on Long-Range Transboundary Air Pollution [7,8] addressing Cd, Pb, and Hg, as well as N and S. The European Monitoring and Evaluation Programme (EMEP) is to collate emission data, to collect atmospheric deposition Europe-wide by technical devices, and to calculate and map atmospheric deposition by chemical transport models such as the Long Term Ozone Simulation—EURopean Operational Smog model (LOTOS-EUROS) and EMEP [9,10,11,12,13,14,15,16,17,18,19,20,21]). This monitoring and modelling data can be validated and complemented by monitoring the bioaccumulation of elements in moss [22,23,24]. In Europe, HM (since 1990), N (since 2005), and persistent organic pollutants (POP; since 2010) were determined in moss specimens sampled in a rather dense spatial pattern. Since 2000, this European Moss Survey (EMS) is part of the International Cooperative Programme on Effects of Air Pollution on Natural Vegetation and Crops (ICP Vegetation). Since 1990, the EMS was conducted every five years and covered up to 7300 sampling sites in up to 36 European countries enabling to map spatial patterns of bioaccumulation and to derive deposition estimates by regression modelling [25,26,27,28,29].
High concentrations of atmospheric pollutants can result in exceeding Critical Levels of atmospheric concentrations and Critical Loads (CL) of atmospheric deposition. CL are defined as quantitative estimates of exposure to one or more pollutants deposited from air to the ground below which significant harmful effects on specified sensitive elements of the environment do not occur according to present knowledge. Critical levels are defined as concentrations of pollutants in the atmosphere above which direct adverse effects on receptors, such as human beings, plants, ecosystems, or materials, may occur according to present knowledge [7,8].
The chemical elements regarded in this investigation are given in Figure 1. The data on element concentrations in moss collected in Germany were analysed by a broad range of statistical methods focusing among others on following five key issues:
  • Bivariate and multiple correlations with ecological features of the sampling sites and of their environment—for instance atmospheric deposition, canopy drip effects, and land use—with results from other biomonitoring programmes and with results from deposition measurements using technical collectors and deposition modelling;
  • Geostatistical analysis and surface-covering estimation and mapping of site-specific data;
  • Computation and geostatistical mapping of percentile statistics of element-, site-, and survey-specific measurements;
  • Calculation and geostatistical mapping of elements integrating indices and surveys;
  • Assessing the relevance of modelled HM deposition for ecosystem integrity and human health based on CL.
This article aims at presenting the current state of knowledge on atmospheric HM deposition and bioaccumulation and the assessment of its relevance for ecosystem integrity and human health in Germany. Both these aspects of the relevance of HM input are interlinked. For example, excessive pollution of arable and grassland ecosystems contributes to the exposure on humans via the food chain. Damage to forest ecosystems reduces their recreational effect on humans. The article concentrates on two of the five key issues investigated in the framework of the German moss surveys: 1. Summarising EMS data collected from 1990 to 2015 across Germany by percentile statistics and calculation of elements and surveys integrating index scores 2. Reporting on the latest assessment of atmospheric heavy metal deposition with regard to ecological integrity and human health in Germany.

2. Materials and Methods

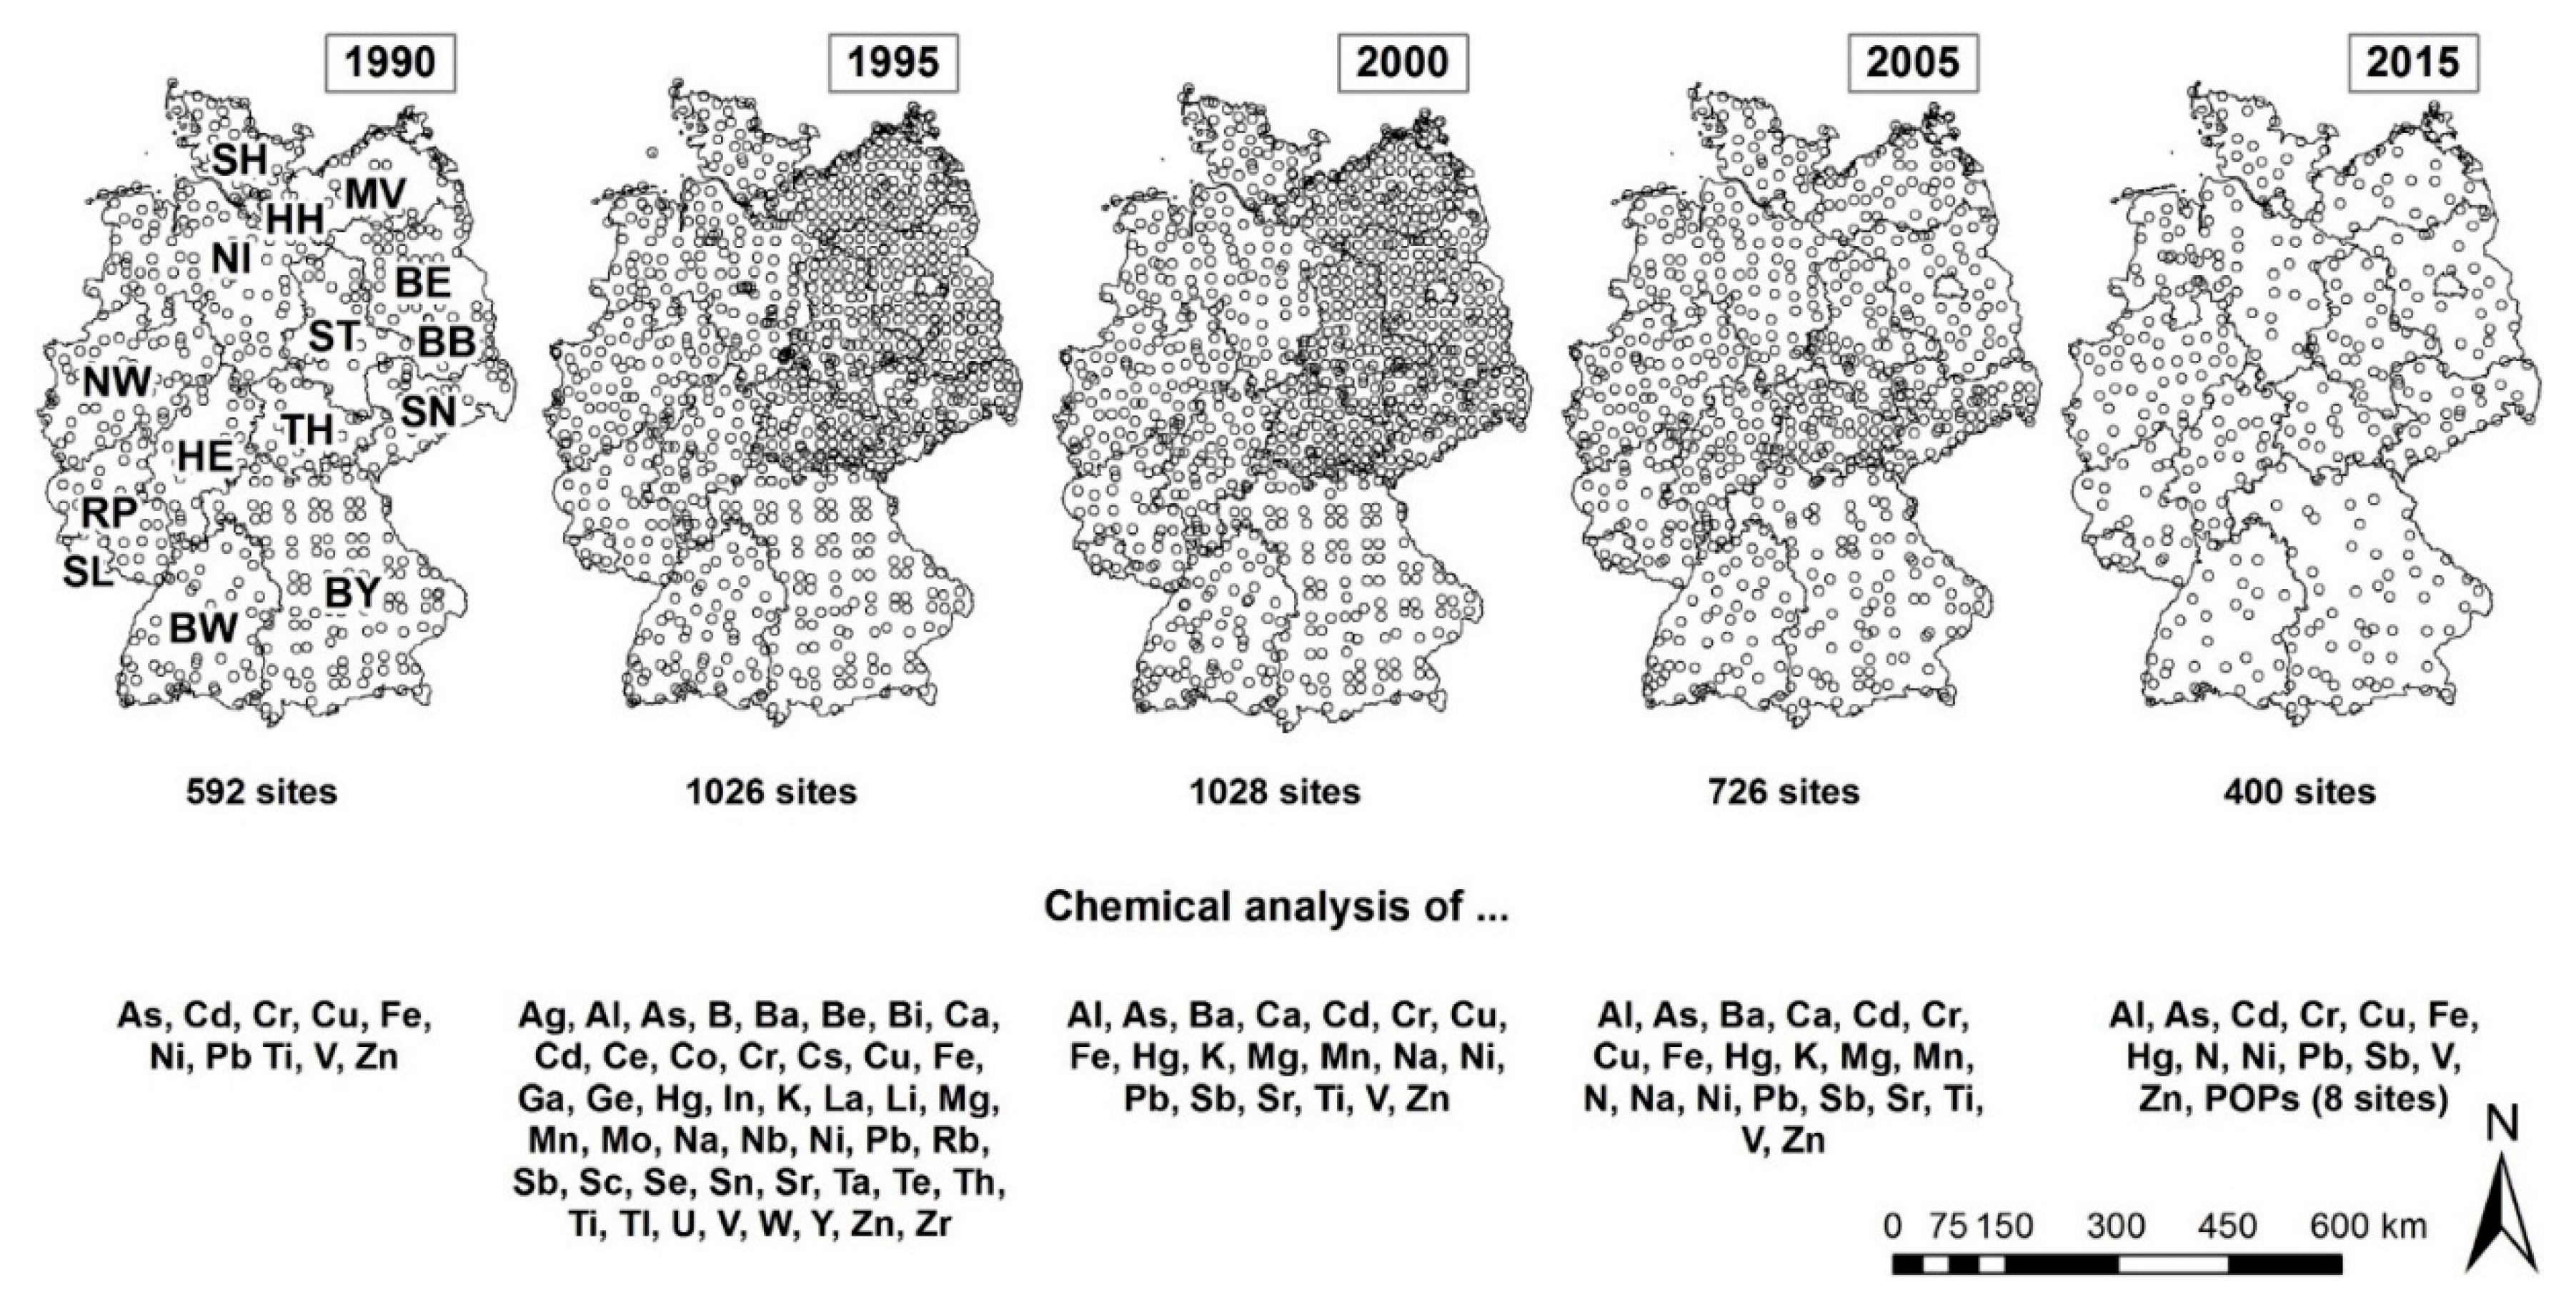
2.1. Bioaccumulation of Atmospheric Deposition of HM in Moss

Sampling and chemical analysis of moss specimens as well as classification and mapping of element concentrations determined follow a harmonised methodology (for EMS 2015 refer to ICP Vegetation [27]). Between 1990 and 2015, the number of moss sampling sites in Europe ranged between 4499 and 7312 in 20–36 countries. In the German Moss Survey, moss specimens were collected at 592 (1990 [30]), 1026 (1995 [31,32], 1028 (2000 [28]), 726 (2005 [33]), and 400 (2015 [34]) sites in forested areas. The reduction of sampling sites was performed according a statistically sound methodology [33,35]. Germany did not take part in the EMS 2010.
The international classification of element concentrations in moss [27] is too coarse to display the spatial variance of decreasing element concentrations. Additionally, the extensive data on up to 40 metal elements collected between 1990 and 2015 every five years at up to 1028 sites across Germany were summarised as far as possible in terms of a multi-metal index (MMI). Thereby, mapping of spatial and temporal trends was preserved. To this end, the element-specific data on HM accumulation was divided into 10 percentiles, which were then transformed into MMI score values ranging from 1 to 10.
The statistical analyses presented in this review regard HM concentrations that were measured in moss specimens collected in Germany 1990–2015. The following percentile statistics were calculated and mapped for spatial point data as well as for geostatistical surface estimations [23]:
  • Element- and survey-specific quantiles (10 classes as defined by the 10th, 20th,100th percentile for each of the surveys) enabling to detect whether the geographical patterns of bio-accumulation hot spots of 7 elements (Cr, Cu, Fe, Ni, Pb, V, Zn: 1990–2015) and 12 elements (Al, As, Cd, Cr, Cu, Fe, Hg, Ni, Pb, Sb, V, Zn: 1995–2015) from previous campaigns remain hot spots even with decreasing atmospheric deposition and bio-accumulation, or whether the bio-accumulation patterns shift across time or not.
  • Element-specific quantiles integrating all surveys 1990–2015 allowing for a statistically derived differentiation of 7 (1990–2015) and 12 (1995–2015), respectively, element concentrations into 10 classes and for their mapping across time in time and space despite decreasing element concentrations.
  • Seven and 12 elements and surveys, respectively, integrating calculation of a Multi Metals Index (MMI90-2015: 7 HM; MMI95-2015: 12 HM). To this end, gridded data on element concentration in moss were each subdivided into 10 percentile classes (0–10th percentile, > 10th to 20th percentile, … > 90th to 100th percentile). In a second step, scores are assigned to the element-specific percentile classes (0–10th percentile = index value 1, > 10th to 20th percentile = index value 2, and so on). To calculate the MMI ranging from 1 (low metal accumulation) to 10 (high metal accumulation), the element-specific index values for each object were averaged.
The results for Element-specific quantiles integrating all surveys 1990–2015 (b) and MMI90-2015 and MMI95-2015 scores are presented in Section 3.1.

2.2. Assessing Impacts of Atmospheric Deposition

2.2.1. Assessment Values

The second aim of this contribution was to assess potential HM deposition effects on ecosystems and human health on the basis of legal requirements and environmental quality objectives. As HM can be transported through the atmosphere over long distances and across national borders, both national and international regulations and assessment methods were considered thereby. The regulations and recommendations compiled in Table 1 and Table 2 contain different categories of assessment values, which differ with regard to their protective purpose, the respective level of protection, and protective objective. For this reason, this study uses the overarching term “assessment value” but takes over the nomenclature of quotations from the rules and regulations. In addition, a distinction is made between precautionary assessment values and those which serve to avert danger. Precautionary assessment values indicate limits of resilience (concentrations in environmental compartments or substance flows) below which there is no concern of significant impairment of ecosystems and their functions and services to humans. They apply generally, i.e., beyond the sphere of influence of concrete facilities, projects, or management measures, and they are independent of usage claims. In law, the concept of danger is always linked to a certain probability of the occurrence of significant, harmful changes. In principle, assessment values that serve to avert hazards permit higher pollutant concentrations or inputs than precautionary ones. As a rule, they serve to assess concrete (including planned) facilities, projects, or management measures and are derived from specific uses (e.g., test values and measure values in soil protection). Table 1 compiles the assessment values used in this study to compare them with CL. Due to the methodological differences in their derivation, they are only comparable to each other to a limited extent and with CL. The differences, some of which are clear, are due to different levels of protection, protection objectives, and the relationship between effects (Table 2).
The protection of human health and ecosystems and their functions against adverse effects from air pollutant deposition is generally ensured if HM inputs are completely avoided. However, this is currently not a realistic assumption. On the basis of empirical evidence, it is assumed that the protection of these objects may be reached if specific critical concentrations or loads of HM in environmental media are not exceeded. Thereby, only with the calculation of CL the balance between inputs and outputs can be proved.

2.2.2. Basics for the Determination of Critical Loads for Heavy Metal Deposition

CL for Cd, Pb, and Hg have already been calculated for the entire EMEP region. They serve as policy advice, in particular to examine and justify whether further emission reductions are necessary. To date, they have not been designed as binding air concentration or deposition values. CL indicate the total input rate below which adverse effects on ecosystems and human health (paths atmosphere-soil-groundwater for drinking water use and atmosphere-soil-food wheat (only for Cd)) can be excluded in the long term according to current knowledge. Consequently, if CLs are complied with, risk minimisation is achieved below the classic danger threshold, which means that the assessment values are very precautionary.
The CL concept focuses on the budgets of substances in ecosystems. Ecosystem specific features (soil, climate, use, etc.) are taken into account when calculating the critical load values. As a result, there is not only one CL, but rather a range of values that allows a comprehensive, regionalised representation of the sensitivity of ecosystems, food crops, and drinking water to HM.
In addition to natural and semi-natural ecosystems, agricultural land is also considered both as ecosystems and as areas where human and eco-toxicological values must be respected. CL aimed at protecting ecosystems are hereinafter referred to as CL(M)eco. CL aiming at protecting human health, e.g., drinking water, are abbreviated CL(M)drink and those aimed at protecting food for humans CL(M)food, where (M) stands for heavy metal and can be replaced by the respective element symbol (Cd, Pb, Hg, …). The determination of CL(M)eco was based exclusively on eco-toxicological threshold values. This means that the CL(M)eco were determined on the basis of effects. Experimentally determined zero effect threshold values (NOEC or PNEC) were used as “critical limits” in the calculation of the CL(M)eco. For the CL(M)drink, internationally agreed critical concentrations were used in drinking water and for CL(Cd)food in food wheat.
For Germany, an assessment of the input rates into ecosystems in the equilibrium of inputs and outputs will be carried out according to the CL concept [34]. Their mapping for Germany is carried out on a scale of 1:1 million and provides an overview of the sensitivity of terrestrial ecosystems to nine HM. Ecosystem integrity and human health are regarded as protection goals.
By definition, CL for HM are the highest total input rate of HM under consideration (from atmospheric deposition, fertilisers, and other anthropogenic sources) below which no long-term adverse effects on human health and on the structure and function of ecosystems are to be expected according to the current state of knowledge [7,8]. CL are calculated according to the mass balance approach assuming a chemical equilibrium in the system under consideration and a steady state at a concentration level defined by the critical limit. This is an impact-based derived limit concentration in certain ecosystem compartments below which significant adverse effects on human health as well as on defined sensitive components of ecosystems can be excluded according to the current state of knowledge.
Cd has been identified as an important pollutant in relation to the maintenance of food quality for the protection of human health. With this metal, uptake from the soil into the vegetation is comparatively high, so that accumulations in the soil entail the potential danger of health effects via plant food. Wheat was selected as the indicator plant. Wheat grain accounts for a significant proportion of food in Germany (as in Europe) and its cultivation accounts for a large proportion of agricultural land in Germany (and other European countries) [41]. CLs for the protection of drinking water are mapped for all ecosystem types. CL were therefore determined for three objects of protection:
  • CL(M)eco: Critical Load for a metal (M stands for As, Cd, Cu, Cr, Hg, Ni, Pb, Zn,) to protect the sensitive biota of the ecosystem;
  • CL(M)drink: Critical Load for a metal (M stands for As, Cd, Cu, Cr, Hg, Ni, Pb, Zn) for Protection of drinking water for human beings;
  • CL(Cd)food: Critical Load for Cd for the protection of arable crops (here: wheat-producing as a food for human beings.

2.2.3. Calculation of Critical Loads for Heavy Metals in Germany

The methodological approach for the calculation of CL for HM in this study follows [7,8] (Chapter V.5). All relevant fluxes into or from a certain soil layer, in which the essential substance conversions occur or in which the receptors have their distribution focus and which is therefore relevant for the effects in the system, were compared. The consideration of HM fluxes, reserves, and concentrations refers to mobile or potentially mobilizable metals, only they are relevant for the consideration of substance fluxes.
The mass balance equation includes as output paths from the terrestrial ecosystem the uptake into the biomass with subsequent harvest and the output with the leachate flow as follows:
CL(M) = M_u + M_le(crit)
where:
  • CL(M) = Critical Load of the metal M (g ha−1 a−1)
  • Mu = Net uptake of the metal M into harvestable plant parts (g ha−1 a−1).
  • Mle(crit) = Tolerable (critical) leaching of the metal M from the considered soil layer with exclusive consideration of vertical rivers (leachate) (g ha−1 a−1).
The inclusion of further terms was in accordance with the recommendations of the Expert Panel for HM to the ICP Modelling & Mapping [41,42]. For the CL calculation, the necessary data were spatially linked with GIS software ArcView, 10.2.1 and transferred to an Access 2000 database. Both original data such as precipitation and derived data such as values for the organic matter content (OM) and pH values derived from the land use-differentiated soil overview map of Germany, 1:1,000,000 BÜK1000N were used. The storage, evaluation, and presentation of the data were performed in polygons, which result from the intersection of the input data.
Identifying the geographical distribution and magnitude of total (the sum of wet and dry) deposition of atmospheric pollutants is crucial to determine the areas, populations, ecosystems, and farmlands that are most vulnerable to its negative effects and that would most benefit from measures to control excessive pollutant loads. To this end, the relevance of HM deposition for ecological integrity and human health in terms of CL were compared to the respective atmospheric deposition modelled with the chemical transport model LOTOS-EUROS. CL and CL exceedances by modelled atmospheric deposition were mapped for Germany on a scale of 1:1 Mio.
The deposition dataset [18] contains information on the concentrations and deposition fluxes of various HM (As, Cd, Cr, Cu, Ni, Pb, V, Zn) for the years 2009, 2010, and 2011. The deposition data sets (dry and wet) were combined to the total deposition, converted into the unit of measure of the critical load [g ha−1 a−1] and blended with the critical load receptor areas. The CL exceedance rates were calculated as follows:
MinExcCL(M)eco = (MinMdep + MinMfertilizer)-CL(M)eco
and
MaxExcCL(M)eco = (MaxMdep + MaxMfertilizer)-CL(M)eco
where:
  • MinExcCL(M)eco = Minimum ecosystem critical loads exceedance in the German receptor areas due to total deposition from the air and fertiliser inputs
  • MaxExcCL(M)eco = Maximum ecosystem critical loads exceedance in the German receptor areas due to total deposition from the air and fertiliser inputs
  • MinMdep = Minimum of the total deposition from the air in the German receptor surfaces, corresponds to the highest minimum of the three years 2009–2011
  • MaxMdep = Maximum of total deposition from the air in the German receptor surfaces corresponds to the highest maximum of the three years 2009–2011
  • MinMfertilizer = Minimum of the metal inputs with the fertilization in the German receptor surfaces
  • MaxMfertilizer = Maximum of the metal inputs with the fertilization in the German receptor areas
  • CL(M)eco = Median of the Ecosystem Critical Loads for the metal in the German receptor surfaces

2.2.4. Modelling Heavy Metal Deposition

The deposition dataset was produced by use of the chemical transport model LOTOS EUROS [18] and contains information on the atmospheric concentrations and deposition of various HM (Cd, Pb, Ni, As, Zn, Cu, V, and Cr) for the years 2009, 2010, and 2011. The data include information on the centroid coordinates of the degree cells with the deposition data. The modelled data for Cd and Pb were provided in the 0.125° × 0.0625° network of the Long/Lat system and the data for the other HM in the 0.5° × 0.25° resolution. The methodology of the deposition calculation is explained by Schaap et al. [18], where the different scales of the deposition data were also justified. The available point data (centroids of the grid cells and intersection points of the grid cells) were assigned to the planar degree grid, which has the corresponding mesh size of the respective resolution. This step was necessary to compare the deposition data with the critical load data set.
The datasets on dry and wet atmospheric deposition were combined to the total deposition, converted into the unit of measure of the CL (g ha−1 a−1) and blended with the critical load receptor areas covering Germany. After a detailed examination of all years (2009, 2010, and 2011) for all heavy metals, the data for 2010 turned out to be the highest. For this reason, the full-year presentation is limited to 2010.

3. Results and Discussion

3.1. Trends of HM Bioaccumulation Integrating Metal Elements and Surveys 1990–2015

The surveys integrating metal concentrations classified by use of percentile statistics (Section 2.1.) were transformed to scores ranging from 1 to 10 and aggregated for each of the 3 km by 3 km grid cells covering Germany. Based on this procedure a Multi Metal Index (MMI) encompassing all data collected in the framework of EMS 1990 to 2015 and integrating Cr, Cu, Fe, Ni, Pb, V, and Zn (MMI90-2015) and MMI95-2015 (Al, As, Cd, Cr, Cu, Fe, Hg, Ni, Pb, Sb, V, Zn) was calculated and mapped (Figure 2).
In the following, the spatial patterns depicted in Figure 2 are summarized and the median MMI values for Germany are referred to. Thereby, the geostatistically estimated median MMI are added in squared brackets by those calculated from the sample point measurements. In 1990, almost the whole territory of Germany is covered by MMI90-2015 values exceeding MMI = 6.0 (median 8.3 [7.7]). The survey 1995 (median = 7.3 [6.7]) indicated a slight area-wide decline of the MMI compared with that conducted in 1990. This trend was continued in the survey 2000 (median = 4.6 [4.4]). However, from 2000 to 2005, this trend changed and the MMI increased (median = 5.3 [5.1]) due to increasing bioaccumulation of Cr, Hg, Sb, and Zn. Until the survey in 2015, again a Germany-wide decrease of MMI90-2015 could be corroborated (median = 1.7 [2.0]). In 2015, areas with MMI90-2015 exceeding 4.0 could only be determined for North Rhine-Westphalia and the upper Rhine valley (Baden-Wuerttemberg) (Figure 2 Above).
The maps depicting the spatial patterns MMI95-2015 integrating Al, As, Cd, Cr, Cu, Fe, Hg, Ni, Pb, Sb, V, and Zn measured in moss sampled 1995–2015 (Figure 2 Below) also indicate a clear decrease between 1995 and 2000 from 7.5 [6.6] to 5, 1 [4.8]. From 2000 to 2005 the MMI90-2015 turned to 5.3 [5.0]. Finally, during the years 2005–2015 the MMI95-2015 decreased to 2.0 [2.3]. The spatial patterns and hot spots of MMI95-2015 are similar to MMI90-2015 with correlation coefficients (Spearman) between rs = 0.83 (year 2015, p < 0.01) and rs = 0.98 (year 2000, p < 0.01) and highest values in the Ruhr region (North Rhine-Westphalia) and in the upper Rhine valley (Baden-Wuerttemberg).
The element and surveys integrating trends of bioaccumulation of HM atmospheric deposition depicted in Figure 2 and described the two preceding paragraphs can be explained by looking at the element- and survey-specific quantiles (Section 2.1.) and at the element-specific quantiles integrating surveys (Section 2.1.). From that we can derive information identifying the elements with a decreasing but discontinuous trend (Table 3).
N, which is not in the focus in this review, did not show any statistically significant time trend from 2005 to 2015 but a change of the geographical location of its hot spots. Regarding the development of Cd, Cr, Hg, and Pb accumulation in moss since 2005, a Germany-wide decrease could be detected and proved as statistically significant (p < 0.05). In terms of median values, the decline of HM bioaccumulation ranged between −4% (Hg) and −50.4% (Pb). The same tendency could be corroborated for comparisons between EMS 2015 values with those in the first year of sampling. Since 1990 (in case of Hg since 1995) the median values of all HM were reduced significantly. The most distinct decline was found for Pb (−85.9%) and the lowest for Hg (−20%). The trends for Cd and Pb are in line with respective emission data covering the period 1990 to 2015 [43]. For Cd, the Spearman correlation coefficient rs > 0.3 (p < 0.01) was also found between concentrations in moss sampled in 2005 and according modelled atmospheric deposition, which was calculated by use of LOTOS-EUROS chemical transport modelling. The same holds true for Pb (Section 3.2). According to [43] emissions from metallurgy (Cd, Ni, and Pb), power economy (As, Cd, Ni, and Pb), manufacturing and constructing industry (As, Ni, and Pb), and traffic (Pb, due to the compulsory introduction of unleaded petrol in 1988 in Germany and 2000 in the EU) declined since 1990. However, the decrease of Hg bioaccumulation is less than the reduction of Hg emissions [43]. This is possibly due to long-range transport of gaseous Hg and atmospheric residence times of 6 to 18 months [18]. The concentrations of Cu and Zn in moss contradict the emission trends. At least for Cu, the Spearman correlation between the concentration in moss collected in 2005 and the modelled atmospheric deposition is rs 0.22 (p < 0.01), for Zn, respectively, rs < 0.2 (p < 0.01). For Cr, good agreement could be identified between the emission trends [43] and the concentrations in moss during the period 1990 to 2015. Strikingly, the Cr concentrations in moss were extraordinarily high in 2005, especially in Mecklenburg-West Pomerania and conurbations such as Bremen, Hamburg, Dresden, Halle/Leipzig, and the Ruhr region. Respective increased values were also reported from Austria.

3.2. Atmospheric Heavy Metal Deposition

The ranges of modelled HM deposition in Germany for the year 2010 [18] are shown in Table 4. For Hg, deposition data in Germany are only available as modelled EMEP data 2013 on a 50 × 50 km² grid (EMEP 2015) 5–95 [10,11]. The ranges of the 5th percentile to 95th percentile vary from 0 to 0.76 g ha−1 a−1 for deciduous forest, from 0.16 to 0.87 g ha−1 a−1 for coniferous forest, from 0.8 to 0.35 g ha−1 a−1 for acre, from 0 to 0.31 g ha−1 a−1 for marshes, from 0.08 to 0.34 g ha−1 a−1 for grassland, and from 0.08 to 0.34 g ha−1 a−1 for grassland. For Thallium deposition data are not available for the whole of Germany, but only from a few measuring stations.

3.3. Heavy Metal Inputs from Other Sources

In addition to the atmospheric inputs of HM presented in Section 3.2, the following other input pathways play an important role in soil pollution. The respective values were collected by Knappe et al. [44] from nationwide surveys and they are given in Table 5:
  • Application of mineral and organic (“farm”) fertilisers containing HM on agricultural land (arable land and intensive grassland);
  • Application of pesticides containing HM on agricultural land;
  • Application of lime fertilizers containing HM in forests.

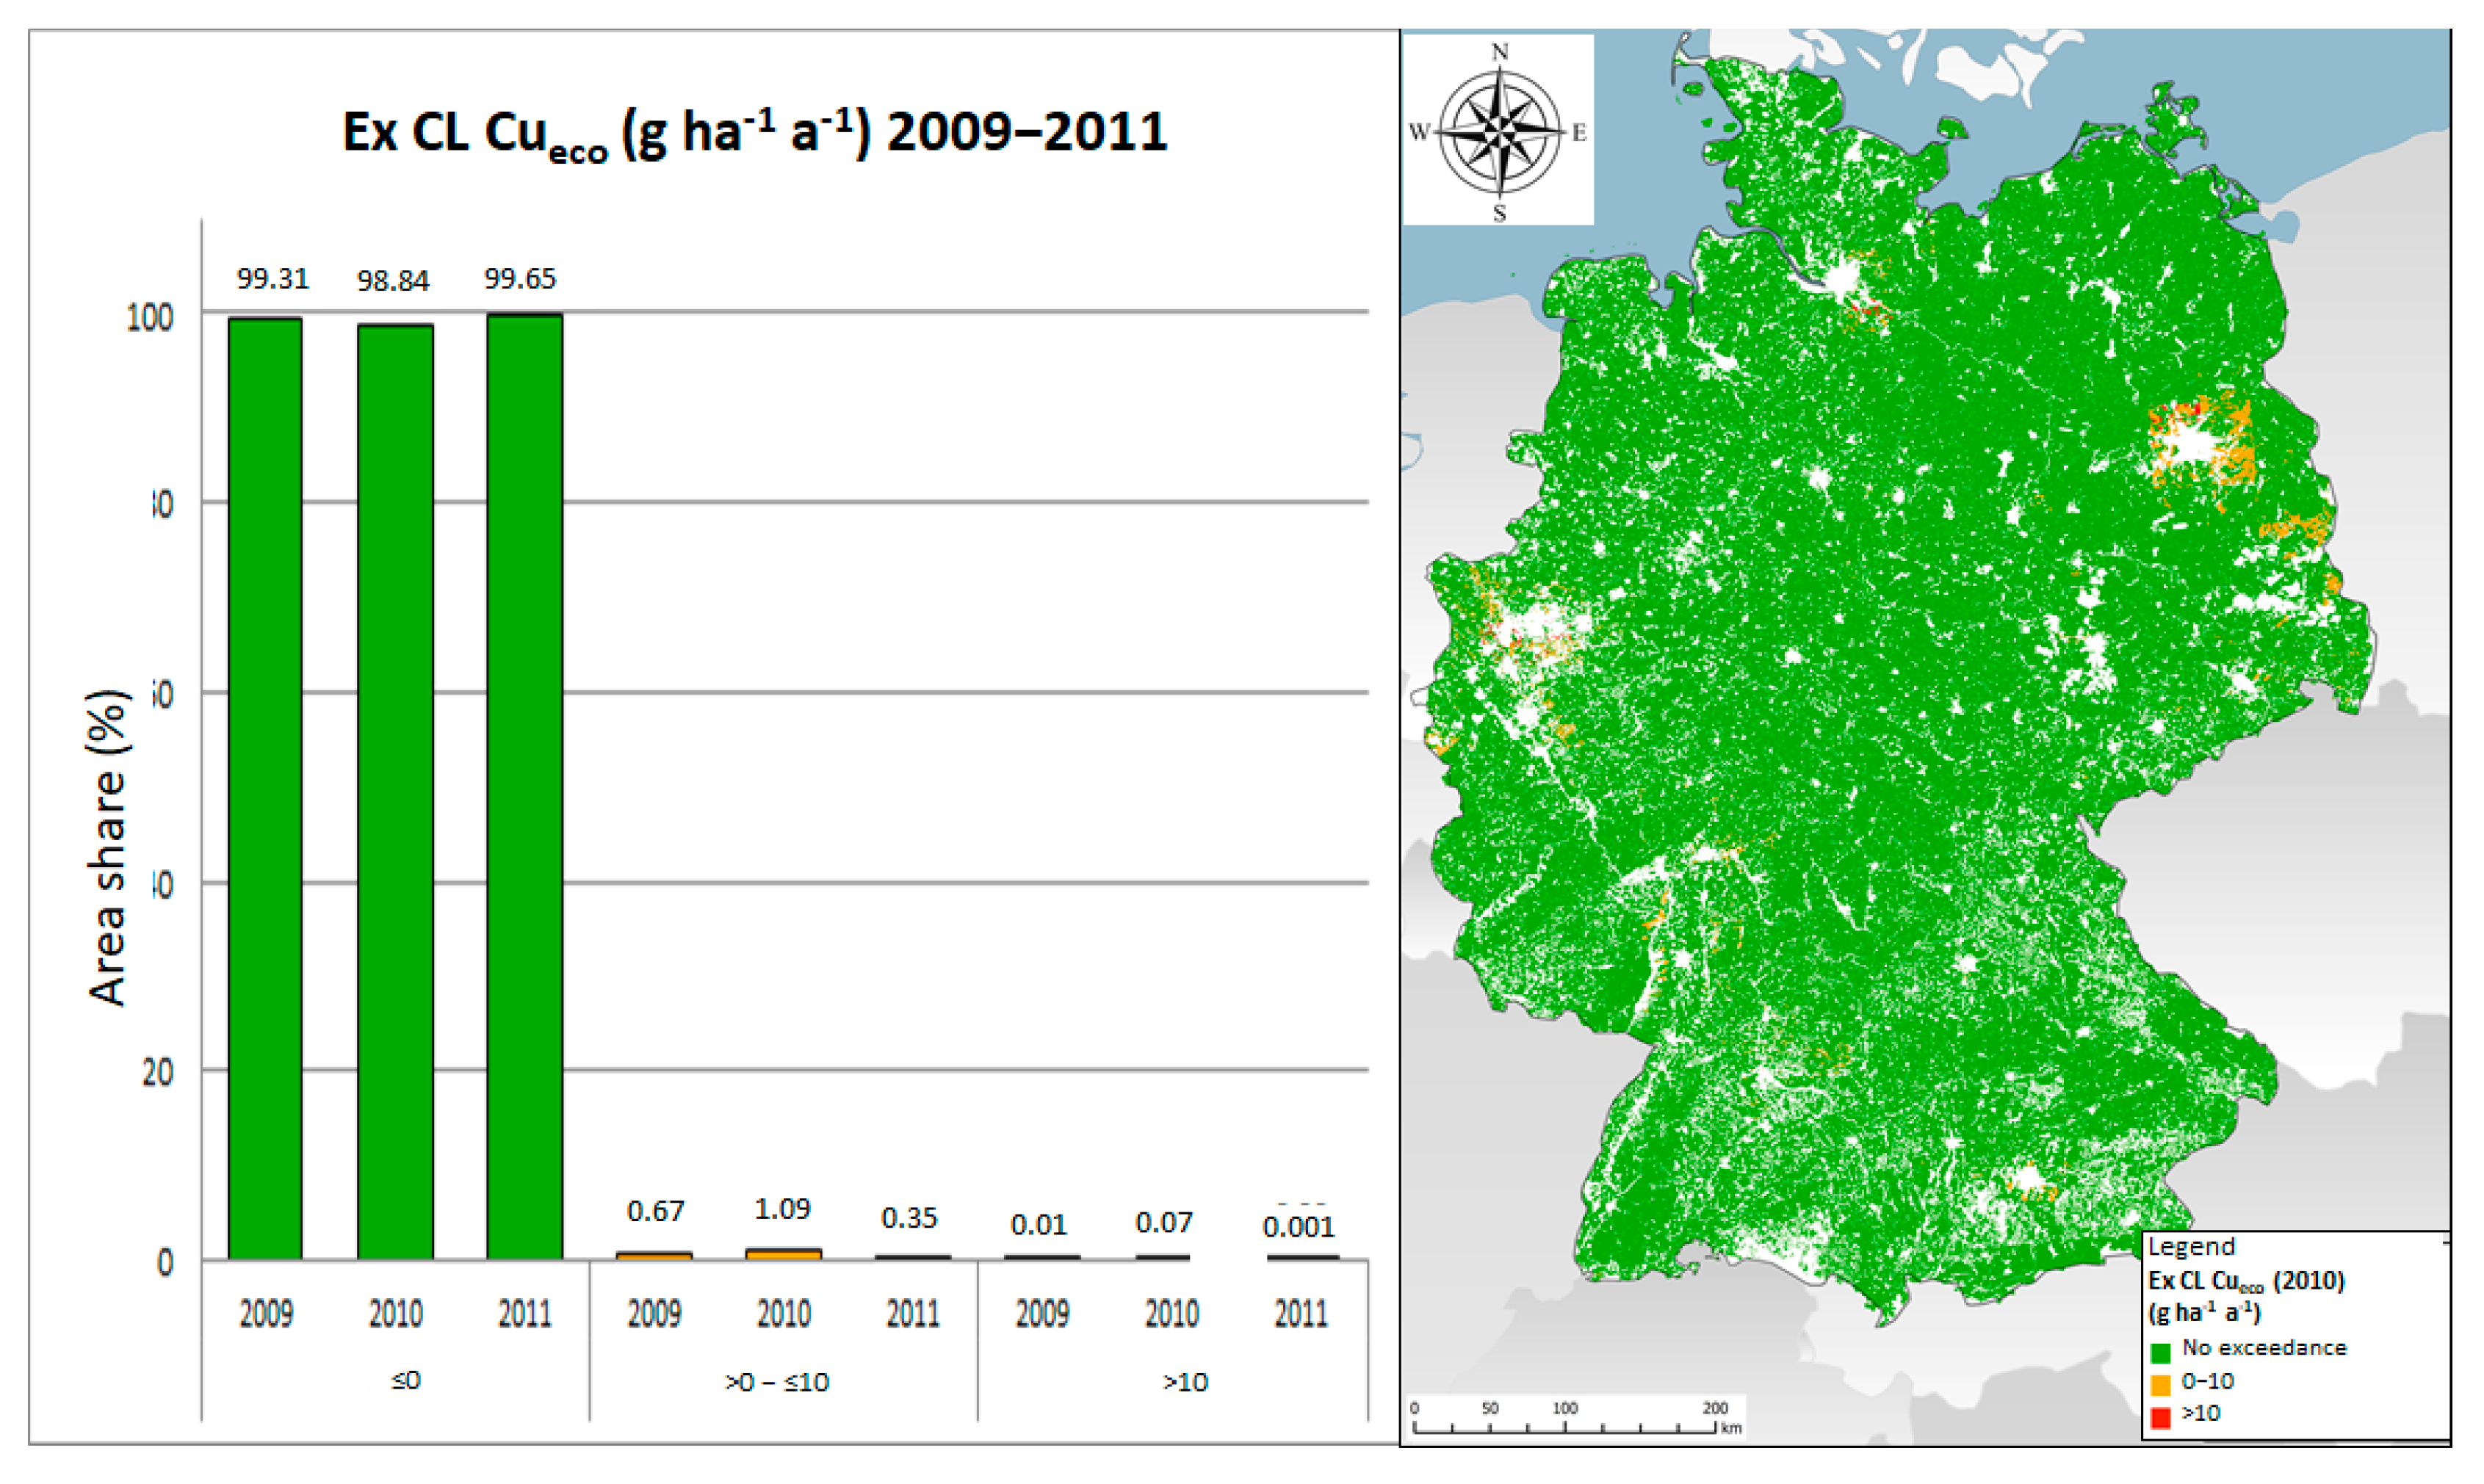
3.4. Critical Load Exceedances Due to Atmospheric Deposition

After comparing the deposition data available from this study for 2009–2011 [18] with the respective CL, three exceedances occurred: Pb (drinking water and ecosystem protection) and Cu (ecosystem protection) (Figure 3, Figure 4 and Figure 5). The critical load exceedance for Pb deposition from air with the protection target drinking water quality can only be expected on a relatively small receptor surface. Between 1.32% (2011) and 2.44% (2010) of the receptor surface have an increased risk for drinking water quality due to airborne pollutant deposition of Pb. Critical load exceedance with airborne Cu deposition with ecosystem integrity as a protection target is also relatively low. The values vary between 0.35% (2011) and 1.16% (2010) of the receptor areas. A significantly higher proportion of land is affected by a critical load exceedance in airborne Pb deposition with the protection objective of ecosystem integrity. Here, space shares between 5.18% (2011) and 14.36% (2010) are achieved. In absolute terms, this corresponds to 14,494 km² (2011) and 40,181 km² (2010). The focus is on the Leipzig and Thuringian basins, the loess areas (including the northern Harz foothills and the Lower Saxony area), the Erzgebirge foothills, the Lower Saxony highlands, parts of the Mecklenburg Lake District backcountry and parts of the Ruhr area (Lower Rhine lowlands and Cologne Bay). These areas are already identified as particularly sensitive to Pb deposition. Maps of the exceedance rates of the CL for Pb (drinking water and ecosystem protection) and Cu (ecosystem protection) are shown in Figure 3, Figure 4 and Figure 5. There is no need to map exceedances of other CL as there are no exceedances of these CLs in 2010.
These results based on the deposition calculations with the LOTOS-EUROS model differ significantly from the deposition calculations with the EMEP model [18]. The LOTOS-EUROS model consistently results in lower medians and maxima than EMEP. The EMEP/LOTOS-EUROS ratios correlate very strongly with the deposition height, i.e., where EMEP calculates particularly high deposition (e.g., Pb in the Ruhr area or Cd in North Rhine-Westphalia), the differences between the two models are also highest. Conversely, the low deposition calculated with LOTOS-EUROS, e.g., at altitudes in southern Bavaria, is higher than with EMEP (Cd: 45% higher, Pb: 12% higher).
The integrative analysis of the LOTOS-EUROS models (2005, 2007–2011, Germany) with the geostatistical area estimates of the heavy metal contents in moss (EMS, 2005, Germany) showed stronger statistical correlations than the correlation with measured concentrations in moss [24]. For Cu, the correlation is weak. At Pb, the mean correlations to LOTOS-EUROS were stronger than to EMEP, but strongest to the arithmetic mean of LOTOS-EUROS and EMEP. It follows from this that if EMEP background deposition were applied, the proportion of areas with critical load exceedances would be higher. However, the comparison of the geostatistical area estimates of the heavy metal contents in moss with the EMEP results also leads to the conclusion that the LOTOS-EUROS results for the Pb deposition are closer to reality than the EMEP data and thus at least for Pb the exceedance rates shown above have lower uncertainties than when using EMEP deposition. The uncertainties of the LOTOS-EUROS results cannot be measured quantitatively, because there are not enough measurement data containing wet and dry deposition at the same time.

3.5. Statistical Evaluation of Critical Load Exceedances

In the following, the values for the total deposition for 2010 by Schaap et al. [18] and for Hg from the EMEP dataset for Germany 2013 are compared with the CL for 2016 (minimum, 5-percentile, 95-percentile and median). This comparison shows possible risks for ecosystems and human health for the areas that cannot be represented in the German data set due to its small scale. Since the 2010 deposition dataset shows higher average deposition than the 2009 and 2011 data sets for Germany, this comparison also tends to show more unfavourable conditions, so that the risk assessment is conservative.
The German datasets for CL and deposition were calculated on the basis of input data collected on a scale of 1:1 million. The mapping units of BÜK1000N, CORINE 2006 [45] and the site types classified by climate zones are not homogeneous in reality. They may contain sprays that are more sensitive to heavy metal ingress. The German dataset of CL 2016 [34] and the exceedances of CL in 2010 is therefore not applicable for large-scale area-based evaluations or even for site-specific statements. A rough orientation for individual sites can only be derived from the German dataset if it can be demonstrated that the same site conditions prevail for specific areas or sites as were used as a basis in the German CL(M) and deposition datasets. In order to nevertheless be able to derive a statement on the risks also for areas that cannot be represented at a scale of 1:1 million, the respective worst-case values are compared with each other, i.e., the lower range limit of the CL with the upper range limits of the deposition. It is assumed that the parameter values of the site types that are not representative in terms of area on a scale of 1:1 million and are not represented in the German data sets would not lie outside the ranges of the CL and atmospheric deposition in Germany.
The comparison of the ranges of CL and deposition shows the risk of whether and to what extent, in the worst case, further accumulation of HM in ecosystems or in groundwater or in the soil of wheat fields above the critical concentrations could take place if the annual deposition rates were to remain constant at the 2010 level in the future. However, it should be pointed out here that the deposition data used for comparison, which were determined on the basis of models throughout Germany [18], could be significantly higher locally, e.g., on areas with industrial and/or traffic concentrations or in the vicinity of a particularly high-emission plant.

3.5.1. Hg

Since no Germany-wide deposition calculations including dry deposition for Hg are available [17], the assessment of the total atmospheric load situation can only be made on the basis of the EMEP deposition mapping [10,11] (Table 6).
Based on the evaluation of the EMEP total deposition values in a 50 km × 50 km grid [10,11], it can be assumed that a proportion of Germany’s ecosystem receptor areas, i.e., those with high to medium sensitivity, are contaminated by Hg inputs above the critical load. Sensitive ecosystem types include in particular the unused deciduous forests of dry, nutrient-poor sites such as dry oak forests in the arid regions of Brandenburg and Saxony-Anhalt or beech forests along the coasts. The CL for drinking water protection in Germany are also clearly exceeded in the worst case. This means that in the worst case, Hg can accumulate in the soil or groundwater as soon as the critical limits in soil and soil water have been reached. However, the buffer capacity of the humus-rich forest soils in particular is very high for Hg, so that actual damage to ecosystem compartments, even if CL are exceeded, may only be expected after decades or centuries.

3.5.2. Cd

The comparison of the Germany-wide raster maps of the total deposition of Cd in 2010 determined by Schaap et al. [18] with the CL determined in this study is given in Table 7.
The maximum atmospheric deposition in 2010 may have exceeded the CL for the protection of ecosystems, drinking water, and food in a few areas if maximum deposition rates hit areas with very low CL (<2.3 g ha−1 a−1). This means that in the worst case an unacceptable accumulation of Cd in soil and drinking water could occur as long as the deposition is above the respective critical load and the critical limits have already been reached. However, when the inputs from atmospheric deposition and fertilisers are determined summarily, there is a risk that arable land will be exceeded if maximum total inputs are applied to high to average sensitive soils.
The comparison of the maximum inputs of Cd by fertilisation with CL(Cd)food shows that risks to human health from the consumption of wheat products of German origin cannot be excluded, since an intolerable increase in the Cd content in the soil can at the same time lead to an intolerable increase in the Cd content in the wheat grain [44].

3.5.3. Pb

The comparison of the Germany-wide raster maps of the total deposition of Pb in 2010 calculated by Schaap et al. [18] with the CL determined in this paper is shown in Table 8.
The maximum atmospheric deposition in 2010 has exceeded the CL for the protection of ecosystems and drinking water in a large part of the areas. This means that an unacceptable accumulation of Pb in soil and especially in drinking water occurs as soon as the critical limits in soil and soil water are reached. When the inputs from atmospheric deposition and fertilization are determined summarily, there is an excess risk for all arable land and grassland if maximum total inputs are applied to high to medium sensitive soils.

3.5.4. As

Table 9 compares the grid maps of the total deposition of As in 2010 calculated throughout Germany by Schaap et al. [18] with the CL determined in this study.
Even in the worst case (maximum deposition meets minimum CL), the CL for the protection of ecosystems and drinking water are clearly undercut. Even if the fertiliser inputs in the maximum are added to the total atmospheric inputs in the maximum, the CL for ecosystem or drinking water protection are not exceeded. If, in the critical load calculation for ecosystem protection, the minimum threshold [46] used instead of the critical concentration in the leachate according to Doyle et al. [47] (cited in: [48]), a minimum critical load of 2.9 g ha−1 a−1 would be obtained. In the worst-case scenario, this minimum would also not be exceeded by the maximum deposition. The same applies to the alternatively calculated minimum critical load for drinking water protection.

3.5.5. Cu

The comparison of the grid maps of the total deposition of Cu in 2010 calculated by Schaap et al. [18] throughout Germany with the CL determined in this paper is shown in Table 10.
The maximum atmospheric deposition in 2010 [18] has exceeded the CL for ecosystem protection on part of the areas. This means that there will be an unacceptable accumulation of Cu in soil and/or groundwater as soon as the critical limits in soil are exceeded. When the inputs from atmospheric deposition and fertilisation are determined summarily, there is an exceedance risk for all arable land and grassland when maximum total inputs meet high to average sensitive soils.

3.5.6. Zn

The comparison of the grid maps of the total deposition of Zn in 2010 calculated by Schaap et al. [18] throughout Germany with the CL determined in this paper is shown in Table 11.
Even in the worst case (maximum deposition meets minimum CL), the CL for the protection of ecosystems and drinking water are barely undershot. The minimum inputs of Zn with fertilisers are already so high that there is a high risk of the CL for ecosystem protection being exceeded for all arable land and grassland. Since limit concentrations for Zn in drinking water are not specified, a critical load for drinking water protection cannot be determined.

3.5.7. Cr

The comparison of the grid maps of the total deposition of Cr in 2010 calculated by Schaap et al. [18] throughout Germany with the CL determined in this paper is shown in Table 12.
The maximum atmospheric deposition in 2010 may not have exceeded the CL for the protection of ecosystems and drinking water in any area. This means that in the worst case there is no unacceptable accumulation of Cr in soil and drinking water. If, in the critical load calculation for ecosystem protection, instead of the critical concentration in the leachate according to Crommentuijn et al. [49] (cited in: [48]), the minimum threshold [46] was used as an alternative, a minimum critical load of 2.1 g ha−1 a−1 would be obtained. In the worst case, however, this minimum would be exceeded by the maximum deposition. The same applies to the alternatively calculated minimum critical load for drinking water protection. There is also an exceedance risk for a part of the arable land in Germany when the entries from atmospheric deposition and fertilisation are determined summarily, if maximum total entries hit soils with high to average sensitivity.

3.5.8. Ni

Table 13 compares the grid maps of the total deposition of Ni in 2010 calculated by [18] throughout Germany with the CL determined in this study.
The maximum atmospheric deposition in 2010 may not have exceeded the CL for ecosystem protection in any area. This means that in the worst case there is no unacceptable accumulation of Ni in the soil. Since limit concentrations for Ni in drinking water are not specified, a critical load for drinking water protection cannot be determined. There is no risk that the CL for the protection of forest, arable and grassland ecosystems will be exceeded when the inputs from atmospheric deposition and fertilisation are summarily determined, even if maximum total inputs would occur on high to average sensitive soils. If instead of the WHAM modelling results [50] for the critical concentration in leachate, the critical load calculation for ecosystem protection were to alternatively use the minimum threshold [46], a minimum critical load of 7.9 g ha−1 a−1 would be obtained. In the worst case, this minimum would also not be exceeded by the maximum deposition. The same applies to the alternatively calculated minimum critical load for drinking water protection.

3.5.9. Tl

CL for Tl for the protection of ecosystems cannot yet be determined, because there is no valid database for the derivation of impact-based ecosystem critical limits. A provisional rough estimate of the risk of Tl inputs into Germany’s receptor ecosystems can be based on a calculated balance of inputs and outputs in the ranges typical for Germany (Table 14).
The average Tl content in vegetable biomass on unpolluted soils is 0.05 g t−1 dry matter [51]. Thus, the range of Tl outputs with the biomass harvest is obtained by multiplying this typical concentration in plant stands of unpolluted soils by the minimum and maximum yields in Germany. In leachate, the minimum threshold of 0.0002 g m−3 [46] may be used as a critical limit. This threshold value is an ecotoxicologically determined threshold value for a Tl limit concentration.
Since no nationwide deposition surveys are available, no assessment of the pollution situation can be made. However, a measuring station in Dortmund, for example, recorded an annual average concentration in 2013, which converted into a deposition rate of 0.15 g ha−1 a−1 [52]. This value is within the range for the acceptable discharge rate. Thus, a risk cannot be excluded that sensitive ecosystems could be overburdened in the long term.

3.5.10. V

CL for V for the protection of ecosystems cannot yet be determined because there is no valid database for the derivation of impact-based ecosystem-critical limits. A provisional rough estimate of the risk of V inputs into Germany’s receptor ecosystems can be based on a calculated balance of inputs and outputs in the ranges typical for Germany (Table 15).
Biomass harvesting is one of acceptable cutting methods. The average V content in vegetable biomass can be assumed to be 0.7 g t−1 dry matter [53]. The ranges of the V outputs with the biomass harvest then result from multiplying this typical concentration in plant stands of unpolluted soils with the minimum and maximum yields in Germany. Furthermore, leaching with the seepage can be taken into account as an acceptable discharge, whereby the critical concentration of the metal in the leachate can be assumed to be the negligibility threshold of 0.004 g m−3 [46]. This human-toxic threshold value is lower than the ecotoxicological threshold value for a V limit concentration.
The maximum deposition 2010 [18] for forest and grassland is slightly above the minimum acceptable deposition. In the worst case (maximum deposition meets areas with minimal cut-offs), a risk of impairment of ecosystem functions cannot be ruled out.

3.6. Comparison and Discussion of Assessment Values, Risk Assessment of Heavy Metal Inputs

When comparing the deposition calculated by Schaap et al. [18] as an area-wide dataset for Germany with the assessment values, the differences between the calculation results of the deposition (with EMEP model, LOTO-EUROS model, derived from mosses) and between assessment values are of great importance. The dataset for MH deposition calculated for Germany corresponds methodically roughly to the German dataset for the total deposition of N, which is used for the assessment of environmental impacts of projects and plants as the data basis for determining the background deposition. However, such an application is not recommended for the datasets of the total heavy metal deposition due to the high uncertainties [18]. However, it is in line with expectations that this background deposition will not exceed assessment values for the assessment of the environmental impacts of plants or projects.

3.6.1. Protection of Human Health

Comparing the assessment values based on human toxicological thresholds and relating to the total general exposure with the corresponding airborne input rates (for Hg: EMEP deposition grid data for 2013; for all other metals deposition grid data for 2010 from Schaap et al. [18], then the following undercuttings and exceedances become obvious (Table 16). A comparison of the plant-related assessment values for deposition according to TA Luft [36] with the background loads does not provide any information on the currently existing risks and is therefore not made in the following section. Alternatively, it is indicated to what extent the background deposition already exhausts the values according to Table 6 or Table 8 of the TA Luft [36] or comparable assessment values.
Although the immission limit values and target values of the 39th Federal Immission Control Ordinance [38] are in principle suitable as assessment values for endangering human health, the concentrations stated are not directly comparable with the deposition of the German dataset. If the concentrations are converted into input rates using the mean deposition velocities in the various vegetation complexes, taking into account the proportions of coarse and fine fractions in the dust, different permissible input rates are obtained for coniferous and deciduous forest and for arable land.
The EU Position Paper [54] specifies immission target values (concentrations in the particulate matter fraction PM10) for As, Cd, and Ni. For Cd, a deposition threshold derived from concentration values is also proposed. These are proposals derived from human toxicological data. These assessment values are therefore suitable for the risk assessment of total entries for human health. The assessment concentrations for As and Ni were converted into allowable input rates as indicated above. For the protection of drinking water, the CL (CL(M)drink) for the atmospheric total heavy metal inputs for the German receptor surfaces on a scale of 1:1 million were determined as assessment values for the assessment of the CL(M)drink, in which the limit concentrations from the German Drinking Water Ordinance [55] were included as critical threshold values. These are identical to the corresponding limit concentrations of the WHO guideline [56]. The CL for drinking water protection were determined taking into account the different leachate rates and vegetation types. In this respect, they show a higher degree of differentiation than the absolute assessment values of the 39th BImSchV [38] and the TA Luft [36]. Entries at the CL level lead to an equilibrium between total input and unpolluted output and thus guarantee the precautionary avoidance of an accumulation of HM in drinking water above the limit values. Thus, the following differentiated picture emerges with regard to the risk to human health from inputs of the individual HM under consideration.

Hg

The 39th BImSchV [38] and the EU Position Paper [54] do not contain assessment values for Hg. Based on the EMEP deposition grid map of Germany for the year 2013, the CL for drinking water protection CL(Hg) drink were exceeded in the German dataset 2016 [34] with a focus on southeast Brandenburg, northeast Saxony, and southwest Saxony-Anhalt. The maximum deposition exhausts the assessment value of TA Luft [36] (Table 6) to 22% and the assessment value of TA Luft [36] (Table 8) to 0.8%.

Cd

For the protection of plant food (wheat grain), a critical load for Cd inputs on wheat fields (CL(Cd)food) was determined as the assessment value, in which the Cd limit concentration for wheat was included in accordance with the recommendation of the manual [8,57]. This is half of the limit value set in the EU regulation (EC No. 1881/2006). The CL(Cd)food was not exceeded in 2010 by the atmospheric Cd deposition in the receptor surfaces of the German CL dataset 2016 [34]. However, it should be noted that only a fraction of the heavy metal load on agricultural soils results from the atmosphere. In particular, the comparison of Cd inputs by fertilisation with CL(M)food shows the risk of harmful accumulation in wheat fields. Since the current content of Cd in wheat correlates with the content in soil [44], there is currently a risk potential for human health from the consumption of wheat products of German origin. The CL for drinking water protection in the receptor areas of the German dataset 2016 [34] are not exceeded by the atmospheric deposition in 2010 (Table 4). In the German dataset 2016 [34], it may be possible that areas where maximum deposition rates meet a very low critical load (<2.3 g ha−1 a−1) (worst case) may not be mapped due to scale conditions. In these cases, the maximum atmospheric deposition in 2010 (Table 4) may have exceeded the CL for the protection of drinking water and food. This means that in the worst case, Cd may accumulate in drinking water and wheat products as long as the deposition is above the respective critical load and the critical limits are exceeded.
The CL(Cd)drink and CL(Cd)food are predominantly in the range of the range from the EU position paper [54], but also go deeper than this. The target value for the Cd entry from the EU position paper is far below the atmospheric deposition 2010 [18]. The maximum deposition exhausts the assessment value of TA Luft [36] (Table 6) at 27% and the assessment value of TA Luft [36] (Table 8) at 21%. If the assessment value for the concentration from the 39th BImSchV [38] were alternatively converted into a deposition, this would result in assessment values of 2.5–7 g ha−1 a−1, which would not be exceeded by the deposition in the German dataset or in the worst case. However, this is only an auxiliary calculation for a rough comparison of the exceedance rates of CL(M)drink and CL(M)food.

Pb

The CL for the protection of drinking water will be exceeded by atmospheric Pb deposition in 2010 [18] on 2.41% of the receptor areas in Germany, predominantly in the state of Brandenburg, in Leipzig and in the Ruhr area. This area proportion may be higher, since the German dataset 2016 [34] may not include areas where maximum deposition rates meet a very low critical load (worst case) (Table 8). The maximum deposition [18] exhausts 19% of the assessment value of the TA Luft [36] (Table 6) and 11% of the assessment value of the TA Luft [36] (Table 8). If the assessment value for the concentration from the 39th BImSchV [38] were alternatively converted into a deposition rate, this would result in assessment values of 250−716 g ha−1 a−1, which are not exceeded by the deposition of the German dataset [18] and also in the worst case.

As

The CLs for drinking water protection are not exceeded in the receptor areas of the German dataset 2016 [34] by the atmospheric deposition in 2010 [18]. Even in the worst case (maximum deposition rates meet the lowest critical load), which does not occur in the German dataset 2016 [34] but could occur on a larger scale, exceeding the CL for drinking water protection is ruled out. Even if a critical load calculation for drinking water protection is carried out alternatively on the basis of the minimum threshold value [46], the resulting minimum critical load in the worst case would not be exceeded by the maximum deposition. The Minority threshold [46] corresponds to the base value.
The maximum deposition exhausts 6% of the assessment value of the TA Luft [36] (Table 6) and 0.02% of the assessment value of the TA Luft [36] (Table 8). If the assessment value for the concentration from the 39th BImSchV [38] were alternatively converted into a deposition, this would result in assessment values of 2.5–6 g ha−1 a−1, which are not exceeded by the deposition of the German dataset and also in the worst case.

Cu

The CL for drinking water protection in the receptor areas of the German dataset 2016 [34] are not exceeded by the atmospheric deposition in 2010 [18]. Even in the worst case (maximum deposition rates meet the lowest critical load), which does not occur in the German dataset 2016 [34], but could occur on a larger scale, exceeding the CL for drinking water protection is ruled out.

Zn

The CL for drinking water protection in the receptor areas of the German dataset 2016 [34] are not exceeded by the atmospheric deposition in 2010 [18]. Even in the worst case (maximum deposition rates meet the lowest critical load), which does not occur in the German dataset 2016 [34] but could occur on a larger scale, exceeding the CL for drinking water protection is ruled out.

Cr

The CL for drinking water protection in the receptor areas of the German dataset 2016 [34] are not exceeded by the atmospheric deposition in 2010 [18]. Even in the worst case (maximum deposition rates meet the lowest critical load), which does not occur in the German dataset 2016 [34] but could occur on a larger scale, exceeding the CL for drinking water protection is ruled out. However, if a critical load calculation for drinking water protection was carried out alternatively on the basis of the minimum threshold value [46], the resulting minimum critical load would be exceeded by the maximum deposition [18] in the worst case.

Ni

The BTrinkwV [55] does not specify a limit concentration for Ni, therefore no critical load for drinking water protection is calculated in this study. If a critical load calculation for drinking water protection is carried out alternatively on the basis of the minimum threshold value [46], the resulting minimum critical load in the worst case would not be exceeded by the maximum deposition. The maximum deposition exhausts 12% of the TA Luft [36] (Table 6) assessment value.
If the assessment value for the concentration from the 39th BImSchV [38] were alternatively converted into a deposition, this would result in assessment values of 10–28 g ha−1 a−1, which would not be exceeded by the deposition of the German dataset and also in the worst case. If the target values of the EU position paper [54) are converted into deposition rates (5–72 g ha−1 a−1), in the worst case (maximum deposition meets minimum permissible input) there is an exceedance risk on arable land and grassland.

Tl

No limit concentration for Tl is specified in the BTrinkwV [55]. Therefore, no critical load for the drinking water protection CL(Tl)drink was calculated in this study. A human toxicological minimum threshold is also not available [46]. An exceedance of the immission values for heavy metal deposition according to TA Luft [36] (Table 6 and Table 8 ) by the diffuse total pollution from the long-distance transport of the metal in the atmosphere cannot be determined nationwide. However, the assessment values are far above, for example, the annual average concentration measurement values 2013 of the LANUV NRW [52] in Dortmund converted into deposition rates.

V

The BTrinkwV [55] does not specify a limit concentration for V. Therefore, no critical load for the drinking water protection CL(Ni)drink is calculated in this study. A risk assessment using an input/output balance based on a human toxicological minimum threshold [46] shows that a health risk cannot be safely excluded by the inputs in 2010.

3.6.2. Protection of Terrestrial Ecosystems (in Particular Soils) from Harmful Changes

If one compares the assessment values with the corresponding aerial input rates (for Hg: EMEP deposition grid data for 2013 [10,11]; for all other metals deposition grid data for 2010 according to [18], the following under- and overruns result (Table 17). However, the assessment of risks from airborne inputs on the basis of the assessment values from the various statutory regulations and recommendations must be considered taking into account different levels of protection, protection objectives, and impact thresholds. The assessment values of the TA Luft [36], the 39th BImSchV [38], and the EU Position Paper [54] are based on human toxicological threshold values but are also intended for the protection of plants and the environment in general, whereby it is assumed that the ecosystem compartments are not more sensitive than humans. After conversion of the permissible concentrations from the 39th BImSchV [38] into permissible annual input rates, there are no exceedances in 2010 due to the atmospheric background deposition [18]. The assessment values from the EU position paper [54] for Cd will not be exceeded in 2010, as will the assessment values for As after conversion. The converted lowest assessment values for Ni are exceeded in the worst case on fields and grassland.
At the same time, a comparison of the plant-related assessment values for metal inputs (assessment value according to LUA Brandenburg [58], TA Luft [36], permissible additional load according to BBodSchV [37]) with the background loads does not provide any information on the currently existing spatially widespread risks for ecosystems. The comparison can only serve to roughly estimate to what extent the permissible total load has already been exhausted by the background load. The uncertainties of the deposition mapping and its small scale do not permit concrete spatial statements for individual sites. It was therefore to be expected that the atmospheric entries for 2010 would not exceed the plant-related assessment values.
In the following, only the risks of terrestrial ecosystems, including soil, are discussed on the basis of assessment values based on ecotoxicological thresholds, i.e., from the BBodSchV [37], the Brandenburg enforcement aid for the FFH-habitats impact assessment [58] and the CL for ecosystem protection identified in Schröder et al. [34]. As the pathways of action of HM to all compartments of a terrestrial ecosystem usually run across the soil, the assessment values for the protection of soil functions can at the same time be regarded as relevant assessment values for the protection of ecosystems.
The CL for ecosystem protection [34] for the heavy metal inputs of Hg, Cd, Pb, As, Cu, Zn, Cr, and Ni (CL(M)eco) are differentiated by ecosystem type. The input values are determined soil- and vegetation-specifically. The critical threshold values (critical concentration in the soil for the maintenance of microbial functions, for the protection of plants, invertebrates, and soil microorganisms) are comparable with the criteria for determining the precautionary values in the Federal Soil Protection Ordinance [37]. However, the precautionary values of the BBodSchV [37] are stated as concentrations and are therefore not directly comparable with the flow rates of the CL.
According to current knowledge, compliance with CL(M)eco with the inclusion of all input paths permanently (for all time) excludes the possibility of risks arising, provided that the critical limits (critical concentrations in the indicators considered) have not yet been exceeded. If they have already been exceeded, compliance with the critical load leads to a long-term, gradual reduction up to the critical limits.
The assessment values of the ´Brandenburgische FFH-Vollzugshilfe´ [58] are given as maximum permissible concentrations in the soil. In addition, plant-related irrelevance thresholds can be calculated. A comparison of the permissible enrichment rate in 100 years with background deposition therefore also does not lead to a real risk assessment. In the following, therefore, only the extent to which the total permissible positions calculated in this way are already exhausted by the entries at background level is given.
In the following, an assessment of the risk of harmful changes in terrestrial ecosystems based on the current 2010 and 2013 HM deposition under consideration is nevertheless to be carried out, taking into account the limited comparability of the assessment values.

Hg

On the basis of the EMEP deposition grid map of Germany for 2013 [10], the CLs for ecosystem protection in the German dataset 2016 [34] are exceeded, with a focus on North Rhine-Westphalia, southeast Brandenburg, north-east Saxony, and southwest Saxony-Anhalt.
In addition, further diffuse Hg entries may have to be taken into account, which aggravates the situation. However, due to the high buffering capacity of the soils for Hg, it cannot be concluded from a CL(Hg)eco exceedance that there is an immediate risk.
The permissible annual additional load of Hg according to BBodSchV [37] in the amount of 1.5 g ha−1 a−1, if the precautionary value of the Hg concentration in the soil according to BBodSchV [37] has already been reached or exceeded, is far above the maximum of the EMEP deposition in 2013 [10,11]. Fifty-eight percent of the maximum atmospheric background deposition uses this value, but the permissible additional load also applies to all other input paths in total. The irrelevant plant-related additional load extrapolated from the irrelevance threshold according to LUA Bbg [58] using the example of a cambisol to 100 years is already 44% exhausted by the maximum atmospheric background deposition in 2013 [18].

Cd

The CL for ecosystem protection in the receptor areas of the German dataset 2016 [34] are not exceeded by the atmospheric deposition 2010 [18]. In the German dataset 2016 [34], it may be possible that areas where maximum deposition rates meet a very low critical load (<2.3 g ha−1 a−1) (worst case) may not be depicted due to scale. In these cases, the maximum atmospheric deposition in 2010 may have exceeded the CL for ecosystem protection. The permissible annual Cd input rate according to BBodSchV [37] of 6 g ha−1 a−1), if the precautionary value (Cd concentration in soil) according to BBodSchV [37] has already been reached or exceeded, is far above the maximum of the EMEP deposition in 2013 [10,11]. Thirty-nine percent of the maximum atmospheric background deposition uses this value, but the permissible additional load applies to all input paths.
The irrelevant plant-related additional load extrapolated from the irrelevance threshold according to LUA Bbg [58] using the example of a cambisol to 100 years is already 47% exhausted by the maximum atmospheric background deposition in 2010 [18].

Pb

The CL for Pb inputs for the protection of ecosystems are exceeded by the atmospheric deposition in 2010 [18] on 14.11% of the receptor areas in Germany, predominantly in the Leipzig and Thuringian bight, in the Harz foreland and in the Ruhr area. This area share may be higher, since the German dataset 2016 [34] may not include areas where maximum deposition rates meet a very low critical load (worst case). The permissible annual Pb input rate under the BBodSchV [37] of 400 g ha−1 a−1, if the precautionary value has already been reached or exceeded, is well above the maximum of the 2010 deposition [18]. The maximum atmospheric background deposition exhausts 22% of this value, but the permissible additional load applies to all entry paths. The irrelevant plant-related additional load extrapolated from the irrelevance threshold according to LUA Bbg [58] using the example of a cambisol to 100 years is used up by 11% by the maximum atmospheric background deposition in 2010 [18].

As

The CL for ecosystem protection in the receptor areas of the German dataset 2016 [34] are not exceeded by the atmospheric deposition 2010 [18]. Even in the worst case (maximum deposition rates meet the lowest critical load), which does not occur in the German dataset 2016 [34] but could occur on a larger scale, exceeding the CL for ecosystem protection is ruled out. Even if a critical load calculation for ecosystem protection was carried out alternatively on the basis of the minimum threshold value [46], the resulting minimum critical load in the worst case would not be exceeded by the maximum deposition [18]. A permissible additional annual input rate of As according to BBodSchV [37] is not specified.

Cu

In 2010 [18], the Cu deposits exceeded the CL(Cu)eco on 1.16% of the receptor areas in Germany, predominantly in the Berlin environs and the Ruhr area. This area proportion may be higher, since the German CL dataset 2016 [34] may not reflect areas where maximum deposition rates meet a very low critical load (worst case). The permissible annual input rate of Cu according to BBodSchV [37] of 360 g ha−1 a−1, if the permissible Cu concentration in the soil according to BBodSchV [37] has already been reached or exceeded, is far above the maximum of the deposition 2010 [18]. The maximum background deposition exhausts this value to 8%, but the permissible additional load applies to all input paths.

Zn

The CL for ecosystem protection in the receptor areas of the German data set 2016 [34] are not exceeded by the atmospheric deposition 2010 [18]. Even in the worst case (maximum deposition rates meet the lowest critical load), which does not occur in the German data set 2016 [34] but could occur on a larger scale, exceeding the CL for ecosystem protection is ruled out. The permissible annual input rate of Zn according to BBodSchV [37] of 1200 g ha−1 a−1, if the permissible Zn concentration in the soil according to BBodSchV [37] has already been reached or exceeded, is far above the maximum of the deposition in 2010 [18]. The maximum background deposition exhausts this value by 6%, but the permissible additional load applies to all input paths.

Cr

The CL for ecosystem protection in the receptor areas of the German dataset 2016 [34] are not exceeded by the atmospheric deposition 2010 [18]. Even in the worst case (maximum deposition rates meet the lowest critical load), which does not occur in the German CL dataset 2016 [34] but could occur on a larger scale, exceeding the CL for ecosystem protection is ruled out. However, if a critical load calculation for ecosystem protection was carried out alternatively on the basis of the minimum threshold value [46], the resulting minimum critical load would be exceeded by the maximum deposition in the worst case. The permissible annual input rate of Cr according to BBodSchV [37] of 300 g ha−1 a−1, if the permissible Cr concentration in the soil according to BBodSchV [37] has already been reached or exceeded, is far above the maximum of the deposition in 2010 [18]. The maximum background deposition exhausts this value by 1.3%, but the permissible additional load applies to all input paths.

Ni

The CL for ecosystem protection in the receptor areas of the German CL dataset 2016 [34] are not exceeded by the atmospheric deposition 2010 [18]. Even in the worst case (maximum deposition rates meet the lowest critical load), which does not occur in the German CL dataset 2016 [34], but could occur on a larger scale, exceeding the CL for ecosystem protection is ruled out. Even if a critical load calculation for ecosystem protection was carried out alternatively on the basis of the minimum threshold value [46], the resulting minimum critical load would not be exceeded by the maximum deposition [18] in the worst case. The permissible annual Ni input rate according to BBodSchV [37] of 100 g ha−1 a−1, if the permissible Ni concentration in the soil according to BBodSchV [37] has already been reached or exceeded, is far above the maximum of the deposition in 2010 [18]. The maximum background deposition exhausts this value by 7%, but the permissible additional load applies to all input paths.
The maximum atmospheric background deposition in 2010 [18] exploits 4.6% of the irrelevance threshold according to LUA Bbg [58] extrapolated from the example of a cambisol to 100 years of irrelevant plant-related additional pollution.

Tl

Since no nationwide deposition surveys are available, no assessment of the pollution situation can be made. However, a measuring station in Dortmund, for example, recorded an annual average concentration in 2013, which converted to a deposition rate of 0.15 g ha−1 a−1 [52]. A risk assessment by means of an input/output balance based on an ecotoxicological minimum threshold [46] shows that a risk cannot be safely excluded, at least in the Ruhr region. Tl is a highly toxic element for living organisms, comparable to the effect of Hg [59]. Tl is hardly transported in the soil and is thus strongly enriched in the rooted topsoil during prolonged input [59,60] states that 80% of anthropogenic Tl is stored in humus-rich topsoil. This results in an obviously neglected need for research. The impact-based derivation of assessment values and at the same time the inventory of the current deposition in Germany are urgently required.

V

A risk assessment by means of an input/output balance based on a human toxicological minimum threshold [46], which is lower than the ecotoxicological threshold determined, results in a health risk from the inputs in 2010 in the worst case. For example, the maximum deposition in 2010 [18] (Table 4) for forest and grassland is slightly above the minimum acceptable deposition. In the worst case (maximum deposition meets areas with minimal outcropping), a long-term risk of impairment of ecosystem functions cannot be ruled out. Assessment values for V are not given in the BbodSchV [37].

4. Future Research

The German Moss Monitoring 2020 does not continue the monitoring network 2015 and the range of measured elements except for POPs. This is a cause for concern, because in that way it is not possible to detect a trend reversal like for Cr, Sb, Zn, and standstill of concentrations of Al, As, Cd, Cu, Hg, Ni, V between 2000 and 2005. The Moss Survey 2025 should therefore again focus on the internationally agreed measurement spectrum (Al, As, Cd, Cr, Cu, Fe, Hg, Ni, Pb, Sb, V, Zn; N; POP). From a political and ecological point of view, not only increases in concentrations are worth reporting, but also standstills and (further) declines.

Author Contributions

Conceptualization, S.N., A.S., and W.S.; methodology, A.S.; data curation, S.N. and A.S; writing—original draft preparation, W.S.; writing—review and editing, W.S.; supervision, W.S.; project administration, W.S.; funding acquisition, W.S. All authors have read and agreed to the published version of the manuscript.

Funding

This research was funded by the Federal Environment Agency, Germany.

Institutional Review Board Statement

Not applicable.

Informed Consent Statement

Not applicable.

Data Availability Statement

The provision of data is in preparation.

Acknowledgments

We would like to thank Gudrun Schütze (Federal Environment Agency) for her constructive professional support of the project.

Conflicts of Interest

The authors declare no conflict of interest.

References

  1. Rutter, A.J. The hydrological cycle in vegetation. In Vegetation and the Atmosphere; Monteith, J.L., Ed.; Academic Press: London, UK, 1975; Volume 1, pp. 111–154. [Google Scholar]
  2. Dollard, G.J.; Unsworth, M.H.; Harvey, M. Pollutant transfer in upland regions by occult precipitation. Nature 1983, 302, 241–243. [Google Scholar] [CrossRef]
  3. Unsworth, M.; Wilshaw, J. Wet, occult and dry deposition of pollutants on forests. Agric. For. Meteorol. 1989, 47, 221–238. [Google Scholar] [CrossRef]
  4. Bak, J.; Doytchinov, S.; Fisher, R.; Forsius, M.; Grennfelt, P.; Harmens, H.; Hettelingh, J.-P.; Holmberg, M.; Jenkins, A.; Krzyzanowski, M. Impacts of Air Pollution on Ecosystems, Human Health and Materials under Different Gothenburg Protocol Scenarios; Report by the Working Group on Effects; LRTAP: Geneva, Switzerland, 2012; pp. 1–45. Available online: https://unece.org/fileadmin/DAM/env/documents/2012/air/WGE_31th/N_2_WGE-impact-report-2012-sept.pdf. (accessed on 22 January 2021).
  5. De Marco, A.; Proietti, C.; Anav, A.; Ciancarella, L.; D’Elia, I.; Fares, S.; Fornasier, M.F.; Fusaro, L.; Gualtieri, M.; Manes, F.; et al. Impacts of air pollution on human and ecosystem health, and implications for the National Emission Ceilings Directive: Insights from Italy. Environ. Int. 2019, 125, 320–333. [Google Scholar] [CrossRef] [PubMed]
  6. Wright, L.P.; Zhang, L.; Cheng, M.-D.; Aherne, J.; Wentworth, G.R. Impacts and effects indicators of atmospheric deposition of major pollutants to various ecosystems—A Review. Aerosol Air Qual. Res. 2018, 18, 1953–1992. [Google Scholar] [CrossRef] [Green Version]
  7. CLRTAP 2014. Guidance on Mapping Concentrations Levels and Deposition Levels, Manual on Methodologies and Criteria for Modelling and Mapping Critical Loads and Levels and Air Pollution Effects, Risks and Trends. UNECE Convention on Long-Range Transboundary Air Pollution. Available online: https://www.umweltbundesamt.de/en/manual-for-modelling-mapping-critical-loads-levels (accessed on 20 March 2015).
  8. CLRTAP 2017. Revision of Guidance on Mapping Concentrations Levels and Deposition Levels, Manual on Methodologies and Criteria for Modelling and Mapping Critical Loads and Levels and Air Pollution Effects, Risks and Trends. UNECE Convention on Long-Range Transboundary Air Pollution. Available online: https://www.umweltbundesamt.de/en/manual-for-modelling-mapping-critical-loads-levels (accessed on 28 March 2017).
  9. Colette, A.; Aas, W.; Banin, L.; Braban, C.F.; Ferm, M.; González Ortiz, A.; Ilyin, I.; Mar, K.; Pandolfi, M.; Putaud, J.-P. EMEP Cooperative Programme for Monitoring and Evaluation of the Long-range Transmission of Air Pollutants in Europe. Air Pollution Trends in the EMEP Region between 1990 and 2012: Joint Report of EMEP Task Force on Measurements and Modelling (TFMM), Chemical Co-ordinating Centre (CCC), Meteorological Synthesizing Centre-East (MSC-e), Meteorological Synthesizing Centre-West (MSC-w); EMEP/CCC-report 1/2016; Norwegian Institute for Air Research: Kjeller, Norway, 2016; pp. 1–105. [Google Scholar]
  10. EMEP 2015. EMEP Status Reports: Heavy Metals: Analysis of Long-Term Trends, Country-Specific Research and Progress in Mercury Regional and Global Modelling (No. 2/2015). Available online: http://www.msceast.org/index.php/reports (accessed on 20 July 2015).
  11. Country Specific Information, Complementary to the EMEP Status Reports. Available online: http://www.msceast.org/index.php/emep-countries (accessed on 20 July 2015).
  12. Engardt, M.; Simpson, D.; Schwikowski, M.; Granat, L. Deposition of sulphur and nitrogen in Europe 1900–2050. Model calculations and comparison to historical observations. Tellus B Chem. Phys. Meteorol. 2017, 69, 1328945. [Google Scholar] [CrossRef] [Green Version]
  13. Ilyin, I.; Gusev, A.; Rozovskaya, O.; Strijkina, I. Transboundary Pollution of Germany by Heavy Metals and Persistent Organic Pollutants in 2010; EMEP/MSC-E J Technical Report 5/2012; EMEP/MSC-E: Moscow, Russia, 2012. [Google Scholar]
  14. Ilyin, I.; Rozovskaya, O.; Travnikov, O.; Varygina, M.; Aas, W.; Uggerud, H.T. Heavy Metals: Transboundary Pollution of the Environment. J. EMEP Status Report 2/2011. Available online: http://www.msceast.org (accessed on 28 March 2017).
  15. Ilyin, I.; Rozovskaya, O.; Travnikov, O.; Varygina, M.; Aas, W.; Uggerud, H.T. Heavy Metals: Transboundary Pollution of the Environment. J. EMEP Status Report 2/2013. Available online: http://www.msceast.org (accessed on 28 March 2017).
  16. Schaap, M.; Roemer, M.; Sauter, F.; Boersen, G.; Timmermans, R.; Builjes, P.J.H.; Vermeulen, A.T. LOTOS-Euros: Documentation; TNO Report BandO-a R 2005/297; TNO Built Environment and Geosciences: Apeldoorn, The Netherlands, 2005. [Google Scholar]
  17. Schaap, M.; Timmermans, R.M.; Roemer, M.; Boersen, G.; Builtjes, P.J.; Sauter, F.J.; Velders, G.J.; Beck, J.P. The LOTOS EUROS model: Description, validation and latest developments. Int. J. Environ. Pollut. 2008, 32, 270. [Google Scholar] [CrossRef]
  18. Schaap, M.; Hendriks, C.; Jonkers, S.; Builtjes, P. Assessment of the atmospheric heavy metal deposition to terrestrial ecosystems in Germany. In Auswirkungen der Schwer-Metall—Emissionen auf Luftqualität und Ökosysteme in Deutschland—Quellen, Transport, Eintrag, Gefährdungspotenzial [Impacts of Heavy Metal Emission on Air Quality and Ecosystems across Germany—Sources, Transport, Deposition and Potential Hazards]; Final Report, Project No. (FKZ) 3713-63-253, Report No. (UBA-FB) 002635/E, UBA-TEXTE 106/2018; Schröder, W., Nickel, S., Schlutow, A., Nagel, H.-D., Scheuschner, T., Eds.; The German Environment Agency: Dessau, Germany, 2018; pp. 1–81. [Google Scholar]
  19. Torseth, K.; Aas, W.; Breivik, K.; Fjæraa, A.M.; Fiebig, M.; Hjellbrekke, A.; Myhre, C.L.; Solberg, S.; Yttri, K.E. Introduction to the European Monitoring and Evaluation Programme (EMEP) and observed atmospheric composition change during 1972–2009. Atmos. Chem. Phys. Discuss. 2012, 12, 5447–5481. [Google Scholar] [CrossRef] [Green Version]
  20. Schröder, W.; Holy, M.; Pesch, R.; Zechmeister, H.; Harmens, H.; Ilyin, I. Mapping atmospheric depositions of cadmium and lead in Germany based on EMEP deposition data and the European Moss Survey 2005. Environ. Sci. Eur. 2011, 23, 19. [Google Scholar] [CrossRef] [Green Version]
  21. Schröder, W.; Pesch, R.; Harmens, H.; Fagerli, H.; Ilyin, I. Does spatial auto-correlation call for a revision of latest heavy metal and nitrogen deposition maps? Environ. Sci. Eur. 2012, 24, 20. [Google Scholar] [CrossRef] [Green Version]
  22. Onianwa, P.C. Monitoring atmospheric metal pollution: A review of the use of mosses as indicators. Environ. Monit. Assess. 2001, 71, 13–50. [Google Scholar] [CrossRef] [PubMed]
  23. Schröder, W.; Nickel, S. Mapping percentile statistics of element concentrations in moss specimens collected from 1990 to 2015 in forests throughout Germany. Atmos. Environ. 2018, 190, 161–168. [Google Scholar] [CrossRef]
  24. Schröder, W.; Nickel, S.; Völksen, B.; Dreyer, A.; Wosniok, W. Nutzung von Bioindikationsmethoden zur Bestimmung und Regionalisierung von Schadstoffeinträgen für eine Abschätzung des atmosphärischen Beitrags zu aktuellen Belastungen von Ökosystemen [Use of Bioindication Methods for the Determination and Regionalisation of Pollutant Inputs to Estimate the Atmospheric Contribution to Current Ecosystem Pressures]; UBA-Texte 91/2019; Umwelt Bundesamt: Dessau, Germany, 2019; Volume 1–2, pp. 1–189, 1–296. [Google Scholar]
  25. Berg, T.; Hjellbrekke, A.; Rühling, Å.; Steinnes, E.; Kubin, E.; Larsen, M.M.; Piispanen, J. Absolute Deposition Maps of Heavy Metals for the Nordic Countries Based on the Moss Survey; TemaNord 505; Nordic Council of Ministers: Copenhagen, Denmark, 2010; p. 35. [Google Scholar]
  26. Berg, T.; Steinnes, E. Use of mosses (Hylocomium splendens and Pleurozium schreberi) as biomonitors of heavy metal deposition: From relative to absolute values. Environ. Pollut. 1998, 98, 61–71. [Google Scholar] [CrossRef]
  27. Harmens, H.; Mills, G.; Hayes, F.; Norris, D.; Sharps, K. Twenty eight years of ICP Vegetation. An overview of its activities. Ann. Bot. 2015, 5, 31–43. [Google Scholar]
  28. Schröder, W.; Hornsmann, I.; Pesch, R.; Schmidt, G.; Markert, B.; Fränzle, S.; Wünschmann, S.; Heidenreich, H. Nitrogen and metals in two regions in Central Europe: Significant differences in accumulation in mosses due to land use? Environ. Monit. Assess. 2007, 133, 495–505. [Google Scholar]
  29. Schröder, W.; Holy, M.; Pesch, R.; Harmens, H.; Ilyin, I.; Steinnes, E.; Alber, R.; Aleksiayenak, Y.; Blum, O.; CosKun, M.; et al. Are cadmium, lead and mercury concentrations in mosses across Europe primarily determined by atmospheric deposition of these metals? J. Soils Sediments 2010, 10, 1572–1584. [Google Scholar] [CrossRef]
  30. Herpin, U.; Lieth, H.; Markert, B. Monitoring der Schwermetallbelastung in der Bundesrepublik Deutschland mit Hilfe von Moosanalysen [Monitoring of Heavy Metal Pollution in the Federal Republic of Germany Using Moss Analyses]; UBA-Texte 31/95: Berlin, Germany, 1995; p. 161. [Google Scholar]
  31. Siewers, U.; Herpin, U. Schwermetalleinträge in Deutschland—Moosmonitoring 1995/96 [Heavy Metal Deposition in Germany—Moss monitoring 1995/96]; Geologisches Jahrbuch Sonderhefte Sonderheft Heft 2; Schweizerbart: Stuttgard, Germany, 1998; p. 199. [Google Scholar]
  32. Siewers, U.; Herpin, U.; Strassburg, S. Schwermetalleinträge in Deutschland (Part II). Moosmonitoring 1995/96 [Heavy Metal Deposition in Germany (Part II). Moss Monitoring 1995/96]; Geologisches Jahrbuch Sonderhefte Sonderheft Heft 3; Schweizerbart: Stuttgard, Germany, 2002; p. 103. [Google Scholar]
  33. Pesch, R.; Schröder, W. Statistical and geoinformatical instruments for the optimisation of the German moss-monitoring network. In Managing Environmental Knowledge, Proceedings of the 20th International Conference on Informatics for Environmental Protection, Graz, Austria, 6–8 September 2006; Tochtermann, K., Scharl, A., Eds.; Shaker Verlag: Aachen, Germany, 2006; pp. 191–198. [Google Scholar]
  34. Schröder, W.; Nickel, S.; Schlutow, A.; Nagel, H.-D.; Scheuschner, T. Auswirkungen der Schwermetall—Emissionen auf Luftqualität und Ökosysteme in Deutschland—Quellen, Transport, Eintrag, Gefährdungspotenzial. Teil 2: Integrative Datenanalyse, Erheblichkeitsbeurteilung und Untersuchung der Gegenwärtigen Regelungen und Zielsetzungen in der Luftreinhaltung und Vergleich mit Ausgewählten Anforderungen, die sich in Bezug auf den Atmosphärischen Schadstoffeintrag aus den Verschiedenen Rechtsbereichen ergeben [Effects of Heavy Metal Emissions on Air Quality and Ecosystems in Germany—Sources, Transport, Input, Hazard Potential. Part 2: Integrative Data Analysis, Assessment of Relevance and Investigation of Current Regulations and Objectives in Air Pollution Control and Comparison with Selected Requirements Arising from the Various Areas of Legislation with Regard to Atmospheric Pollutant Input]; UBA-TEXTE 107/2018: Dessau, Germany, 2018; pp. 1–257. [Google Scholar]
  35. Nickel, S.; Schröder, W. Reorganisation of a long-term monitoring network using moss as biomonitor for atmospheric deposition in Germany. Ecol. Indic. 2017, 76, 194–206. [Google Scholar] [CrossRef]
  36. Technische Anleitung zur Reinhaltung der Luft—TA Luft (Bundesministerium für Umwelt, Naturschutz und Reaktorsicherheit). Erste Allgemeine Verwaltungsvorschrift zum Bundes–Immissionsschutzgesetz. Available online: https://www.bmu.de/fileadmin/Daten_BMU/Download_PDF/Luft/taluft.pdf (accessed on 30 January 2021).
  37. Bundes-Bodenschutz- und Altlastenverordnung (BBodSchV). (GBBl. I S. 1554 vom 12 Juli 1999, zuletzt geändert durch Art. 102 der Verordnung vom 31 August 2015 (GBl. I S. 1474) [Federal Soil Protection and Contaminated Sites Ordinance (BBodSchV). Available online: https://www.gesetze-im-internet.de/bbodschv/BBodSchV.pdf (accessed on 30 January 2021).
  38. Neununddreißigste Verordnung zur Durchführung des Bundes-Immissionsschutzgesetzes Verordnung über Luftqualitätsstandards und Emissionshöchstmengen (39th BImSchV). [Thirty-Ninth Ordinance for the Implementation of the Federal Immission Control Act Ordinance on Air Quality Standards and Emission Ceilings]. Available online: https://www.gesetze-im-internet.de/bimschv_39/BJNR106510010.html (accessed on 30 January 2021).
  39. Directive 2004/107/EC of the European Parliament and of the Council of 15 December 2004 Relating to Arsenic, Cadmium, Mercury, Nickel and Polycyclic Aromatic Hydrocarbons in Ambient Air; OJ L 23; European Parliament: Brussels, Belgium, 2005; pp. 3–16.
  40. Directive 2008/50/EC of the European Parliament and of the Council of 21 May 2008 on Ambient Air Quality and Cleaner air for Europe; OJ L 152; European Parliament: Brussels, Belgium, 2008; pp. 1–44.
  41. Nagel, H.-D.; Becker, R.; Kraft, P.; Schlutow, A.; Schütze, G.; Weigelt-Kirchner, R. NFC Deutschland, Critical Loads, Biodiversität, Dynamische Modellierung [NFC Germany, Critical Loads, Biodiversity, Dynamic Modelling]; UBA-TEXTE 39/2008: Dessau, Germany, 2008; pp. 1–291. [Google Scholar]
  42. EP CLHM 2005. Expert Panel on Critical Loads of Heavy Metals (EP CLHM). How to Calculate Time Scales of Accumulation of Metals in Soils and Surface Waters? Some Methodological Principles. In NFC Deutschland, Critical Loads, Biodiversität, Dynamische Modellierung [NFC Germany, Critical Loads, Biodiversity, Dynamic Modelling]; Nagel, H.-D., Becker, R., Kraft, P., Schlutow, A., Schütze, G., Weigelt-Kirchner, R., Eds.; UBA-TEXTE 39/2008: Dessau, Germany, 2008; pp. 1–291. [Google Scholar]
  43. NaSE. Nationale Trendtabellen für die Deutsche Berichterstattung Atmosphärischer Emissionen (Schwermetalle) 1990–2015 [National Trend Tables for German Reporting of Atmospheric Emissions (Heavy Metals) 1990–2015]; Stand Januar 2017; Umweltbundesamt: Dessau, Germany, 2017; Available online: https://www.umweltbundesamt.de/dokument/nationale-trendtabellen-fuer-die-deutsche-2 (accessed on 6 December 2017).
  44. Knappe, F.; Möhler, S.; Ostermayer, A.; Lazar, S.; Kaufmann, C. Vergleichende Auswertung von Stoffeinträgen in Böden Über Verschiedene Eintragspfade [Comparative Evaluation of Substance Inputs into Soils via Different Input Paths]. Available online: https://www.umweltbundesamt.de/publikationen/vergleichende-auswertung-von-stoffeintraegen-in (accessed on 30 January 2021).
  45. CLC 2006. Karte der Bodenbedeckung [Land Cover Map]. CORINE Land Cover 2006. Available online: https://www.umweltbundesamt.de/themen/boden-landwirtschaft/flaechensparen-boeden-landschaften-erhalten/corine-land-cover-clc (accessed on 28 March 2017).
  46. Zeddel, A.; Quadflieg, A.; Utermann, J. Grundsätze für die Anwendung der Geringfügigkeitsschwellen an der Schnittstelle Wasserrecht—Abfallrecht—Bodenschutzrecht [Principles for the Application of Minimum Thresholds at the Interface of Water Law—Waste Law—Soil Protection Law]. Recht/Strategie/Wirtschaft 2016. Available online: https://www.vivis.de/wp-content/uploads/MNA3/2016_MNA_051-64_Zeddel.pdf (accessed on 28 March 2017).
  47. Doyle, P.J.; Gutzman, D.W.; Sheppard, M.I.; Sheppard, S.C.; Bird, G.A.; Hrebenyk, D. An ecolocical risk assessment of air emissions of trace metals from copper and zinc production facilities. J. Hum. Ecol. Risk Assess. 2003, 9, 607–636. [Google Scholar] [CrossRef]
  48. Reinds, G.J.; Groenenberg, J.E.; De Vries, W.D. Critical loads of copper, nickel, zinc, arsenic, chromium and selenium for terrestrial ecosystems at a European scale. A preliminary assessment; Alterra-Rapport; Alterra: Wageningen, The Netherlands, 2005; pp. 1–45. [Google Scholar]
  49. Crommentuijn, T.; Polder, M.D.; van de Plassche, E.J. Maximum Permissible Concentrations and Neglectible Concentrations for Metals, Taking Background Concentrations into Account; Report Nr. 601501 001; National Institut of Public Health and Environment: Bilthoven, The Netherlands, 1997. [Google Scholar]
  50. Tipping, E. WHAMC—A chemical equilibrium model and computer code for waters, sediments, and soils incorporating a discrete site/electrostatic model of ion-binding by humic substances. J. Elsevier. 1994, 20, 973–1023. [Google Scholar] [CrossRef]
  51. Markert, B. Multi-element analysis in plant material-analytical tools and biological questions. In Biochemistry of Trace Elements; Adriano, D.C., Ed.; Lewis Publishers: Boca Raton, FL, USA, 1992; pp. 401–428. [Google Scholar]
  52. LANUV NRW (Landesamt für Natur, Umwelt und Verbraucherschutz NRW). Jahreskenngrößen der LUQS-Messstetionen des LANUV NRW für die Jahre 2003–2013 [Annual characteristics of the LUQS measuring stations of LANUV NRW for the years 2003–2013]. 2015. Available online: https://www.lanuv.nrw.de/umwelt/luft/immissionen/messorte-und-werte (accessed on 28 March 2017).
  53. Schroeder, H.A.; Balassa, J.J.; Tipton, H.J. Vanadium in plants. J. Chronic Dis. 1963, 16, 1047–1071. [Google Scholar] [CrossRef]
  54. EU (2000) Position Paper: Ambient Air Pollution by AS, CD and NI Compounds. Working Group on Arsenic, Cadmium and Nickel Compounds. Available online: http://ec.europa.eu/environment/air/pdf/pp_as_cd_ni.pdf (accessed on 28 March 2017).
  55. Bundes-Trinkwasserverordnung (BTrinkwV 2001) BGBl. I S. 2977: Verordnung Über die Qualität von Wasser für den Menschlichen Gebrauch [Regulation on the Quality of Water Intended for Human Consumption]. Available online: https://www.gesetze-im-internet.de/trinkwv_2001/BJNR095910001.html (accessed on 30 January 2021).
  56. World Health Organization. Guidelines for Drinking-Water Quality, 4th ed.; World Health Organization: Geneva, Switzerland, 2011; pp. 1–632. [Google Scholar]
  57. CLRTAP 2004. Manual on Methodologies and Criteria for Modelling and Mapping Critical Loads and Levels and Air Pollution Effects, Risks and Trends; UBA-Texte 52/2004: Dessau, Germany, 2004; pp. 1–266. Available online: https://www.umweltbundesamt.de/sites/default/files/medien/4038/dokumente/manual_complete_english.pdf (accessed on 28 March 2017).
  58. Landesumweltamt Brandenburg-LUA Bbg. Vollzugshilfe zur Ermittlung erheblicher und irrelevanter Stoffeinträge in Natura 2000-Gebiete [Implementation Aid for the Identification of Significant and Irrelevant Substance Inputs into Natura 2000 areas]. Available online: https://mluk.brandenburg.de/sixcms/media.php/9/FFH-Vollzugshilfe-Stoffeintraege.pdf (accessed on 30 January 2021).
  59. Madejón, P. Thallium. Chapter 23 in Heavy Metals in Soils. Trace Metals and Metalloids in Soils and Their Bioavailability; Alloway, B.J., Ed.; Springer: Dordrecht, The Netherlands; Heidelberg, Germany; New York, NY, USA; London, UK, 2013; pp. 543–547. [Google Scholar]
  60. Scholl, G.; Metzger, F. Erhebungen über die Ti-Belastung von Nutzpflanzen auf kontaminierten Böden im Raum Lengerich [Surveys on the Ti contamination of crops on contaminated soil in the Lengerich area]. J. Landwirtsch. Forsch. 1981, 38, 216–223. [Google Scholar]
Figure 1. Sampling sites and elements regarding the German Moss Surveys 1990, 1995, 2000, 2005, and 2015. SH = Schleswig-Holstein; MV = Mecklenburg-West Pomerania; HH = Hamburg; NI = Lower Saxony; BE = Berlin; ST = Saxony-Anhalt; BB = Brandenburg; NW = North Rhine-Westphalia; SN = Saxony; TH = Thuringia; HE = Hesse; RP = Rhineland Palatinate; SL = Saarland; BY = Bavaria; BW = Baden-Wuerttemberg.
Atmosphere 12 00193 g001
Figure 2. Spatial patterns of Multi Metal Index (MMI) integrating Cr, Cu, Fe, Ni, Pb, V, and Zn based on data collected from 1990 to 2015 (Above). Spatial patterns of MMI integrating Al, As, Cd, Cr, Cu, Fe, Hg, Ni, Pb, Sb, V, and Zn based on data collected from 1995 to 2015 (Below).
Atmosphere 12 00193 g002
Figure 3. Exceedance of Critical Loads with the protection objective of drinking water quality by atmospheric Pb deposition.
Atmosphere 12 00193 g003
Figure 4. Exceedance of Critical Loads with the aim of protecting ecosystem integrity by atmospheric Pb deposition.
Atmosphere 12 00193 g004
Figure 5. Exceedance of Critical Loads with the protection objective ecosystem integrity by atmospheric Cu deposition.
Atmosphere 12 00193 g005
Table 1. Assessment values for heavy metal fluxes (g ha−1 a−1) for the protection of ecosystems and human health.
MetalTA Luft 1TA Luft 2BBodSchV 339th BImSchV 4,5Directive 2004/107/EC 5Directive 2008/50/EC 5
Emitter-RelatedGeneral Load
Hg4 110 F, 11 G1.5
Cd7 9 F, 117 G6 4.4 H, 7 C, 4 D, 2.5 F G 4.4 H, 7 C, 4 D, 2.5 F G
Pb365 675 F, 6935 G400 435 H, 716 C, 420 D, 250 F G 435 H, 716 C, 420 D, 250 F G
As15 4271 F, 219 G 5.2 H, 6 C, 4 D, 2.2 F G 5.2 H, 6 C, 4 D, 2.2 F G
Ni55 100 17.4 H, 28 C, 17 D, 10 F G 17.4 H, 28 C, 17 D, 10 F G
Cu 360
Zn 1200
Cr 300
Tl726
1 TA Luft [36] = Technical Instructions for Air pollution control (deposition values to protect human health). 2 TA Luft [35] = Technical Instructions for Air pollution control (deposition values as reference points for the special case examination to protect environment). 3 BBodSchV [37] = Federal Soil Protection Ordinance (permissible additional load according to §11 para. 2). 4 39th BImSchV [38] = 39th Federal Immission Control Ordinance. 5 Converted from assessment values for concentrations (Tables 33 and Table 34 in [17]) published in Directive 2004/107/EC [39] and Directive 2008/50/EC [40]. F For field. G For grassland. C For coniferous forest. D For deciduous forest. H For housing settlement.
Table 2. Compilation of categories of assessment values from legal, sublegal regulations, and recommendations for air pollution control for heavy metal fluxes for the protection of ecosystems, protected goods, levels and objectives, and impact indicators.
Sources for Appraisal ValuesDesignation/Category of Appraisal Values Binding ForceObjects of ProtectionLevel of Protection Application for the Assessment Impact Indicator
39th BImSchV [38]Immission limit value (Pb)Legally bindingMan + Environment Precaution + danger preventionGeneral strainHuman toxicological impact thresholds
Target values (As, Cd, Ni)Not legally bindingMan + EnvironmentPrecaution + danger preventionGeneral strainHuman toxicological impact thresholds
TA Luft [36]Immission values for pollutant depositionBinding on administra-tive actionEnvironmentHazard prevention (immission values)Plants requiring approvalHuman toxicological impact thresholds
Directive 2004/107/EC [39]Immission target valuesEU recommendationMan and environment (via soil, plants)Precaution + danger preventionGeneral strain Human toxicological impact thresholds
Directive 2008/50/EC [40]Immission limit value (Pb)Legally bindingMan + EnvironmentPrecaution + danger preventionGeneral strainHuman toxicological impact thresholds
CLRTAP [7,8]Critical Loads (CL(M)eco)
(Section 2.2.2)
Recommendation/orientationTerrestrial ecosystems, soil organisms and plantsPrecautionGeneral strainEcotoxicological thresholds NOEC, LOEC microorganisms, invertebrates and plants
Critical Loads (CL(M)drink),
(CL(Cd)food)
(Section 2.2.2)
Recom-mendation/
orientation
Human PrecautionGeneral strainLimit values of Drinking Water Ordinance and critical limit for Cd in wheat
BBodSchV [37]Precaution-ary valuesLegally bindingEcosystems, soil organisms and plants PrecautionGeneral validity (cross-use) Ecotoxicological thresholds NOEC, LOEC, (in future: HC5, EC10) of soil organisms and plants (all pathways) + Background values
Permissible annual additional loadLegally binding *Ecosystems, soil organisms and plants (all paths of action)Pension entitlement and limited in the long runGeneral validity (cross-use) Information on the amount of ubiquitous deposition
* It is legally binding that values for the permissible additional load are derived. The values themselves are rather indicative, as there are no concrete prescribed applications. Installations or input values due to management are subject to other technical laws. BBodSchV [38] = Federal Soil Protection Ordinance; CLRTAP [7,8] = Convention on Long-range Transboundary Air Pollution; EC10 = ECx is the effect concentration at which x% effect (mortality, inhibition of growth, reproduction, …) is observed compared to the control group; HC5 = Hazardous concentration for 5% of the species; LOEC = Lowest Observed Effect Level; NOEC = No Observed Effect Concentration; PNEC = Predicted No Effect Concentration; TA Luft [36] = Technical Instructions Air.
Table 3. Element-specific trends of heavy metal (HM) bioaccumulation in moss (Germany, 1990–2015).
Heavy MetalSurvey(s)Trend
Pb, Fe1990–2015Continuous reduction of concentrations
2015Only areas with very low concentrations *
Cr, Sb, Zn1990 (1995)–2015Statistically significant decrease
2000–2005Interim increase
2015Only areas with very low concentrations *
Al, As, Cd, Cu, Hg, Ni, V1990 (1995)–2015Statistically significant decrease
2000–2005Intermediate standstill
Al, As, Cd, Hg, Sb were monitored since 1995, Cr, Cu, Fe, Ni, Pb, V, and Zn since 1990. * The international classification of element concentrations in moss [27] does not allow displaying spatial variance with decreasing element concentrations. Therefore, the data on HM accumulation was divided into ten percentile classes (Section 2.1).
Table 4. Background atmospheric total deposition of heavy metals (g ha−1 a−1) [18].
Statistical ParameterPbCdAsNiCuZnCrV
5. Perc.4.960.210.2821.983.0711.890.840.33
25. Perc.5.900.260.3332.354.8116.071.030.39
50. Perc.6.710.290.3802.695.8919.081.220.44
75. Perc.7.810.330.4373.107.1722.241.450.52
95. Perc.11.000.450.6033.9210.6733.382.080.85
Min.3.590.170.2081.421.988.240.660.30
Max.87.252.331.0267.1129.4276.633.971.90
Mean7.240.310.4012.806.4220.251.310.49
Table 5. HM inputs from fertilisation in agriculture and forestry (in g ha−1 a−1) in Germany [44].
Heavy MetalAcre Grassland Organic AgricultureForest
Mineral FertilizerCompostSewage SludgeFarm FertilizerMineral FertilizerFarm FertilizerFarm Fertilizer Liming
AsMin.0.998.914.40.761.072.610.5270.4
Max1.6931.287.973.91.284.980.72
PbMin.4.1982.8247.981.818.118.650.8590.7
Max.8.76315.8987.2810.399.3110.941.245
CdMin.1.331.611.140.42.050.660.6190.2
Max.3.34.572.611.432.610.860.82
CrMin.46.6173.4255.4540.6524.4221.518.828.2
Max.57.23163.870.1459.3229.227.3210.38
CuMin.11.2798.61282.218.820.2781.430.780.8
Max.34.61397.79514.49220.1727.13174.273.53
NiMin.6.6431.8326.765.155.48.321.751.6
Max.9.16109.7645.7716.755.814.822.03
HgMin.0.010.270.640.010.030.060.0370.06
Max.0.051.061.190.090.030.120.046
TlMin.0.080.260.330.040.110.130.080.09
Max.0.180.850.640.230.140.240.09
ZnMin.66.76376.05694.1231.0999.35331.69.734.2
Max.250.21445.751272.09911.77129.54706.527.48
Table 6. Comparison of the Hg deposition (in g ha−1 a−1) in the year 2013 [10,11] with the critical loads (in g ha−1 a−1) of the receptor surfaces in Germany.
Deposition Hg 2013Critical Loads
EMEP [10,11]EMEP [10,11]CL(Hg)ecoCL(Hg)ecoCL(Hg)drink CL(Hg)drink
5. Perc.95. Perc.Min.5.–95. Perc. (Median)Min.5.–95. Perc. (Median)
0.000.8700.2–0.6 (0.4)0.260.6–5.7 (3.2)
Table 7. Comparison of the Cd deposition (in g ha−1 a−1) with the assessment values (in g ha−1 a−1) and statistical evaluation of the area share of protected receptor areas in Germany, 2010, against limit values exceeded.
Deposition Cd 2010Critical Loads
Schaap et al. [18] Schaap et al. [18] CL(Cd)ecoCL(Cd)ecoCL(Cd)drink CL(Cd)drink CL(Cd)food CL(Cd)food
5. Perc.95. Perc.Min.5.–95. Perc. (Median)Min.5.–95. Perc. (Median)Min.5.–95. Perc. (Median)
0.21–0.45 (0.29) 2.33 1.534.1–42.4 (10.5)0.652.5–18 (10.2) 2.313–9.3 (6)
Table 8. Comparison of Pb deposition 2010 (in g ha−1 a−1) with the Critical Loads (in g ha−1 a−1) of receptor surfaces in Germany.
Deposition Pb 2010Critical Loads
Schaap et al. [18] Schaap et al. [18] CL(Pb)ecoCL(Pb)ecoCL(Pb)drink CL(Pb)drink
5. Perc.95. Perc.Min5.–95. Perc. (Median)Min5.–95. Perc. (Median)
4.43–11 (6.71)87.25 1.976–601 (21) 2.89–61 (35)
Table 9. Comparison of As deposition in 2010 (in g ha−1 a−1) with the CL (in g ha−1 a−1) of receptor surfaces in Germany.
Deposition As 2010Critical Loads
Schaap et al. [18] Schaap et al. [18] CL(As)ecoCL(As)ecoCL(As)drink CL(As)drink
5. Perc.95. PercMin.5.–95. Perc. (Median)Min.5.–95. Perc. (Median)
0.28–0.6 (0.38) 1.03115181–711 (414)26–56 (31)
Table 10. Comparison of the 2010 Cu deposition (in g ha−1 a−1) with the critical loads (in g ha−1 a−1) of the receptor surfaces in Germany.
Deposition Cu 2010Critical Loads
Schaap et al. [18] Schaap et al. [18] CL(Cu)ecoCL(Cu)ecoCL(Cu)drink CL(Cu)drink
5. Perc.95. Perc.Min5.–95. Perc. (Median)Min5.–95. Perc. (Median)
3.1–10.67 (5.89) 29.42713–710 (74)4841070–11,268 (6172)
Table 11. Comparison of the Zn deposition 2010 (in g ha−1 a−1) with the critical loads (in g ha−1 a−1) of the receptor surfaces in Germany.
Deposition Zn 2010Critical Loads
Schaap et al. [18] Schaap et al. [18] CL(Zn)ecoCL(Zn)ecoCL(Zn)drinkCL(Zn)drink
5. Perc.95. Perc.Min.5.–95. Perc. (Median)Min.5.–95. Perc. (Median)
11.89–33.38 (19.08) 76.6381189–1032 (565)12342848–28,316 (15,628)
Table 12. Comparison of Cr deposition 2010 (in g ha−1 a−1) and critical loads (in g ha−1 a−1) of receptor areas in Germany.
Deposition 2010Critical Loads
Schaap et al. [18] Schaap et al. [18] CL(Cr)ecoCL(Cr)ecoCL(Cr)drink CL(Cr)drink
5. Perc.95. Perc.Min.5.–95. Perc. (Median)Min.5.–95. Perc. (Median)
0.84–2.08 (1.22) 3.9778115–448 (263)1228–282 (156)
Table 13. Comparison of Ni deposition in 2010 (in g ha−1 a−1) with the critical loads (in g ha−1 a−1) of receptor areas in Germany.
Deposition 2010Critical Loads
Schaap et al. [18] Schaap et al. [18] CL(Ni)ecoCL(Ni)eco
5. Perc.95. Perc.Min.5.–95. Perc. (Median)
1.98–3.92 (2.69) 7.1137109–3338 (518)
Table 14. Calculation of the acceptable Tl discharge in the typical German range (minimum and maximum).
Terms of the Balance SheetAcreGrasslandForest
Yield minimum (t dry mass ha−1 a−1)2.1990.10.65
Yield maximum (t dry mass ha−1 a−1)14.0886.57.4
Tl withdrawal by biomass harvest Minimum (g ha−1 a−1)0.110.0050.033
Tl removal by biomass harvest maximum (g ha−1 a−1)0.7040.3250.37
Leakage water rate minimum (m³ ha−1 a−1)17512570
Seepage water rate maximum (m³ ha−1 a−1)949678380
Acceptable Tl- washing rate minimum (g ha−1 a−1)0.0350.0250.014
Acceptable Tl- washout rate maximum (g ha−1 a−1)0.190.1360.076
Acceptable total Tl discharge minimum (g ha−1 a−1)0.1450.030.046
Acceptable total Tl discharge maximum (g ha−1 a−1)0.8940.460.446
Table 15. Calculation of the acceptable V discharge in the typical German range (minimum and maximum).
Terms of the Balance SheetAcreGrasslandWood
Yield minimum (t dry mass ha−1 a−1)2.1990.10.65
Yield maximum (t dry mass ha−1 a−1)14.0886.57.4
V extraction by biomass harvest minimum (g ha−1 a−1)1.540.070.455
V extraction by biomass harvest maximum (g ha−1 a−1)9.864.555.18
Leakage water rate minimum (m³ ha−1 a−1)17512570
Seepage water rate maximum (m³ ha−1 a−1)949678380
Acceptable V-washing rate minimum (g ha−1 a−1)0.70.50.28
Acceptable V-washing rate minimum (g ha−1 a−1)3.82.711.52
Acceptable total V discharge minimum (g ha−1 a−1)2.240.570.735
Acceptable total V discharge minimum (g ha−1 a−1)13.667.626.697
Table 16. Assessment values for heavy metal (in g ha−1 a−1) fluxes for the protection of human health and their exceedance/undercutting by atmospheric deposition (for Hg: EMEP in 2013 [10,11]; for all others German dataset in 2010 from Schaap et al. [18]).
MetalTALuft
Table 6
TALuft
Table 8
39th BImSchV
Coniferous/Deciduous Forest/
Arable Land 1
EU-Position
Paper
Coniferous/Deciduous Forest/
Arable Land 1
CL(M)FoodCL(M)Drink
Emitter-Related General Load
Hg4+110+ 0.3–13.8−−
Cd7+9+7/4/2.5+9–18+1.9–19.20.8–42.6-
Pb365+675+716/420/250+ 3–142−−
As15+4271+6/4/2.2+3–9/4–13/1.5–5+ 2–138+
Ni55+ 28/17/10+8–42/14–72/5–25
Cu 484–27,533+
Zn 1234–69,133+
Cr 12–688+
1 Converted into input rates using the mean deposition velocities in the various vegetation complexes. + Critical values for human health are not exceeded. A risk can be excluded. Critical values for human health are exceeded in worst cases. A risk cannot be excluded regionally. −− Critical values for human health are exceeded. There is a regional risk.
Table 17. Assessment values for heavy metal fluxes to protect ecosystems and their exceedance/undercutting by atmospheric deposition (for Hg: EMEP in 2013 [10,11]; for all others German dataset in 2010 [18]).
Assessment Value (LUA Brandenburg 2008)TALuft
Table 6
TALuft
Table 8
BBodSchV
Permissible Additional Load
39th BImSchV
Coniferous/Deciduous Forest/Arable Land 1
EU-Position
Paper
Coniferous/Deciduous Forest/Arable Land 1)
CL(M)eco
Emittent-RelatedGeneral Load
(g ha−1 100 a−1)(g ha−1 a−1)
Hg2+4+110+1.5+ 0.1–1.1
Cd5+7+9+6+7/4/2.5+9–18+1.5–127.6
Pb768+365+675+400+716/420/250+ 2–2603
As 15+4271+ 6/4/2.2+3–9/4–13/1.5–5+115–1669+
Ni154+55+ 100+28/17/10+8–42/14–72/5–25 37–11,232+
Cu 360+ 7–3384
Zn 1200+ 81–2457+
Cr 300+ 78–1049+
1 Converted into input rates using the mean deposition velocities in the various vegetation complexes. + Critical values for ecosystems are not exceeded. A risk can be excluded. Critical values for ecosystems are exceeded in worst cases. A risk cannot be excluded regionally. −− Critical values for ecosystems are exceeded. There is a regional risk.
Publisher’s Note: MDPI stays neutral with regard to jurisdictional claims in published maps and institutional affiliations.

