Article

The On-Line Integrated Mesoscale Chemistry Model BOLCHEM

1
National Research Council of Italy, Institute of Atmospheric Sciences and Climate (CNR-ISAC), Strada Prov.le Lecce-Monteroni Km 1200, 73100 Lecce, Italy
2
National Research Council of Italy, Institute of Atmospheric Sciences and Climate (CNR-ISAC), Via Gobetti 101, 40129 Bologna, Italy
3
ENEA, Air Pollution Laboratory, Via Martiri di Monte Sole 4, 40129 Bologna, Italy
4
National Research Council of Italy, Institute for Microelectronics and Microsystems (CNR-IMM), Via Gobetti 101, 40129 Bologna, Italy
*
Author to whom correspondence should be addressed.
Atmosphere 2021, 12(2), 192; https://doi.org/10.3390/atmos12020192
Submission received: 19 December 2020 / Revised: 24 January 2021 / Accepted: 27 January 2021 / Published: 31 January 2021
(This article belongs to the Special Issue Regional Air Quality Modeling)

Abstract

:
This work presents the on-line coupled meteorology–chemistry transport model BOLCHEM, based on the hydrostatic meteorological BOLAM model, the gas chemistry module SAPRC90, and the aerosol dynamic module AERO3. It includes parameterizations to describe natural source emissions, dry and wet removal processes, as well as the transport and dispersion of air pollutants. The equations for different processes are solved on the same grid during the same integration step, by means of a time-split scheme. This paper describes the model and its performance at horizontal resolution of 0.2 × 0.2 over Europe and 0.1 × 0.1 in a nested configuration over Italy, for one year run (December 2009–November 2010). The model has been evaluated against the AIRBASE data of the European Environmental Agency. The basic statistics for higher resolution simulations of O3, NO2 and particulate matter concentrations (PM 2.5 and PM10) have been compared with those from Copernicus Atmosphere Monitoring Service (CAMS) ensemble median. In summer, for O3 we found a correlation coefficient R of 0.72 and mean bias of 2.15 over European domain and a correlation coefficient R of 0.67 and mean bias of 2.36 over Italian domain. PM10 and PM 2.5 are better reproduced in the winter, the latter with a correlation coefficient R of 0.66 and the mean bias MB of 0.35 over Italian domain.

1. Introduction

For many years, Meteorology and Air Quality (AQ) have been developed as separate disciplines. From the modeling point of view, this led to the development of separate Meteorological and Chemical Transport Models (CTM), the latter using as input data the output of the former. However, over the last decades, it was recognized that the interaction among processes in the atmosphere could not be confined within those two domains. Actually, some of the missing couplings in the offline representation of the atmosphere proved to be fairly important, not only for climate modeling where the impact of greenhouse gases and aerosol on radiation and clouds is of paramount importance in the determination of the global (and local) budgets, but also for short time forecasts of both meteorological and composition quantities, in which aerosols play a major role (see [1] for a review).
Despite this, the development of integrated models of atmospheric dynamics and composition is relatively recent: for instance, the first stable version of WRF-Chem, one of the most widespread models, has been released only in 2005 [2]. In Baklanov et al. [1] the status and a short model description of the more used online coupled models in Europe is presented. Among others, we recall a.e., the COSMO-ART model [3], Enviro-HIRLAM model [4], the MetUM [5,6]. The online coupled models involve a strong coupling of the two “realms” with raising scientific and computational complexities. For these reasons, CTMs, i.e., offline models that typically use the output of a meteorological model to compute transport, diffusion, and transformation of pollutants, are still widely used (see, e.g., Copernicus Atmospheric Monitoring Service-Europe, https://atmosphere.copernicus.eu).
In recent years, large efforts have been undertaken to develop not only integrated models, but also strategies and frameworks for online integrated modeling (see, e.g., Baklanov et al. [7]) and their evaluation, as, for instance, the joint European–North American Air Quality Model Evaluation International Initiative [8,9].
BOLCHEM is an online integrated mesoscale meteorology–chemistry model where, as defined in Baklanov et al. [1], equations for different atmospheric processes are solved “simultaneously” (by means of a time split scheme) over the same grid using one main time step for integration. Although in the online integrated models it is possible to include interactions between different components (typically “feedback”), at the present stage of development, in the BOLCHEM model, the chemistry and meteorological components are one-way coupled (defined as “online-access” according to Baklanov et al. [1]). The processes that constitute the meteorological component (flow dynamics, thermodynamics, radiation, surface and other physical processes) are based on the BOLAM model, which is a meteorological model developed in Italy, at ISAC-CNR. BOLCHEM development started in 2002, making it one of the first projects for the development of online integrated models in Europe. The first version of BOLCHEM included only the gas-phase chemical processes. BOLCHEM was inserted in the NetFAM/COST 728 database among the “few” (at that time) online models (see Baklanov et al. [10]). From 2005 to 2009, BOLCHEM participated in the GEMS Project [11], the Regional Air Quality (RAQ) subproject with a version that included gas chemistry and related processes [12,13], and to MACC—Modelling Atmospheric Composition and Climate. A first study with BOLCHEM can be found in Mircea et al. [14]. In the CityZen project, BOLCHEM contributed to the activities on regional climate [15,16,17], including aerosol and its interaction with radiation. The model, with the inclusion of both gas and aerosol chemistry, was applied for specific air quality studies, mainly in the frame of INTERREG ERESIA, INTERREG CESAPO, and MED POSEIDON projects [18,19,20].
This paper presents the first full description of the meteorological and chemical modules of the model (Section 2) and its performances on the European and Italian domain (Section 3).

2. Model Description

Every existing integrated meteorological and chemical transport modeling system (Met-Chem Model) is built on top of a pre-existing meteorological model. This is reflected in the model description. Here we start the description keeping in mind the online-integration framework, outlining the model description based on processes: turbulence (including dispersion of tracers), interface (including dry deposition), radiation (including primary effect), cloud (including wet removal), and so on. BOLCHEM is based on the hydrostatic meteorological model BOLAM [21], the gas-phase chemical mechanism SAPRC90 [22] and the aerosol model AERO3 [23,24] and includes a number of parameterizations to describe transport and dispersion, natural emission sources, dry and wet removal processes and their interactions. These different components have been intimately connected by unifying as much as possible the process involved. All the meteorological and chemical fields (gas concentration, number and mass concentration of aerosol species, virtual temperature, specific humidity, ...) are available at every time step of integration (see Section 2.7). This allows a consistent treatment of the different processes, as advection, turbulence, radiation, for both meteorological and chemical quantities.
This section describes in detail the model components, the modeling system configuration and applications.

2.1. Boundary Layer and Vertical Diffusion

The surface layer (SL) is modeled according to the classical Monin-Obukhov similarity theory [25]. The Businger (see [26]) stability functions are used in the unstable SL, while Holtslag [27] functions apply to the stable case. The roughness length over land, initially defined depending on vegetation and sub-grid orographic variance, is modified as a function also of snow coverage conditions. Over the sea, a Charnock roughness [28] representation is introduced for computing momentum fluxes. It takes into account the dependence of wave height on the surface wind speed, while roughness lengths for temperature and humidity in stable and unstable conditions are defined according to [29]. The mixing length (ML) based turbulence closure, widely used to compute the PBL fluxes for atmospheric modeling (see, for instance, [30]) is applied to model the turbulent vertical diffusion of momentum, potential temperature and specific humidity in the free atmosphere. The turbulence closure is of order 1.5, in which the turbulent kinetic energy (TKE) equation is integrated over time [31]. To take into account buoyancy effects in case of saturated atmosphere, the ML depends on the Richardson number based on equivalent potential temperature. In the unstable case, a modified version of the Bougeault and Lacarrere [32] ML is applied while, in the stable case, a modified Blackadar [33] formulation is used. Finally, the dissipated TKE is fed back into resolved temperature (frictional heating).
Diffusion is split into vertical and horizontal. The vertical one is performed using the vertical diffusion coefficients for all of the atmospheric components (temperature, humidity, gas and aerosol species). This avoids the need to compute extra diagnostics variables typically used in CTM (e.g., the mixing height). Furthermore, the calculation of all the derived quantities (i.e., U10) is straightforward in a coupled model where all the quantities are available online/runtime.

2.2. Convection and Precipitation

The sub-grid convective precipitation is treated in BOLCHEM following the Kain-Fritsch (KF) parameterization scheme [34,35] that has shown considerable success in simulating the development and evolution of convection under a variety of atmospheric environments [36,37]. The parameterization has been completely re-coded and some modification has been introduced in the original code. Liquid water static energy (instead of the Bolton approximation of equivalent potential temperature) is used as a thermodynamic conserved quantity. Moreover, additional modifications have been introduced with respect to the Kain [35] version, regarding the dependency of downdraft on ambient relative humidity, and the precipitation rate. The cloud depth threshold establishing the onset of shallow convection has also been increased. The above changes tend to slightly reduce, on average, the temperature at low tropospheric levels around and below cloud base, hence stabilizing a little more efficiently the lower troposphere. This has also the effect of reducing to some extent the intensity of small-scale cyclogenesis in the presence of convection.
The scheme describing the physical processes of stratiform precipitation is based on a single-moment, bulk microphysics scheme with two ice precipitation categories (snow and graupel). The spectral properties of clouds and hydrometeors are described assuming generalized gamma function distributions. The main processes described by the microphysical scheme are: nucleation of cloud water (cw) and of cloud ice (ci), condensation and evaporation of cw, freezing of cw, sublimation and melting of ci, auto-conversion of cw and of ci into rain and precipitating ice categories, sublimation of snow and graupel, evaporation of rain, melting/freezing of hydrometeors, hydrometeor and cloud interactions (collection/accretion/riming), computation of terminal fall speeds and fall process, using a conservative backward-upstream integration scheme, thermodynamic feedback based on enthalpy conservation.
Aerosols and gases removal by clouds and precipitation is treated as in the EMEP/MSC-W model [38]. The online availability of the meteorological fields allows a better computation of the effects of spatial and temporal variability of clouds and precipitation on pollutant removal, since the evolution of single-cell storms have a typical lifespan of less than one hour that cannot be properly captured by offline models.

2.3. Gas Chemistry

The atmospheric gas-phase chemistry is simulated with the SAPRC90 photochemical mechanism, as described in [22]. It is implemented using the chemistry preprocessor Flexible Chemical Mechanism (FCM) [39]. This mechanism considers 35 chemical species that undergo 131 reactions. It is designed for an efficient representation of complex ambient mixtures with the purpose of assessing differences in atmospheric impacts of individual VOCs. Although it is recognized that chemical processes involving VOCs and NOx lead to the generation of ozone and other secondary pollutants in the presence of sunlight [40,41], the role of VOCs in ozone and secondary organic aerosol formation and evolution is a subject in continuous progress. Different mechanisms use different model species to represent how organic compounds react [42]. SAPRC90 mechanism includes reactions for a large number of VOCs that have been evaluated against environmental chamber data. The SAPRC90 photolysis rates used in photolytic reactions are calculated by the model as a function of the simulated radiation (see Section 2.5). The mechanism includes the gas-phase reactions of SO2, but not heterogeneous reactions. SAPRC90 was extended to describe the formation of condensable organic products and the oxidation of SO2 in aqueous, following the scheme reported in [43].

2.4. Aerosol Dynamics

Chemical composition of aerosol is simulated with the aerosol dynamic model AERO3 [23,24] coupled with the inorganic, thermodynamic equilibrium model ISORROPIA [44], and with the secondary organic aerosol model SORGAM [45]. The aerosol dynamic model is coupled with the gas-phase chemical model allowing the use of updated gas-phase precursor concentrations. The implemented aerosol dynamic module follows the so-called modal approach proposed by Whitby [46], in which the population of particles is described by a superposition of log-normal distributions called modes. The aerosol population is described by three modes (Aitken, accumulation, coarse), the aerosol particles are formed by nucleation and growth by condensation and coagulation, both intra- and inter-modal. Gas/particle mass transfer continuously modifies the chemical composition of aerosol. The considered aerosols are: primary unspeciated anthropogenic aerosol and water, primary organic aerosol, primary elemental carbon, soil and sea salt, secondary biogenic and anthropogenic organic aerosol, ammonium, nitrate, and sulfate. The amount of ammonium, nitrate, sulfate and water contained in the aerosol is calculated with ISORROPIA [44] and depends on available concentrations of ammonia, nitric acid, SO 2 and on relative humidity and temperature. The amount of secondary organic aerosol (SOA), both biogenic and anthropogenic, is calculated using the absorptive partitioning model of Pankow [47], extended by Odum et al. [48], and the concentrations of reacted ROG’s, the total (gas + aerosol) concentration of each semi-volatile organic compound and the concentrations of primary and secondary organic aerosols.

2.5. Radiation

The atmospheric radiation is computed with a combined application of the Ritter and Geleyn [49] scheme (hereafter referred to as RG) and the Morcrette [50], Morcrette et al. [51] scheme, (referred to as ECMWF), the latter including the Rapid Radiative Transfer Model (RRTM) [52] and the Tegen et al. [53] aerosol climatology. The RG scheme, with the option of maximum cloud coverage, is called approximately every 0.5 h of simulated time and has been modified to take into account the explicit cloud water and cloud ice concentrations predicted by BOLCHEM (in the original RG scheme, clouds were parameterized from specific humidity). The ECMWF scheme, being much more computationally expensive than the RG scheme, is computed only every 1.5 h of simulated time at alternate horizontal grid points, in order to save computational time. The difference between the surface and internal radiative fluxes of the ECMFW and RG schemes is then interpolated in time and space, and it is used to correct the fluxes computed by the RG scheme. Concerning photolytic reactions, the computation of photolysis rates requires the use of algorithms that make use of spectral radiative and molecular properties (absorption cross-sections and photo-dissociation quantum yields) [54] that are rather expensive to be computed run-time.
One of the typical alternative approach (see [1], Table 8), i.e., is to derive the photolytic rates from a lookup table that contains values previously computed in clear-sky conditions as a function of the solar zenith angle. This approach is used in BOLCHEM, with photolytic rates produced by running the FCM over 11 h angles. The clear-sky values are then modified locally (in every grid cell) according to the ratio between the actual short-wave net flux and the same quantity in clear sky conditions as computed by the model, both available runtime. This allows for a 3D spatial distribution of photolysis rates that accounts for the actual (modeled) local radiation fluxes. The correction factor can exceed 1.0 above clouds and is reduced within and below clouds.
Because the impact of clouds on the actinic flux is nearly independent on the wavelength [55] the correction is applied without reference to specific spectral properties of involved molecules, and it is assumed to capture the overall modification of the photolysis activity without adding heavy computation. A similar approach was adopted in other models, e.g., COSMO-ART [3].

2.6. Surface Fluxes

Surface fluxes (sources and sinks) are the most critical input for a Met-Chem. Moisture and heat influence atmospheric dynamics while anthropogenic and natural emissions are the source of gas and particulate pollutants. On the other hand, removal by dry deposition can be an important sink for them. In the following, submodels of surface fluxes for the different components are described. While anthropogenic contribution can be only included from available databases, natural component sources (heat, moisture, gases and aerosols) couples different components such as radiation, turbulence, soil type and moisture content. Different parameterizations are used for different processes. According to the online approach, all of the modules used for the calculation of surface fluxes of the various components share all the available information.

2.6.1. Anthropogenic Emissions

The anthropogenic emission data are based on European Database or National Database. In the present work, we use the TNO-MACC-III emission database for the year 2010, that is an update from the TNO-MACC-II dataset [56]. It provides gridded emissions on the European domain, at 0.125° × 0.0625° longitude-latitude resolution, for each year, country, sector and source type. Additionally, a classification in area and point sources is provided without any information on emission height and other parameters, for individual point sources. Eight key families of pollutant are considered: methane (CH4), carbon monoxide (CO), ammonia (NH3), non-methane volatile compounds (NMVOC), nitrogen oxides (NOx), particulate matter (PM2.5 and PM10), sulfur dioxide (SO2). The annual emissions are then split in time to hourly resolution and NMVOC and PM are speciated on the basis of emission sectors (SNAP) and seasonal activity [57], according to the chemical module SAPRC90 and the aerosol module AERO3. Since within one SNAP, different types of sources occur, the emissions can have different height. We have used the following recipe to allocate emissions on vertical levels: area sources at the lowest layer of the model, point source vertically allocated on one of the three levels (0 m, 50 m, 150 m) depending on the typical stack emission for different SNAP.

2.6.2. Soil and Vegetation Model: Moisture and Heat

The meteorological component BOLAM includes an original soil model with fixed lower boundary conditions, where heat and water vertical transfer are computed at the interfaces of several soil layers with depths ranging typically from a few cm to more than 1 m, increasing downward. Vegetation effects at the surface (transpiration and interception of precipitation) and in the soil (extraction of water by roots depending on wilting conditions), taking into account different soil types and physical parameters, are considered. The soil model also includes a treatment of freezing and melting processes of the water content. At the surface, the evolution of the snow cover is computed considering snow accumulation and melting, with a single-layer snow mantle model. A surface skin temperature is defined by imposing zero-net flux divergence of heat at the soil-atmosphere interface. Albedo and emissivity variations are also computed as a function of the uppermost soil water content. The sea surface temperature is predicted using a slab ocean model, where latent and sensible heat fluxes, and radiation contributions, are taken into account. The soil and vegetation dataset is obtained from the Global Land Cover Facility of the University of Maryland at 1/120 degree resolution [58], a classification from AVHRR satellite and free available.

2.6.3. Biogenic Gas Emissions

The surface flux of visible radiation and skin temperature, calculated run time by the BOLCHEM model at every time step, are used to estimate the biogenic gas emission fluxes. Biogenic emissions are grouped into three categories: isoprene (C5H8), monoterpenes (C10H16) and OVOCs (CxHyOz). Following Guenther et al. [59], Simpson et al. [60], the biogenic emission flux is given by the product of the emission potential, the foliar biomass density and an environmental correction factor representing the effects of temperature, and in some case solar radiation, on emissions. The emission potential and the foliar biomass density are ecosystem-dependent. BOLCHEM uses an independent database, having 1 km spatial resolution [61]: a non-canopy approach is adopted and the emission potential is calculated at branch-levels. For monoterpene, two separated emission potentials are provided. Depending on the plant specie, the monoterpene emission flux is driven by temperature only, or by light and temperature. The correction factor is calculated following Guenther et al. [62]. For isoprene, as for monoterpene light and temperature depending, the factor is the product of two coefficients which account respectively for the effect of leaf temperature and Photosynthetically Active Radiation (PAR). PAR is calculated in BOLCHEM as a function of the surface flux of visible radiation. For monoterpene and OVOCs emission from most plants, the correction factor is a factor depending on temperature only [59,62]. BOLCHEM uses the skin temperature to calculate the correction factor.

2.6.4. Sea Salt

Sea salt emission flux is calculated following Zhang et al. [63]. In this approach, the solute weight fraction of seawater, composed in the model by Cl, Na+ and SO 4 2 , is represented as a function of RH [64] over the 0.45–0.99 RH range. Then, the density of a sea-salt particle is expressed as a function of the solute weight fraction of seawater. The surface fluxes of sea-salt are first calculated at the reference relative humidity of 80%, using open-ocean source functions that empirically relate the particle number size distribution and the wind speed at 10 m a.s.l. (U10) [65,66]. This function is applicable for U10 < 20 ms−1 and 0.8 m < r80 < 10 m, being r80 the wet particle radius at RH = 80%. The size distribution of sea salt particle flux is then adjusted according to the local relative humidity, using a correction factor, expressed as a function of ambient relative humidity RH. The relative humidity RH and U10 are calculated by BOLCHEM at every time-step, the latter according to the stability condition (see Section 2.1).

2.6.5. Forest Fire Emissions

Forest fire emissions can be estimated for particular case studies and then included in the BOLCHEM model [18]. The pre-processor prebolchem_fire  is described in Pizzigalli [67]. Wildfire emission fluxes are estimated starting from latitude and longitude of area burned obtained from satellite products, as MODIS burned area product, following the methodology proposed by  Seiler and Crutzen [68]. The emission E(x) of specie x is given by the product of the burnt area (A), the fuel load (B), the burning efficiency CE and the emission factor e(x) of species x. B and e(x) are functions of the land cover classification and CE is a function of the tree cover. For each class of vegetation, values of fuel load and burning efficiency are estimated for each class of vegetation, referring to the UMD Global Land Cover Classification (GLCC) [58]. The WRAP approach (WRAP, 2005) is used to modulate the emission fluxes and to estimate the fire emission height. Basically, the fires are classified into size classes based on virtual acreage, then top and bottom emission height (Htopmax and Hbotmax) and buoyant efficiency BEsize are assigned to every plume class. The total fire emissions are split into the smoldering and flaming part. The smoldering fraction is calculated as a function of the BE size and it is daily modulated as a function of the BEsize and buoyant efficiency. The remaining part is distributed between the bottom and the top of the plume following a diurnal profile, with peak emissions during the early afternoon and low emissions during the night.

2.6.6. Dry Deposition

Parameters from the BOLAM surface layer, such as roughness length and stability functions (see Section 2.1) temperature, pressure, soil and vegetation types are directly provided at every time step to the gas dry deposition module. The scheme is based on a resistance analogy approach [69] in which the dry deposition velocities are written as the inverse of the sum of three resistances, Vd = (Ra + Rb + Rc)−1, where the three quantities Ra, Rb and Rc are the aerodynamic, quasi-laminar and canopy resistances, respectively. The formulation of Rc follows the methodology implemented in Anav et al. [70]. It uses the parameterization of Emberson et al. [71] to account for stomatal conductance, which is calculated for different land cover types as a function of the vegetation type, phenology, and  surface parameters as temperature and humidity. The algorithm is adapted to the BOLCHEM soil and vegetation classes, using 16 vegetation and 9 soil types.

2.7. Numerical Core

The model prognostic variables are distributed in the vertical on a non-regular Lorenz grid [72], with higher resolution in the atmospheric boundary layer near the lower surface. The vertical coordinate is based on a hybrid, pressure-based coordinate system, in which the pure terrain-following coordinate at the model surface, gradually tends to a pure pressure coordinate with increasing height above the ground. The horizontal discretization is based on a staggered Arakawa-C grid [73], in geographical coordinates (latitude-longitude). The equator can be taken to be any great circle on the Earth in order to minimize grid anisotropy over the limited area of the simulation. The time scheme of BOLAM is split-explicit, forward-backward for the gravity modes. The main model time step dt is limited by the Courant number constraint for the horizontal advection in the meteorological component. This time step is used for almost all of the processes except in radiation and convection modules, where the computation of the time tendencies of these processes is performed every 30 min and applied to each time step dt, and in the gas chemistry module, where the solver for chemistry uses an algorithm to adapt the time step for which dt represents the maximum. The SAPRC90 equations are solved by the lsode solver with adaptive time-step in which a minimum value is set as an internal parameter. The lateral boundary conditions are applied on a number of grid boundary frames, using a relaxation scheme [74] that efficiently absorbs wave energy, helping in reducing spurious reflection by the lateral boundaries.
The advection scheme presently implemented is the Weighted Average Flux scheme (WAF) [75], which is a second-order implementation of the Godunov method [76] particularly suited to integrate in time the conservation of a scalar quantity. This scheme is a “total variation diminishing” one, and therefore prevents the occurrence of spurious oscillations (see also [77]). The horizontal velocity components are interpolated over the T-points of the Arakawa C grid, advected as any other variable defined on those points, and interpolated back to velocity points (to avoid smoothing, one-dimensional fourth-order interpolation is used).
Conservation of mass of advected and diffused species is easily implemented in an online model. In order to conserve mass exactly in the transport of the scalar parameters involved in the chemical core, a flux-form of the BOLAM advection scheme has been used in which the advected quantities are expressed as volumetric concentrations.
Lateral boundary conditions for meteorology are imposed using a relaxation scheme [74,78], while a sponge layer is adopted at the top of the atmosphere, which is located at about 10 h Pa (middle stratosphere). Boundary concentrations for chemical species are injected into the model by means of an inflow/outflow condition applied to the external grid frame. In addition, to save CPU time, the top level for chemistry can be optionally chosen to be lower than that for meteorology.

2.8. Model Configuration and Previous Applications

BOLCHEM has been used in different applications, from experimental forecast over Europe (GEMS) and Italy (MACC) to long term (climatological) studies (CityZen). In these applications, the horizontal resolution ranges from 0.5° to 0.1° with a number of vertical levels ranging from 30 to 60. The meteorological component of BOLCHEM uses the hydrostatic approximation and thus the horizontal resolution is limited to about 5–6 km. In order to allow for timesteps as large as possible, horizontal discretization is performed on a rotated, latitude–longitude grid that minimizes the convergence of meridians in the limited area domain. The top of the vertical chemical domain can be selected to be lower than that for meteorology, which is at about 10 h Pa, depending on the case studied. For long range transport simulations and/or for comparison with satellite data, the top can be set to the 200 h Pa or even at the top of meteorological one [79]. For studies at mesoscale the top can be reduced to half of the maximum value of the vertical coordinate. The model timestep is determined by the empiric rule dt ≃ 1000 × dlon (s), dlon being the grid distance in degrees. Initial and boundary conditions for meteorology can be taken either from the European Centre for Medium-range Weather Forecasts (ECMWF) Integrated Forecasting System (IFS) or from the National Centers for Environmental Prediction (NCEP) Global Forecasting System (GFS), the latter being used typically in forecast mode for real time applications.
As far as the atmospheric composition is concerned, boundary conditions can vary depending on the specific application. In the GEMS and MACC projects, the output from global and regional forecasting systems, respectively, were used. Chemical boundary conditions can be derived by CAMS products (both on global and regional scales). Another possibility is to perform simulations by nesting BOLCHEM into itself. The parent simulation, performed using climatological BC, then provide the boundary conditions for nested simulation. The latter is usually performed at the finer horizontal resolution, but with the same vertical levels as the parent domain. Results of the model used in nesting configuration, with child domain at 0.06° resolution, are shown in Buccolieri et al. [19] and in Cesari et al. [20]. Anthropogenic emissions must be provided by the user for the specific case considered. In the actual implementation, the used biogenic emissions are based on an inventory generated by NKUA (National and Kapodistrian University of Athens) in the frame of the GEMS project [61]. However, following the same methodology, it is possible to build the information for other areas of interest. In addition, in order to better integrate the different components (meteorology, chemistry, vegetation) in a fully coupled on-line model, it is preferable to connect the biogenic emissions to the vegetation database already used by the meteorological component.
As BOLCHEM was built merging different codes with different settings policies, and because running the whole model requires the control of a large number of (heterogeneous) parameters that sometimes appear with different names in different parts of the ensemble of setting, the model was equipped with a system that unifies the run setting and allows to manage the whole run, from the definition of the domain (space-time) and resolution to the download of meteo ic/bc, preparation of emissions, and the run itself. Every parameter is accessible to the user in a unique run.ini with an extensive description that provides a sort user-guide. The BOLCHEM-run system is actually a collection of tools managed by a python script and relies on cfget, a free software specifically developed for the purpose (https://packages.qa.debian.org/c/cfget.html).

3. Model Evaluation

3.1. Model Setup

The assessment of model performance was performed for a one-year run over Europe (December 2009–November 2010). BOLCHEM was operated in a one-way nesting configuration using two grids on regular lon–lat rotated coordinates where the parent domain extended over Europe with a horizontal resolution of 0.2° × 0.2°, while the nested one was centered over Italy at 0.1° × 0.1° horizontal resolution (Figure 1). The number of vertical levels is 50 for meteorology and 25 for atmospheric composition (half of the meteorological domain that over flat terrain corresponds to about 5600 m a.s.l) in both simulations.
A spin-up period of 30 days (November 2009) was used and not considered for model verification. For the parent run, boundary conditions for the meteorological processor were taken from ECMWF analysis every six hours. Meteorological runs were initialized every day at 00 UTC, while the atmospheric composition was carried through the whole simulation, i.e., the concentration after one-day simulation was used as the initial condition for the next day run. The chemical module (both aerosol and gas phase) are driven by a climatology provided by the Institut national de l’environnement industriel et des risques (INERIS) in the frame of the CityZen project [15]. For the gas phase the available species are: ozone (O3), nitric oxide (NO), nitrogen dioxide (NO2), nitric acid (HNO3), peroxyacetyl nitrate (PAN), hydrogen peroxide (H2O2), carbon monoxide (CO), methane (CH4), formaldeyde (HCHO), ethane (C2H6), butane (C4H10), etilene (C2H4), propylene (C3H6). The species in the aerosol phase are: insoluble black carbon (BC), insoluble particle organic matter (OC), soluble black carbon (BC), soluble particle organic matter aerosol (OC) and soluble sulphate (SO 4 2 ) in the accumulation mode and insoluble dust and soluble sea salt in the coarse mode. All the species are provided on a monthly basis, on a lat-lon grid at 3.75° × 2.5° longitude-latitude resolution, over 19 vertical levels. Nested run uses the output from the parent simulation as boundary conditions, both for meteorological and chemical fields. Anthropogenic emissions are based on the TNO-MAC-III emission database for the year 2010. Natural dust emissions are included in the model only as boundary conditions, with fluxes evaluated on the basis of the climatological database. The model setup follows the standard configurations in terms of PBL parameterization, microphysics, as reported in Section 2.1 and Section 2.2. Ground measurements were obtained through the public database of the European Environmental Agency AIRBASE (https://www.eea.europa.eu/data-and-maps/data/airbase-the-european-air-quality-database-2), which contains air quality data delivered annually under 97/101/EC Council Decision establishing a reciprocal exchange of information and data from networks and individual stations measuring ambient air pollution within the Member States.
This experiment aims to verify the model skill in capturing the main features of the major air quality indicators at continental and regional scales on a seasonal basis. Seasons are defined as follows: winter (DJF) includes December (2009), January and February; spring (MAM) includes March, April and May; summer (JJA) includes June, July and August; autumn (SON) includes September, October and November. The model evaluation is focused on the NO2, O3, PM2.5 and PM10 concentrations at surface level for background stations. Model surface concentration is interpolated bi-linearly at the AIRBASE locations of the selected stations. Hourly concentrations of O3 and NO2 and daily concentrations for particulate matter PM2.5 and PM10 were considered over the European region (−15° E to 30° E; 30° N to 60° N) and over Italian region (6° E to 20° E; 36° N to 48° N). For European domain, the results are compared with those of Im et al. [8] and Im et al. [9], that evaluated eight operational online-coupled models over Europe and North America for the year 2010 using common emissions and boundary conditions. BOLCHEM results for the Italian domain are compared with the forecast performed by the CAMS regional ensemble model at a horizontal resolution of 0.1° × 0.1°. CAMS ensemble model is based on nine (three in 2010) state-of-the-art numerical air quality models developed in Europe. They are combined via an ensemble approach, consisting in calculating the median value of the individual outputs [80].

3.2. Model Results

3.2.1. European Domain

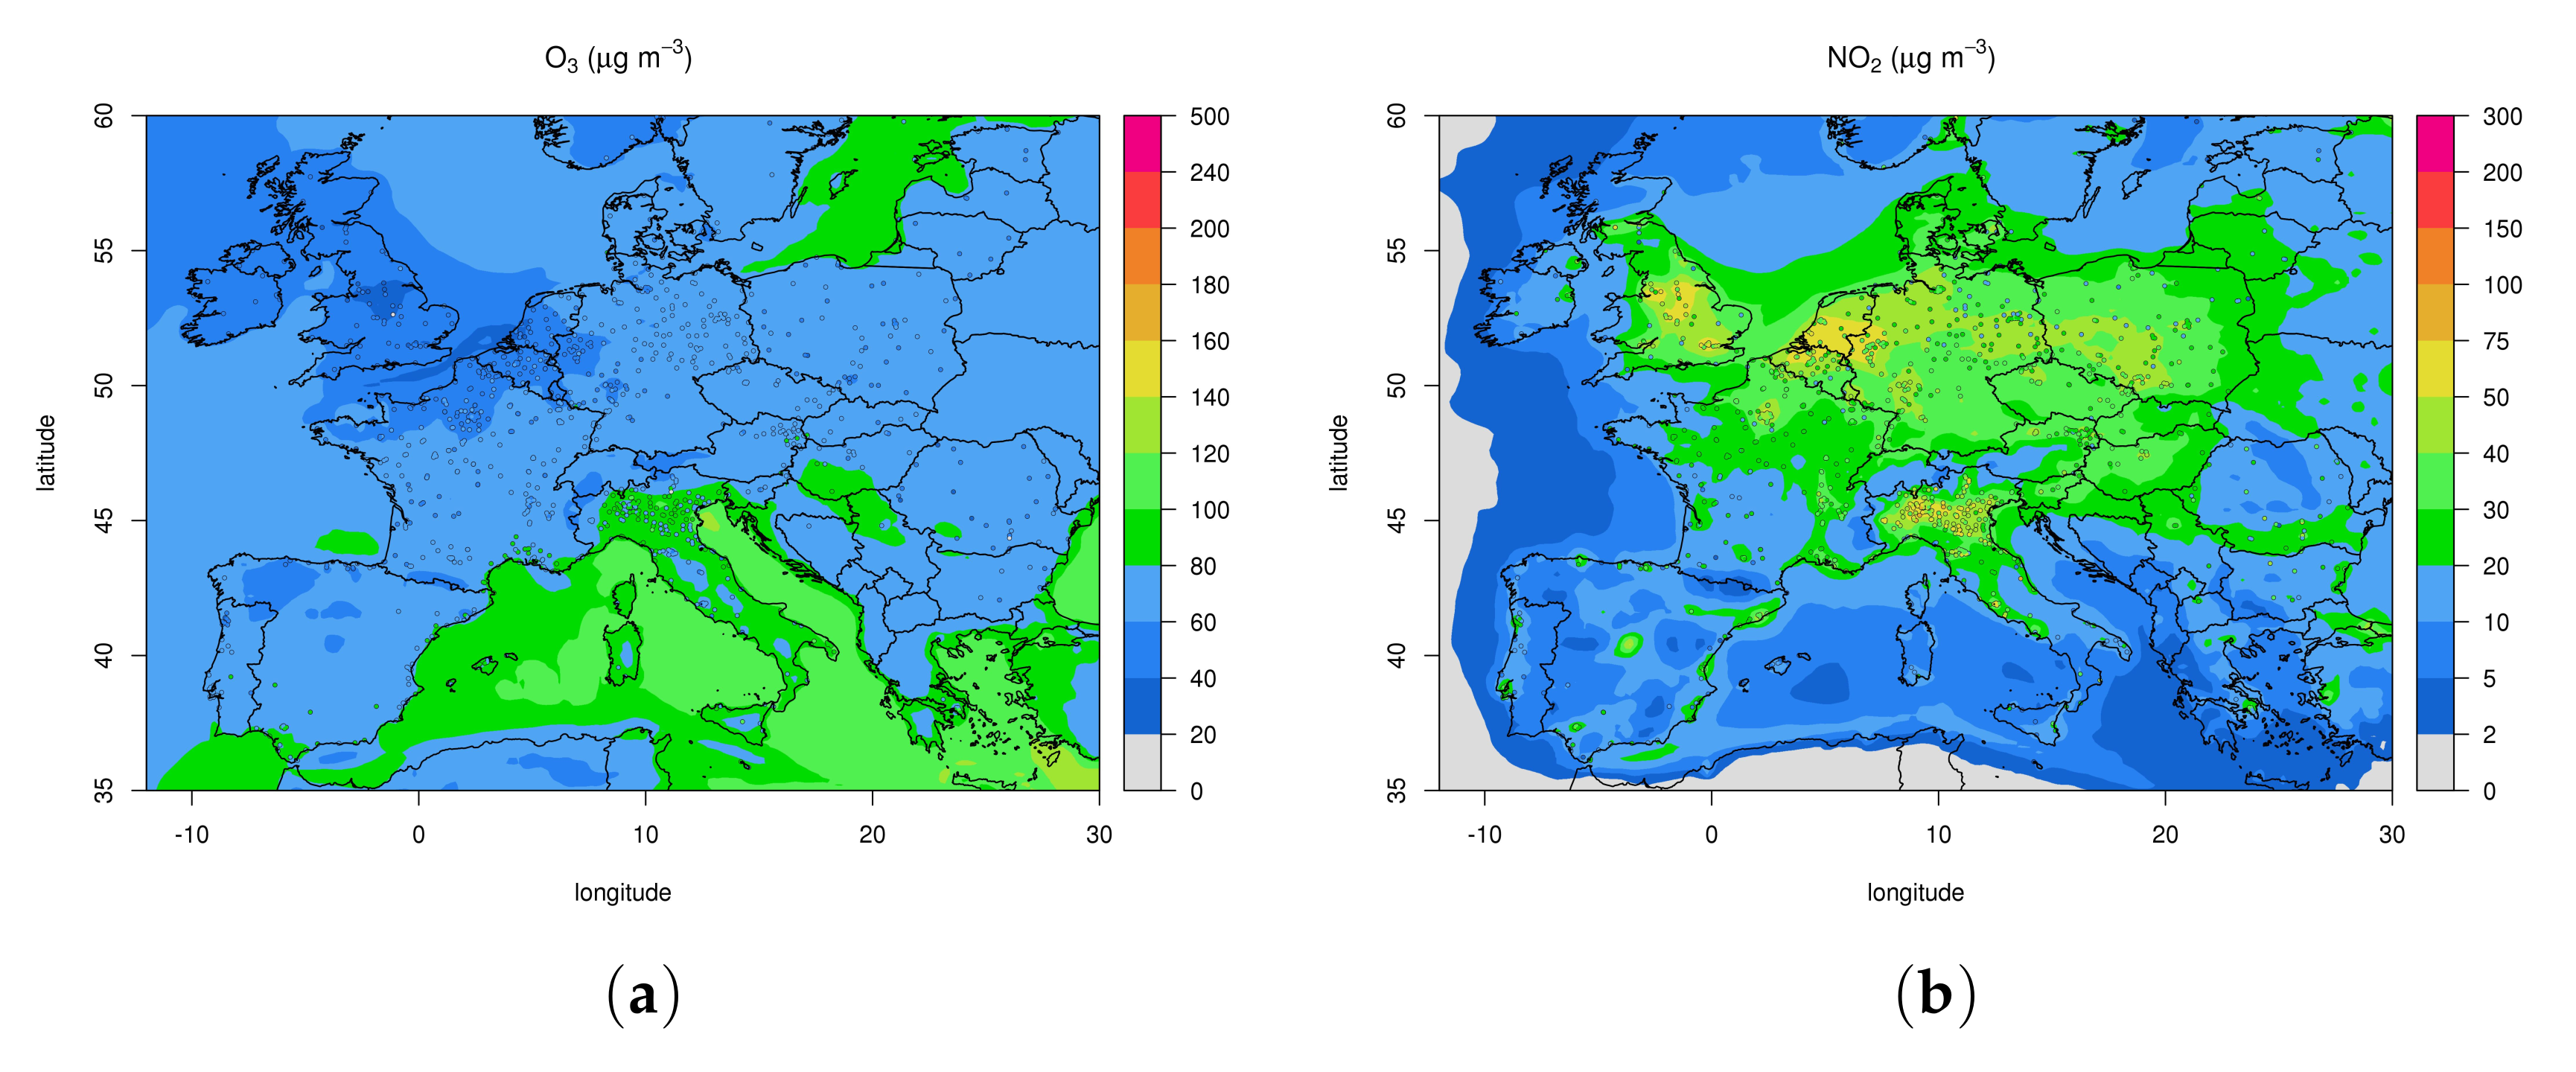
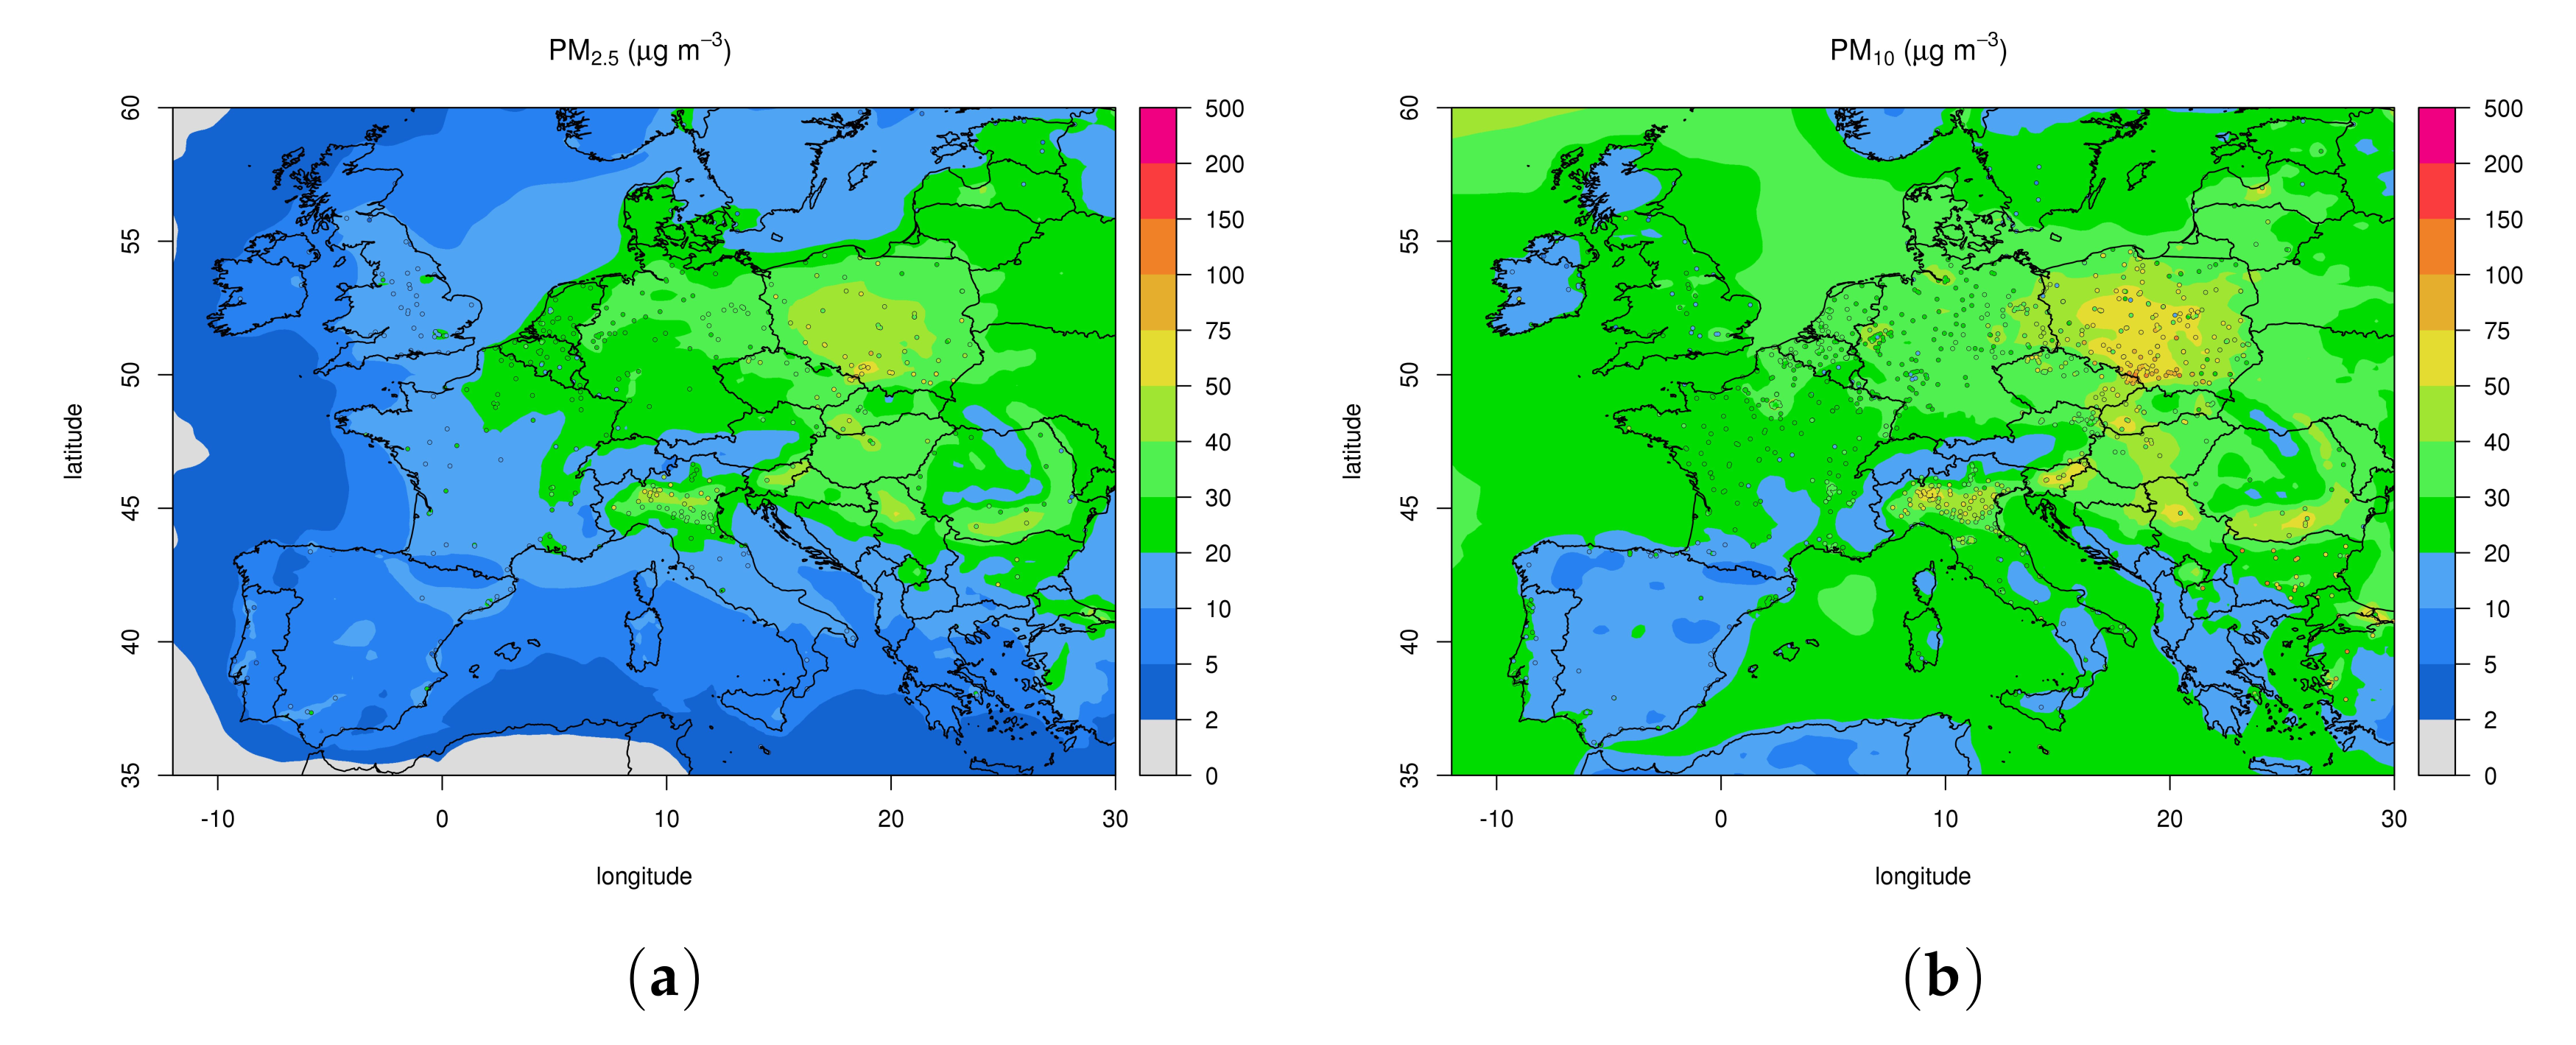
In order to give a general view of the model results, with the purpose to point out the model capability in reproducing the spatial variability over the European and Italian domain, a seasonal average of observed values superimposed to modeled ones over the domain of interest are presented in Figure 2 and Figure 3.
The seasonal average of concentration for particulate matter PM2.5 and PM10 and NO2 is considered during the cold season (DJF), while the seasonal average of O3 concentration is considered during the warm season (JJA). According to measure availability, daily values for PM2.5 and PM10 and hourly values for NO2 and O3 are used. In Figure 2 and Figure 3 the position of used Airbase stations is represented by circle marks. At the same locations, filled circles represent the measured concentrations. Figure 2 and Figure 3 depict a fairly good overall agreement, with well captured spatial structure. In particular for O3, higher concentration values are found in the South Regions of the domain and over the Mediterranean Sea. Values over Spain and the French Mediterranean coastline are well reproduced, with a slight overestimation over Northern Italy (Po Valley). For NO2, high value over Po Valley are well reproduced, concentration values over North Europe and Great Britain regions are overestimated. For PM2.5 and PM10 we found a reasonably good overall agreement. In particular, in the most critical areas over the European domain, such as Po Valley and Benelux, the model captures the observed, strong spatial gradient. The high concentration values observed over Poland are also well reproduced.
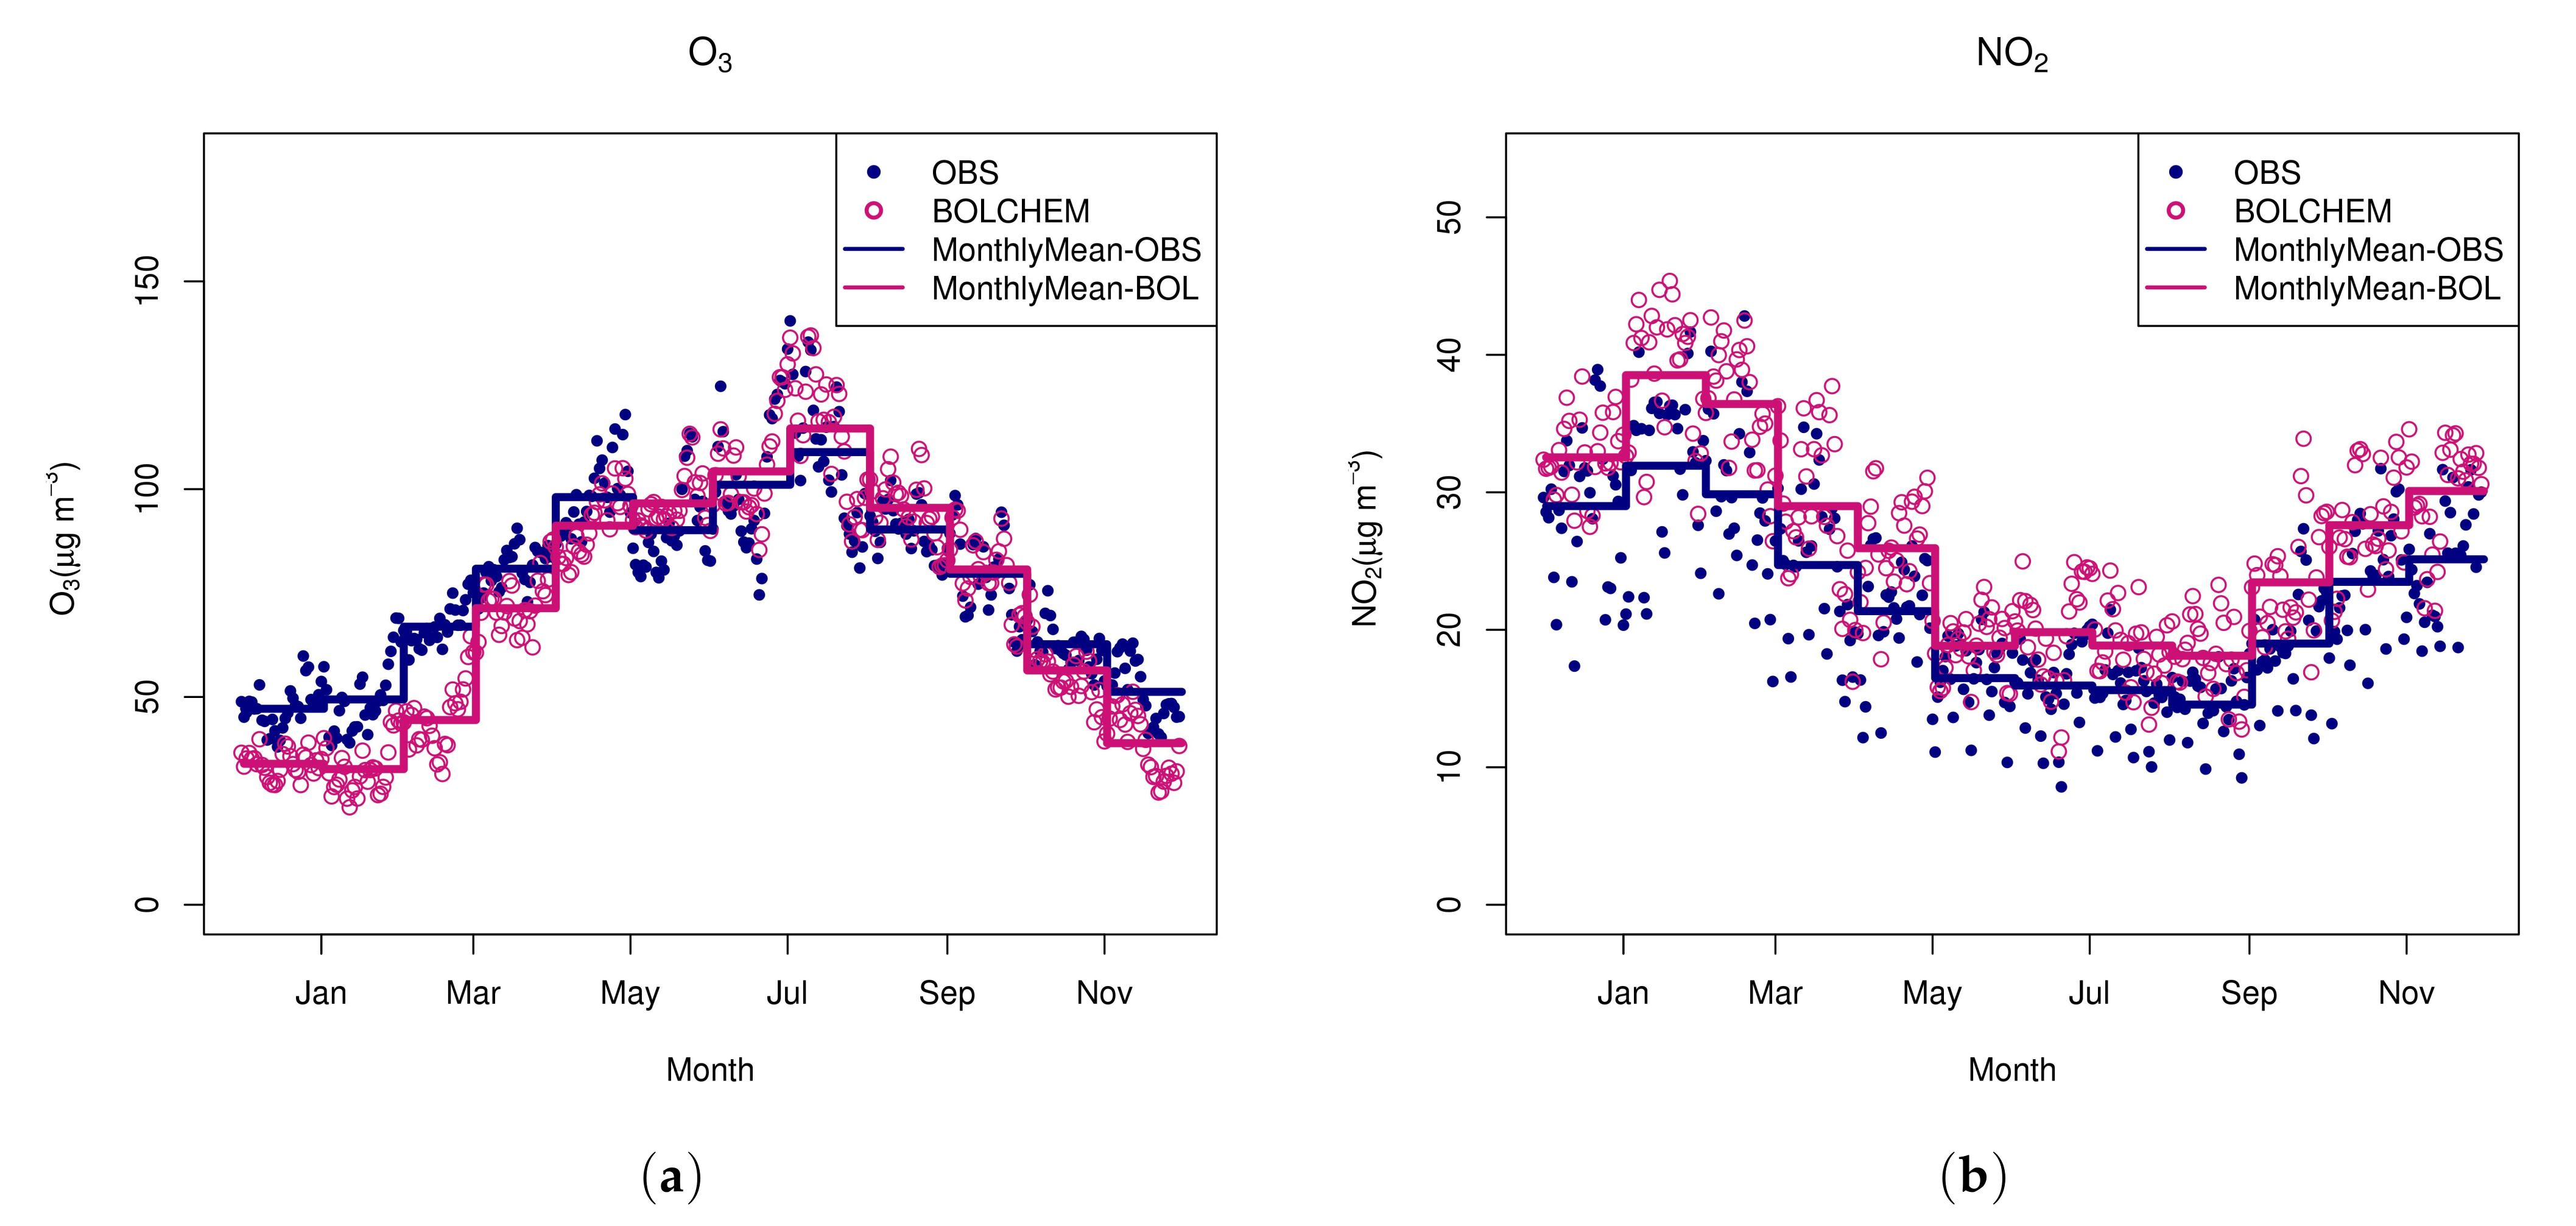
The model also captures the monthly variability, as shown in Figure 4 and Figure 5. Monthly mean value is considered for all the pollutants, with the exception of O3, for which the monthly average is calculated using the maximum daily 1-h average concentration. It displays a good agreement with observation in summer, when the O3 levels are higher (Figure 4a). The underestimation observed during the cold season could be related to an excessive O3 titration by a high value of NO. This seems confirmed by the large overestimation of NO2 observed in the winter period (Figure 4b).
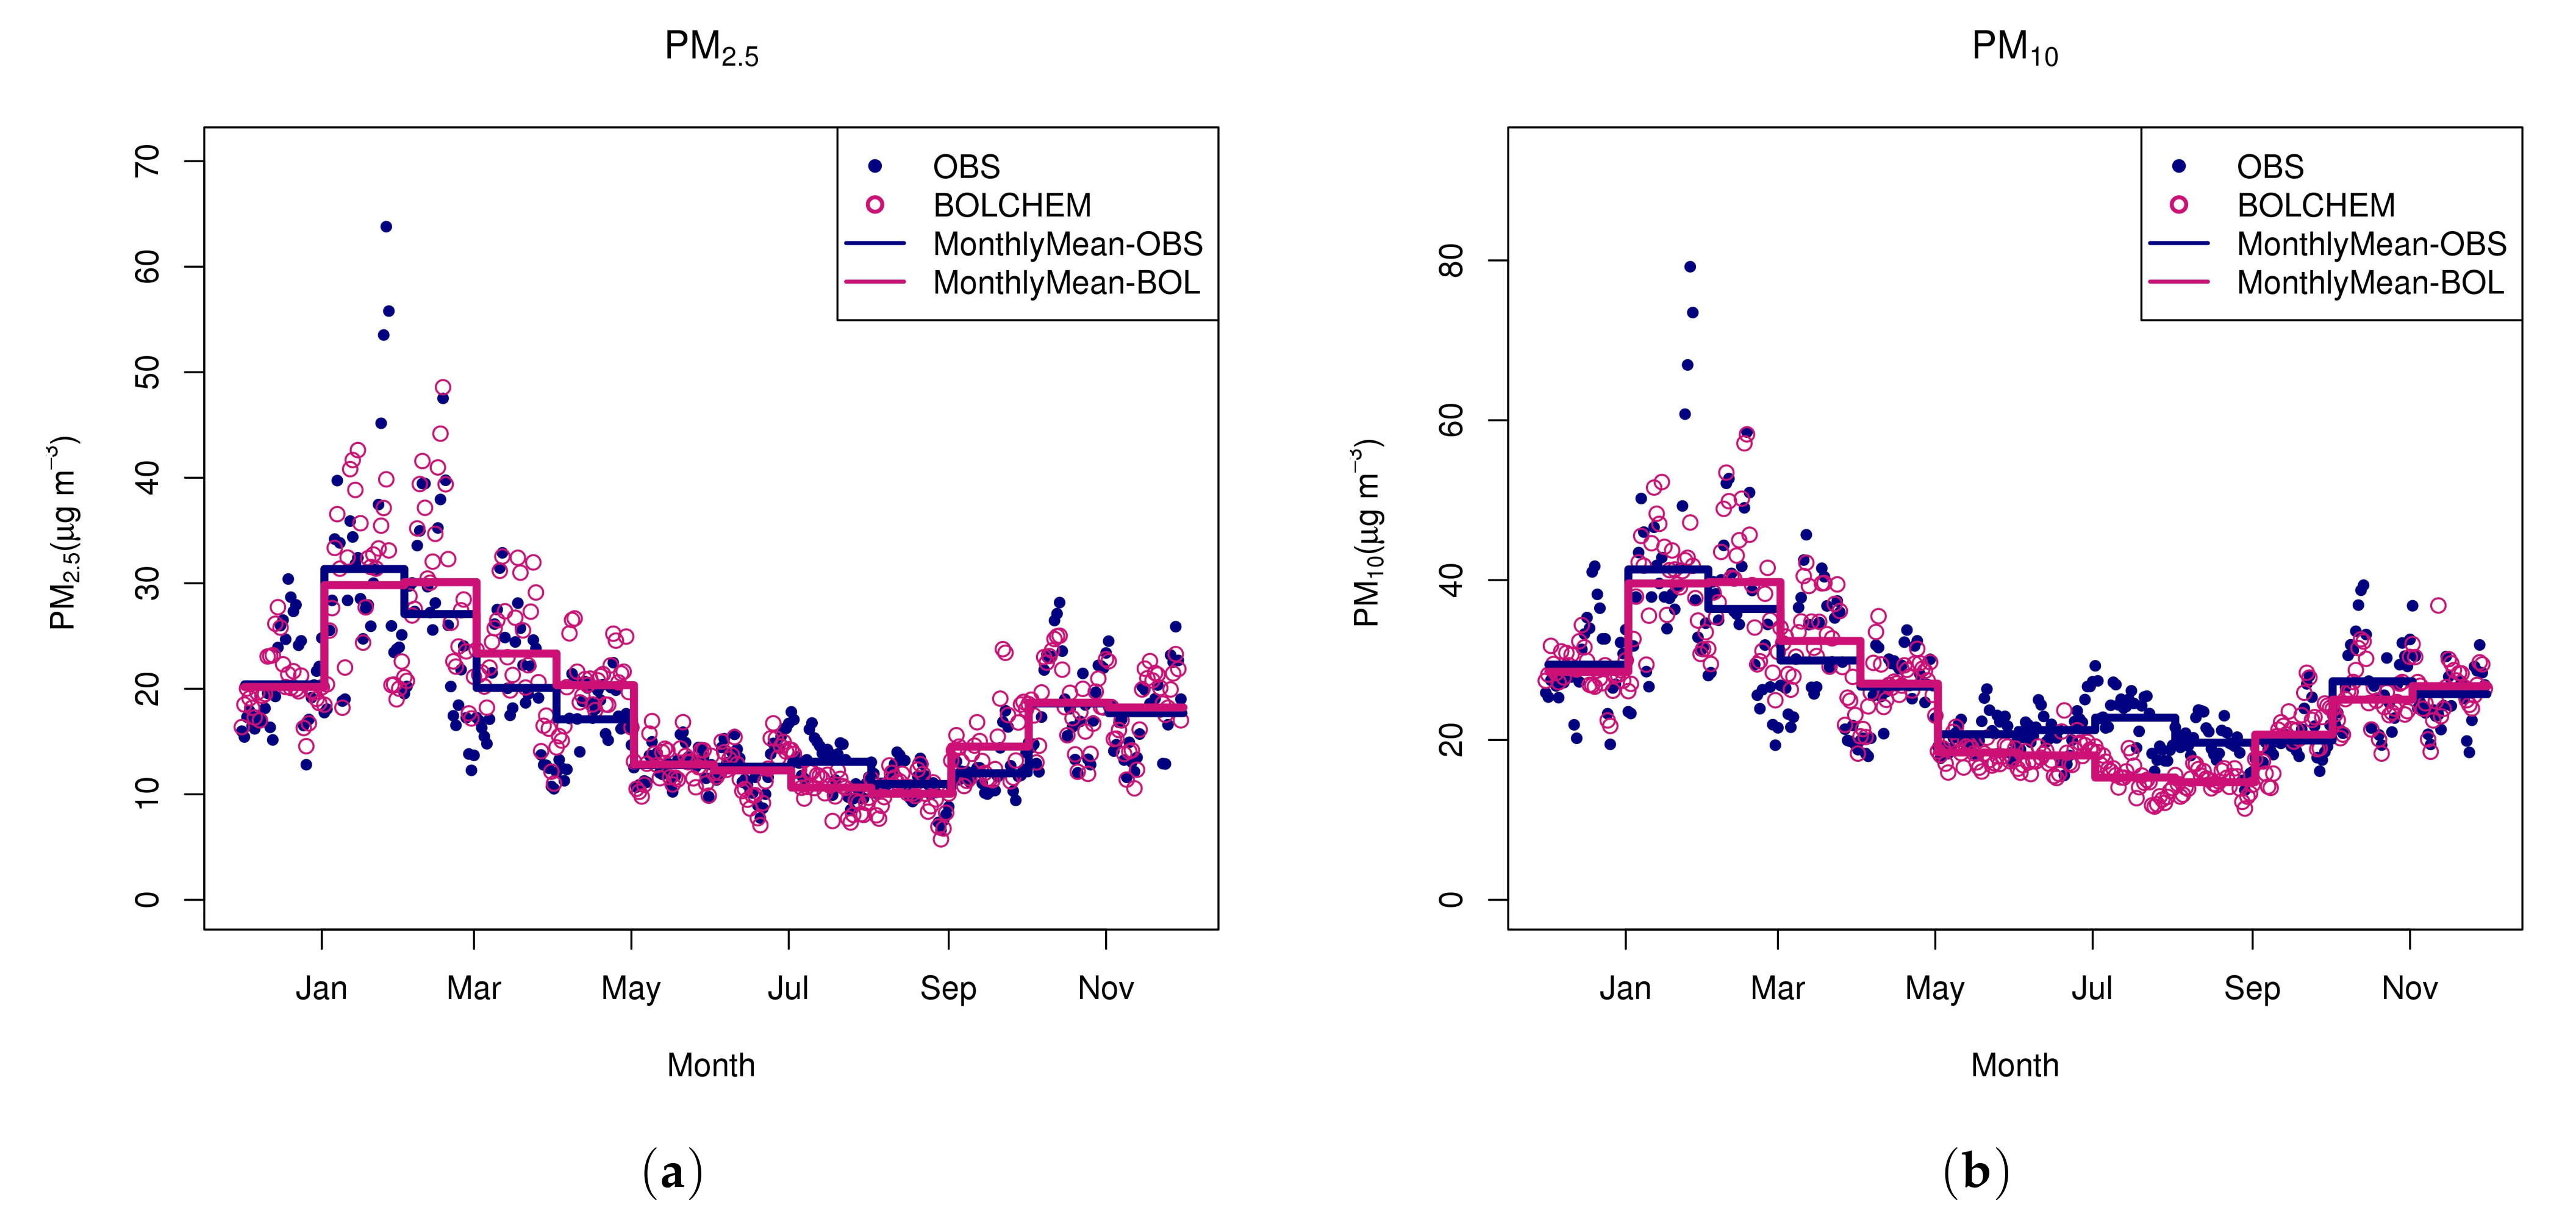
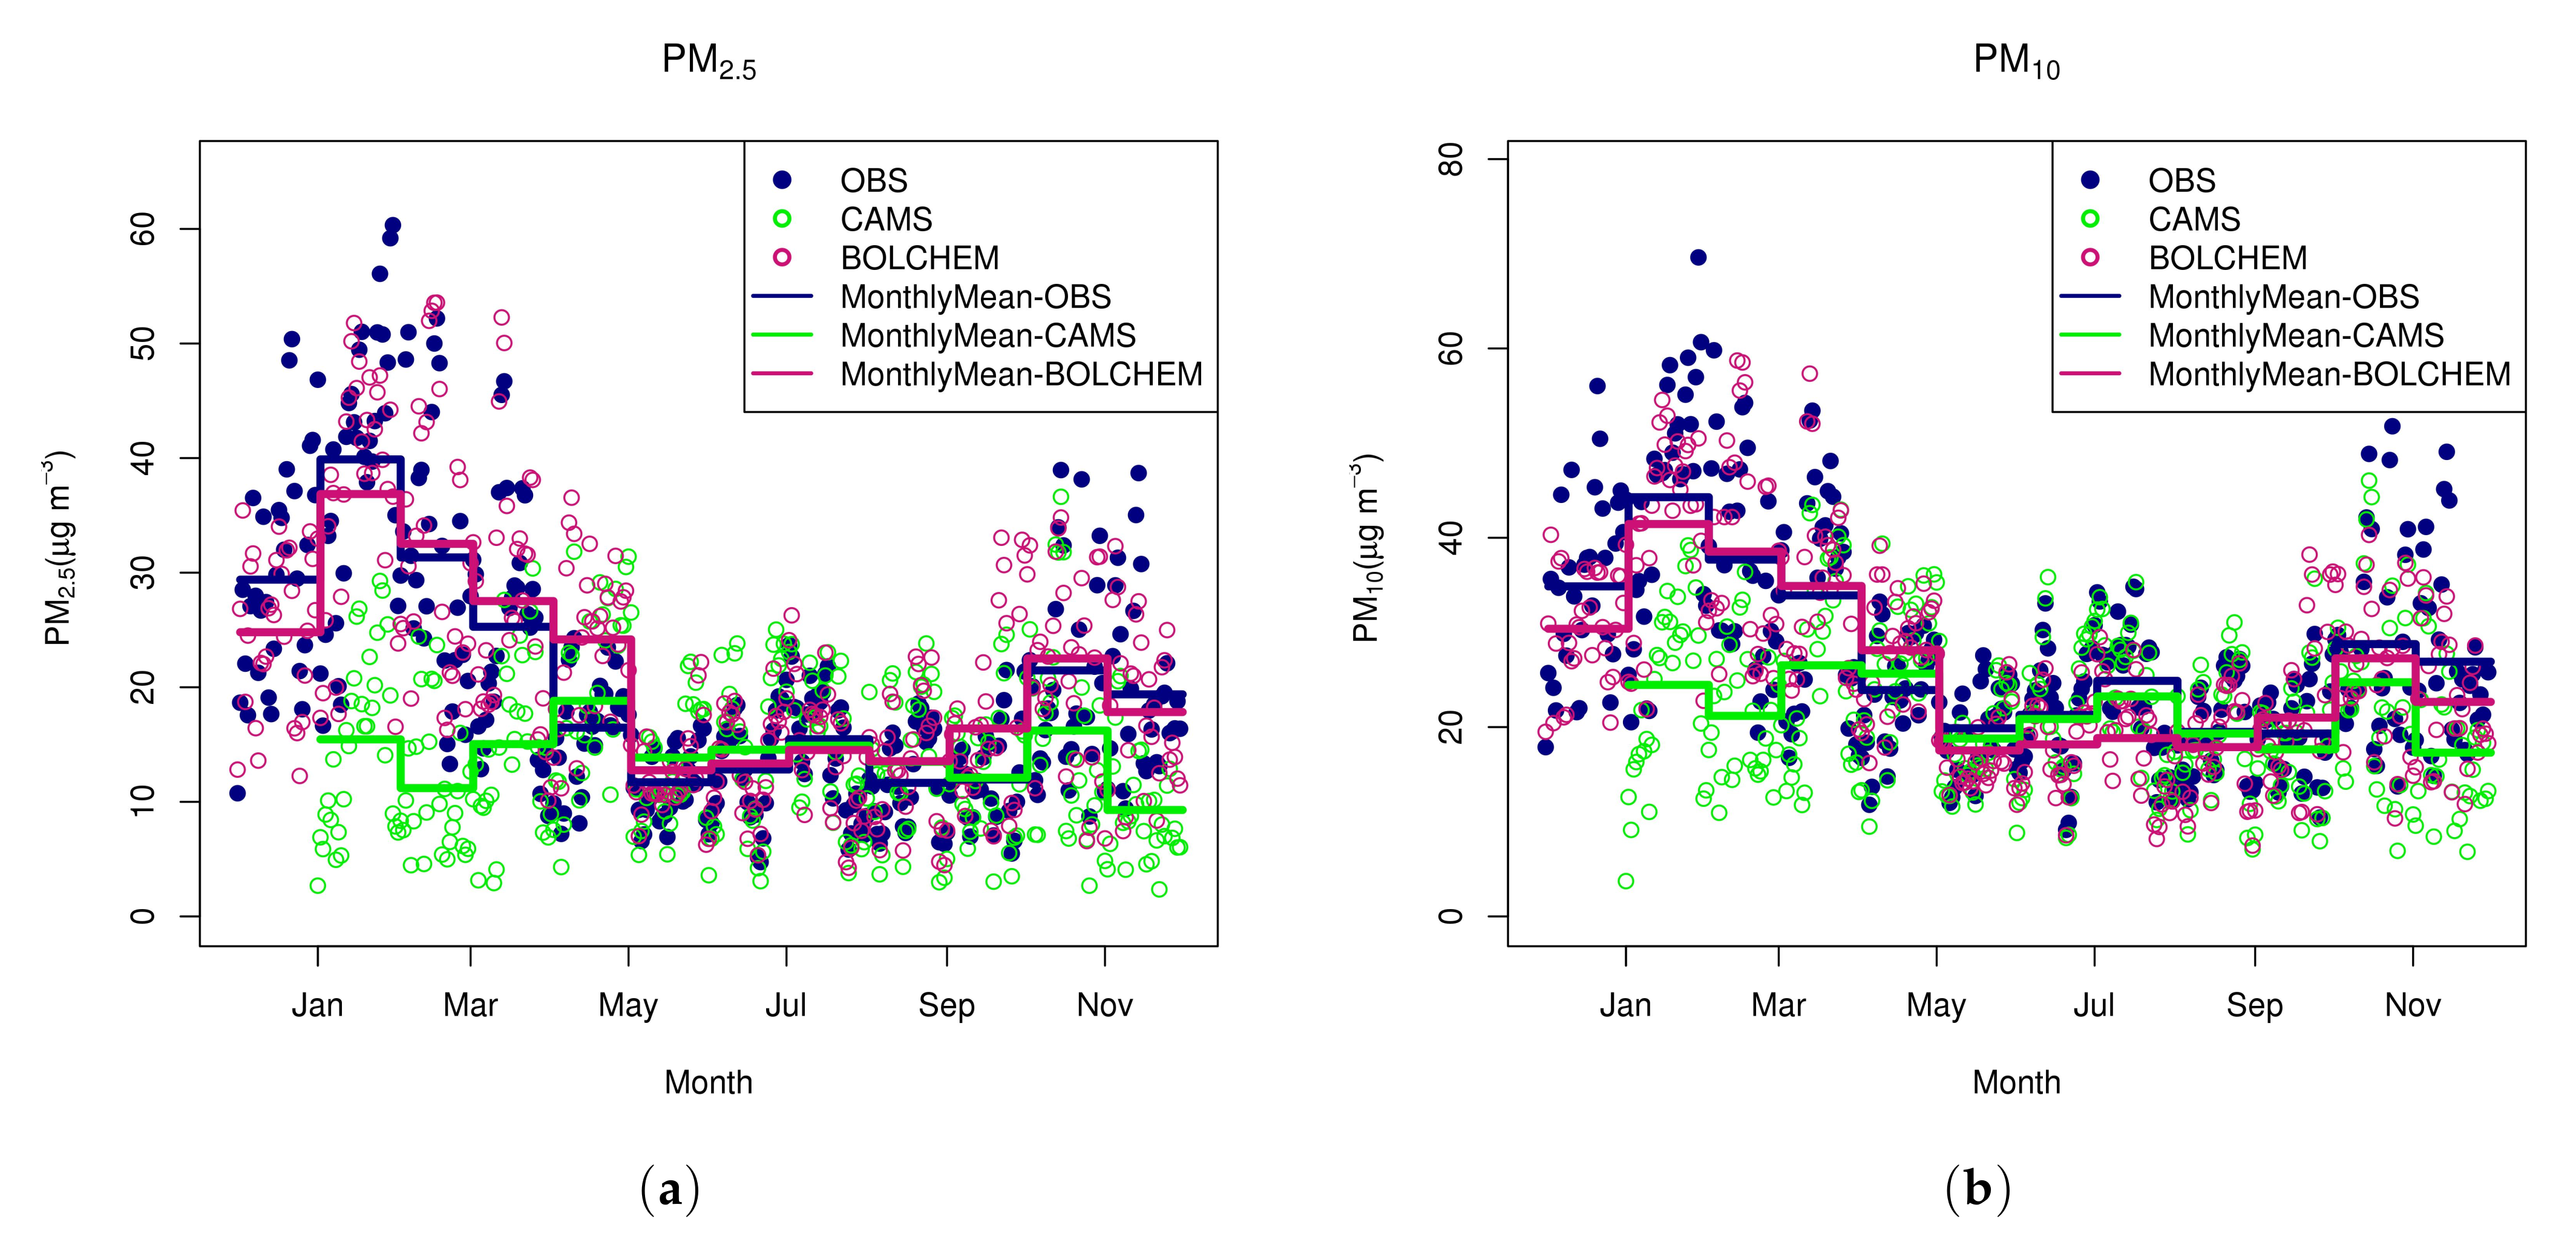
For PM2.5 and PM10 the model well reproduces the monthly variability throughout the year with a weak overestimation during spring and underestimation in summer. The larger underestimation in PM10 than in PM2.5, suggests that this could be attributed to Saharan dust storms. Moreover, the model seems to fail to reproduce the PM peaks observed between January and February, probably due to single events of transport at large scale (e.g., Saharan dust) or to accumulation near the ground due to high stability meteorological conditions not well reproduced by the model.
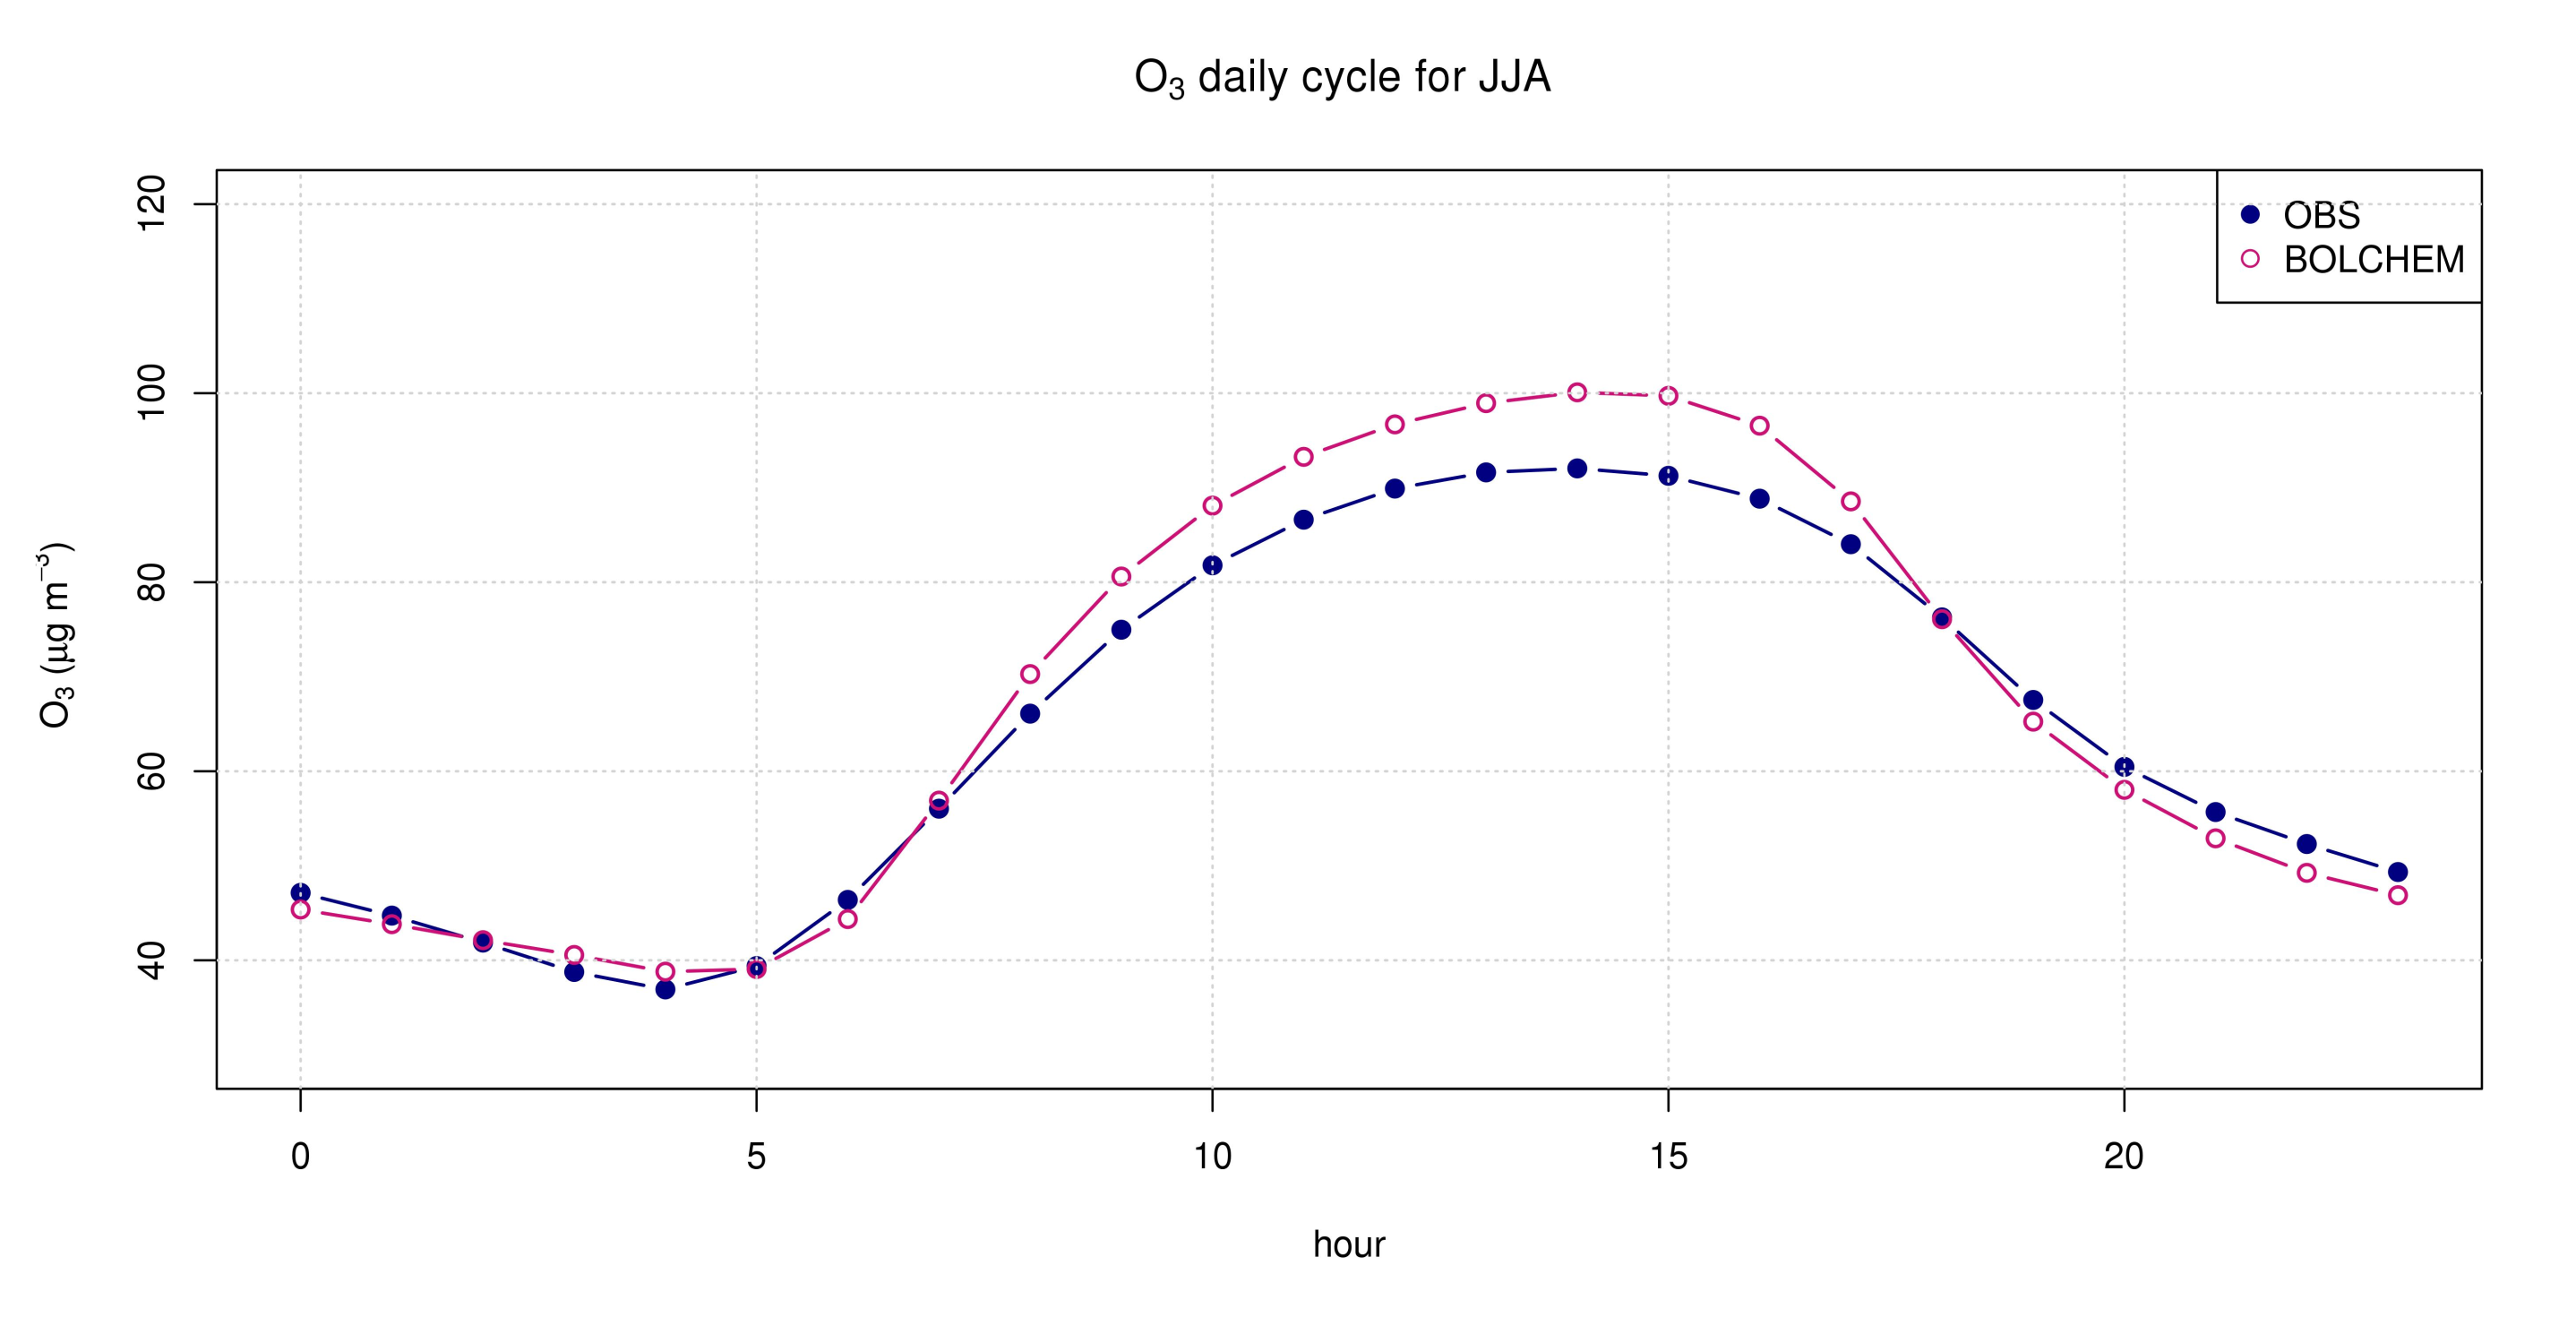
More information on the model capability to describe O3 behavior, in particular the daily variability, can be obtained by the diurnal cycle, which is mostly driven by solar radiation. O3 in summer presents a typical diurnal cycle with the maximum located in the early afternoon, which is the main feature affecting air quality. Figure 6 shows, for the summer season, measured concentration vs. modeled concentrations. The model well reproduces the diurnal cycle of ozone concentration, although a slight overestimation during the daytime.
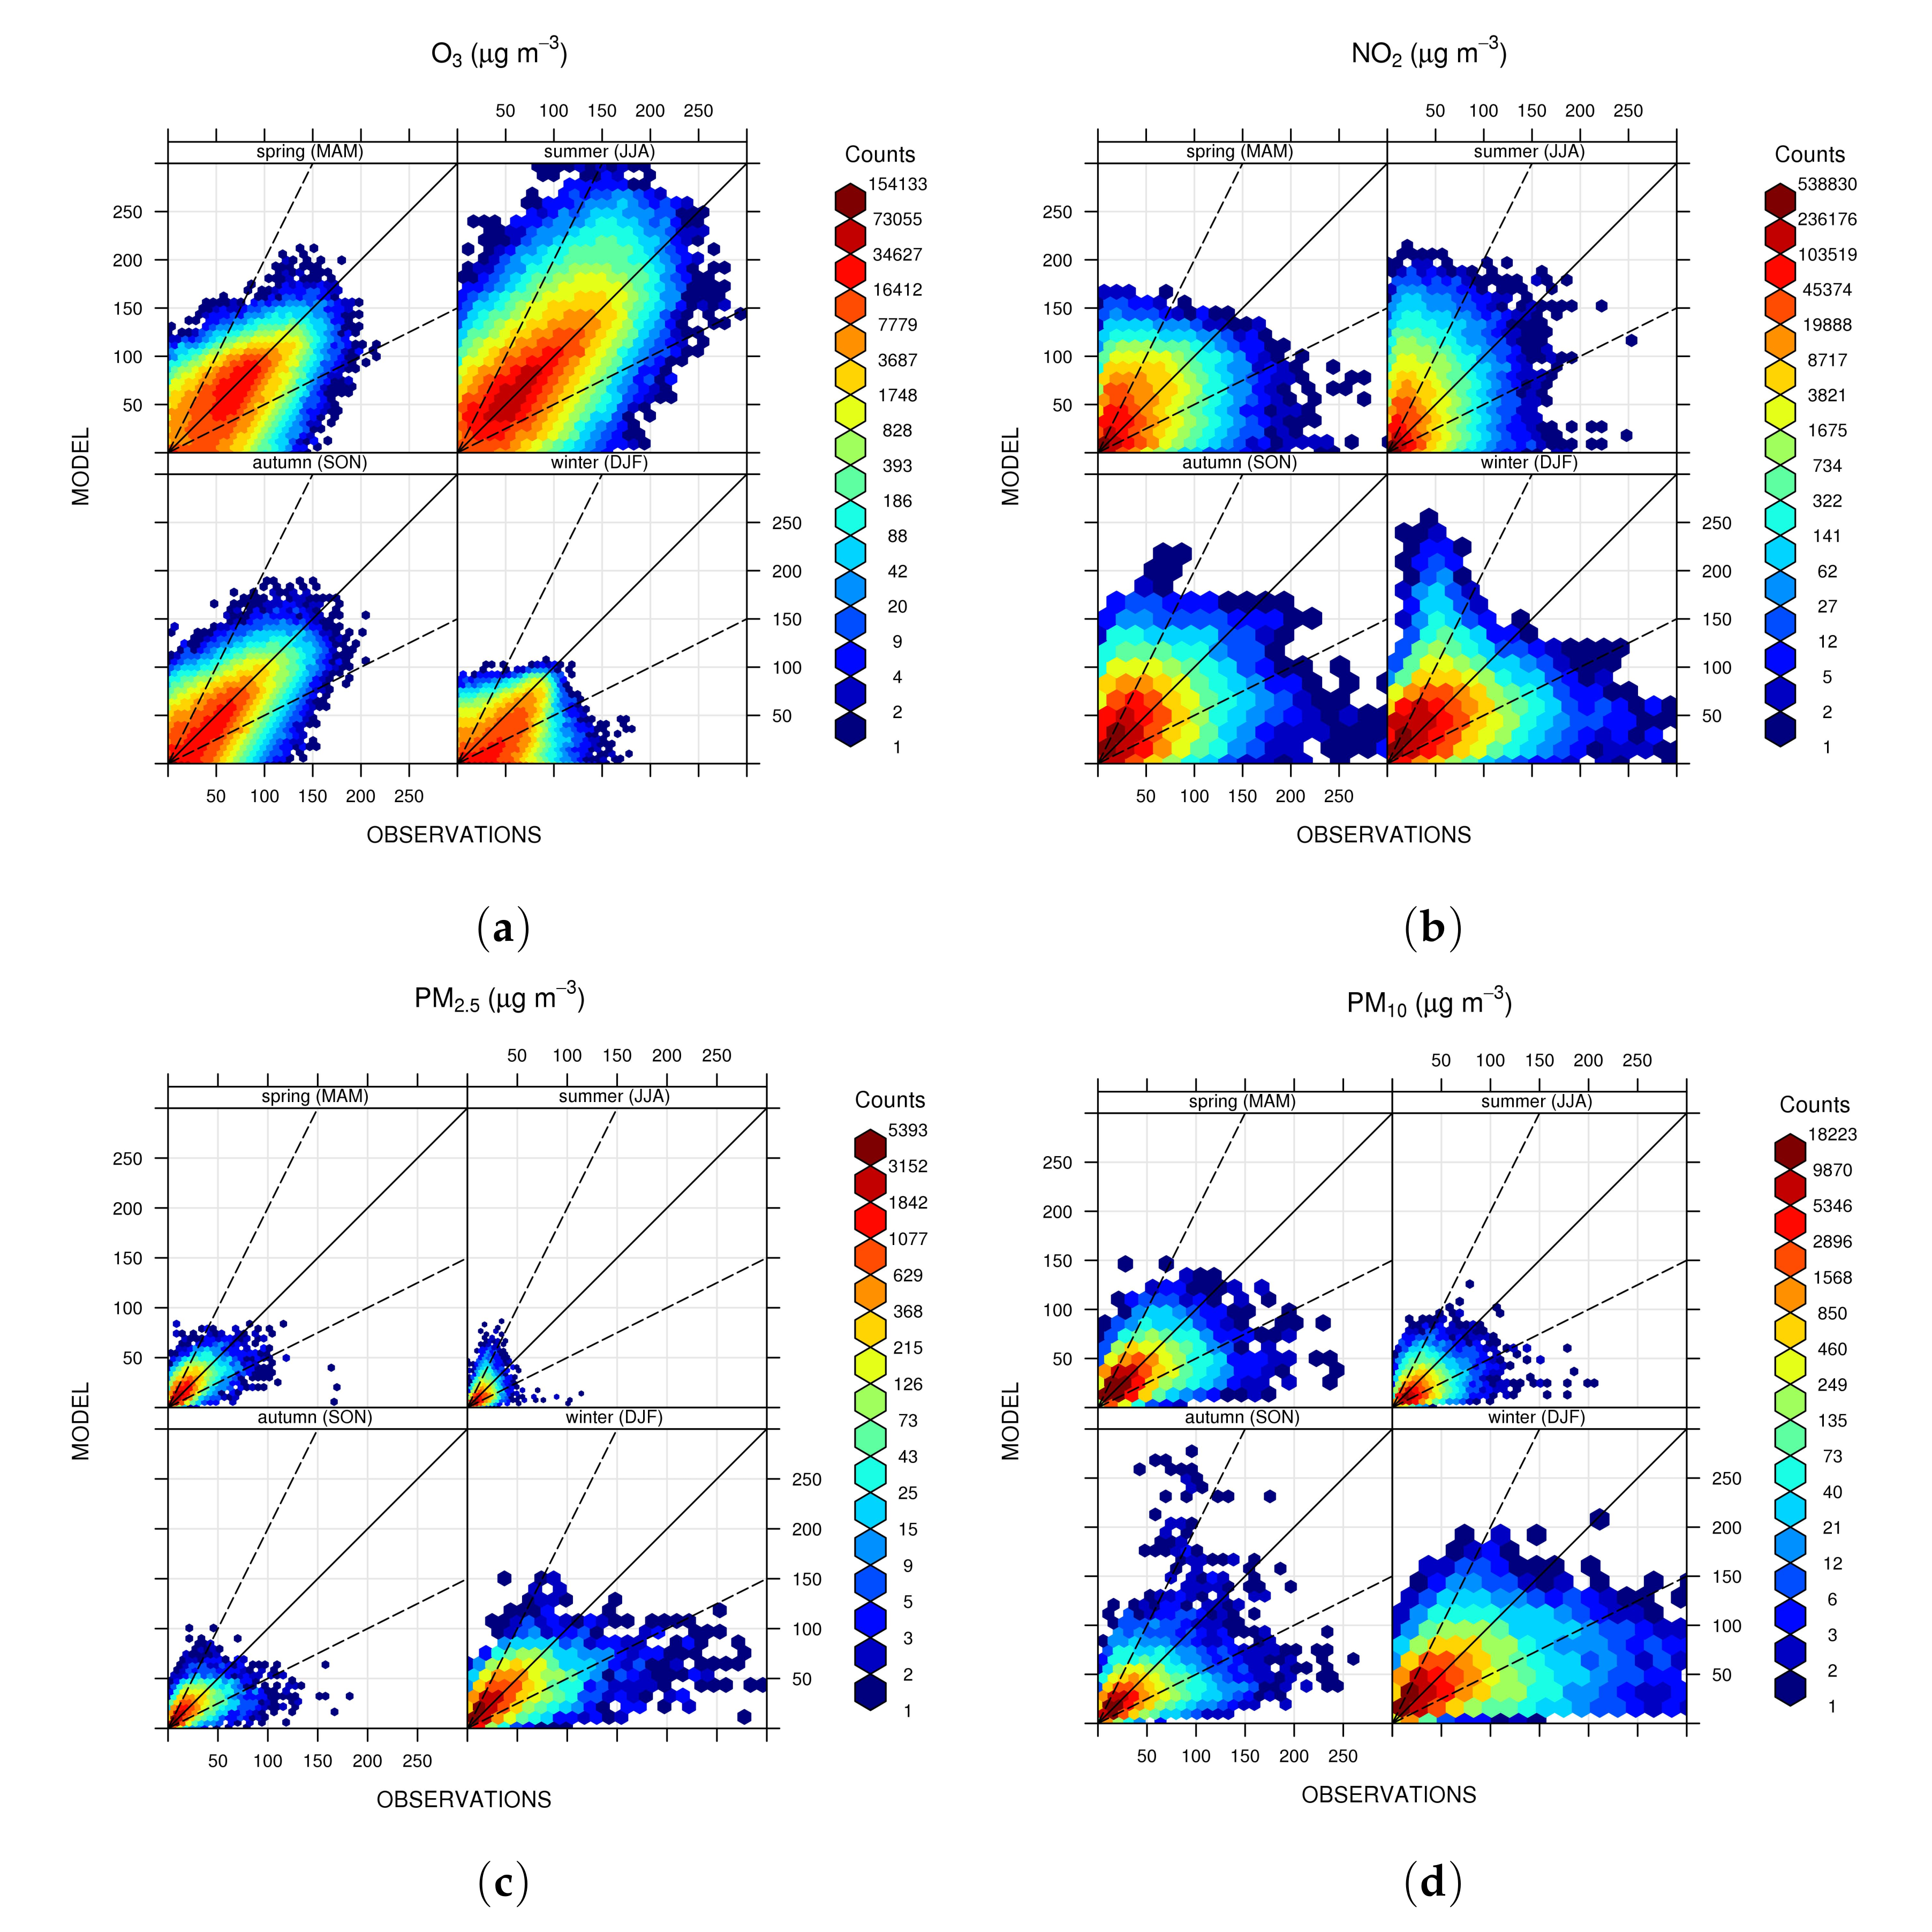
Model performance in reproducing the observed concentrations, without any averaging operation (temporal or spatial), is highlighted by the scatter plot diagram. Figure 7 display concentration data as hexagonal points, each having as x-coordinate the measured pollutant concentration (µg m−3), and as y-coordinate the simulated pollutant concentration (µg m−3) (at the same time and the same Airbase station). In the color bar are reported the number of samples falling in each hexagon. Hourly values have been used for NO2 and O3 concentrations, and daily value for PM2.5 and PM10. Results are shown on a seasonal basis. For O3, the best agreement is found in the summer. For the spring season, also affected by a moderately high O3 concentration, the model performances are satisfactory, although a slight model underestimation is evident. More persistent underestimation is present for the cold seasons, especially in winter. This result doesn’t represent a serious limit to the model application, being O3, unlike PM, not a typical winter pollutant. The concentration of PM10 is well reproduced by the model in winter, and encouraging results were achieved for the remaining seasons, as pointed out by the basic statistics reported in Table 1. PM2.5 shows results similar to those of PM10. NO2 shows similar results for all seasons, with a slight model overestimation of low concentration values and underestimation of high concentration values. We can therefore note that for O3 and particulate matter (PM2.5 and PM10) the best agreement was found in the seasons where the two pollutants are most abundant, respectively. It is worth noting that the basic statistics, R = 0.72 for O3 as well as R = 0.66 for PM2.5 underpin the good model performance in terms of temporal correlation.
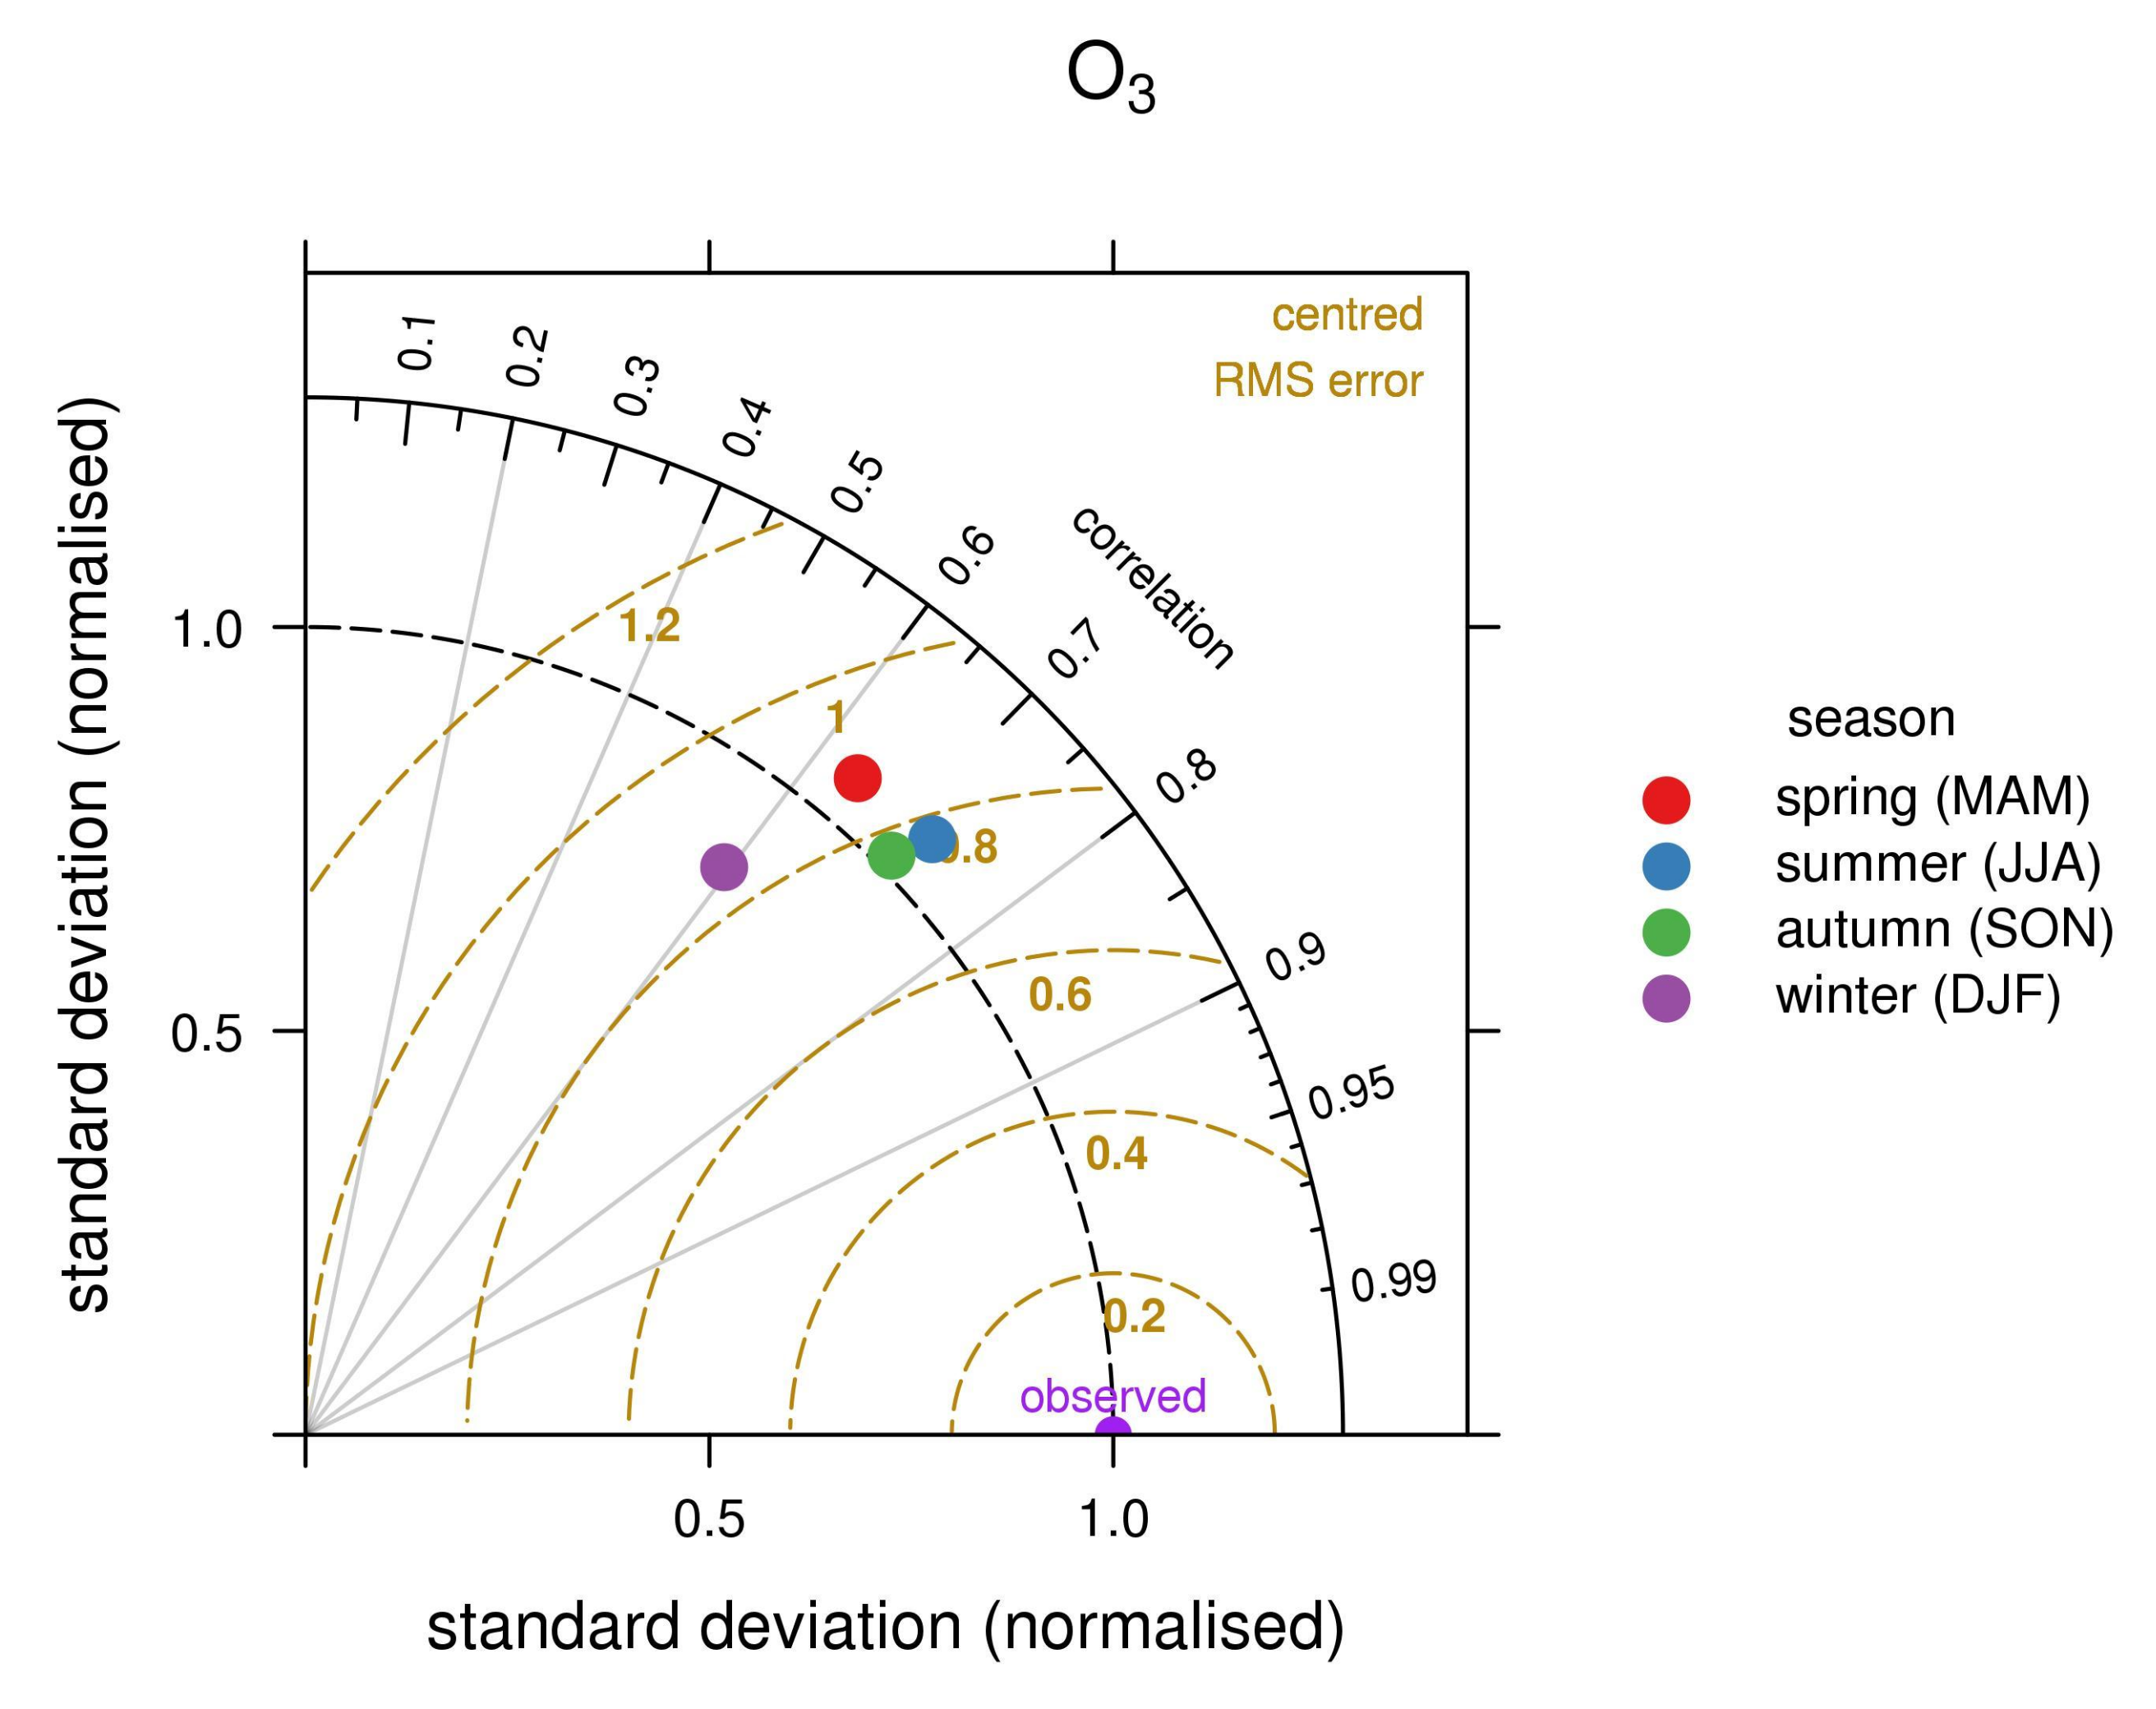
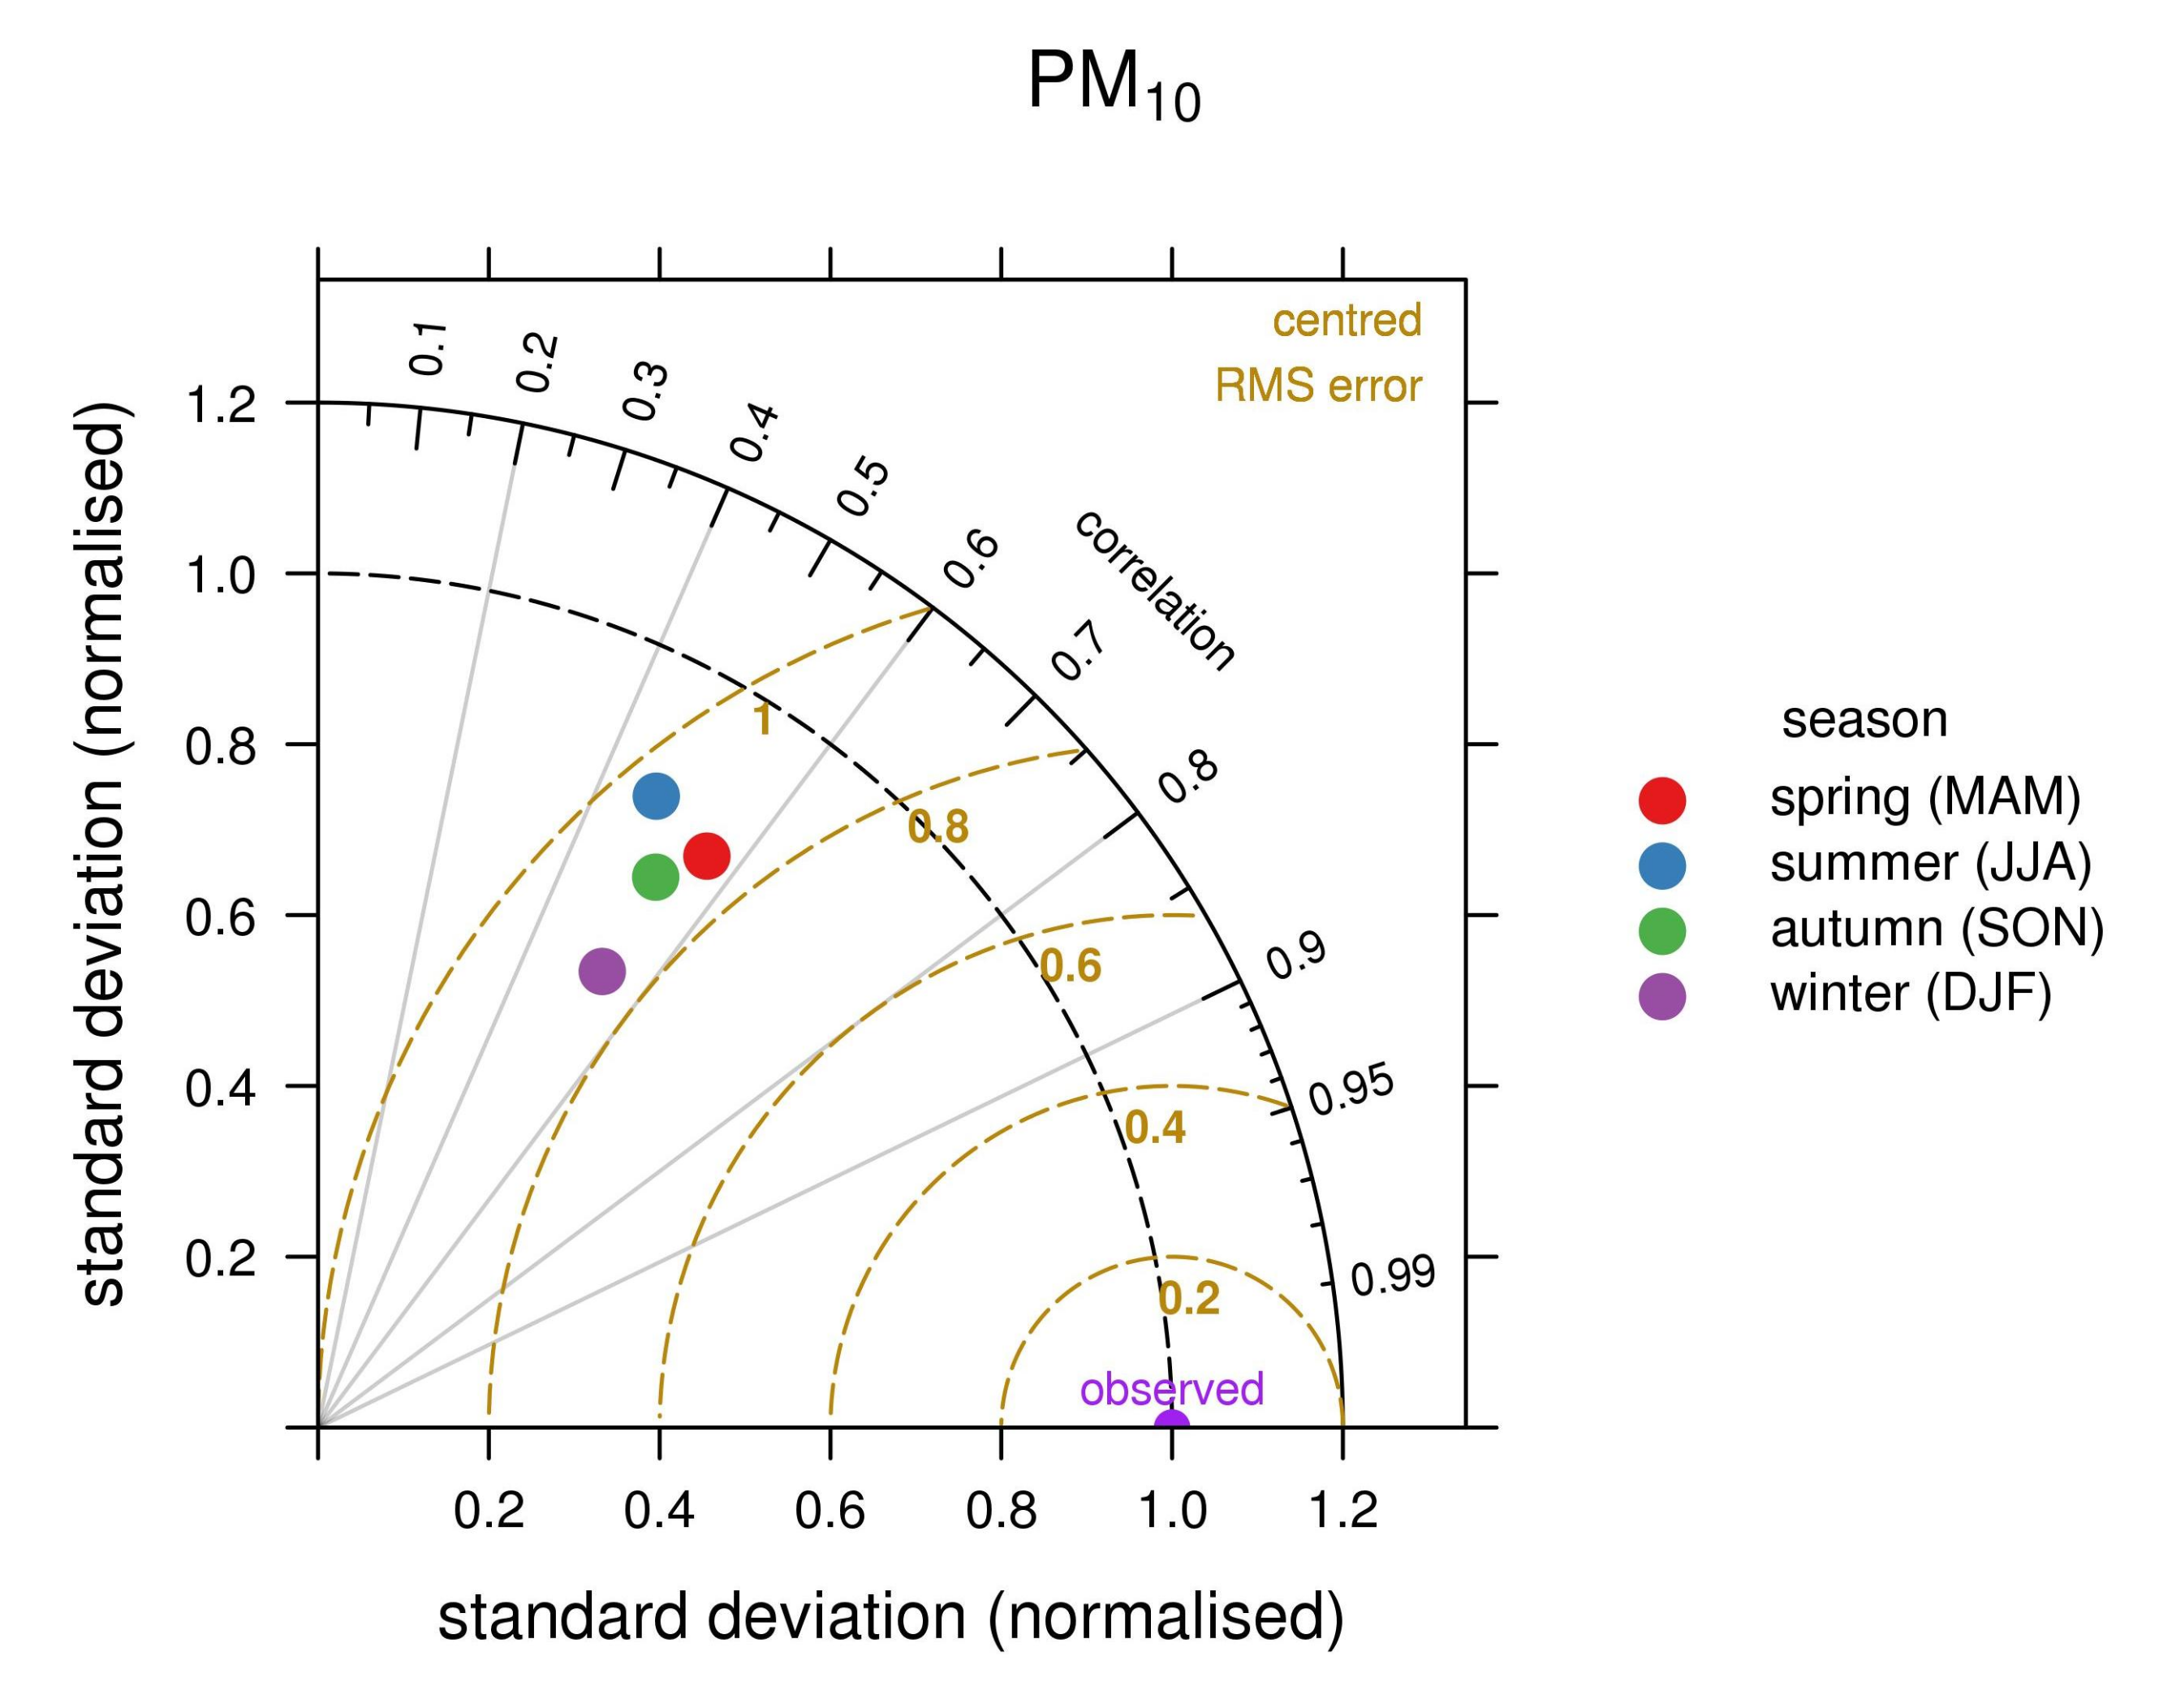
The simultaneous variation of the correlation coefficient R, of the standard deviation (sigma) and of the (centered) root-mean-square error is shown on seasonal basis by the Taylor diagrams (Figure 8, Figure 9, Figure 10 and Figure 11).
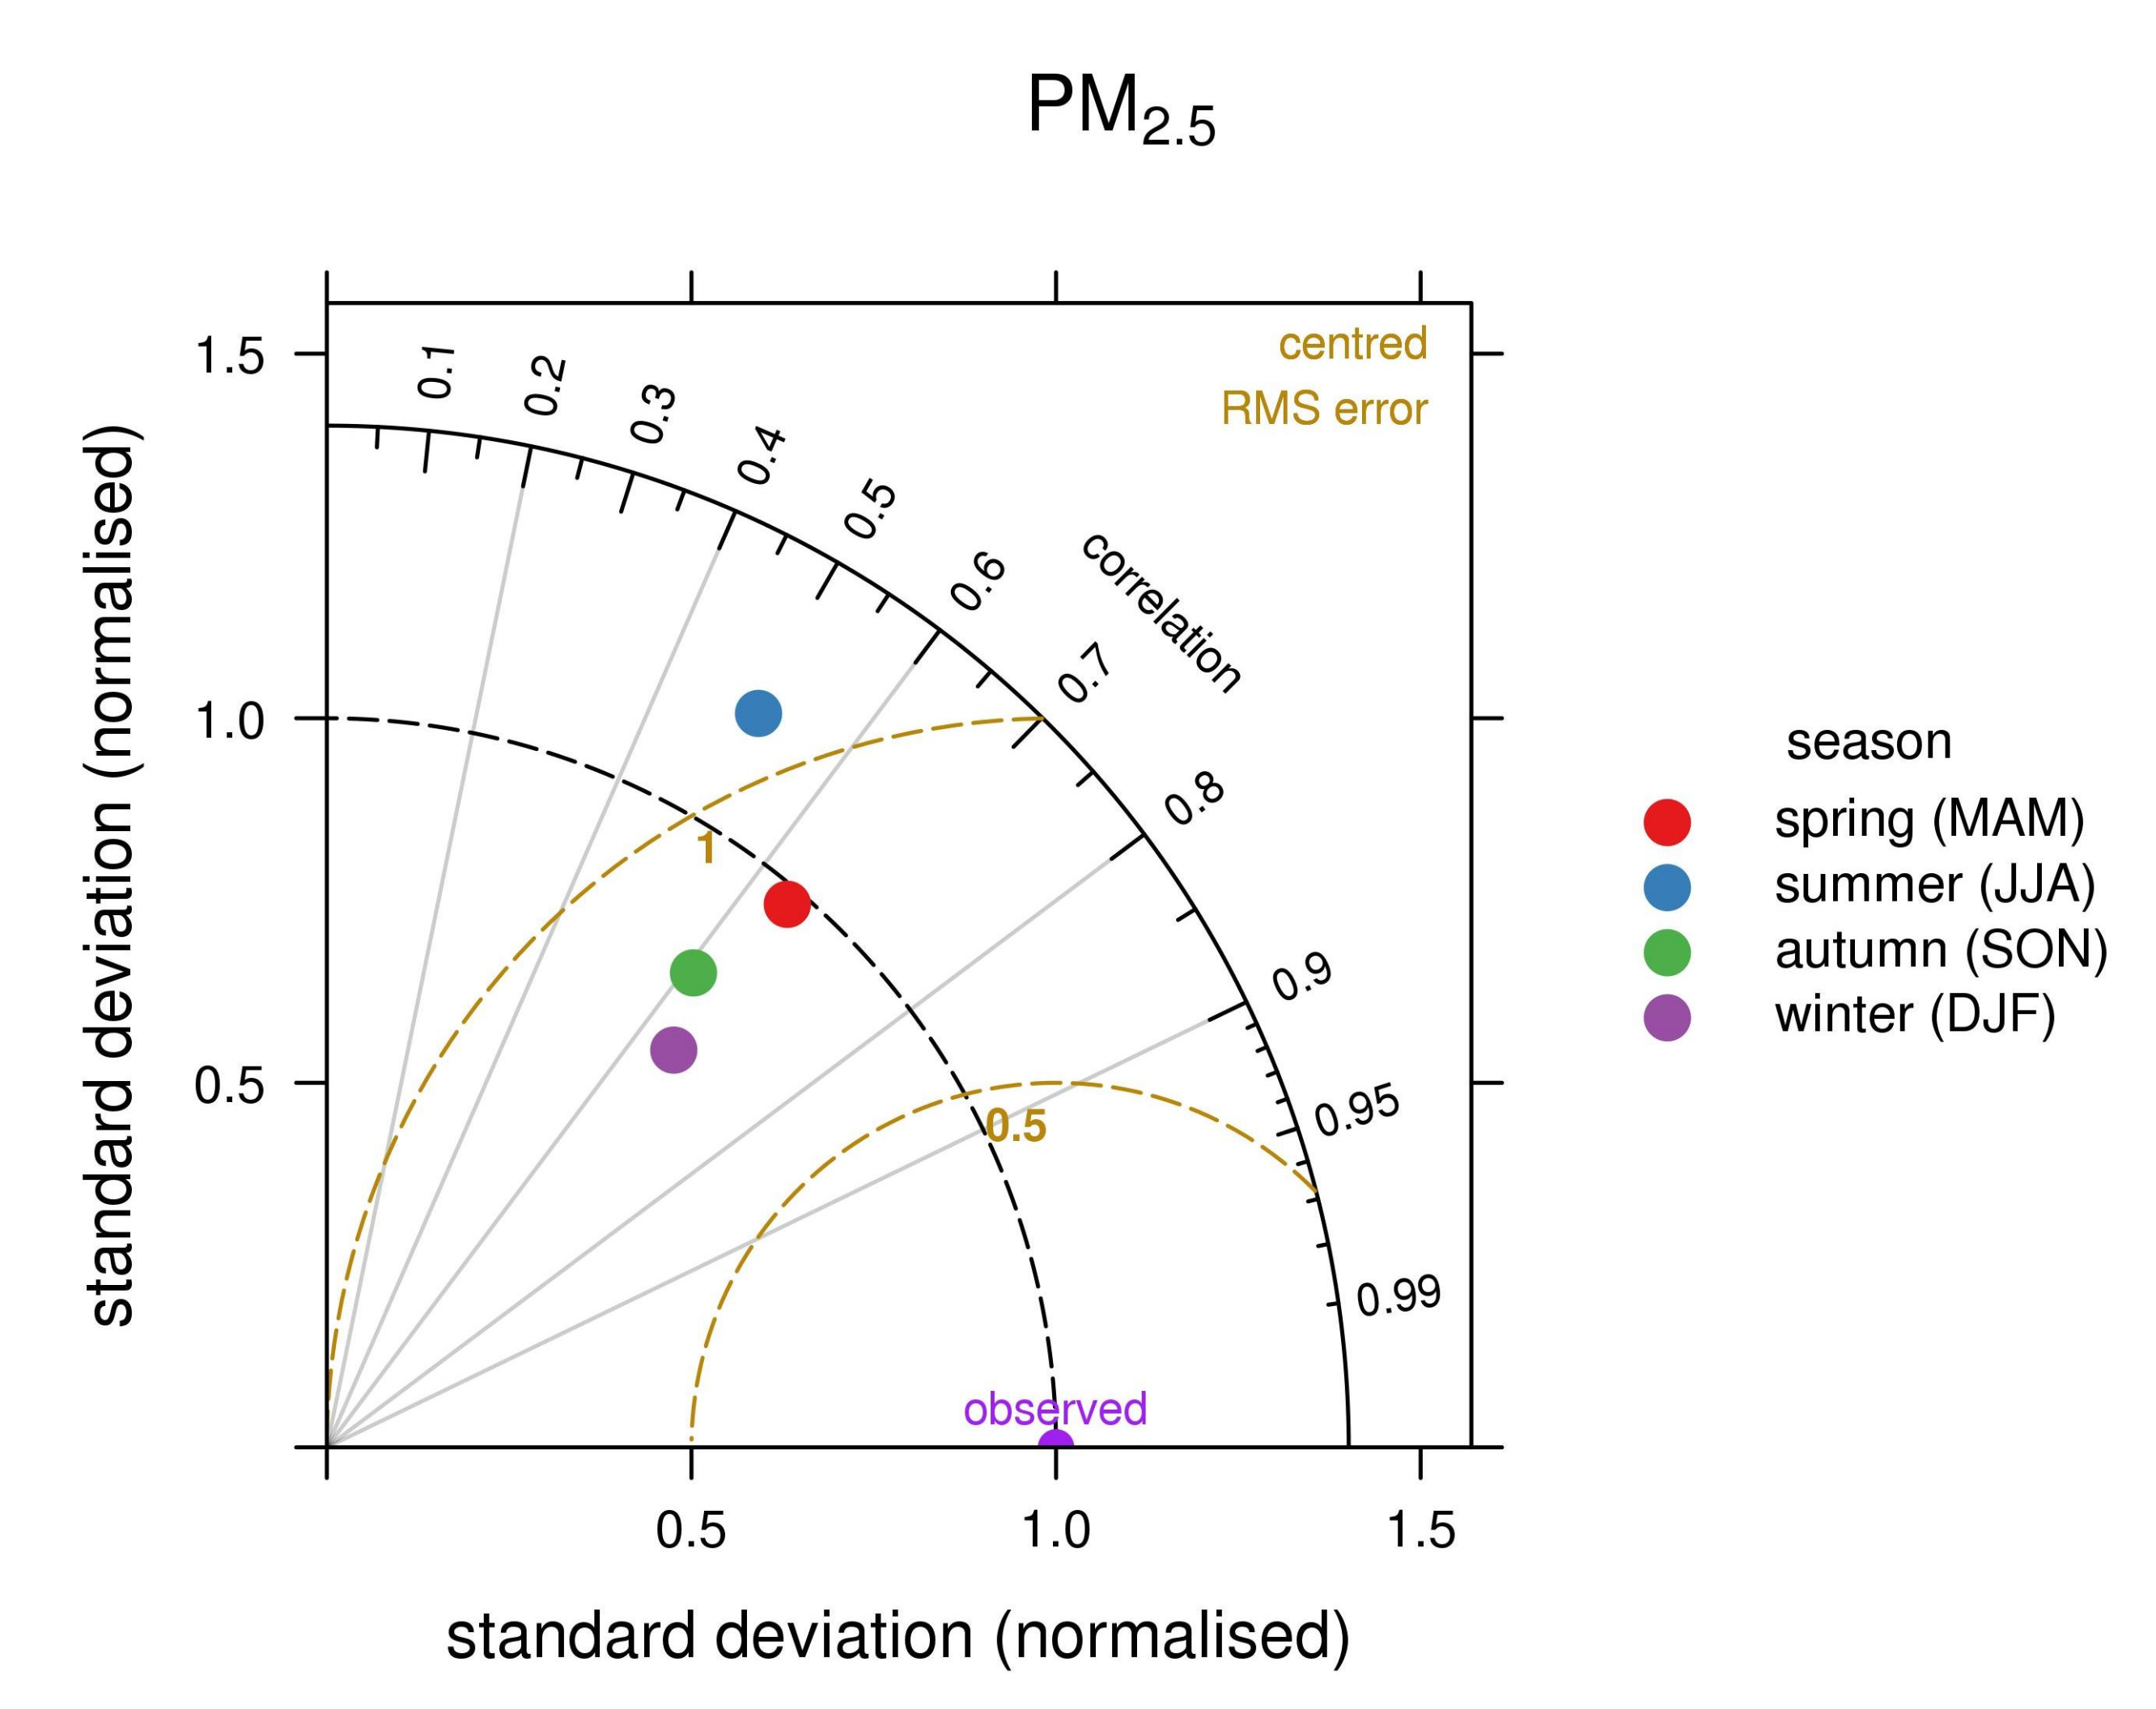
The diagrams point out that for the O3 (Figure 8) the best model performances are in summer and autumn, with the higher value for the correlation coefficient R, the lower value for the RMSE and the normalized SD close to unit. Anyway, also for the other seasons, the value of SD indicates that the variability of the model data is similar to the variability of observations. In winter, the model data having less variability than the measurements (SD < 1) and the correlation coefficient has the lower value. For NO2 (Figure 9), the model data have more variability than the measurements in all season, except in winter. The correlation coefficient shows similar values in all seasons. Model PM2.5 data show more variability in summer season (Figure 10). For PM10, Figure 11 highlight the general underestimation of the model data variability in all the season. The model has the best performance in the winter and spring season.
It can however be observed that for all pollutants the model performances are close to those achieved by the current state-of-the-art model system dedicated to air quality study [8,9,80]. Im et al. [8] found that for O3 the temporal variations were better captured in all models in summer and autumn. The correlation coefficient R was between 0.8 and 0.9 in summer, and between 0.6 and 0.8 in winter. It was found a general underestimation of the annual surface O3 by up to 18%, especially in winter and spring, while overestimation of the observed concentration was found in autumn. In BOLCHEM the correlation coefficient varies from 0.59 (winter period) to 0.72 (summer period). As regards the mean bias, we found MB = −14.96 µg m−3 in winter and MB = 2.15 µg m−3 in summer. Im et al. [9] showed that for PM the monthly temporal variations were not captured by any of the models, particularly in winter. The rural PM10 was reproduced with R = 0.18 − 0.86, while the variations at urban sites were reproduced with slightly lower agreement (R = 0.06 − 0.82). Underestimated was found by all models: from 10% to 66% over the rural stations and from 43% to 75% over the urban one. Similar results were obtained for PM2.5 concentration. In BOLCHEM the correlation coefficient varies between 0.47 and 0.56 for PM10 and between 0.51 and 0.66 for PM2.5. PM concentration is underestimate in summer with MB = −5.22 µg m−3 for PM10 and MB = −1.24 µg m−3 for PM 2.5.

3.2.2. Italian Domain

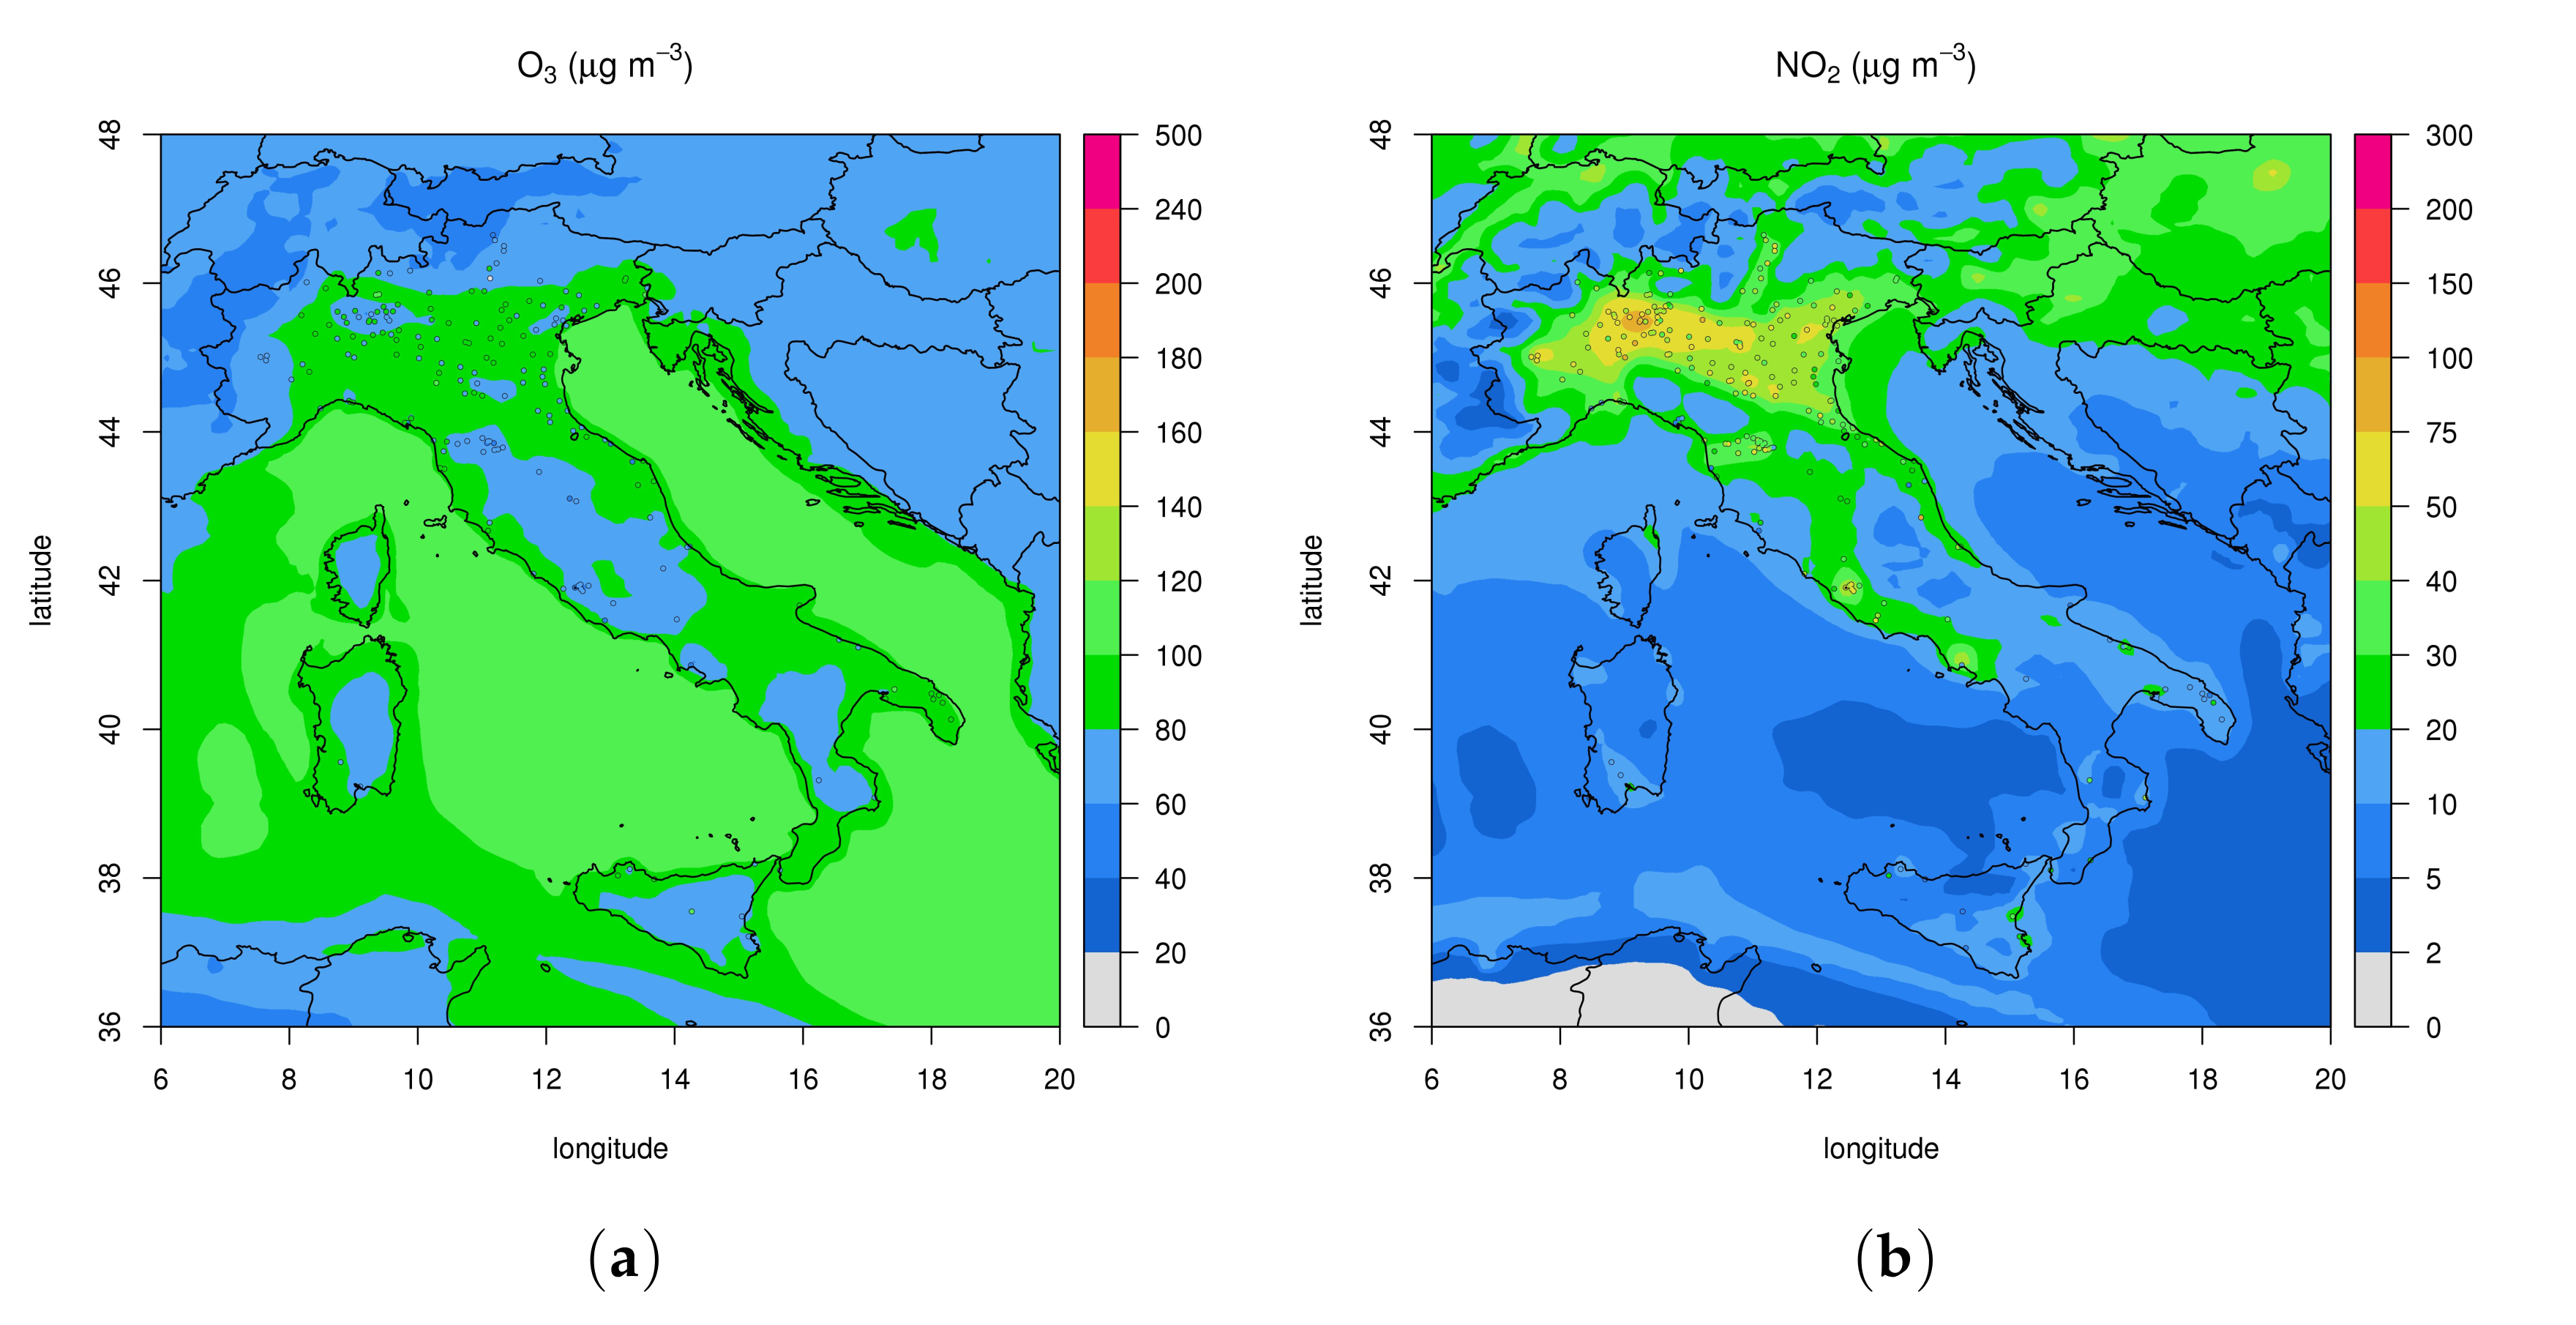
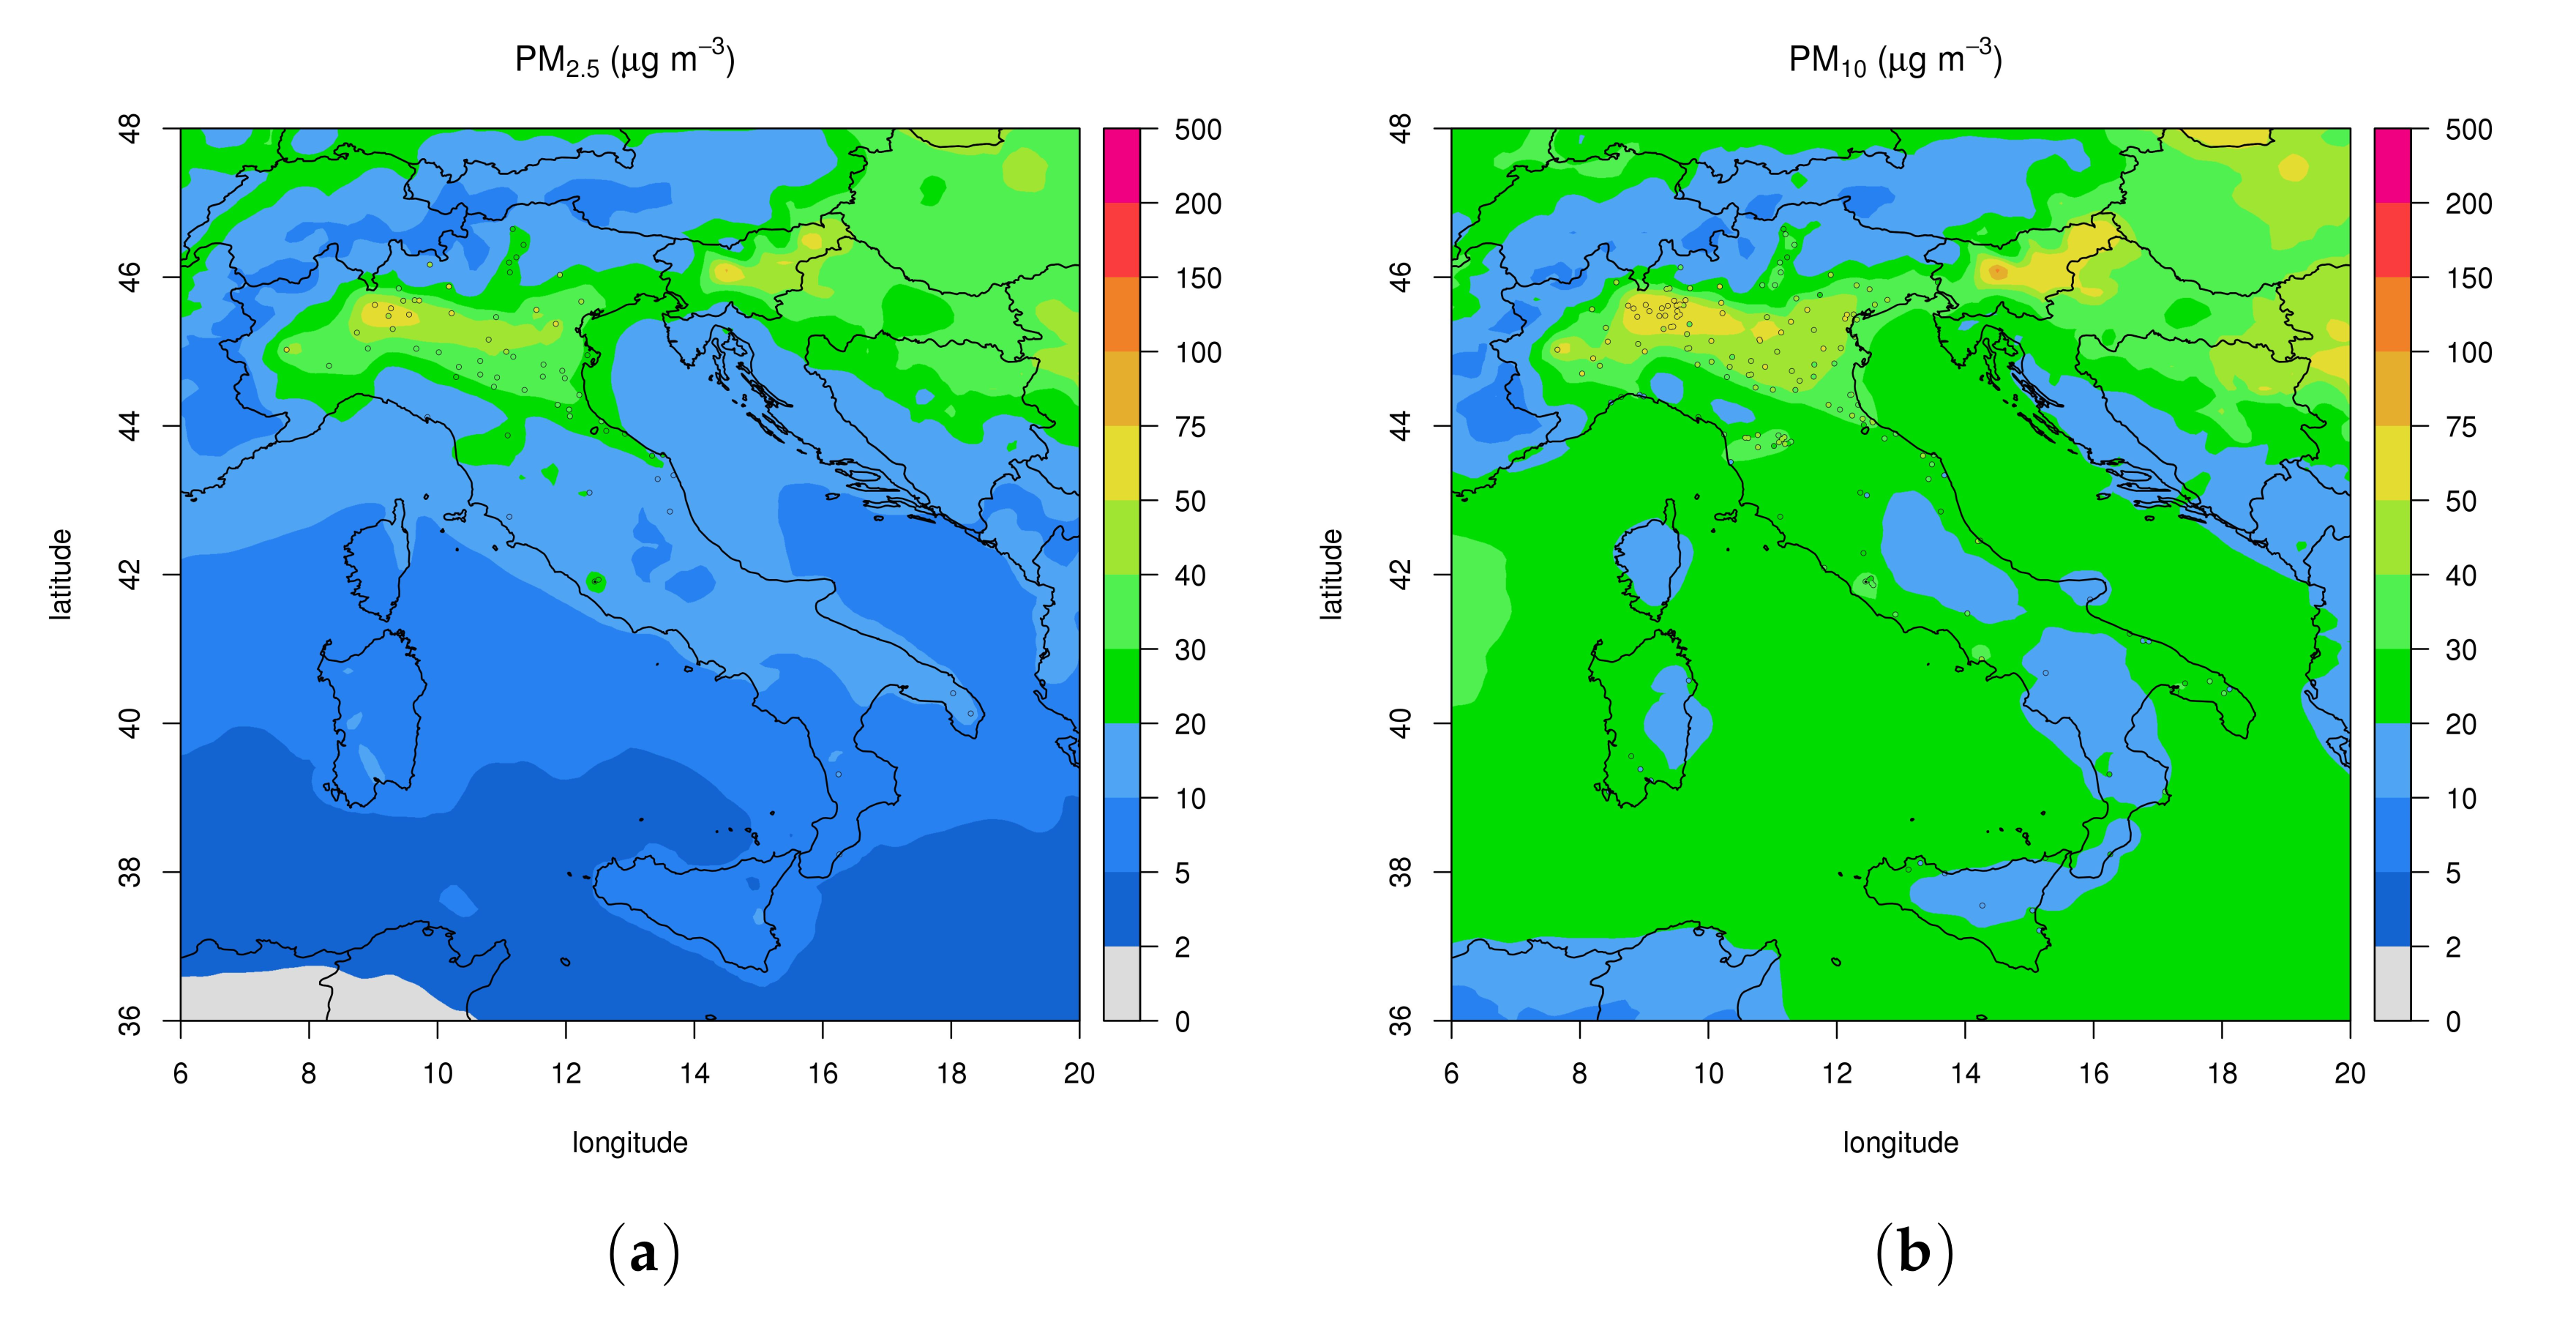
In this section, the results of the nested simulation, with horizontal domain centered over Italy, at resolution of 0.1° × 0.1°, are presented and compared with results of CAMS ensemble median. As for the parent simulation, the model capability in reproducing the spatial variability is first considered. Figure 12 and Figure 13 show the seasonal average of observed values at Airbase stations superimposed to modeled ones. Filled circles at Airbase station positions represent the measured concentration. First, we observe that the measurement stations are mainly located in the Po Valley. This area is one of the most polluted regions in Europe, having a high density of anthropogenic emissions combined with frequent stagnant atmospheric conditions. In Figure 12 and Figure 13 the area near big cities, as Milan and Turin, characterized by higher anthropogenic emissions and then higher pollutants concentration value are clearly visible, especially for NO2 (Figure 12b).
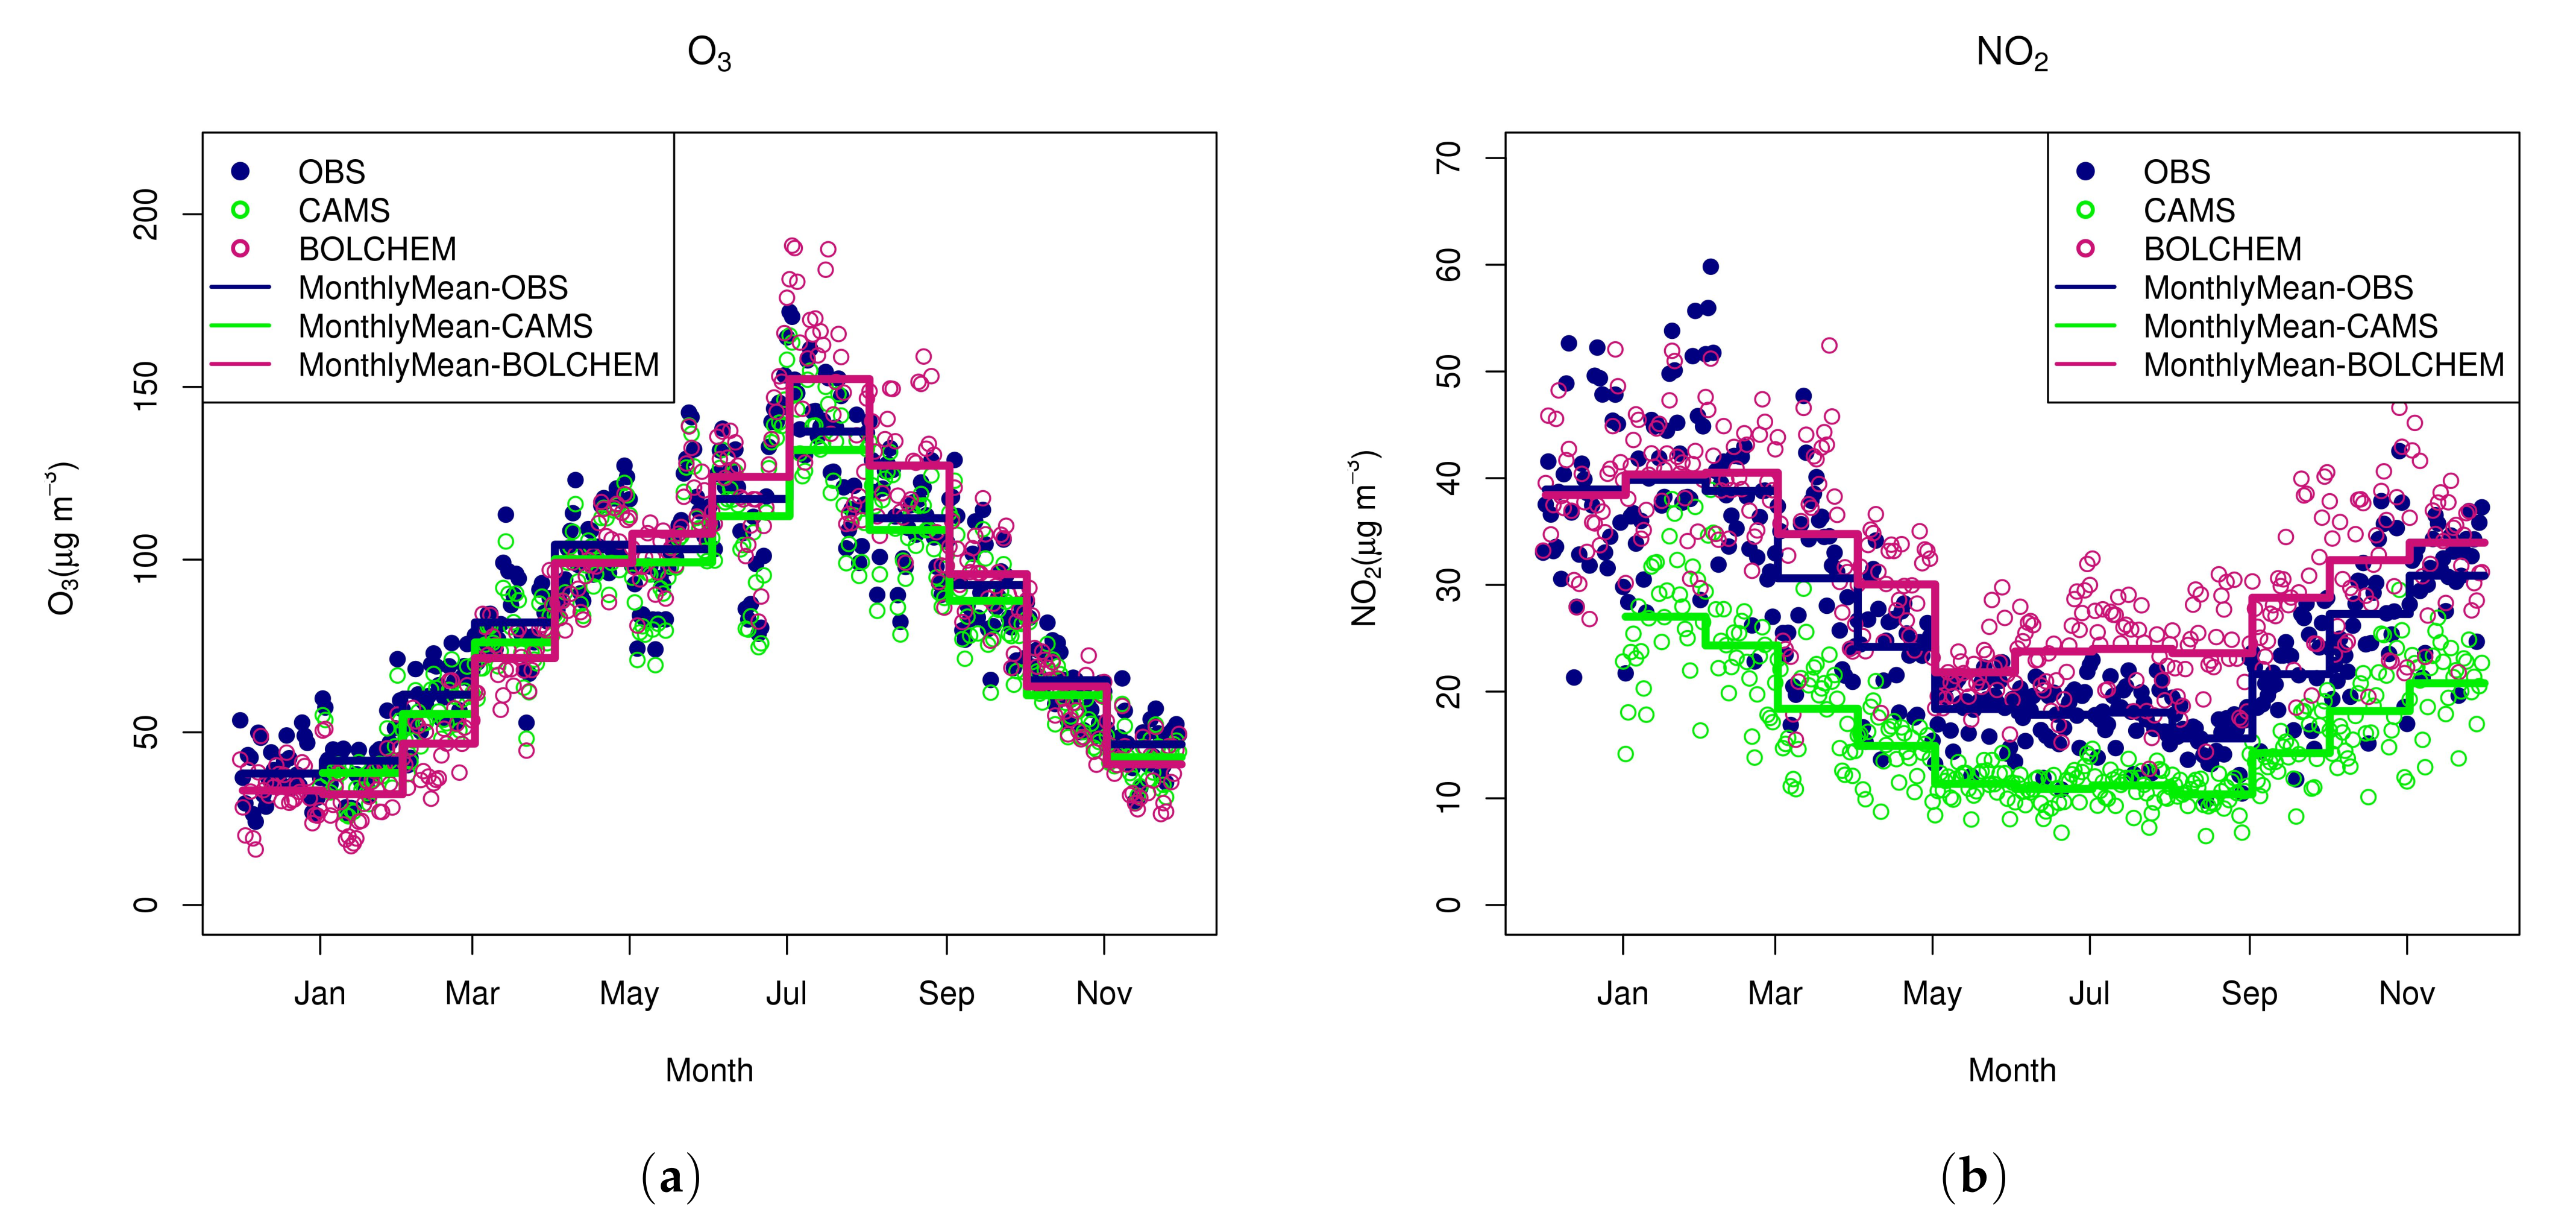
The monthly variability is shown in Figure 14 and Figure 15. As well as for the simulation over Europe, the monthly mean value is considered for all the pollutants, with the exception of O3, for which the monthly mean is calculated using the maximum daily 1-h average concentration.
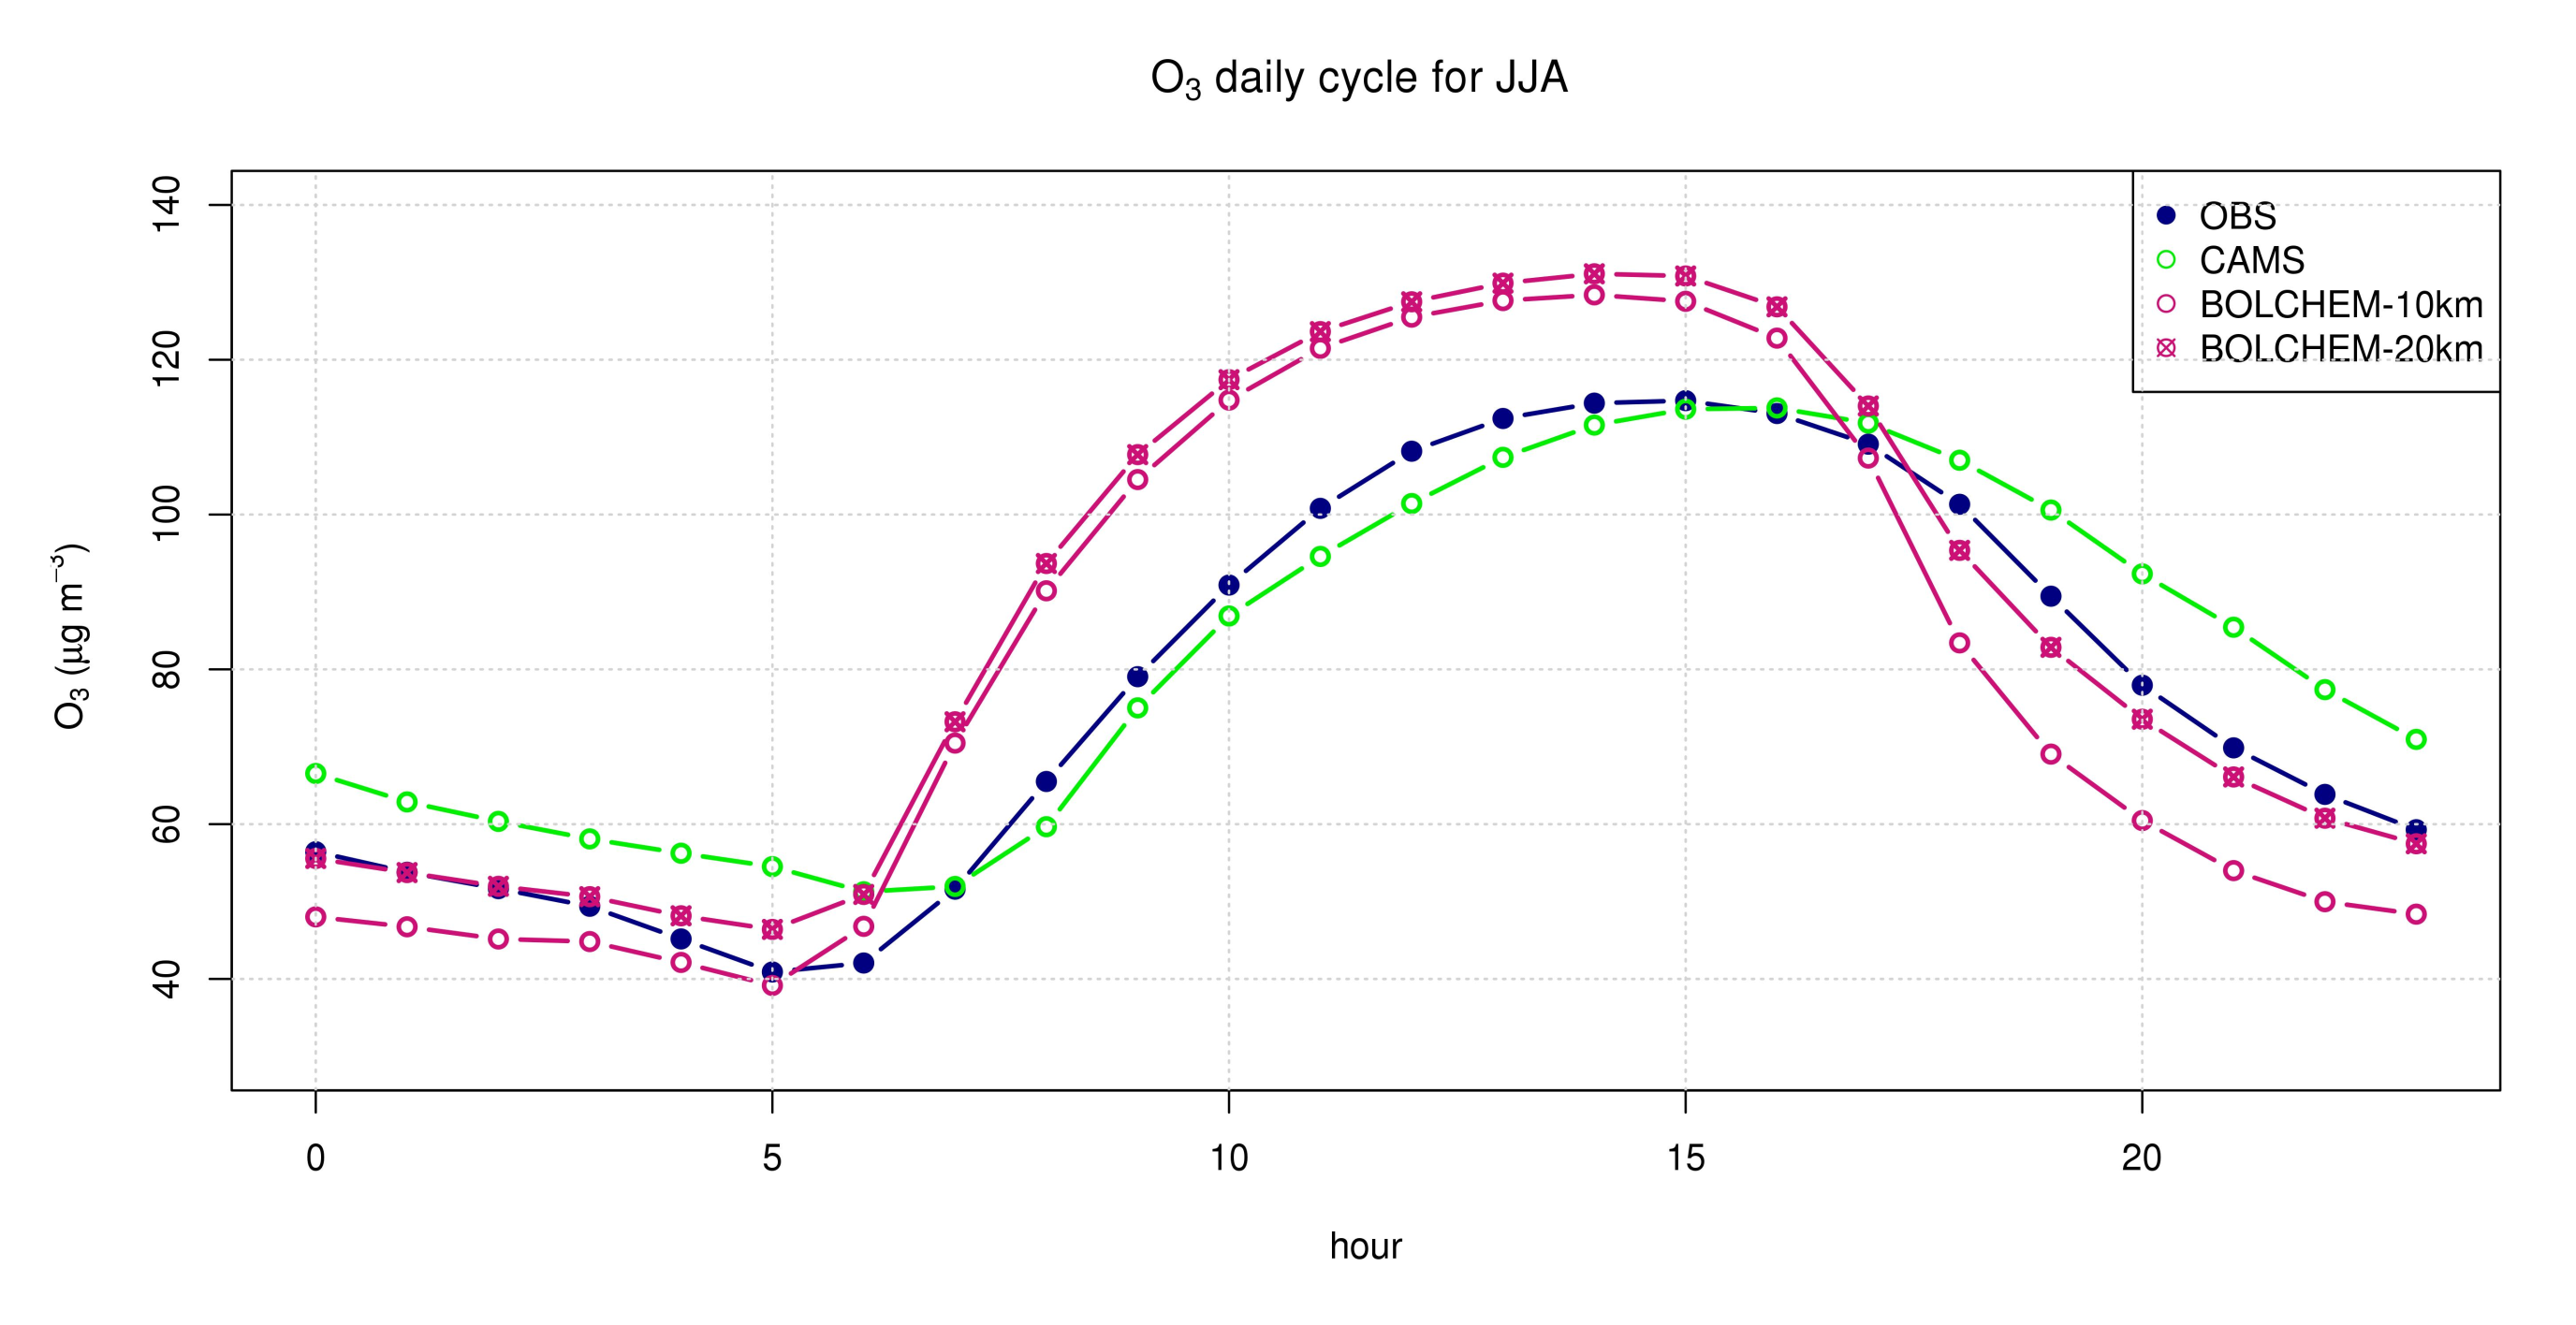
For O3 (Figure 14a) we found an overestimation during summer, when the O3 levels are higher. Being the overestimation more evident for the months of July and August (Figure 14a), this could be caused by an overestimation of biogenic VOC emissions, as these are characterized by large uncertainties [81,82]. However, this aspect requires more investigation. The observed overestimation is highlighted by the O3 daily cycle (Figure 16).
In particular, we can observe a rapid growth during the first hours of the day. This trend could be related to the ability of the model to reproduce the characteristics of the Po Valley (high density of anthropogenic emissions combined with frequent stagnant atmospheric conditions), which makes the greatest contribution to statistics, and not to the higher horizontal resolution, as we can deduce comparing the results obtained with the simulations performed at the two different resolution (Figure 16). The impact of the higher resolution is evident for the night concentration values. Unlike CAMS ensemble median, that overestimates the nighttime O3 concentration, the nocturnal simulated O3 concentrations of BOLCHEM are lower than those measured. The O3 concentration underestimation is more pronounced the higher the resolution. One possible cause could be an underestimation of the height of the nocturnal stable boundary layer, with consequent accumulation of NO and therefore removal of O3 through titration. We recall that the planetary boundary layer is still a hot issue in the study of air pollution and that the estimation of the boundary layer height has an important impact on the dispersion of pollutants. The NO2 concentration reaches its maximum values in winter, a season in which its average monthly value is well reproduced by the model BOLCHEM (Figure 14b). On the other hand, NO2 is overestimated in the rest of the year. On the contrary, CAMS ensemble median shows a systematic underestimation in all months. However, we can note that the difference between measured and modeled concentration is smaller, in absolute value, for the BOLCHEM model, as can be seen from the mean bias value (Table 2). For PM2.5 (Figure 15a) and PM10 (Figure 15b), the model reproduces the seasonal variability, as seen in the data. This variability is not captured by CAMS ensemble median. We also note that in the winter months, more critical due to the high concentration values of the particulate, there is a good agreement between model and measurements.
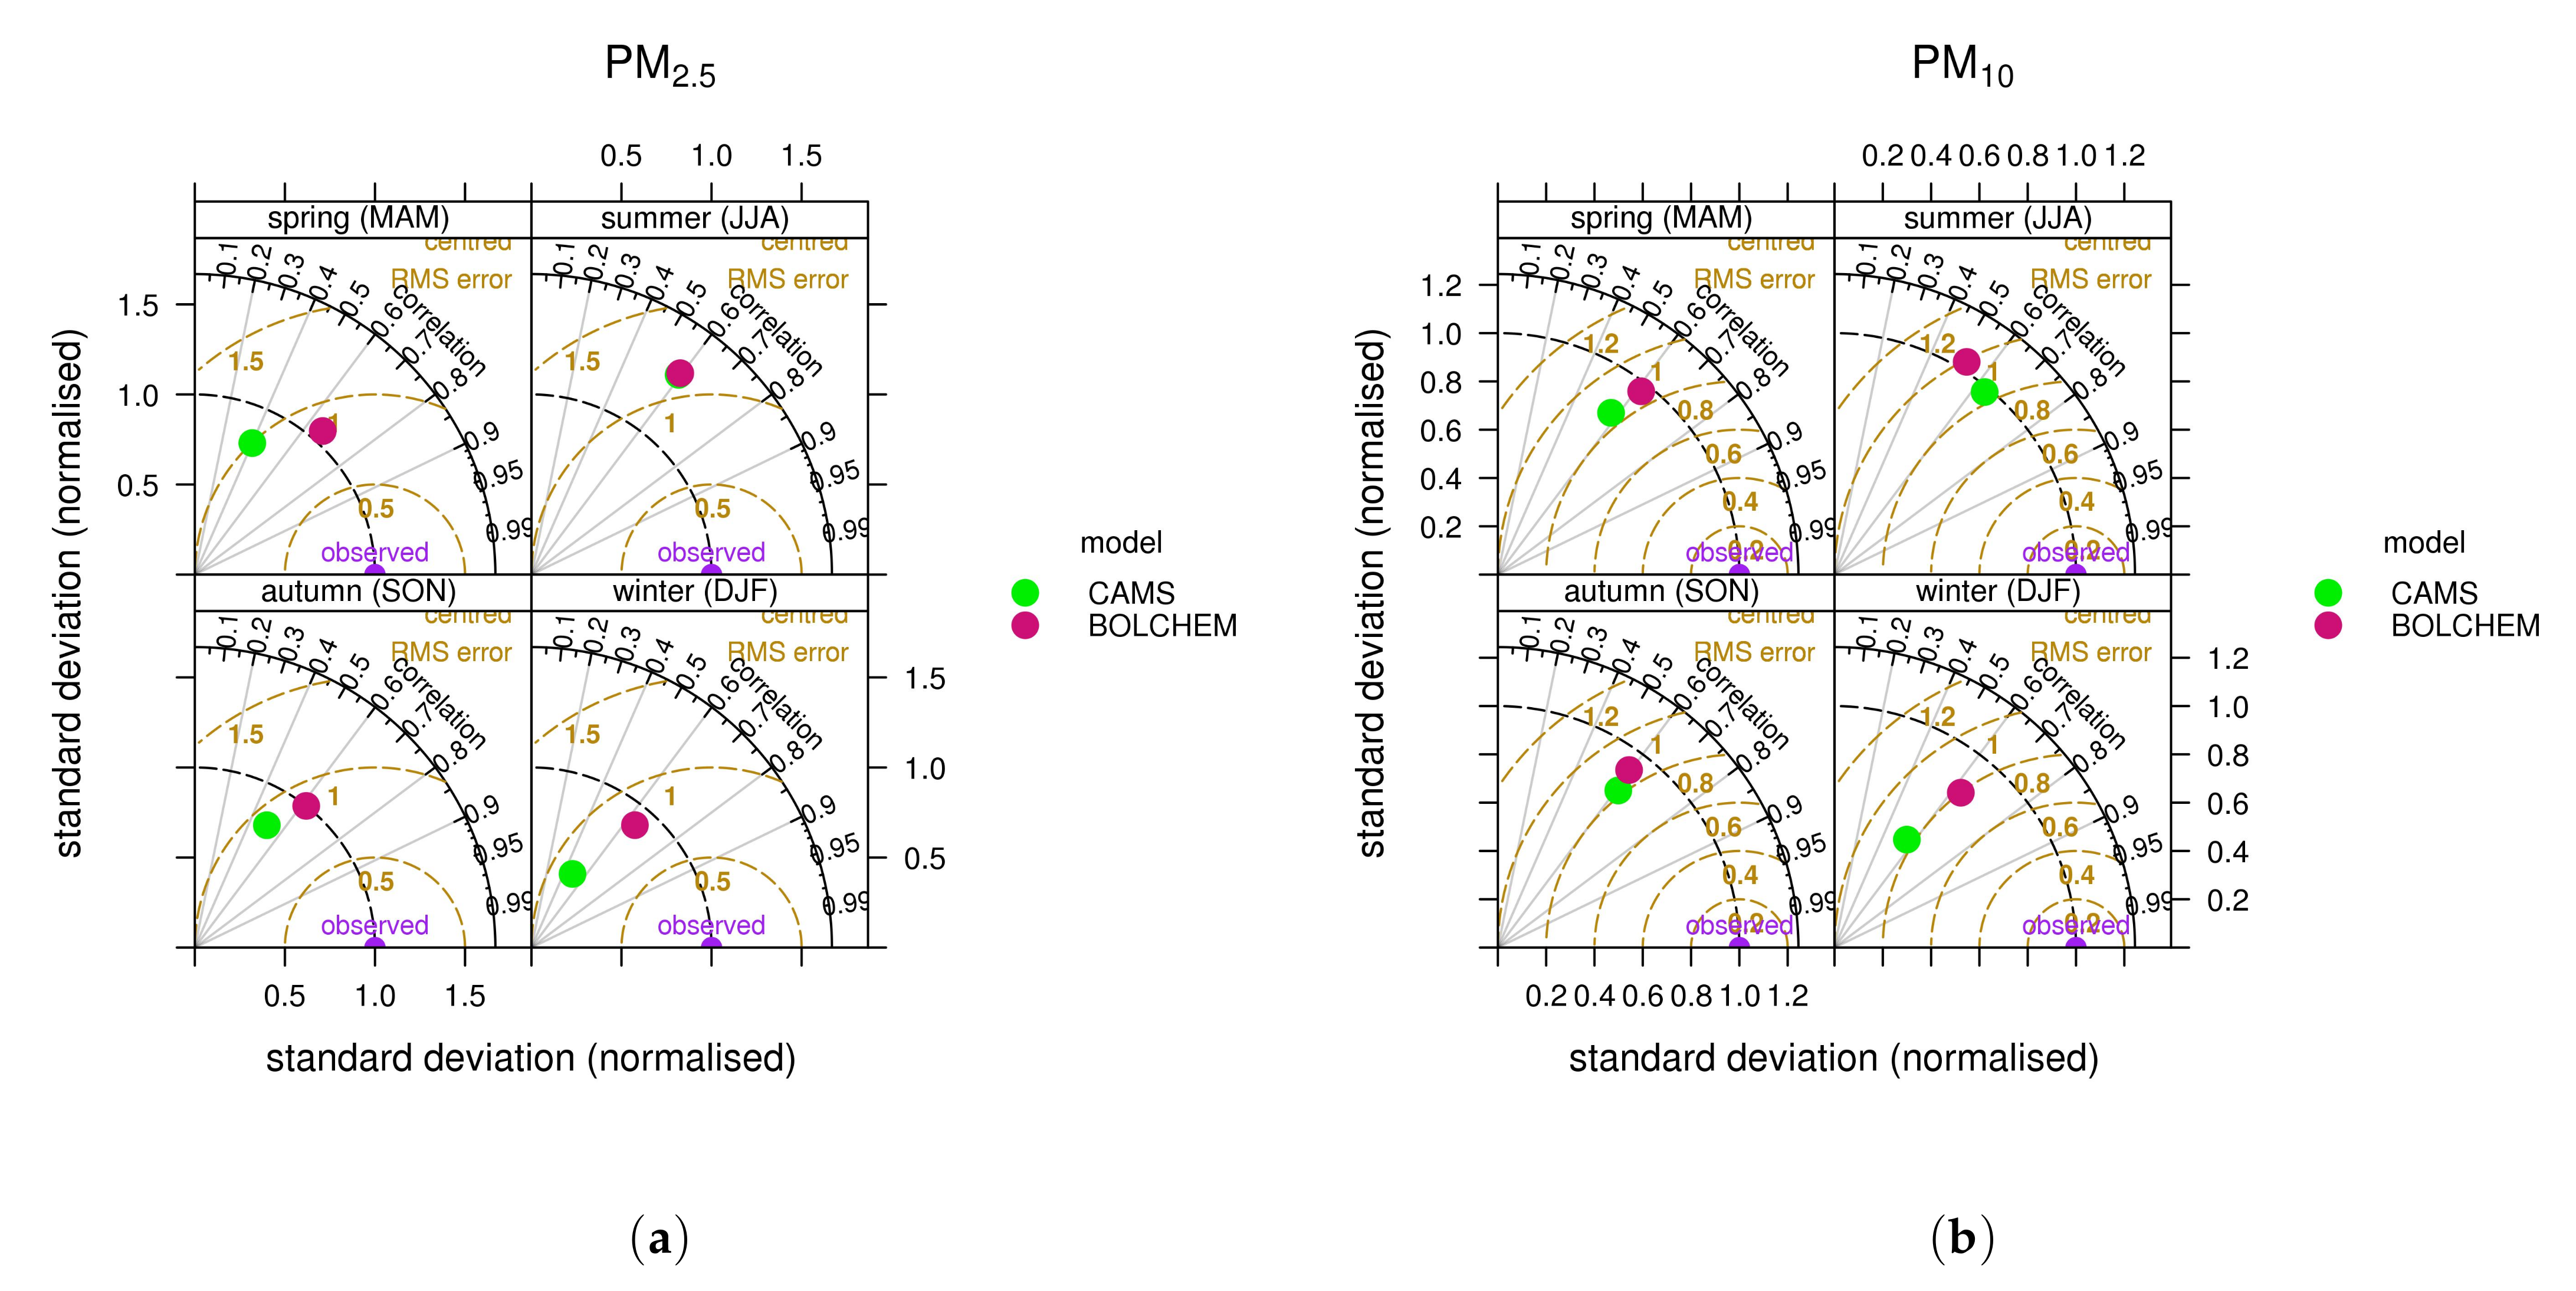
For providing additional information about the model skill on a seasonal basis, Taylor diagrams are shown in Figure 17 and Figure 18. The basic statistics are reported in Table 2, both for BOLCHEM model and CAMS ensemble median.
O3 statistics show that BOLCHEM performance is not as good as CAMS ensemble median. However, it can be noted the better performances in summer (with the higher value for the correlation coefficient R) and autumn (with the lower value for the RMSE and the normalized SD close to unit). In case of NO2, the best performances are achieved in the winter season in term of MB, even if the correlation is lower than for CAMS ensemble median. As regard PM2.5 and PM10, both in CAMS and BOLCHEM show similar results in summer. For these pollutants, BOLCHEM outperforms CAMS ensemble median in winter, while in the other season the performance is slightly different.

4. Conclusions

We have presented a description of the on-line air-quality model BOLCHEM that is based on the hydrostatic meteorological BOLAM model, the gas chemistry module SAPRC90 and the aerosol dynamic module AERO3. BOLCHEM has been used for different applications, both forecast and air pollution case studies in the framework of different European projects such as GEMS and CESAPO. The model was evaluated on seasonal basis (for the year 2010) for NO2, O3, PM2.5 and PM10, using measured concentrations available from values measured at background AirBase database. Simulations were performed at 0.2° × 0.2° resolution over the European domain, and at 0.1° × 0.1° over the Italian domain. The model reproduces the ozone concentration during summer when it has the highest concentrations and impact on vegetation, in particular for the European domain, with correlation coefficient 0.72. The model performances are lower over the Italian domain, for which an overestimation is present during daytime and an underestimation is present during nighttime. The correlation coefficient of O3 ranges between 0.62 and 0.70, the latter value referred to the autumn period. However, the value of RMSE are comparable with those of some models of the CAMS ensemble, as can be seen from the Evaluation and Quality Assurance reports of these models, provided on a seasonal base (https://atmosphere.copernicus.eu/regional-services). PM2.5 and PM10 are particularly well reproduced by the model in wintertime when the PM10 concentration usually exceeds the limit values imposed by EU Air Quality Directive on ambient air quality and cleaner air for Europe (AQD, Directive 2008/50/EC). Over the European domain for PM2.5 the correlation coefficient is 0.51 (summer period) and 0.66 (winter period), for PM10 the correlation coefficient ranges between 0.47 (summer period) and 0.56 (spring period). Comparison of the basic statistics for higher-resolution simulations with those from CAMS ensemble median shows that BOLCHEM better reproduces the aerosol dynamic than CAMS ensemble median. In winter period, for PM2.5 the correlation coefficient is 0.64 for BOLCHEM and 0.49 for CAMS, for PM10 the correlation coefficient is 0.63 for BOLCHEM and and 0.56 for CAMS.
Future developments of BOLCHEM will include:
  • estimation of emission potential and foliar biomass density referring to the vegetation dataset used in BOLCHEM, that is UMD Global Land Cover Classification (GLCC);
  • implementation of a pre-processor system to allow the integration of the mineral dust flux simulated by the model DREAMABOL [83] model into BOLCHEM boundary condition;
  • upgrade of the gas-phase chemical mechanism and aerosol module;
  • a major challenge to complete BOLCHEM aerosol feedback description would be to study the effect of aerosol components that are currently not included in the radiation module, such as ammonium and nitrates.

Author Contributions

A.M. and F.T. started the BOLCHEM project. A.M. coordinated the model development and he is the main developer of the code. P.M. is the main developer of the meteorological module BOLAM included in BOLCHEM. R.C., A.M., M.D., M.M., F.R. and F.T. contributed to the developed of the model. R.C., T.C.L. and A.M. performed the set up, simulations and analysis for the presented model evaluation. All the authors discussed the model results. A.M. proposed the paper structure, redefined with R.C. R.C. wrote the paper with contributions by all other authors. All authors have read and agreed to the published version of the manuscript.

Funding

This research received no external funding.

Institutional Review Board Statement

Not applicable.

Conflicts of Interest

The authors declare no conflict of interest.

References

  1. Baklanov, A.; Schlünzen, K.; Suppan, P.; Baldasano, J.; Brunner, D.; Aksoyoglu, S.; Carmichael, G.; Douros, J.; Flemming, J.; Forkel, R.; et al. Online coupled regional meteorology chemistry models in Europe: Current status and prospects. Atmos. Chem. Phys. 2014, 14, 317–398. [Google Scholar] [CrossRef] [Green Version]
  2. Grell, G.; Peckham, S.; Schmitz, R.; McKeen, S.; Frost, G.; Skamarock, W.; Eder, B. Fully coupled “online” chemistry within the WRF model. Atmos. Environ. 2005, 39, 6957–6975. [Google Scholar] [CrossRef]
  3. Vogel, B.; Vogel, H.; Bäumer, D.; Bangert, M.; Lundgren, K.; Rinke, R.; Stanelle, T. The comprehensive model system COSMO-ART—Radiative impact of aerosol on the state of the atmosphere on the regional scale. Atmos. Chem. Phys. 2009, 9, 8661–8680. [Google Scholar] [CrossRef] [Green Version]
  4. Baklanov, A.; Korsholm, U.; Nuterman, R.; Mahura, A.; Nielsen, K.; Sass, B.; Rasmussen, A.; Zakey, A.; Kaas, E.; Kurganskiy, A.; et al. Enviro-HIRLAM online integrated meteorology-chemistry modelling system: Strategy, methodology, developments and applications (v7.2). Geosci. Model Dev. 2017, 10, 2971–2999. [Google Scholar] [CrossRef] [Green Version]
  5. Savage, N.H.; Agnew, P.; Davis, L.S.; Ordóñez, C.; Thorpe, R.; Johnson, C.E.; O’Connor, F.M.; Dalvi, M. Air quality modelling using the Met Office Unified Model (AQUM OS24-26): Model description and initial evaluation. Geosci. Model Dev. 2013, 6, 353–372. [Google Scholar] [CrossRef] [Green Version]
  6. Morgenstern, O.; Braesicke, P.; O’Connor, F.; Bushell, A.; Johnson, C.; Osprey, S.; Pyle, J. Evaluation of the new UKCA climate-composition model—Part 2: The Troposphere. Geosci. Model Dev. 2014, 7, 41–91. [Google Scholar]
  7. Baklanov, A.; Baldasano, J.; Bouchet, V.; Brunner, D.; Ekman, A.; Galmarini, S.; Carmichael, G.; Grell, G.; Flemming, J.; Forkel, R.; et al. Coupled Chemistry-Meteorology/Climate Modelling (CCMM): Status and Relevance for Numerical Weather Prediction, Atmospheric Pollution and Climate Research; GAW Report No. 226, WWRP 2016-1, WCRP Report No. 9/2016; World Meteorological Organization (WMO): Geneva, Switzerland, 2016. [Google Scholar]
  8. Im, U.; Bianconi, R.; Solazzo, E.; Kioutsioukis, I.; Badia, A.; Balzarini, A.; Baró, R.; Bellasio, R.; Brunner, D.; Chemel, C.; et al. Evaluation of operational on-line-coupled regional air quality models over Europe and North America in the context of AQMEII phase 2, Part I: Ozone. Atmos. Environ. 2015, 115, 404–420. [Google Scholar] [CrossRef] [Green Version]
  9. Im, U.; Bianconi, R.; Solazzo, E.; Kioutsioukis, I.A.B.; Balzarini, A.; Baró, R.; Bellasio, R.; Brunner, D.; Chemel, C.; Curci, G.; et al. Evaluation of operational on-line-coupled regional air quality models over Europe and North America in the context of AQMEII phase 2, Part II: Particulate Matter. Atmos. Environ. 2015, 115, 421–441. [Google Scholar] [CrossRef] [Green Version]
  10. Baklanov, A.; Fay, B.; Kaminski, J. Overview of Existing Integrated (Off-Line and On-Line) Mesoscale Systems in Europe; COST Action 728, Working Group 2, Deliverable 2.1 Report; COST: Brussels, Belgium, 2007. [Google Scholar]
  11. Hollingsworth, A.; Engelen, R.; Textor, C.; Benedetti, A.; Boucher, O.; Chevallier, F.; Dethof, A.; Elbern, H.; Eskes, H.; Flemming, J.; et al. Toward a monitoring and forecasting system for atmospheric composition: The GEMS Project. Bull. Am. Meteorol. Soc. 2008, 89, 1147–1164. [Google Scholar] [CrossRef]
  12. Huijnen, V.H.J.; Eskes, H.J.; Poupkou, A.; Elbern, H.; Boersma, K.; Foret, G.M.; Sofiev, M.; Valdebenito, A.; Flemming, J.; Stein, O.; et al. Comparison of OMI NO2 tropospheric columns with an ensemble of global and European regional air quality models. Atmos. Chem. Phys. 2010, 10, 3273–3296. [Google Scholar] [CrossRef] [Green Version]
  13. Zyryanov, D.; Foret, G.; Eremenko, M.; Beekmann, M.; Cammas, J.; D’Isidoro, M.; Elbern, H.; Flemming, J.; Friese, E.; Kioutsioutkis, I.; et al. 3-D evaluation of tropospheric ozone simulations by an ensemble of regional Chemistry Transport Model. Atmos. Chem. Phys. 2012, 12, 3219–3240. [Google Scholar] [CrossRef] [Green Version]
  14. Mircea, M.; D’Isidoro, M.; Maurizi, A.; Vitali, L.; Monforti, F.; Zanini, G.; Tampieri, F. A comprehensive performance evaluation of the air quality model BOLCHEM to reproduce the ozone concentrations over Italy. Atmos. Environ. 2008, 42, 1169–1185. [Google Scholar] [CrossRef]
  15. Colette, A.; Granier, C.; Hodnebrog, O.; Jakobs, H.; Maurizi, A.; Nyiri, A.; Bessagnet, B.; D’Angiola, A.; D’Isidoro, M.; Gauss, M.; et al. Air quality trends in Europe over the past decade: A first multi- model assessment. Atmos. Chem. Phys. 2011, 11, 11657–11678. [Google Scholar] [CrossRef] [Green Version]
  16. Colette, A.; Granier, C.; Hodnebrog, O.; Jakobs, H.; Maurizi, A.; Nyiri, A.; Rao, S.; Amann, M.; Bessagnet, B.; D’Angiola, A.; et al. Future air quality in Europe: A multi-model assessment of projected exposure to ozone. Atmos. Chem. Phys. 2012, 12, 10613–10630. [Google Scholar] [CrossRef] [Green Version]
  17. Maurizi, A.; Russo, F.; D’Isidoro, M.; Tampieri, F. Nudging technique for scale bridging in air quality/climate atmospheric composition modelling. Atmos. Chem. Phys. 2012, 12, 3677–3685. [Google Scholar] [CrossRef] [Green Version]
  18. Cesari, R.; D’Isidoro, M.; Maurizi, A.; Mircea, M.; Monti, F.; Pizzigalli, C. Modelling dispersion of smoke from wildfires in a Mediterranean area. Int. J. Environ. Pollut. 2014, 55, 219–229. [Google Scholar] [CrossRef]
  19. Buccolieri, R.; Cesari, R.; Dinoi, A.; Maurizi, A.; Tampieri, F.; Di Sabatino, S. Impact of ship emissions on local air quality in a Mediterranean city’s harbour after the European sulphur directive. Int. J. Environ. Pollut. 2016, 59, 30–42. [Google Scholar] [CrossRef]
  20. Cesari, R.; Buccolieri, R.; Maurizi, A.; Landi, T.; Di Sabatino, S. Influence of Ship Emissions on Ozone Concentration in a Mediterranean Area: A modelling approach. In Air Pollution Modeling and its Application XXV, Springer Proceedings in Complexity; Springer: Cham, Switzerland, 2018; pp. 317–321. [Google Scholar]
  21. Buzzi, A.; D’Isidoro, M.; Davolio, S. A case-study of an orographic cyclone south of the Alps during the MAP SOP. Q. J. R. Meteorol. Soc. 2003, 129, 1795–1818. [Google Scholar] [CrossRef]
  22. Carter, W.P. A detailed mechanism for the gas-phase atmospheric reactions of organic compounds. Atmos. Environ. Part A Gen. Top. 1990, 24, 481–518. [Google Scholar] [CrossRef]
  23. Binkowski, F.S.; Shankar, U. The regional particulate matter model: 1. Model description and preliminary results. J. Geophys. Res. Atmos. 1995, 100, 26191–26209. [Google Scholar] [CrossRef]
  24. Binkowski, F.S.; Roselle, S.J. Models-3 Community Multiscale Air Quality (CMAQ) model aerosol component 1. Model description. J. Geophys. Res. Atmos. 2003, 108. [Google Scholar] [CrossRef]
  25. Monin, A.S.; Obukhov, A.M. Osnovnye zakonomernosti turbulentnogo pere- meshivanija v prizemnom sloe atmosfery (Basic Laws of Turbulent Mixing in the Atmo- sphere Near the Ground). Tr. Geofiz. Inst. SSSR 1954, 24, 163–187. [Google Scholar]
  26. Fleagle, R.; Businger, J. An Introduction to Atmospheric Physics, 2nd ed.; International Geophysics; Elsevier: Amsterdam, The Netherlands, 1980; Volume 25. [Google Scholar]
  27. Beljaars, A.; Holtslag, A. Flux parameterization over land surfaces for atmospheric models. J. Appl. Meteorol. 1991, 30, 327–341. [Google Scholar] [CrossRef]
  28. Charnock, H. Wind stress on a water surface. Q. J. R. Meteorol. Soc. 1955, 81, 639–640. [Google Scholar] [CrossRef]
  29. Large, W.; Pond, S. Open Ocean Momentum Flux Measurements in Moderate to Strong Winds. J. Phys. Oceanogr. 1981, 11, 324–336. [Google Scholar] [CrossRef] [Green Version]
  30. Cuxart, J.; Holtslag, A.; Beare, R.; Bazile, E.; Beljaars, A.; Cheng, A.; Conangla, L.; Ek, M.; Freedman, F.; Hamdi, R.; et al. Single-column model intercomparison for a stably stratified atmospheric boundary layer. Bound. Layer Meteorol. 2006, 118, 273–303. [Google Scholar] [CrossRef] [Green Version]
  31. Zampieri, M.; Malguzzi, P.; Buzzi, A. Sensitivity of quantitative precipitation forecasts to boundary layer parameterization: A flash flood case study in the Western Mediterranean. Nat. Hazards Earth Syst. Sci. 2005, 5, 603–612. [Google Scholar] [CrossRef]
  32. Bougeault, P.; Lacarrere, P. Parameterization of Orography-Induced Turbulence in a Mesobeta-Scale Model. Mon. Weather Rev. 1989, 117, 1872–1890. [Google Scholar] [CrossRef]
  33. Blackadar, A. The vertical distribution of wind and turbulence exchange in a neutral atmosphere. J. Geophys. Res. 1962, 62, 3095–3102. [Google Scholar] [CrossRef] [Green Version]
  34. Kain, J.S.; Fritsch, J.M. Convective parameterization for mesoscale models: The Kain-Fritsch Scheme. In The Representation of Cumulus Convection in Numerical Models; Springer: Cham, Switzerland, 1993; pp. 165–170. [Google Scholar]
  35. Kain, J.S. The Kain–Fritsch convective parameterization: An update. J. Appl. Meteorol. 2004, 43, 170–181. [Google Scholar] [CrossRef] [Green Version]
  36. Wang, W.; Seaman, N.L. A comparison study of convective parameterization schemes in a mesoscale model. Mon. Weather Rev. 1997, 125, 252–278. [Google Scholar] [CrossRef] [Green Version]
  37. Ferretti, R.; Low-Nam, S.; Rotunno, R. Numerical simulations of the Piedmont flood of 4–6 November 1994. Tellus A Dyn. Meteorol. Oceanogr. 2000, 52, 162–180. [Google Scholar] [CrossRef]
  38. Simpson, D.; Benedictow, A.; Berge, H.; Bergström, R.; Emberson, L.D.; Fagerli, H.; Flechard, C.R.; Hayman, G.D.; Gauss, M.; Jonson, J.E.; et al. The EMEP MSC-W chemical transport model–technical description. Atmos. Chem. Phys. 2012, 12, 7825–7865. [Google Scholar] [CrossRef] [Green Version]
  39. Kumar, N.; Lurmann, F.; Carter, W. Development of the Flexible Chemical Mechanism Version of the Urban Airshed Model; Tech. Rep. STI-94470-1508-FR; UC Riverside: Riverside, CA, USA, 1995; pp. 1777–1789. [Google Scholar]
  40. Seinfeld, J.H.; Pandis, S.N. Atmospheric Chemistry and Physics: From Air Pollution to Climate Change; Wiley Interscience: Hoboken, NJ, USA, 1998. [Google Scholar]
  41. Sillman, S. The relation between ozone, NOx and hydrocarbons in urban and polluted rural environment. Atmos. Environ. 1999, 33, 1821–1845. [Google Scholar] [CrossRef]
  42. Carter, W.P. Development of a database for chemical mechanism assignments for volatile organic emissions. J. Air Waste Manag. Assoc. 2015, 65, 1171–1184. [Google Scholar] [CrossRef]
  43. Silibello, C.; Calori, G.; Brusasca, G.; Giudici, A.; Angelino, E.; Fossati, G.; Peroni, E.; Buganza, E. Modelling of PM10 concentrations over Milano urban area using two aerosol modules. Environ. Model. Softw. 2008, 23, 333–343. [Google Scholar] [CrossRef]
  44. Nenes, A.; Pandis, S.N.; Pilinis, C. ISORROPIA: A new thermodynamic equilibrium model for multiphase multicomponent inorganic aerosols. Aquat. Geochem. 1998, 4, 123–152. [Google Scholar] [CrossRef]
  45. Schell, B.; Ackermann, I.J.; Hass, H.; Binkowski, F.S.; Ebel, A. Modeling the formation of secondary organic aerosol within a comprehensive air quality model system. J. Geophys. Res. Atmos. 2001, 106, 28275–28293. [Google Scholar] [CrossRef]
  46. Whitby, K.T. The physical characteristics of sulfur aerosols. In Sulfur in the Atmosphere; Elsevier: Amsterdam, The Netherlands, 1978; pp. 135–159. [Google Scholar]
  47. Pankow, J.F. An absorption model of gas/particle partitioning of organic compounds in the atmosphere. Atmos. Environ. 1994, 28, 185–188. [Google Scholar] [CrossRef]
  48. Odum, J.R.; Hoffmann, T.; Bowman, F.; Collins, D.; Flagan, R.C.; Seinfeld, J.H. Gas/particle partitioning and secondary organic aerosol yields. Environ. Sci. Technol. 1996, 30, 2580–2585. [Google Scholar] [CrossRef]
  49. Ritter, B.; Geleyn, J. A Comprehensive Radiation Scheme for Numerical Weather Prediction Models with Potential Applications in Climate Simulations. Mon. Weather Rev. 1992, 120, 303–325. [Google Scholar] [CrossRef] [Green Version]
  50. Morcrette, J. Radiation and cloud radiative properties in the European Centre for Medium Range Weather Forecasts forecasting system. J. Geophys. Res. 1991, 96, 9121–9132. [Google Scholar] [CrossRef]
  51. Morcrette, J.; Barker, H.; Cole, J.; Iacono, M.; Pincus, R. Impact of a new radiation package, McRad, in the ECMWF Integrated Forecasting System. Mon. Weather Rev. 2008, 136, 4773–4798. [Google Scholar] [CrossRef]
  52. Mlawer, E.; Taubman, S.; Brown, P.; Iacono, M.; Clough, S. Radiative Transfer for Inhomogeneous Atmospheres: RRTM, a Validated Correlated-k Model for the Longwave. J. Geophys. Res. 1997, 102, 16663–16682. [Google Scholar] [CrossRef] [Green Version]
  53. Tegen, I.; Hollrig, P.; Chin, M.; Fung, I.; Jacob, D.; Penner, J. Contribution of different aerosol species to the global aerosol extinction optical thickness: Estimates from model results. J. Geophys. Res. 1997, 102, 23895–23915. [Google Scholar] [CrossRef]
  54. Madronich, S.; Flocke, S. The Role of Solar Radiation in Atmospheric Chemistry. In Environmental Photochemistry. The Handbook of Environmental Chemistry (Reactions and Processes); Springer: Berlin/Heidelberg, Germany, 1999; Volume 2/2L. [Google Scholar]
  55. Crawford, J.; Shetter, R.; Lefer, B.; Cantrell, C.; Junkermann, W.; Madronich, S.; Calvert, J. Cloud impacts on UV spectral actinic flux observed during the International Photolysis Frequency Measurement and Model Intercomparison (IPMMI). J. Geophys. Res. 2003, 108. [Google Scholar] [CrossRef]
  56. Kuenen, J.; Visschedijk, A.; Jozwicka, M.; Denier Van Der Gon, H. TNO-MACC_II emission inventory; a multi-year (2003–2009) consistent high-resolution European emission inventory for air quality modelling. Atmos. Chem. Phys. 2014, 14, 10963–10976. [Google Scholar] [CrossRef] [Green Version]
  57. Monforti, F.A.P. Thoscane: A tool to detail corinair emission inventories. Environ. Model. Softw. 2005, 20, 505–508. [Google Scholar] [CrossRef]
  58. Hansen, M.C.; Defries, R.S.; Townshend, J.R.G.; Sohlberg, R. Global land cover classification at 1 km spatial resolution using a classification tree approach. Int. J. Remote Sens. 2000, 21, 1331–1364. [Google Scholar] [CrossRef]
  59. Guenther, A.; Hewitt, C.; Erickson, D.; Fall, R.; Geron, C.; Graedel, T.; Harley, P.; Klinger, L.; Lerdau, M.; McKay, W.; et al. A global model of natural volatile organic compound emissions. J. Geophys. Res. Atmos. 1995, 100, 8873–8892. [Google Scholar] [CrossRef]
  60. Simpson, D.; Wilfried, W.; Börjesson, G.; Cinderby, S.; Ferreiro, A.; Guenther, A.; Nicholas Hewitt, C.; Janson, R.; Khalil, M.A.K.; Owen, S.; et al. Inventorying emissions from nature in Europe. J. Geophys. Res. Atmos. 1999, 104, 8113–8152. [Google Scholar] [CrossRef] [Green Version]
  61. Symeonidis, P.; Poupkou, A.; Gkantou, A.; Melas, D.; Yay, O.D.; Pouspourika, E.; Balis, D. Development of a computational system for estimating biogenic NMVOCs emissions based on GIS technology. Atmos. Environ. 2008, 42, 1777–1789. [Google Scholar] [CrossRef]
  62. Guenther, A.B.; Zimmerman, P.R.; Harley, P.C.; Monson, R.K.; Fall, R. Isoprene and Monoterpene Emission Rate Variability: Model Evaluations and Sensitivity Analyses. J. Geophys. Res. Atmos. 1993, 98, 12609–12617. [Google Scholar] [CrossRef] [Green Version]
  63. Zhang, K.M.; Knipping, E.M.; Wexler, A.; Bhave, P.V.; Tonnesen, G.S. Size distribution of sea-salt emissions as a function of relative humidity. Atmos. Environ. 2005, 39, 3373–3379. [Google Scholar] [CrossRef]
  64. Tang, I.N.; Tridico, A.C.; Fung, K.H. Thermodynamic and optical properties of sea salt aerosols. J. Geophys. Res. 1997, 102, 269–275. [Google Scholar] [CrossRef]
  65. Monahan, E.; Spiel, D.; Davidson, K. A model of marine aerosol generation via whitecaps and wave disruption. In Oceanic Whitecaps; Springer: Cham, Switzerland, 1986; pp. 167–174. [Google Scholar]
  66. Gong, S.L. A parameterization of sea-salt aerosol source function for sub- and super-micron particles. Glob. Biogeochem. Cycles 2003, 17, 1097. [Google Scholar] [CrossRef]
  67. Pizzigalli, C. Modelling wildfires in the Mediterranean area during summer 2007. Nuovo Cimento 2012, 35C, 137–146. [Google Scholar]
  68. Seiler, W.; Crutzen, P.J. Estimates of gross and net fluxes of carbon between the biosphere and the atmosphere from biomas burning. Clim. Chang. 1980, 2, 207–247. [Google Scholar] [CrossRef]
  69. Wesely, M.L. Parameterisation of surface resistances to gaseous dry deposition in regional-scale numerical models. Atmos. Environ. 1989, 23, 1293–1304. [Google Scholar] [CrossRef]
  70. Anav, A.; Menut, L.; Khvorostyanov, D.; Viovy, N. A comparison of two canopy conductance parameterizations to quantify the interactions between surface ozone and vegetation over Europe. J. Geophys. Res. 2012, 117, G03027. [Google Scholar] [CrossRef] [Green Version]
  71. Emberson, L.D.; Ashmore, M.R.; Cambridge, H.M.; Tuovinen, J.P.; Simpson, D. Modelling stomatal flux across Europe. Environ. Pollut. 2000, 109, 403–413. [Google Scholar] [CrossRef]
  72. Lorenz, E. Energy and Numerical Weather Prediction. Tellus 1960, 12, 157–167. [Google Scholar] [CrossRef] [Green Version]
  73. Arakawa, A.; Lamb, V. Computational Design of the Basic Dynamical Processes of the UCLA General Circulation Model. Methods Comput. Phys. Adv. Res. Appl. 1977, 17, 173–265. [Google Scholar]
  74. Leheman, R. On the choice of relaxation coefficients for Davies’ lateral boundary scheme for regional weather prediction models. Meteorol. Atmos. Phys. 1993, 52, 1–14. [Google Scholar] [CrossRef]
  75. Billet, S.; Toro, E.F. On WAF-type schemes for multidimensional hyperbolic conservation laws. J. Comput. Phys. 1997, 130, 1–24. [Google Scholar] [CrossRef]
  76. Godunov, S. A difference method for numerical calculation of discontinuous solutions of the equations of hydrodynamics. Math. Sb. (N. S.) 1993, 47, 271–306. [Google Scholar]
  77. Hubbard, M.; Nikiforakis, N. A three-dimensional, adaptive, Godunov-type model for global atmospheric flows. Mon. Weather Rev. 2003, 131, 1848–1864. [Google Scholar] [CrossRef]
  78. Davies, H.C. A lateral boundary formulation for multi-level prediction models. Q. J. R. Meteorol. Soc. 1976, 102, 405–418. [Google Scholar]
  79. Aidaoui, L.; Maurizi, A.; Azzi, A. Modelled NO2 tropospheric columns at different resolutions versus OMI satellite data: Analysis of a 1-year BOLCHEM simulation over Europe. Air Qual. Atmos. Health 2015, 8, 163–174. [Google Scholar] [CrossRef]
  80. Marécal, V.; Peuch, V.H.; Andersson, C.; Andersson, S.; Arteta, J.; Beekmann, M.; Benedictow, A.; Bergström, R.; Bessagnet, B.; Cansado, A.; et al. A regional air quality forecasting system over Europe: The MACC-II daily ensemble production. Geosci. Model Dev. 2015, 8, 2777–2813. [Google Scholar] [CrossRef] [Green Version]
  81. Poupkou, A.; Giannaros, T.; Markakis, K.; Kioutsioukis, I.; Curci, G.; Melas, D.; Zerefos, C. A model for European Biogenic Volatile Organic Compound emissions: Software development and first validation. Environ. Model. Softw. 2010, 25, 1845–1856. [Google Scholar] [CrossRef]
  82. Cesari, R.; Landi, T.; Maurizi, A. The coupled chemistry-meteorology model BOLCHEM: An application to air pollution in the Po Valley (Italy) hot spot. Int. J. Environ. Pollut. 2019, 65, 1–24. [Google Scholar] [CrossRef]
  83. Binietoglou, I.; Basart, S.; Alados-Arboledas, L.; Amiridis, V.; Argyrouli, A.; Baars, H.; Baldasano, J.; Balis, D.; Belegante, L.; Bravo-Aranda, J.; et al. A methodology for investigating dust model performance using synergistic EARLINET/AERONET dust concentration retrievals. Atmos. Meas. Tech. 2015, 8, 3577–3600. [Google Scholar] [CrossRef] [Green Version]
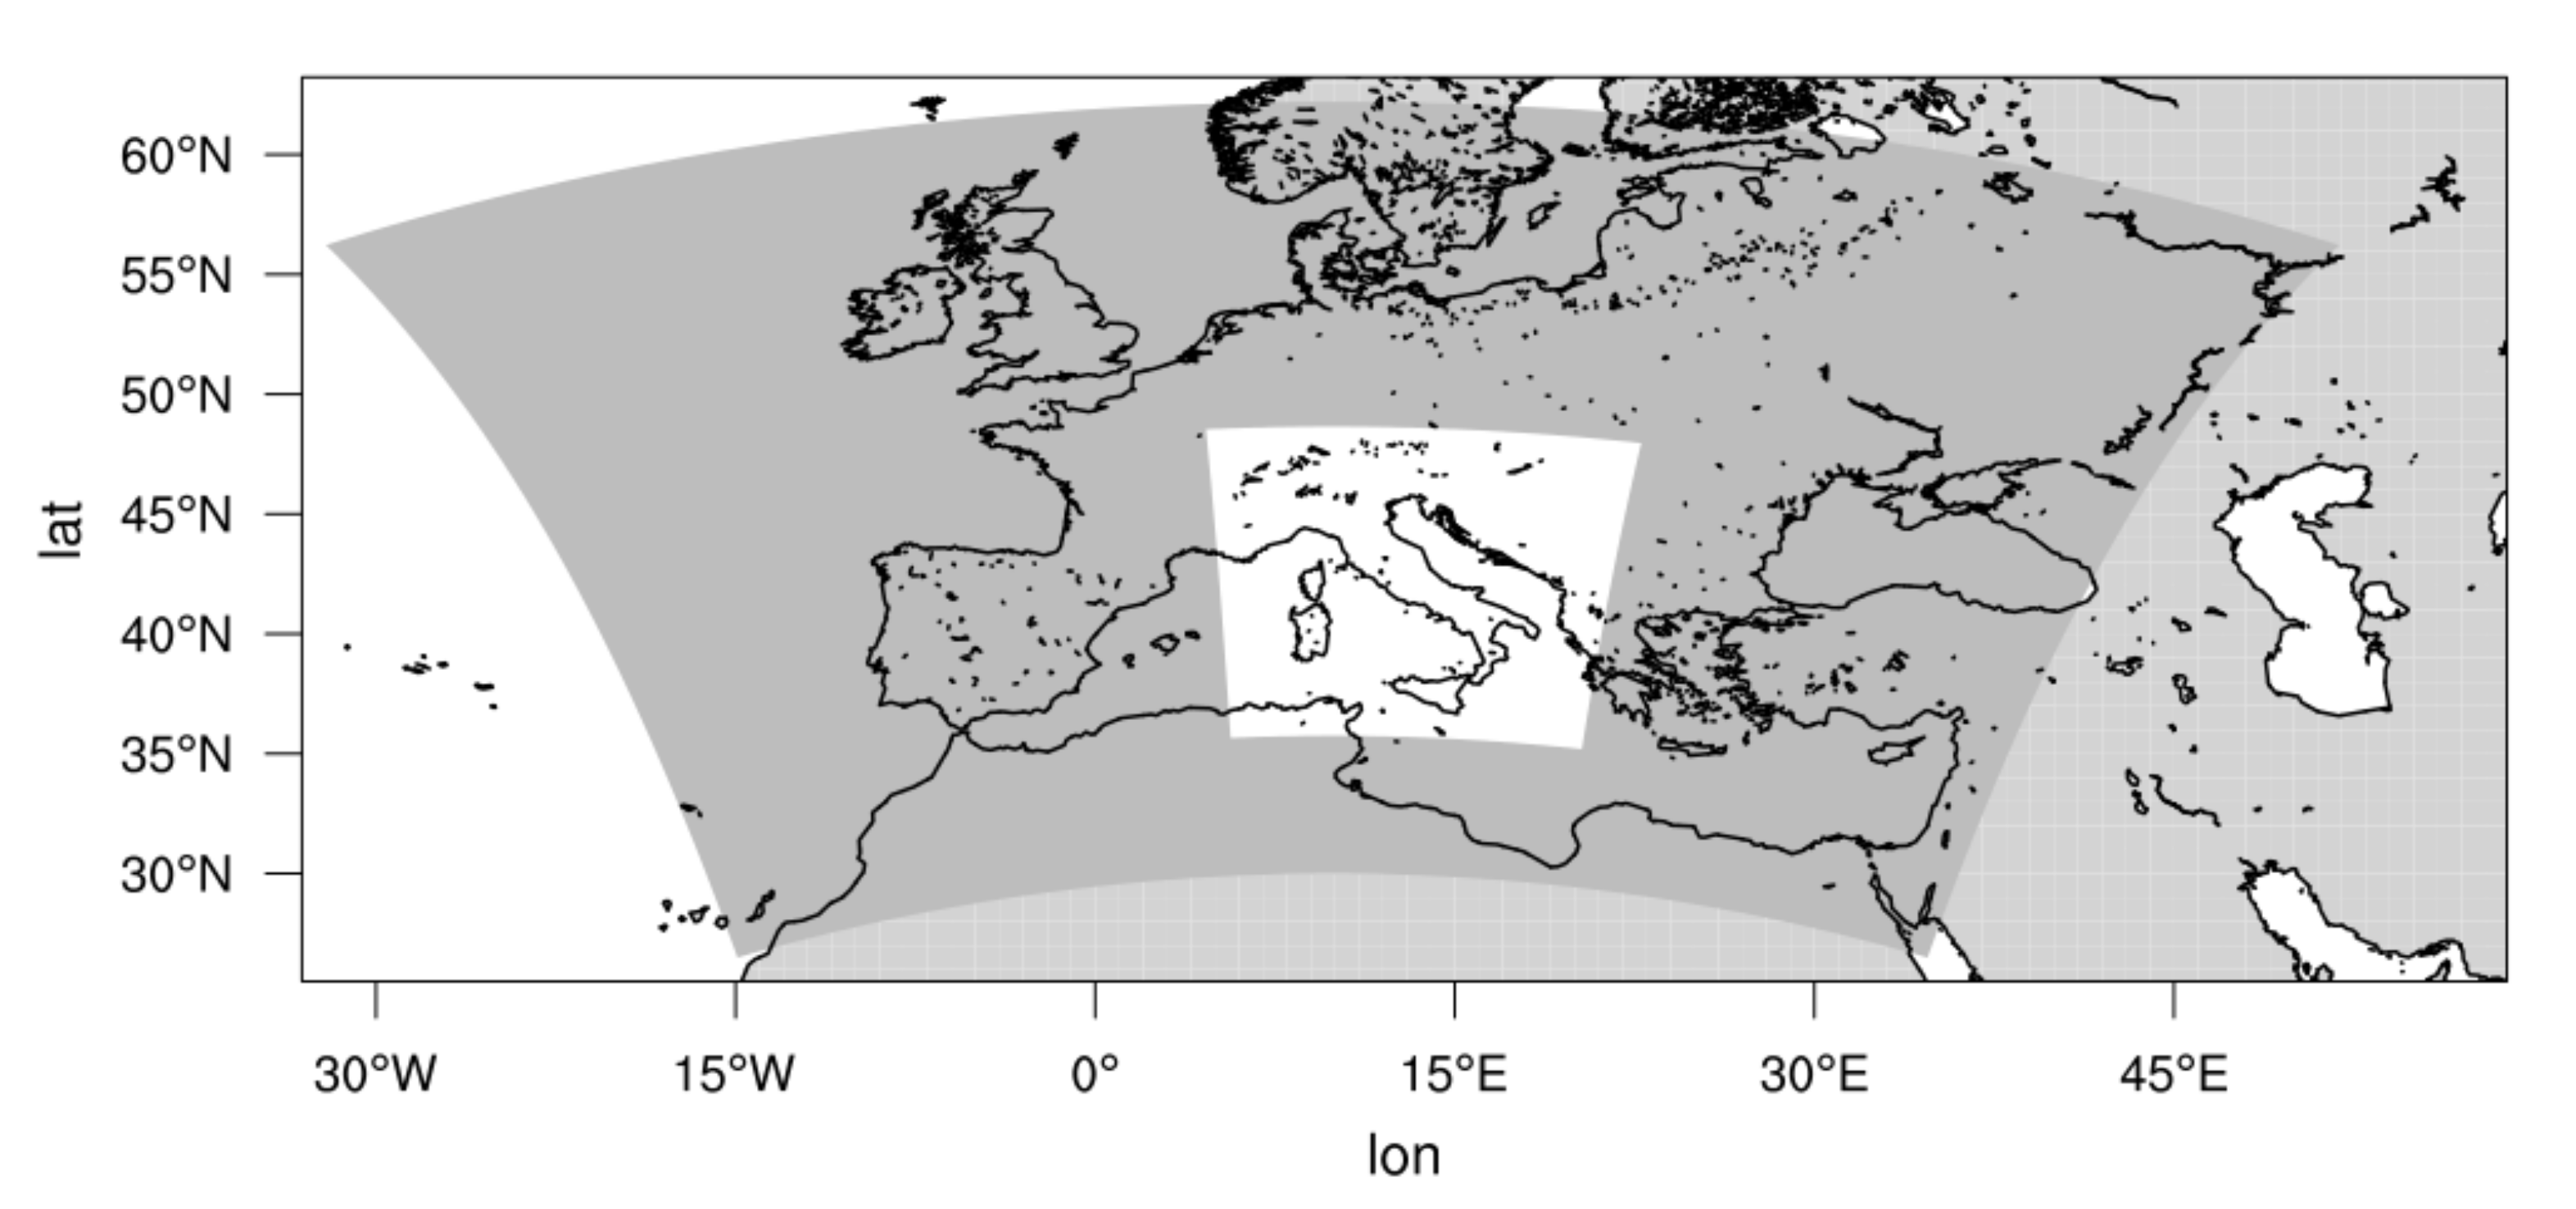
Figure 1. Horizontal domains of model simulations.
Atmosphere 12 00192 g001
Figure 2. Seasonal average of model (maps) and measurements (filled circles) of O3 concentration (µg m−3) for June, July and August (JJA) season (a) and NO2 concentration (µg m−3) for December, January, February (DJF) season (b).
Atmosphere 12 00192 g002
Figure 3. Seasonal average of model (maps) and measurements (filled circles) of PM2.5 concentration (µg m−3) (a) and PM10 concentration (µg m−3) (b) for DJF season.
Atmosphere 12 00192 g003
Figure 4. Average values calculated overall background stations for whole period of interest, from December 2009 to November 2010, for O3 (a) and NO2 (b). Maximum daily 1-h average concentration (µg m−3) for O3 and daily mean values concentration (µg m−3) for NO2 are plotted through blue filled circles (observations) and red empty circles (model). The monthly mean of the plotted concentration is represented with solid line (red line represents simulated value, while blue line represents measured values).
Atmosphere 12 00192 g004
Figure 5. As in Figure 4, but for PM2.5 (a) and for PM10 (b) daily mean values concentration (µg m−3).
Atmosphere 12 00192 g005
Figure 6. Hourly mean ozone concentration averaged overall background station for the summer season. Observations (blue curve) and modeled concentrations (red curve) are reported.
Atmosphere 12 00192 g006
Figure 7. Scatter plots for hourly O3 (a) and NO2 (b) concentration and daily PM2.5 (c) and PM10 (d) concentration. The point refers to the samples having the concentration value (µg m−3) reported on the axis. Such calculations was done on seasonal basis: upper-left spring, upper-right summer, down-left autumn and down-right winter.
Atmosphere 12 00192 g007
Figure 8. Taylor diagram generated for O3, on seasonal basis as reported in the legend.
Atmosphere 12 00192 g008
Figure 9. As in Figure 8, but for NO2.
Atmosphere 12 00192 g009
Figure 10. As in Figure 8, but for PM2.5.
Atmosphere 12 00192 g010
Figure 11. As in Figure 8, but for PM10.
Atmosphere 12 00192 g011
Figure 12. Seasonal average of model (maps) and measurements (filled circles) of O3 concentration (µg m−3) for JJA season (a) and NO2 (b) concentration (µg m−3) for DJF season.
Atmosphere 12 00192 g012
Figure 13. Seasonal average of model (maps) and measurements (filled circles) of PM2.5 (a) and PM10 (b) concentration (µg m−3) for DJF season.
Atmosphere 12 00192 g013
Figure 14. Average values calculated overall background stations for the period of interest, for O3 (a) and NO2 (b) both for BOLCHEM (from December 2009 to November 2010) and for CAMS ensemble median (from January 2010 to November 2010) model. Maximum daily 1-h average concentration (µg m−3) for O3 and daily mean values concentration (µg m−3) for NO3 are reported through blue filled circles (observations) and empty circles (red for BOLCHEM and green for CAMS). The monthly mean of the reported concentration is represented with solid line (red line represents simulated value, while blue line represents measured values).
Atmosphere 12 00192 g014
Figure 15. As in Figure 14, but for PM2.5 (a) and PM10 (b) daily mean values concentration (µg m−3).
Atmosphere 12 00192 g015
Figure 16. Hourly mean ozone concentration averaged overall background station for the summer season. Observations (blue curve) and modeled concentrations at 0.1° and 0.2° resolution (red curve for BOLCHEM model and green curve for CAMS ensemble) are reported.
Atmosphere 12 00192 g016
Figure 17. Taylor diagram generated for O3 (a) and for NO2 (b) for BOLCHEM and CAMS ensemble median (on seasonal basis).
Atmosphere 12 00192 g017
Figure 18. As in Figure 17, but for PM2.5 (a) and PM10 (b).
Atmosphere 12 00192 g018
Table 1. Basic statistics over the European domain: correlation coefficient R, root mean square error RMSE (µg m−3) and mean bias MB (µg m−3) calculated for O3, NO2, PM2.5 and PM10 on seasonal basis for the background stations.
SeasonO3NO2PM2.5PM10
RRMSEMBRRMSEMBRRMSEMBRRMSEMB
MAM0.6425.13−5.380.5021.013.670.659.422.150.5613.720.18
JJA0.7226.362.150.4419.533.490.517.20−1.240.4712.05−5.22
SON0.7120.37−4.210.4919.654.470.6110.351.030.5215.48−0.21
DJF0.5924.99−14.960.4722.095.470.6617.840.350.5325.720.16
Table 2. Basic statistics over italian domain at 0.1° resolution: correlation coefficient R, root mean square error RMSE (µg m−3) and mean bias MB (µg m−3) calculated for O3, NO2, PM2.5 and PM10 on seasonal basis for the background stations, both from BOLCHEM model and CAMS ensemble median.
SeasonO3 BOLCHEMO3 CAMSNO2 BOLCHEMNO2 CAMS
RRMSEMBRRMSEMBRRMSEMBRRMSEMB
MAM0.6230.14−6.440.8418.203.610.4226.264.430.5619.33−9.59
JJA0.6734.822.360.8520.974.480.3526.556.500.4813.89−6.40
SON0.7023.25−2.410.8615.213.170.4723.795.100.6117.72−8.97
DJF0.6220.97−9.180.8313.592.080.4725.150.540.6124.16−13.71
SeasonPM2.5 BOLCHEMPM2.5 CAMSPM10 BOLCHEMPM10 CAMS
RRMSEMBRRMSEMBRRMSEMBRRMSEMB
MAM0.6611.313.600.4012.75−1.780.6112.970.920.5713.05−2.27
JJA0.597.490.480.597.491.000.5310.58−3.600.638.52−0.73
SON0.6211.051.320.5112.45−5.070.5913.20−1.370.6113.46−5.07
DJF0.6416.59−2.130.4929.12−22.300.6318.98−2.180.5627.45−18.16
Publisher’s Note: MDPI stays neutral with regard to jurisdictional claims in published maps and institutional affiliations.