Article

Responses of Primary Productivity and Phytoplankton Community to the Atmospheric Nutrient Deposition in the East China Sea

1
Shanghai Key Laboratory of Atmospheric Particle Pollution Prevention, Department of Environmental Science & Engineering, Fudan University, Shanghai 200438, China
2
Institute of Eco-Chongming (SIEC), No. 3663 Northern Zhongshan Road, Shanghai 200062, China
*
Author to whom correspondence should be addressed.
Atmosphere 2021, 12(2), 210; https://doi.org/10.3390/atmos12020210
Submission received: 4 January 2021 / Revised: 25 January 2021 / Accepted: 1 February 2021 / Published: 4 February 2021
(This article belongs to the Section Meteorology)

Abstract

:
Atmospheric deposition of nutrients to the surface seawater may significantly affect marine phytoplankton growth. Two in situ bioassay experiments were performed in the East China Sea (ECS) by adding nutrients (N, P, and Si) and atmospheric aerosols into the surface seawater. Chlorophyll a (Chl a) concentrations were largely enhanced by simultaneous input of N and P with the maximal increase of 0.68–0.78 μg Chl a per μmol N addition. This Chl a increment was significantly lower (0.19–0.47 μg) in aerosol treatments as a result of initial N-replete condition (N/P ratio ~50) and extremely high N/P ratio in aerosols (>300). Among the multiple influencing factors, atmospheric dry flux of NH4+ + NO3 (AN) was found to be an effective predictor for springtime Chl a in the ECS with a time lag of three days and were strongly correlated with Chl a concentrations on day 3 (r = 0.81, p < 0.001), which might be partly explained by the asynchronous supplies of N (atmospheric deposition) and P (subsurface water). Although dinoflagellates dominated the phytoplankton community in both initial seawaters, additions of P and N + P + Si profoundly enhanced the cell densities and dominance of diatom species Thalassiosira sp. and Nitzschia closterium in the 2012 and 2014 bioassay experiments, respectively. Moreover, the percentage of dinoflagellates were promoted by adding higher NH4+/NO3 ratio (6/4 vs. 1/9) when silicate was at a low concentration (~2 μmol L−1). Atmospheric deposition is likely to be an important N source supporting the high primary production in the ECS and its supply of excess N relative to P may influence dominant phytoplankton groups.

Graphical Abstract

1. Introduction

Marine primary productivity is influenced by multiple factors such as irradiance, temperature, salinity and grazing, but nutrients availability is probably the most important one [1,2]. The East China Sea (ECS) is one of the largest marginal seas of the western North Pacific (WNP) and has a high primary productivity of ~145 g C m−2 y−1 [3], which plays vital roles in the biogeochemical cycles of carbon and other elements [4]. The coastal ECS outer Changjiang River Estuary (CRE) is the most productive area where algal blooms occur frequently [5].
Diatoms and dinoflagellates are two dominant phytoplankton groups in the ECS, and the proportion of dinoflagellates in phytoplankton has risen markedly from less than 5% in the 1980s to approximately 20% in the 2010s [6]. There has also been a shift of major bloom species from diatoms to dinoflagellates since the 1980s [7], and the dominance of dinoflagellates in spring blooms has been observed in recent studies [8,9]. Diatoms are considered to be more efficient than dinoflagellates in carbon export to the deep water due to its relatively large size and siliceous structures [10]. The reduction of diatoms was suggested to be associated with the change in stoichiometric balance between N, P, and Si [11]. Diatoms have advantages over dinoflagellates in nutrients utilization, but they are dependent on Si and susceptible to P limitation [12]. The competition between diatoms and dinoflagellates may also influenced by N speciation. Dinoflagellate blooms tend to be associated with high concentration of reduced forms of N such as NH4+, and inversely diatom blooms in coastal area typically develop under the condition of high NO3 [13,14].
The nutrients composition in the ECS is influenced by several water masses including Changjiang dilution water (CDW), Taiwan warm current (TWC), coastal upwells and Kuroshio current (KC, Figure 1) [15,16]. Atmospheric deposition is another substantial source of nutrients to the surface ocean [17,18,19] and supports 8–70% of the marine primary productivity in different oceanic regions [20,21,22]. The deposition fluxes of atmospheric NO3 and NH4+ to the surface water of the ECS are comparable to those transferred by the Changjiang River [23,24]. Atmospheric aerosols over the coastal ECS contain the ratio of water-soluble inorganic N (WSIN) to P (>300) much higher than 16 (Redfield ratio), nearly the same amounts of NH4+ and NO3 [25,26] and little bioavailable Si [27], which differ greatly to the Changjiang River water that contains lower NH4+/NO3 and N/P ratios and abundant Si [28]. The marginal seas of the WNP are among the high-atmospheric-deposition regions worldwide [29,30]. The recent increase in anthropogenic emissions of reactive N from northeastern Asia may have caused the increase of excess N relative to P in the upper water, which may switch the nutrient status from N limit to P limit in the long run [31,32]. “Excess nitrate” was measured in multiple regions of the ECS and high N/P ratios were found in the CRE and adjacent waters [33,34]. It has been indicated that primary productivity in large areas of the Yellow Sea (YS) and the ECS may be limited by phosphate [34,35].
The influence of atmospheric deposition on marine primary production and phytoplankton community is of great concern [21,36,37] and many studies have reported the effects of aerosol or nutrients inputs on the phytoplankton growth and community change by applying bioassay experiments [19,35,38,39]. Correlations have also been observed between dust events and algal blooms in the eastern North Pacific, the Yellow Sea and the Arabian Sea [40,41,42,43]. In this study, bioassay experiments with additions of different nutrients and aerosol samples were conducted in the coastal ECS, and the correlations between satellite retrieved Chl a concentrations and long-term measurements of aerosol nutrient fluxes in springtime were also analyzed to understand the mechanism of how atmospheric deposition, together with other nutrient sources (such as upwells), affects primary productivity and dominant phytoplankton groups in the ECS, with broader implications with respect to the P-deficient coastal seas.

2. Methods

2.1. Aerosol Sample Collection and Dry Flux Estimate

Aerosol samples including total suspended particulate (TSP) and size-segregated samples were collected on Huaniao Island from year 2011 to 2015 using a high-volume sampler (1130 L min−1) and a nine-stage Anderson Cascade Impactor (28.3 L min−1, Thermo Fisher Scientific, MA, USA). All samples were collected on Whatman® 41 cellulose filters and the filters were stored frozen at −20 °C. The analysis was performed by cutting 1/16 filter sample and sonicated in 20 mL milliQ water for about 40 min. The mixture was filtered through 0.45 μm pore size membrane, and the filtrate was analyzed for NH4+ and NO3 using Ion Chromatography (ICS 3000, Dionex, CA, USA). A portion of filtrate was adjusted to 2% HNO3 and then analyzed for water-solubleP, Fe and Cu (hereafter we use soluble P, Fe and Cu) by inductively coupled plasma optical emission spectrometer (ICP-OES, SPECTRO, Kleve, Germany). Detailed procedures for aerosol sampling and chemical analysis are seen in Wang et al. [44]. The dry deposition fluxes of aerosol components including NH4+, NO3 and soluble P, Fe, and Cu were estimated by multiplying the atmospheric concentrations (C) by their dry deposition velocities (Vd, Equation (1)):
F = C × Vd
The dry deposition velocity (Vd) was calculated by multiplying the mass percentage of aerosol component in each stage of the size-segregated samples (Ri) by the particle deposition velocity of the corresponding size bin (Vi, calculated from William’s model) and then sum up (Equation (2)) [45]:
V d =   i = 0 8 R i   ×   V i

2.2. Bioassay Experiments

In situ incubation experiments were performed at Huaniao Island (30.86° N, 122.67° E) in the ECS on 6–9 June 2012 and 12–16 May 2014 using surface seawater collected onboard a wood boat at 30.85° N, 123.17° E and 30.85° N, 123.15° E, respectively (about 50 km eastward from Huaniao Island, Figure 1). Seawater was pre-filtered through 50 μm nylon mesh and stored into acid-cleaned 50 L carboys (Nalgene®), which were covered with black plastic bags during transport. The temperature and salinity of ambient seawater were measured using a YSI EC 300 Multi-Parameter Water Quality Sonde (Yellow Spring, OH, USA). The seawater was filtered through 50 μm nylon mesh again (to remove accumulated algal cells) before being transferred into 4 L polyethylene cubitainers to mimic a closed marine system. The cubitainers were tied on a floating raft and soaked into the seawater for incubation. A neutral density screen was used to attenuate sunlight to 50%, which was equivalent to the upper 10 m of euphotic zone during summer months.
Five nutrient treatments with different stoichiometry and two aerosol treatments were designed for bioassay experiments (Table 1). Chemicals (NH4)2SO4, NaNO3, NaH2PO4∙2H2O, and Na2SiO3∙9H2O were used for nutrient additions. Two aerosols, samples A1 (collected on 31 March 2012) and A2 (collected on 27 October 2012), representing mineral dust and anthropogenic pollutants [39] were selected and added, respectively. The addition of 10 μmol L−1 NH4+ + NO3 (AN) was estimated by assuming that the 10 day atmospheric deposition of water-soluble inorganic N (WSIN) retained within 10 m mixed layer [46], and the two NH4+/NO3 molar ratios (1/9 and 6/4) was set up to simulated different (exceptional and average) atmospheric deposition scenarios. The input of soluble P (SP) and other components to seawater along with the aerosol additions could be estimated (Table 1 and Figure S1). The accretion of 0.6 μmol L−1 PO43− in nutrient treatments was calculated from the N/P Redfield ratio (16) and also comparable to the benthic levels of PO43− in offshore water of the ECS [16]. A total of 10 μmol L−1 SiO32− was added according to the Redfield N/Si ratio of 1:1. The addition of 1 mg L−1 aerosol sample was calculated according to the moderately strong deposition event in the studied area of approximately 10 g m−2 into the mixed layer of 10 m [35]. Triplicate cubitainers were sacrificed for each sampling time to minimize uncertainty. The sampling information is detailed in Table S1.

2.3. Chl a, Nutrients Measurements, and Phytoplankton Cell Counting

According to the Vertically Generalized Production Model (VGPM) at Ocean Productivity site [47], primary productivity is a function of Chl a, day length, photosynthetically available radiation (PAR), euphotic depth, and physiological variable. While not simply linear correlated, Chl a may be representative of changes in mixed-layer productivity [48]. An empirical correlation has been observed between springtime Chl a concentration and primary production (Figure S2), so here Chl a concentration is used as an indicator of primary productivity.
Chl a samples in the bioassay experiments were prepared by filtering 350 mL seawater through GF/F filters under gentle vacuum and stored in cryovials at −20 °C until being processed. The samples were extracted using magnesium carbonate-saturated 90% acetone according to Method 445.0 (Arar and Collins, 1997, EPA) and analyzed using a fluorescence spectrophotometer (CARY Eclipse, Varian, CA, USA).
Fifty milliliter seawater was collected through syringe filtration (0.45 μm PES) and stored frozen (−20 °C) before analysis. Nutrient concentrations were determined by an autoanalyzer (QuAAtro, Bran+Luebbe GmbH, Norderstedt, Germany) with detection limits of 0.04, 0.015, 0.015, 0.024, and 0.03 μmol L−1 for NH4+, NO3, NO2, SP, and SiO32−, respectively. Surface water collected onboard R/V Dong Fang Hong 2 during the three cruises (23 March–14 April 2014 [25], 1 April–2 May 2015 and 27 March–11 April 2017 [49]) covering the area from marginal seas to remote western North Pacific (WNP) were also analyzed for the concentrations of NH4+, NO3, NO2, SP, and SiO32− using the same procedure.
One liter of seawater was preserved with 1.5% Lugol’s iodine solution and condensed to a final volume of about 10 mL by settling for over 48 h. The condensed solution was adopted for phytoplankton cell counting using an inverted microscope (ECLIPSE Ti-S, Nikon, Tokyo, Japan). Compared to the molecular biological methods [39], the microscopic counting may rely highly on experience of the operators, but it may provide accurate quantitative information of specific algal species and, thus, provide useful information of phytoplankton groups. Recounts were performed to minimize inaccuracies.

2.4. Statistical Analyses for Correlations between Chl a and Atmospheric Components

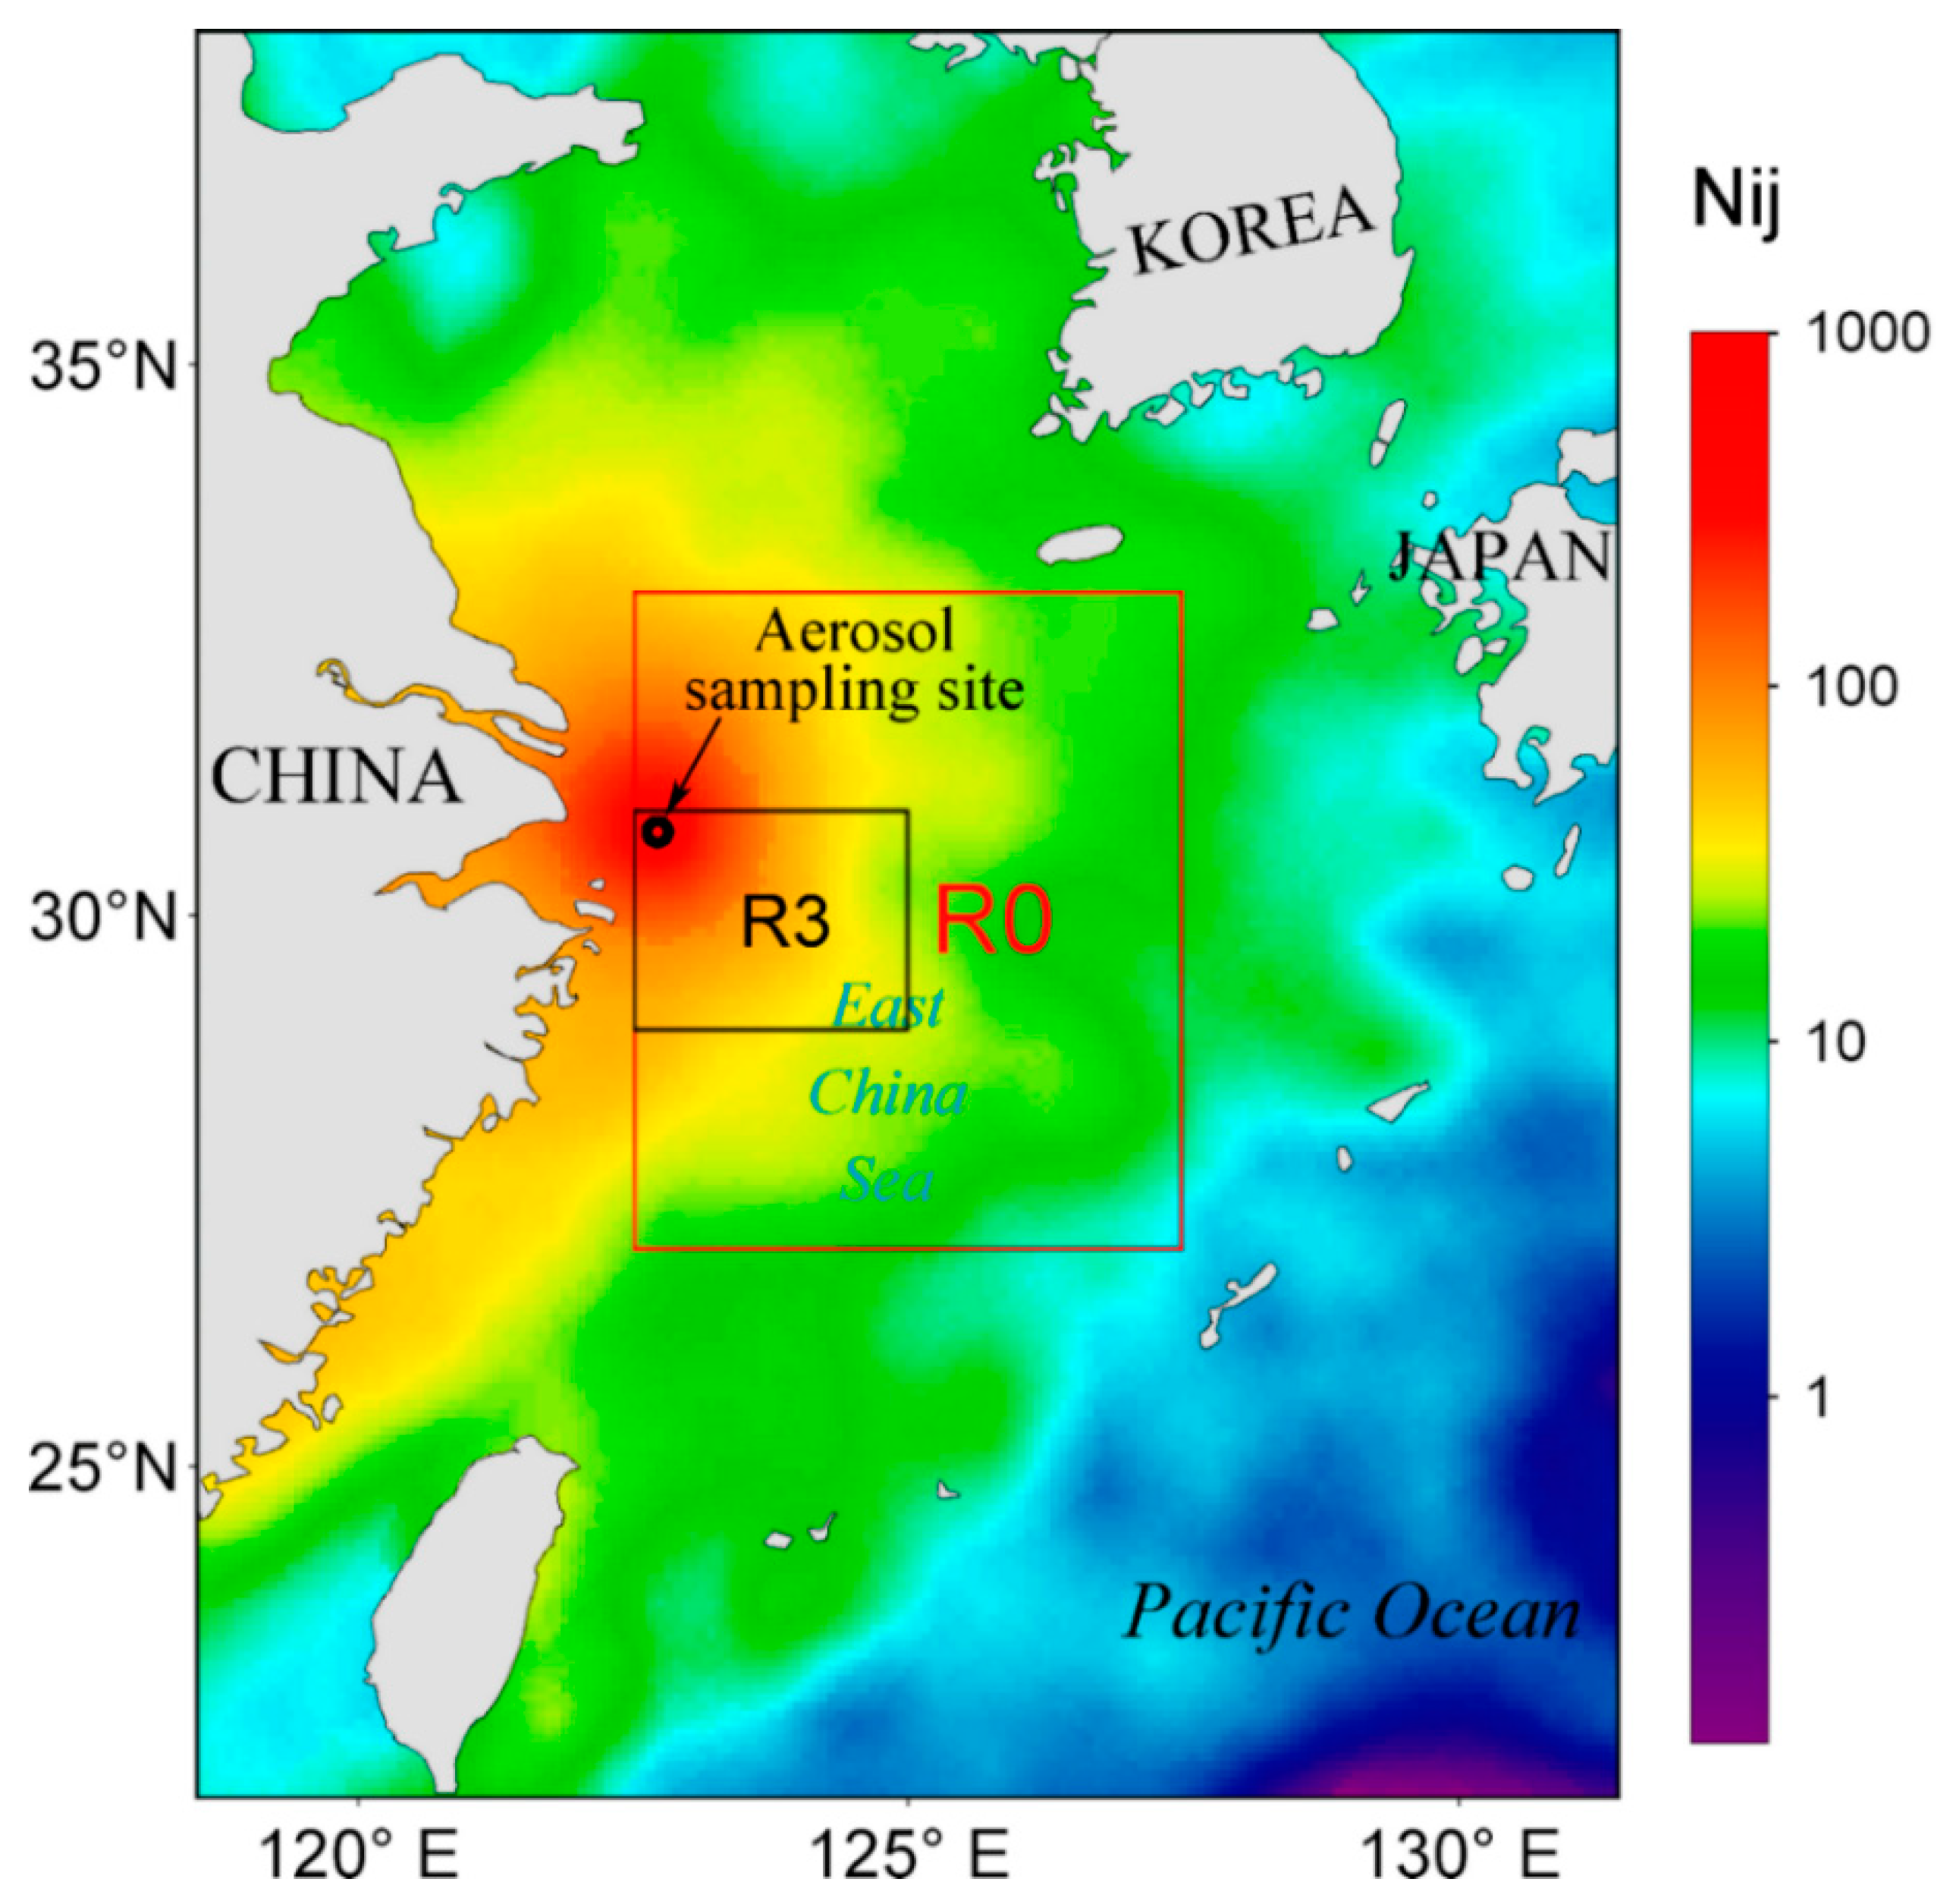
The studied oceanic regions were selected considering the multiple influencing factors including Changjiang River runoff, upwells in coastal areas, and the forward air trajectories from Huaniao Island (aerosol sampling site). 72 h forward trajectories at 700 m starting height during the springs of 2011–2015 were calculated by running the NOAA Air Resource Lab HYSPLIT model and the TrajStat Software [50,51]. Nij value is used as the number of trajectory segment endpoints falling into each statistical grid cell (0.5° latitude × 0.5° longitude) [52]. To identify the influence of atmospheric deposition, a 2° × 2.5° (latitude 29–31° N and longitude 122.5–125° E) area (generally with Nij values greater than 30) located in the southeast to Huaniao Island was selected as the studied area (R3), and a 6° × 5° area (R0, 27–33° N and 122.5–127.5° E, generally with Nij values greater than 10) covering the southern YS and the majority of the ECS (Figure 2) was used to compare with R3 in the statistical analysis.
The average Chl a (level 3 standard products of MODIS/Aqua and Terra), sea surface temperature (SST) and PAR corresponding to each sampling day in the springs of 2011–2015 were obtained from MODIS (http://oceancolor.gsfc.nasa.gov), with a 4 km × 4 km resolution. The data were processed using SeaDAS software (version 7.4) to obtain the average value in a 2880 (48 × 60) pixels area. Only samples on none-wet days (foggy and rainy days are excluded) were included to represent the atmospheric dry deposition scenario. To avoid inaccuracy in statistics, abnormal values (Chl a >15 μg L−1 with few data point) were excluded. Higher Chl a values obtained from Aqua data (usually >5 μg L−1), lower values (usually <1 μg L−1) obtained with less than 140 pixels, and values obtained with few valid pixels assembles at the margin that may be extension of data set in the adjacent area (that may not represent the average level for the studied area) were replaced with those obtained from Terra data (if befitting) or excluded (if Terra data is void or also less than 140 pixels).
The relationships between Chl a and influencing factors including atmospheric NH4+, NO3, SP, soluble Fe and Cu, and environmental factors (PAR, SST) were analyzed using the Automatic Linear Modeling (ALM) in IBM® Statistical Product and Service Solutions (SPSS, IBM Corp., Armonk, NY, USA), since the ALM outperform traditional regression analyses by automatically transforming independent variables, trimming outliers, and conducting model ensemble to improve predictions. In this study, 5 predictors were included and forward stepwise method with Akaike Information Criterion Corrected (AICC) and 95% confidence level were applied.

3. Results and Discussion

3.1. Changes of Chl a Concentrations

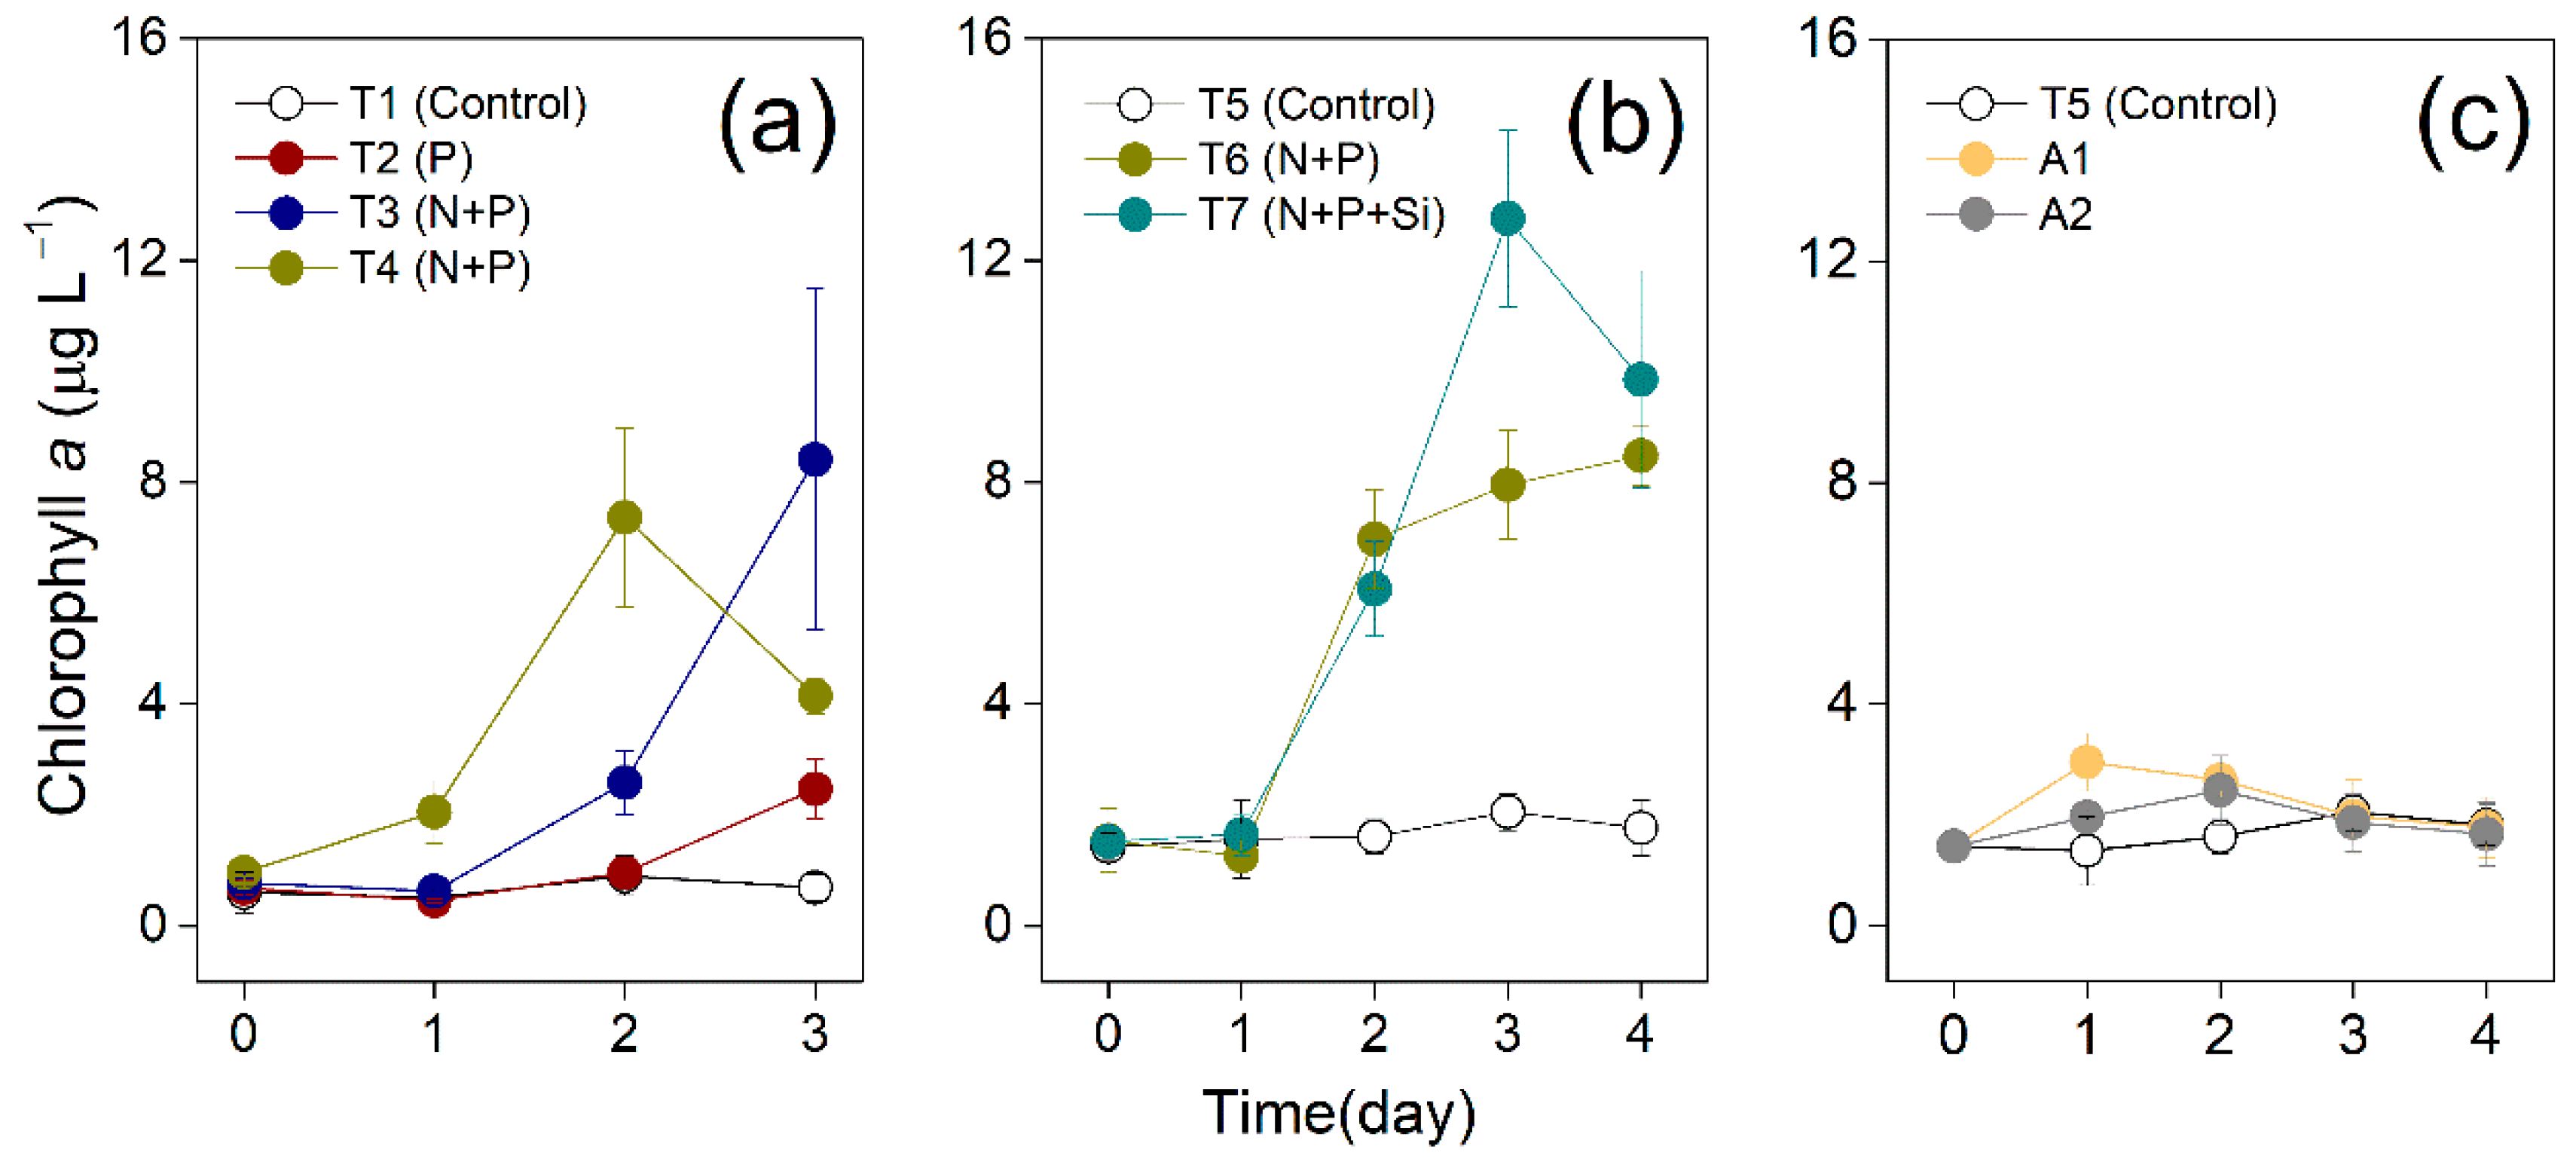
The initial Chl a concentrations in seawater collected for 2012 and 2014 bioassay experiments were 0.61 and 1.44 μg L−1 respectively, which were comparable to those (0.27–1.37 μg L−1) measured previously in the surface ECS [53]. The initial concentrations of NH4+, NO3, SP, and SiO32− in the seawater collected for 2012 experiment (Figure 1) were comparable to the nutrients previously reported (0.2–4.8 μmol L−1 NO3 and 0.1–0.4 μmol L−1 SP) in the same area of the ECS [53,54]. The N and Si concentrations were higher than 2 μmol L−1 and the P concentrations were lower than 0.2 μmol L−1 which represent approximate half-saturation constants for uptake and potentially limit algal growth [55]. The N/P ratio, Si/P ratio were 44.2, 23.1 in 2012 seawater and 45.8, 115.7 in 2014 seawater, respectively, higher than the criteria for P limitation (N/P > 22, Si/P > 22) proposed by Justić et al. [56]. A remarkable increase of Chl a (156% of the control) was observed in P treatment (T2, Figure 3a) but not with the addition of only DIN (Figure S3a from a microcosm experiment), suggesting that P was likely a prior limiting factor for phytoplankton growth in the sampled seawater. Moreover, the maximal Chl a concentrations were considerably higher in N + P treatments (8.41, 7.37 and 8.48 μg L−1 for T3, T4 and T6, respectively, Figure 3b) compared to T2 (2.47 μg L−1), implying that initial N concentration (2.91–5.35 μmol L−1) in seawater may not be sufficient to support the phytoplankton growth induced by 0.6 μmol L−1 P addition and PN co-limiting seemed to occur. Our observation of maximal Chl a (8.41 μg L−1) in all N + P treatments was comparable to the highest value (9.1 μg L−1) reported in this area in spring [57], suggesting that the amounts of N and P added in the bioassay experiments were in a reasonable range compared with the actual nutrient inputs.
Although containing adequate N (equivalent 3.3 μmol L−1 and 5.3 μmol L−1 WSIN were added with 1 mg/L aerosol samples to A1 and A2, respectively), limited increase of Chl a was observed in two aerosol treatments (Figure 3c), suggesting that under potential P limitation, aerosols containing little SP may not notably promote the growth of phytoplankton. Similar bioassay experiment was performed in the May of 2018 with the N/P ratio 29.2 and Chl a concentration 3.00 μg L−1 in the initial seawater. The Chl a concentrations increased to 7.93–9.09 μg L−1 (compared to a maximum of 6.64 μg L−1 in the control) in aerosol addition (1.5 mg L−1) treatments and to a higher level of 16.4–19.0 μg L−1 in aerosol plus PO43− (0.375 μmol L−1) treatments [58] (exemplified in Figure S3b). This indicated that affluent aerosol N could be consumed if affluent P was provided by other sources. Atmospheric deposition as a significant source of DIN may combine with the “excess” P supplied by TWC or upwelling in the coastal ECS to induce the remarkable phytoplankton blooms.

3.2. Correlations between Chl a and Nutrients

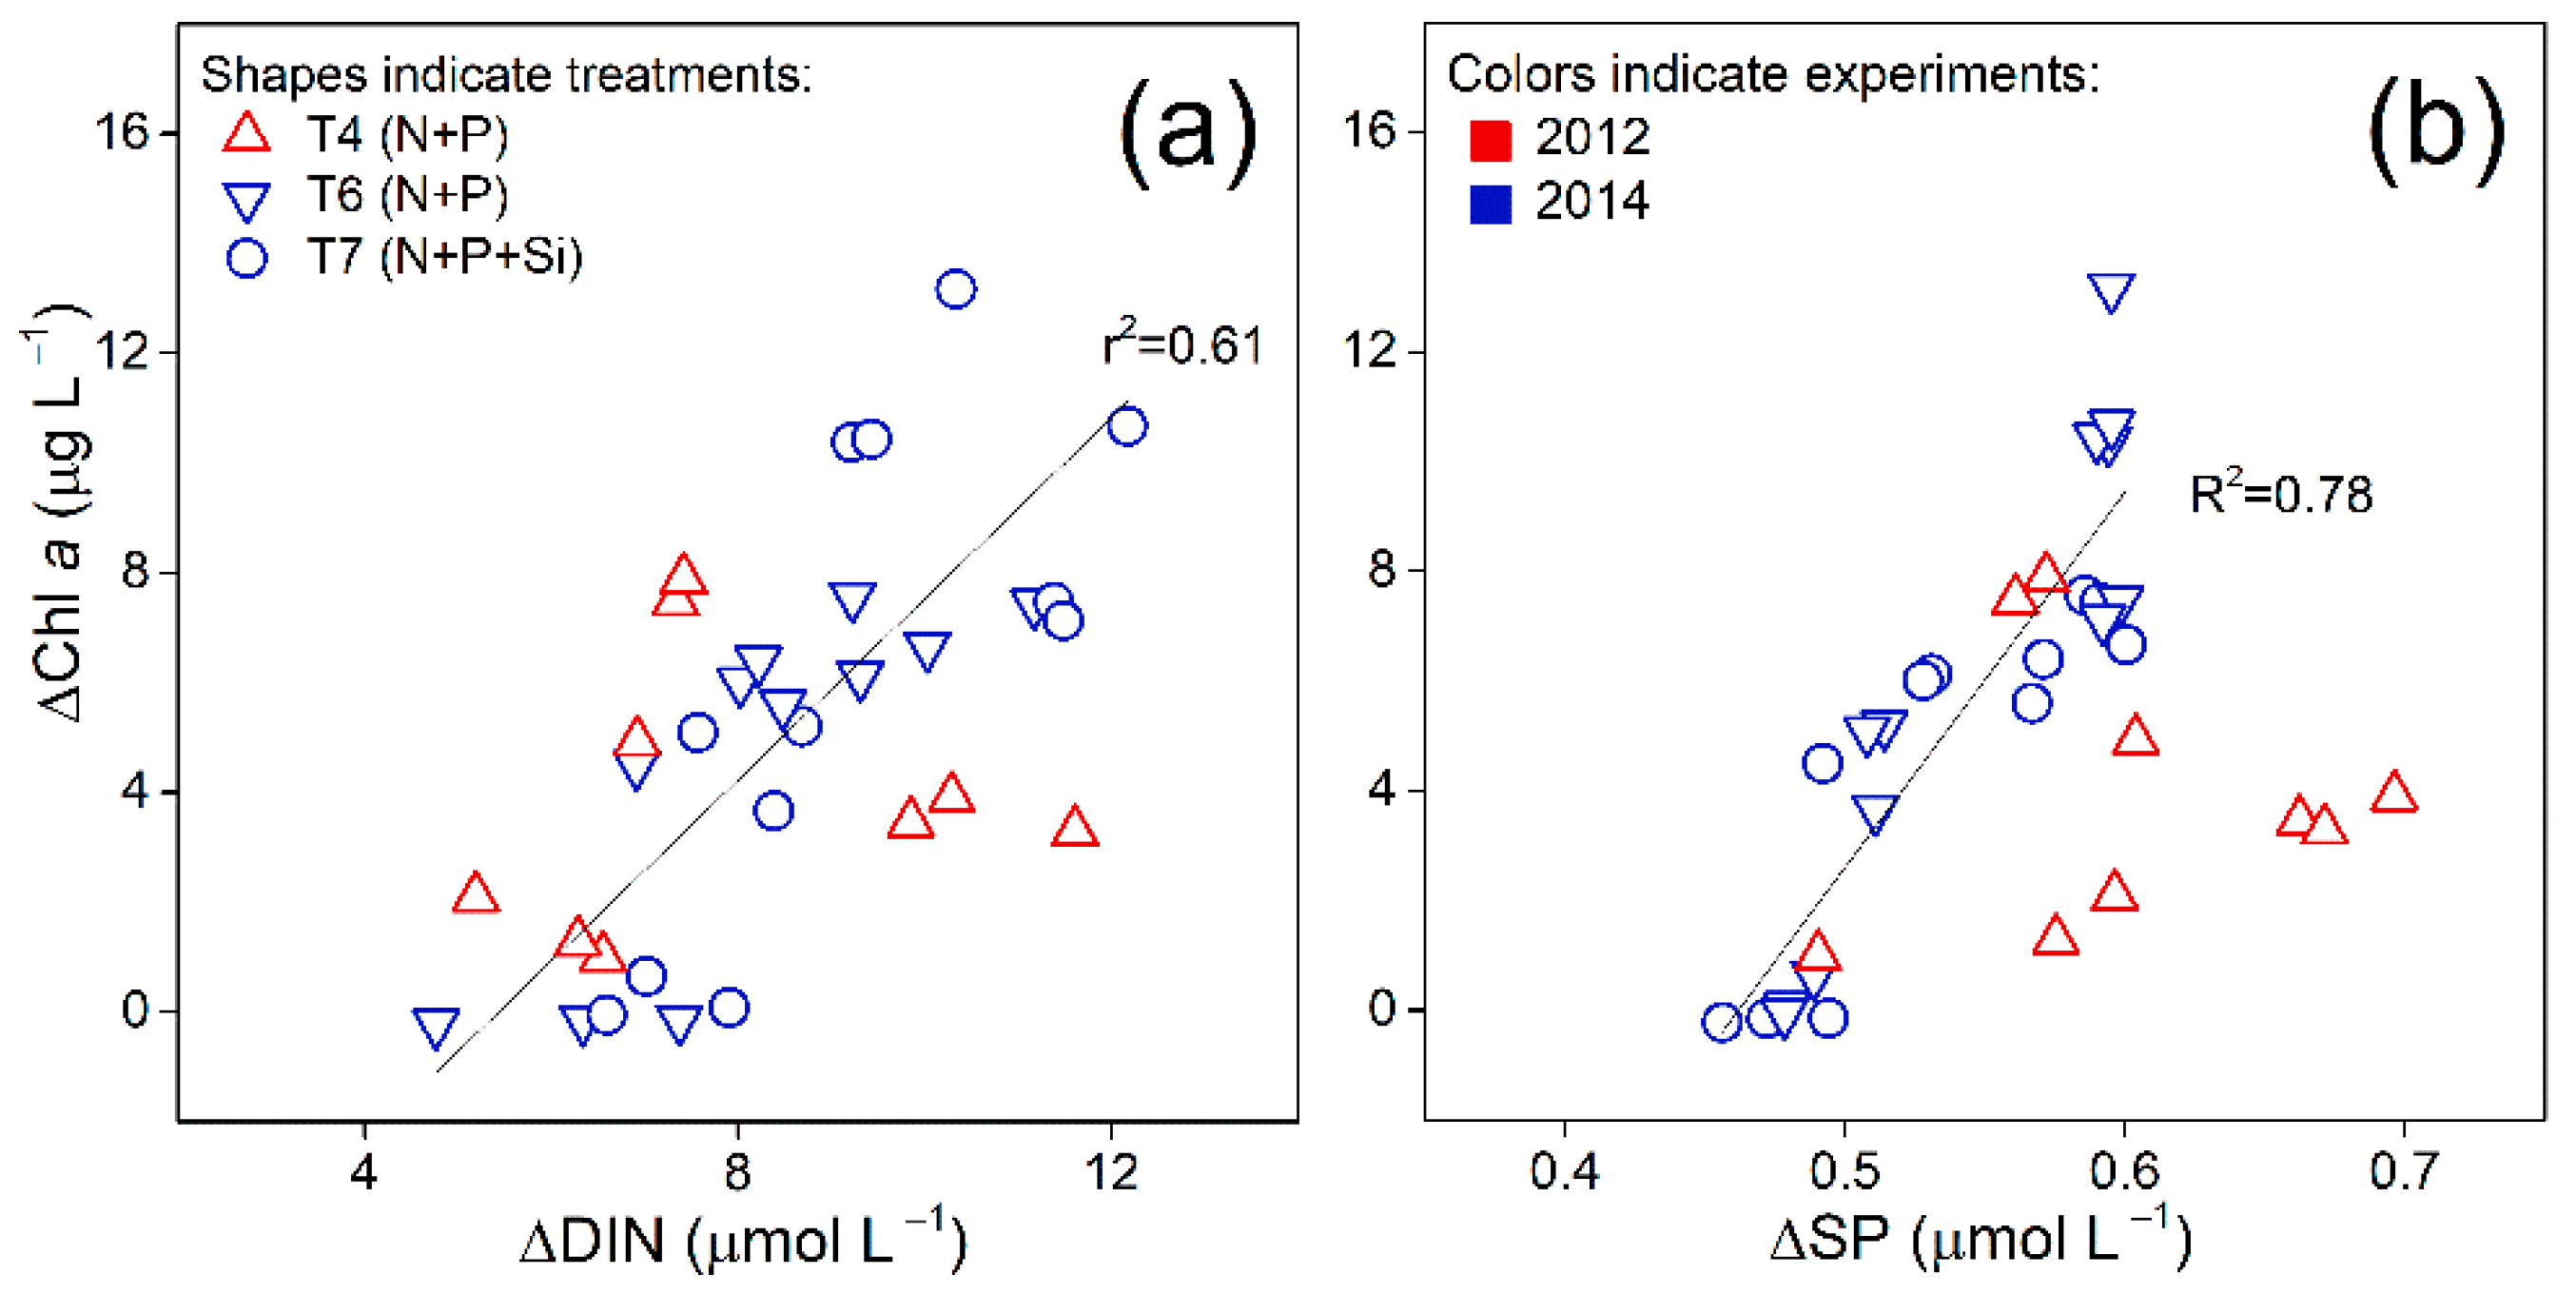
Although the experiments were conducted in two respective years with different seawater conditions, the maximal ΔChl a was found to be similar in T3, T4, and T6 (6.76–7.80 μg L−1) when adding a total of 10 μmol L−1 DIN and 0.6 μmol L−1 PO43− (Table 2). This suggested that the response of chlorophyll a concentration to the input of exogenous N was fairly consistent with adequate P supply. The maximal ΔChl a increased significantly in T7 (11.3 μg L−1) when adding silicate along with N and P. The Si addition in our experiment may be conducive to diatoms growth and thereby enhance primary productivity. Chl a responded quicker in T4 and T6 (with higher NH4+ concentration added) than in T3 (Figure 3), which was consistent with the easier uptake of NH4+ than NO3 by algal cells [59]. Nitrate needs to be first reduced to NH4+ before being utilized and this process is catalyzed by two iron-containing enzymes nitrate reductase and nitrite reductase [60]. Given the differences in initial nutrient concentrations (Figure 1) and the sampling period, the variation in Chl a could be influenced by other factors as well as the easier uptake of NH4+.The maximal Δ Chl a were 1.52 and 1.01 μg L−1 in A1 and A2 (aerosol treatments), corresponding to the maximal 0.47 and 0.19 μg Δ Chl a induced by per μmol DINadd, respectively (Figure 3c), significantly lower than those (0.68–0.78 μg) in N + P treatments (T3, T4 and T6, Table 2). This may be explained by the input of very high N/P ratios in A1 (980) and A2 (1149) treatments, and the extremely low soluble P content in aerosols (Figure S1) mutes the response of primary production [36]. In nutrient addition treatments of 2014 experiment (T6 and T7), the increase of Chl a concentration (ΔChl a) was found to be significantly correlated with the decline of DIN concentration (ΔDIN) with a slope of around 1.65 regardless of SiO32− concentrations added (Figure 4a, only blue color, r2 = 0.61). This was higher than the median value of 1.05 μg Chl a increase per μmol NO3 decline reported by Gowen et al. in the field observation in Scottish coastal waters [61]. Linear relationship was also found between ΔChl a and SP consumption (ΔSP) in nutrient treatments of 2014 experiment with a slope of 68.4 (Figure 4b, only blue color, r2 = 0.78). Thus, the uptake ratio of ΔDIN/ΔSP (41.5) by phytoplankton was considerably higher than the Redfield ratio of 16, suggesting that phytoplankton probably adapted to the initially high DIN/SP ratio (48.2) in seawater and their utilization of P was much more efficient than DIN [62].
No correlation was found between ΔChl a and nutrients consumption (both ΔDIN and Δ SP) for the two aerosol treatments. The calculated ratios of maximal ΔChl a to the maximal ΔDIN (ΔChl amax/ΔDINmax) were 0.44 and 0.63 μg per μmol for A1 and A2 treatments respectively, comparable to those of N + P treatments (0.63–0.67 μg per μmol, Table 2). Although atmospheric deposition had limited impact on the growth of phytoplankton when P was in a short supply (initial DIN/ SP ratio ~50), the value of ΔChl amax/ΔDINmax was consistent. By contrast, significant accretion of ΔChl amax/ ΔDINmax was found in T7 (0.97) compared to T6 (0.67) in 2014 experiment by the addition of N + P + Si (Table 2), suggesting that the primary productivity supported by per unit DIN increased by adding Si (facilitating diatoms growth).
Quantification of Chl a increase related to DIN input is of great importance in simulating the effect of atmospheric deposition on marine primary productivity. Results of this study showed that the Chl a increase (ΔChl a) in bioassay experiments was highly correlated with DIN consumption (ΔDIN) with adequate P supply. Similar bioassay experiments were conducted in the same area [35,58] or in other coastal seas such as the Yellow Sea [63] and the South China Sea [64], but the ΔChl a values caused by nutrients addition were different. This indicated that initial nutrient composition, dominant phytoplankton groups and experimental design should be taken into consideration in quantification of Chl a increase induced by atmospheric N input. Although aerosol deposition could not effectively promote Chl a in the coastal ECS due to P deficient, it provides affluent WSIN. In our experiments, the increase of Chl a in the treatment adding both N and P was significantly larger than only P treatment, suggesting that phytoplankton growth in the coastal ECS could be limited by P followed by N. Thus, the affluent WSIN supplied by atmospheric deposition may play a critical role in supporting algal blooms with the P input from other exogenous sources.

3.3. Correlations between Atmospheric N Fluxes and Chl a

The averaged Chl a concentrations in R3 usually peak in the spring (Figure S2). To better identify the influence of atmospheric N deposition on the primary production in the ECS and diminish the influence of factors with seasonal variation, such as nutrient supply from the Yangtze River or upwelling, we combined field measurements of daily aerosol components over Huaniao Island during springtime from 2011 to 2015 with MODIS/Aqua standard level 3 Chl a, PAR and SST in the same periods. The daily Chl a corresponding to aerosol sampling days range between 0.66 and 5.09 μg L−1 in the studied period of 2011–2015 (Figure 5). The mass concentrations of NO3 and NH4+ in the samples collected in the same period over Huaniao Island ranged between 0.3–37.1 μg m−3 and between 0.02–9.2 μg m−3, respectively, The calculated deposition velocities for NO3 and NH4+ were 1.5 and 1.2 cm s−1 [26] respectively, and therefore the dry deposition fluxes of NO3 and NH4+ ranged between 6.7–775 μmol m−2 d−1 and between 1.1–531 μmol m−2 d−1, with the averages (medians) of 174 (150) and 158 (136) μmol m−2 d−1, respectively (Figure 5). The variations of atmospheric concentrations of soluble P, Fe, and Cu were provided in Table S2.
Time-series of atmospheric dry fluxes of NH4+, NO3, AN, and soluble P, Fe, Cu, and MODIS derived SST, PAR were used as predictors for estimating the change of springtime Chl a concentrations in R3 by considering the time lag of 1–5 days. ALM results showed that besides the environmental factors of SST and PAR, AN ascended in the importance for predicting the Chl a of R3 from day 1 to day 3, and its predicting accuracy reached the maximum 52% on day 3 (Figure S4). Chl a could also be predicted (51.4% accuracy) with NH4+ and NO3 as two major predictors separately on day 3 (Figure S5). Correlation analysis also showed that atmospheric AN flux was significantly correlated with Chl a on day 3 but not on day 0 (r = 0.81, p < 0.001, Figure 6), suggesting that Chl a response to the atmospheric N input may take a certain period. This could be partly explained by the relatively high N/P ratios measured in the surface water of the R3 region (averaged 59.6 using data in R3, Figure S6), and P is scarcer than N to cause the increase of Chl a. By contrast, lower correlations were found between Chl a concentration and atmospheric components in R0 which might have different nutrient status and was less affected by the air masses transported from Huaniao Island (Table S3).
Weak correlation was observed between Chl a and P (Figure S7), while atmospheric P deposition should not be a critical predictor due to its very low content in aerosols and limited effect on Chl a as observed in the bioassay experiment. The lack of significant correlation between Chl a and Fe in R3 on day 0 was consistent with the previous result [65]. Although dust deposition is an essential source of Fe to the surface ocean [66], riverine input, shallow depth and upwells in the coastal area may largely erase the influence of atmospheric Fe input. Except for the coastal areas, the concentration of N in surface seawaters of major part of the ECS is close to or below the proposed N limitation level of 2 μmol L−1 (Figure S6), the N deposition seemed to be a significant N sources and contributed substantially to the primary productivity in the ECS. Zhu et al. calculated that atmospheric N deposition could support 7.2% of the total primary production in the ECS, and this value might be tripled if wet deposition was included [26]. As the most abundant nitrogen species in atmospheric deposition (10 mmol m−2 y−1 vs. 6.1 mmol m−2 y−1 of NO3) [26], NH4+ had the highest significance in predicting Chl a concentration, but it showed lower correlation coefficient than NO3 (Figure 6). This probably because NH4+ can be utilized easier than NO3 and trigger quicker response of Chl a within three days. In addition, the ocean is also a potential NH3 source and not just a passive recipient for atmospheric NH4+ deposition [67].
Anthropogenic N deposition has caused increase of excess N relative to P in the marginal seas of the WNP in past decades [31]. Previous studies indicated that except in winter season, most area of the ECS is limited by P or co-limited by N and P [34,68]. Our springtime shipboard investigation over the WNP exhibited a different nutrient scenario that the nearshore surface water was in a P-limiting state whilst relative abundant P was observed offshore (Figure S6). In coastal seas, excess nutrients usually lead to severe eutrophication and consequently hypoxia and N can be removed via denitrification or anammox [62,69,70], leaving relatively abundant P in the subsurface water. This exogenous source of P may support the high primary productivity in the ECS combined with excessive N input via atmospheric deposition (and runoffs). The maximum Chl a concentration induced by adding 0.6 μmol L−1 P (benthic P level in the ECS) in two bioassay experiments was close to that in field observations, indicating that the natural primary production in coastal seas may be largely determined by P supply from vertical mixing.
A time lag (3–13 days) was always observed between the phytoplankton blooms and the passing of dust storms [40,41,42,43], which may be determined by the time acquired for accumulation of biomass associated with the zooplankton prey, change of community structure, and adaptation to the new conditions in natural seawater [71,72,73]. The time lag may be also caused by the rate of nutrients supplement in seawater. In this study, a three-day lagged response of Chl a to atmospheric N deposition was a bit longer than Chl a required to peak in our bioassay experiments after nutrient additions. This may be partly caused by the asynchronous inputs of N and P from the atmosphere to this N-replete coastal sea, and phosphate was supplied by subsurface waters. Additionally, the difference in N/P ratio in the surface seawater from nearshore to offshore implied that the effect of atmospheric deposition on primary productivity could be more prompt in N-depleted offshore compared to the coastal region.

3.4. Change of Phytoplankton Community

Algal species belonging to three phyla Pyrrophyta (dinoflagellates), Bacillariophyta (diatoms), and Chromophyta were recorded using microscope during the bioassay experiments. It was found that the initial seawater sampled in 2012 and 2014 contained 49 and 86 algal species with total cell densities 4201 and 4515 cell L−1, respectively (detailed in Figure S8). Dinoflagellates were dominant species in the initial seawater for both 2012 (56.8%) and 2014 (81.4%) experiments, which probably corresponded to the high N/P ratio (~50) and P-limiting condition (Si/P > 22 and N/P > 22) of the seawater [11]. It was suggested that with natural algal assemblage, dinoflagellates had higher affinity to P and were more adaptable to high N/P ratio than diatoms (few exceptions may be related to their life cycle properties) [12,74]. The initial SiO32− concentrations in both experiments (2.77 and 6.94 μmol L−1) were not the limiting factor (above threshold concentration of ~2 μmol L−1) for the diatoms.
A significant augment of diatom biomass was observed in T2 and T3 treatments with additions of only P and N + P, and the proportions of Thalassiosira sp. increased from 3.65% to 33.7% in T2 and to 60% in T3 after 48 h incubation (day 2), respectively (Figure 7). By contrast, the cell density of Thalassiosira sp. kept at a low level in T1 (control), accounting for a maximal 18.2% (day 2) of the total cells. This suggested that P supply, or together with N at the NH4+/NO3 ratio (1/9) could substantially enhance the growth of this diatom species, as was observed in the 2012 bioassay experiment.
Diatoms also became dominant in treatments T6 and T7, and they increased enormously in T7 with the addition of extra 10 μmol L−1 Si. Nitzschia closterium instead of Thalassiosira sp. was the most abundant species (on day 3) in the 2014 bioassay experiment. Correspondingly, the cell density of diatoms was extremely low in T5 (control) accounting for 11.8% (on day 4) of the total cells, even though the initial Si concentration in seawater was 6.94 μmol L−1, suggesting the growth of diatoms might be prohibited by P. Si is an essential component in diatom cell wall and its importance to diatoms growth has been approved by many studies [10,75,76]. Diatoms may take a great advantage when nutrients (N, P, and Si) are abundant, and diatom blooms usually precede the blooms of other phytoplankton groups when nutrients are sufficient [77]. Results suggested that N + P together with high level of Si could facilitate the dominance of diatoms.
With relatively low silicate, the dominant phytoplankton group may be readily affected by other factors such as NH4+/NO3 ratio. It was noted that T3 and T4 were dominated by diatoms (64.5% on day 2) and dinoflagellates (85.0% on day 2) with the input of 1/9 and 6/4 NH4+/NO3 ratios, respectively, despite the same amounts of total N and P were added. This suggested that the high NH4+ to NO3 ratio (6/4) added with adequate P might favor the growth of dinoflagellates. Lomas and Glibert (2000) [13] pointed out that some diatoms (e.g., Thalassiosira weissflogii and Skeletonema costatum) had greater NO3 uptake and reduction rates than dinoflagellates. Ammonium and urea could be assimilated in the light as well as in the dark, while NO3 uptake was known to be light dependent [78,79]. Dark N uptake ability of some dinoflagellates (e.g., Alexandrium tamarense, Prorocentrum minimum and Gyrodinium aureolum) was shown as their competitive advantage over other species such as diatoms [80,81].
The total algal cell number did not show notable increase and the dinoflagellates remained dominant in two aerosol treatments (A1 and A2), probably due to preserved P shortage in these treatments. At day 4, the number of two diatom species (Nitzschia closterium and Nitzschia longissima) in A1 (with lower NH4+/NO3 ratio) were notably higher (286 cell L−1) than those in the control (T5), while three dinoflagellates taxa (Prorocentrum, Karenia and Amphidinium carterae) showed a notable increase in A2 (with higher NH4+/NO3 ratio) compared to the control (T5) with the most abundant taxa of Prorocentrum (511 cell L−1). This indicated the higher NH4+/NO3 ratio and higher AN in A2 may favor the growth of dinoflagellates. Special attention should be paid to the effect of atmospheric deposition on phytoplankton community because many dinoflagellate taxa, including Prorocentrum, Karenia and Amphidinium carterae, are major harmful algal bloom (HAB) species and produce diarrhetic shellfish poisoning (DSP) toxin, neurotoxic shellfish poisoning (NSP) toxin, and hemolysins. These toxins may cause fish mortalities and impose threats to aquaculture quality assurance [82,83,84].
Previous nutrient enrichment experiments also revealed that a low Si/N ratio (Si/N < 1) and high N/P (>50) possibly accelerated the outbreak of Prorocentrum donghaiense (dinoflagellate) and a decreased Si/N ratio could speed up Skeletonema costatum (diatom) decay [85]. Guo et al. argued that the average silicate concentration in the present ECS was higher than the threshold (~2 μmol L−1) that enabled the dominance of diatoms [8], and therefore the N/P ratio probably outweighed the Si/N ratio in regulating the dominant phytoplankton groups and in contributing to the formation of dinoflagellate blooms in spring [86]. With the increasing anthropogenic emission of reactive N and subsequently enhanced N deposition to the coastal seas, both P and Si could become insufficient relative to N and thereby affect the dominant groups of phytoplankton (especially inhibit the growth of diatoms). Meanwhile, the higher NH4+/NO3 ratio in atmospheric deposition (compared to riverine input) together with little P may also favor the growth of dinoflagellates under lower silicate concentration. Hence, the shift from diatoms dominance to dinoflagellates may be closely related to atmospheric nutrients deposition in coastal waters.
The change of phytoplankton community structure may affect carbon export to deep water, nutrient and element cycles and air-sea exchange of substances which are not taxonomically balanced. For instance, Prymnesiophytes and some dinoflagellates contribute more than diatoms in global DMSP production [87], which is subsequently released as DMS to the atmosphere participating atmospheric chemistry and generating radiative effect [88]. The algal species recorded in this study such as Amphidinium carterae, certain Prorocentrum sp. are DMSP high-yielding species [89], and their abundance varied greatly among treatments at day 4 and became dominant in two aerosol treatments.

4. Conclusions

Nutrient structure is one of the most important factors controlling marine primary productivity. Elevated N/P ratio in the Eastern China Sea has been reported in the past decades [31,33,34,90], and the soluble phosphate concentration in most parts of the YS and the ECS in spring and summer are below the proposed P limitation level of 0.2 μmol L−1 [34,55]. Our bioassay experiments showed that Chl a in the coastal ECS could be largely enhanced by simultaneous input of N and P with the maximum increase of 0.68–0.78 μg Chl a per μmol Nadd. Atmospheric deposition contains a mass of WSIN and extremely high N/P ratio, and thereby the promotion of atmospheric N on the primary production in coastal waters may not be instant. Results showed that atmospheric dry fluxes of NH4+ and NO3 were found to be effective predictors for the springtime primary productivity in the studied area (R3) with an approximate 3-day time lag, and the strong linear correlation (R = 0.81) was observed between AN fluxes and Chl a concentrations (on day 3). The delayed response of Chl a could be partly explained by the asynchronous supply of N and P, and the latter was probably supplied by the subsurface water. The instant effect of atmospheric deposition in the ECS may be determined by other aerosol components, such as soluble Fe and Cu, with a diel response [39,65]. The impact of atmospheric N deposition on the productivity may be prompt in the regions where P is abundant relative to N, as the case of open oceans (the open ECS and the North Pacific subtropical gyre).
Dinoflagellates were found to be dominant in the initial seawater in both bioassay experiments, and nutrients input with abundant P and Si profoundly enhanced the cell densities and the dominance of diatom species Thalassiosira sp. and Nitzschia closterium. Under a low Si condition, the high ratio of NH4+/NO3 promoted the dominance of dinoflagellates relative to diatoms. Atmospheric deposition may exacerbate the excess N relative to P. Although NH4+ may be significant due to shallow depth and eutrophication in the coastal ECS, NH4+ in the surface water of open oceans is normally deficient. Therefore, atmospheric deposition of NH4+ is likely to affect phytoplankton composition in the stratified and open oceans. With an extremely high N/P ratio and the lack of bioavailable Si, atmospheric deposition of nutrients might contribute to the shift of dominant phytoplankton groups from diatoms to dinoflagellates, which could change the carbon export to deep water and marine biogenic emissions (e.g., dimethyl sulfide) and have a profound impact on biogeochemical processes.

Supplementary Materials

The following are available online at https://www.mdpi.com/2073-4433/12/2/210/s1, Figure S1: The concentrations of soluble aerosol components added in the two aerosol treatments in 2014 mesocosm experiment, Figure S2: (a) The average MODIS-Aqua chlorophyll a (Chl a) concentration during the spring months (March, April, and May) of 2011–2015 (monthly data, http://giovanni.gsfc.nasa.gov/giovanni) in the studied areas including the East China Sea. (b) Monthly averaged primary production in R0 and R3. Shaded part indicated 95% confidence levels of 5-year data calculation, Figure S3: (a) Change of Chl a concentrations after adding only nitrogen species into the natural seawater used in 2012 experiment. (b) Change of Chl a concentrations in aerosol and aerosol + P treatments in 2018 incubation experiment, Figure S4: Automatic linear modeling (ALM) results showing the most important predictors of Chl a concentration in R3 during a 5-day prediction period, Figure S5: Automatic linear modeling (ALM) results showing the most important predictors of Chl a concentration in R3 during a five-day prediction period, Figure S6: Springtime distribution of DIN (or total organic nitrogen, abbreviated as TON) and SP concentrations in the NWP from nearshore to offshore, Figure S7: Correlations of Chl a with SST, PAR and atmospheric dry deposition fluxes of other components other than nitrogen species in R3 at day 0 and day 3, Figure S8: Change of cell numbers of individual algal species during the mesocosm experiments. No. 1–50 belong to Pyrrophyta (dinoflagellates), no. 51–101 belong to Bacillariophyta (diatoms), and no. 102–107 belong to Chromophyta. The number of algal species was averaged from triplicate samples, and the percentage of certain species was calculated using the number of each species divided by the total algal cell number in the sample, Table S1: Collecting and sampling times and parameters of seawater used for the mesocosm experiments in 2012 and 2014, Table S2: Deposition fluxes (µmol m−2 day−1) of major aerosol components in the aerosol samples in the spring months from year 2011 to 2015, Table S3: Correlations between Chl a concentration and dry fluxes of major atmospheric components considering time lags from 0 to 5 days in the larger sea area of R0.

Author Contributions

Conceptualization: Q.M. and Y.C.; methodology: Q.M. and Y.C.; software: Q.M.; validation: Y.C., F.W. and H.L.; formal analysis: Q.M., F.W. and H.L.; investigation: Q.M., Y.C., F.W. and H.L.; resources: Y.C.; data curation: Q.M.; writing—original draft preparation: Q.M.; writing—review and editing: Y.C.; visualization: Q.M. and Y.C.; supervision: Y.C.; project administration: Y.C.; funding acquisition: Y.C. All authors have read and agreed to the published version of the manuscript.

Funding

This work is jointly supported by the National Key Research and Development Program of China (2016YFA0601304) and National Natural Science Foundation of China (41775145).

Acknowledgments

The authors gratefully acknowledge the NOAA Air Resources Laboratory (ARL) for open access to the HYSPLIT model. We also thank the Ocean Biology Processing Group of NASA GSFC (http://oceancolor.gsfc.nasa.gov) for provision of oceanic data. We are especially grateful to Huaniao lighthouse maintained by Shanghai Maritime Safety Administration for providing the long-term sampling site. We sincerely thank Yueping Chen for sampling assistance at Huaniao Island, and we also appreciate the efforts from other group members in the incubation experiments and analyses of aerosol samples.

Conflicts of Interest

The authors declare no conflict of interest. The funders had no role in the design of the study; in the collection, analyses, or interpretation of data; in the writing of the manuscript, or in the decision to publish the results.

References

  1. Heisler, J.; Glibert, P.M.; Burkholder, J.M.; Anderson, D.M.; Cochlan, W.; Dennison, W.C.; Dortch, Q.; Gobler, C.J.; Heil, C.A.; Humphries, E.; et al. Eutrophication and harmful algal blooms: A scientific consensus. Harmful Algae 2008, 8, 3–13. [Google Scholar] [CrossRef] [Green Version]
  2. Paerl, H.W. Nuisance phytoplankton blooms in coastal, estuarine, and inland waters. Limnol. Oceanogr. 1988, 33, 823–843. [Google Scholar] [CrossRef]
  3. Gong, G.C.; Wen, Y.H.; Wang, B.W.; Liu, G.J. Seasonal variation of chlorophyll a concentration, primary production and environmental conditions in the subtropical East China Sea. Deep Sea Res. Part II Top. Stud. Oceanogr. 2003, 50, 1219–1236. [Google Scholar] [CrossRef]
  4. Chen, C.-T.A.; Andreev, A.; Kim, K.-R.; Yamamoto, M. Roles of Continental Shelves and Marginal Seas in the Biogeochemical Cycles of the North Pacific Ocean. J. Oceanogr. 2004, 60, 17–44. [Google Scholar] [CrossRef]
  5. Tang, D.; Di, B.; Wei, G.; Ni, I.H.; Oh, I.S.; Wang, S. Spatial, seasonal and species variations of harmful algal blooms in the South Yellow Sea and East China Sea. Hydrobiologia 2006, 568, 245–253. [Google Scholar] [CrossRef]
  6. Yang, S.; Han, X.; Zhang, C.; Sun, B.; Wang, X.; Shi, X. Seasonal changes in phytoplankton biomass and dominant species in the Changjiang River Estuary and adjacent seas: General trends based on field survey data 1959–2009. J. Ocean Univ. China 2014, 13, 926–934. [Google Scholar] [CrossRef]
  7. Li, M.; Xu, K.; Watanabe, M.; Chen, Z. Long-term variations in dissolved silicate, nitrogen, and phosphorus flux from the Yangtze River into the East China Sea and impacts on estuarine ecosystem. Estuar. Coast. Shelf Sci. 2007, 71, 3–12. [Google Scholar] [CrossRef]
  8. Guo, S.; Feng, Y.; Wang, L.; Dai, M.; Liu, Z.; Bai, Y.; Sun, J. Seasonal variation in the phytoplankton community of a continental-shelf sea: The East China Sea. Mar. Ecol. Prog. Ser. 2014, 516, 103–126. [Google Scholar] [CrossRef] [Green Version]
  9. Xu, Z.; Chen, Y.; Meng, X.; Wang, F.; Zheng, Z. Phytoplankton community diversity is influenced by environmental factors in the coastal East China Sea. Eur. J. Phycol. 2016, 51, 107–118. [Google Scholar] [CrossRef]
  10. Yool, A.; Tyrrell, T. Role of diatoms in regulating the ocean’s silicon cycle. Glob. Biogeochem. Cycles 2003, 17, 1103. [Google Scholar] [CrossRef]
  11. Justić, D.; Rabalais, N.N.; Turner, R.E. Stoichiometric nutrient balance and origin of coastal eutrophication. Mar. Pollut. Bull. 1995, 30, 41–46. [Google Scholar] [CrossRef]
  12. Egge, J.K. Are diatoms poor competitors at low phosphate concentrations? J. Mar. Syst. 1998, 16, 191–198. [Google Scholar] [CrossRef]
  13. Lomas, M.W.; Glibert, P.M. Comparisons of nitrate uptake, storage, and reduction in marine diatoms and flagellates. J. Phycol. 2000, 36, 903–913. [Google Scholar] [CrossRef]
  14. Glibert, P.M.; Magnien, R.; Lomas, M.W.; Alexander, J.; Tan, C.; Haramoto, E.; Trice, M.; Kana, T.M. Harmful algal blooms in the Chesapeake and Coastal Bays of Maryland, USA: Comparison of 1997, 1998, and 1999 events. Estuaries 2001, 24, 875–883. [Google Scholar] [CrossRef]
  15. Chen, C.T.A.; Ruo, R.; Paid, S.C.; Liu, C.T.; Wong, G.T.F. Exchange of water masses between the East China Sea and the Kuroshio off northeastern Taiwan. Cont. Shelf Res. 1995, 15, 19–39. [Google Scholar] [CrossRef]
  16. Zhang, J. Nutrient elements in large Chinese estuaries. Cont. Shelf Res. 1996, 16, 1023–1045. [Google Scholar] [CrossRef]
  17. Chen, Y.; Mills, S.; Street, J.; Golan, D.; Post, A.; Jacobson, M.; Paytan, A. Estimates of atmospheric dry deposition and associated input of nutrients to Gulf of Aqaba seawater. J. Geophys. Res. Atmos. 2007, 112. [Google Scholar] [CrossRef]
  18. Duce, R.A.; LaRoche, J.; Altieri, K.; Arrigo, K.R.; Baker, A.R.; Capone, D.G.; Cornell, S.; Dentener, F.; Galloway, J.; Ganeshram, R.S.; et al. Impacts of Atmospheric Anthropogenic Nitrogen on the Open Ocean. Science 2008, 320, 893–897. [Google Scholar] [CrossRef] [Green Version]
  19. Mackey, K.R.M.; van Dijken, G.L.; Mazloom, S.; Erhardt, A.M.; Ryan, J.; Arrigo, K.R.; Paytan, A. Influence of atmospheric nutrients on primary productivity in a coastal upwelling region. Glob. Biogeochem. Cycles 2010, 24. [Google Scholar] [CrossRef] [Green Version]
  20. Duce, R.A. The Impact of Atmospheric Nitrogen, Phosphorus, and Iron Species on Marine Biological Productivity. In The Role of Air-Sea Exchange in Geochemical Cycling; Buat-Ménard, P., Ed.; Springer: Dordrecht, The Netherlands, 1986; pp. 497–529. [Google Scholar] [CrossRef]
  21. Paerl, H.W. Coastal eutrophication and harmful algal blooms: Importance of atmospheric deposition and groundwater as “new” nitrogen and other nutrient sources. Limnol. Oceanogr. 1997, 42, 1154–1165. [Google Scholar] [CrossRef] [Green Version]
  22. Paerl, H.W.; Whitall, D.R. Anthropogenically-derived atmospheric nitrogen deposition, marine eutrophication and harmful algal bloom expansion: Is there a link? Ambio 1999, 28, 307–311. [Google Scholar]
  23. Nakamura, T.; Matsumoto, K.; Uematsu, M. Chemical characteristics of aerosols transported from Asia to the East China Sea: An evaluation of anthropogenic combined nitrogen deposition in autumn. Atmos. Environ. 2005, 39, 1749–1758. [Google Scholar] [CrossRef]
  24. Zhang, Y.; Yu, Q.; Ma, W.; Chen, L. Atmospheric deposition of inorganic nitrogen to the eastern China seas and its implications to marine biogeochemistry. J. Geophys. Res. Atmos. 2010, 115. [Google Scholar] [CrossRef]
  25. Fu, J.; Wang, B.; Chen, Y.; Ma, Q. The influence of continental air masses on the aerosols and nutrients deposition over the western North Pacific. Atmos. Environ. 2018, 172, 1–11. [Google Scholar] [CrossRef]
  26. Zhu, L.; Chen, Y.; Guo, L.; Wang, F. Estimate of dry deposition fluxes of nutrients over the East China Sea: The implication of aerosol ammonium to non-sea-salt sulfate ratio to nutrient deposition of coastal oceans. Atmos. Environ. 2013, 69, 131–138. [Google Scholar] [CrossRef]
  27. Yadav, K.; Sarma, V.V.S.S.; Rao, D.B.; Kumar, M.D. Influence of atmospheric dry deposition of inorganic nutrients on phytoplankton biomass in the coastal Bay of Bengal. Mar. Chem. 2016, 187, 25–34. [Google Scholar] [CrossRef]
  28. Wan, X.; Wu, Z.; Chang, Z.; Zhang, X. Reanalysis of atmospheric flux of nutrients to the South Yellow Sea and the East China Sea. J. Mar. Environ. Sci. 2002, 21, 14–18. [Google Scholar]
  29. Duce, R.A.; Tindale, N.W. Atmospheric transport of iron and its deposition in the ocean. Limnol. Oceanogr. 1991, 36, 1715–1726. [Google Scholar] [CrossRef]
  30. Guo, C.; Yu, J.; Ho, T.Y.; Wang, L.; Song, S.; Kong, L.; Liu, H. Dynamics of phytoplankton community structure in the South China Sea in response to the East Asian aerosol input. Biogeosciences 2012, 9, 1519–1536. [Google Scholar] [CrossRef] [Green Version]
  31. Kim, T.-W.; Lee, K.; Najjar, R.G.; Jeong, H.-D.; Jeong, H.J. Increasing N Abundance in the Northwestern Pacific Ocean Due to Atmospheric Nitrogen Deposition. Science 2011, 334, 505–509. [Google Scholar] [CrossRef] [Green Version]
  32. Kim, I.-N.; Lee, K.; Gruber, N.; Karl, D.M.; Bullister, J.L.; Yang, S.; Kim, T.-W. Increasing anthropogenic nitrogen in the North Pacific Ocean. Science 2014, 346, 1102–1106. [Google Scholar] [CrossRef] [PubMed]
  33. Wong, G.T.F.; Gong, G.C.; Liu, K.K.; Pai, S.C. ‘Excess Nitrate’ in the East China Sea. Estuar. Coast. Shelf Sci. 1998, 46, 411–418. [Google Scholar] [CrossRef] [Green Version]
  34. Wang, B.-d.; Wang, X.-l.; Zhan, R. Nutrient conditions in the Yellow Sea and the East China Sea. Estuar. Coast. Shelf Sci. 2003, 58, 127–136. [Google Scholar] [CrossRef]
  35. Mackey, K.R.M.; Kavanaugh, M.T.; Wang, F.; Chen, Y.; Liu, F.; Glover, D.M.; Chien, C.-T.; Paytan, A. Atmospheric and Fluvial Nutrients Fuel Algal Blooms in the East China Sea. Front. Mar. Sci. 2017, 4. [Google Scholar] [CrossRef] [Green Version]
  36. Chien, C.-T.; Mackey, K.R.M.; Dutkiewicz, S.; Mahowald, N.M.; Prospero, J.M.; Paytan, A. Effects of African dust deposition on phytoplankton in the western tropical Atlantic Ocean off Barbados. Glob. Biogeochem. Cycles 2016, 30, 716–734. [Google Scholar] [CrossRef] [Green Version]
  37. Paerl, H.W.; Fogel, M.L. Isotopic characterization of atmospheric nitrogen inputs as sources of enhanced primary production in coastal Atlantic Ocean waters. Mar. Biol. 1994, 119, 635–645. [Google Scholar] [CrossRef]
  38. Paytan, A.; Mackey, K.R.M.; Chen, Y.; Lima, I.D.; Doney, S.C.; Mahowald, N.; Labiosa, R.; Postf, A.F. Toxicity of atmospheric aerosols on marine phytoplankton. Proc. Natl. Acad. Sci. USA 2009, 106, 4601–4605. [Google Scholar] [CrossRef] [Green Version]
  39. Meng, X.; Chen, Y.; Wang, B.; Ma, Q.; Wang, F. Responses of phytoplankton community to the input of different aerosols in the East China Sea. Geophys. Res. Lett. 2016, 43, 7081–7088. [Google Scholar] [CrossRef]
  40. Bishop, J.K.; Davis, R.E.; Sherman, J.T. Robotic observations of dust storm enhancement of carbon biomass in the North Pacific. Science 2002, 298, 817–821. [Google Scholar] [CrossRef] [PubMed] [Green Version]
  41. Shi, J.; Gao, H.; Zhang, J.; Tan, S.; Ren, J.; Liu, C.; Liu, Y.; Yao, X. Examination of causative link between a springbloom and dry/wet deposition of Asian dust in the Yellow Sea, China. J. Geophys. Res. 2012, 117, D17304. [Google Scholar] [CrossRef] [Green Version]
  42. Banerjee, P.; Prasanna Kumar, S. Dust-induced episodic phytoplankton blooms in the Arabian Sea during winter monsoon. J. Geophys. Res. Oceans 2014, 119, 7123–7138. [Google Scholar] [CrossRef]
  43. Tan, S.-C.; Wang, H. The transport and deposition of dust and its impact on phytoplankton growth in the Yellow Sea. Atmos. Environ. 2014, 99, 491–499. [Google Scholar] [CrossRef]
  44. Wang, F.; Chen, Y.; Meng, X.; Fu, J.; Wang, B. The contribution of anthropogenic sources to the aerosols over East China Sea. Atmos. Environ. 2016, 127, 22–33. [Google Scholar] [CrossRef]
  45. Guo, L.; Chen, Y.; Wang, F.; Meng, X.; Xu, Z.; Zhuang, G. Effects of Asian dust on the atmospheric input of trace elements to the East China Sea. Mar. Chem. 2014, 163, 19–27. [Google Scholar] [CrossRef]
  46. Park, S.; Chu, P.C. Synoptic distributions of thermal surface mixed layer and thermocline in the southern yellow and East China Seas. J. Oceanogr. 2007, 63, 1021–1028. [Google Scholar] [CrossRef]
  47. Behrenfeld, M.J.; Falkowski, P.G. Photosynthetic rates derived from satellite-based chlorophyll concentration. Limnol. Oceanogr. 1997, 42, 1–20. [Google Scholar] [CrossRef]
  48. Behrenfeld, M.J.; O’Malley, R.T.; Boss, E.S.; Westberry, T.K.; Graff, J.R.; Halsey, K.H.; Milligan, A.J.; Siegel, D.A.; Brown, M.B. Revaluating ocean warming impacts on global phytoplankton. Nat. Clim. Chang. 2016, 6, 323–330. [Google Scholar] [CrossRef]
  49. Yang, T.; Chen, Y.; Zhou, S.; Li, H.; Wang, F. Solubilities and deposition fluxes of atmospheric Fe and Cu over the Northwest Pacific and its marginal seas. Atmos. Environ. 2020, 239, 117763. [Google Scholar] [CrossRef]
  50. Stein, A.F.; Draxler, R.R.; Rolph, G.D.; Stunder, B.J.B.; Cohen, M.D.; Ngan, F. NOAA’s HYSPLIT Atmospheric Transport and Dispersion Modeling System. Bull. Am. Meteorol. Soc. 2016, 96, 2059–2077. [Google Scholar] [CrossRef]
  51. Wang, Y.Q.; Zhang, X.Y.; Draxler, R.R. TrajStat: GIS-based software that uses various trajectory statistical analysis methods to identify potential sources from long-term air pollution measurement data. Environ. Model. Softw. 2009, 24, 938–939. [Google Scholar] [CrossRef]
  52. Ashbaugh, L.L.; Malm, W.C.; Sadeh, W.Z. A Residence Time Probability Analysis of Sulfur Concentrations at Grand Canyon National Park. Atmos. Environ. (1967) 1985, 19, 1263–1270. [Google Scholar] [CrossRef]
  53. Lee Chen, Y.-L.; Chen, H.-Y. Nitrate-based new production and its relationship to primary production and chemical hydrography in spring and fall in the East China Sea. Deep Sea Res. Part II Top. Stud. Oceanogr. 2003, 50, 1249–1264. [Google Scholar] [CrossRef]
  54. Gong, G.-C.; Chang, J.; Chiang, K.-P.; Hsiung, T.-M.; Hung, C.-C.; Duan, S.-W.; Codispoti, L.A. Reduction of primary production and changing of nutrient ratio in the East China Sea: Effect of the Three Gorges Dam? Geophys. Res. Lett. 2006, 33. [Google Scholar] [CrossRef] [Green Version]
  55. Fisher, T.; Peele, E.; Ammerman, J.H., Jr. Nutrient Limitation of Phytoplankton in Chesapeake Bay. Mar. Ecol. Prog. Ser. 1992, 82, 51–63. [Google Scholar] [CrossRef]
  56. Justić, D.; Rabalais, N.N.; Turner, R.E.; Dortch, Q. Changes in nutrient structure of river-dominated coastal waters: Stoichiometric nutrient balance and its consequences. Estuar. Coast. Shelf Sci. 1995, 40, 339–356. [Google Scholar] [CrossRef]
  57. Zhou, W.; Huo, W.; Yuan, X.; Yin, K. Distribution features of chlorophyll a and primary productivity in high frequency area of red tide in East China Sea during spring. Ying Yong Sheng Tai Xue Bao (J. Appl. Ecol.) 2003, 14, 1055–1059. [Google Scholar]
  58. Li, H.; Chen, Y.; Zhou, S.; Wang, F.; Yang, T.; Zhu, Y.; Ma, Q. Change of dominant phytoplankton groups in the eutrophic coastal sea due to atmospheric deposition. Sci. Total Environ. 2021, 753, 141961. [Google Scholar] [CrossRef] [PubMed]
  59. Hildebrand, M. Cloning and functional characterization of ammonium transporters from the marine diatom Cylindrotheca fusiformis (Bacillariophceae). J. Phycol. 2005, 41, 105–113. [Google Scholar] [CrossRef]
  60. Sunda, W. Feedback Interactions between Trace Metal Nutrients and Phytoplankton in the Ocean. Front. Microbiol. 2012, 3. [Google Scholar] [CrossRef] [PubMed] [Green Version]
  61. Gowen, R.J.; Tett, P.; Jones, K.J. Predicting marine eutrophication: The yield of chlorophyll from nitrogen in Scottish coastal waters. Mar. Ecol. Prog. Ser. 1992, 85, 153–161. [Google Scholar] [CrossRef]
  62. Karl, D.M. Microbially Mediated Transformations of Phosphorus in the Sea: New Views of an Old Cycle. Annu. Rev. Mar. Sci. 2014, 6, 279–337. [Google Scholar] [CrossRef]
  63. Zhang, C.; Gao, H.; Yao, X.; Shi, Z.; Shi, J.; Yu, Y.; Meng, L.; Guo, X. Phytoplankton growth response to Asian dust addition in the northwest Pacific Ocean versus the Yellow Sea. Biogeosciences 2018, 15, 749–765. [Google Scholar] [CrossRef] [Green Version]
  64. Mu, Y.; Chu, Q.; Zhang, C.; He, J.; Gao, H. Impact of Dust and Haze Addition on Phytoplankton Biomass and Community Structure in the South China Sea. China Environ. Sci. 2018, 38, 3512–3523. [Google Scholar]
  65. Wang, F.J.; Chen, Y.; Guo, Z.G.; Gao, H.W.; Mackey, K.R.; Yao, X.H.; Zhuang, G.S.; Paytan, A. Combined effects of iron and copper from atmospheric dry deposition on ocean productivity. Geophys. Res. Lett. 2017, 44, 2546–2555. [Google Scholar] [CrossRef]
  66. Jickells, T.D.; An, Z.S.; Andersen, K.K.; Baker, A.R.; Bergametti, G.; Brooks, N.; Cao, J.J.; Boyd, P.W.; Duce, R.A.; Hunter, K.A.; et al. Global Iron Connections Between Desert Dust, Ocean Biogeochemistry, and Climate. Science 2005, 308, 67–71. [Google Scholar] [CrossRef] [Green Version]
  67. Altieri, K.E.; Hastings, M.G.; Peters, A.J.; Oleynik, S.; Sigman, D.M. Isotopic evidence for a marine ammonium source in rainwater at Bermuda. Glob. Biogeochem. Cycles 2014, 28, 1066–1080. [Google Scholar] [CrossRef]
  68. Moore, C.M.; Mills, M.M.; Arrigo, K.R.; Berman-Frank, I.; Bopp, L.; Boyd, P.W.; Galbraith, E.D.; Geider, R.J.; Guieu, C.; Jaccard, S.L.; et al. Processes and patterns of oceanic nutrient limitation. Nature 2013, 701–710. [Google Scholar] [CrossRef] [Green Version]
  69. Capone, D.G.; Knapp, A.N. A marine nitrogen cycle fix? Nature 2007, 445, 159–160. [Google Scholar] [CrossRef]
  70. Wang, J.; Kan, J.; Qian, G.; Chen, J.; Xia, Z.; Zhang, X.; Liu, H.; Sun, J. Denitrification and anammox: Understanding nitrogen loss from Yangtze Estuary to the east China sea (ECS). Environ. Pollut. 2019, 252, 1659–1670. [Google Scholar] [CrossRef]
  71. Agawin, N.S.; Duarte, C.; Agustí, S. Response of Mediterranean Synechococcus growth and loss rates to experimental nutrient inputs. Mar. Ecol. Prog. Ser. 2000, 206, 97–106. [Google Scholar] [CrossRef]
  72. Lippemeier, S.; Frampton, D.M.F.; Blackburn, S.I.; Geier, S.C.; Negri, A.P. Influence of phosphorus limitation on toxicity and photosynthesis of Alexandrium minutum (Dinophyceae) monitored by in-line detection of variable chlorophyll fluorescence. J. Phycol. 2003, 39, 320–331. [Google Scholar] [CrossRef]
  73. Mulderij, G.; Van Donk, E.; Roelofs, J.G.M. Differential sensitivity of green algae to allelopathic substances from Chara. Hydrobiologia 2003, 491, 261–271. [Google Scholar] [CrossRef]
  74. Riegman, R.; De Boer, M.; de Senerpont Domis, L. Growth of harmful marine algae in multispecies cultures. J. Plankton Res. 1996, 18, 1851–1866. [Google Scholar] [CrossRef]
  75. Dugdale, R.C.; Wilkerson, F.P. Silicate regulation of new production in the equatorial Pacific upwelling. Nature 1998, 391, 270–273. [Google Scholar] [CrossRef]
  76. Martin-Jezequel, V.; Hildebrand, M.; Brzezinski, M.A. Silicon metabolism in diatoms: Implications for growth. J. Phycol. 2000, 36, 821–840. [Google Scholar] [CrossRef]
  77. Egge, J.K.; Aksnes, D. Silicate as Regulating Nutrient in Phytoplankton Competition. Mar. Ecol. Prog. Ser. 1992, 83, 281–289. [Google Scholar] [CrossRef]
  78. Cochlan, W.; Price, N.; Harrison, P. Effects of irradiance on nitrogen uptake by phytoplankton: Comparison of frontal and stratified communities. Mar. Ecol. Prog. Ser. 1991, 69, 103–116. [Google Scholar] [CrossRef]
  79. Kudela, R.; Cochlan, W. Nitrogen and carbon uptake kinetics and the influence of irradiance for a red tide bloom of Southern California. Aquat. Microb. Ecol. 2000, 21, 31–47. [Google Scholar] [CrossRef]
  80. Leong, S.C.Y.; Maekawa, M.; Taguchi, S. Carbon and nitrogen acquisition by the toxic dinoflagellate Alexandrium tamarense in response to different nitrogen sources and supply modes. Harmful Algae 2010, 9, 48–58. [Google Scholar] [CrossRef]
  81. Paasche, E.; Bryceson, I.; Tangen, K. Interspecific variation in dark nitrogen uptake by dinoflagellates. J. Phycol. 2004, 20, 394–401. [Google Scholar] [CrossRef]
  82. Marr, J.C.; Jackson, A.E.; McLachlan, J.L. Occurrence of Prorocentrum lima, a DSP toxin-producing species from the Atlantic coast of Canada. J. Appl. Phycol. 1992, 4, 17–24. [Google Scholar] [CrossRef]
  83. Brand, L.E.; Campbell, L.; Bresnan, E. Karenia: The biology and ecology of a toxic genus. Harmful Algae 2012, 14, 156–178. [Google Scholar] [CrossRef]
  84. Pagliara, P.; Caroppo, C. Toxicity assessment of Amphidinium carterae, Coolia cfr. monotis and Ostreopsis cfr. ovata (Dinophyta) isolated from the northern Ionian Sea (Mediterranean Sea). Toxicon 2012, 60, 1203–1214. [Google Scholar] [CrossRef] [PubMed]
  85. Zhou, Y.; Zhang, Y.; Li, F.; Tan, L.; Wang, J. Nutrients structure changes impact the competition and succession between diatom and dinoflagellate in the East China Sea. Sci. Total Environ. 2017, 574, 499–508. [Google Scholar] [CrossRef]
  86. Liang, Y.; Zhang, G.; Wan, A.; Zhao, Z.; Wang, S.; Liu, Q. Nutrient-limitation induced diatom-dinoflagellate shift of spring phytoplankton community in an offshore shellfish farming area. Mar. Pollut. Bull. 2019, 141, 1–8. [Google Scholar] [CrossRef] [PubMed]
  87. Liss, P.S.; Hatton, A.D.; Malin, G.; Nightingale, P.D.; Turner, S.M. Marine sulphur emissions. Philos. Trans. R. Soc. Lond. Ser. B 1997, 352, 159–169. [Google Scholar] [CrossRef]
  88. Charlson, R.J.; Lovelock, J.E.; Andreae, M.O.; Warren, S.G. Oceanic phytoplankton, atmospheric sulphur, cloud albedo and climate. Nature 1987, 326, 655–661. [Google Scholar] [CrossRef]
  89. Keller, M.D. Dimethyl Sulfide Production and Marine Phytoplankton: The Importance of Species Composition and Cell Size. Biol. Oceanogr. 1989, 6, 375–382. [Google Scholar] [CrossRef]
  90. Harrison, P.J.; Hu, M.H.; Yang, G.P.; Lu, X. Phosphate limitation in estuarine and coastal waters of China. J. Exp. Mar. Biol. Ecol. 1990, 140, 79–87. [Google Scholar] [CrossRef]
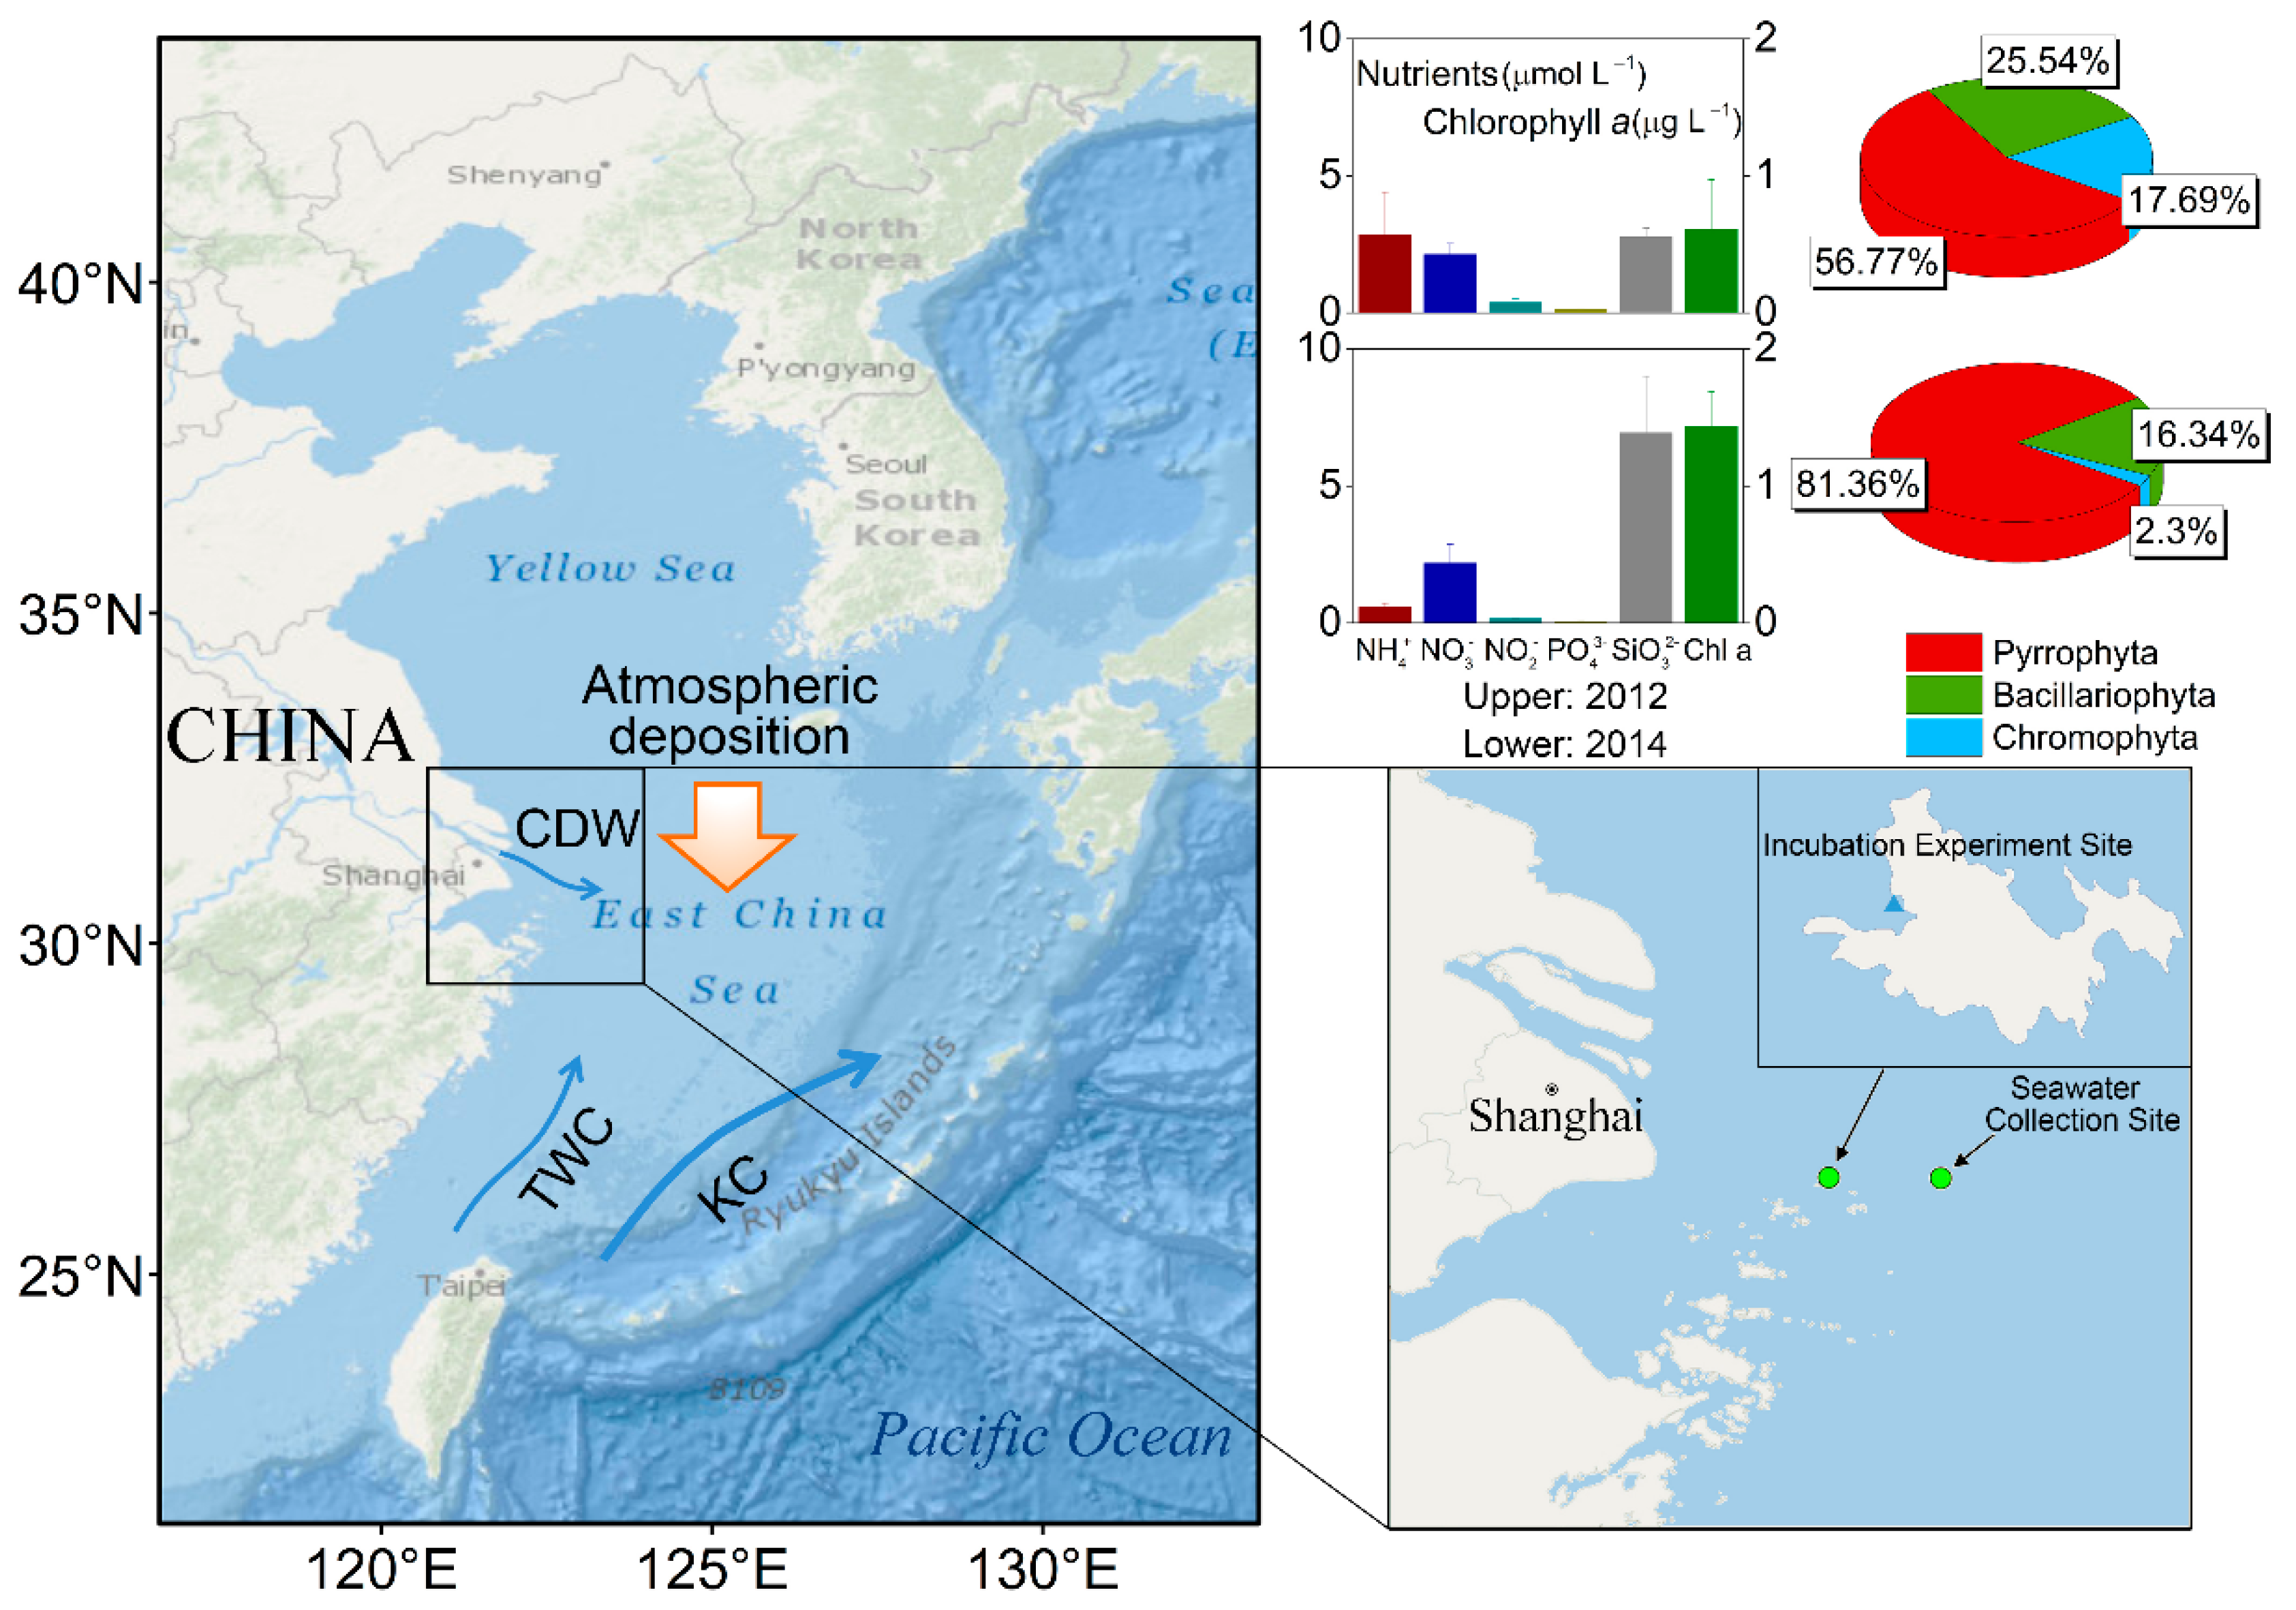
Figure 1. Sites for water collection and incubation experiments and the initial nutrients levels and phytoplankton community structure in natural seawater. The major species (quantitatively >5% of the total cell number) included Alexandrium tamarense (dinoflagellate), Dictyocha speculum (Chromophyta), Scrippsiella trochoidea (dinoflagellate), Pleurosigma pelagicum (diatom), and Gonyaulax verior (dinoflagellate) in the initial seawater for the 2012 experiment and Karenia mikimotoi (dinoflagellate), Gyrodinium instriatum (dinoflagellate), Prorocentrum donghaiense (dinoflagellate), Gyrodinium spirale (dinoflagellate), and Pheopolykrikos hartmannii (dinoflagellate) in the initial seawater for the 2014 experiment. The base map was obtained from Environmental Systems Research Institute (ESRI) online data.
Atmosphere 12 00210 g001
Figure 2. The oceanic region influenced by the air masses started from the aerosol sampling site in the spring months (March, April, and May) of 2011–2015. Kriging interpolation was applied to obtain a gradual change.
Atmosphere 12 00210 g002
Figure 3. Change of Chl a concentrations in 2012 (a) and 2014 (b) and (c) bioassay experiments including controls (T1 and T5) and treatments adding 0.6 μmol L−1 PO43− (T2), 0.6 μmol L−1 PO43− + 1 μmol L−1 NH4+ + 9 μmol L−1 NO3 (T3), 0.6 μmol L−1 PO43− + 6 μmol L−1 NH4+ + 4 μmol L−1 NO3 (T4), 0.6 μmol L−1 PO43− + 6 μmol L−1 NH4+ + 4 μmol L−1 NO3 (T6), 0.6 μmol L−1 PO43− + 6 μmol L−1 NH4+ + 4 μmol L−1 NO3 + 10 μmol L−1 SiO32− (T7), aerosol 1 (A1 sampled on 31 March 2012), and aerosol 2 (A2 sampled on 27 October 2012).
Atmosphere 12 00210 g003
Figure 4. Change of Chlorophyll a (ΔChl a) concentrations versus (a) DIN consumption (ΔDIN) and (b) phosphate consumption (ΔSP), calculated using the initial DIN or SP concentrations (including additions and seawater background) minus their concentrations at the sampling day.
Atmosphere 12 00210 g004
Figure 5. The average values of Chl a, PAR, and SST in R3 corresponding to aerosol dry deposition fluxes of NH4+ and NO3 during the studied period.
Atmosphere 12 00210 g005
Figure 6. Correlations between Chl a and atmospheric dry deposition fluxes of nitrogen species in R3 on day 0 and day 3. AN is calculated as the sum of NH4+ and NO3.
Atmosphere 12 00210 g006
Figure 7. Change of phytoplankton community structure during the 2012 and 2014 bioassay experiments. Algal species belonging to three major phyla of Bacillariophyta, Dinophyta, and Chromophyta were identified.
Atmosphere 12 00210 g007
Table 1. The concentrations of nutrients and amounts of aerosols added to different treatments of the bioassay experiments conducted in 2012 and 2014. Chemicals, (NH4)2SO4, NaNO3, NaH2PO4∙2H2O, and Na2SiO3∙9H2O and aerosols sampled at Huaniao Island were used for additions.
Experimental
Year
TreatmentNutrients Addition (μmol L−1)Aerosol Addition
(mg L−1)
NH4+NO3PO43−SiO32−
2012T10000-
T2000.60-
T31.09.00.60-
T46.04.00.60-
2014T50000-
T66.04.00.60-
T76.04.00.610-
A1 (31 March 2012)1.2 *2.1 *0.007 * (SP)-1.0
A2 (27 October 2012)3.5 *1.8 *0.003 * (SP)-1.0
* represents concentrations of nutrient species in aerosols added to each treatment (detailed in Figure S1).
Table 2. Comparison of nutrient consumption, Chl a, and their ratios for different treatments of the bioassay experiments in 2012 and 2014.
TreatmentsT2(P)T3(N + P)T4(N + P)T6(N + P)T7(N + P+Si)Aerosol 1Aerosol 2
DINadd (μmol L−1)0101010103.275.26
ΔDINmax (μmol L−1)2.4712.410.510.611.73.451.61
ΔDINmax/DINadd-1.241.051.061.171.060.31
SPadd (μmol L−1)0.60.60.60.60.60.020.01
ΔSPmax (μmol L−1)0.680.680.680.600.600.020.01
ΔSPmax/SPadd1.131.141.131.000.990.970.94
ΔChl amax (μg L−1)1.627.806.767.0511.31.521.01
ΔChl amaxDINadd (μg/μmol)0.160.780.680.711.130.470.19
ΔChl amax/ΔDINmax (μg/μmol)0.660.630.640.670.970.440.63
ΔChl amax/SPadd (μg/μmol)2.7013.011.311.718.980.994.3
ΔDINmax/ΔSPmax3.6518.115.617.719.7190159
Notes: ΔChl amax refers to the maximum Chl a increase relative to the initial concentrations, and ΔDINmax refers to the maximum DIN consumptions relative to the mean value of the initial DIN concentrations in the seawater and the added amount. All the values were the average of triplicates.
Publisher’s Note: MDPI stays neutral with regard to jurisdictional claims in published maps and institutional affiliations.