Abstract
A total of 68 PUF samples were collected seasonally from 17 sampling sites in Harbin, China from May 2016 to April 2017 for analyzing 15 congeners of gaseous polycyclic aromatic hydrocarbons (Σ15PAHs). An improved non-negative matrix (NMF) model and a positive matrix factorization (PMF) model were used to apportion the sources of PAHs. The carcinogenic risk due to exposure to PAHs was estimated by the toxicity equivalent of BaP (BaPeq). The results showed that the average concentration of Σ15PAHs was 68.3 ± 22.3 ng/m3, and the proportions of 3-ring, 4-ring, 5-ring, and 6-ring PAHs were 64.4%, 32.6%, 2.10%, and 0.89%, respectively. Among the six typical functional areas in Harbin, the Σ15PAHs concentrations were 98.1 ± 76.7 ng/m3, 91.2 ± 76.2 ng/m3, 71.4 ± 75.6 ng/m3, 67.9 ± 65.6 ng/m3, 42.6 ± 34.7 ng/m3, and 38.5 ± 38.0 ng/m3 in the wastewater treatment plant, industrial zone, business district, residential area, school, and suburb, respectively. During the sampling period, the highest concentration of Σ15PAHs was in winter. The improved NMF model and PMF model apportioned the PAHs into three sources including coal combustion, biomass burning, and vehicle exhaust. The contributions of coal combustion, biomass burning, and vehicle exhausts were 34.6 ± 3.22%, 48.6 ± 4.03%, and 16.8 ± 5.06%, respectively. Biomass burning was the largest contributor of Σ15PAHs concentrations in winter and coal combustion contributed significantly to the concentrations in summer. The average ΣBaPeq concentration was 0.54 ± 0.23 ng/m3 during the sampling period, high concentrations occurred in the cold season and low levels presented in the warm period. Vehicle exhaust was the largest contributor to the ΣBaPeq concentration of PAHs in Harbin.
1. Introduction
Polycyclic aromatic hydrocarbons (PAHs) have received considerable attention in recent decades because of their relatively high burden on the environment and strong toxic potency [1,2]. PAHs are a diverse class of aromatic compounds containing at least two benzene rings, which have carcinogenic, teratogenic, and mutagenic toxicity [1,3]. These compounds are mainly derived from the incomplete combustion of carbonaceous materials, associated with anthropogenic activities in particular [4,5]. The anthropogenic emission sources primarily include the combustion of fossil fuels and biomass for domestic and industrial purposes [5]. The key point in reducing PAH concentrations is to control their sources. Reliable source apportionment is vital for the development of effective political abatement strategies [6].
China has been estimated as one of the largest contributors of PAH emissions in the world [5] and is facing severe pollution of PAHs. The source apportionments of atmospheric PAHs in China were mainly concentrated in the Pearl River Delta, the Yangtze River Delta, and North China [7,8,9]. However, there is little such concern for cold metropolises in Northeast China. Harbin is an important industrial city in Northeast China, and is characterized by high population density, heavy traffic, and huge coal consumption [3]. In recent years, energy consumption has also been increasing steadily due to the rapid development of industrialization and urbanization of the city. Moreover, the city has longer heating periods and more energy consumption than most northern cities in China [10]. The additional energy consumption leads to heavier emissions of air pollution (including PAHs) and worse air quality [3,10].
Receptor models are widely used for source apportionment of environmental pollutants. The receptor models mainly include Principal Component Analysis (PCA), Chemical Mass Balance (CMB), Factor Analysis/Multiple Linear Regression (FA/MLR), Non-negative Constrained Factor Analysis (NCFA), Positive Matrix Factorization (PMF), and UNMIX [11,12]. Some models quantitatively apportion pollutants to their sources by decomposing a matrix of pollutants (such as PAHs) into two matrices [6,13]. Researchers prefer to use the PMF model because it does not require prepared source profiles to derive a source apportionment and the results do not have significantly negative source contributions [13]. These non-negative contributions have better interpretability. The algorithm used in the PMF model belongs to a subset of non-negative matrix factorization (NMF) [14]. Thus, the NMF model also has the advantages of the PMF model, as mentioned above [13].
Generally, 16 kinds of PAH congeners are considered as priority pollutants by the United States Environmental Protection Agency (US EPA) and the European Community [1]. They have different toxic potencies, and the total toxic potency was commonly used to assess the health risk related with PAHs [15]. The toxic potency of each PAH component was assessed based on the toxicity equivalent concentration of benzo[a]pyrene (BaP) [15,16]. In order to better understand the sources and toxic potency of PAHs in the atmosphere, this study conducted a sampling campaign to collect air samples by polyurethane foam (PUF) disks in 6 class functional areas of Harbin during May 2016 and April 2017. An improved NMF model and a PMF model were used together to apportion PAHs sources and the total toxicity equivalent concentration of BaP (BaPeq) was used to assess the toxic potency of PAHs. The major objectives of this study are as follows: (1) to examine the spatiotemporal patterns of PAHs concentration levels; (2) to apportion sources of PAHs; (3) to assess the human health risk of PAHs.
2. Methods and Materials
2.1. Sample Collection
The air samples were collected at 17 sampling sites of 6 types of areas in Harbin by PUF disks. The locations of the sampling sites were showed in Figure 1. The 6 types of areas include industrial zone, business district, residential area, school, sewage treatment plant, and suburb. There were no obvious pollution sources around each sampling site, and the installation height of the PUF sampler was more than 1.5 m. The structure and size of the PUF sampler used in this study were the same as those widely used for passive sampling of atmospheric persistent organic pollutants (POPs) [17]. The diameter, thickness, and density of the PUF disks were 14 cm, 1.35 cm, and 0.0213 g/cm3, respectively. Passive air samples were collected seasonally from May 2016 to April 2017 according to summer, autumn, winter, and spring, and a total of 68 PUF disk samples were collected.
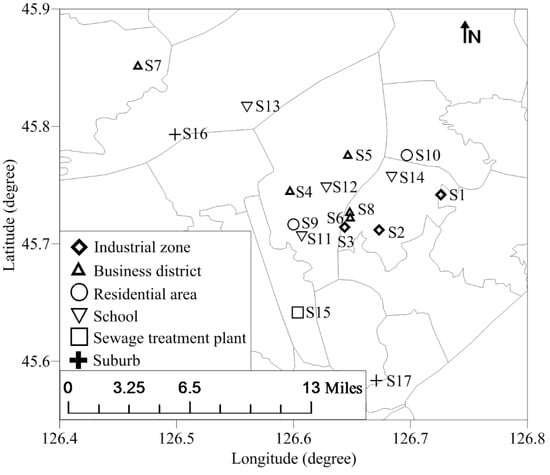
Figure 1.
The locations of the sampling sites for collecting air samples in Harbin.
The PUF disks were Soxhlet-extracted with acetone for 24 h and dichloromethane (DCM) for 24 h, respectively. The extracted PUF disks were wrapped with aluminum foil after being incandesced at 450 °C for 4 h, placed in disk-shaped aluminum cans, sealed in polyethylene bags, and placed in a −20 °C freezer before the sampling campaign. The PUF disks were used according to the standard procedures [18]. After a 90-day sampling period, the PUF disks were wrapped, sealed, and stored in a −20 °C freezer in the lab until further analyses. Six extracted PUF disks were exposed to the air for a few seconds during the sampling period and then stored at −20 °C in a freezer for use as field blank samples.
2.2. Analytical Procedure
Determinations of PAHs followed the methods introduced in previous studies [4,16,19]. Briefly, the exposed PUF disks were spiked with a mixture of surrogate standards (naphthalene-d8, acenaphthene-d10, phenanthrene-d10, chrysene-d12, and perylene-d12) and Soxhlet–extracted with dichloromethane for 24 h. Activated copper granules were added into the collection flask to remove sulfur. The extracts were concentrated with a rotary evaporator and solvent-exchanged into n-hexane with a volume of ~0.5 mL. Purification was carried out by a multilayer column containing anhydrous sodium sulfate, neutral silica gel, and neutral alumina from top to bottom. PAHs were eluted with 20 mL of a mixture solvent of dichloromethane and n-hexane (1:1, v/v). The eluent solvent was blown down to approximately 25 μL, and hexamethylbenzene was added to each concentrated sample as an internal standard before the instrumental analysis.
The PAHs were analyzed by a gas chromatography (Agilent 7890a, Agilent Technologies Inc., Santa Clara, CA, USA) equipped with a capillary column (DB-5MS, 30 m × 0.25 mm × 0.25 μm) and a mass spectrometer (MSD, Agilent 5975c, Agilent Technologies Inc., CA, USA). The parameter setting was also obtained from previous studies [4,16,19]. Briefly, each extracted sample (1 μL) was injected in a splitless mode with a solvent delay time of 10 min. High-purity helium was applied as the carrier gas with a flow rate of 1.83 mL/min. The temperatures of the injector and transfer lines were 280 °C and 300 °C, respectively. The initial oven temperature was set at 60 °C for 5 min, elevated to 280 °C at a heating rate of 3 °C/min, and held for 30 min. The 16 PAHs considered as priority pollutants by the US EPA were quantified in this study: Naphthalene (Nap), Acenaphthene (Acy), Acenaphthene (Ace), Fluorene (Flu), Phenanthrene (Phe), Anthracene (Ant), Fluoranthene (Fla), Pyrene (Pyr), Benz(a)anthracene (BaA), Chrysene (Chr), Benzo(b)fluoranthene (BbF), Benzo(k)fluoranthene (BkF), Benzo(a)pyrene (BaP), Indeno(1,2,3-cd)pyrene (IDP), Dibenzo(a.h)anthracene (DahA), Benzo(g,h,i)perylene (BghiP). Gaseous concentrations of PAHs were calculated by a sampling rate of 3.5 m3/d according to a previous study [20].
2.3. Quality Assurance and Quality Control
A procedural blank, a field blank, and a real sample selected randomly were run with each batch of 10 real samples to assess potential contamination during the analysis. The results showed that the change of PAHs concentrations in duplicates was less than 15%. The target compounds in the procedural and field blanks were not detected except for Nap. The deuterated PAHs were added to samples and blanks to monitor the analytical and sampling procedure. The deuterated PAHs recoveries were 38 ± 36%, 83 ± 15%, 108 ± 26%, 91 ± 12%, and 92 ± 17% for naphthalene-d8, acenaphthene-d10, phenanthrene-d10, chrysene-d12, and perylene-d12, respectively. The method detection limits (MDLs) were defined as the average concentrations of target PAH compounds in field blanks plus three times the standard deviation of the blanks. The MDLs of target PAH compounds were in a range from 0.01 to 3.7 pg/m3. All the PAHs concentrations reported in this study were not corrected with surrogate recoveries. Nap was not discussed throughout the text because of its low recovery, as reported in previous studies [21,22].
2.4. Methods of Source Apportionment
PMF 5.0—the newest version of the PMF model released by the U.S. EPA—and an improved NMF model were used to apportion sources of gaseous PAHs in Harbin in this study. The PMF model was developed based on ME-2 algorithm and detailed information can be found in previous literature [23]. The improved NMF model has a similar function with the PMF model [23], namely, an original matrix (V) is decomposed into two matrices (W and H) with each coefficient no less than zero, which can be expressed as follows:
where p is the number of factors and e is the simulated residual of the components in row i and column j. This model decomposes the matrix by minimizing the objective function (QNMF), which can be expressed as follows:
where u is the matrix of the uncertainty and the other symbols have the same meaning as the symbols in Equation (1) [23,24].
The improved NMF model consists of four algorithms, which are a multiplicative update method (MU) [25], an optimal gradient method (OG) [26], a highly efficient monotonic fixed-point algorithm (FP) [27], and a conjugate gradient algorithm (CG) [28]. The four algorithms were modified by adding an uncertainty matrix to decompose a data matrix to adapt to the source apportionment [13]. The four algorithms in the improved NMF model were compiled using Matlab R2016b software [13].
The improved NMF model and the PMF model used the same input data and iterations in this study. The input data of PAHs concentration was a matrix of 68 × 15. The uncertainty matrix was made as follows: when the concentration of the jth PAH component of the ith sample was lower than the detection limit of the component, the corresponding element value was 5/6 times the detection limit in row i and column j of the uncertainty matrix; otherwise, the corresponding element value in the uncertainty matrix was calculated by the following formula:
where Uc is the relative uncertainty of each PAH component (%), C is the concentration of PAHs component (ng/m3), and MDL is the detection limit of PAH component (ng/m3). In order to maximize the chance of reaching the globally optimal solution and compare the results, the improved NMF model and the PMF model were run 100 times for a final solution by using a new random seed or starting point for each iteration [23].
Principal component analysis (PCA) was used to pre-estimate the number of sources before the source apportionments by using the improved NMF model and the PMF model. The assessment was because PCA is often used to analyze the interrelationships among a large number of variables and to explain these variables in terms of a smaller number of variables with a minimum loss of information [16]. SPSS 19.0 for Windows was used for the PCA analysis.
2.5. Toxic Potency Assessment of PAHs
The potential health risks of exposure to PAHs were assessed by the BaPeq concentrations. The total BaPeq concentration contributed by 15 PAH components were calculated by the equation as follows:
where Ci and TEFi are the measured concentration and the toxicity equivalent factor of ith PAH component. The TEF values of PAHs components used in this study were given by previous studies [16,29].
3. Results and Discussion
3.1. Concentrations and Compositions of PAHs
The PAH concentrations in the atmosphere of Harbin during the sampling period are listed in Table 1. The average concentration of Σ15PAHs was 68.3 ± 22.3 ng/m3. The concentrations of 3-ring, 4-ring, 5-ring, and 6-ring PAHs were 47.2 ± 13.9 ng/m3, 19.3 ± 8.80 ng/m3, 1.20 ± 0.46 ng/m3, and 0.58 ± 0.24 ng/m3, accounting for 64.4%, 32.6%, 2.10%, and 0.89% of Σ15PAHs concentration, respectively. The most abundant PAHs were Phe, Fla, and Flu, with average concentrations of 33.4 ± 9.62 ng/m3, 10.9 ± 5.13 ng/m3, and 8.67 ± 2.88 ng/m3, respectively. Compared with the gaseous concentration of PAHs in Harbin in spring 2007, the total Σ15PAHs concentration was slightly low and the composition ratio was very similar [30].

Table 1.
The mean ± standard deviation of Polycyclic Aromatic Hydrocarbons (PAHs) concentrations and BaPeq concentrations in six functional areas (unit: ng/m3).
Among the six typical functional areas in Harbin, the Σ15PAHs concentrations in the wastewater treatment plant, industrial zone, business district, residential area, school and suburb were 98.1 ± 76.7 ng/m3, 91.2 ± 76.2 ng/m3, 71.4 ± 75.6 ng/m3, 67.9 ± 65.6 ng/m3, 42.6 ± 34.7 ng/m3, and 38.5 ± 38.0 ng/m3, respectively. The Kruskal–Wallis test showed that PAH concentrations had no significant differences among the six typical areas of Harbin. The high concentration of PAHs suggests that their sources were widespread; as reported, the wastewater treatment plant was a heavy emission source of PAHs [31,32] and the relatively high emission intensity of PAHs in the industrial zone, business district, and residential areas was caused by human activities in these areas [33,34,35,36]. Generally, the components of PAHs in the six areas had a similar pattern. The percentage of 3-ring PAHs to the Σ15PAHs (61.1%) in the wastewater treatment plant was lower than the average proportion, while the percentage of 4-ring PAHs (36.6%) was higher than the average level. Meanwhile, the proportion of 3-ring PAHs (75.8%) in residential area was higher than the average, while the percent of 4-ring PAHs (21.8%) was lower than the average. The slight difference may be due to differences in their sources [31,32,33,34,35].
The seasonal variation of gaseous concentrations of PAHs in the atmosphere of Harbin from summer 2016 to spring 2017 is listed in Table 2. The average concentrations of Σ15PAHs in Harbin in summer, autumn, winter of 2016, and spring of 2017 were 28.2 ± 26.2 ng/m3, 40.6 ± 23.1 ng/m3, 153.5 ± 38.1 ng/m3 and 57.7 ± 10.3 ng/m3, respectively. Obviously, the concentration of Σ15PAHs was about 3–5 times higher in winter than in other seasons. The most significant difference of PAH concentrations between winter and summer was found in residential and suburban areas. The ratios of PAH concentrations in winter to summer were about 13 in the two areas. The Residential area is an area where the heating demand is relatively concentrated in winter, and there are many household heating cases in the suburbs. It is concluded that the combustion emission of heating fuels is the main reason for the significant increase of PAHs concentration in winter [3,36,37]. In China, about 30% of the population lives in areas that need heating in winter [38], indicating the significance of reducing PAH emissions from the heating sector.
Table 2.
The mean ± standard deviation of seasonal concentrations of gaseous PAHs and BaPeq concentrations in Harbin during summer 2016 and spring 2017 (unit: ng/m3).
3.2. Source Apportionment of PAHs in the Atmosphere
The PCA model developed for the atmospheric PAHs explained 89.7% of the total variance when 2 principal components (PC) were considered. PC1 (78.4% explained variance, Figure 2 and Figure 3) gave high positive scores and loadings for all PAH components and PC2 (11.3% explained variance, Figure 2 and Figure 3) clearly associated concentrations of Fla, Pyr, and Chr. The overwhelming interpretability of PC1 indicates that the concentration changes of PAHs in the city were controlled primarily by fewer significant emission sources [39], and the primary sources were not well apportioned by the PCA analysis [40]. Based on the pre-estimation results, the improved NMF model and PMF model were used to apportion sources of PAHs in the Harbin atmosphere. Three factors were identified after iterative testing from 3 to 5 factors in model exercises. The Q and Q(robust) values calculated by the four algorithms in the improved NMF model were the same (922.96 for Q and 901.55 for Q(robust), see Table 3). The Q and Q(robust) values estimated by the PMF model were 933.83 and 930.88, which were slightly higher than that calculated by the improved NMF model. The BS-DISP estimation by using the PMF model scenario with three factors showed that the largest decrease of Q(robust) were less than 1% of the Q value of corresponding base model. The minor difference indicated that the results of the base model could be treated as the global optimum solutions.
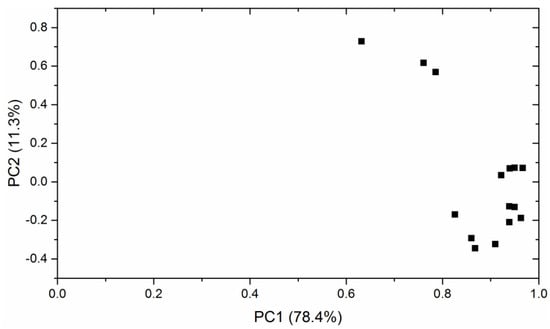
Figure 2.
Principal Component Analysis (PCA) score plot based on PAH components in atmospheric samples collected from Harbin.
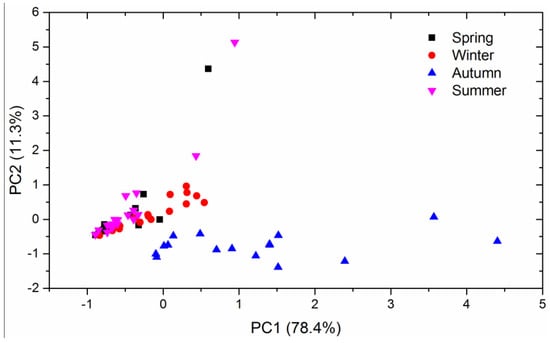
Figure 3.
PCA loading plot based on PAH components in atmospheric samples collected from Harbin.
Table 3.
The Q and Q(robust) values calculated by non-negative matrix (NMF) and positive matrix factorization (PMF) models. MU—multiplicative update method; OG—optimal gradient method; FP—fixed-point algorithm; CG—conjugate gradient algorithm.
The three factors identified by the algorithms of MU, OG, FP, and CG in the improved NMF model and the PMF model showed similar patterns. Factor 1 was biomass burning, typically characterized by high loadings of low molecular weight PAHs such as Acy, Ace, Flu, Phe, and Ant [16,41]. Factor 2 was considered as vehicle exhaust emissions, characterized by high loads on high molecular weight PAHs such as BghiP, DahA, IDP, BaP, BkF, and BbF [16,41,42]. Factor 3 showed high proportions to the moderate molecular weight PAHs of Fla, Pyr, BaA, and Chr, which were treated as the contribution related to coal combustion [16,41,43].
The contributions of three factors to PAHs in the atmosphere apportioned by the improved model and the PMF model are shown in Figure 4. These results indicate that the models used in this study identified similar resolutions of source apportionments. The average contributions of biomass burning, coal combustion, and vehicle emission to Σ15PAHs concentration obtained by the two models were 48.6 ± 4.03%, 34.6 ± 3.22%, and 16.8 ± 5.06%, respectively. The molecular diagnostic ratios of PAHs, such as Ant/(Ant + Phe), Fla/(Fla + Pyr), BaA/(BaA + Chr), and IDP/(IDP + BghiP) (Table 4), were often used to qualitatively differentiate sources of PAHs in past studies [44,45,46]. The ratios of Ant/(Ant + Phe), Fla/(Fla + Pyr), BaA/(BaA + Chr), and IDP/(IDP + BghiP) of PAHs in this study were 0.04 ± 0.03, 0.62 ± 0.03, 0.25 ± 0.08, and 0.82 ± 0.04, respectively. Among them, the ratios of Fla/(Fla + Pyr) and IDP/(IDP + BghiP) indicated that biomass burning and coal combustion were the main contributors to PAHs in the atmosphere in Harbin [44,45], the ratios of Ant/(Ant + Phe) and BaA/(BaA + Chr) suggested that vehicle exhaust was the main contributor of PAHs [44,47]. The similar sources identified by the improved NMF model and PMF model and the method of diagnostic ratios indicate that the models used in this study can comprehensively apportion PAHs sources.
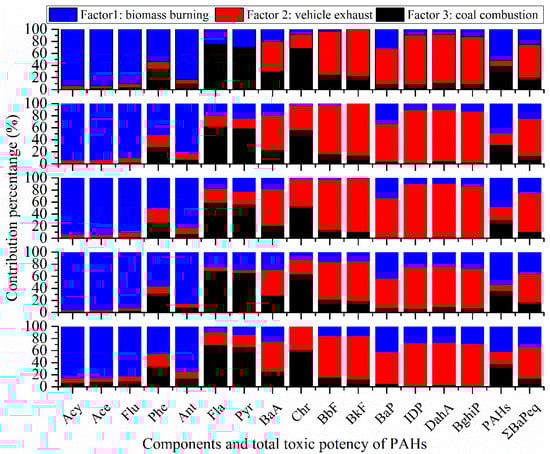
Figure 4.
Fractional contributions to components and total toxic potency of PAHs from three sources identified by the improved NMF and the PMF models. (Note: the results in the panels from top to bottom were solved by the algorithms of MU, OG, FP, and CG in the improved NMF model and the PMF model).
Table 4.
Characteristic PAH molecular diagnostic ratios.
The improved NMF model and the PMF model identified that contributions in summer, autumn, winter, and spring were 10.0 ± 3.57%, 32.5 ± 3.92%, 70.3 ± 4.43%, 12.5 ± 3.44% for biomass burning; 67.6 ± 5.33%, 57.9 ± 2.82%, 15.1 ± 3.46%, 55.2 ± 7.80% for coal combustion; and 22.4 ± 7.51%, 9.59 ± 3.54%, 14.7 ± 4.34%, 32.3 ± 10.1% for vehicle exhaust, respectively. It is already clear that the contribution of biomass burning increased significantly in winter and the source became the preponderant contributor of gaseous PAHs in the city during winter due to heating needs. The emission source of PAHs should be paid more attention in China because about 30% of the total population lives in areas that need heating in winter [38]. Coal combustion emitted more moderate molecular weight PAHs, such as Fla, Pyr, BaA, and Chr [16,41,43]. These moderate molecular weight PAHs are more favorable to partition into a gaseous form in the atmosphere under the condition of a high-temperature environment in summer [48]. The factors lead to coal combustion as the main contribution source of gaseous PAHs in Harbin in summer.
3.3. Toxic Potency of PAHs and Source Contribution
Table 1 lists the ΣBaPeq concentrations calculated using Equation (4). The average ΣBaPeq concentration was 0.54 ± 0.23 ng/m3. The average ΣBaPeq concentrations in the industrial area, sewage treatment plant, business district, residential area, school, and suburb were 0.89 ± 0.77 ng/m3, 0.65 ± 0.54 ng/m3, 0.63 ± 0.78 ng/m3, 0.53 ± 0.51 ng/m3, 0.28 ± 0.23 ng/m3, and 0.23 ± 0.20 ng/m3, respectively. In terms of season, the average ΣBaPeq concentration reached its maximum value in winter, which was 1.20 ± 0.52 ng/m3, followed by spring (0.47 ± 0.13 ng/m3), autumn (0.27 ± 0.13 ng/m3), and summer (0.23 ± 0.12 ng/m3), as listed in Table 2. Figure 4 displays the contribution of three sources to the ΣBaPeq concentration in Harbin identified by the improved NMF model and the PMF model. The contribution proportions of biomass burning, coal combustion, and vehicle exhaust were 28.7 ± 4.69%, 14.8 ± 2.80%, and 56.5 ± 6.17%, respectively. The contributions indicate that vehicle exhaust was the largest contributor to potential health risks of exposure to PAHs although the source contributed weakly to PAH concentration in the atmosphere in Harbin.
4. Conclusions
This study comprehensively investigated ∑15PAHs in passive air samples collected from 17 sampling sites in six functional areas in Harbin, China from May 2016 to April 2017. The results showed that the average concentration of Σ15PAHs in 68 collected samples was 68.3 ± 22.3 ng/m3. It was dominated by 3-ring PAHs (64.4%), followed by 4-ring (32.6%), 5-ring (2.10%), and 6-ring (0.89%). The components of Phe, Fla, and Flu had the highest concentrations among the Σ15PAHs. The Σ15PAHs concentrations were 98.1 ± 76.7 ng/m3, 91.2 ± 76.2 ng/m3, 71.4 ± 75.6 ng/m3, 67.9 ± 65.6 ng/m3, 42.6 ± 34.7 ng/m3, and 38.5 ± 38.0 ng/m3 in the wastewater treatment plant, industrial zone, business district, residential area, school, and suburb, respectively. The improved NMF model and the PMF model analyzed three source of PAHs. Among the three sources, the average contribution of biomass burning, coal combustion, and vehicle exhaust were 48.6 ± 4.03%, 34.6 ± 3.22%, and 16.8 ± 5.06%, respectively. The contribution of biomass burning was significantly increased in winter, while that of coal combustion was significantly higher in summer. Vehicle exhaust was the largest contributor to the potential health risks of exposure to PAHs in Harbin. As an important city with a population of over a million in northeast China, Harbin should not only pay attention to the atmospheric concentration level of PAHs and their sources, but also pay enough attention to other pollutants with significant impacts on health risks and their sources.
Author Contributions
Conceptualization, H.Q.; Data curation, B.L. and L.M.; Formal analysis, H.L. and J.X.; Funding acquisition, H.Q. and C.T.; Investigation, M.W. and W.M.; Methodology, H.L., J.X., M.W. and W.M.; Project administration, H.Q. and C.T.; Resources, B.L., H.Q., L.M. and J.X.; Software, H.L. and C.T.; Supervision, B.L. and L.M.; Validation, L.M. and W.M.; Visualization, W.M.; Writing—original draft, H.L.; Writing—review & editing, C.T. and H.Q. All authors have read and agreed to the published version of the manuscript.
Funding
This study was financially supported by the National Natural Science Foundation of China (No. 41977190 and U1806207), the seed project of Yantai Institute of Coastal Zone Research, Chinese Academy of Sciences (No. YIC Y855011021).
Institutional Review Board Statement
Not applicable.
Informed Consent Statement
Not applicable.
Data Availability Statement
The data presented in this study are available on request from the corresponding author.
Conflicts of Interest
The authors declare no competing financial interest.
References
- Ma, W.-L.; Liu, L.-Y.; Tian, C.-G.; Qi, H.; Jia, H.-L.; Song, W.-W.; Li, Y.-F. Polycyclic aromatic hydrocarbons in Chinese surface soil: Occurrence and distribution. Environ. Sci. Pollut. Res. 2015, 22, 4190–4200. [Google Scholar] [CrossRef]
- Hong, W.-J.; Jia, H.; Ma, W.-L.; Sinha, R.K.; Moon, H.-B.; Nakata, H.; Minh, N.H.; Chi, K.H.; Li, W.-L.; Kannan, K.; et al. Distribution, Fate, Inhalation Exposure and Lung Cancer Risk of Atmospheric Polycyclic Aromatic Hydrocarbons in Some Asian Countries. Environ. Sci. Technol. 2016, 50, 7163–7174. [Google Scholar] [CrossRef]
- Ma, L.; Li, B.; Liu, Y.; Sun, X.; Fu, D.; Sun, S.; Thapa, S.; Geng, J.; Qi, H.; Zhang, A.; et al. Characterization, sources and risk assessment of PM2.5-bound polycyclic aromatic hydrocarbons (PAHs) and nitrated PAHs (NPAHs) in Harbin, a cold city in Northern China. J. Clean. Prod. 2020, 264, 121673. [Google Scholar] [CrossRef]
- Liu, J.; Xu, Y.; Li, J.; Liu, D.; Tian, C.; Chaemfa, C.; Zhang, G. The distribution and origin of PAHs over the Asian marginal seas, the Indian and the Pacific Oceans: Implications for outflows from Asia and Africa. J. Geophys. Res. Atmos. 2014. [Google Scholar] [CrossRef]
- Shen, H.; Huang, Y.; Wang, R.; Zhu, D.; Li, W.; Shen, G.; Wang, B.; Zhang, Y.; Chen, Y.; Lu, Y.; et al. Global atmospheric emissions of polycyclic aromatic hydrocarbons from 1960 to 2008 and future predictions. Environ. Sci. Technol. 2013, 47, 6415–6424. [Google Scholar] [CrossRef] [PubMed]
- Wang, X.; Zong, Z.; Tian, C.; Chen, Y.; Luo, C.; Li, J.; Zhang, G.; Luo, Y. Combining positive matrix factorization and radiocarbon measurements for source apportionment of PM2.5 from a national background site in North China. Sci. Rep. 2017, 7, 10648. [Google Scholar] [CrossRef]
- Zhang, J.W.; Zhao, J.; Cai, J.; Gao, S.T.; Li, J.; Zeng, X.Y.; Yu, Z.G. Spatial distribution and source apportionment of atmospheric polycyclic aromatic hydrocarbons in the Pearl River Delta, China. Atmos. Pollut. Res. 2018, 9, 887–893. [Google Scholar] [CrossRef]
- Zhang, L.; Zhang, T.; Dong, L.; Shi, S.; Zhou, L.; Huang, Y. Assessment of halogenated POPs and PAHs in three cities in the Yangtze River Delta using high-volume samplers. Sci. Total Environ. 2013, 454–455, 619–626. [Google Scholar] [CrossRef] [PubMed]
- Shen, R.; Liu, Z.; Chen, X.; Wang, Y.; Wang, L.; Liu, Y.; Li, X. Atmospheric levels, variations, sources and health risk of PM2.5-bound polycyclic aromatic hydrocarbons during winter over the North China Plain. Sci. Total Environ. 2019, 655, 581–590. [Google Scholar] [CrossRef]
- Sun, X.; Wang, K.; Li, B.; Zong, Z.; Shi, X.; Ma, L.; Fu, D.; Thapa, S.; Qi, H.; Tian, C. Exploring the cause of PM2.5 pollution episodes in a cold metropolis in China. J. Clean. Prod. 2020, 256, 120275. [Google Scholar] [CrossRef]
- Belis, C.A.; Karagulian, F.; Larsen, B.R.; Hopke, P.K. Critical review and meta-analysis of ambient particulate matter source apportionment using receptor models in Europe. Atmos. Environ. 2013, 69, 94–108. [Google Scholar] [CrossRef]
- Hopke, P.K. A review of receptor modeling methods for source apportionment. J. Air Waste Manag. Assoc. 2016, 66, 237–259. [Google Scholar] [CrossRef]
- Liu, H.; Tian, C.; Zong, Z.; Wang, X.; Li, J.; Zhang, G. Development and assessment of a receptor source apportionment model based on four nonnegative matrix factorization algorithms. Atmos. Environ. 2019, 197, 159–165. [Google Scholar] [CrossRef]
- Wang, Y.; Zhang, Y. Nonnegative matrix factorization: A comprehensive review. IEEE Trans. Knowl. Data Eng. 2013, 25, 1336–1353. [Google Scholar] [CrossRef]
- Xue, X.; You, Y.; Wu, J.; Han, B.; Bai, Z.; Tang, N.; Zhang, L. Exposure measurement, risk assessment and source identification for exposure of traffic assistants to particle-bound PAHs in Tianjin, China. J. Environ. Sci. 2014, 26, 448–457. [Google Scholar] [CrossRef]
- Wang, X.; Zong, Z.; Tian, C.; Chen, Y.; Luo, C.; Tang, J.; Li, J.; Zhang, G. Assessing on toxic potency of PM2.5-bound polycyclic aromatic hydrocarbons at a national atmospheric background site in North China. Sci. Total Environ. 2018, 612, 330–338. [Google Scholar] [CrossRef]
- Shoeib, M.; Harner, T. Characterization and Comparison of Three Passive Air Samplers for Persistent Organic Pollutants. Environ. Sci. Technol. 2002, 36, 4142–4151. [Google Scholar] [CrossRef]
- Zhang, G.; Chakraborty, P.; Li, J.; Sampathkumar, P.; Balasubramanian, T.; Kathiresan, K.; Takahashi, S.; Subramanian, A.; Tanabe, S.; Jones, K.C. Passive atmospheric sampling of organochlorine pesticides, polychlorinated biphenyls, and polybrominated diphenyl ethers in urban, rural, and wetland sites along the coastal length of India. Environ. Sci. Technol. 2008, 42, 8218–8223. [Google Scholar] [CrossRef]
- Xu, Y.; Zhang, Y.-L.; Li, J.; Gioia, R.; Zhang, G.; Li, X.-D.; Spiro, B.; Bhatia, R.S.; Jones, K.C. The spatial distribution and potential sources of polycyclic aromatic hydrocarbons (PAHs) over the Asian marginal seas and the Indian and Atlantic Oceans. J. Geophys. Res. 2012, 117, D07302. [Google Scholar] [CrossRef]
- Motelay-Massei, A.; Harner, T.; Shoeib, M.; Diamond, M.; Stern, G.; Rosenberg, B. Using passive air samplers to assess urban-rural trends for persistent organic pollutants and polycyclic aromatic hydrocarbons. 2. Seasonal trends for PAHs, PCBs, and organochlorine pesticides. Environ. Sci. Technol. 2005, 39, 5763–5773. [Google Scholar] [CrossRef]
- Wang, X.; Liu, S.; Zhao, J.; Zuo, Q.; Liu, W.; Li, B.; Tao, S. Deposition flux of aerosol particles and 15 polycyclic aromatic hydrocarbons in the North China Plain. Environ. Toxicol. Chem. 2014, 33, 753–760. [Google Scholar] [CrossRef]
- Zhang, Y.; Deng, S.; Liu, Y.; Shen, G.; Li, X.; Cao, J.; Wang, X.; Reid, B.; Tao, S. A passive air sampler for characterizing the vertical concentration profile of gaseous phase polycyclic aromatic hydrocarbons in near soil surface air. Environ. Pollut. 2011, 159, 694–699. [Google Scholar] [CrossRef]
- Norris, G.; Duvall, R. EPA Positive Matrix Factorization (PMF) 5.0 Fundamentals and User Guide; EPA/600/R-14/108; U.S. Environmental Protection Agency National Exposure Research Laboratory: Washington, DC, USA, 2014; pp. 1–124.
- Paatero, P.; Eberly, S.; Brown, S.G.; Norris, G.A. Methods for estimating uncertainty in factor analytic solutions. Atmos. Meas. Tech. 2014, 7, 781–797. [Google Scholar] [CrossRef]
- Lee, D.D.; Seung, H.S. Learning the parts of objects by non-negative matrix factorization. Nature 1999, 401, 788–791. [Google Scholar] [CrossRef]
- Guan, N.; Tao, D.; Luo, Z.; Yuan, B. NeNMF: An optimal gradient method for nonnegative matrix factorization. IEEE Trans. Signal Process. 2012, 60, 2882–2898. [Google Scholar] [CrossRef]
- Li, L.; Zhang, Y.-J. FastNMF: Highly efficient monotonic fixed-point nonnegative matrix factorization algorithm with good applicability. J. Electron. Imaging 2009, 18, 033004. [Google Scholar] [CrossRef]
- Abd El Aziz, M.; Khidr, W. Nonnegative matrix factorization based on projected hybrid conjugate gradient algorithm. Signal Image Video Process. 2015, 9, 1825–1831. [Google Scholar] [CrossRef]
- Nisbet, I.C.T.; LaGoy, P.K. Toxic equivalency factors (TEFs) for polycyclic aromatic hydrocarbons (PAHs). Regul. Toxicol. Pharm. 1992, 16, 290–300. [Google Scholar] [CrossRef]
- Ma, W.-L.; Li, Y.-F.; Sun, D.-Z.; Qi, H.; Liu, L.-Y.; Zhang, Z.; Tian, C.-G.; Shen, J.-M. Gaseous polycyclic aromatic hydrocarbons in Harbin air. Environ. Sci. 2009, 30, 3167–3172. [Google Scholar]
- Chen, J.; Liao, J.; Wei, C. Coking wastewater treatment plant as a sources of polycyclic aromatic hydrocarbons (PAHs) in sediments and ecological risk assessment. Sci. Rep. 2020, 10, 7833. [Google Scholar] [CrossRef] [PubMed]
- Zhang, W.; Wei, C.; Feng, C.; Yan, B.; Li, N.; Peng, P.; Fu, J. Coking wastewater treatment plant as a source of polycyclic aromatic hydrocarbons (PAHs) to the atmosphere and health-risk assessment for workers. Sci. Total Environ. 2012, 432, 396–403. [Google Scholar] [CrossRef]
- Jia, T.; Guo, W.; Liu, W.; Xing, Y.; Lei, R.; Wu, X.; Sun, S. Spatial distribution of polycyclic aromatic hydrocarbons in the water–sediment system near chemical industry parks in the Yangtze River Delta, China. Sci. Total Environ. 2021, 754, 142176. [Google Scholar] [CrossRef]
- Xu, H.; Ta, W.; Yang, L.; Feng, R.; He, K.; Shen, Z.; Meng, Z.; Zhang, N.; Li, Y.; Zhang, Y.; et al. Characterizations of PM2.5-bound organic compounds and associated potential cancer risks on cooking emissions from dominated types of commercial restaurants in northwestern China. Chemosphere 2020, 261, 127758. [Google Scholar] [CrossRef]
- Huo, C.-Y.; Sun, Y.; Liu, L.-Y.; Sverko, E.; Li, Y.-F.; Li, W.-L.; Ma, W.-L.; Zhang, Z.-F.; Song, W.-W. Assessment of human indoor exposure to PAHs during the heating and non-heating season: Role of window films as passive air samplers. Sci. Total Environ. 2019, 659, 293–301. [Google Scholar] [CrossRef]
- Cui, S.; Song, Z.; Zhang, L.; Zhang, Z.; Hough, R.; Fu, Q.; An, L.; Shen, Z.; Li, Y.-F.; Liu, D.; et al. Polycyclic aromatic hydrocarbons in fresh snow in the city of Harbin in northeast China. Atmos. Environ. 2019, 215, 116915. [Google Scholar] [CrossRef]
- Ma, W.-L.; Li, Y.-F.; Sun, D.-Z.; Qi, H.; Liu, L.-Y. Polycyclic aromatic hydrocarbons in air of Harbin City. Chin. Environ. Sci. 2010, 30, 145–149. [Google Scholar]
- National Bureau of Statistics, China Statistical Yearbook 2017; China Statistics Press: Beijing, China, 2018. Available online: http://www.stats.gov.cn/tjsj/ndsj/2018/indexch.htm (accessed on 7 February 2021).
- Cheng, Y.; Yu, Q.-q.; Liu, J.-m.; Du, Z.-Y.; Liang, L.-l.; Geng, G.-n.; Zheng, B.; Ma, W.-l.; Qi, H.; Zhang, Q.; et al. Strong biomass burning contribution to ambient aerosol during heating season in a megacity in Northeast China: Effectiveness of agricultural fire bans? Sci. Total Environ. 2021, 754, 142144. [Google Scholar] [CrossRef] [PubMed]
- Cesari, D.; Amato, F.; Pandolfi, M.; Alastuey, A.; Querol, X.; Contini, D. An inter-comparison of PM10 source apportionment using PCA and PMF receptor models in three European sites. Environ. Sci. Pollut. Res. 2016, 23, 15133–15148. [Google Scholar] [CrossRef] [PubMed]
- Xu, S.; Liu, W.; Tao, S. Emission of polycyclic aromatic hydrocarbons in China. Environ. Sci. Technol. 2006, 40, 702–708. [Google Scholar] [CrossRef] [PubMed]
- Wang, J.; Geng, N.B.; Xu, Y.F.; Zhang, W.D.; Tang, X.Y.; Zhang, R.Q. PAHs in PM2.5 in Zhengzhou: Concentration, carcinogenic risk analysis, and source apportionment. Environ. Monit. Assess. 2014, 186, 7461–7473. [Google Scholar] [CrossRef] [PubMed]
- Wang, Y.; Xu, Y.; Chen, Y.; Tian, C.; Feng, Y.; Chen, T.; Li, J.; Zhang, G. Influence of different types of coals and stoves on the emissions of parent and oxygenated PAHs from residential coal combustion in China. Environ. Pollut. 2016, 212, 1–8. [Google Scholar] [CrossRef] [PubMed]
- Yunker, M.B.; Macdonald, R.W.; Vingarzan, R.; Mitchell, R.H.; Goyette, D.; Sylvestre, S. PAHs in the Fraser River basin: A critical appraisal of PAH ratios as indicators of PAH source and composition. Org. Geochem. 2002, 33, 489–515. [Google Scholar] [CrossRef]
- Katsoyiannis, A.; Sweetman, A.J.; Jones, K.C. PAH molecular diagnostic ratios applied to atmospheric sources: A critical evaluation using two decades of source inventory and air concentration data from the UK. Environ. Sci. Technol. 2011, 45, 8897–8906. [Google Scholar] [CrossRef] [PubMed]
- Liu, W.; Xu, Y.; Zhao, Y.; Liu, Q.; Yu, S.; Liu, Y.; Wang, X.; Liu, Y.; Tao, S.; Liu, W. Occurrence, source, and risk assessment of atmospheric parent polycyclic aromatic hydrocarbons in the coastal cities of the Bohai and Yellow Seas, China. Environ. Pollut. 2019, 254, 113046. [Google Scholar] [CrossRef]
- Tobiszewski, M.; Namieśnik, J. PAH diagnostic ratios for the identification of pollution emission sources. Environ. Pollut. 2012, 162, 110–119. [Google Scholar] [CrossRef] [PubMed]
- Xie, M.; Hannigan, M.P.; Barsanti, K.C. Gas/particle partitioning of n-alkanes, PAHs and oxygenated PAHs in urban Denver. Atmos. Environ. 2014, 95, 355–362. [Google Scholar] [CrossRef]


Publisher’s Note: MDPI stays neutral with regard to jurisdictional claims in published maps and institutional affiliations. |
© 2021 by the authors. Licensee MDPI, Basel, Switzerland. This article is an open access article distributed under the terms and conditions of the Creative Commons Attribution (CC BY) license (http://creativecommons.org/licenses/by/4.0/).