Article

In Situ, Rotor-Based Drone Measurement of Wind Vector and Aerosol Concentration in Volcanic Areas

1
Japan Weather Association, Tokyo 170-6055, Japan
2
Disaster Prevention Research Institute, Kyoto 611-0011, Japan
*
Author to whom correspondence should be addressed.
Atmosphere 2021, 12(3), 376; https://doi.org/10.3390/atmos12030376
Submission received: 29 January 2021 / Revised: 5 March 2021 / Accepted: 10 March 2021 / Published: 13 March 2021

Abstract

:
Unmanned aerial vehicles (UAVs), represented by rotor-based drones, are suitable for volcanic observations owing to the advantages of mobility and safety. In this study, vertical profiles of wind and aerosol concentrations at altitudes up to 1000 m around Mt. Sakurajima, one of the most active volcanoes in Japan, were measured in situ using a drone equipped with an ultrasonic anemometer and aerosol sensor. The drone-measured wind profiles were compared with Doppler LiDAR data and analysis values derived from a meteorological model. Drone-measured vertical profiles collected at a vertical speed of 1 m·s−1 (upward and downward) showed strong agreement with the LiDAR observations, as did the averaged values of hovering drone measurements. Obvious vertical wind shear was found by the drone in the vicinity of Mt. Sakurajima. An aerosol sensor was installed on the drone with the capability to measure fine (PM2.5) and coarse particles (PM10) simultaneously; in this manner, volcanic ash and aerosol pollutants around the volcano could be distinguished. Thus, it was proven that drones could be applied to investigate wind conditions and aerosols in situ, even at dangerous locations near active volcanoes.

1. Introduction

Small, unmanned aerial vehicles (UAVs) have become popular tools across various fields, such as photography and agriculture, and logistics and maintenance of infrastructure. Fixed-wing UAVs have often been used as UAVs for atmospheric observation; however, recently, the use of rotor-based drones (hereafter referred to as “drones”) has expanded rapidly. This is in part because drones, unlike fixed-wing UAVs, do not require a runway for takeoff or landing and are also capable of low-speed, low-altitude, and hovering flight. Barbieri et al. [1] conducted a comparative study on atmospheric observation and concluded that drones are more suitable for atmospheric measurements at fixed points than fixed-wing UAVs. Since fixed-wing UAVs cannot hover at specific points. Therefore, drones are promising platform for measuring the vertical profile of wind vectors (wind speed and direction) in the atmospheric boundary layer. Although radiosonde is a traditional method for meteorological observation in the atmospheric boundary layer, it is costly and less ecologically friendly as it is disposable. Remote sensing methods such as sound detection and ranging (SoDAR) and light detection and ranging (LiDAR) are superior, but they require stationary power sources and high initial investments. Drones, however, provide relatively low-cost atmospheric measurements. Shimura et al. [2] showed the feasibility of wind profile measurement up to 1000 m using an anemometer-equipped drone across a wide range of wind speed conditions (up to 11 m·s−1). In addition to this direct form of measurement, a method for estimating wind speed and direction from the flight data of the fuselage (pitch, roll, and yaw) has also been investigated [2,3,4,5]. Furthermore, the addition of gas and/or particulate matter (PM) sensors on the drone makes it possible to obtain air quality data as well. For example, drones equipped with atmospheric sensors have been applied to measure the emissions of pollutant sources, such as ship exhaust or open burning [6,7,8]. Aside from these emission point source investigations, the vertical profile of gases and PM concentrations in the atmospheric boundary layer have also been examined via drones [9,10,11,12,13,14,15,16].
The acquisition of vertical profiles of meteorological data, volcanic gases, and PM concentrations is indispensable for building a predictive model for the diffusion of ejecta. In previous studies, helicopters or tethered balloons have been used for acquiring similar measurements. Tethered balloons, however, are vulnerable to strong winds and lack agility, while the cost of helium is steadily increasing due to a global shortage. Maneuvering helicopters near a crater is dangerous for both the aircraft and the crew due to the corrosive gases present and volcanic ash, in addition to the high associated operating costs. For these reasons, the observational ability of fixed-wing UAVs has been explored, but obtaining vertical profile data at specific points is challenging due to their lack of hover ability and vertical motion. Therefore, drones have garnered increasing volcanic research attention [2,17,18], although few approaches are currently available to assess the accuracy of their measurements with field observations.
In the present study, we applied drone measurements to volcanic observations, including the wind vector and aerosol distributions. The purpose of this work is to establish a method for the in situ measurement of wind and aerosol and gas concentrations around a volcano. This paper presents drone observations of the volcanic data at Sakurajima, one of the most active volcanoes in Japan. In particular, the study focuses on in situ measurements of the wind vector and PM concentration. The vertical profiles were compared with LiDAR observations and objective analysis values estimated using a meteorological model.

2. Materials and Methods

2.1. Reseach Platform: Drone and Sensors

A hexarotor-based drone (SPIDER CS-6; Luce Search Co., Ltd., Hiroshima, Japan) was used in this study, with a weight of 3.8 kg, horizontal dimensions of 95 cm × 95 cm, and height of 40 cm. The additional payload weight was 4 kg, and maximum flight duration was 20–25 min, using lithium polymer batteries. A 2D-ultrasonic anemometer (FT702; FT Technologies, Sunbury-on-Thames, UK) was installed on the upper center of the drone to measure the horizontal wind vector. The anemometer sensor unit was mounted on the tip of a 47 cm aluminum pole to reduce the effect of propeller downwash. Three wire stays prevented the pole from vibrating excessively. The PM sensor (Pocket PM2.5 Monitor; Yaguchi Electric Co., Ltd., Miyagi, Japan) was equipped on the drone to investigate aerosol distribution; this sensor is capable of simultaneous measurements of PM2.5 (PM ≤ 2.5 µm diameter) and PM10 (PM ≤ 10 µm diameter). Previously, this sensor was used for air pollution monitoring surveys [19]. Furthermore, its small size (4 cm × 8 cm × 3 cm) and lightweight (67 g) make it well suited for drone observations. Wind and PM data were stored in an external datalogger at 1-s intervals, and the stored data were collected after landing the drone. For the measurement of volcanic gas concentrations, a gas detector (QRAE3; RAE Systems, Inc., Sunnyvale, CA, USA) was equipped to simultaneously measure SO2 and H2S concentrations at 1-s intervals, and the data were stored internally. The fully equipped drone, i.e., with the anemometer, PM sensor, and gas detector, is presented in Figure 1.

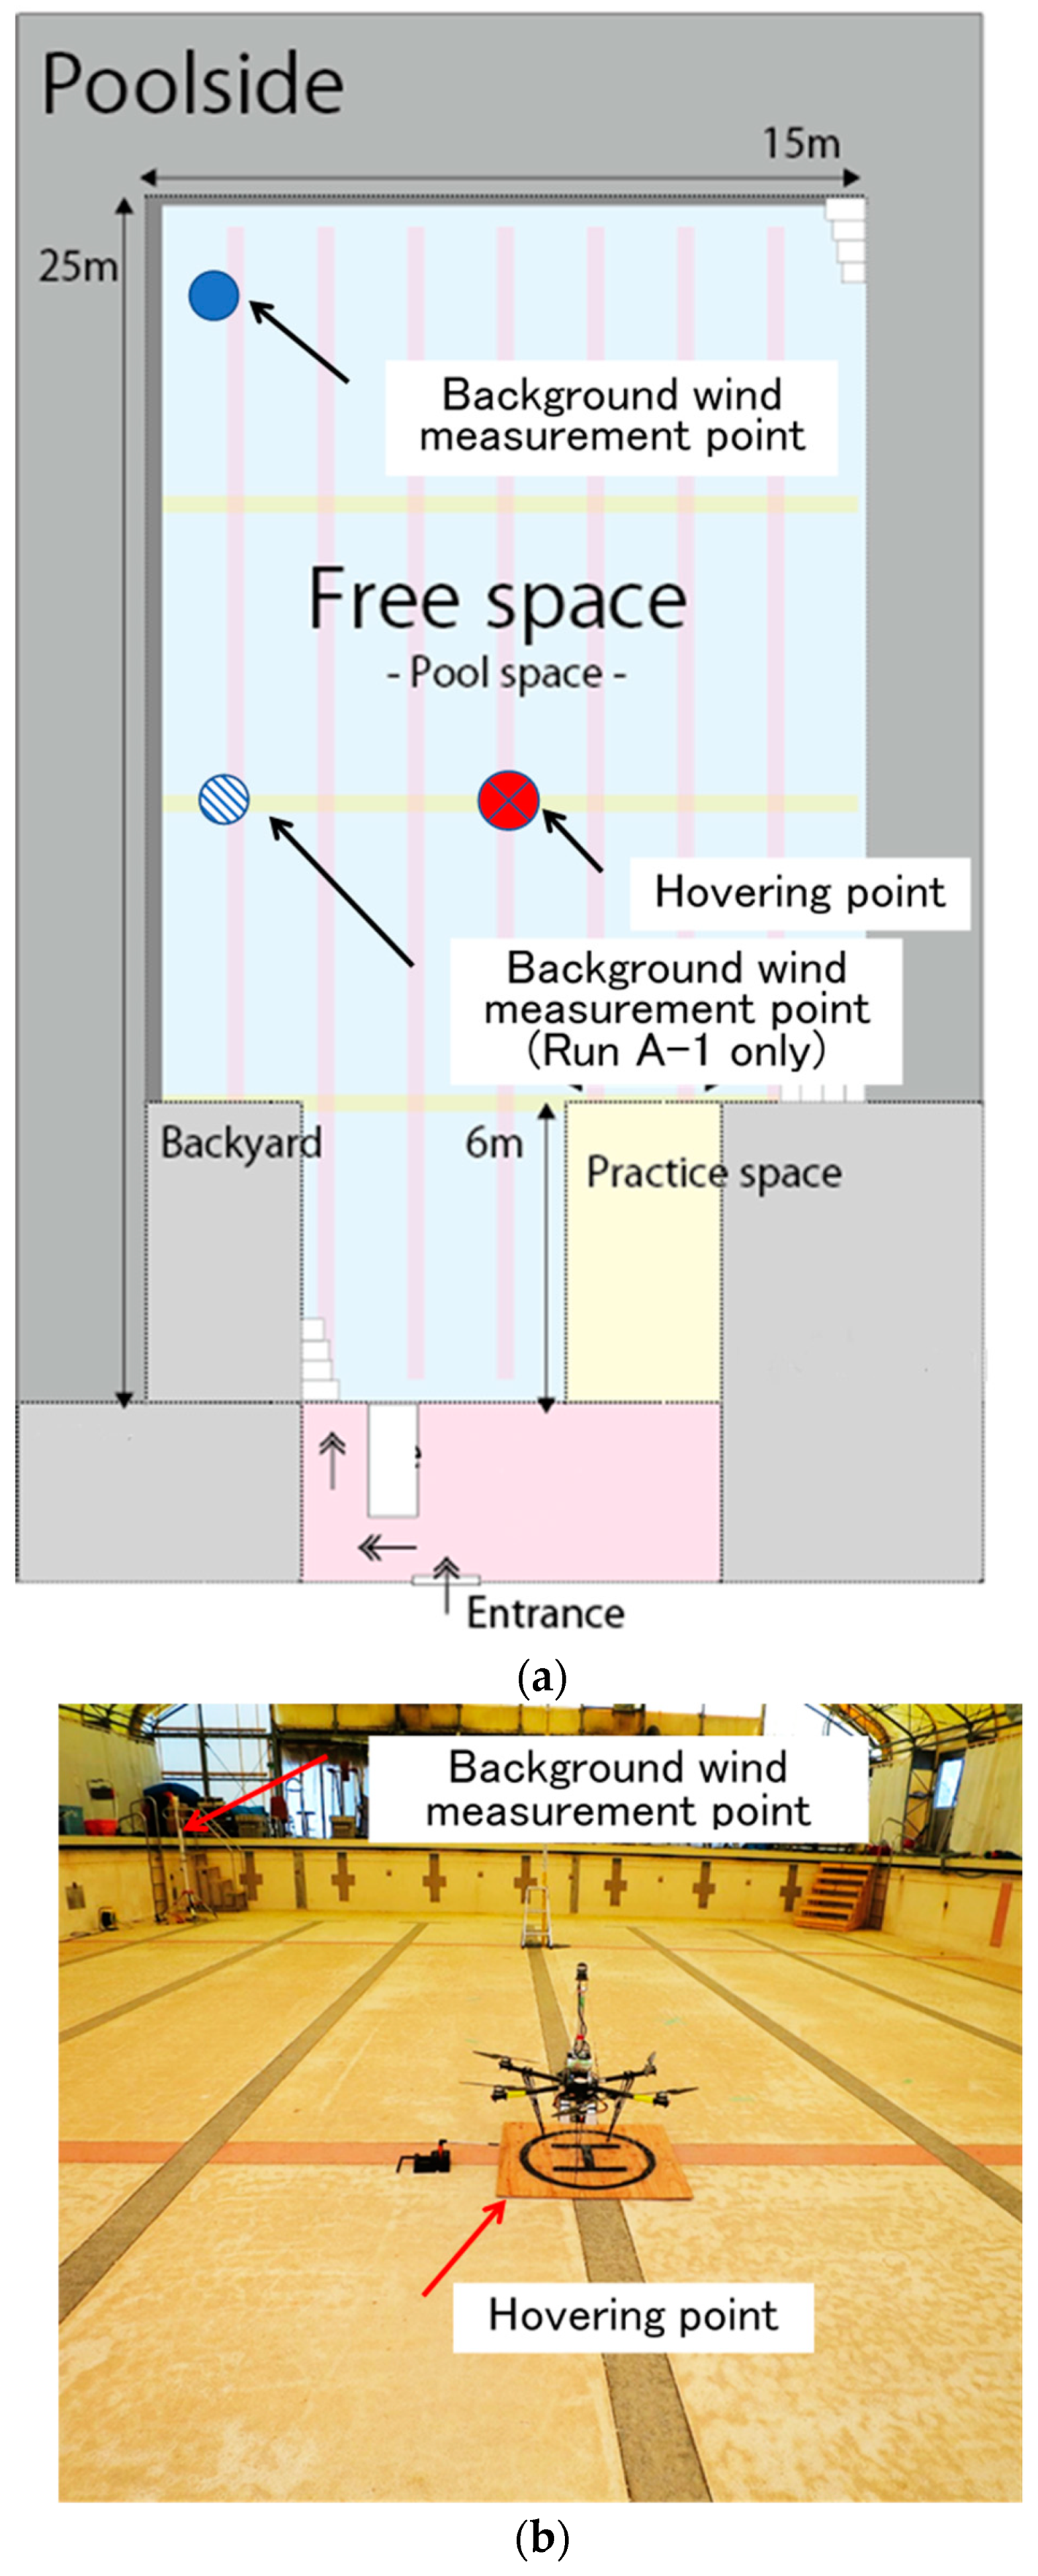
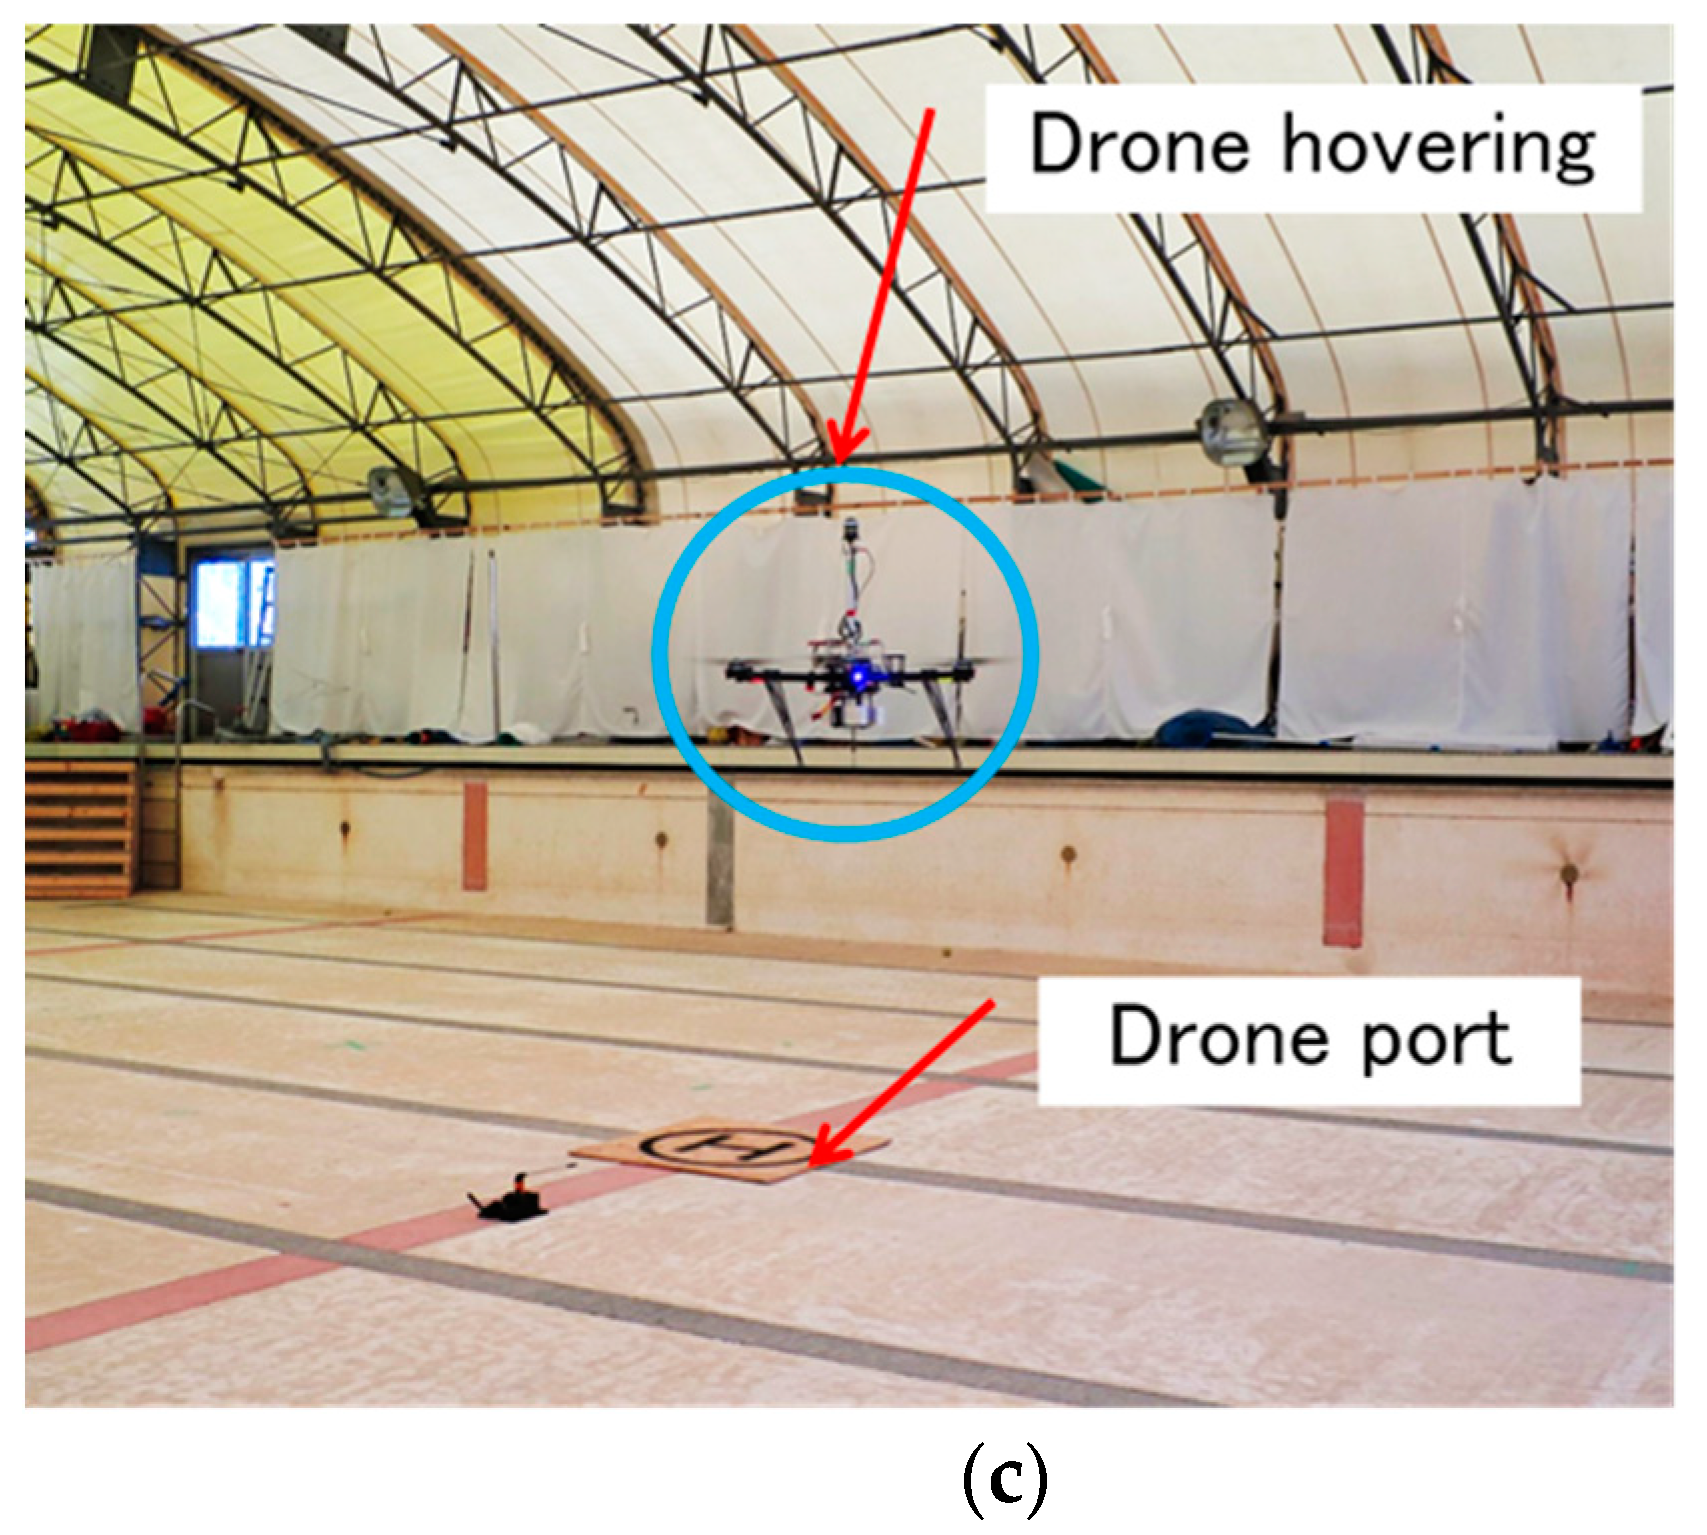
2.2. Preliminary Experiments

Propeller downwash can affect drone-mounted anemometer measurements, but indoor experiments and simulations have shown that mounting the sensor on the upper center of the drone reduces its impact [20,21,22,23]. Accordingly, the anemometer used in this study was equipped on the upper center of the fuselage; however, our previous research identified a wind speed bias of +0.5 m·s−1 when compared with observations from a meteorological tower [2]. Since this bias was attributed to the downwash effect, a preliminary experiment was conducted in an indoor field under still conditions. The test site was a drained, indoor swimming pool, with a flight space of 5 m × 25 m × 15 m (h × l × w) (Figure 2). The roof was composed of a plastic fiber material such that the GPS signal, indispensable for stable drone flight, could still be received. The anemometer-equipped drone was deployed from the center of the test site. To capture the background wind caused by a drone flight, an anemometer (WXT510; Vaisala, Finland) was installed at a height of 2 m (Figure 2b), and the wind speed was recorded at 1-min intervals. The background wind measurement point was replaced after the first run (Run A-1) to avoid a collision accident with a drone. The drone was hovered for 5-min at heights of 2 m and 3.5 m during each run, and a 5-min waiting time was imposed between flights to confirm that the stable, still conditions returned under the static state. The wind speed data measured by the drone were logged at 1-s intervals and analyzed.

2.3. Field Observations

To measure the vertical profile of wind, volcanic aerosols, and gases, we flew the drone up to 1000 m above ground level (agl) at the summit crater of Sakurajima, Japan (Figure 3), known for frequent eruptions [24]. Eruptions have primarily occurred at the summit crater (Minamidake; elevation, 1031 m) since 1955. Drone flights were carried out 30 October 2019, at the Kurokami site (elevation, 110 m). The Doppler LiDAR (DIABREZZA_W; Mitsubishi Electric Co., Ltd., Japan) can accurately observe the vertical wind profile up to 600 m and was installed approximately 50 m away from the drone port for safety. The LiDAR specifications used in this study are shown in Table S1 in Supplementary Materials. The following two protocols were followed for drone-based measurements of the vertical wind profile: (A) wind measurements were obtained by hovering at specified altitudes for predetermined periods of time and taking the average for each altitude; and (B) wind measurement was conducted under constant vertical motion from the ground to up (and back), such that the vertical profile could be directly estimated from the instantaneous values. Although it is expected that the influence of instantaneous wind fluctuations will be reduced by considering the averages described in Protocol A, many hovering measurements at each altitude are required to obtain a profile with a high vertical resolution. This approach is, therefore, more time intensive, as many flights are required due to the limited battery capacity. In contrast, for Protocol B, although a continuous vertical profile is readily attainable, the vertical air flow generated by the drone propellers may interfere with the anemometer measurements.
Wind measurements at the Haruta site (elevation, 408 m) were conducted on 30–31 January 2018. The drone was flown vertically while remaining stationary along the horizontal plane and hovered for 3-min at multiple specified altitudes (Protocol A). Three to four flights were required to obtain a set of vertical profiles up to 1000 m agl. The vertical wind profiles collected were compared with values estimated by the mesoscale meteorological model of the Japan Meteorological Agency (JMA-MSM). The JMA-MSM, a routinely operated weather prediction model, includes grid point meteorological values of wind, temperature, and humidity, with a horizontal spatial resolution 10 km2 [24]. For comparison, the value of the grid closest to the flight point was extracted from the model results, as close to the initial flight time as possible.
Aerosol and volcanic gas concentration analyses were carried out at the Nabeyama site (elevation, 110 m) on 26 February 2020 and at the Arimura site (elevation, 85 m) on 27 February 2020. The drone, equipped with both the PM sensor and the volcanic gas detector, was flown according to both protocols mentioned above.
All observation sites in this study were selected from outside the exclusion zone within 2 km from the crater to ensure safety.

3. Results and Discussion

The drone flight information for the preliminary calibration analysis and field observations are summarized in Table 1.

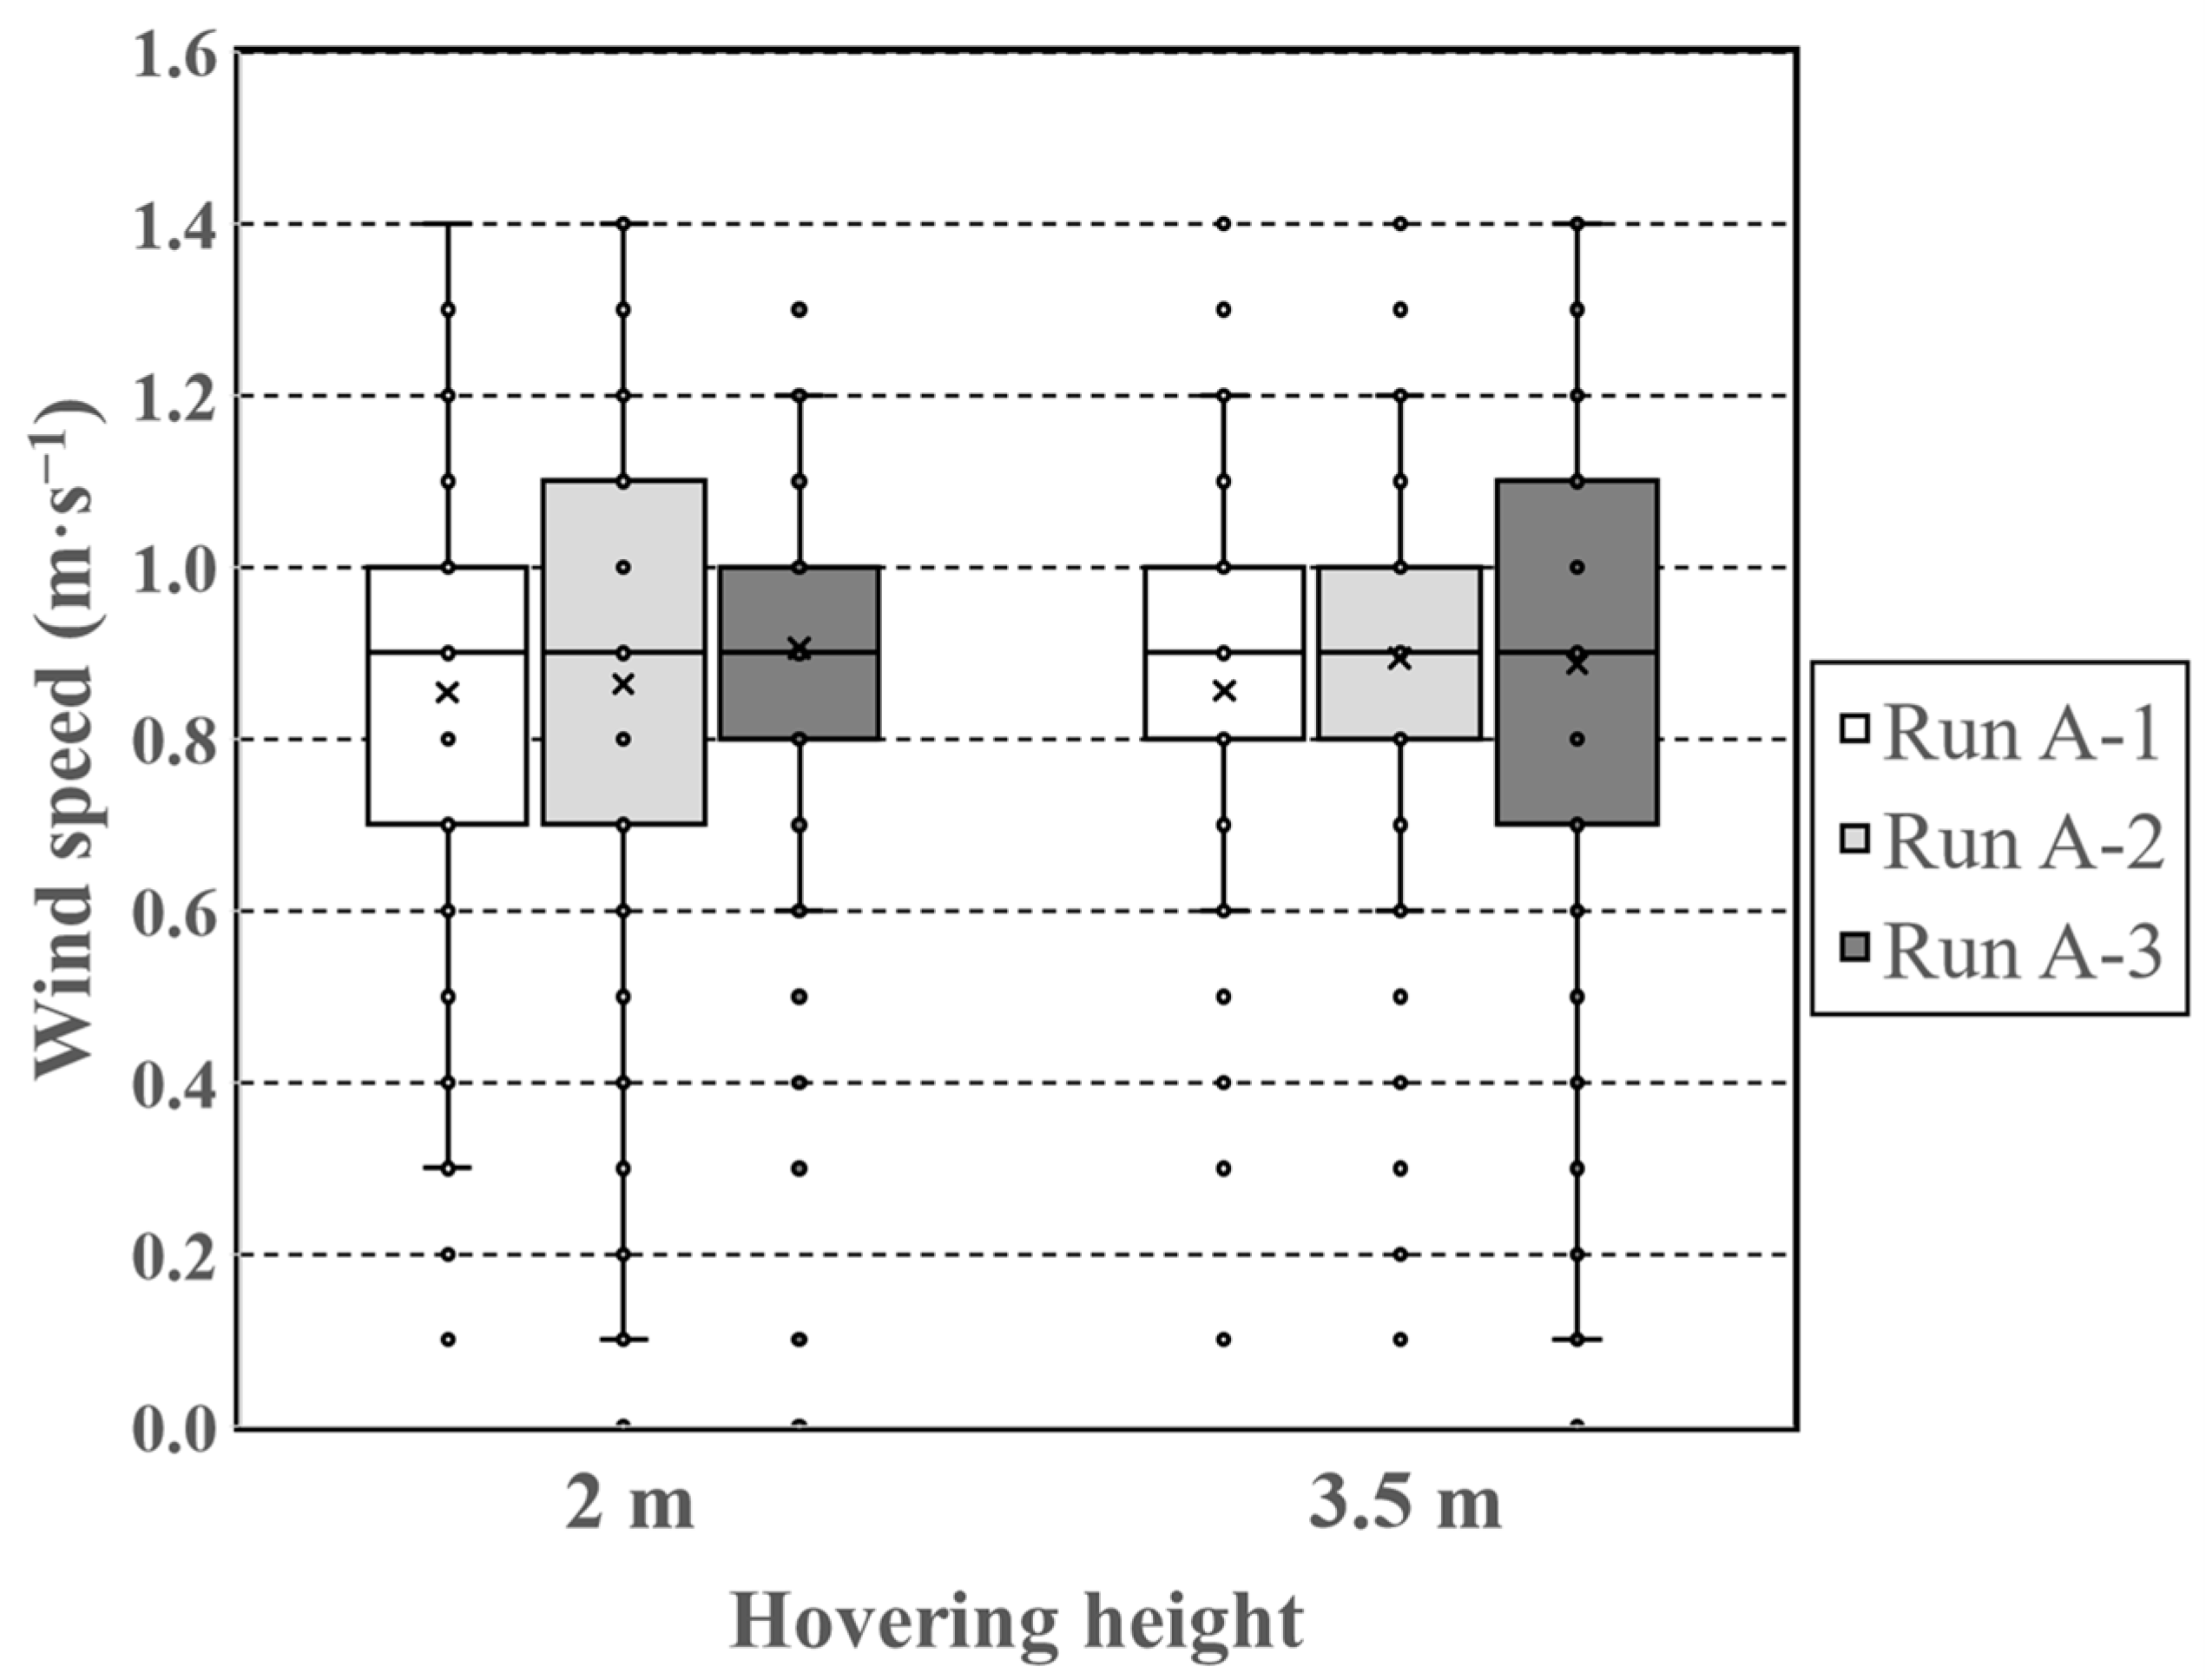
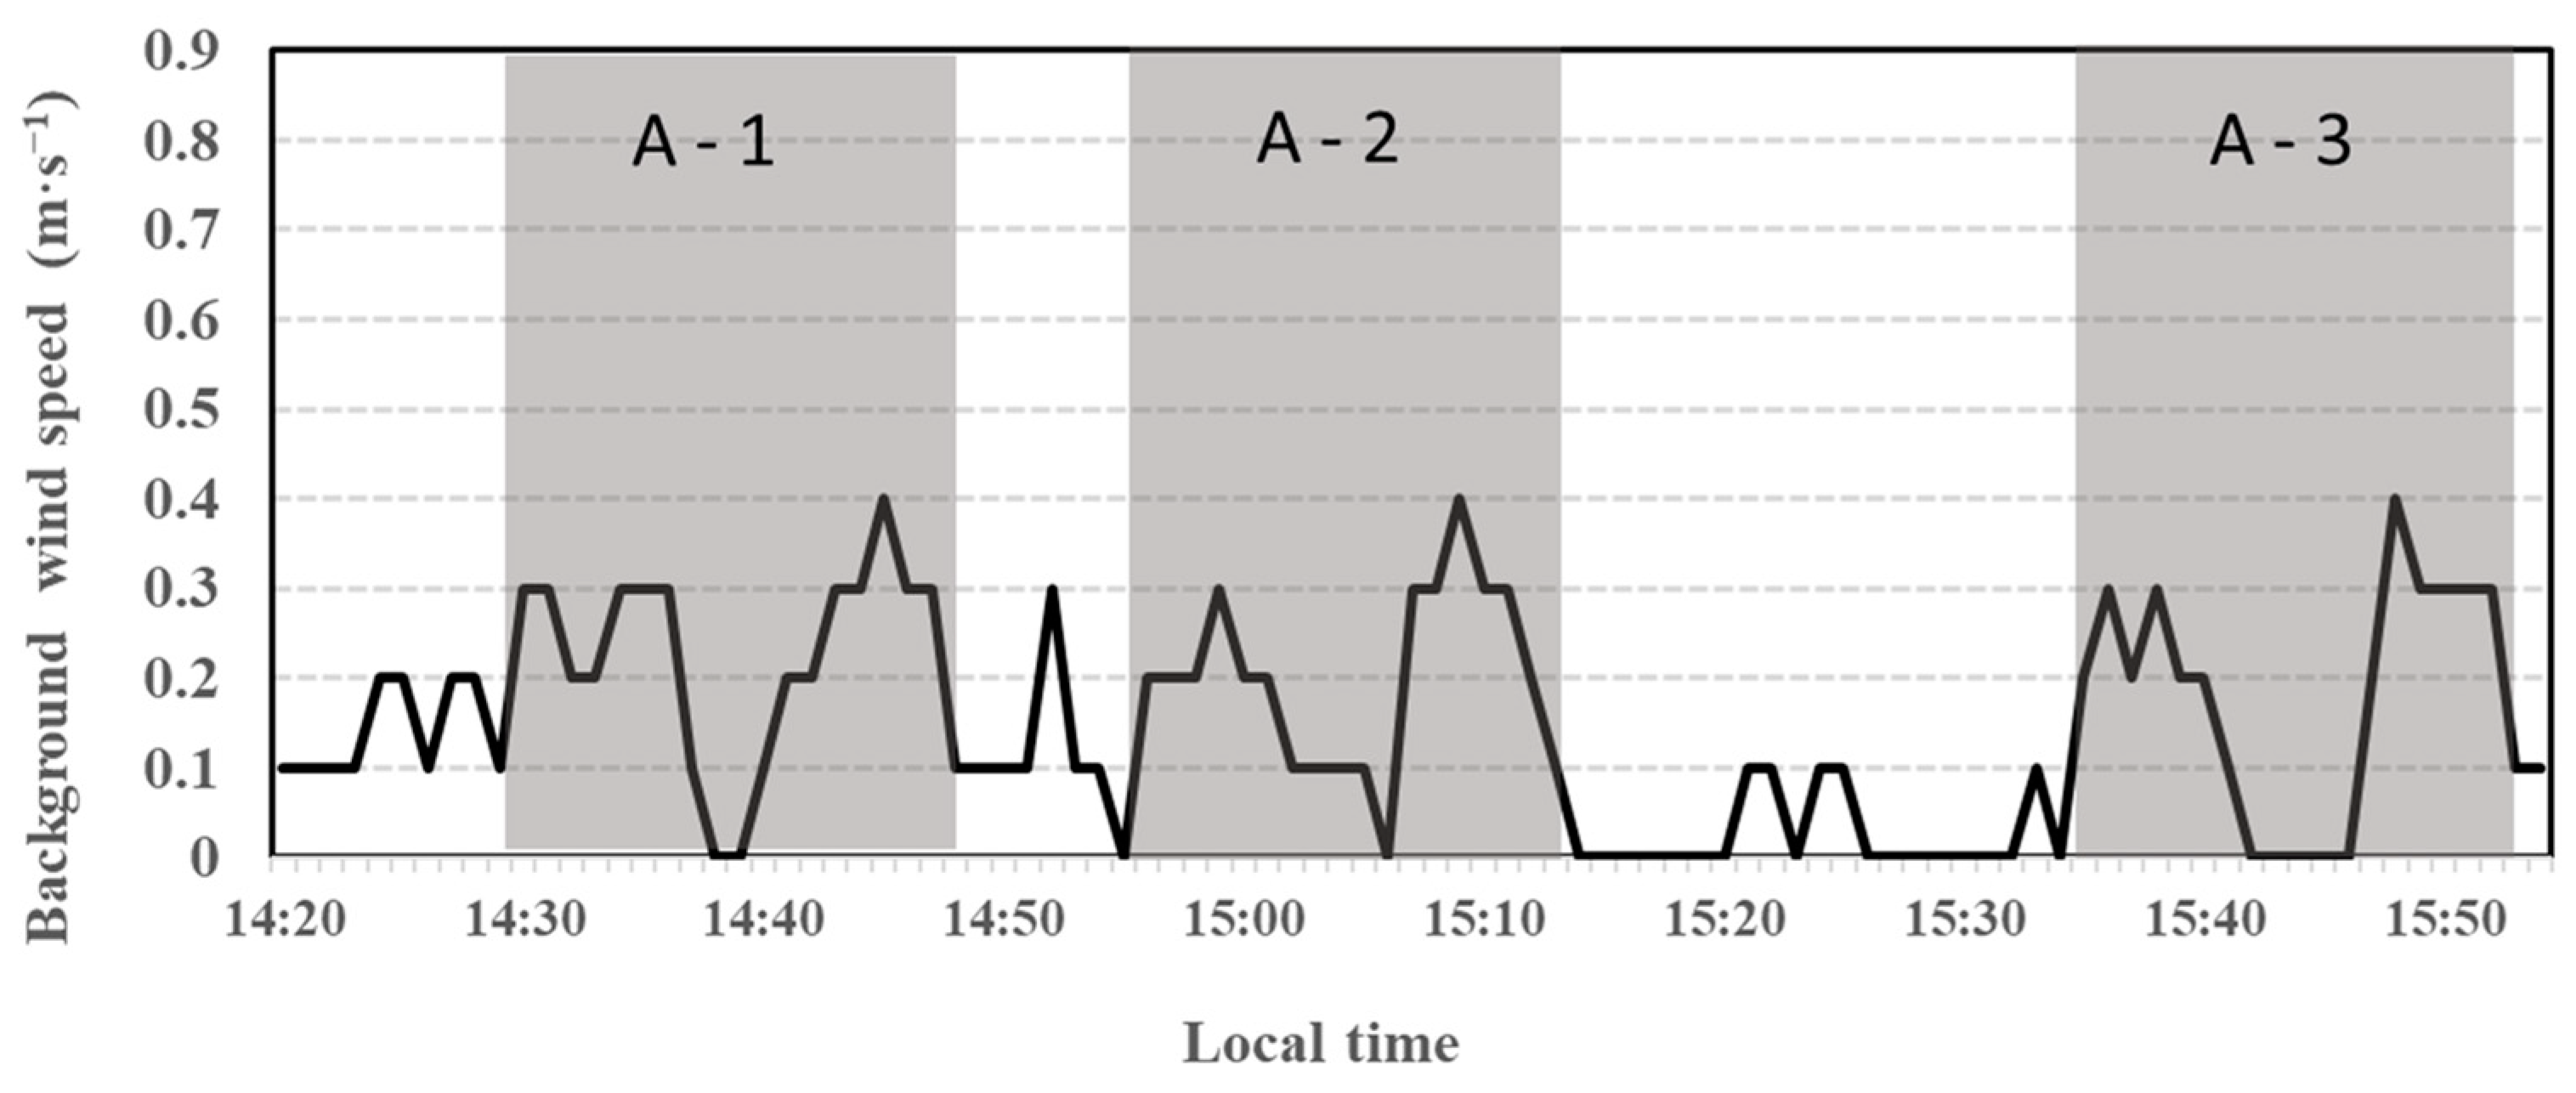
3.1. Preliminary Experiments

Hovering flights of 5-min at 2 m and 3.5 m agl were carried out three times for each altitude, and the wind speed values at 1-s intervals are shown as box plots in Figure 4. Although a maximum wind speed of approximately 1.4 m·s−1 was measured in each run, the minimum values were near zero. This relatively large variation suggests that the effect of propeller downwash is not constant, and it is necessary to account for the bias; however, the difference of the mean values and ranges of wind speed at each altitude were small, implying that the experimental reproducibility is good. Comparing across altitudes, the average measured wind speeds were 0.9 m·s−1 at each height, with no difference. During flights, an average ambient wind of 0.3 m·s−1 was measured in the room for each run (Figure 5). This indoor air movement was possibly caused by the drone, as the test site was an enclosed space, and the rotations of the propellers were the only known source of disturbance to the air flow. By using this wind speed as the background noise level and subtracting it from the drone-measured wind speed, a bias of +0.6 m·s−1 was derived as the propeller downwash effect during hovering. This is similar to the +0.5 m·s−1 bias obtained from comparative observations with outdoor meteorological towers in our previous study [2]. In this study, a bias of +0.5 m·s−1 was used to correct for drone-measured wind speed. Notably, these bias values are valid only for this precise combination of drone and anemometer, including the mounted position.

3.2. Field Observations

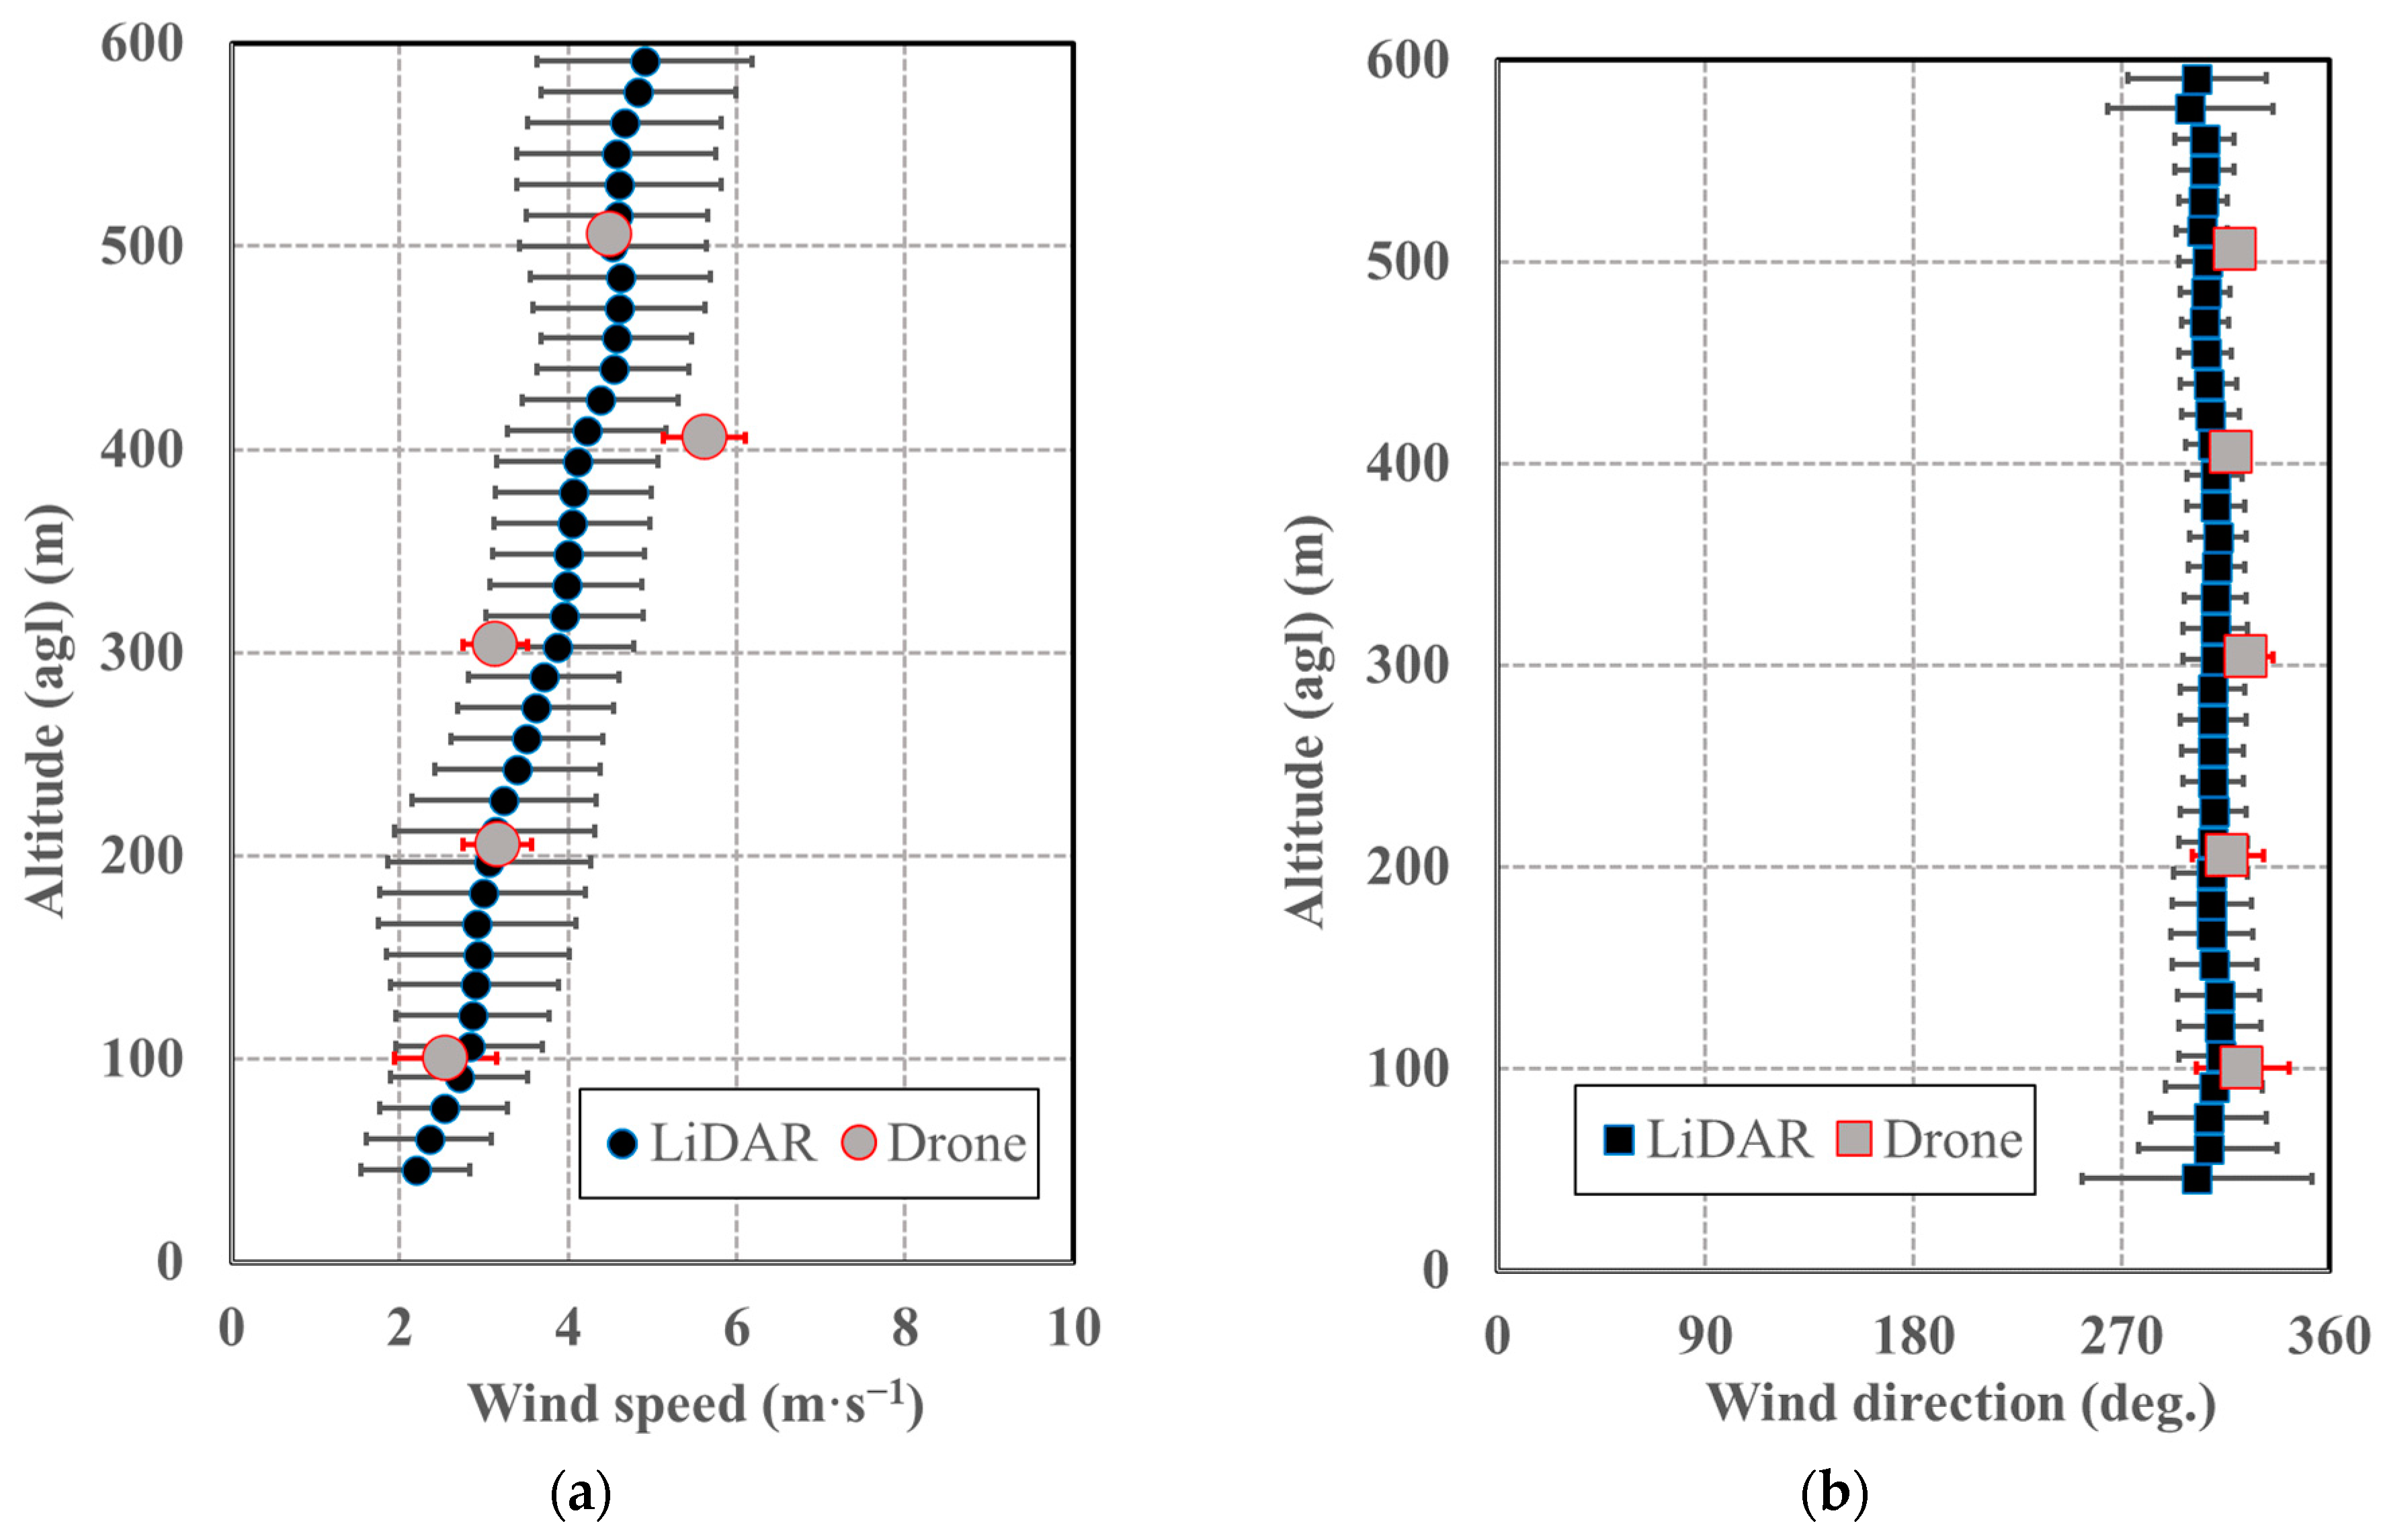
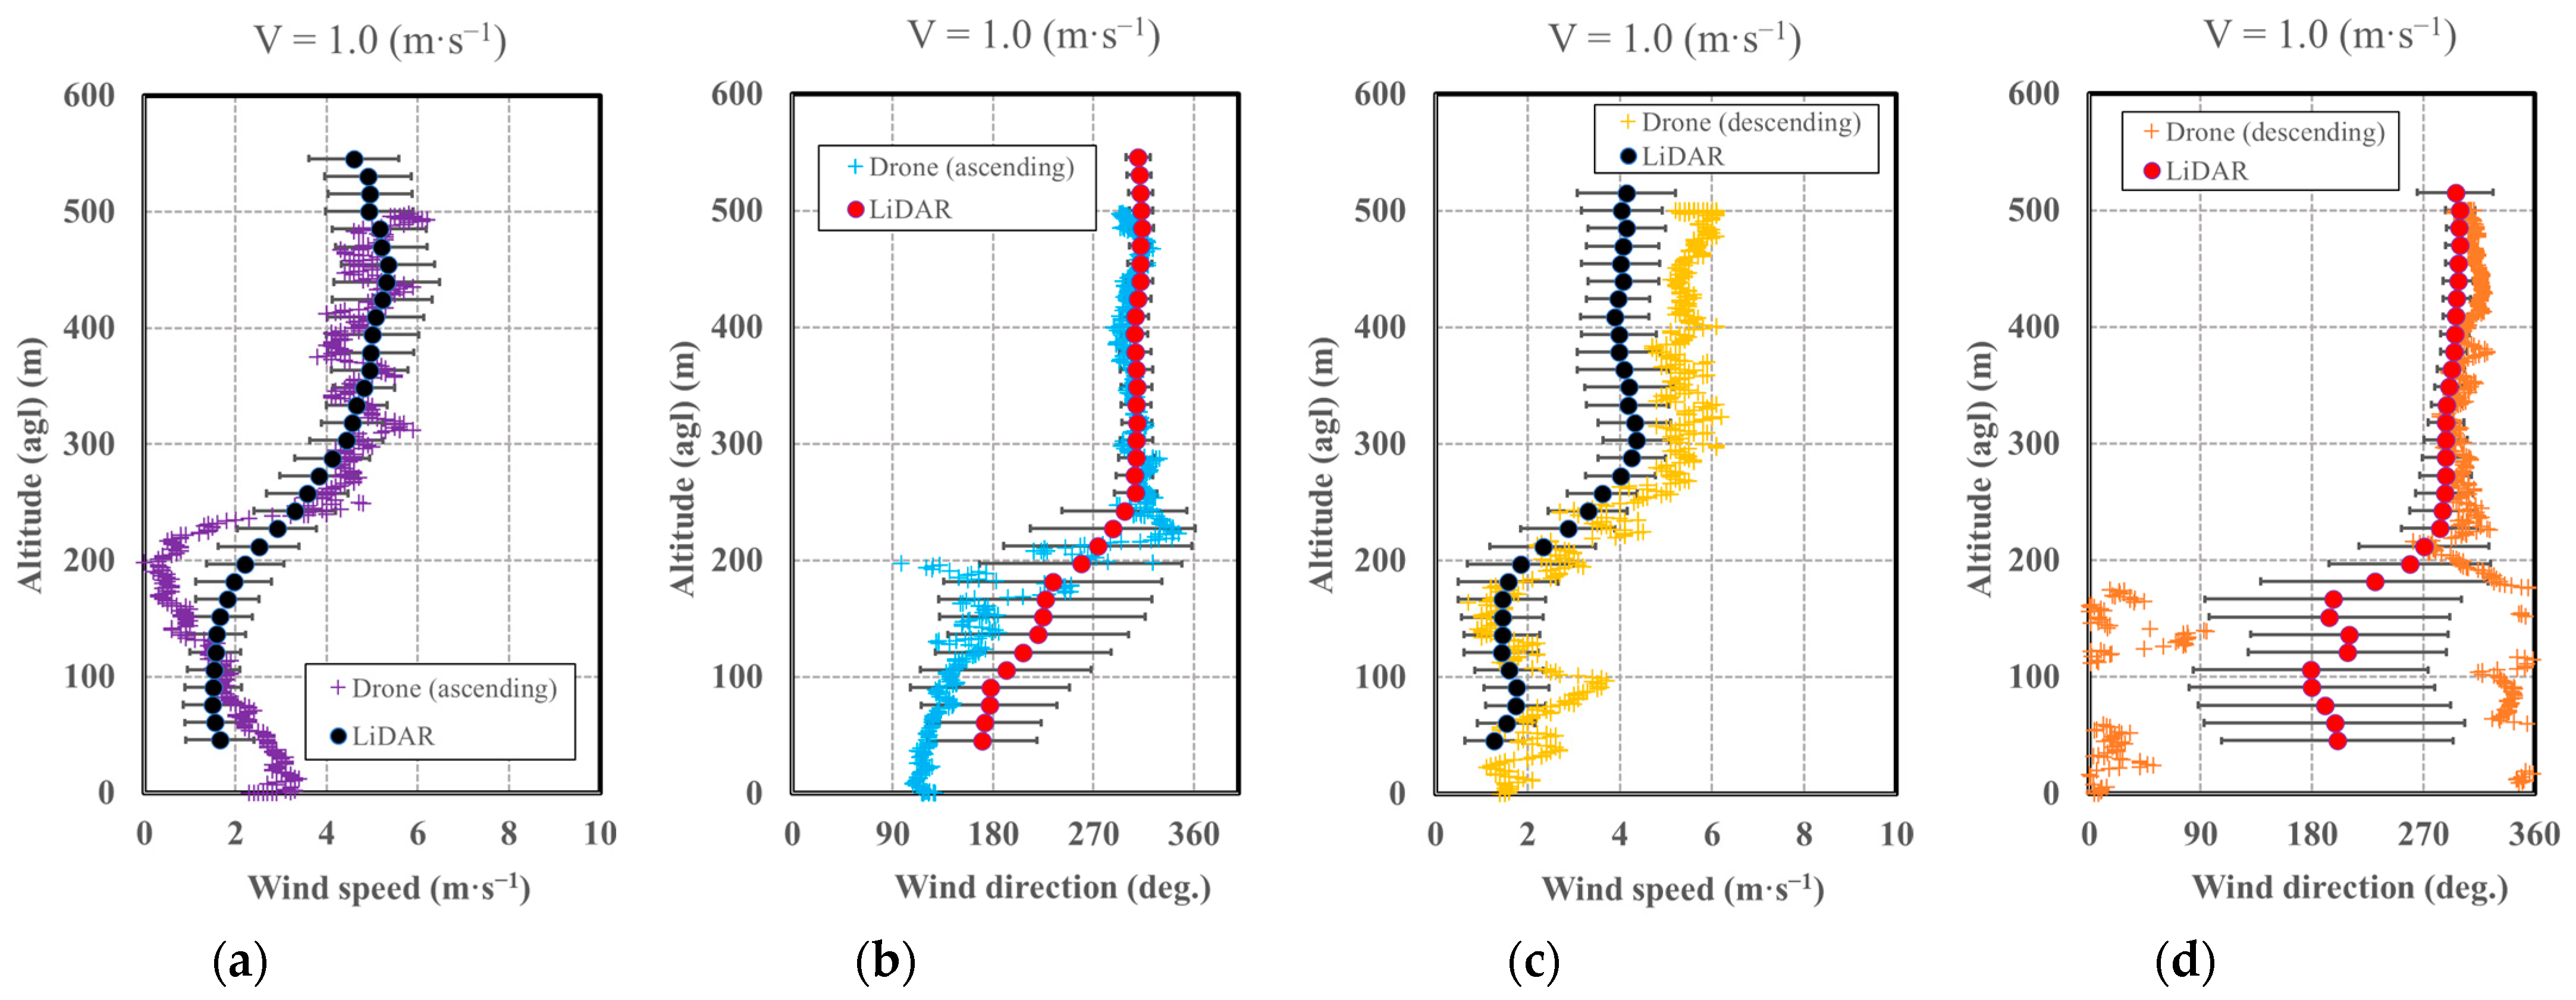
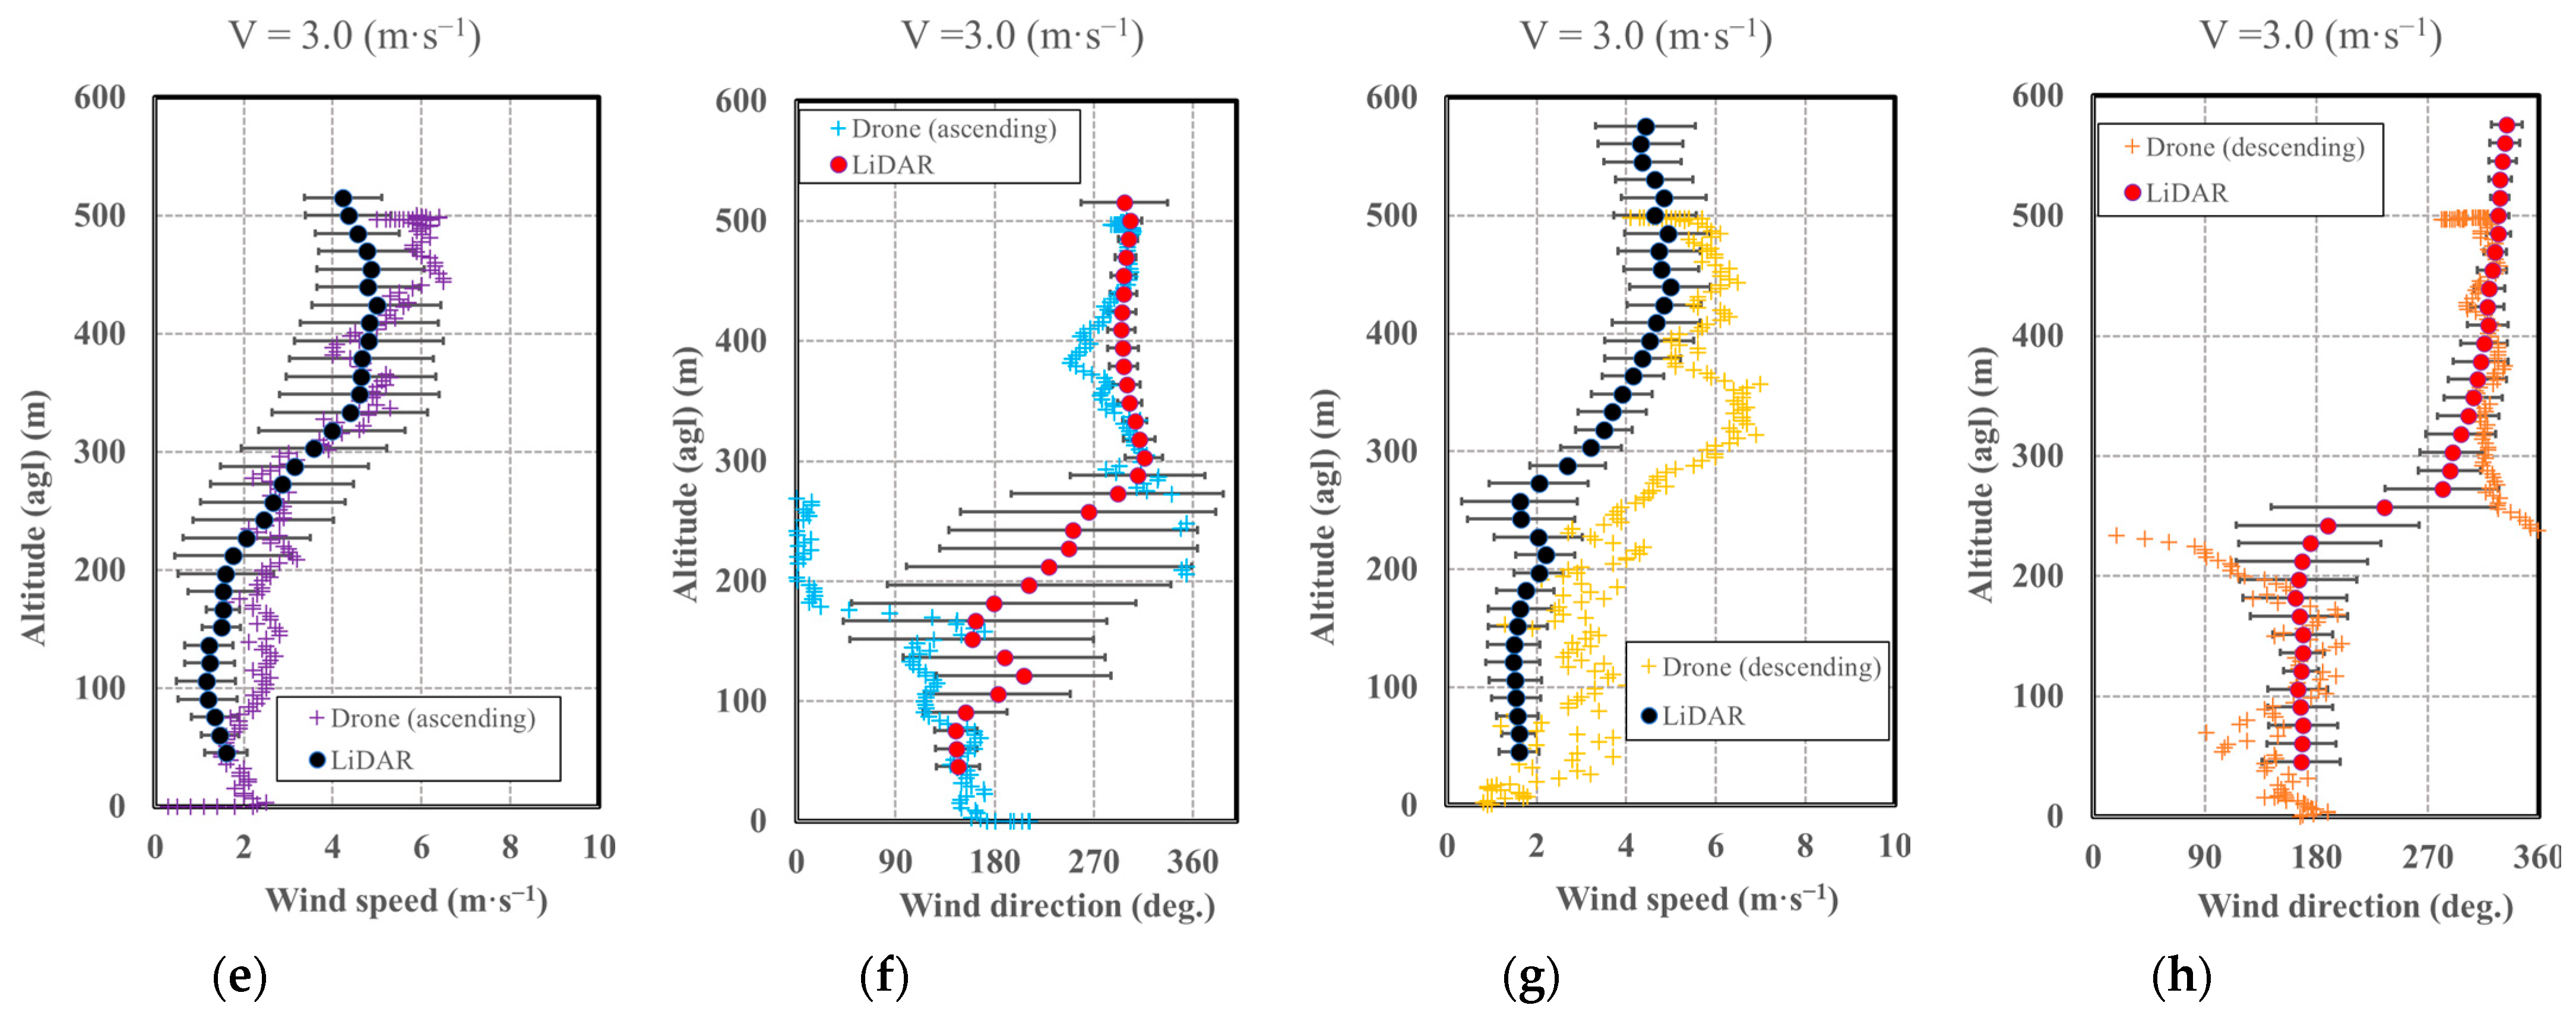
3.2.1. Comparison with LiDAR Observations

First, we compared the drone-measured wind direction and speed under Protocol A with the Doppler LiDAR results. The hovering altitudes were 500 m, 400 m, 300 m, 200 m, and 100 m agl, for 1-min at each altitude. The time series of drone-measured wind for each run to obtain vertical profiles are shown in Figure S1a in Supplementary Materials. Figure 6 shows the mean values measured by the drone and LiDAR at each altitude for Run B-4, and the error bars represent the standard deviation. LiDAR data were acquired simultaneously during drone flight. LiDAR-observed wind speed was weak overall, but gradually increased with altitude, reaching 4 m·s−1 at 500 m agl (Figure 6a). Comparatively, although the hovering measurements at an altitude of 400 m were slightly greater, the vertical profile of wind speed observed by the drone under Protocol A was nearly consistent with LiDAR-based measurements after taking the range of variability into consideration. As for the wind direction, both systems were in agreement with each other (Figure 6b).
Figure 7 shows the results of comparing the vertical profile of the wind speed and direction measured under constant vertical motion at a speed (V) of 1.0 m·s−1 and 3.0 m·s−1 (Protocol B). The plots of LiDAR show the average over the ascending and descending time periods of the drone, and the error bars represent the standard deviation during the same periods. LiDAR observations indicated that the wind was very weak up to 200 m agl (Figure 7a,c,e,g). The wind direction fluctuated greatly, but a northwest wind of approximately 5.0 m·s−1 prevailed ≥ 300 m agl for both speeds of vertical motion examined (Figure 7b,d,f,h). At V = 1.0 m·s−1, the results of the drone were in good agreement with the LiDAR observations, although the wind speed measured by the ascending drone was weak around 200 m agl (Figure 7a), and descending drone was overestimated around 100 m agl (Figure 7c). Regarding wind direction, the results were in close agreement above 200 m agl where the wind direction stabilized (Figure 7b,d). In contrast, with a vertical speed of 3.0 m·s−1, the wind speed profile measured by the ascending drone was nearly identical to the LiDAR observations (Figure 7e), but that measured by the descending drone was consistently overestimated (Figure 7g). For the wind direction, even when altitude was restricted to the stable range above 300 m, the ascending drone maintained low consistency with LiDAR measurements (Figure 7f). It is likely that the vertical airflow generated when the drone descended at 3.0 m·s−1 resulted in a positive bias to the wind speed measured due to updraft; nevertheless, the ascending results were consistent with the LiDAR measurements. Therefore, it is concluded that, even when the vertical moving speeds were the same, there was a difference in the intensity of the vertical airflow and wake vortex between the ascending and descending drone due to the fuselage structure. Another possible interpretation is that the degree of anemometer interference depends on the vertical airflow direction (updraft or downdraft) because of the characteristics of the sensor.
The results of the LiDAR comparison suggest that hovering the drone at specific altitudes or slow speed vertical operation can afford appropriate measurements of the vertical profile of the wind vector.

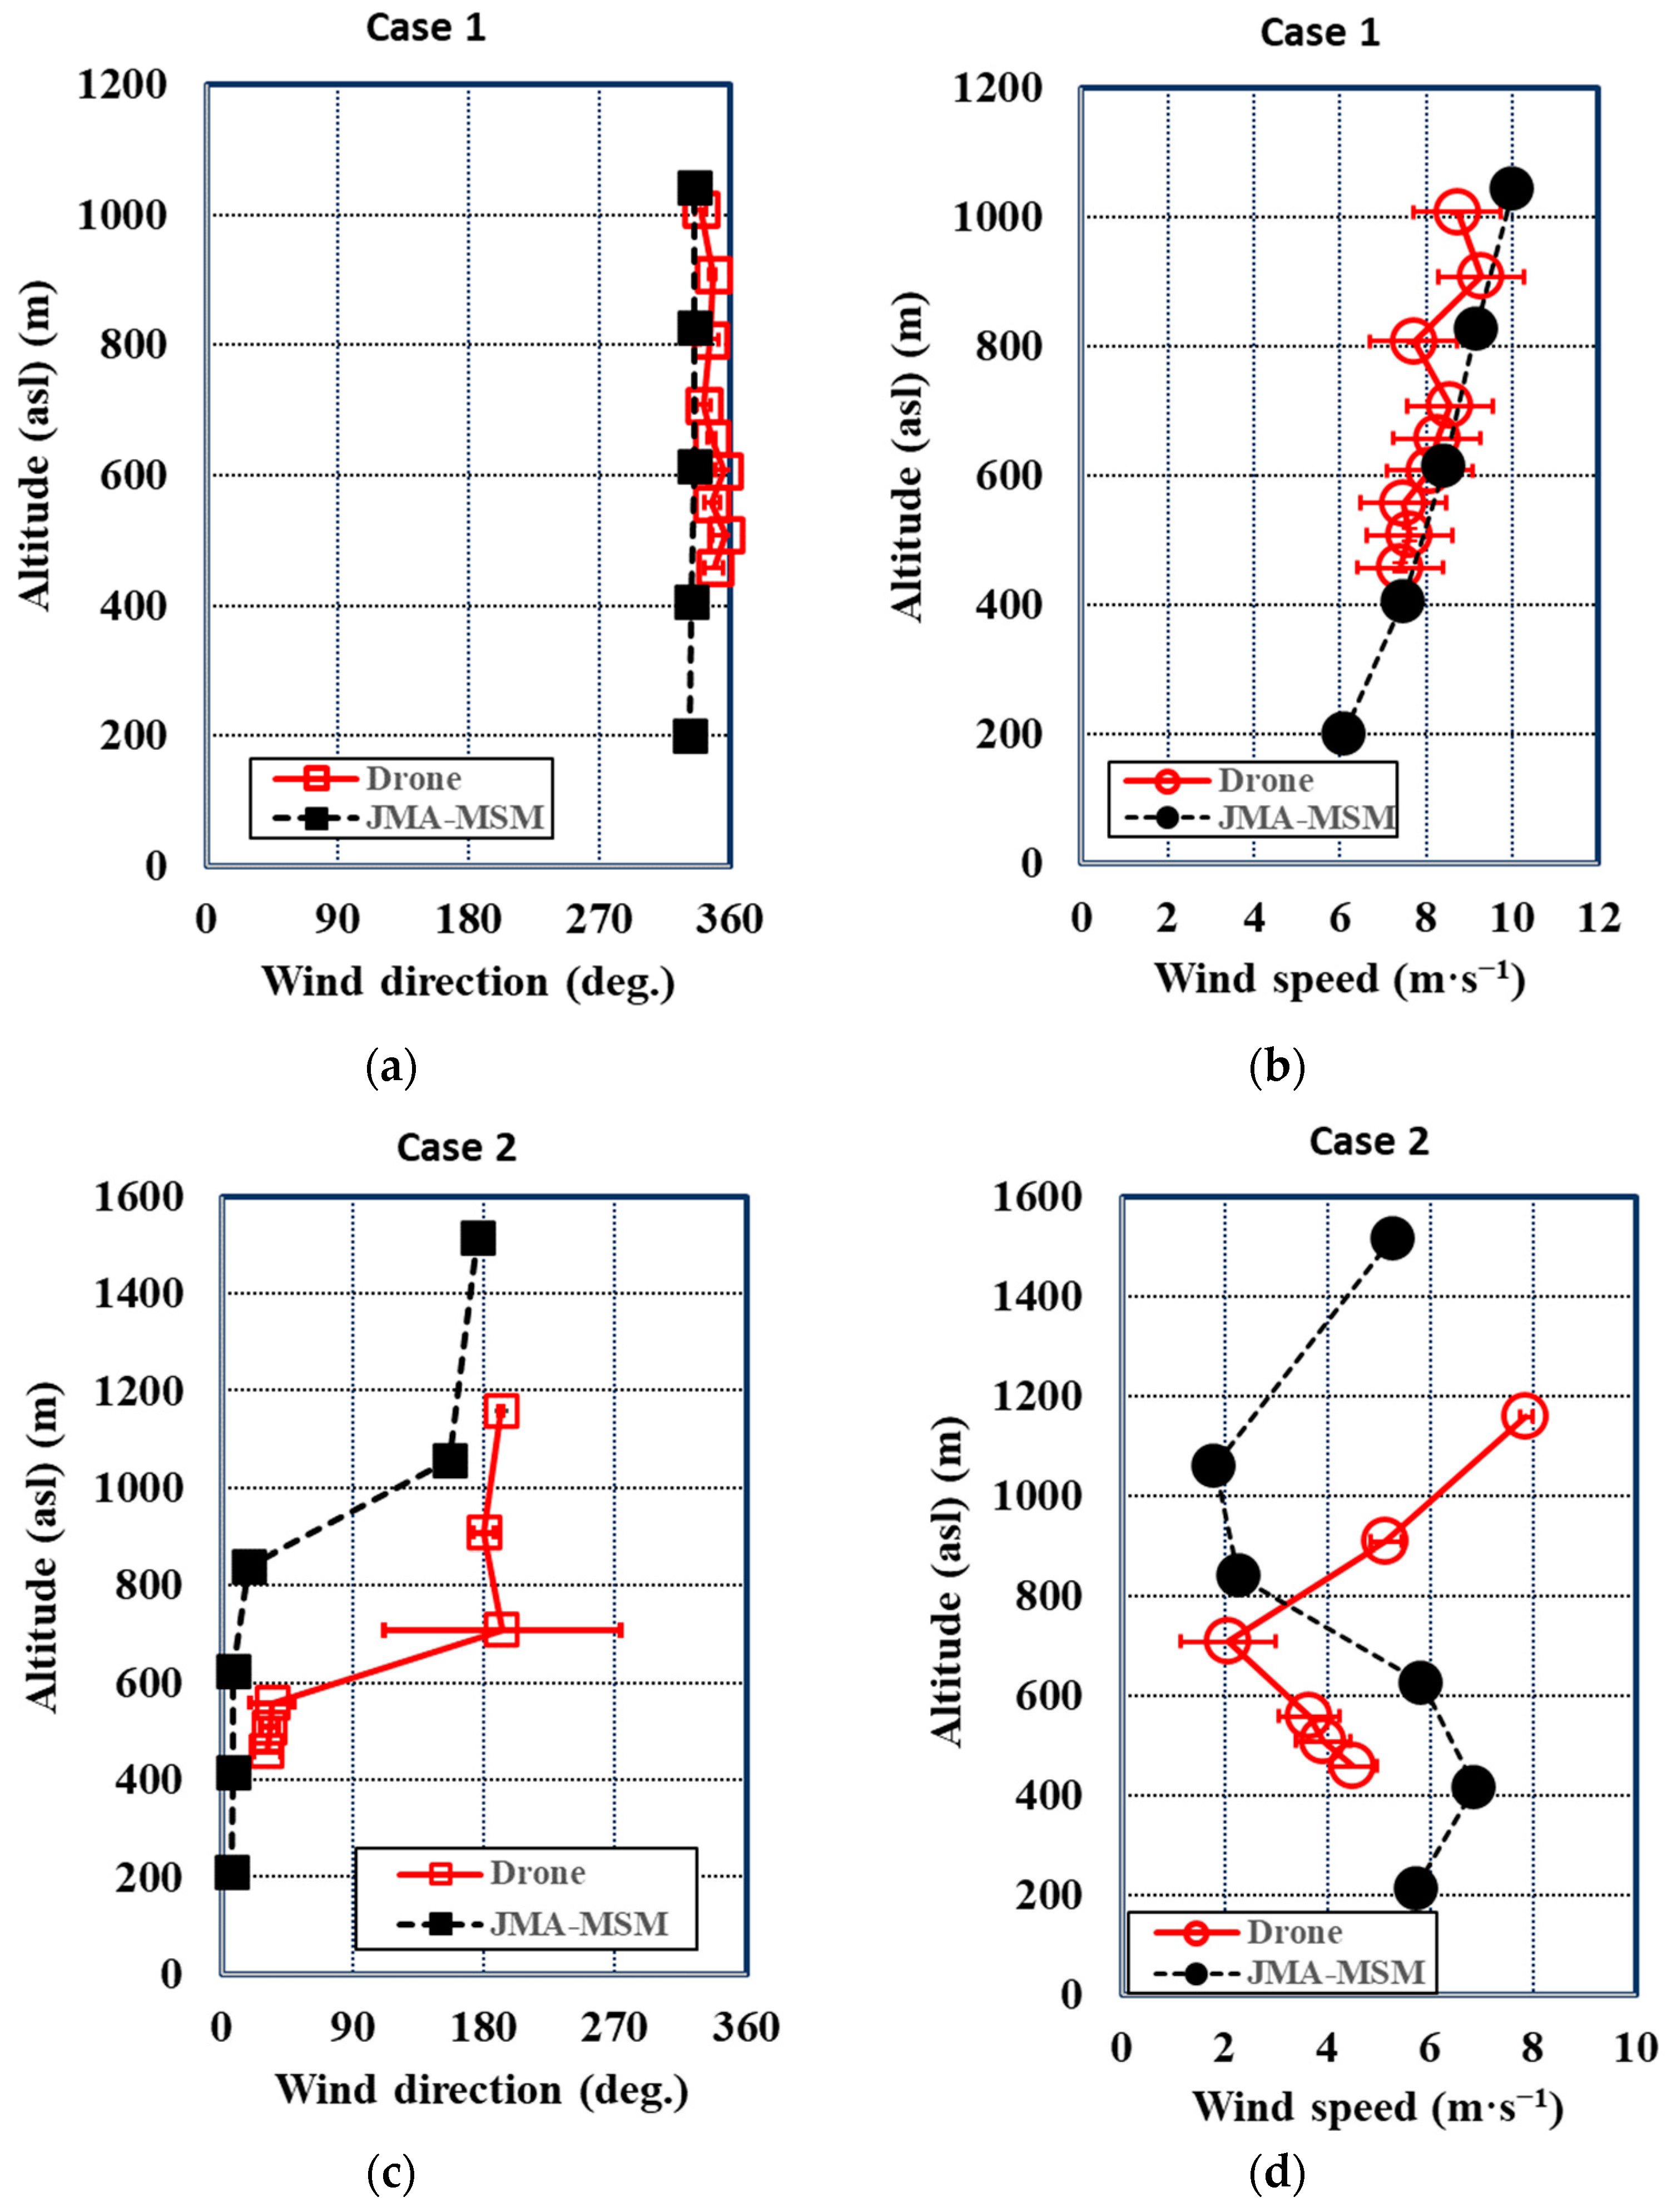
3.2.2. Objective Analysis Comparison

The time series of drone-measured wind for each run to obtain vertical profiles are shown in Figure S1b,c in the Supplementary Materials. The drone-measured vertical wind profiles were compared with the objective analysis values derived from JMA-MSM (Figure 8). In this figure, the altitude was measured as above sea level (asl), and the profiles obtained from the flights on 30 January 2018, were grouped as Case 1, while the profiles obtained from the 31 January 2018, as Case 2. In Case 1, the profiles showed a northerly wind direction across an altitude of 500–1050 m (Figure 8a), and the wind speed increased almost continuously from 7.0 to 9.0 m·s−1 (Figure 8b). A similar behavior was indicated by JMA-MSM across the same altitudes for the closest period attainable. In Case 2, the wind direction observed by the drone showed a strong vertical shear up to an altitude of 600–800 m, where northerly winds changed to southerly (Figure 8c) ones; in contrast, the profile of JMA-MSM showed an identical pattern, but the wind direction changed approximately 200 m higher (between 800 and 1000 m). With regard to wind speed, drone measurements gradually weakened from approximately 400 to 800 m and increased sharply above 800 m (Figure 8d); the profile of JMA-MSM displayed a similar pattern where wind speed decreased significantly from approximately 600 to 1000 m and increased at altitudes exceeding 1000 m, again an offset of approximately 200 m. The differences observed in Case 2 are presumably due to the drone measurements being simple point values, whereas those from JMA-MSM are spatially averaged results over the 10 km mesh. This factor is likely more prominent near volcanoes that have complex terrains.

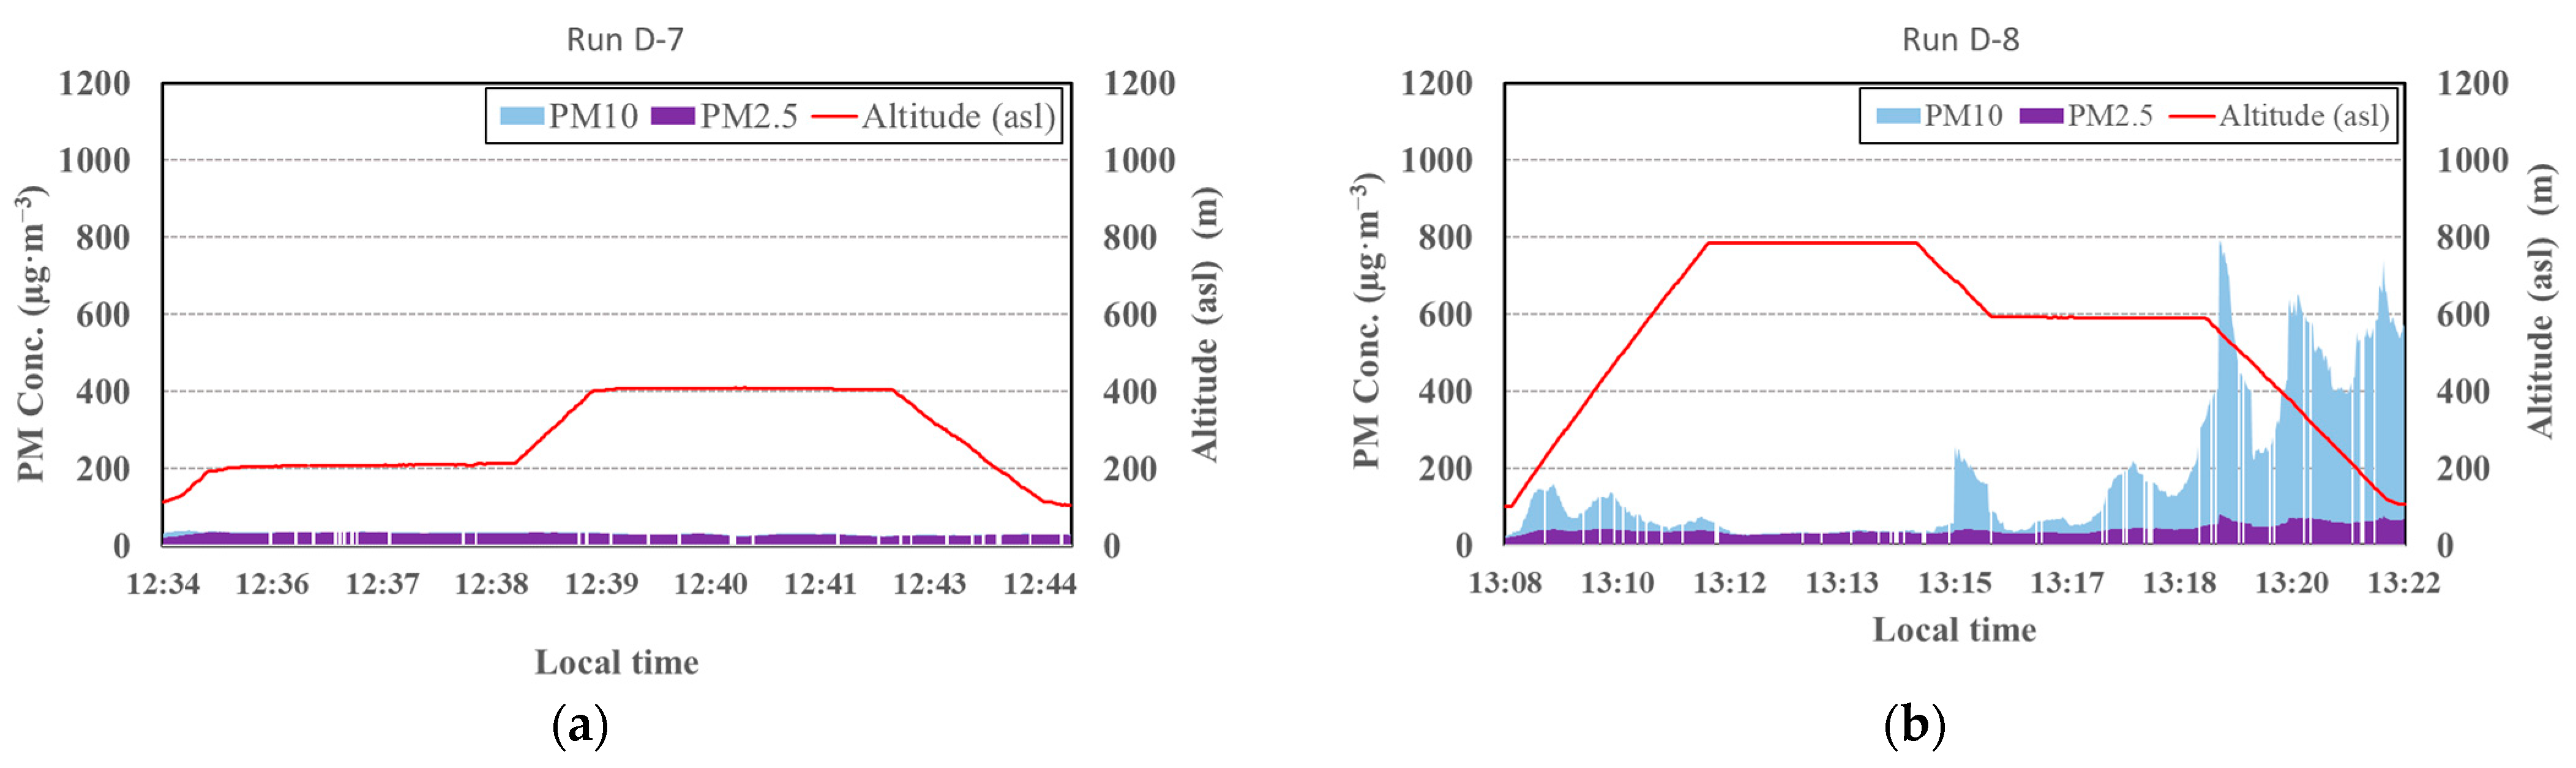
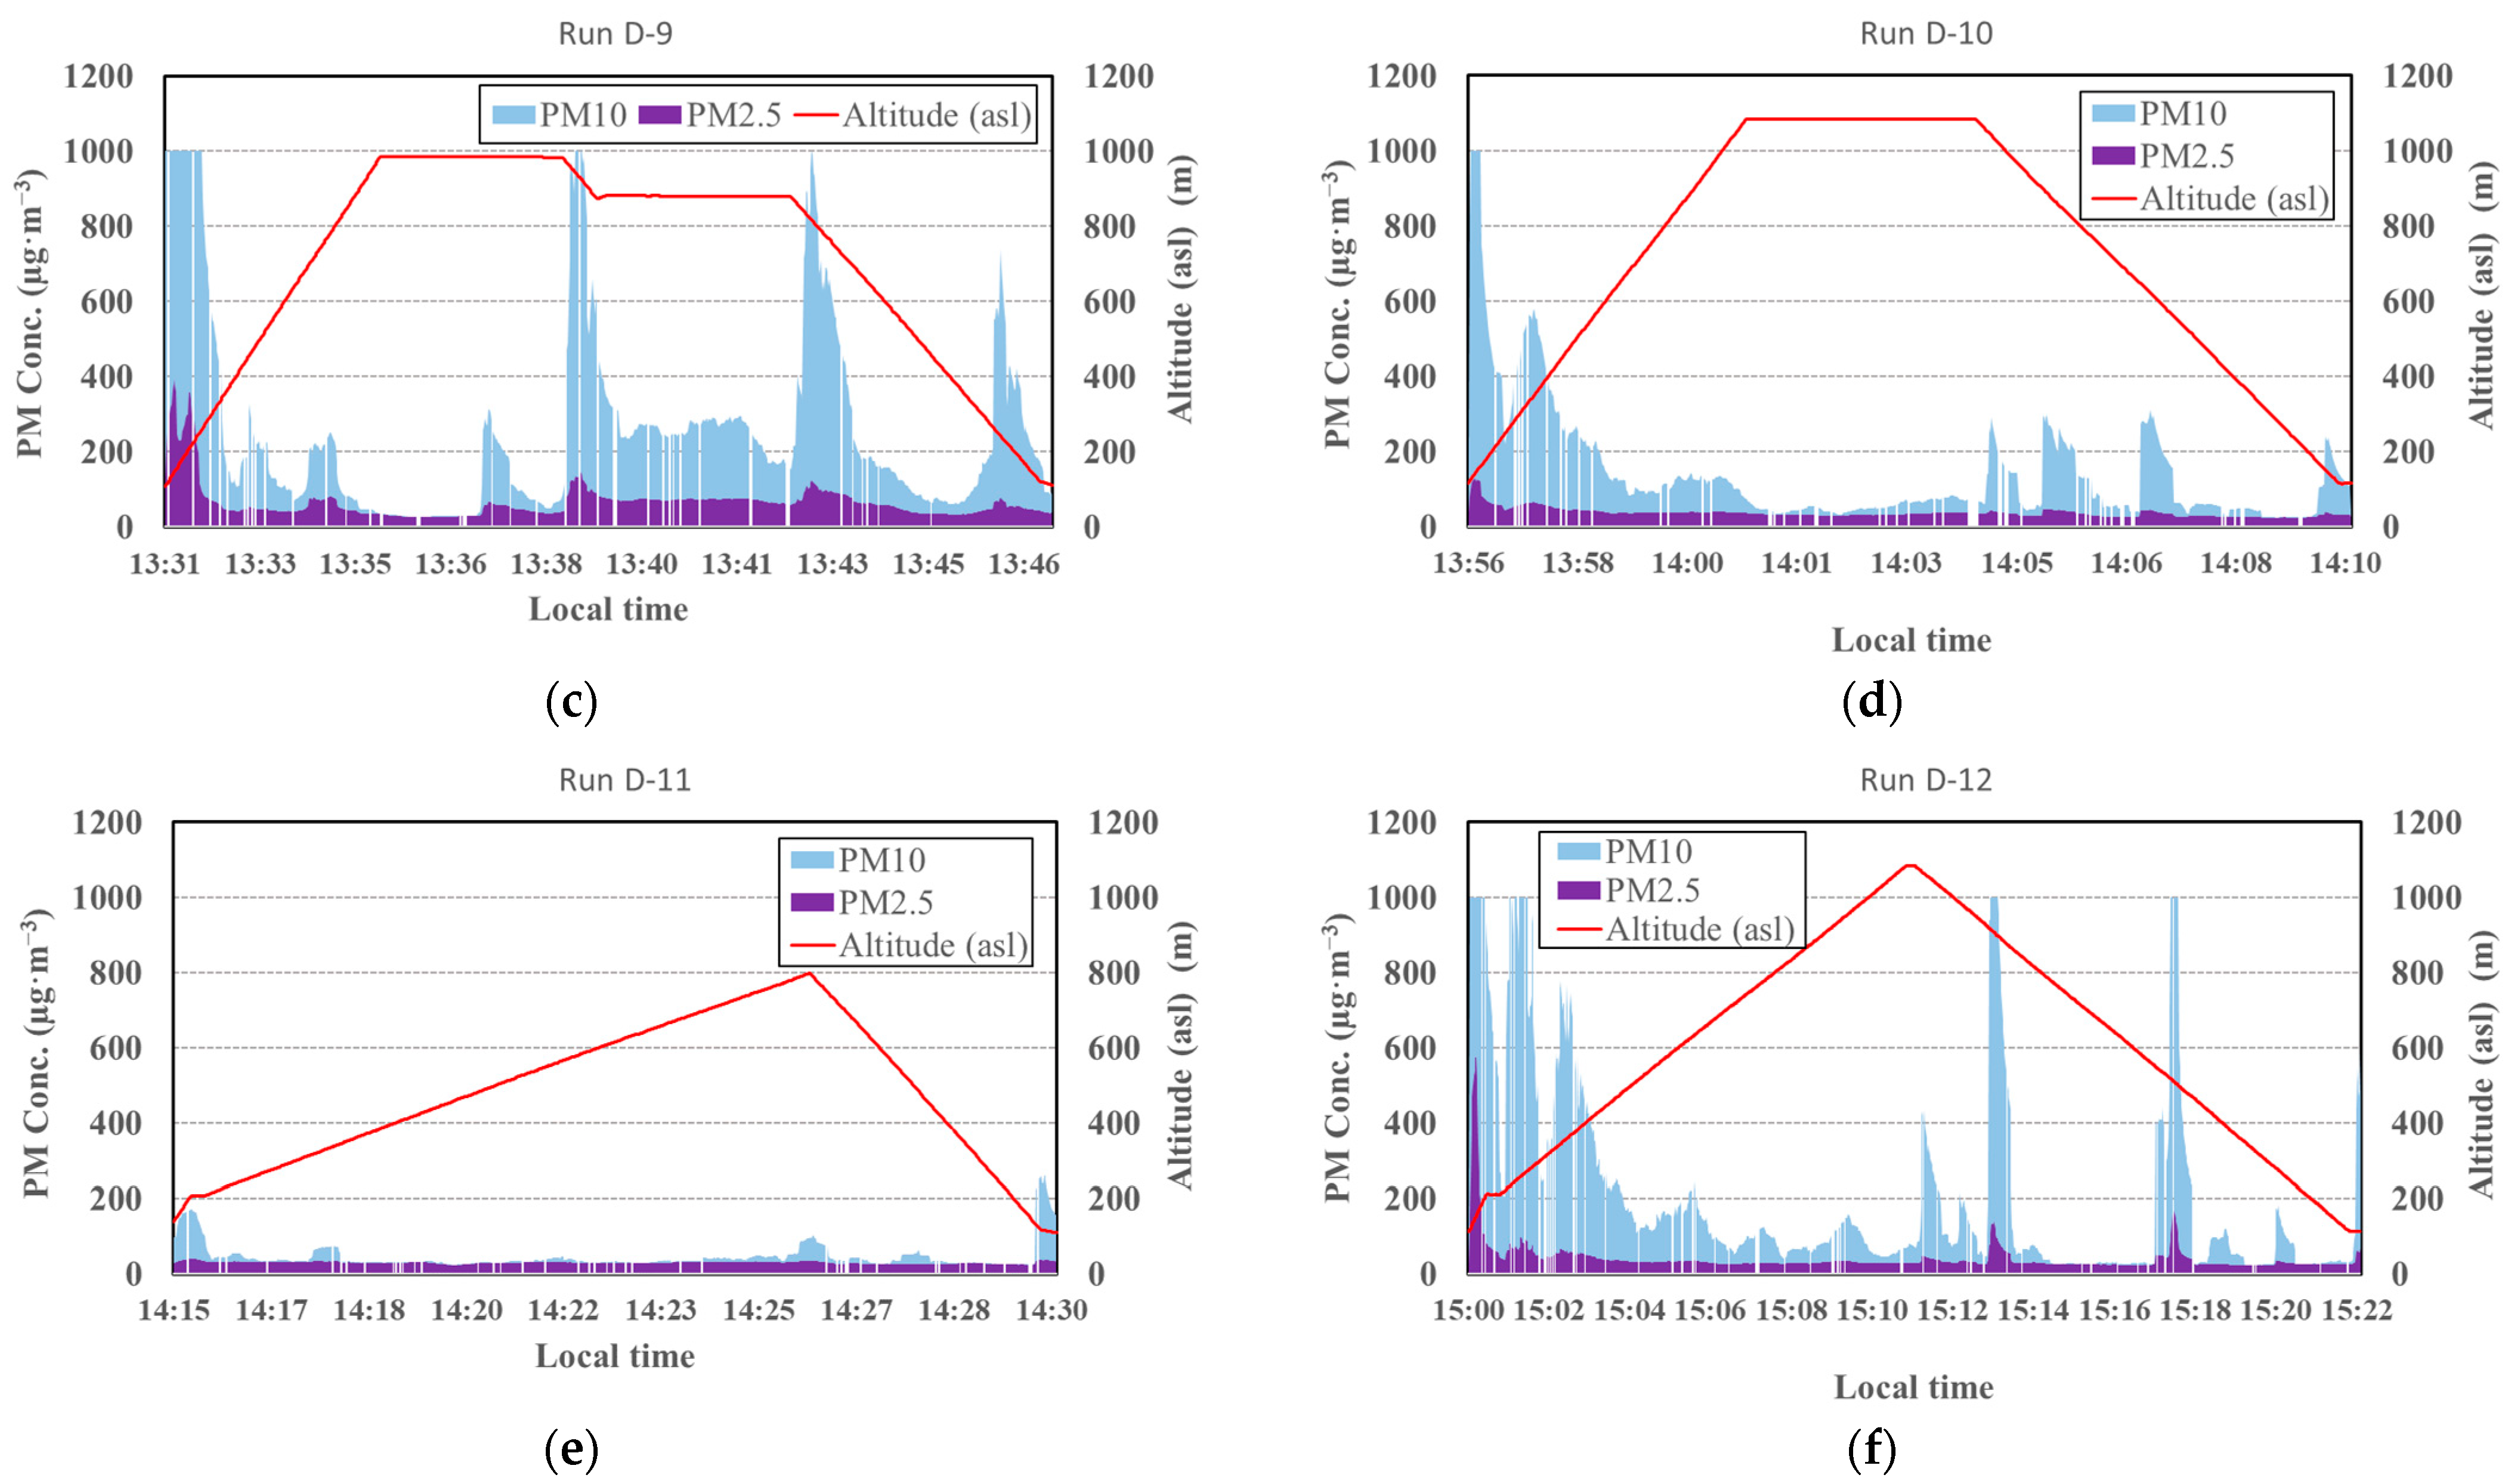
3.2.3. Aerosol Distributions

Table 2 lists the dates and times of Sakurajima eruptions or explosions, as observed by the Japan Meteorological Agency on 26–27 February 2020. Three eruptions occurred before the start of observations on 26 February 2020 (E2, E3, and E4), whereas two explosions occurred during the period of observation on 27 February 2020 (E5 and E6).
Although the eruptions on 26 February 2020 occurred slightly before the start of observations, observed PM (PM10 and PM2.5) concentrations were nearly constant across a range of 30–60 µg·m−3 among Runs D-1 to D-6 (Figure 9). The drone was operated under Protocol A in these runs, with a 3-min hovering period at each altitude. The observed variations in PM concentrations were relatively small across all altitudes during the periods of hovering and movement for each run. These results indicate that the vertical distribution of PM concentration was nearly uniform from the ground up to 1100 m (asl), with minimal temporal variability. Additionally, as the concentrations of PM10 and PM2.5 were nearly identical, the majority of aerosols were fine particles. The concentrations of ground-level PM2.5 and suspended particulate matter (SPM; a standard unique to Japan comparable to PM10) observed at Kagoshima City Hall, an Atmospheric Environmental Regional Observation System (AEROS) station located approximately 10 km west of the Minamidake crater, were both 18 µg·m−3 at 13:00 on 26 February 2020. These observed concentrations were lower than the measurements from the atmospheric boundary layer but consistent with the finding that fine particles were dominant; this confirmed that most of the drone-measured PM were aerosols unrelated to volcano, mainly anthropogenic pollutants, and not volcanic tephra. It is probable that the absence of volcanic tephra was related to wind direction, moving the plume away from the observation site. It was confirmed by the disdrometers deployed in Sakurajima that the drone was not located downwind of the crater, which was the emission source (Figure S2 in Supplementary Materials).
Two explosions occurred during drone observation on 27 February 2020. It was possible to visually identify the behavior of an intermittent plume and ash fall passing over the observation site (Photo S1 in Supplementary Materials). Figure 10 shows the time series variations for PM concentrations during each run on 27 February 2020, where Runs D-7 to D-10 were conducted under Protocol A and Runs D-11 and D-12 were conducted under Protocol B. Run D-7 was conducted before the explosions, and it confirmed that the PM concentrations were initially as low as the background levels (Figure 10a). In contrast, peak concentrations appeared after Run D-8 (Figure 10b–f) and were tens of times higher than the background levels, reaching the maximum detection limit of the PM sensor (>1000 µg·m−3). However, maximum PM concentration levels were measured at several different instances after the explosions; these levels subsided within a few minutes, even at the same altitude. A primary driver of this sporadic pattern observed is the uneven output rate of the volcanic eruption, which is normal for the Sakurajima crater [25]. Another possible reason was the unstable wind around the volcano, which altered the direction of the plume every minute or so. An additional, notable finding was that, at peak levels, the increase in PM10 concentration was greater than that in PM2.5 concentration, implying that the contribution of coarse particles was dominant in the volcanic ash plumes. This feature has also been reported in a previous volcanic survey on Sakurajima, for which a manned airplane was employed [26].
In the observation of volcanic gases on 26–27 February 2020, both SO2 and H2S concentrations were below the detection limits of the sensors (<0.1 ppm) for all runs. The reason for this may be that the gas plume did not pass through the observation sites or the amount of gas released was small.

4. Conclusions and Future Perspectives

The feasibility of drone-based measurements as a new platform for volcanic observations was evaluated in this study. We established a method for the in situ measurement of wind and aerosol and gas concentrations around a volcano to advance modeling efforts of the diffusion of tephra. In the field observations conducted at Sakurajima, vertical profiles from drone-derived measurements taken at a vertical speed of 1.0 m·s−1 (upward and downward), and averaged values taken while hovering, were consistent with the profiles derived from Doppler LiDAR data. Contrarily, the profiles measured at a speed of 3.0 m·s−1 deviated strongly from the LiDAR measurements. These results suggest that appropriate drone measurements of the vertical wind profile should be obtained while hovering or moving vertically at slow speeds. In the field observations, the drone succeeded in accurately capturing the vertical shear of the wind speed and direction. Observations of aerosols around the volcano revealed high concentration peaks of PM appearing intermittently during or after explosions, across all altitudes analyzed at the downwind site. Furthermore, the concentration of coarse particles increased significantly during these spikes.
At present, atmospheric observation by drones is not suitable for long-term or stationary observation due to battery capacity limitations, but it is advantageous for its agility and capability of in situ measurements. Therefore, it is recommended that drones should be used complementarily with remote sensing instruments such as Doppler LiDAR or differential optical absorption spectroscopy, which are monitored continuously. Apart from the restrictions imposed by relevant laws and regulations, drones can be deployed rapidly and are easily transportable, making them effective for temporary observations during eruptions and spot observations over complex terrains.
The drone used in this study cannot withstand wind speeds exceeding 15 m·s−1, nor is it water resistant; thus, data under severe weather conditions cannot be obtained. These limitations are significant drawbacks for volcanic observations, and we plan to use a more robust drone in the future. In this study, observation data were collected offline, but for flight safety, it is desirable to be able to monitor wind speed and air quality information in real time. To this end, we are currently working on the development of a telemetry system for data observation. Increasing the flight time is also indispensable for full-scale volcanic observations; this would enable not only vertical distribution by drones but also acquisition of three-dimensional data with the inclusion of the horizontal direction. As a result, the drone could also be used to estimate the total gas volumes released.

Supplementary Materials

The following are available online at https://www.mdpi.com/2073-4433/12/3/376/s1, Table S1. Main specification of Doppler LiDAR (DIABREZZA_W; Mitsubishi Electric Corporation). Figure S1: Time series of drone-measured wind for each run to obtain vertical profiles. Figure S2: Particle concentrations observed by disdrometers deployed Sakurajima on 26–27 February 2020. Photo S1. (a) Rising plume of the eruption (E6) on 27 February 2020; (b) volcanic ash that fell on the car after the eruption (E6).

Author Contributions

Conceptualization, K.S. and M.I. (Minoru Inoue); Methodology, K.S.; Validation, T.S.; Formal analysis, K.S.; Investigation, K.S., T.S., M.I. (Minoru Inoue); Resources, K.S., M.I. (Minoru Inoue); Data curation, K.S., T.S.; Writing—original draft preparation, K.S.; Writing—review and editing, T.S., M.I. (Minoru Inoue), and M.I. (Masato Iguchi); Visualization, K.S. and T.S.; Supervision, M.I. (Masato Iguchi); Project administration, M.I. (Masato Iguchi); Funding acquisition, M.I. (Masato Iguchi). All authors have read and agreed to the published version of the manuscript.

Funding

This study was partially supported by the Integrated Program for Next Generation Volcano Research and Human Resource Development of the Ministry of Education, Culture, Sports, Science, and Technology (MEXT), Japan. This work was also supported by the Japan Society for the Promotion of Science (JSPS) KAKENHI, Grant Number 18K11635.

Institutional Review Board Statement

Not applicable.

Informed Consent Statement

Not applicable.

Data Availability Statement

The data presented in this study are available on request to the corresponding author.

Acknowledgments

We thank Takashi Maruyama for providing the wind data observed by the Doppler LiDAR at Sakurajima. The authors also would like to acknowledge the ReNA team of the Japan Weather Association for supporting our indoor experiments and field observations.

Conflicts of Interest

The authors declare no conflict of interest.

References

  1. Barbieri, L.; Kral, S.T.; Bailey, S.C.C.; Frazier, A.E.; Jacob, J.D.; Reuder, J.; Brus, D.; Chilson, P.B.; Crick, C.; Detweiler, C.; et al. Intercomparison of small unmanned aircraft system (sUAS) measurements for atmospheric science during the LAPSE-RATE campaign. Sensors 2019, 19, 2179. [Google Scholar] [CrossRef] [PubMed] [Green Version]
  2. Shimura, T.; Inoue, M.; Tsujimoto, H.; Sasaki, K.; Iguchi, M. Estimation of wind vector profile using a hexarotor unmanned aerial vehicle and its application to meteorological observations up to 1000 m above the surface. J. Atmos. Ocean. Technol. 2018, 35, 1621–1631. [Google Scholar] [CrossRef]
  3. Palomaki, R.T.; Rose, N.T.; van den Bossche, M.; Sherman, T.J.; De Wekker, S.F. Wind estimation in the lower atmosphere using multirotor aircraft. J. Atmos. Ocean. Technol. 2017, 34, 1183–1191. [Google Scholar] [CrossRef]
  4. Neumann, P.P.; Bartholmai, M. Real-time wind estimation on a micro unmanned aerial vehicle using its inertial measurement unit. Sens. Actuators 2015, 235A, 300–310. [Google Scholar] [CrossRef]
  5. Brosy, C.; Krampf, K.; Zeeman, M.; Wolf, B.; Junkerman, W.; Schäfer, K.; Emels, S.; Kunstmann, H. Simultaneous multicopter-based air sampling and sensing of meteorological variables. Atmos. Meas. Tech. 2017, 10, 2773–2784. [Google Scholar] [CrossRef] [Green Version]
  6. Aurell, J.; Mitchell, W.; Chirayath, V.; Jonsson, J.; Tabor, D.; Gullett, B. Field determination of multipollutant, open area combustion source emission factors with a hexacopter unmanned aerial vehicle. Atmos. Environ. 2017, 166, 433–440. [Google Scholar] [CrossRef] [PubMed]
  7. Anand, A.; Wei, P.; Gali, N.K.; Sun, L.; Yang, F.; Westerdahl, D.; Zhang, Q.; Deng, Z.; Wang, Y.; Liu, D.; et al. Protocol development for real-time ship fuel sulfur content determination using drone-based plume sniffing microsensor system. Sci. Total Environ. 2020, 744, 140885. [Google Scholar] [CrossRef]
  8. Villa, T.F.; Brown, R.A.; Jayaratne, E.R.; Gonzalez, L.F.; Morawska, L.; Ristovski, Z.D. Characterization of the particle emission from a ship operating at sea using an unmanned aerial vehicle. Atmos. Meas. Tech. 2019, 12, 691–702. [Google Scholar] [CrossRef]
  9. Zhu, Y.; Wu, Z.; Park, Y.; Fan, X.; Bai, D.; Zong, P.; Qin, B.; Cai, X.; Ahn, K. Measurements of atmospheric aerosol vertical distribution above North China Plain using hexacopter. Sci. Total Environ. 2019, 665, 1095–1102. [Google Scholar] [CrossRef]
  10. Liu, F.; Zheng, X.; Jiangsu, H.Q. Comparison of particle concentration vertical profiles between downtown and urban forest park in Nanjing (China). Atmos. Pollut. Res. 2018, 9, 829–839. [Google Scholar] [CrossRef]
  11. Brady, J.; Stokes, M.; Bonnardel, J.; Bertram, T. Characterization of a quadrotor unmanned aircraft system for aerosol particle-concentration measurements. Environ. Sci. Technol. 2016, 50, 1376–1383. [Google Scholar] [CrossRef]
  12. Liu, C.; Huang, J.; Wang, Y.; Tao, X.; Hu, C.; Deng, L.; Xu, J.; Xiao, H.; Luo, L.; Xiao, H.; et al. Vertical distribution of PM2.5, and interactions with the atmospheric boundary layer during the development stage of a heavy haze pollution event. Sci. Total Environ. 2020, 704, 135329. [Google Scholar] [CrossRef]
  13. Kuuluvainen, H.; Poikkimäki, M.; Järvinen, A.; Kuula, J.; Irjala, M.; Dal Maso, M.; Keskinen, J.; Timonen, H.; Niemi, J.; Rönkkö, T. Vertical profiles of lung deposited surface area concentration of particulate matter measured with a drone in a street canyon. Environ. Pollut. 2018, 241, 96–105. [Google Scholar] [CrossRef]
  14. Villa, T.; Jayaratne, E.; Gonzalez, L.; Morawska, L. Determination of the vertical profile of particle number concentration adjacent to a motorway using an unmanned aerial vehicle. Environ. Pollut. 2017, 230, 134–142. [Google Scholar] [CrossRef] [Green Version]
  15. Gu, Q.; Michanowicz, D.R.; Jia, C. Developing a modular unmanned aerial vehicle (UAV) platform for air pollution profiling. Sensors 2018, 18, 4363. [Google Scholar] [CrossRef] [Green Version]
  16. Chilinski, M.T.; Markowicz, K.M.; Markowicz, J. Observation of vertical variability of black carbon concentration in lower troposphere on campaigns in Poland. Atmos. Environ. 2016, 137, 155–170. [Google Scholar] [CrossRef]
  17. McGonigle, A.; Aiuppa, A.; Giudice, G.; Tamburello, G.; Hodson, A.; Gurrieri, S. Unmanned aerial vehicle measurements of volcanic carbon dioxide fluxes. Geophys. Res. Lett. 2008, 35, L06303. [Google Scholar] [CrossRef] [Green Version]
  18. Mori, T.; Hashimoto, T.; Terada, A.; Yoshimoto, M.; Kazahaya, R.; Shinohara, H.; Tanaka, R. Volcanic plume measurements using a UAV for the 2014 Mt. Ontake eruption. Earth Planets Space 2016, 68, 1–18. [Google Scholar] [CrossRef] [Green Version]
  19. Yi, E.E.P.N.; Nway, N.C.; Aung, W.Y.; Thant, Z.; Wai, T.H.; Hlaing, K.K.; Maung, C.; Yagishita, M.; Ishigaki, Y.; Win-Shwe, T.-T.; et al. Preliminary monitoring of concentration of particulate matter (PM2.5) in seven townships in Yangon City, Myanmar. Environ. Health Prev. Med. 2018, 23, 1–8. [Google Scholar] [CrossRef]
  20. Hwang, J.Y.; Jung, M.K.; Kwon, O.J. Numerical study of aerodynamic performance of a multirotor unmanned-aerial-vehicle configuration. J. Aircr. 2015, 52, 839–846. [Google Scholar] [CrossRef]
  21. Roldán, J.J.; Joossen, G.; Sanz, D.; del Cerro, J.; Barrientos, A. Mini-UAV based sensory system for measuring environmental variables in greenhouse. Sensors 2015, 15, 3334–3350. [Google Scholar] [CrossRef] [PubMed] [Green Version]
  22. Villa, T.F.; Salimi, F.; Morton, K.; Morawska, L.; Gonzalez, F. Development and validation of a UAV-based system for air pollution measurements. Sensors 2016, 16, 2202. [Google Scholar] [CrossRef] [Green Version]
  23. Alvarado, M.; Gonzalez, F.; Erskine, P.; Cliff, D.; Heuff, D. A methodology to monitor airborne PM10 dust particles using a small unmanned aerial vehicle. Sensors 2017, 17, 343. [Google Scholar] [CrossRef] [PubMed]
  24. Fujita, T.; Yamada, Y.; Ishida, J.; Kumagai, Y.; Aranami, K.; Ohmori, S.; Nagasawa, R.; Kumagai, H. The operational JMA nonhydrostatic mesoscale model. Mon. Weather Rev. 2006, 134, 1266–1296. [Google Scholar]
  25. Poulidis, A.P.; Takemi, T.; Shimizu, A.; Iguchi, M.; Jenkins, S.F. Statistical analysis of dispersal and deposition patterns of volcanic emissions from Mt. Sakurajima, Japan. Atmos. Environ. 2018, 179, 305–320. [Google Scholar] [CrossRef]
  26. El’ıasson, J.; Yoshitani, J.; Mik, D.; Webe, K.; Böolke, C.; Scharifi, E. Measurements of particle distribution and ash fluxes in the plume of Sakurajima volcano with optical particle counter. J. Disaster Res. 2016, 11, 85–95. [Google Scholar] [CrossRef]
Figure 1. Drone equipped with ultrasonic anemometer, particulate matter (PM) sensor, and gas detector.
Atmosphere 12 00376 g001
Figure 2. (a) Indoor test site layout. (b) Position of hovering point and indoor wind measurement point (except for Run A-1). (c) Drone hovering at a height of 2 m. The background wind measurement point was replaced after the first run (Run A-1) to avoid a collision accident with a drone.
Atmosphere 12 00376 g002aAtmosphere 12 00376 g002b
Figure 3. Volcanic observation sites at Sakurajima. The round blue markers indicate drone flight locations; the triangular marker indicates the active crater location, and the square maker indicates the Atmospheric Environmental Regional Observation System (AEROS) station. Elevation information was obtained from the Geospatial Information Authority of Japan (https://fgd.gsi.go.jp/download/menu.php, accessed on 23 March 2018).
Atmosphere 12 00376 g003
Figure 4. Box plots of drone-measured wind speeds during hovering in an indoor, still test site.
Atmosphere 12 00376 g004
Figure 5. Time series of background wind speed measured with WXT510 during indoor analysis. The shaded sections correspond to the flight times for each run.
Atmosphere 12 00376 g005
Figure 6. Comparison between hovering drone (Protocol A) and Doppler light detection and ranging (LiDAR) observations for: (a) wind speed and (b) wind direction for Run B-4.
Atmosphere 12 00376 g006
Figure 7. Comparison of vertically moving drone and LiDAR observations: (ad) V = 1.0 m·s−1; (eh) V = 3.0 m·s−1; (a,c,e,g) wind speed; (b,d,f,h) wind direction; (a,b,e,f) with ascending drone; and (c,d,g,h) with descending drone for Runs B-1 and B-3. The error bars represent the standard deviation of LiDAR measurements during the ascending and descending time periods of the drone.
Atmosphere 12 00376 g007aAtmosphere 12 00376 g007b
Figure 8. Comparison between vertically moving drone (Protocol B) and objective analysis values derived from JMA-MSM: (a,c) wind direction profile and (b,d) wind speed profile. Drone profiles were obtained from the averages of Runs C-1 to C-4 in Case 1, and Runs C-5 to C-7 in Case 2. The error bars represent the standard deviation of drone measurements.
Atmosphere 12 00376 g008
Figure 9. Time series variation of drone-measured PM10 and PM2.5 concentrations on 26 February 2020 (Runs D-1 to D-6) at Nabeyama site. Red lines show the altitude (asl) of flight. Flight pattern of (af) was Protocol A (i.e., “hovering”).
Atmosphere 12 00376 g009
Figure 10. Time series variation of drone-measured PM10 and PM2.5 concentrations on 27 February 2020 (Runs D-7 to D-12) at the Arimura site. Red lines show the altitude (asl) of flight. Flight pattern of (ad) was Protocol A (i.e., “hovering”), and pattern of (ef) was Protocol B (i.e., “moving”).
Atmosphere 12 00376 g010aAtmosphere 12 00376 g010b
Table 1. Overview of drone flight for preliminary analysis and field observations.
Run No.Flight Date Time aSiteFlight PatternAccuracy Analysis
A-122 February 2019 14:29:12–14:46:50Indoor drone fieldHovering (2.0 m, 3.5 m)Preliminary experiments
A-222 February 2019 14:55:00–15:11:30Indoor drone fieldHovering (2.0 m, 3.5 m)
A-322 February 2019 15:33:40–15:51:30Indoor drone fieldHovering (2.0 m, 3.5 m)
B-130 October 2019 14:00:20–14:07:32KurokamiMoving (V = 3.0 m·s−1)Comparison with Doppler LiDAR
B-230 October 2019 14:10:10–14:20:04KurokamiMoving (V = 2.0 m·s−1)
B-330 October 2019 14:24:15–14:41:45KurokamiMoving (V = 1.0 m·s−1)
B-430 October 2019 14:44:00–14:55:00KurokamiHovering (500 m, 400 m, 300 m, 200 m, 100 m)
C-130 January 2018 15:25:00–15:39:00HarutaHovering (150 m, 100 m, 50 m)Comparison with objective analysis value (JMA-MSM)
C-230 January 2018 15:42:00–15:52:00HarutaHovering (300 m, 200 m)
C-330 January 2018 15:58:00–16:08:00HarutaHovering (400 m, 250 m)
C-430 January 2018 16:10:00–16:24:00HarutaHovering (600 m, 500 m)
C-531 January 2018 11:08:00–11:20:00HarutaHovering (150 m, 100 m, 50 m)
C-631 January 2018 11:24:00–11:36:00HarutaHovering (500 m, 300 m)
C-731 January 2018 11:39:00–11:50:00HarutaHovering (750 m)
D-126 February 2020 13:49:45–14:02:30NabeyamaHovering (1000 m)Aerosols and volcanic gases
D-226 February 2020 14:06:35–14:21:59NabeyamaHovering (900 m, 800 m)
D-326 February 2020 14:25:38–14:39:05NabeyamaHovering (700 m, 600 m)
D-426 February 2020 14:42:20–14:57:35NabeyamaHovering (500 m, 400 m, 300 m)
D-526 February 2020 15:03:15–15:18:40NabeyamaHovering (900 m, 800 m)
D-626 February 2020 15:20:35–15:33:05NabeyamaHovering (600 m, 500 m)
D-727 February 2020 12:34:50–12:44:30ArimuraHovering (100 m, 300 m)
D-827 February 2020 13:08:40–13:22:00ArimuraHovering (700 m, 500 m)
D-927 February 2020 13:31:40–12:47:10ArimuraHovering (900 m, 800 m)
D-1027 February 2020 13:56:50–14:10:15ArimuraHovering (1000 m)
D-1127 February 2020 14:15:30–14:30:35ArimuraMoving (V = 1.0 m·s−1)
D-1227 February 2020 15:00:45–15:22:50ArimuraMoving (V = 1.5 m·s−1)
a Local time (JST; Japan Standard Time).
Table 2. Eruptions and explosions of Sakurajima, Minamidake Crater, as observed by the Japan Meteorological Agency on 26–27 February 2020.
Event No.Date Time aType bPlume DirectionPlume Height (m)Related Run c
E126 February 2020 12:51ExplosionSE2600
E226 February 2020 13:04EruptionSE2000
E326 February 2020 13:13EruptionSE1800
E426 February 2020 13:23EruptionSE1500Run D-1
E527 February 2020 13:01ExplosionSE1800Run D-8
E627 February 2020 14:23ExplosionS1800Run D-11
E727 February 2020 23:15ExplosionW1300
a Local time (JST; Japan Standard Time). b Explosion: infrasound (>10 Pa) or the observations of falling ballistic blocks on the flank. Eruption: top of the plume reached an altitude ≥ 1000 m above the crater (excluding explosions). c The flight closest to the eruption or explosion time.
Publisher’s Note: MDPI stays neutral with regard to jurisdictional claims in published maps and institutional affiliations.

