Article

PM10 and PM2.5 Dust-Retention Capacity and Leaf Morphological Characteristics of Landscape Tree Species in the Northwest of Hebei Province

1
College of Forestry, Hebei Agricultural University, Baoding 071001, China
2
Institute of Forestry and Pomology, Beijing Academy of Agriculture and Forestry Sciences, Beijing 100093, China
*
Authors to whom correspondence should be addressed.
Atmosphere 2022, 13(10), 1657; https://doi.org/10.3390/atmos13101657
Submission received: 8 August 2022 / Revised: 6 October 2022 / Accepted: 7 October 2022 / Published: 11 October 2022
(This article belongs to the Special Issue Impact of Land-Use and Climate Change on Vegetation)

Abstract

:
This study aimed to explain the reasons for the differences in the PM2.5 and PM10 dust-retention capacity of different tree species. Ten typical landscape tree species with a strong ability to adsorb particulate matter and improve the quality of the atmospheric environment were selected in Zhangjiakou, and the leaves of each tree species were collected from April to October. The PM2.5 and PM10 dust-retention capacity of different tree species were measured using an aerosol regenerator. The differences in the leaf structure of different tree species were analyzed using an electron microscope. The results showed that the PM10 and PM2.5 per unit leaf area of 10 tree species ranged from 1.31 ± 0.68 to 2.64 ± 1.29 μg·cm−2 and from 0.28 ± 0.13 to 0.99 ± 0.34 μg·cm−2, and the PM10 and PM2.5 dust-retention capacity per unit leaf area of coniferous trees was higher than that of broad-leaved trees. Further, the PM10 dust-retention capacity per unit leaf area of each tree species in different months was the highest in October (3.17 ± 1.12 μg·cm−2) and the lowest in August (0.79 ± 0.56 μg·cm−2). The PM2.5 dust-retention capacity per unit leaf area was the highest in October (0.99 ± 0.34 μg·cm−2) and the lowest in April (0.28 ± 0.13 μg·cm−2). The annual PM10 and PM2.5 dust-retention capacity per hectare of Pinus tabulaeformis was the highest and that of Ginkgo biloba was the lowest. The conifer trees have rough leaves, and broad-leaved trees have smooth leaves. The leaves of P. tabulaeformis and Picea asperata have a widespread stomata distribution, and the leaf surface is not smooth, with a large number of grooves and bulges. The number of stomata on the leaf surface of Salix babylonica and G. biloba is less than that of P. tabulaeformis and P. asperata. When the dust-retention capacity of PM2.5 per unit leaf area is high, the corresponding roughness is also significant, and a good logarithmic relationship exists between roughness and PM2.5 per unit leaf area (R2 = 0.9504). The results of this study might have an important reference value in terms of the selection of tree species with strong PM10 and PM2.5 dust-retention capacity and the improvement in ambient air quality in the northwest of Hebei Province.

1. Introduction

Atmospheric aerosol is one of the core components in the study of climate and environment. It has a direct impact on human health, resulting in respiratory and cardiovascular diseases [1]. Epidemiological and toxicological studies showed that particles carrying a variety of chemicals could have a severe negative impact on human health [2]. Fine particulate matter (aerodynamic diameter <2.5 μm, PM2.5) and coarse particulate matter (aerodynamic diameter 2.5–10 μm, PM10) are important constituents of aerosol. As the main air pollutant in cities [3,4], atmospheric particulate matter has always been the focus of research in the field of an urban environment, as well as the main index reflecting ambient air quality. The diffusion of particulate matter in the atmosphere can significantly reduce visibility, leading to haze formation. Particulate matter can enter the human respiratory tract, increase the risk of cardiopulmonary diseases, and cause significant harm to human health [5,6]. It also has negative effects on social economy and urban environment. According to their aerodynamic diameter, atmospheric particles can be divided into micron particles (diameter >1 μm), submicron particles (0.1–1 μm), and ultrafine particles (diameter <0.1 μm). PM2.5 and PM10 are the main components of particulate matter on the micron scale. PM2.5 refers to particulate matter with a diameter of 2.5 μm or less, and PM10 refers to particulate matter with a diameter of 10 μm or less. The smaller the particle size, the higher the optical absorption coefficient, resulting in lower atmospheric visibility [7]. As the host city of snow events for the 2022 Winter Olympic Games, the ambient air quality of Zhangjiakou has attracted public attention. According to the Statistical Bulletin of the National Economic and Social Development of Zhangjiakou in 2019 [8], the ambient air quality of the whole year reached the standard for 308 days in the central urban area, with a compliance rate of 84.4%; the comprehensive ambient air quality index of Zhangjiakou was 3.53, ranking first in the Hebei Province. In 2019, PM2.5 and PM10 were still the main pollutants in the province [9]. Therefore, measures to effectively reduce the concentration of PM2.5 and PM10 and improve the urban environment, and thereby retain a good image of Zhangjiakou City before the world, are of considerable significance. PM2.5 and PM10 concentrations can be reduced both by reducing pollution sources and through forest vegetation. Forest vegetation purifies the atmospheric environment and reduces the mass concentration of particulate matter in the atmosphere via stomata (dermis) absorption, leaf lag, and internal degradation so as to fully improve the environmental quality; this has been the topic of studies conducted globally [10]. The forest cover has increased from 3.6% to 8% in La Costa, and the mean concentration of PM10 has reduced to 2% (removed 4 tons per year) [11]. Lu et al. [12] found that the PM2.5 adsorption amount per unit leaf area was reduced by 23.25% as the altitude increased by 50 m. However, the existing studies cannot fully clarify the reasons for the differences in the dust-retention capacity of different tree species and the overdue particles of different tree species. Therefore, the purpose of this study was to explain the reasons for the difference of dust retention capacity between PM2.5 and PM10 of different tree species, and to analyze the mechanism of the difference in the amount of particles adsorbed by different tree species from the leaf morphology and roughness, we selected 10 typical landscape tree species in Zhangjiakou City, collected the leaves of each tree species from April to October, and used an aerosol regenerator to measure the PM2.5 and PM10 dust-retention capacity of the leaves of different tree species. The suitable tree species with strong fine particulate matter-retention capacity in Zhangjiakou City were pointed out. The results of this study might help improve the environment of northwest Hebei Province.

2. Materials and Methods

2.1. Selection of Tree Species

Zhangjiakou is in the northwest of Hebei Province. It has met the national environmental air quality standards due to the hosting of the Winter Olympic Games. Its anthropogenic air pollutant emission intensity is also at a low level, but the pollution exceeds the standard in winter on some days. PM2.5 is added to Zhangjiakou’s environment via industrial, residential, transportation, agricultural, and power generation sources, contributing 34.5%, 29.7%, 15.7%, and 6.4%, respectively. The main types of pollution sources in Zhangjiakou are residential sources (17.6%), industrial sources (16.6%), and agricultural sources (8.8%) [13]. The study was conducted in Zhangjiakou People’s Park, the largest comprehensive park, with a total area of about 12.43 hm2. The atmospheric and environmental conditions in the park are consistent, and the pollution sources are the same. The park was built in the early 19th century and is located on the west bank of the Qingshui River in the city center. A total of 10 common and typical tree species with similar forest ages in Zhangjiakou People’s Park were selected. These included P. tabulaeformis, P. orientalis, P. bungeana, Picea asperata, G. biloba, Salix babylonica, Populus, Fraxinus chinensis, Sophora japonica, and Acer mono. These 10 tree species, on average, accounted for more than 85% of the landscape tree species in the study area (Table 1).

2.2. Foliage Collection Method

From April to October, three trees of different tree species were selected for field sampling (avoiding rainy days). The leaves of coniferous and broad-leaved tree species were collected at the upper, middle, and lower positions of the tree crown in the east, south, west, and north directions. All blades weighed more than 100 g. The leaves were collected three times a month. After the collection, the leaves were taken to the laboratory.

2.3. Determination of PM2.5 and PM10 Absorption Capacity of Tree Species

The aerosol regenerator (QRJZFSQ-Ⅱ) was used to measure the particulate matter (PM2.5) in leaves of different tree species. According to the method used by Zhang et al. [14] and Niu et al. [15], the particulate matter (M) of PM2.5 and PM10 per unit leaf area was calculated via Equation. The PM2.5 and PM10 dust-retention capacity per hectare of forestland(Q)was calculated via Equation.
M = m A
Q = 0.1 M L A I k
where M is the PM2.5 and PM10 dust-retention capacity of tree species per unit leaf area (μg·cm−2); m is the residual amount of PM2.5 and PM10 (μg) in the leaves placed into the aerosol regenerator; A is the leaf area (cm2) of all the leaves placed in the aerosol regenerator cartridge; Q is the PM2.5 and PM10 dust-retention capacity per hectare of forest land, kg/(hm2·a); LAI is the leaf area index; 0.1 is the unit conversion coefficient; k is the elution times per year. The amount and intensity of rainfall affected the cleaning of PM2.5 and PM10. The annual elution times of PM10 and PM2.5 were observed to be 18 and 12, respectively, based on the local rainfall data.

2.4. Roughness of Leaf Surface of Different Tree Species

In the laboratory, the fronts and backs of the leaves were washed with distilled water. The water on the surfaces of the leaves was carefully removed with absorbent paper. The relatively flat surface of the leaves was selected, trying to avoid the veins of the leaves and making it a sample measuring about 5 × 5 mm2. At room temperature, the samples were scanned and photographed with a gold-coated Si3N4 probe using a scanning probe microscope (spi3800-spa-400, Seiko Instruments Inc., Chiba, Japan) in noncontact atomic force microscopy (AFM) analysis mode. The scanning rate was 0.5 Hz, the lateral resolution was 0.2 nm, the vertical resolution was 0.01 nm, and the maximum scanning range was 10 × 10 μm2. All AFM images were in height mode, and no processing was performed on the images.

2.5. Leaf Surface Micromorphological Structure of Different Tree Species

An appropriate number of leaves were picked and immediately sealed in plastic paper to prevent the extrusion or damage of leaf hairs. The fresh leaves were cut into small cubes with a side length of about 5 mm in the middle of both sides of the vein and fixed immediately using 2.5% (volume fraction) glutaraldehyde solution. Then, the leaves were rinsed with phosphoric acid buffer solution three times, dehydrated with gradient ethanol, and divided into five gradients: 70%, 80%, 90%, 95%, and 100%. After the sample was sprayed with gold, the FEI Quanta 200 environmental scanning electron microscope (FEI Company, Eindhoven, The Netherlands) was used to observe the surface of the blade and select a suitable proportion for photographing.

3. Results and Analysis

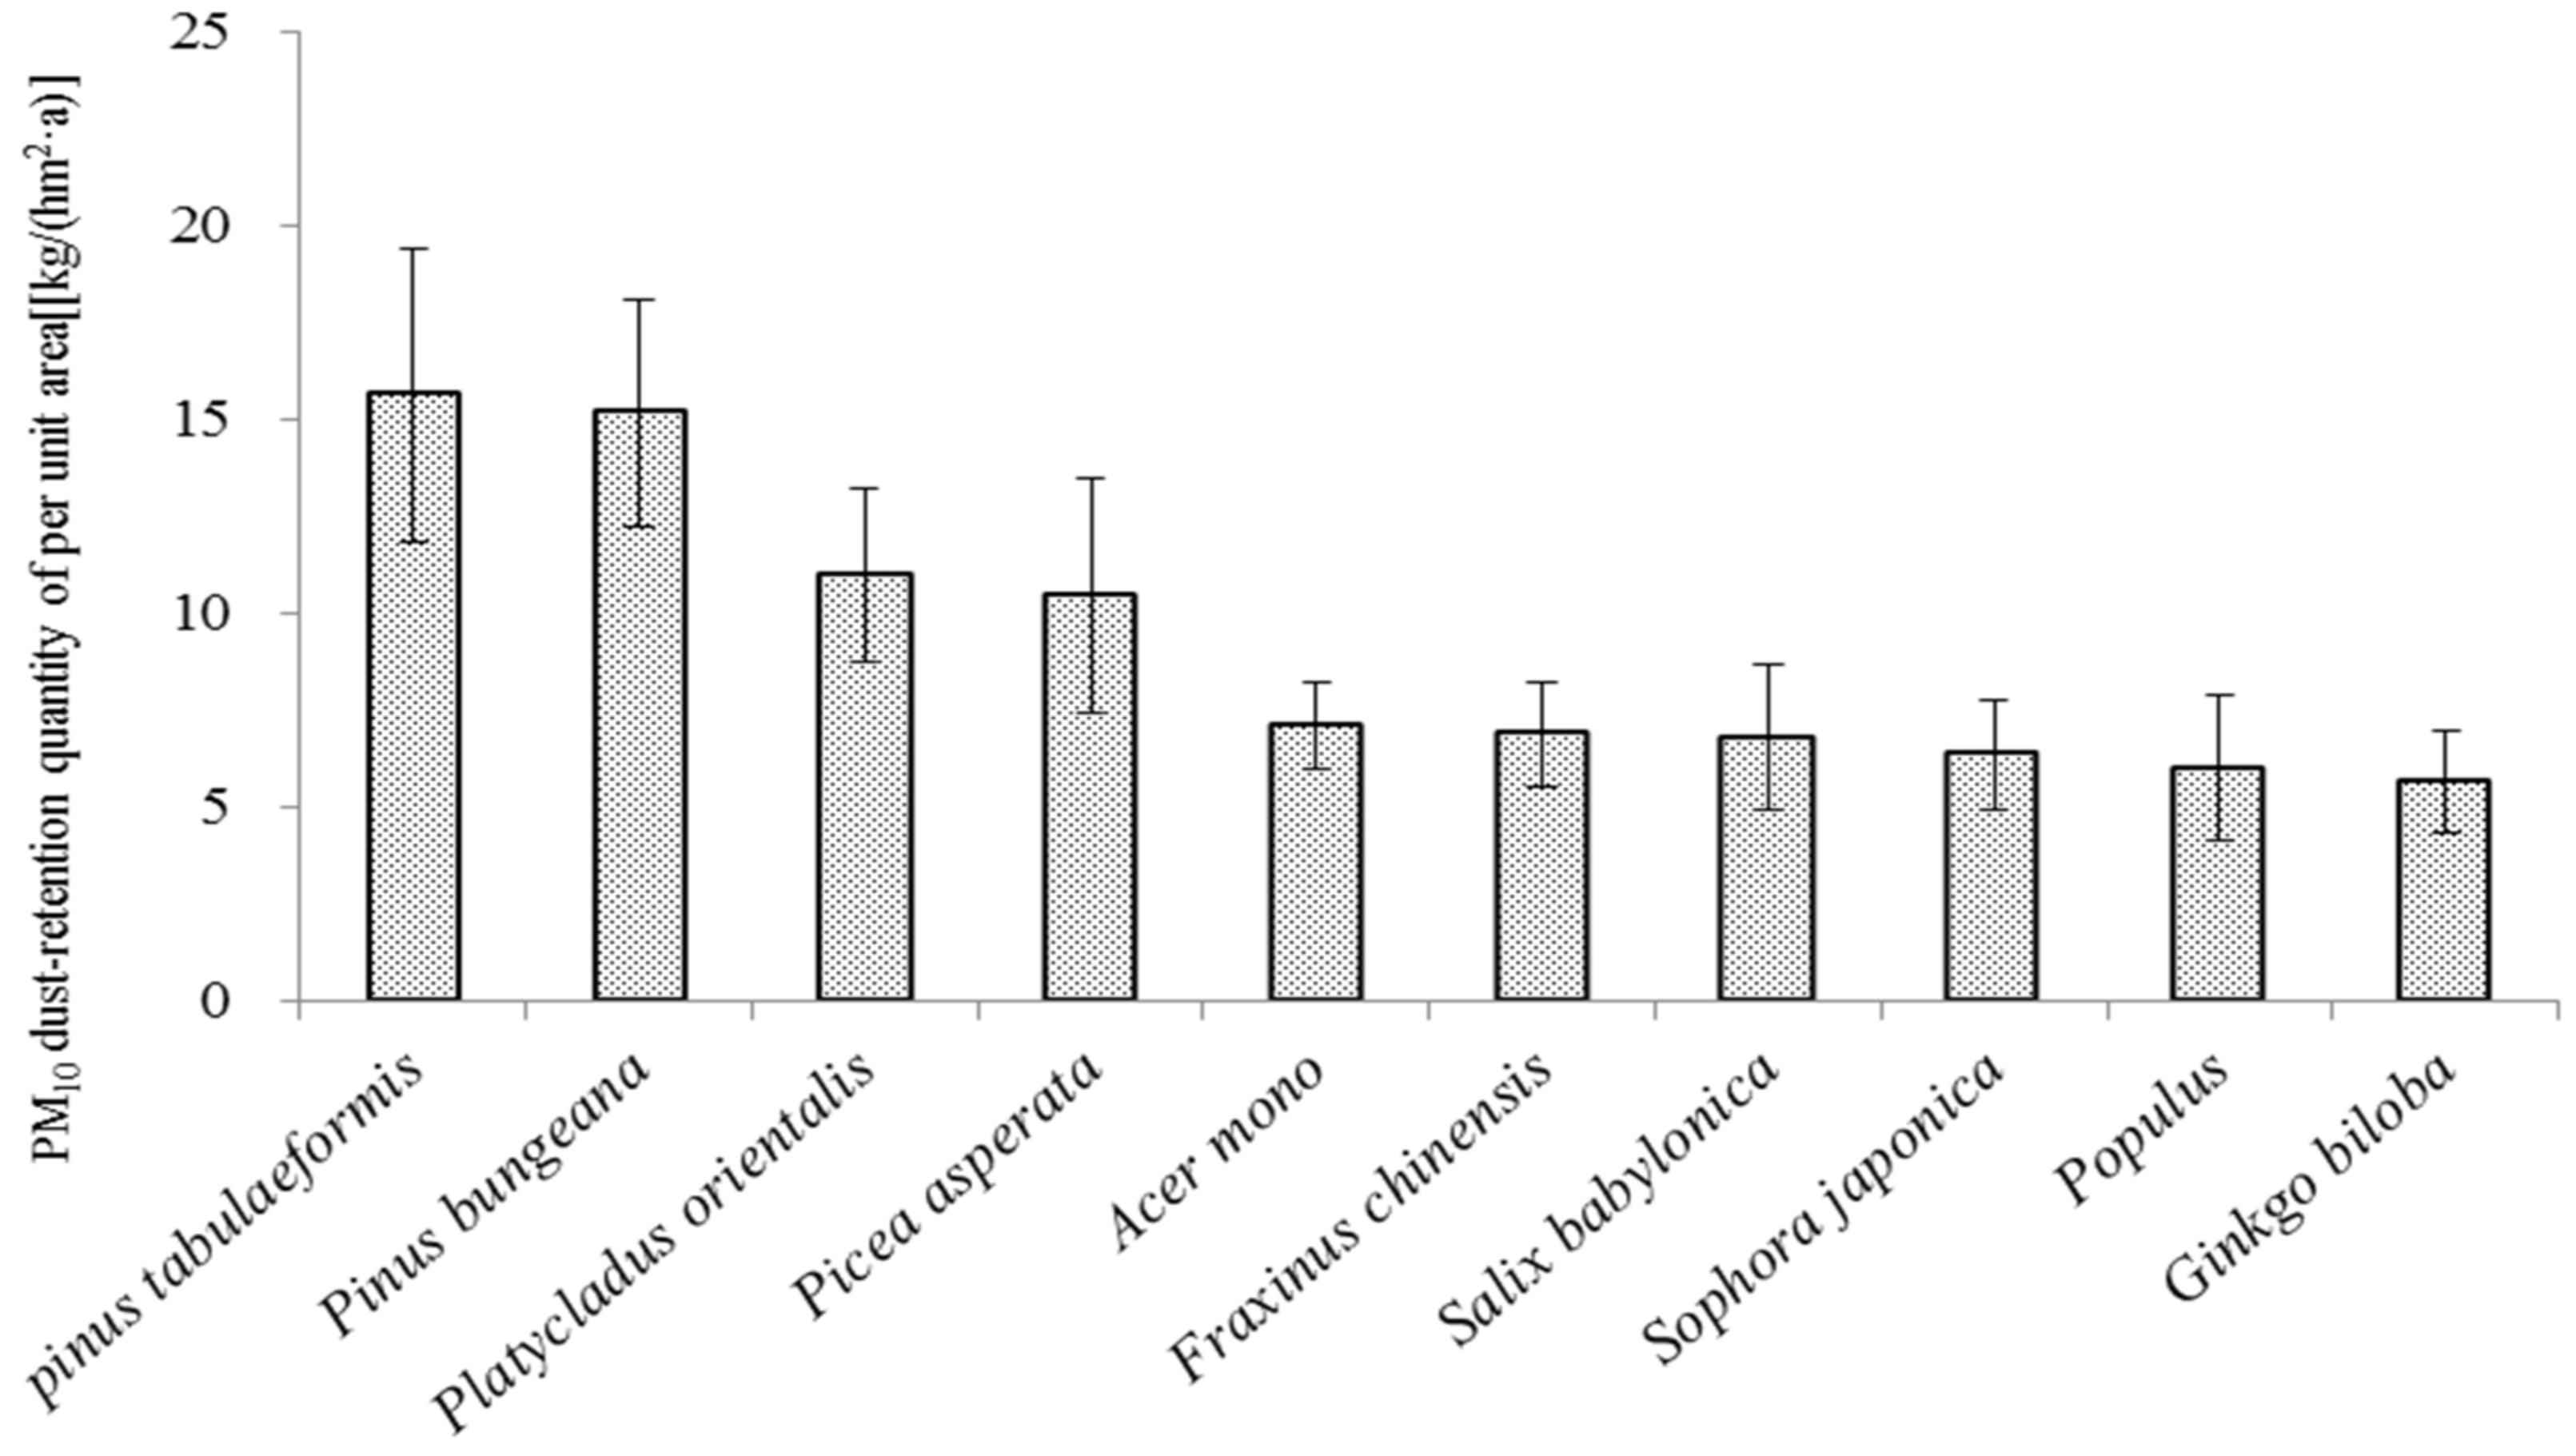
3.1. Analysis of PM10 Dust-Retention Capacity of Different Tree Species

The PM10 dust-retention capacity per unit leaf area of 10 tree species ranged from 1.31 ± 0.68 to 2.64 ± 1.29 μg·cm−2, and the PM10 dust-retention capacity per unit leaf area of each tree species was greater than that of broad-leaved trees (Table 2). The average PM10 dust-retention capacity per unit leaf area of coniferous trees was above 1.80 μg·cm−2, while that of broad-leaved trees was below 1.60 μg·cm−2. Hence, all four coniferous trees had high PM10 dust-retention capacity, while all six broad-leaved trees had low PM10 dust-retention capacity. The PM10 dust-retention capacity per unit leaf area of P. tabulaeformis was the highest (2.64 ± 1.29 μg·cm−2), followed by P. bungeana (2.56 ± 1.08 μg·cm−2). Among the broad-leaved tree species, Acer mono (1.58 ± 0.55 μg·cm−2) and Fraxinus chinensis (1.47 ± 0.65 μg·cm−2) had the highest PM10 dust-retention capacity per unit leaf area, while Ginkgo biloba (1.31 ± 0.68 μg·cm−2) had the lowest. The highest PM10 dust-retention capacity was observed in October, followed by September and May, and the lowest capacity was in August. The PM10 dust-retention capacity per unit area of each tree species in different months was in the order of October (3.17 ± 1.12 μg·cm−2) > September (2.75 ± 0.53 μg·cm−2) > May (1.53 ± 0.40 μg·cm−2) > July (1.44 ± 0.33 μg·cm−2) > June (1.41 ± 0.48 μg·cm−2) > April (1.20 ± 0.46 μg·cm−2) > August (0.79 ± 0.56 μg·cm−2). The value in October was 4.03 times that in August.
In addition, significant differences were found in the annual PM10 dust-retention capacity per hectare of different tree species (Figure 1). The annual PM10 dust-retention capacity per hectare of different tree species was still greater in coniferous than in broad-leaved trees, with P. tabulaeformis having the highest PM10 dust-retention capacity, followed by P. bungeana. Among the broad-leaved tree species, Acer momo and F. chinensis had the highest PM10 dust-retention capacity, while Populus and G. biloba had the lowest. The annual overdue PM10 per hectare of different tree species was in the order of P. tabulaeformis (15.64 ± 1.71 kg/(hm2·a)) > P. bungeana (15.18 ± 1.33 kg/(hm2·a)) > P. orientalis (11.00 ± 1.02 kg/(hm2·a)) > P. asperata (10.45 ± 1.38 kg/(hm2·a)) > A. momo (7.12 ± 0.51 kg/(hm2·a)) > F. chinensis (6.88 ± 0.63 kg/(hm2·a)) > Salix babylonica (6.81 ± 0.84 kg/(hm2·a)) > S. japonica (6.37 ± 0.65 kg/(hm2·a)) > Populus (6.02 ± 0.84 kg/(hm2·a)) > G. biloba (5.66 ± 0.60 kg/(hm2·a)). The annual PM10 dust-retention capacity of P. tabulaeformis was 2.76 times that of G. biloba.

3.2. Analysis of PM2.5 Dust-Retention Capacity of Leaves of Different Tree Species

The mean PM2.5 dust-retention capacity of leaves of different tree species from April to October was between 0.28 ± 0.13 and 0.99 ± 0.34 μg·cm−2 (Table 3). The PM2.5 dust-retention capacity per unit leaf area of coniferous trees was higher than that of broad-leaved trees. The mean of PM2.5 dust-retention capacity per unit leaf area of coniferous trees was above 0.60 μg·cm−2, while that of broad-leaved trees was below 0.50 μg·cm−2. The top four species in terms of PM2.5 dust-retention capacity per unit leaf area were coniferous trees, while broad-leaved trees ranked among the bottom six. The PM2.5 dust-retention capacity per unit area of the leaves of P. tabulaeformis was the highest (0.80 ± 0.35 μg·cm−2), followed by P. bungeana (0.74 ± 0.33μg·cm−2). Among the broad-leaved tree species, S. babylonica (0.54 ± 0.21μg·cm−2) had the highest PM2.5 dust-retention capacity per unit leaf area, followed by A. mono (0.43 ± 0.16 μg·cm−2) and F. chinensis (0.42 ± 0.20 μg·cm−2); G. biloba (0.35 ± 0.21 μg·cm−2) had the lowest dust-retention capacity. The PM2.5 dust-retention capacity was the highest in October, followed by September and June, and the lowest capacity was observed in April. The PM2.5 dust-retention capacity per unit leaf area of different tree species ranged from 0.63 to 1.60 μg·cm−2 in October, from 0.42 to 0.81 μg·cm−2 in September, and between 0.09 and 0.54 μg·cm−2 in April. The order of PM2.5 dust-retention capacity per unit area of each tree species in different months was in the order of October (0.99 ± 0.34 μg·cm−2) > September (0.65 ± 0.11 μg·cm−2) > June (0.54 ± 0.20 μg·cm−2) > July (0.51 ± 0.16 μg·cm−2) > May (0.39 ± 0.24 μg·cm−2) > August (0.33 ± 0.08 μg·cm−2) > April (0.28 ± 0.13 μg·cm−2). The dust-retention capacity per unit area was 3.50 times higher in October than in April.
The annual PM2.5 dust-retention capacity per hectare of different tree species was still greater in coniferous than in broad-leaved trees (Figure 2); it was the highest for P. tabulaeformis, followed by P. bungeana. Among the broad-leaved tree species, S. babylonica and F. chinensis had the highest PM2.5 dust-retention capacity, and Populus had the second-lowest and G. biloba had the lowest. The PM2.5 dust-retention capacity per hectare of different tree species was the highest in P. tabulaeformis (3.35 ± 0.98 kg/(hm2·a)) and the lowest in G. biloba (1.03 ± 0.42 kg/(hm2·a)). The PM2.5 dust-retention capacity per hectare of P. tabulaeformis was 3.24 times that of G. biloba.

3.3. Relationship between Particulate Matter Dust-Retention Capacity and Leaf Morphological Characteristics of Different Tree Species

3.3.1. Relationship between Morphological and Leaf Surface Characteristics of Different Tree Species and Particulate Matter Dust-Retention Capacity

Four representative tree species (the coniferous and broad-leaved tree species with the highest and the lowest dust-retention capacity) were selected from the 10 tree samples: P. tabulaeformis, P. asperata, S. babylonica, and G. biloba. The leaf surface characteristics of different tree species at different times in April and October were described. The month of April was when the experiment began and it was the time of the early stage of tree growth. October was the last sampling month in this study, which was also the end stage of the growth of trees. A significant difference was found in leaf morphology in this period. Figure 3 shows that a large number of stomata were found on the leaves of P. tabulaeformis and P. asperata in April, and stomata were clearly visible. The leaf surface of P. tabulaeformis and P. asperata was not smooth, with a large number of grooves and bumps. In April, the number of stomata on the leaf surface of S. babylonica and G. biloba was lower than that of P. tabulaeformis and P. asperata. The leaf surface of G. biloba was very smooth, and the stomata distribution could hardly be seen. In October, a large number of particulate matter was present on the leaf surface of the four tree species, and the leaves were rougher. The number of particulate matter on the leaf surface of P. tabulaeformis and P. asperata was significantly higher than that of S. babylonica and G. biloba. The leaf surface roughness of S. babylonica and G. biloba was also greater than that in April, and the stomata were full of particulate matter. The leaves of coniferous trees were rougher, while the leaves of broad-leaved trees were smoother.

3.3.2. Relationship between Particulate Matter Dust-Retention Capacity and Leaf Roughness of Different Tree Species

Figure 4 shows the relationship between the PM2.5 dust-retention capacity per unit leaf area of different tree species and the leaf roughness of the corresponding tree species. When the PM2.5 dust-retention capacity per unit leaf area was high, the corresponding roughness was also significant. A good logarithmic relationship existed between the roughness and the PM2.5 dust-retention capacity per unit leaf area: y = 44.438ln(x) + 36.914 (R2 = 0.9504). For example, G. biloba had the lowest PM2.5 dust-retention capacity per unit leaf area (only 0.35 ± 0.21 μg·cm−2); its corresponding roughness was lower (35.68 ± 8.54 nm). The maximum PM2.5 dust-retention capacity per unit leaf area was 0.80 ± 0.35 μg·cm−2. The corresponding roughness was also significant, which was 144.35 ± 25.63 nm. The leaf roughness of P. tabulaeformis was 4.05 times that of G. biloba. The leaf roughness of other tree species also showed basically the same result as PM2.5 retention per unit leaf area.
Figure 5 shows the relationship between the PM10 dust-retention capacity per unit leaf area of different tree species and the leaf roughness of the corresponding tree species. When the PM10 dust-retention capacity per unit leaf area was high, the corresponding roughness was also significant, and a good logarithmic relationship existed between the roughness and the PM10 dust-retention capacity per unit leaf area: y = 43.101 ln(x) + 38.934 (R2 = 0.8941). For example, the PM10 per unit leaf area of G. biloba and Populus was only 1.31 ± 0.68 and 1.34 ± 0.90 μg·cm−2, respectively; the corresponding roughness was also lower, 35.68 ± 8.54 and 73.45 ± 10.28 nm, respectively. The PM10 dust-retention capacity per unit leaf area of P. bungeana and P. tabulaeformis was the highest (2.56 ± 1.08 and 2.64 ± 1.29 μg·cm−2, respectively), and the corresponding roughness was also significant (135.88 ± 22.45 and 144.35 ± 25.63 nm, respectively). The leaf roughness of P. tabulaeformis was 4.05 times that of G. biloba. The leaf roughness of other tree species also showed the same result as PM10 dust-retention capacity per unit leaf area.

4. Discussion

4.1. Analysis of the Differences in PM10 and PM2.5 Dust-Retention Capacities of Different Tree Species

The PM10 and PM2.5 dust-retention capacity per unit leaf area of different tree species ranged from 1.31 ± 0.68 to 2.64 ± 1.29 μg·cm−2 and 0.28 ± 0.13 to 0.99 ± 0.34 μg·cm−2, respectively, with coniferous trees showing higher dust-retention capacity than the broad-leaved trees. The average PM10 dust-retention capacity per unit leaf area of conifers was above 1.80 μg·cm−2, while that of broad-leaved trees was below 1.60 μg·cm−2. The coniferous trees exhibited the top four dust-retention capacities, and all six broad-leaved trees had comparatively lower dust-retention capacities. The PM2.5 dust-retention capacity per unit leaf area of different tree species was the same as that of PM10. This indicated that the fine particulate matter dust-retention capacity of coniferous trees was greater than that of broad-leaved trees. The highest fine particulate matter dust-retention capacity was observed in P. tabulaeformis and P. bungeana among conifers and S. babylonica and F. chinensis among broad-leaved trees. G. biloba and Populus had the lowest such capacity. This was because the foliar structure of different tree species was different. Studies found that tree species with more pores and villi and significant roughness were more conducive to lagging particles, while tree species with smooth leaves were not conducive to lagging particles adhering to their surface [16,17]. Many studies [18,19] pointed out that the leaves of coniferous trees were rougher, and the leaves of broad-leaved trees were smoother than those of coniferous trees. Therefore, the capacity of coniferous trees to hold particulate matter was higher than that of broad-leaved trees, which was consistent with the results of this study.
This study showed that the PM10 dust-retention capacity per unit leaf area of each tree species in different months was in the order of October > September > May > July > June > April > August, and that of PM2.5 was in the order of October > September > June > July > May > August > April. It was seen that the particulate matter dust-retention capacity of different tree species was the highest in October and September and the lowest in August and April. The dust-retention capacity of leaves significantly changed with weather conditions, such as rainfall, wind, and sand dust. The amount of dust washed away by the same rainfall was also different due to the differences in leaf surface structure. This indicated that the dust-retention process of plant leaves was a complex and dynamic process, which was not linearly related to the passage of time, but also involved dust retention and dust shedding at the same time [20]. Wang et al. [21] observed the dust retention on the leaf surfaces of some coniferous tree species in Beijing and found that many particles were hidden in the grooves between the dense ridges on the leaf surfaces of P. orientalis and S. chinensis, and the particles were firmly attached and not easy to be washed away by moderate-intensity (14.5 mm) rainfall. This was related to the growth status of trees at different times, weather conditions, and mass concentration of particulate matter outside. In this study, April was the period when the trees taken for this study had just started growing leaves. Most of the trees at that time had tender leaves, and both coniferous and broad-leaved trees had a low capacity to hold particulate matter. August had the rainy season, with the highest rainfall of 43.67 mm. Under the scouring effect of rainfall, a large number of overdue particles on the leaves of trees were washed out. Hence, the particulate matter dust-retention capacity of different tree species in August was the lowest. In October and September, trees grew for a long time and belonged to the late stage of growth. With the prolongation of growth time, the quantity of particulate matter on leaves increased. Moreover, September and October belonged to autumn. The mass concentration of PM2.5 in autumn was 20.80 μg·m−3, and the mass concentration of PM2.5 in summer was 18.13 μg·m−3. The mass concentration of PM2.5 in autumn was 1.11 times than that in summer. In autumn, more particulate matter sources fell on the surface of trees and leaves. Therefore, the particulate matter dust-retention capacity of different tree species was the highest in October and September.

4.2. Relationship between Particulate Matter Dust-Retention Capacity and Leaf Morphological Characteristics of Different Tree Species

Under the influence of rain, wind, sand, and dust, foliar dust retention changed frequently, and the degree of variation varied with species. Luo et al. [22] studied the PM2.5 dust-retention capacity in six landscape tree species in Shenyang, including P. tabulaeformis, P. orientalis, P. bungeana, P. alba berolinebsis, S. babylonica, and A. momo. They found that the PM2.5 clearance rate under rainfall conditions was 37.69% in broad-leaved trees and 27.76% in coniferous trees. This was because the concave and convex structures of P. tabulaeformis and P. orientalis were advantageous to the particulate matter. The secretion of viscous oil to form small particles accumulated in the mesh structure of the particle group; in the wind, rain, sand, and dust, weather events occur, so the dust-retention capacity of foliar dust will not change obviously, and the dust-retention capacity of foliar dust has little influence from the external environment change. On the contrary, some particles of small size in the air can easily enter a large number of depressions on the leaf surfaces of coniferous trees. Once trapped, they are not easily blown away by the wind or taken away by rainfall, and hence they accumulate on the leaf surface for a long time. However, the contact area between leaves and particles is small due to the relatively smooth micromorphological structure and hydrophobic nature of the leaf surface of broad-leaved trees, such as S. babylonica, A. momo, and Populus, which leads to the low affinity between particles and leaf surface and makes it difficult for particles to deposit on the leaf surface [23]. Hence, the particles fall down in large quantities when rainfall occurs. This is consistent with the results of this study, as the particulate matter dust-retention capacity of the leaves of P. tabulaeformis and P. bungeana was high, while that of S. babylonica, Populus, and Ginkgo biloba was low. These results indicated that the leaf micromorphological structure of coniferous trees was more conducive to lagging particulate matter than that of broad-leaved trees.
This study showed that the PM2.5 and PM10 dust-retention capacity of the unit leaf area per hectare of forest land of coniferous trees was greater than that of broad-leaved trees. The leaves of P. tabulaeformis and P. bungeana were larger than those of different tree species. The leaves of Populus and G. biloba were the smallest, and the leaves of S. babylonica, F. chinensis, and A. momo were of average size. In April and October, the stomata distribution of P. tabulaeformis and P. asperata was widespread, and the leaf surface was smooth, with a large number of grooves and bumps. The leaf surface porosity of S. babylonica and G. biloba was less than that of P. tabulaeformis and P. asperata. The leaf surface of G. biloba was very smooth, and the stomata distribution was not clearly visible. The longer the leaf villi of a plant, the easier it was to absorb particulate matter; additionally, the adsorption effect on particulate matter increased. These changes accelerated plant metabolism to adapt to the environment [24]. A larger amount of particulate matter was found on the leaf surface of each tree in October than in April, but the amount of particulate matter on the leaf surface of P. tabulaeformis and P. asperata was significantly higher than that of S. babylonica and G. biloba. The leaves of coniferous trees were rougher, while the leaves of broad-leaved trees were smoother. The results of this study were also consistent with the results of Lu et al. [11]. Chen et al. [25] believed that leaf surfaces with significant roughness, dense micromorphology and structure, and large difference in depth would increase the contact area between them and particles, resulting in a higher adsorption capacity of leaves to particles. The roughness of P. tabulaeformis leaves (144.35 ± 25.63 nm) was more than that of G. biloba (35.68 ± 8.54 nm). The leaf roughness of P. tabulaeformis was 4.05 times that of G. biloba. In this study, the PM10 dust-retention capacity per hectare of P. tabulaeformis forest was 2.76 times that of G. biloba. In addition, the PM2.5 dust-retention capacity per hectare of P. tabulaeformis forest was 3.24 times that of G. biloba, which proved the relationship between leaf roughness and dust-retention capacity.

5. Conclusions

The PM10 and PM2.5 dust-retention capacity per unit leaf area of different tree species ranged from 1.31 ± 0.68 to 2.64 ± 1.29 μg·cm−2 and 0.28 ± 0.13 to 0.99 ± 0.34 μg·cm−2. The PM10 and PM2.5 dust-retention capacity per unit leaf area of coniferous trees was higher than that of broad-leaved trees. The PM10 dust-retention capacity per unit leaf area was the highest in October and the lowest in August. The PM2.5 dust-retention capacity per unit leaf area was maximum in October (0.99 ± 0.34 μg·cm−2) and minimum in April (0.28 ± 0.13 μg·cm−2). The PM10 and PM2.5 dust-retention capacity per hectare of different tree species showed that the variation law of conifers was greater than that of broad-leaved trees. It was the highest for P. tabulaeformis, followed by P. bungeana. Among the broad-leaved tree species, the PM10 and PM2.5 dust-retention capacity was the highest in A. momo and F. chinensis and the lowest in Populus and G. biloba. The leaves of conifers were rough, and the leaves of broad-leaved trees were smooth. The leaves of P. tabulaeformis and P. asperata had a large stomata distribution, and the leaf surface was not smooth, with a large number of grooves and bumps. When the PM2.5 dust-retention capacity per unit leaf area was high, the corresponding roughness was also significant, and a good logarithmic relationship existed between the roughness and the PM2.5 dust-retention capacity per unit leaf area. Hence, coniferous trees should be considered for landscaping. S. babylonica, F. chinensis, and A. momo can also be considered among the broad-leaved tree species for landscaping purposes.

Author Contributions

Conceptualization, X.Y., Z.G. and B.C.; investigation, Z.G. and Y.Q.; methodology, X.Y. and B.C.; software, Z.G. and B.C.; validation, X.Y. and B.C.; writing—original draft preparation, Z.G. and Y.Q.; writing—review and editing, B.C. and X.Y.; supervision, Z.G. and B.C.; funding acquisition, X.Y. All authors have read and agreed to the published version of the manuscript.

Funding

This work was supported by a special research project of the forestry public welfare industry (201204101) and Hebei Forestry and grassland science and technology promotion demonstration project (JI LT (2021) No. 004).

Institutional Review Board Statement

Not applicable.

Informed Consent Statement

Not applicable.

Conflicts of Interest

The authors declare no conflict of interest.

References

  1. Zhang, R.J.; Wang, M.F.X.; Hu, F.; Xu, Y.F. Elemental concentrations and distributions of atmospheric particles before and in heating period in Beijing. J. Univ. Chin. Acad. Sci. 2002, 19, 75–81. [Google Scholar]
  2. Shen, L.F.; Guo, Z.G.; Gao, H.W.; Zhang, Y.J.; Chen, H.T. Preliminary study on element composition and source apportionment of atmospheric aerosol over Bohai Sea. Environ. Monit. China 2005, 21, 16–21. [Google Scholar]
  3. Shi, Y.; Matsunaga, T.; Yamaguchi, Y.; Zhao, A.M.; Li, Z.Q.; Gu, X.F. Long-term trends and spatial patterns of satellite-retrieved PM2.5 concentrations in south and southeast Asia from 1999 to 2014. Sci. Total Environ. 2018, 615, 177–186. [Google Scholar] [CrossRef] [PubMed]
  4. Voliotis, A.; Samara, C. Submicron particle number doses in the human respiratory tract: Implications for urban traffic and background environments. Environ. Sci. Pollut. Res. 2018, 25, 33724–33735. [Google Scholar] [CrossRef]
  5. Samek, L.; Stegowski, Z.; Styszko, K.; Furman, L.; Fiedor, J. Seasonal contribution of assessed sources to submicron and fine particulate matter in a Central European urban area. Environ. Pollut. 2018, 241, 406–411. [Google Scholar] [CrossRef]
  6. Liu, Y.H.; Hou, Y.J.; Shu, D.Y.; Yang, B.; Cui, Y.C.; Ding, F.J. Properties and spatio-temporal variation of leaf retained particulate matters of the main tree species planted in Guiyang City. Sci. Silvae Sin. 2020, 56, 12–25. [Google Scholar]
  7. Wang, Z.S.; Li, Y.T.; Liu, B.X.; Sun, F.; Zhang, D.W.; Zhou, J.N.; Liu, Z.Y.; Pan, L.B. Chemical characteristics of PM2.5 in Beijing. Acta Ecol. Sin. 2016, 36, 2382–2392. [Google Scholar]
  8. Zhangjiakou Municipal Bureau of Statistics. Statistical Bulletin of National Economic and Social Development of Zhangjiakou in 2019; Zhangjiakou Municipal Bureau of Statistics: Zhangjiakou, China, 2020. [Google Scholar]
  9. Department of Ecological Environment of Hebei Province. Bulletin of Ecological Environment of Hebei Province in 2019; Department of Ecological Environment of Hebei Province: Shijiazhuang, China, 2020. [Google Scholar]
  10. Chen, B.; Xu, J.J.; Liu, D.H.; Yang, X.B. Response of Ginkgo biloba growth and physiological traits to ozone stress. Glob. Ecol. Conserv. 2022, 34, e02020. [Google Scholar] [CrossRef]
  11. Lu, S.W.; Yang, X.B.; Li, S.N.; Chen, B.; Jiang, Y.; Wang, D.; Xu, L. Effects of plant leaf surface and different pollution levels on PM2.5 adsorption capacity. Urban For. Urban Green. 2018, 34, 64–70. [Google Scholar] [CrossRef]
  12. Lu, S.W.; Li, S.N.; Chen, B.; Liu, H.L.; Zhao, D.B.; Chen, P.F. Variations in PM2.5 concentration and leaf adsorption capacity of Pinns tabulaeformis forests at different altitudes on Beijing Xishan Mountains. Acta Ecol. Sin. 2017, 37, 6588–6596. [Google Scholar]
  13. Li, J.D. Characteristics of PM2.5 Pollution and Source Change in Zhangjiakou under the Background of Clean Atmospheric Environment in the Mountainous Areas on the Northwest Margin of Beijing Tianjin Hebei. Master’s Thesis, Nanjing University of Information Science and Technology, Nanjing, China, 2021. [Google Scholar]
  14. Zhang, W.K.; Wang, B.; Niu, X. Dynamic research on particulates-absorbing capacities of common tree species leaves in Beijing over time. Acta Sci. Circumstantiae 2016, 36, 3840–3847. [Google Scholar]
  15. Niu, X.; Wang, B.; Wei, W.J. Response of the particulate matter capture ability to leaf age and pollution intensity. Environ. Sci. Pollut. Res. 2020, 27, 34258–34269. [Google Scholar] [CrossRef]
  16. Beckett, K.P.; Freer-Smith, P.H.; Taylor, G. Particulate pollution capture by urban trees: Effect of species and windspeed. Glob. Chang. Biol. 2000, 6, 995–1003. [Google Scholar] [CrossRef]
  17. Zhang, L.; Zhang, Z.; Chen, L.; McNulty, S. An investigation on the leaf accumulation-removal efficiency of atmospheric particulate matter for five urban plant species under different rainfall regimes. Atmos. Environ. 2019, 208, 123–132. [Google Scholar] [CrossRef]
  18. Chen, B.; Li, S.N.; Lu, S.W.; Liu, H.L.; Zhao, D.B.; Chen, P.F. Function study of coniferous species leaf retention of PM2.5 in winter in Xishan mountain of Beijing. Environ. Sci. Technol. 2018, 41, 28–33. [Google Scholar]
  19. Zhao, C.X.; Wang, Y.J.; Wang, Y.Q.; Zhang, H.L. Interactions between fine particulate matter (PM2.5) and vegetation: A review. Chin. J. Ecol. 2013, 32, 2203–2210. [Google Scholar]
  20. Li, H.M.; Liu, X. Relationships between leaf epidermal morphology and dust-retaining capability of main garden trees in Chengyang district of Qingdao. Chin. J. Ecol. 2008, 27, 1659–1662. [Google Scholar]
  21. Wang, L.; Ha, S.; Liu, L.Y.; Gao, S.Y. Effects of weather condition in spring on particulates density on conifers leaves in Beijing. Chin. J. Ecol. 2006, 25, 998–1002. [Google Scholar]
  22. Luo, J.; Niu, Y.D.; Zhang, Y.; Zhang, M.; Tian, Y.X.; Zhou, X.L. Dynamic analysis of retention PM2.5 by plant leaves in rainfall weather conditions of six tree species. Energy Sources Part A Recovery Util. Environ. Eff. 2020, 42, 1014–1025. [Google Scholar] [CrossRef]
  23. Wang, H.X.; Shi, H.; Wang, Y.H. Dynamics of the captured quantity of particulate matter by plant leaves under typical weather conditions. Acta Ecol. Sin. 2015, 35, 1–12. [Google Scholar] [CrossRef]
  24. Nowak, D.J.; Hirabayashi, S.; Bodine, A.; Hoehn, R. Modeled PM2.5 removal by trees in ten U.S. cities and associated health effects. Environ. Pollut. 2013, 178, 395–402. [Google Scholar] [CrossRef] [PubMed]
  25. Chen, B.; Jiang, Y.; Lu, S.W.; Li, S.N.; Chen, P.F.; Liu, H.L.; Zhao, D.B. Relationship between PM2.5 adsorption and wettability of different trees during summer, autumn in West Mountain of Beijing. J. Nanjing For. Univ. (Nat. Sci. Ed.) 2018, 42, 113–119. [Google Scholar]
Figure 1. Annual PM10 dust-retention capacity per hectare of different tree species.
Atmosphere 13 01657 g001
Figure 2. Annual PM2.5 dust-retention capacity per hectare of different tree species.
Atmosphere 13 01657 g002
Figure 3. Leaf morphological characteristics of typical tree species in April and October.
Atmosphere 13 01657 g003aAtmosphere 13 01657 g003b
Figure 4. Relationship between PM2.5 dust-retention capacity and leaf roughness of different tree species.
Atmosphere 13 01657 g004
Figure 5. Relationship between PM10 dust-retention capacity and leaf roughness of different tree species.
Atmosphere 13 01657 g005
Table 1. Basic information on different tree species.
Tree SpeciesHeight (m, Mean ± SD)Breast Diameter (cm, Mean ± SD)Crown Width (m)
East–West (Mean ± SD)North–South (Mean ± SD)
Pinus tabulaeformis7.85 ± 2.4512.04 ± 3.542.33 ± 0.452.58 ± 0.58
Platycladus orientalis7.04 ± 3.2211.54 ± 2.872.45 ± 0.472.54 ± 0.65
Pinus bungeana5.88 ± 2.1210.24 ± 2.142.68 ± 0.582.55 ± 0.45
Picea asperata6.58 ± 1.5811.55 ± 2.541.25 ± 0.331.35 ± 0.54
Ginkgo biloba9.88 ± 3.6414.25 ± 3.541.68 ± 0.241.85 ± 0.74
Salix babylonica10.85 ± 5.6416.54 ± 4.143.54 ± 1.024.55 ± 1.58
Populus14.53 ± 6.5422.54 ± 4.754.12 ± 1.883.85 ± 1.68
Fraxinus chinensis12.53 ± 3.4519.54 ± 3.253.12 ± 1.422.57 ± 1.44
Sophora japonica11.33 ± 3.5815.32 ± 3.542.85 ± 2.013.02 ± 1.85
Acer mono7.85 ± 3.5512.78 ± 2.472.24 ± 1.022.64 ± 1.33
Table 2. PM10 dust-retention capacity of leaves of different tree species (μg·cm−2).
Tree SpeciesAprilMayJuneJulyAugustSeptemberOctoberMean ± SD
Pinus tabulaeformis1.811.701.991.501.383.965.032.64 ± 1.29
Platycladus orientalis1.861.621.591.320.942.693.771.97 ± 0.89
Pinus bungeana1.822.012.341.911.713.124.982.56 ± 1.08
Picea asperata1.212.151.181.600.282.993.791.89 ± 1.10
Ginkgo biloba0.791.331.051.270.252.202.281.31 ± 0.68
Salix babylonica1.161.671.111.020.372.112.541.43 ± 0.68
Populus0.761.101.020.950.172.932.431.34 ± 0.90
Fraxinus chinensis0.721.041.151.690.902.492.291.47 ± 0.65
Sophora japonica0.821.051.151.010.702.482.311.36 ± 0.67
Acer mono1.071.381.281.920.862.482.081.58 ± 0.55
Mean1.20 ± 0.461.53 ± 0.401.41 ± 0.481.44 ± 0.330.79 ± 0.562.75 ± 0.533.17 ± 1.121.75 ± 0.80
Table 3. PM2.5 dust-retention capacity of leaves of different tree species (μg·cm−2).
Tree SpeciesAprilMayJuneJulyAugustSeptemberOctoberMean ± SD
Pinus tabulaeformis0.540.680.850.750.450.731.600.80 ± 0.35
Platycladus orientalis0.420.780.810.560.360.731.240.70 ± 0.27
Pinus bungeana0.310.670.850.740.440.711.440.74 ± 0.33
Picea asperata0.410.460.450.600.370.811.320.63 ± 0.31
Ginkgo biloba0.090.160.340.330.240.640.680.35 ± 0.21
Salix babylonica0.320.380.390.240.230.660.840.54 ± 0.21
Populus0.240.140.320.310.230.590.770.37 ± 0.21
Fraxinus chinensis0.200.110.430.540.340.640.710.42 ± 0.20
Sophora japonica0.200.170.430.480.310.420.720.39 ± 0.17
Acer mono0.120.320.540.530.340.540.630.43 ± 0.16
Mean0.28 ± 0.130.39 ± 0.240.54 ± 0.200.51 ± 0.160.33 ± 0.080.65 ± 0.110.99 ± 0.360.53 ± 0.16
Publisher’s Note: MDPI stays neutral with regard to jurisdictional claims in published maps and institutional affiliations.

