Article

Association between Chronic Exposure to Ambient Air Pollutants, Demography, Vaccination Level, and the Spread of COVID-19 during 2021 Delta Variant Morbidity Wave

by
Zohar Barnett-Itzhaki
1,2,*,† and
Adi Levi
2,3,†
1
School of Engineering, Ruppin Academic Center, Emek Hefer 4025000, Israel
2
Ruppin Research Group in Environmental and Social Sustainability, Ruppin Academic Center, Emek Hefer 4025000, Israel
3
School of Sciences, Achva Academic College, Arugot 7980400, Israel
*
Author to whom correspondence should be addressed.
These authors contributed equally to this work.
Atmosphere 2022, 13(11), 1845; https://doi.org/10.3390/atmos13111845
Submission received: 16 October 2022 / Revised: 2 November 2022 / Accepted: 4 November 2022 / Published: 6 November 2022
(This article belongs to the Special Issue Environmental and Public Health Aspects regarding Pandemic Viruses)

Abstract

:
Studies conducted in the early COVID-19 pandemic stages showed positive associations between chronic exposure to ambient air pollution and COVID-19 morbidity. Here, we examined the associations between populations’ chronic exposure to air pollutants (NO2, CO, PM10, PM2.5, and SO2), demographics, and vaccination rates, to COVID-19 morbidity rates in 280 Israeli municipalities during the Delta-variant-dominated morbidity wave of summer 2021. We found that COVID-19 morbidity was positively associated with chronic exposure to air pollutants, the municipality’s population density, total population size, and the rate of elderly people. Multivariate linear regression models showed similar trends: positive associations between COVID-19 rates and density, ratio of elderly people, and most air pollutants, and a non-significant link to COVID-19 vaccine second dose ratio. Our results emphasized the effects of chronic air pollution exposure on the spread of the pandemic and strengthen the urgent need for uncompromising policy for a dramatic reduction in air pollution. They also highlighted the vulnerable populations (elderly, densely populated municipalities) during the Delta morbidity wave. These findings could assist policy makers to better inform the public and manage health policies in future COVID-19 waves, hopefully leading to a reduced impact on health.

1. Introduction

Prior to the COVID-19 pandemic outbreak, the World Health Organization (WHO) stated that air pollution is one of the greatest environmental risks to health and emphasized the need to address it as an imperative act critical to the protection of public health. The organization estimated in 2016 that 4.2 million premature deaths per year were related to ambient air pollution exposure [1]. Furthermore, the International Agency for Research on Cancer (IARC), published an assessment in 2013 that unanimously classified outdoor air pollution and particulate matter (PM) from outdoor air pollution as carcinogenic to humans (Group 1, standard IARC classification), based on vast mechanistic evidence of carcinogenicity in humans and animals. In particular, an increased risk of lung cancer due to air pollution exposure was consistently reported in studies that included millions of people across the world [2]. In 2019, 99% of the world population was living in areas where WHO ambient air quality guidelines were not met [1]. The burden of disease from stroke, heart disease, lung cancer, and both chronic and acute respiratory diseases, including asthma, could be locally and globally reduced by reducing ambient air pollution levels [3].
The association between chronic exposure to ambient air pollution and COVID-19 and its manifestation in elevated levels of morbidity and mortality was demonstrated in a plethora of recently published studies conducted on a multi-state or global level [4,5,6] or on a local and regional resolution of counties and municipalities in the USA, the Netherlands, China, Italy, the UK, Israel, and many other countries [7,8,9,10,11,12,13,14,15,16].
In those studies, which largely used COVID-19 data from March 2020 to the first quarter of 2021 (the early global morbidity waves), a positive link was often demonstrated between long-term exposure to PM2.5 (fine PM with diameter less than 2.5 μm) and PM10 (fine PM with diameter less than 10 μm) and COVID-19 morbidity and/or mortality. Several studies also showed a positive contribution of chronic exposure to other common air pollutants, mainly nitrogen oxides (NOx/NO2) and ground level ozone (O3), but also sulfur dioxide (SO2) and carbon monoxide (CO), to elevated levels of COVID-19 morbidity and mortality [16]. These results mostly refer to morbidity and mortality caused by the SARS-CoV-2 original strain and its early dominant lineages, which characterized the first and second COVID-19 waves [17]. A few studies also referred to variants emerging later, characterizing the third wave, such as the highly contagious Alpha B.1.1.7 variant, first reported in the UK in the fall of 2020, and the Beta B.1.351 and Gamma P.1 first reported in South Africa and Brazil, respectively [10,16,18,19,20].
The SARS-CoV-2 Delta variant (B.1.617.2) was first detected in October 2020, in the Maharashtra state of India, and was declared a “variant of concern” (VOC) on 15 June 2021 [20,21]. Then, by surpassing other variants of its lineage, the Delta variant became the most prevalent and rapidly spreading variant in almost 200 countries across the world. Several physiological characteristics and clinical features were distinctive to the SARS-CoV-2 Delta variant compared to other variants, including high viral load, potent transmissibility, and monoclonal antibodies therapy resistance. These characteristics have led to higher transmission and mortality rates compared with previous variants [21].
A handful of recently published studies examined the association between Delta-variant-induced morbidity and air pollution concentrations. In Indonesia, air pollution levels were monitored during and post lockdown, resulting in reduced CO, NO2, SO2, and O3 levels in the outbreak’s center due to the lockdown followed by increased levels after seven weeks [22]. In east China, the association between short-term exposure to outdoor PM and the risk of severe Delta-variant COVID-19 morbidity was examined among 476 adult patients. A study showed that short-term exposure to outdoor PM was positively related to the risk of severe COVID-19 [23]. In southern California, a cohort study of 50,010 COVID-19 patients associated prior PM2.5 and NO2 exposure levels (one month and one year) with an increased risk of COVID-19-related hospitalizations [24].
In Israel, the number of COVID-19-positive cases (“COVID-19 rates”) started to rise exponentially in June 2021, generating a fourth COVID-19 morbidity wave. From 15 June 2021, the number of new cases per day (7-day average) increased dramatically from just 17 to a peak of 11,027 new daily cases on 14 September, dropping down to 254 new cases per day on 28 November 2021 (Figure 1) [25]. Of note is the fact that, compared to previous morbidity waves, during this wave, no lockdown measures were applied. The rise in community transmission was followed by an increase in the number of severe cases and deaths, both in vaccinated and unvaccinated populations. Genetic analysis showed that in June 2021, more than 98% of positive COVID-19 cases were attributed to the Delta variant. By 1 June 2021, the nationwide Israeli vaccination campaign, which began on 20 December 2020, had already reached a staggering number of 5,279,926 fully vaccinated individuals (i.e., receiving two doses of the Pfizer–BioNTech BNT162b2 vaccine) above the age of 16 [18].
To the best of our knowledge, during the Delta-variant-dominated morbidity wave, no positive link has been reported to date between statewide long-term exposure to air pollution and COVID-19 morbidity levels. Furthermore, in our previous study in Israel, a positive link was observed between long-term exposure to air pollutant concentrations and COVID-19 morbidity rate following the first two morbidity waves, while no such link was found during the third (Alpha B.1.1.7-variant-dominated) wave [10]. Therefore, the aim of this ecological study was to examine the association between population chronic exposure to key ambient air pollutants, populations’ demographics, and vaccination level to Delta-wave COVID-19 morbidity rates in Israel. We examined the association between the annual average concentrations of five dominant ambient air pollutants: PM10, PM2.5, NO2, CO, and SO2, in 2020, and COVID-19 rates in 280 Israeli cities and towns (municipalities) during the increasing phase of the Delta variant morbidity wave (15 August and 22 August) and at its morbidity peak (3 September) in the summer of 2021 (Figure 1).
We hypothesized that populations living in municipalities with chronic elevated air pollution levels would have higher morbidity rates compared with populations from municipalities with relatively low air pollution. Additionally, we hypothesized that high population density, high elderly rate, and low vaccination rates would also contribute to the municipalities’ morbidity rates.

2. Methods

2.1. Data Collection

The following demographic information per Israeli municipality was collected from the Israeli Central Bureau of Statistics (CBS) website: municipality’s total population size in 2020, proportion of elderly (age 60 and above) in 2020, proportion of children (ages 0–11) in 2020, density (population per Km2) in 2019, municipality’s socioeconomic cluster (a CBS socioeconomic index ranging between 1–municipality’s lowest socioeconomic ranking to 10-municipality’s highest socioeconomic ranking, calculated for each municipality based on 14 socio-demographic parameters and other quality of life variables) in 2017, and population natural growth per 100,000 capita in 2019 [26].
Data on COVID-19 rates and vaccinated individuals (1st and 2nd dose) in 280 Israeli cities, towns, villages, etc., (municipalities scattered across the country, representing 99% of the Israeli population), were collected from Israel’s government COVID-19 dataset website [27]. We focused on COVID-19 rates on three selected dates (all in 2021) that covered different stages of the Delta variant morbidity wave. Two dates were in the increasing phase of the wave, i.e., 15 August and 22 August, and another was within the morbidity peak (3 September). To reflect the “spread value” of the pandemic on these dates (positive rate), for each date, we calculated the difference between the number of COVID-19-positive cases three days ahead, and the COVID-19 rate three days before.
The numbers of elderly people, children, COVID-19 rates, and numbers of vaccinated individuals per municipality were normalized by dividing each of these values by the municipality’s total population.
Estimation of the population’s exposure to different air pollutants was calculated using a hybrid model provided by the Israeli Ministry of Environmental Protection (IMoEP). This hybrid model merged two sources of information: (a) Annual averages of the CHIMERE model [28]. This is a multi-scale photochemical and transport model used by the IMoEP as a forecast model that provides forecasts (on an hourly basis) at a spatial resolution of 3 Km over the entire area of Israel. The model is based on both meteorological forecast and air pollutants’ emissions data from industry, power production, gas stations, road traffic, and others. The CHIMERE model also takes into account surface topography, land cover, land use, etc. (b) Air pollutant concentrations, measured by the Israeli air quality monitoring network measurements. Additional details regarding the hybrid model can be found in Yuval et al. [29]. The hybrid model forecasts were averaged for each pollutant (NO2, CO, PM10, PM2.5, and SO2) in 2020, resulting in an annual average level of each of the air pollutants. We calculated the population exposure weighted mean per municipality for each air pollutant by extracting the pollutant’s average concentration in the areas attributed to the municipality in 2020 [28,30].

2.2. Statistical Analyses

Since most of the variables were nonlinearly distributed, Spearman’s correlations were used to test the associations between COVID-19 rates (the spread value described in Section 2.1) and the demographic, socioeconomic, vaccination, and environmental data.
Multivariate linear regressions were used to examine the associations between the demographic and vaccination data, air pollution measures, and between the rates of COVID-19 in the aforementioned dates. Every regression model included the following variables: the municipality’s population density, total population size, the rate of elderly residents, and the rate of residents who were fully vaccinated at the time (two doses). The other two parameters (socioeconomic cluster and proportion of children (ages 0–11) in 2020) were not used due to co-linearity with other parameters. Every model included the average concentration of one of the five air pollutants: NO2, CO, PM10, PM2.5, and SO2. We used the logarithm value of the morbidity rates. For each model, we calculated statistical significance, root mean square error (RMSE), and the coefficient/p-value of each parameter.
All statistical analyses were performed using Matlab© version R2021b. The level of significance was 0.05 in all analyses.

3. Results

3.1. Air Pollutant Concentrations in Israel during 2016–2020

We examined the annual national average concentrations of five air pollutants: NO2, CO, PM10, PM2.5, and SO2. The observed generally decreasing trend in CO and NO2 concentrations during 2016–2019 dramatically deepened in 2020. The sharply decreasing trend in SO2 during 2016–2019 stopped in 2020. PM2.5 and PM10 concentrations that were generally gradually increasing during 2016–2019 dropped dramatically during 2020 (see supplementary Figure S1).

3.2. Associations between Demographic Parameters, Vaccination Level, and Rates of Positive Cases

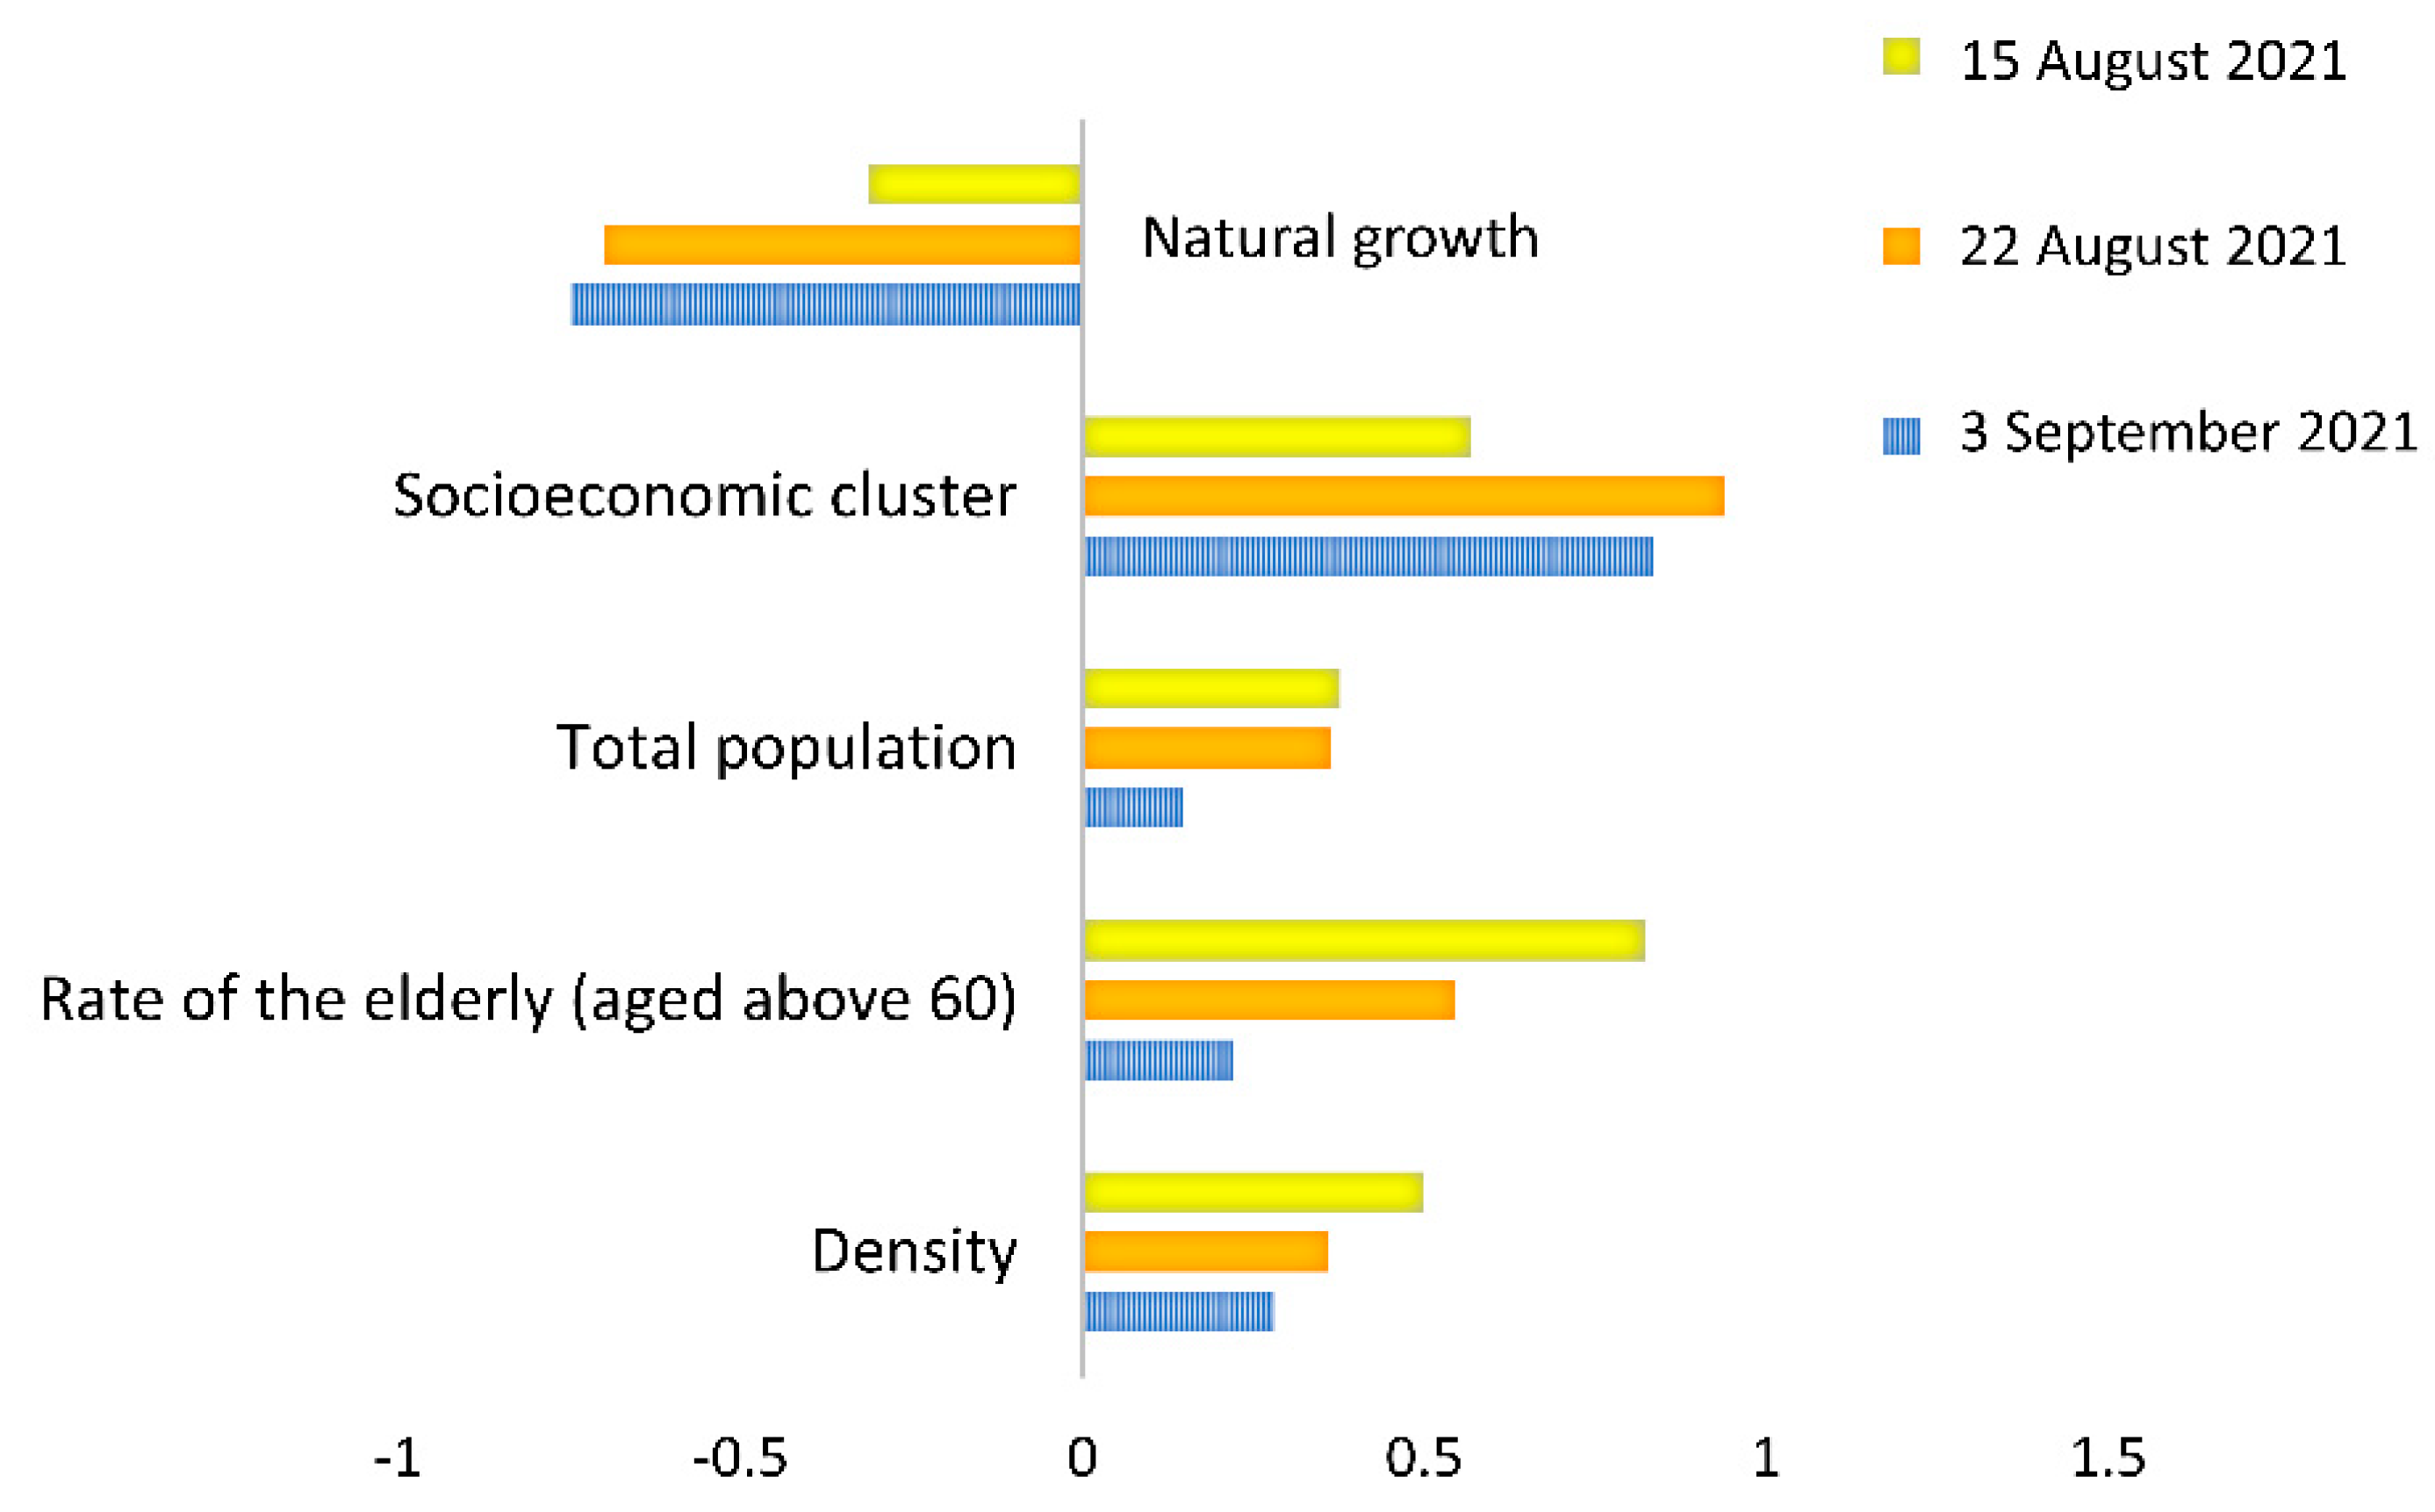
We calculated Spearman’s correlations between demographic parameters and the rates of COVID-19 in each municipality’s local population. Statistically significant positive correlations were found between total population size (r = 0.38, p < 0.001 on 15 August, r = 0.36, p < 0.001 on 22 August, r = 0.15, and p = 0.04 on 3 September), rate of elderly people (aged above 60) (r = 0.82, p < 0.001 on 15 August, r = 0.54, p < 0.001 on 22 August, r = 0.22, and p = 0.002 on 3 September), the municipality population density (r = 0.5, p < 0.001 on 15 August, r = 0.36, p < 0.001 on 22 August, r = 0.28, p = 0.0004 on 3 September), and the rates of COVID-19 among the municipality’s population (“COVID-19 rate”) (Figure 2).
The correlation between the COVID-19 rate and the proportion of the population that had received the first vaccination dose revealed a statistically significant negative association (r = −0.33, p < 0.001) only on 22 August, while the negative association between the COVID-19 rate and the rate of population that had received the second vaccination dose was statistically significant (r = −0.41, p < 0.001) only on 15 August. The rate of children in the municipality was not statistically significant when correlated with COVID-19 rates (see supplementary Table S1). Additionally, the socioeconomic cluster had a statistically significant positive association with COVID-19 rates (r = 0.57, p < 0.001, r = 0.93, p < 0.001, and r = 0.82, p < 0.001) at all three time points, respectively. Finally, the population natural growth was negatively associated (r = −0.31, p < 0.001, r = −0.7, p < 0.001, and r = −0.75, p < 0.001) at all three time points, respectively (Figure 2).

3.3. Associations between Air Pollutant Concentrations and Rates of Positive Cases

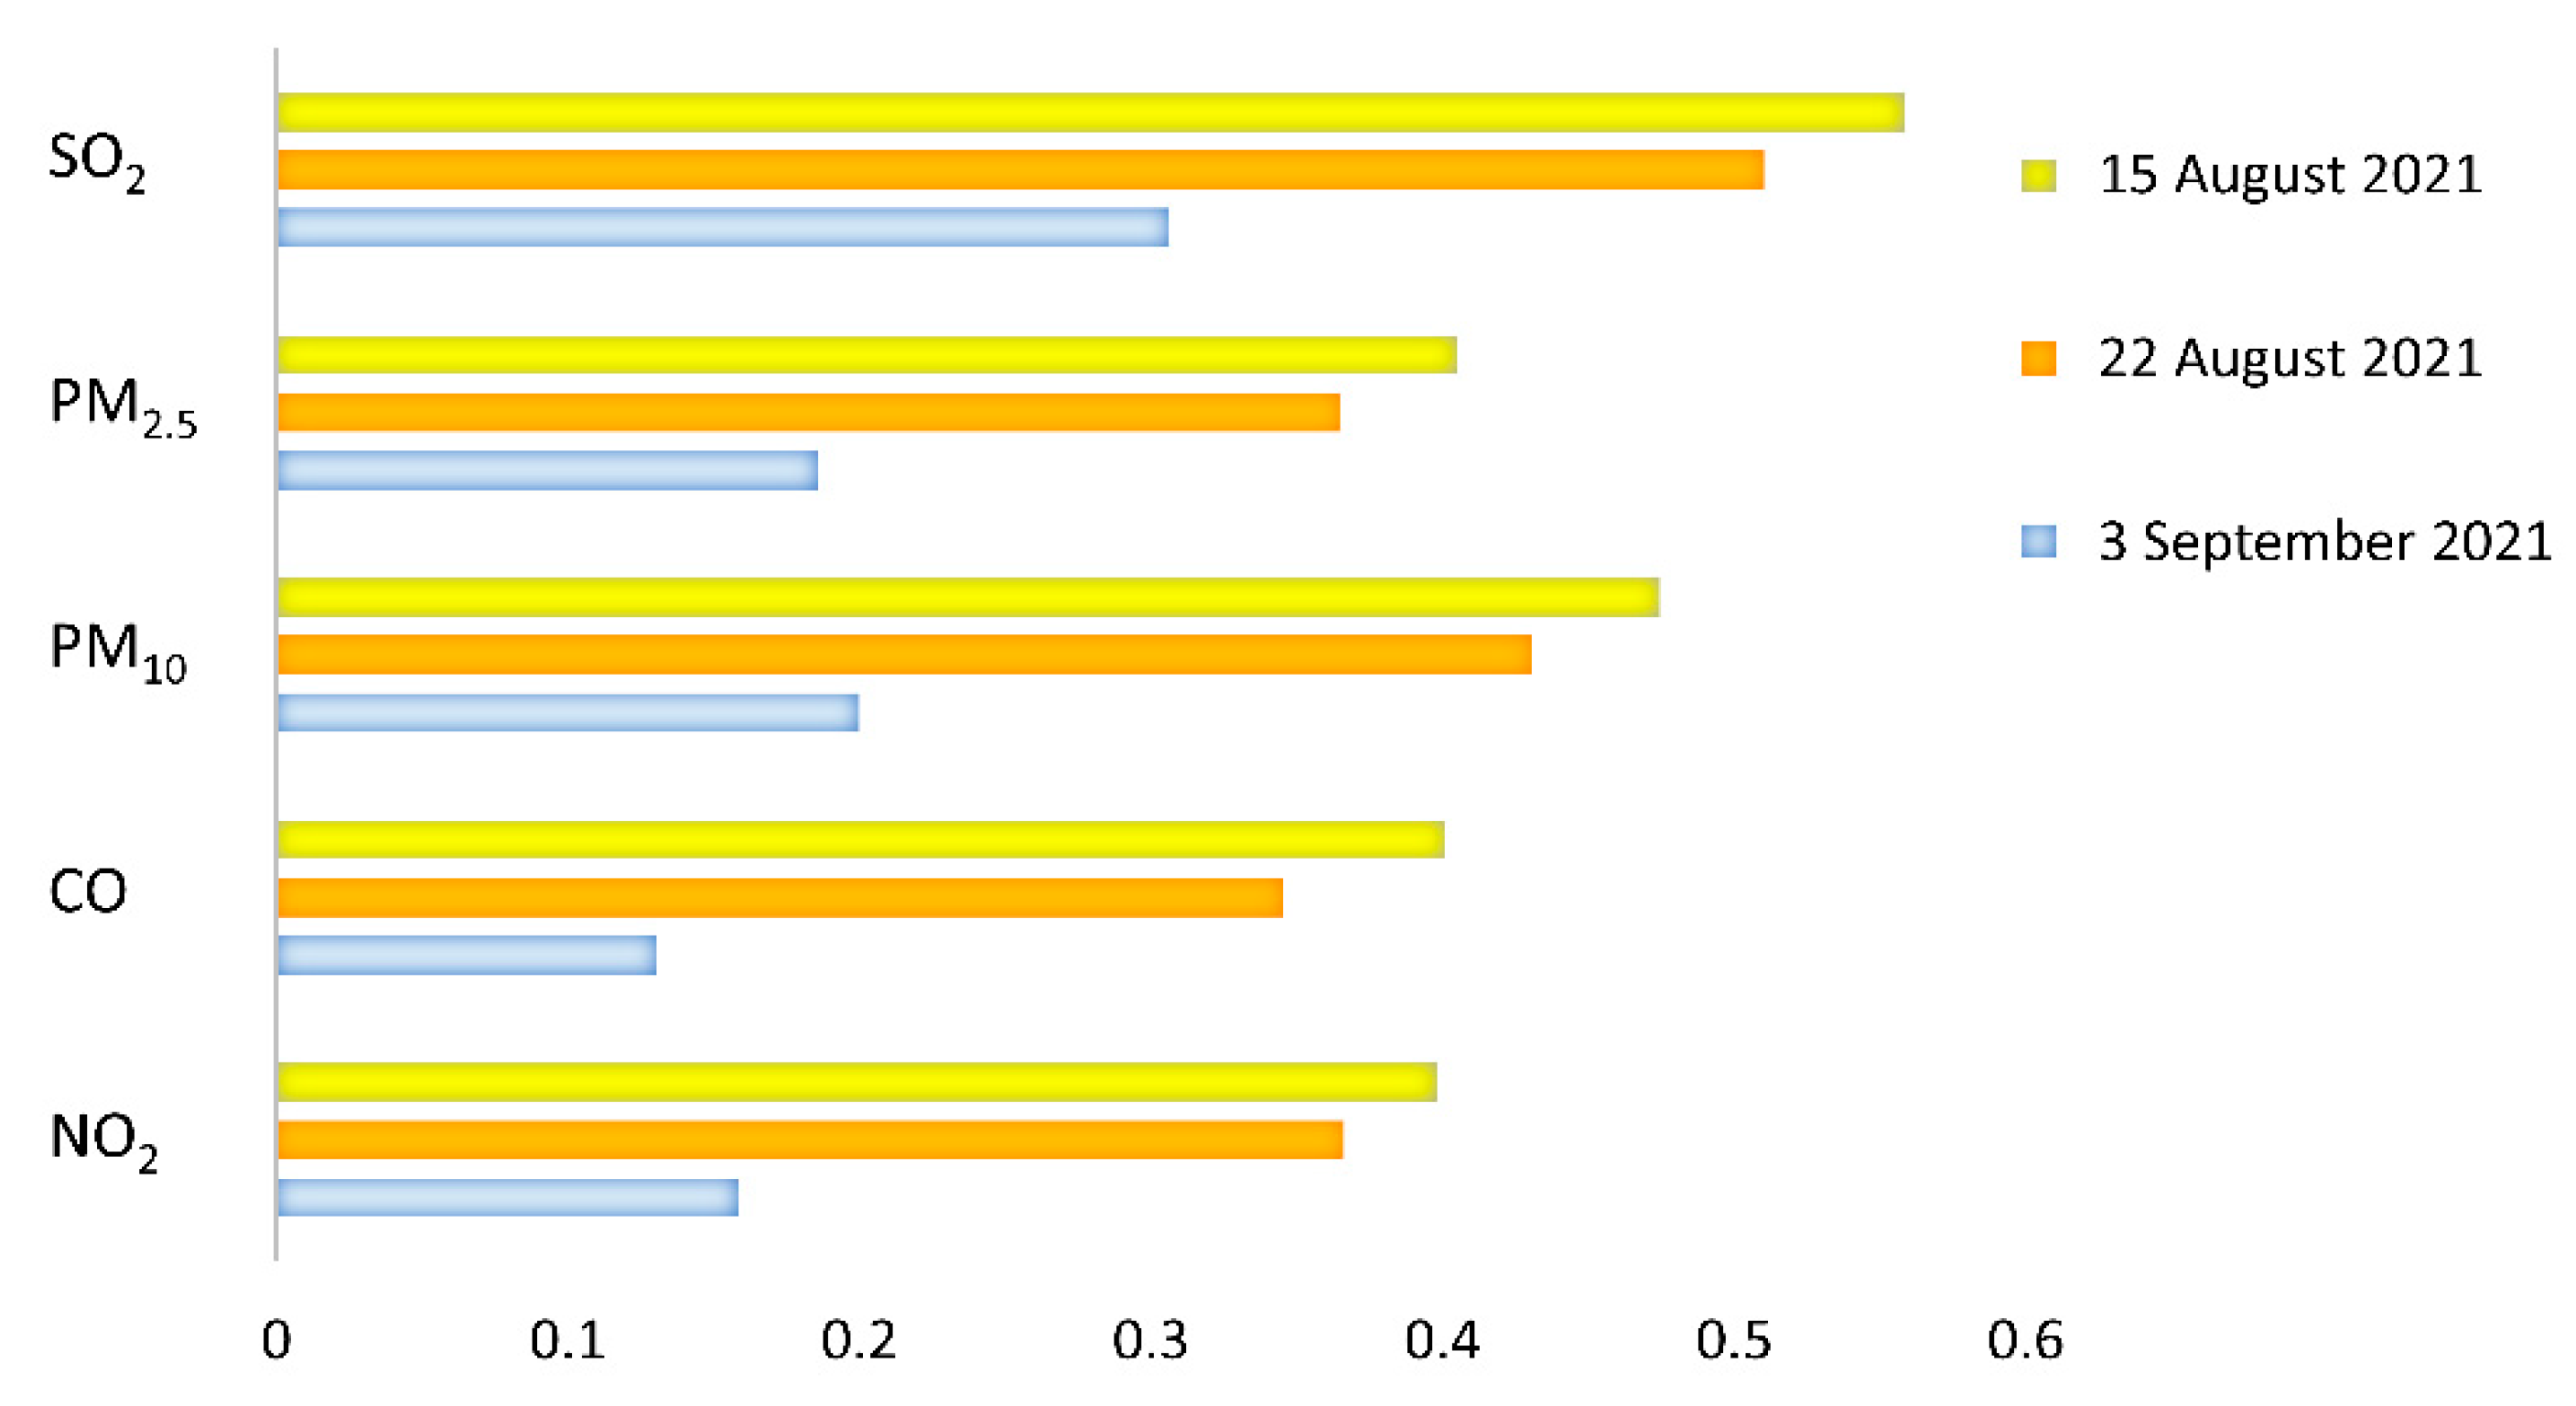
Statistically significant positive correlations were found between the studied pollutant concentrations and COVID-19 rates at all the examined time points (except CO on 3 September) throughout the Delta wave (Figure 3). For all five pollutants, the positive association was the strongest at the first time point and became slightly weaker with time. SO2: r = 0.56, p < 0.01; r = 0.51, p < 0.01; r = 0.31, p < 0.01; PM2.5: r = 0.4, p < 0.01; r = 0.37, p < 0.01; r = 0.19, p = 0.01; PM10: r = 0.47, p < 0.01; r = 0.43, p < 0.01; r = 0.2, p = 0.005; CO: r = 0.4, p < 0.01; r = 0.35, p < 0.01; r = 0.13, p = 0.07; and NO2: r = 0.4, p < 0.01; r = 0.37, p < 0.01; r = 0.16, p = 0.03 on 15 August, 22 August, and 3 September, respectively, (see supplementary Table S2).

3.4. Multivariate Linear Regressions

Multivariate linear regression models were used to predict the COVID-19 rates on two of the selected dates: 15 August and 3 September, based on the following parameters: municipality’s population size, density, rate of elderly people, rate of the population with a second dose of the COVID-19 vaccine, and the concentrations of the five examined air pollutants. Due to the significant correlation between the air pollutant concentrations (data not shown) [10] and to avoid collinearity, we developed different models for each date (two dates: 15 August and 3 September), and for each pollutant (five pollutants: NO2, CO, PM10, PM2.5, and SO2) using only one pollutant in each model, resulting in ten different models. Of note, all the models were statistically significant (p < 0.05).
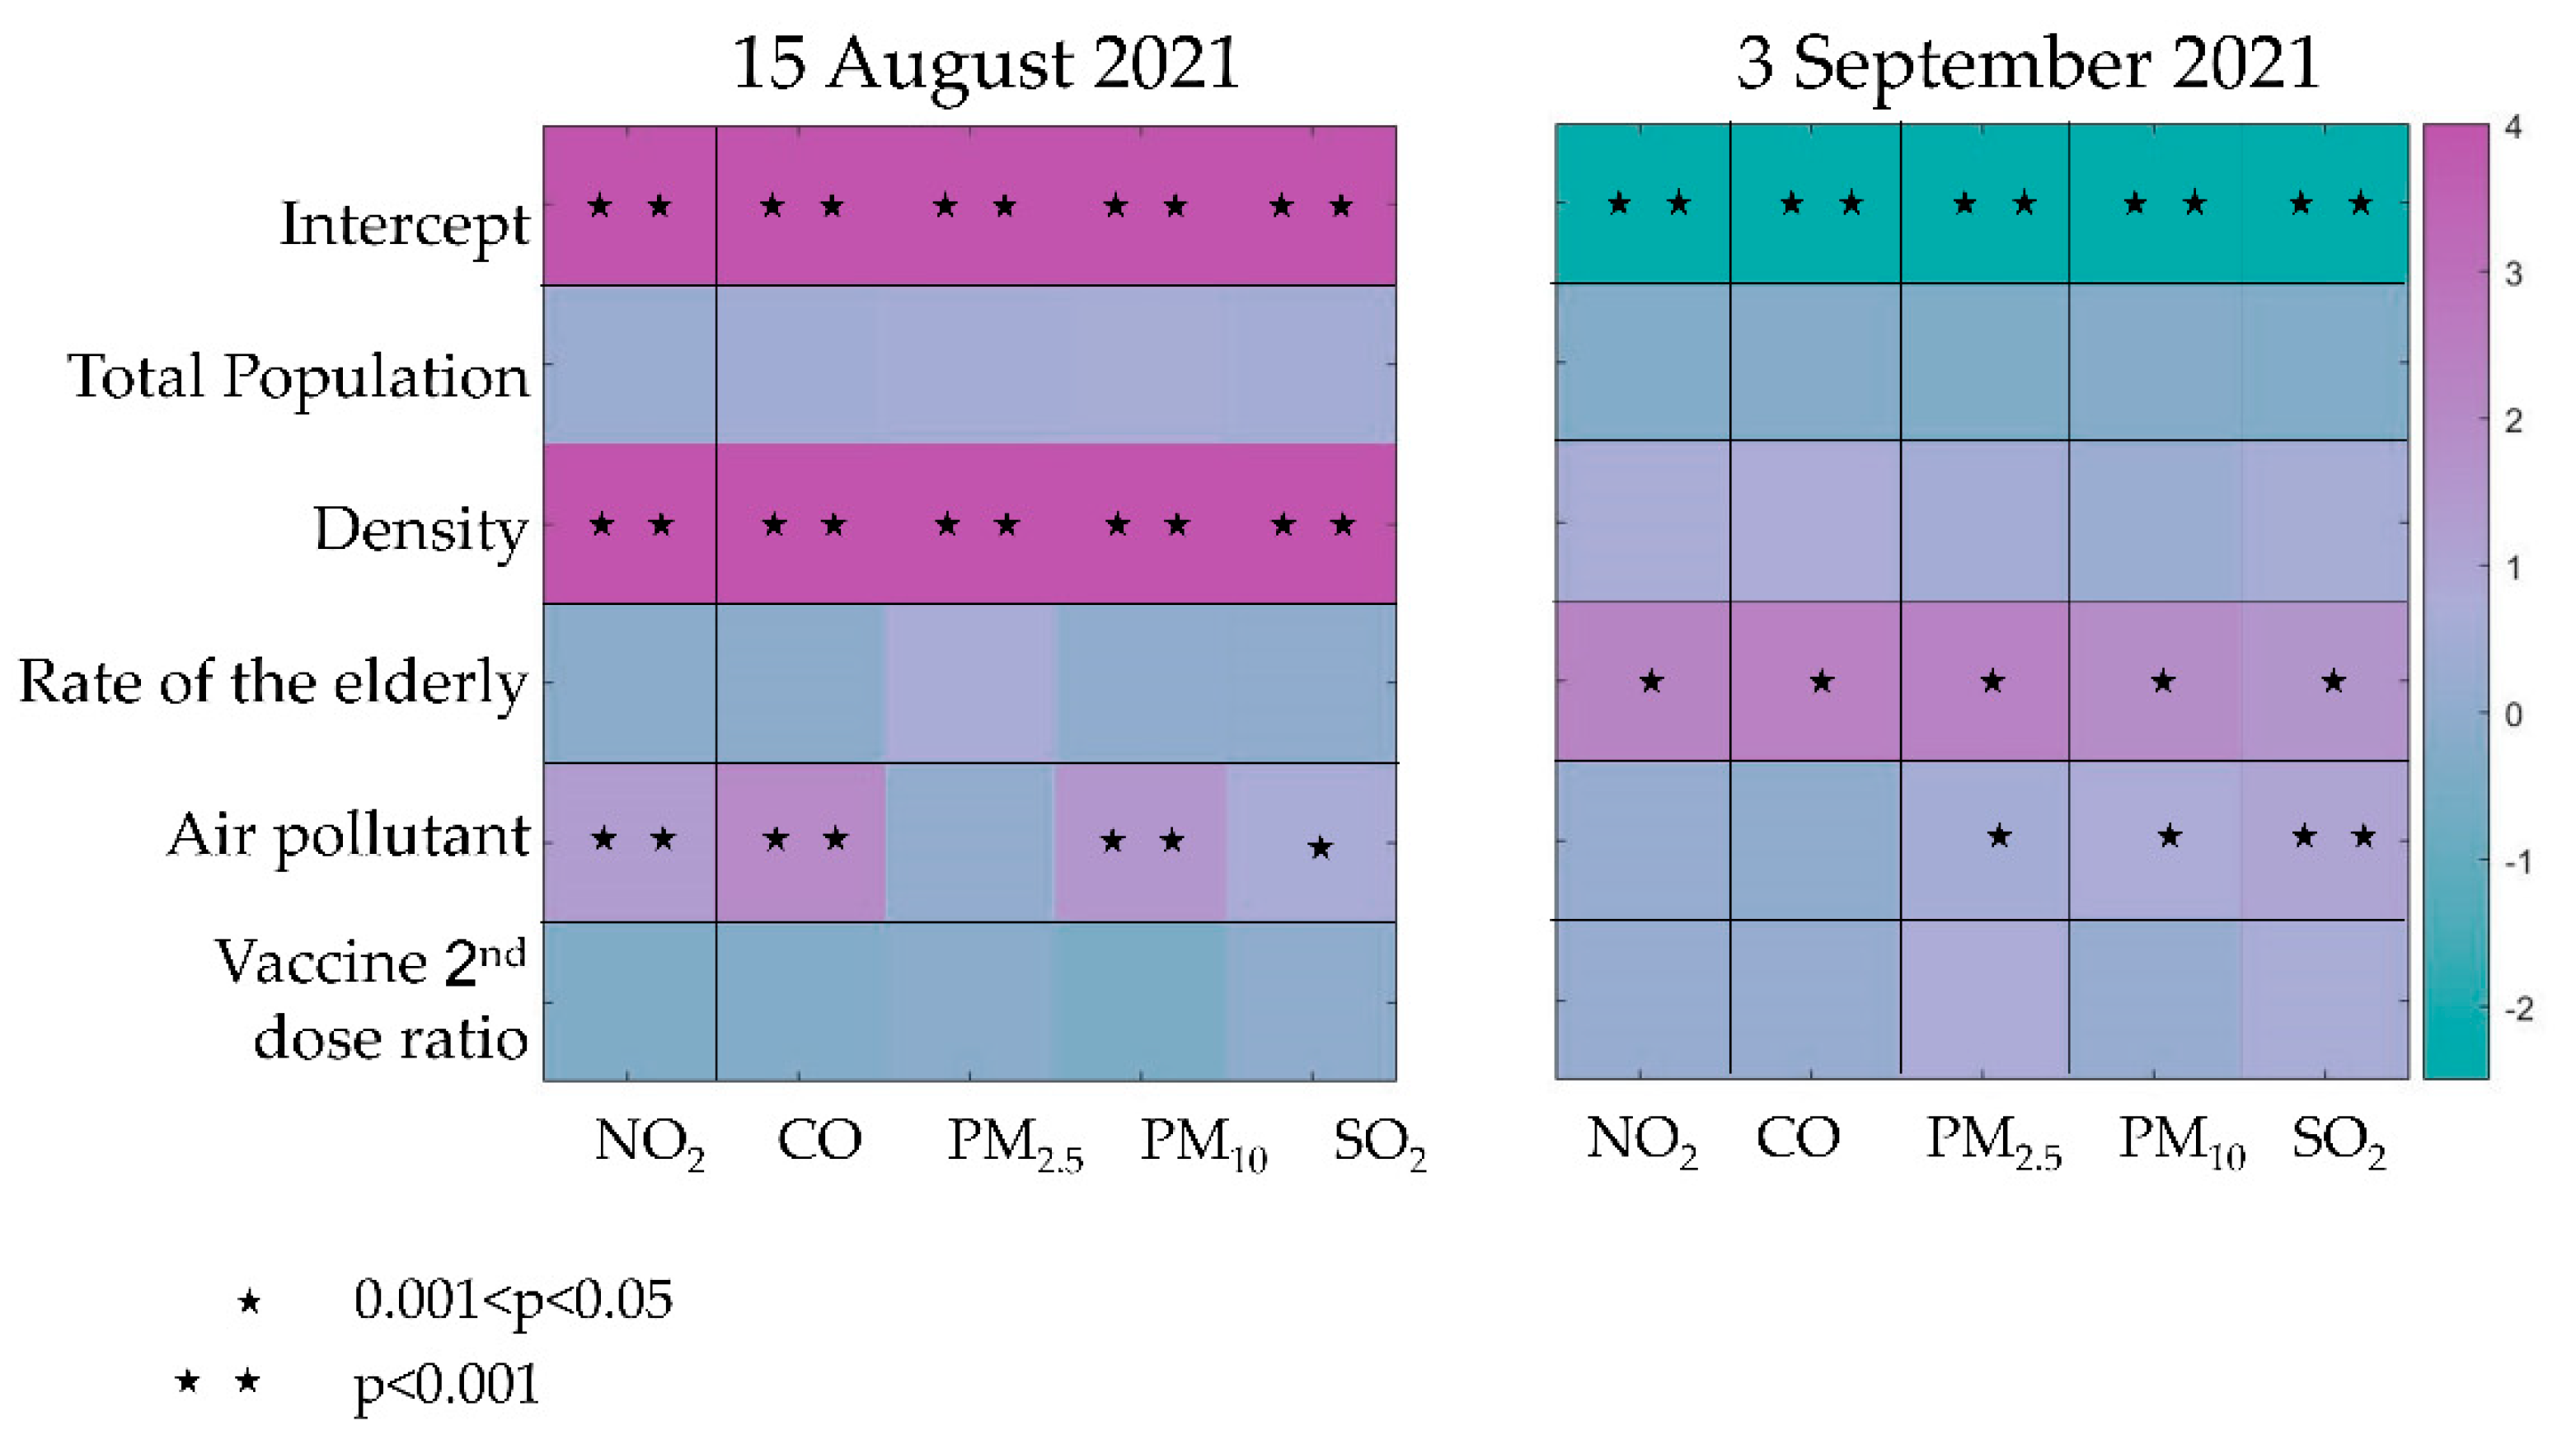
Population density was positively associated with COVID-19 rates on both dates, but this association was statistically significant (p < 0.001) only in the models that predicted COVID-19 rates on 15 August. Additionally, the proportion of the elderly (>60) was positively associated with COVID-19 rates on both dates but was statistically significant (p < 0.03) only in the models that predicted COVID-19 rates on 3 September. The rate of people with a second dose of the vaccine was negatively associated with COVID-19 rates on 15 August and positively associated with COVID-19 rates on 3 September. However, these associations were not statistically significant (see supplementary Table S2). All air pollutant concentrations in 2020 were positively associated with COVID-19 rates on both dates. Most of these associations were statistically significant: 15 August: NO2 (β = 1.3, p < 0.001), CO (β = 2.0, p < 0.001), PM10 (β = 1.56, p < 0.001), and SO2 (β = 0.72, p = 0.02); 3 September: PM2.5 (β = 0.56, p = 0.02), PM10 (β = 0.74, p = 0.008), and SO2 (β = 1.05, p = 0.001) (Figure 4).

4. Discussion

The aim of this study was to examine the associations between the Israeli population’s chronic exposure to air pollution (during 2020), demographics, and health factors to COVID-19 morbidity, during the Delta variant morbidity wave.

4.1. Air Pollutant Concentrations in Israel during 2016–2020

The declining trend observed in SO2 concentrations between 2016 to 2019 (from 1.79 μg/m3 to 1.06 μg/m3, respectively) (see supplementary Figure S1), was attributed to the national policy of gradually switching from coal-dominated electricity production to natural gas in Israeli power plants [31]. The sharp declines in four of the air pollutants’ national average concentrations (except SO2) (see supplementary Figure S1), observed in 2020, was attributed to that year’s two major lockdowns that were implemented in Israel (from mid-March until the third week of April and from 18 September to 17 October), and to additional local lockdowns and limitations introduced during June and July in neighborhoods and towns suffering from high COVID-19 infection rates. Although the concentration of pollutants generally attributed to transportation emissions dropped in 2020, SO2 levels did not change significantly (see supplementary Figure S1), possibly due to the 0.6% increase in electricity consumption compared to 2019. This increase was related to climatic events (such as atypical heat waves leading to intense use of air conditioning), causing an increase of 1.9% in electricity consumption and eliminating the 1.3% consumption reduction attributed to COVID-19 lockdowns and the decreased economic activity in 2020 [32].

4.2. Associations between Demographic Parameters, Vaccination Level, and Rates of Positive Cases

COVID-19 rates were positively correlated with municipality total population size and population density (per Km2) (Figure 2). Such positive associations were also found in our previous study at the first, pre-second, and second COVID-19 Israeli morbidity waves (in March, July, and September 2020, respectively). Nevertheless, in the third local morbidity wave (January 2021), which was characterized by wide-scale morbidity, population density and municipality total population were not statistically associated with COVID-19 morbidity rates. The impact of population density and the total population size at that time was possibly diminished by the fast-growing vaccination campaign, and also by socioeconomic parameters that might have boosted inhouse infection chains during the lockdown, especially in large households or multigenerational households where the youth and the elderly tend to share accommodation. Both characterized cities and towns with a low socioeconomic status [10].
Interestingly, in the Delta morbidity wave, socioeconomic cluster positively correlated with COVID-19 rates at all time points, and population natural growth was negatively correlated with COVID-19 rates at all time points. The comparison of these finding with our opposite findings from the third wave mentioned above [10] suggested that the initiation of the Delta wave, as well as its progress, had different characteristics from the previous morbidity waves in Israel. While in the third morbidity wave a lockdown dramatically reduced public gatherings and the tourism sector was almost at a halt, perhaps making inhouse infection chains in large or multigenerational households a dominant infectious mechanism, in the summer of 2021, the Delta wave was characterized by no lockdown and relatively vibrant activity in the tourism and aviation sectors. In addition, in May 2021, prior to the Delta wave initiation, infection rates had decreased to a few dozen cases daily, mostly in people that were unvaccinated or returning from abroad. The COVID-19 morbidity rate then began to rise exponentially in June 2021, with more than 98% of the positive cases attributed to the Delta variant [18]. These different conditions might have led to an initial spread of the Delta variant in communities with a higher socioeconomic status (which fit with our findings) that tend to travel abroad more frequently, before it had spread to the wider Israeli population.
In the current study, the proportion of elderly was positively correlated with COVID-19 morbidity rates (Figure 2). The total population size, population density, and the rate of elderly people (also in Figure 2) were also reported to be positively corelated with COVID-19 morbidity and mortality rates in other studies around the world. Yu et al. [33], who investigated the spatial relationship between COVID-19 infection and mortality, population density, and PM2.5 concentrations in 251 countries, reported that population density was strongly correlated with COVID-19 infection and mortality rates, along with PM2.5 concentrations. P’aez-Osuna et al. [34] reported a higher COVID-19 mortality rate during the first and second waves of the COVID-19 pandemic in Mexico in the denser municipalities of the state of Sinaloa. In our previous study conducted on 36 OECD countries, we found positive correlations between state population density and the rate of COVID-19 death on the 40th and 80th days since the reporting of the first confirmed case of COVID-19 [4].
The observed partial negative correlation between the COVID-19 rate and the rate of population that had received the first and second vaccination dose (22 August and 15 August, respectively) (see supplementary Table S1), was attributed to the waning immunity against the Delta variant observed in all age groups several months after receiving the BNT162b2 vaccine second dose. As vaccine protection waned in the Israeli population since mid-June 2021, both the infection rate and rate of severe morbidity in the elderly population (>60) were higher among persons who became fully vaccinated in January 2021 in comparison to those fully vaccinated two months later. Similar trends in infection rates were reported in other age groups (40–59 and 16–39 years old), when the infection rate among those fully vaccinated at the first authorized time was higher than for those who got fully vaccinated two months later [18]. At that time, these findings provided an epidemiologic basis for the decision of the Israeli Ministry of Health to approve the administration of a booster (third vaccine dose) to those individuals that were vaccinated five months earlier (or more) on 30 July 2021 in the middle of the Delta morbidity wave increasing phase (Figure 1), which probably impacted the Delta wave’s magnitude and duration.

4.3. Associations between Air Pollutant Concentrations and Rates of Positive Cases

In this study, we examined the association between the annual average concentrations of five air pollutants (PM10, PM2.5, NO2, CO, and SO2) and COVID-19 rates in 280 Israeli municipalities during the summer of 2021 Delta variant morbidity wave increasing phase (15 August and 22 August) and its morbidity peak (3 September). Statistically significant positive correlations were found between the studied pollutant concentrations and COVID-19 rates at all the examined time points throughout the Delta morbidity wave (except CO on 3 September) (Figure 3). For all five pollutants, the positive association was the strongest at the first time point and became slightly weaker with time.
Ample studies have demonstrated the association between chronic exposure to ambient air pollutants and COVID-19 elevated levels of morbidity and/or mortality. Various studies have been conducted since 2020 on a regional scale of counties, metropolitan areas, and municipalities, in China, India, Bangladesh, the Republic of Korea, Canada, USA, Mexico, Italy, Austria, Spain, the Netherlands, Israel, and many other countries [16]. Several studies conducted on a multi-state or global level have also observed a similar association to the one found in the current study between chronic exposure to ambient air pollutants and COVID-19 morbidity and/or mortality [4,5,6]. The majority of the published studies used COVID-19 data from March 2020 until 2021′s first quarter, including the early global morbidity waves caused by the SARS-CoV-2 original strain and its early lineages. Generally, positive associations were shown between PM2.5 and PM10 long-term exposure (and to a lesser extent NOx/NO2, O3, SO2, and CO) and elevated levels of COVID-19 morbidity and/or mortality [16].
Our previous study, conducted on COVID-19 morbidity data from 279 Israeli municipalities, included the first three local morbidity waves. While the first two waves demonstrated positive correlations between nearly all air pollutant concentrations and COVID-19 rates, no such correlation was found in the third morbidity wave [10], which was characterized by an Alpha B.1.1.7 variant dominancy [18,20]. At that time point, the morbidity pattern was associated to socioeconomic and demographic parameters, which characterized municipalities in low socioeconomic clusters, and the COVID-19 morbidity rate was also affected by the growing vaccination campaign of primarily elderly citizens [10].
In contrast to the third wave, in the fourth wave (dominated by the Delta variant), morbidity began to increase (Figure 1), as vaccine protection waned in the Israeli population, and the rate of infection in the elderly population also surged among persons who became fully vaccinated 5–6 months earlier or more [18]. We suggest that under these conditions, air pollution long-term exposure once again became a significant additional factor impacting the COVID-19 morbidity rate together with demographic factors.
Currently, a substantial growing body of evidence supports the positive association between chronic exposure to air pollution and exacerbated COVID-19 morbidity and mortality rates [16]. Nevertheless, the mechanism by which ambient air pollution effects COVID-19 morbidity, severity, and mortality remains largely unclear to date, although several pathways involving increased human sensitivity to pathogens had been suggested. These pathways include elevated human sensitivity to respiratory pathogens due to increased oxidative stress via air pollution exposure [35]; the creation of abnormalities in the human respiratory tract cilia structure affecting its function, reducing mucociliary clearance ability, consequently reducing the removal of and increasing sensitivity to inhaled particles and respiratory pathogens due to air pollution exposure [36]; and an additional hypothesis about PM aerosols serving as a vector for transporting bacteria and viruses deeply into the lungs through airborne diffusion (in high PM and SARS-CoV-2 concentration environments) [12,15]. Altogether or separately, these pathways enhance the SARS-CoV-2 virus transmission mechanism or reduce the body’s ability to protect itself against it. These potential pathways need to be further examined.

4.4. Multivariate Linear Regressions

The multivariate linear regression models for 15 August (morbidity increasing phase) and 3 September (morbidity wave peak), showed similar trends (Figure 4) to the correlations results (Figure 2 and Figure 3). A positive association of population density with COVID-19 rates was statistically significant only in the 15 August models, i.e., in the spreading phase of the wave. Therefore, should future waves occur, dominated by highly infectious variants, it would be advisable to take preemptive health and safety measures in denser municipalities where past higher COVID-19 morbidity rates were found in order to slow down the general COVID-19 infection rate. At the morbidity wave’s peak (3 September), population density showed a similar trend of higher morbidity rates in densely populated areas, although this was not statistically significant, implying that morbidity was already much more widespread in dense and non-dense municipalities alike, thereby reducing the effectiveness of density-based preventive health policies. Since a governmental or local lockdown policy was not applied in the fourth wave, it was challenging to compare these results to the previous three morbidity waves, in which state-wide or regional lockdowns were implemented [10].
The proportion of the elderly in the general population was positively associated with COVID-19 on both dates but was only statistically significant in the 3 September models, together with the non-statistically significant COVID-19 vaccine second dose ratio (Figure 4), with both findings strengthening ours and others previous findings about a waning immunity against the Delta variant. Such waning immunity was reported in Israel during July 2021 for all age groups that were vaccinated by two doses earlier that year, when they were first eligible, and especially for elderly people who were able to get fully vaccinated first, back in January 2021 [18].
Interestingly, in parallel with the waning vaccine immunity of the fourth wave, the 2020 air pollutant concentrations became once again a dominant factor, as was the case in the first two waves, impacting COVID-19 morbidity rates, with most pollutants (excluding PM2.5 on 15 August and NO2 and CO on 3 September) being positively associated with COVID-19 rates on both dates (Figure 4). In our previous research, about a year earlier (July–September 2020), at the pre-second wave peak (24 July), PM2.5, PM10, and NOx mean 2016–2019 concentrations had a significant positive association with COVID-19 rates, while the trend in the second wave (27 September) was similar only for PM2.5 concentrations. Later, during the third wave, this positive association with air pollution concentrations was not found [10]. As reported here, the positive association between air pollutant concentrations and COVID-19 morbidity rates recurred during the fourth morbidity wave, although most air pollutant average concentrations were lower in 2020 compared with the 2016–2019 concentrations (see supplementary Figure S1).
Overall, our results are supported by numerous recently published studies conducted on a global, statewide, and local-municipalities scale. This study’s strengths include: (a) the focus on 280 Israeli municipalities, comprising the vast majority (99%) of the Israeli population; (b) the analysis of the highly reliable databases of the Israeli Ministry of Health COVID-19 data, the Ministry of Environmental Protection 2020 air pollution exposure data, and the Israeli Central Bureau of Statistics demographic data; (c) the robustness of the results, in which different statistical tools led to similar results. Yet, it is vital to point out the current study’s limitations: (a) the lack of 2021 exposure levels to the above air pollutants and (b) the ecological nature of this study pointing out correlations between COVID-19 and air pollutions without a causation, which will require further epidemiological research. Despite the above limitations, we successfully showed an association between chronic exposure of the vast majority of the Israeli population to major air pollutant levels, demographic and health parameters, and COVID-19 rates in 280 Israeli municipalities.

5. Conclusions

In this study, we showed statistically significant nationwide positive associations between COVID-19 rates and chronic exposure of the population to five main air pollutants, municipalities’ total population, population density, the rate of elderly population and socioeconomic cluster in 280 Israeli municipalities throughout the 2021 Delta-variant-dominated morbidity wave.
Our findings could be important in assisting policy makers to better manage health policy measures in future COVID-19 waves in at least two aspects: the study emphasized that chronic exposure to air pollution might increase morbidity rates and may affect the pandemic progress, and it also strengthened the urgent need to reduce air pollution and its harmful effects. Additionally, this study highlighted COVID-19-vulnerable populations during the Delta morbidity wave progress stages, specifically those in densely populated municipalities and the elderly. It also emphasized that the decision of which health policies to implement, such as lockdowns or ‘business as usual’, should strongly take into account the policy’s impact on those vulnerable populations.
Regardless of the current pandemic, the adverse health outcomes stemming from long-term exposure to various air pollutants has long been recognized worldwide by the scientific community and decision makers. Yet, severe ambient air pollution is still responsible annually for the estimated premature deaths of 4.2 million people worldwide. Therefore, only an uncompromising policy for a dramatic reduction in air pollution (including the electrification of transportation systems and an accelerated shift to renewable energy sources, supplemented by enhanced enforcement of WHO air quality standards) can lead to improved public health, reducing chronic respiratory and cardiovascular morbidities and their related premature death-toll.

Supplementary Materials

The following supporting information can be downloaded at: https://www.mdpi.com/article/10.3390/atmos13111845/s1, Figure S1: Annual average concentrations of air pollutants in Israel: 2016–2020: NO2, CO, PM10, PM2.5, and SO2.; Table S1: Spearman’s correlation results: coefficients and p-values of the correlations between demographic parameters and COVID-19 morbidity rates at specific time points in the Delta variant morbidity wave.; Table S2: Multivariate linear regressions results: coefficients and p-values for predicting the COVID-19 rate based on a single air pollutant and selected demographic features.

Author Contributions

A.L. and Z.B.-I.: A.L.—conceptualization, data curation, investigation, methodology, project administration, validation, visualization, writing—original draft, writing—review & editing. Z.B.-I.—conceptualization, data curation, formal analysis, investigation, methodology, project administration, software, validation, visualization, writing—original draft, writing—review & editing. All authors have read and agreed to the published version of the manuscript.

Funding

This research received no external funding.

Institutional Review Board Statement

Not applicable.

Informed Consent Statement

Not applicable.

Data Availability Statement

Not applicable.

Acknowledgments

We thank Ilan Levy for his assistance in the collection of the air pollution data.

Conflicts of Interest

The authors declare that they have no known competing financial interests or personal relationships that could have appeared to influence the work reported in this paper.

Abbreviations

World Health Organization (WHO); particulate matter (PM); fine PM with diameter less than 2.5 μm (PM2.5); fine PM with diameter less than 10 μm (PM10); nitrogen dioxides (NO2); sulfur dioxide (SO2); the novel coronavirus disease (COVID-19); the novel coronavirus (SARS-CoV-2); variant of concern (VOC); Israel Central Bureau of Statistics (CBS); The Israeli Ministry of Environmental Protection (IMoEP).

References

  1. World Health Organization. Ambient (outdoor) air pollution. 2021. Available online: https://www.who.int/en/news-room/fact-sheets/detail/ambient-(outdoor)-air-quality-and-health (accessed on 24 August 2022).
  2. Loomis, D.; Grosse, Y.; Lauby-Secretan, B.; El Ghissassi, F.; Bouvard, V.; Benbrahim-Tallaa, L.; Guha, N.; Bann, R.; Straif, K. The carcinogenicity of outdoor air pollution. Lancet Oncol. 2013, 14, 1262. [Google Scholar] [CrossRef]
  3. World Health Organization. WHO Global Air Quality Guidelines. Particulate Matter (PM2.5 And PM10), Ozone, Nitrogen Dioxide, Sulfur Dioxide and Carbon Monoxide; World Health Organization: Geneva, Switzerland, 2021; Licence: CC BY-NC-SA 3.0 IGO. [Google Scholar]
  4. Barnett-Itzhaki, Z.; Levi, A. Effects of chronic exposure to ambient air pollutants on COVID-19 morbidity and mortality-A lesson from OECD countries. Environ. Res. 2021, 195, 110723. [Google Scholar] [CrossRef] [PubMed]
  5. Fernández, D.; Giné-Vázquez, I.; Liu, I.; Yucel, R.; Ruscone, M.N.; Morena, M.; García, V.G.; Haro, J.M.; Tyrovolas, S. Are environmental pollution and biodiversity levels associated to the spread and mortality of COVID-19? A four-month global analysis. Environ. Pollut. 2021, 271, 116326. [Google Scholar] [CrossRef] [PubMed]
  6. Solimini, A.; Filipponi, F.; Fegatelli, D.A.; Caputo, B.; De Marco, C.M.; Spagnoli, A.; Vestri, A.R. A global association between Covid-19 cases and airborne particulate matter at regional level. Sci. Rep. 2021, 11, 1–7. [Google Scholar] [CrossRef] [PubMed]
  7. Cole, M.; Ozgen, C.; Strobl, E. Air pollution exposure and COVID-19. Institute for the Study of Labor, Discussion Paper No. 13367. 2020. Available online: https://ssrn.com/abstract=3628242 (accessed on 24 August 2022).
  8. Conticini, E.; Frediani, B.; Caro, D. Can atmospheric pollution be considered a co-factor in extremely high level of SARS-CoV-2 lethality in Northern Italy? Environ. Pollut. 2020, 261, 114465. [Google Scholar] [CrossRef] [PubMed]
  9. De Angelis, E.; Renzetti, S.; Volta, M.; Donato, F.; Calza, S.; Placidi, D.; Lucchini, R.J.; Rota, M. COVID-19 incidence and mortality in Lombardy, Italy: An ecological study on the role of air pollution, meteorological factors, demographic, and socioeconomic variables. Environ. Res. 2021, 195, 110777. [Google Scholar] [CrossRef]
  10. Levi, A.; Barnett-Itzhaki, Z. Effects of chronic exposure to ambient air pollutants, demographic, and socioeconomic factors on COVID-19 morbidity: The Israeli case study. Environ. Res. 2021, 202, 111673. [Google Scholar] [CrossRef]
  11. Sasidharan, M.; Singh, A.; Torbaghan, M.E.; Parlikad, A.K. A vulnerability-based approach to human-mobility reduction for countering COVID-19 transmission in London while considering local air quality. Sci. Total Environ. 2020, 741, 140515. [Google Scholar] [CrossRef]
  12. Setti, L.; Passarini, F.; De Gennaro, G.; Barbieri, P.; Licen, S.; Perrone, M.G.; Piazzalunga, A.; Borelli, M.; Palmisani, J.; Di Gilio, A.; et al. Potential role of particulate matter in the spreading of COVID-19 in Northern Italy: First observational study based on initial epidemic diffusion. BMJ Open 2020, 10, e039338. [Google Scholar] [CrossRef]
  13. Tian, H.; Liu, Y.; Song, H.; Wu, C.H.; Li, B.; Kraemer, M.U.; Zheng, P.; Yan, X.; Jia, G.; Zheng, Y.; et al. Risk of COVID-19 is associated with long-term exposure to air pollution. medRxiv 2020. medRxiv:04.21.20073700. [Google Scholar]
  14. Wu, X.; Nethery, R.C.; Sabath, B.M.; Braun, D.; Dominici, F. Exposure to air pollution and COVID-19 mortality in the United States: A nationwide cross-sectional study. medRxiv 2020, medRxiv:04.05.20054502. arXiv:04.05.20054502. [Google Scholar]
  15. Zoran, M.A.; Savastru, R.S.; Savastru, D.M.; Tautan, M.N. Assessing the relationship between surface levels of PM2.5 and PM10 particulate matter impact on COVID-19 in Milan, Italy. Sci. Total Environ. 2020, 738, 139825. [Google Scholar] [CrossRef] [PubMed]
  16. Marquès, M.; Domingo, J.L. Positive association between outdoor air pollution and the incidence and severity of COVID-19. A review of the recent scientific evidence. Environ. Res. 2022, 203, 111930. [Google Scholar] [CrossRef] [PubMed]
  17. O’Toole, A.; Scher, E.; Rambaut, A. SARS-CoV-2 lineages. 2022. Available online: https://cov-lineages.org/lineage_list.html (accessed on 13 September 2022).
  18. Goldberg, Y.; Mandel, M.; Bar-On, Y.M.; Bodenheimer, O.; Freedman, L.; Haas, E.J.; Milo, R.; Alroy-Preis, S.; Ash, N.; Huppert, A. Waning immunity after the BNT162b2 vaccine in Israel. N. Engl. J. Med. 2021, 385, e85. [Google Scholar] [CrossRef]
  19. Sah, P.; Vilches, T.N.; Moghadas, S.M.; Fitzpatrick, M.C.; Singer, B.H.; Hotez, P.J.; Galvani, A.P. Accelerated vaccine rollout is imperative to mitigate highly transmissible COVID-19 variants. EClinicalMedicine 2021, 35, 100865. [Google Scholar] [CrossRef]
  20. CDC. SARS-CoV-2 Variant Classifications and Definitions. Updated 26 April 2022. Available online: https://www.cdc.gov/coronavirus/2019-ncov/variants/variant-classifications.html (accessed on 24 July 2022).
  21. Zhang, M.; Liang, Y.; Yu, D.; Du, B.; Cheng, W.; Li, L.; Yu, Z.; Luo, S.; Zhang, Y.; Wang, H.; et al. A systematic review of vaccine breakthrough infections by SARS-CoV-2 Delta variant. Int. J. Biol. Sci. 2022, 18, 889. [Google Scholar] [CrossRef]
  22. Cahyadi, M.N.; Handayani, H.H.; Warmadewanthi, I.D.A.A.; Rokhmana, C.A.; Sulistiawan, S.S.; Waloedjo, C.S.; Raharjo, A.B.; Endroyono; Atok, M.; Navisa, S.C.; et al. Spatiotemporal Analysis for COVID-19 Delta Variant Using GIS-Based Air Parameter and Spatial Modeling. Int. J. Environ. Res. Public Health 2022, 19, 1614. [Google Scholar] [CrossRef]
  23. Li, Z.; Tao, B.; Hu, Z.; Yi, Y.; Wang, J. Effects of short-term ambient particulate matter exposure on the risk of severe COVID-19. J. Infect. 2022, 84, 684–691. [Google Scholar] [CrossRef]
  24. Chen, Z.; Sidell, M.A.; Huang, B.Z.; Chow, T.; Martinez, M.P.; Lurmann, F.; Gilliland, F.D.; Xiang, A.H. The Independent Effect of COVID-19 Vaccinations and Air Pollution Exposure on Risk of COVID-19 Hospitalizations in Southern California. Am. J. Respir. Crit. Care Med. 2022. [Google Scholar] [CrossRef]
  25. Mathieu, E.; Ritchie, H.; Rodés-Guirao, L.; Appel, C.; Giattino, C.; Hasell, J.; Macdonald, B.; Dattani, S.; Beltekian, D.; Ortiz-Ospina, E.; et al. Coronavirus Pandemic (COVID-19). Published online at OurWorldInData.org. 2020. Available online: https://ourworldindata.org/coronavirus (accessed on 20 April 2022).
  26. CBS-Israel Central Bureau of Statistics. Municipalities in Israel—data files for processing 1999–2019. 2019; Updated 8 March 2022. Available online: https://www.cbs.gov.il/he/publications/doclib/2019/hamakomiot1999_2017/2019.xlsx (accessed on 20 April 2022).
  27. DataGov. Israel’s Government COVID-19 dataset website. 2022. Available online: https://data.gov.il/dataset/covid-19/resource/8a21d39d-91e3-40db-aca1-f73f7ab1df69 (accessed on 20 April 2022).
  28. Monteiro, A.; Miranda, A.; Borrego, C.; Vautard, R.; Ferreira, J.; Perez, A. Long-term assessment of particulate matter using CHIMERE model. Atmos. Environ. 2007, 41, 7726–7738. [Google Scholar] [CrossRef]
  29. Yuval; Levy, I.; Broday, D.M. Improving modeled air pollution concentration maps by residual interpolation. Sci. Total Environ. 2017, 598, 780–788. [Google Scholar] [CrossRef] [PubMed]
  30. Levy, I.; Karakis, I.; Berman, T.; Amitay, M.; Barnett-Itzhaki, Z. A hybrid model for evaluating exposure of the general population in Israel to air pollutants. Environ. Monit. Assess. 2020, 192, 1–10. [Google Scholar] [CrossRef] [PubMed]
  31. Bdal, D.; Glas, E.; Bachar, N. Israel’s Energy Sector 2019 Report. Israeli Ministry of Energy. 2022; (in Hebrew). Available online: https://www.gov.il/he/departments/publications/reports/energy_sector_2019 (accessed on 26 October 2022).
  32. Noga–The Israel Independent System Operator Ltd. Summary of Electricity Production and Consumption for 2020. 2020. Available online: https://www.noga-iso.co.il/media/pywdnn5o/%D7%A1%D7%99%D7%9B%D7%95%D7%9D-%D7%A9%D7%A0%D7%AA-2020.pdf (accessed on 5 April 2022).
  33. Yu, X.; Wong, M.S.; Kwan, M.P.; Nichol, J.E.; Zhu, R.; Heo, J.; Chan, P.W.; Chin, D.C.W.; Kwok, C.Y.T.; Kan, Z. COVID-19 infection and mortality: Association with PM2.5 concentration and population density—An exploratory study. ISPRS Int. J. Geoinf. 2021, 10, 123. [Google Scholar] [CrossRef]
  34. Páez-Osuna, F.; Valencia-Castañeda, G.; Rebolledo, U.A. The link between COVID-19 mortality and PM2.5 emissions in rural and medium-size municipalities considering population density, dust events, and wind speed. Chemosphere 2022, 286, 131634. [Google Scholar] [CrossRef] [PubMed]
  35. Mudway, I.S.; Kelly, F.J.; Holgate, S.T. Oxidative stress in air pollution research. Free Radic. Biol. Med. 2020, 151, 2–6. [Google Scholar] [CrossRef] [PubMed]
  36. Cao, Y.; Chen, M.; Dong, D.; Xie, S.; Liu, M. Environmental pollutants damage airway epithelial cell cilia: Implications for the prevention of obstructive lung diseases. Thorac. Cancer 2020, 11, 505–510. [Google Scholar] [CrossRef] [Green Version]
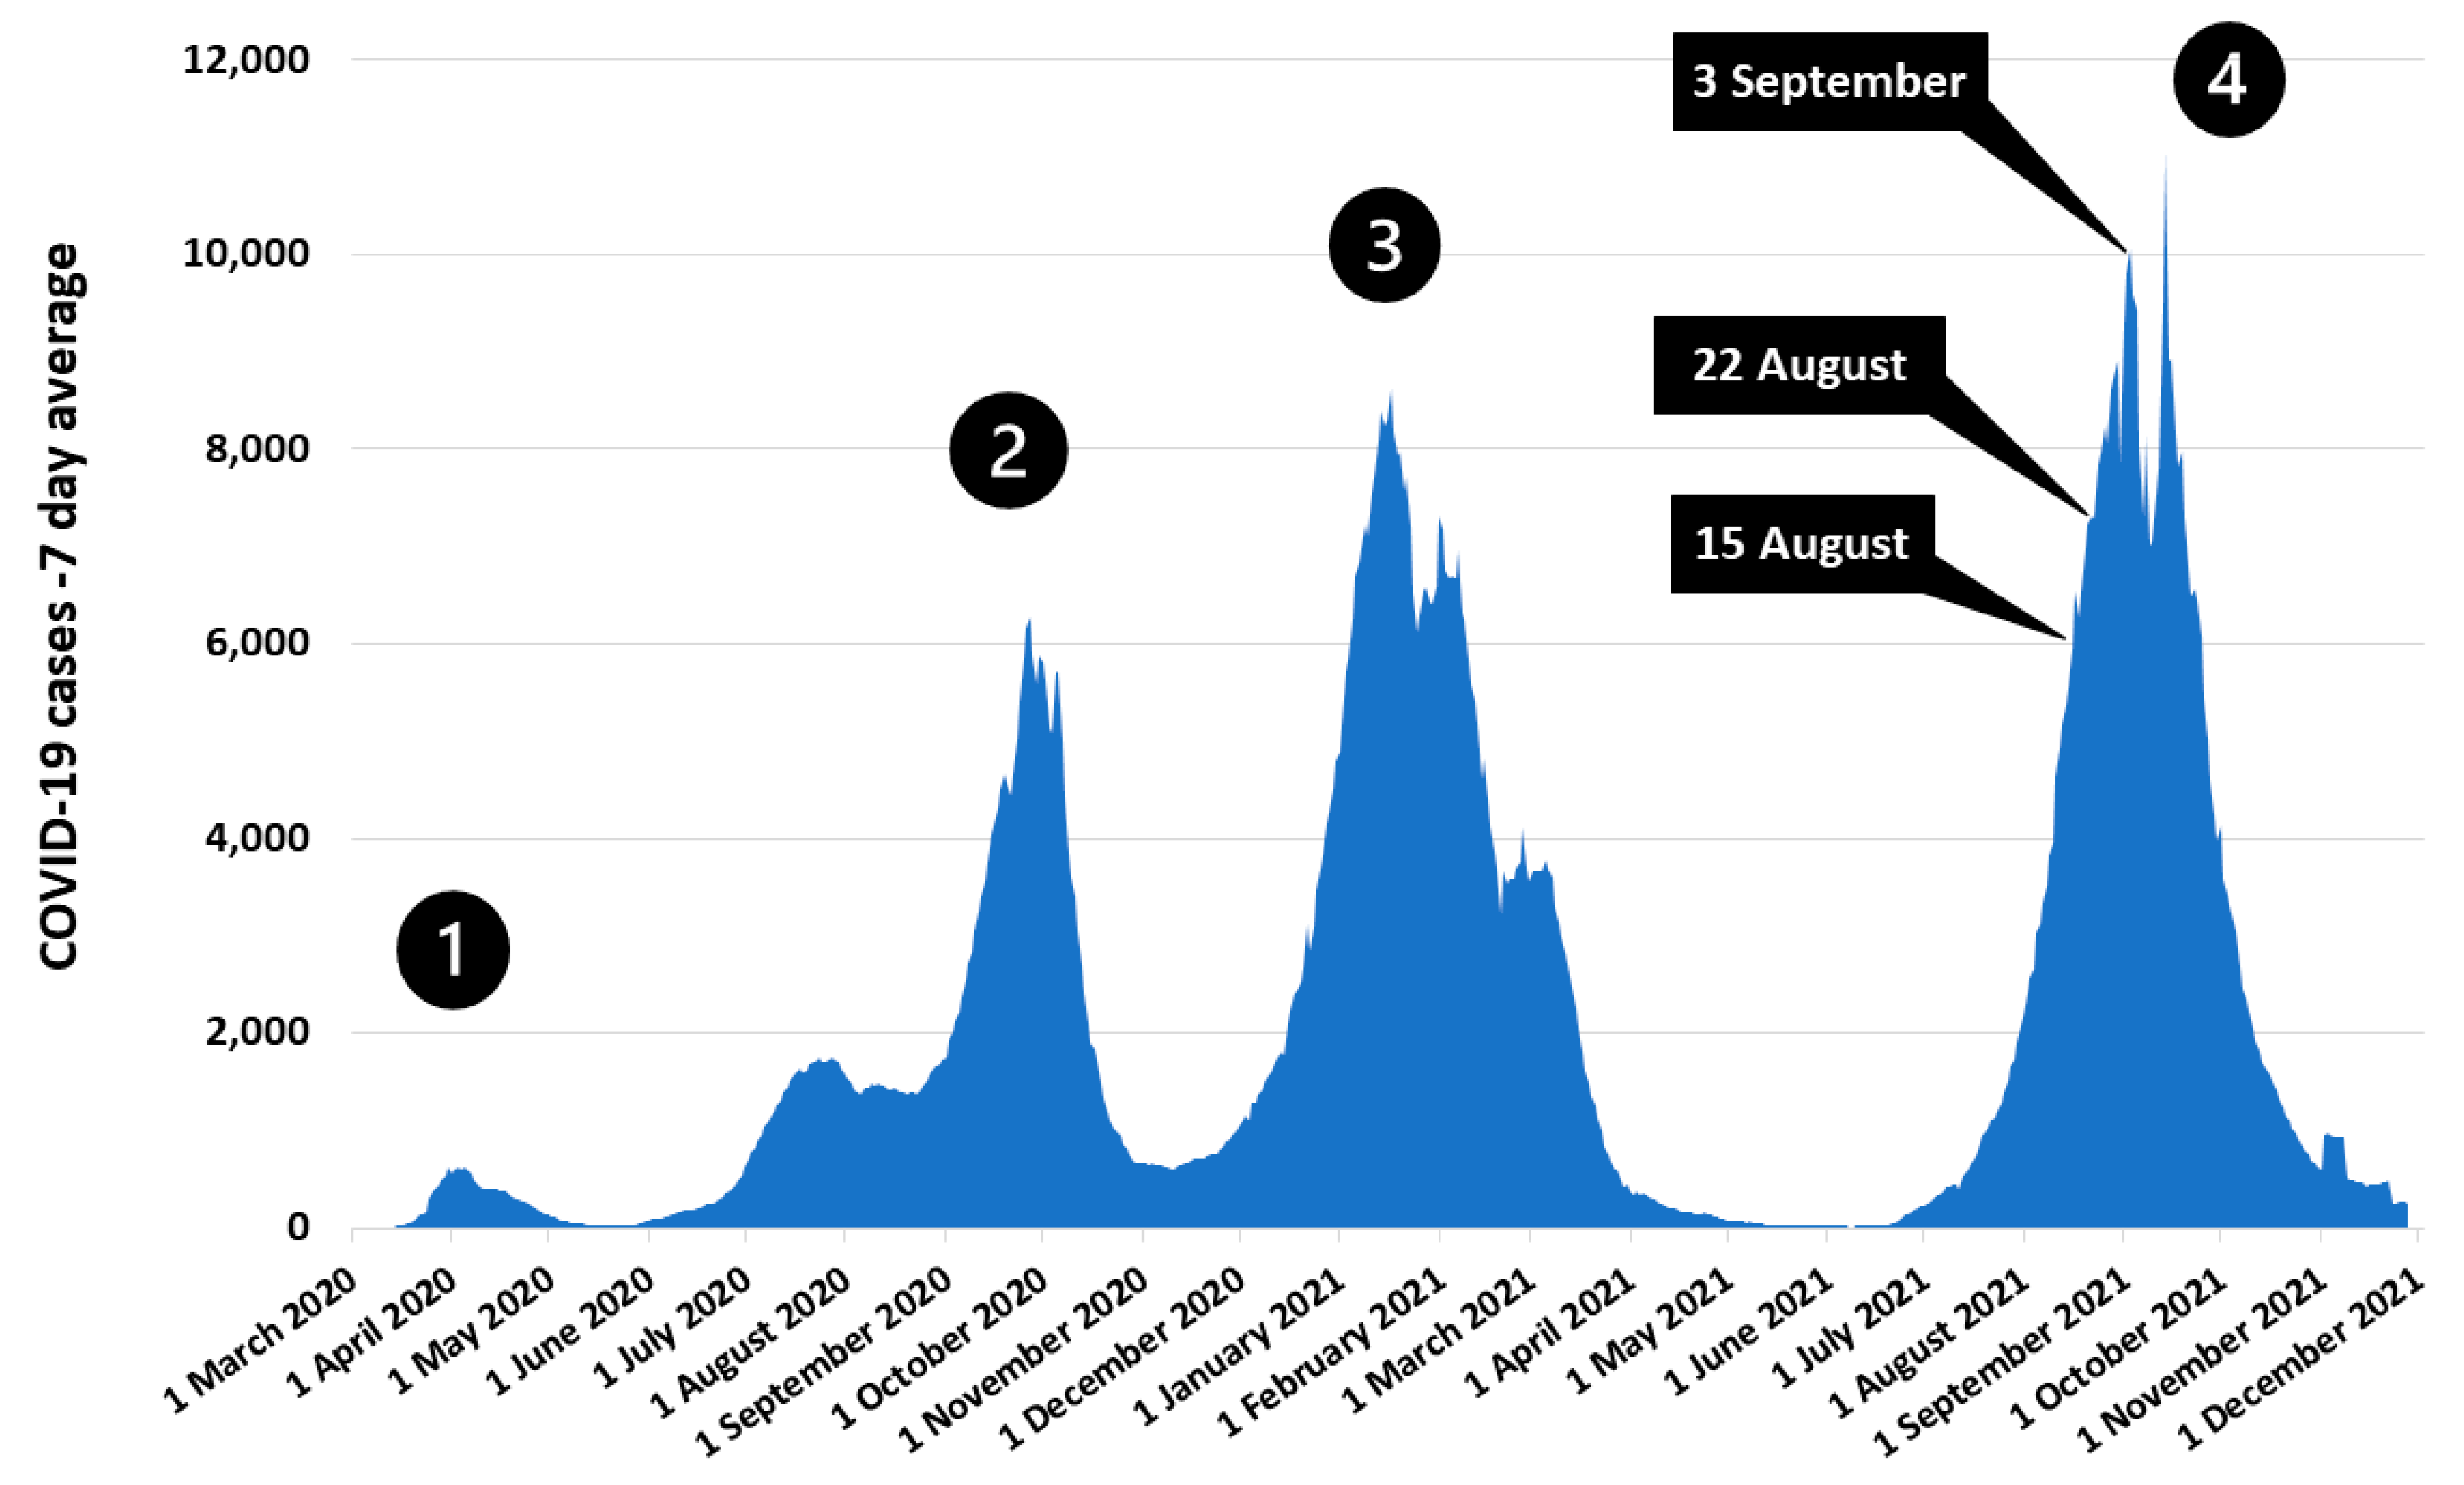
Figure 1. Daily new confirmed COVID-19 cases in Israel (presented as rolling seven-day average). Morbidity waves are numbered one to four. The fourth is the Delta-variant (B.1.617.2) dominated morbidity wave. Data source: Johns Hopkins University Center for Systems Science and Engineering (CSSE) COVID-19 Data https://github.com/CSSEGISandData/COVID-19, Published online at: OurWorldInData.org [25].
Atmosphere 13 01845 g001
Figure 2. Spearman’s correlations between demographic parameters and COVID-19 morbidity rates at specific time points in the Delta variant morbidity wave (All statistically significant).
Atmosphere 13 01845 g002
Figure 3. Spearman’s correlations between air pollutant concentrations and COVID-19 rates at specific time points in the Delta wave (All statistically significant, except CO in 3 September).
Atmosphere 13 01845 g003
Figure 4. A graphic representation of the results (β and p-values) of the multivariate linear regression models used to predict COVID-19 rates at specific time points during the Delta morbidity wave according to several parameters. Pink colors represent significant positive correlations while green colors represent significant negative correlations.
Atmosphere 13 01845 g004
Publisher’s Note: MDPI stays neutral with regard to jurisdictional claims in published maps and institutional affiliations.