1. Introduction
Air pollution, in recent years, has been increasing remarkably, which is acknowledged as a severe threat to the global environment and people’s health. Studies have proved that marine operations have a significant impact on increasing global air emissions despite their critical role in international trade, accounting for approximately 80 percent of total volume and 70 percent of total value [
1]. Noticeably, the volume of emissions emitted by ships within a distance of 400 km from the coast was equal to about 70 percent of total emissions in global routes, in which an estimated amount of 60–90 percent was from the auxiliary engine during docking at berth [
2,
3,
4]. Evidence shows that carbon dioxide (CO
2), nitrogen oxides (NO
x), sulfur oxides (SO
x), and particulate matter (PM, especially PM
10 and PM
2.5) during engine combustion make up most of the ship’s emissions. Recently, the policy-making and scientific communities are paying more and more attention to ship emissions in coastal areas, especially in-port emissions because of their significant consequences on the environment and public health [
5].
To reduce emissions from ocean-going vessels and minimize their negative impacts, strong initiatives and regulations have been developed and implemented in recent years. In general, these policies are geared towards the application of cleaner and more environmental-friendly fuels to ships. In addition, some regulations aim to limit the speed of the ship in the designated area as well as promote the use of more energy-efficient equipment and engines. One of the upcoming regulations, the Energy Efficiency Existing Ship Index (EEXI), is expected to enter into force from 1 January 2023. According to the International Maritime Organization (IMO), ships of 400 gross tonnage and above engaged in international voyages shall comply with the EEXI as a technical measure to reduce their greenhouse gas emissions. In Korea, through 10-year comprehensive programs, the government has been stepping up strong actions to enhance the country’s air quality [
6]. From January 2022, the 0.1% sulfur limit has been applied to all vessels entering the ECAs, which cover five main port areas: Busan, Incheon, Yeosu and Gwangyang, Ulsan, and Pyeongtaek-Dangjin [
7]. To comply with those standards, shipping companies should prepare various countermeasures such as limiting engine output, installing energy-saving devices, and using eco-friendly alternative fuels to meet greenhouse gas regulations on existing ships. Moreover, coming from the research sector, a thorough and reliable analysis of exhaust emissions from the ship is needed to estimate a high-resolution inventory, therefore, to comprehend its quantitative impacts and to execute effective countermeasures [
8]. In Korea, recently, the topic of calculating pollution from ships has attracted the attention of many scholars; however, there can be no denying that they mainly concentrated on two major ports, Incheon and Busan, which left aside other smaller but equally important ports. Moreover, the lack of a standardized method to estimate emissions, along with the uncertainties of data sources adopted from abroad which are different in spatial and temporal scopes make it difficult to compare and validate results.
In this study, the amount of emission in three operating modes for each pollutant emitted from ships operating in Yeosu and Gwangyang ports in Korea was estimated. In addition to providing a real database on specifications of all ships operating in the port area, the authors also want to present a new approach to determining cruising/maneuvering mode by analyzing ship movement using AIS data. Instead of directly applying defaulted values, other researchers may consider this approach and apply it to each port depending on its actual regional conditions. These reliable results could be useful for air quality management decision-making processes for local port operators and public agencies. The rest of the paper is developed as follows. First,
Section 2 summarizes the previous studies related to ship-related emissions and then points out the research demand of this paper.
Section 3 provides a geographical and statical overview of Yeosu and Gwangyang ports. Next, the methodology and data used in this study to estimate shipping emissions are briefly described in
Section 4, followed by the results from the case study of Yeosu and Gwangyang ports in
Section 5. Finally,
Section 6 presents the conclusions from the work and suggestions for further research in the future.
2. Literature Review
The mainstream methods to estimate ship emissions inventory in port areas, in general, can be categorized into two main approaches: the top-down approach (fuel-based) and the bottom-up approach (activity-based). In the top-down approach, statistical data on marine fuel sales and other fuel-related emissions parameters are collected to calculate the volume of emissions from ships [
9]. When it is impossible to build a precise statistic database on traffic information, this method is employed to compute coastal and international emission inventories [
10]. This approach is recommended for a low level of traffic data availability situation. Due to the fact that there is a positive correlation between fuel consumption and emissions discharged from engine combustion, this approach would be a useful and accurate method if researchers could be confident about the marine fuel sales data collected. For example, the emissions of the main pollutants from the shipping activity within the Greek seas in 2008 were calculated by using fuel sales statistics [
11]. The fuel consumption and exhaust gas emissions NO
x, carbon monoxide (CO), CO
2, volatile organic compounds (VOC), and PM exhausted from coastal passenger ships transit ships in busy Turkish Straits were also assessed [
12]. Emissions were estimated resulting from the hoteling of large vessels in 2011 and 2012 using the top-down approach [
13]. On the downside, this method did not accurately depict how ships moved and the location information. That is to say, this method has significant uncertainty (e.g., lack of activity data) in estimating ship emissions because it cannot reflect actual maritime traffic.
Unlike the top-down method, the bottom-up method, which is now employed by more studies, requires a higher level of input parameters such as detailed information about ship specifications (e.g., ship type, engine characteristics, fuel type) and ship operational records (e.g., travel distances, speed, ship tracking, activity time). Because it necessitates in-depth and extensive input data, it is generally acknowledged that the bottom-up approach is more accurate than the top-down approach [
14]. A considerable number of studies have been conducted to evaluate the inventories of ship emissions in various ports around the world in general and in Asia in particular. In Greece, the emissions of the main pollutants were calculated from cruise ships for the Port of Piraeus, between 2008 and 2009, using an in-port ship activity-based methodology [
15]. By vessel type, the volume of emissions was estimated for ships’ hoteling, assessing monetary values for the emissions from ships at berth in the Port of Bergen in Norway [
16]. In Asia, many studies have been conducted to estimate the emission inventory. A comprehensive in-port ship emission inventory was estimated in the Yangshan port of Shanghai with a sophisticated activity-based methodology, supported by the ship-by-ship and real-time data from the modern automatic identification system [
4]. In Hong Kong, non-GHG emission inventories and policy changes to control and regulate marine emissions were discussed [
17]. A similar analysis was also performed for the Port of Incheon in South Korea [
18]. They estimated the non-greenhouse gas emission inventory (CO, NO
x, SO
x, PM, VOC, and NH
3) by different vessel movement phases by ship type. Nevertheless, those studies determine the ship’s activity phase by referring to other previous studies. The study by the Environmental Protection Agency (EPA) adopted that the maneuvering phase in Incheon port was defined within the distance of 1 nm from the berth and the speed of around 3.5 knots [
18,
19]. The ship activities in the Yangshan port area were divided into seven segments: anchorage, fairway, precautionary zone, precautionary zone to the breakwater, harbor transit, docking, and berth based on a report in Port of Long Beach [
4,
20].
Input data in some studies adopted from other international research with different spatial and temporal scopes may lead to uncertainty. Due to the lack of a database, the ship specifications, namely engine power, and designed speed, in some studies were estimated from regression models or defaulted values, which is inaccurate from the real figures. The problem of missing ship data was solved by using simple linear regression analyses by ship type between ship tonnage and main engine from the sample to estimate the main engine power for each ship in Incheon port [
18]. The regression models between the main engine rated power, design voyage speed, and deadweight were also adopted from the previous study to emission inventory in Qingdao port in 2016 [
21,
22]. In this study, authors tried to overcome that limitation by building a real detailed database of ship specifications to facilitate trustworthy and reliable inputs. Moreover, in terms of data on ship activity in port, for example, ship route, speed, and time in each activity mode, namely cruising, maneuvering, and hoteling, the application of a vessel tracking system named automatic identification system (AIS), proposed in the IMO International Convention of Safety of Life at Sea (SOLAS) for better identification of ships, recently has been widely applied in the stream to enhance estimations [
14,
23,
24,
25]. This system is equipped compulsively on passenger ships of all sizes and commercial ships with 300 gross tonnages (GT) or more operated at sea. Hence, the ship’s activities are better geographically characterized and analyzed, and consequently, it improves the reliability of emission inventory investigation. Although the support of AIS as input could be found in some other studies to estimate ship emissions inside the port area, changes in ship speed and activity modes have not been illustrated clearly in those studies. In other words, the process of determining operating modes (cruising, maneuvering, hoteling) was not presented in detail. Therefore, this study aims to analyze the ship’s route and speed change from ship fleet samples based on the automatic identification system (AIS), then determine operating modes, speed, traveling distance, and engine load factor instead of referring to defaulted values from previous studies.
Additionally, to assess and control the current local environmental problems, a reliable in-port ship emission inventory is needed to promote appropriate public policies for the control of air pollution at ports and surrounding regions. After reviewing the literature, we find that a limited number of existing studies on estimations of in-port ship emissions have been conducted in Korea. It cannot be denied that some studies already analyzed them but mostly focused on Incheon [
18,
23,
26] and Busan port [
25,
27,
28], which was insufficient to contribute to a total emission inventory in Korea, which helps to provide an overview and build a long-term strategy to improve the air quality for the country. Recently, the air emissions from a ship operating in Gwangyang port during 2018 were estimated, but the target ship was limited to container ships only [
29]. Therefore, to overcome the lacks above referred and contribute to the ship emission inventory of Korea, the purpose of this study is to calculate the amount of emissions in three operating modes for each pollutant emitted from ships in Yeosu and Gwangyang port, which is widely known as one of the busiest port areas in Korea.
3. Study Area
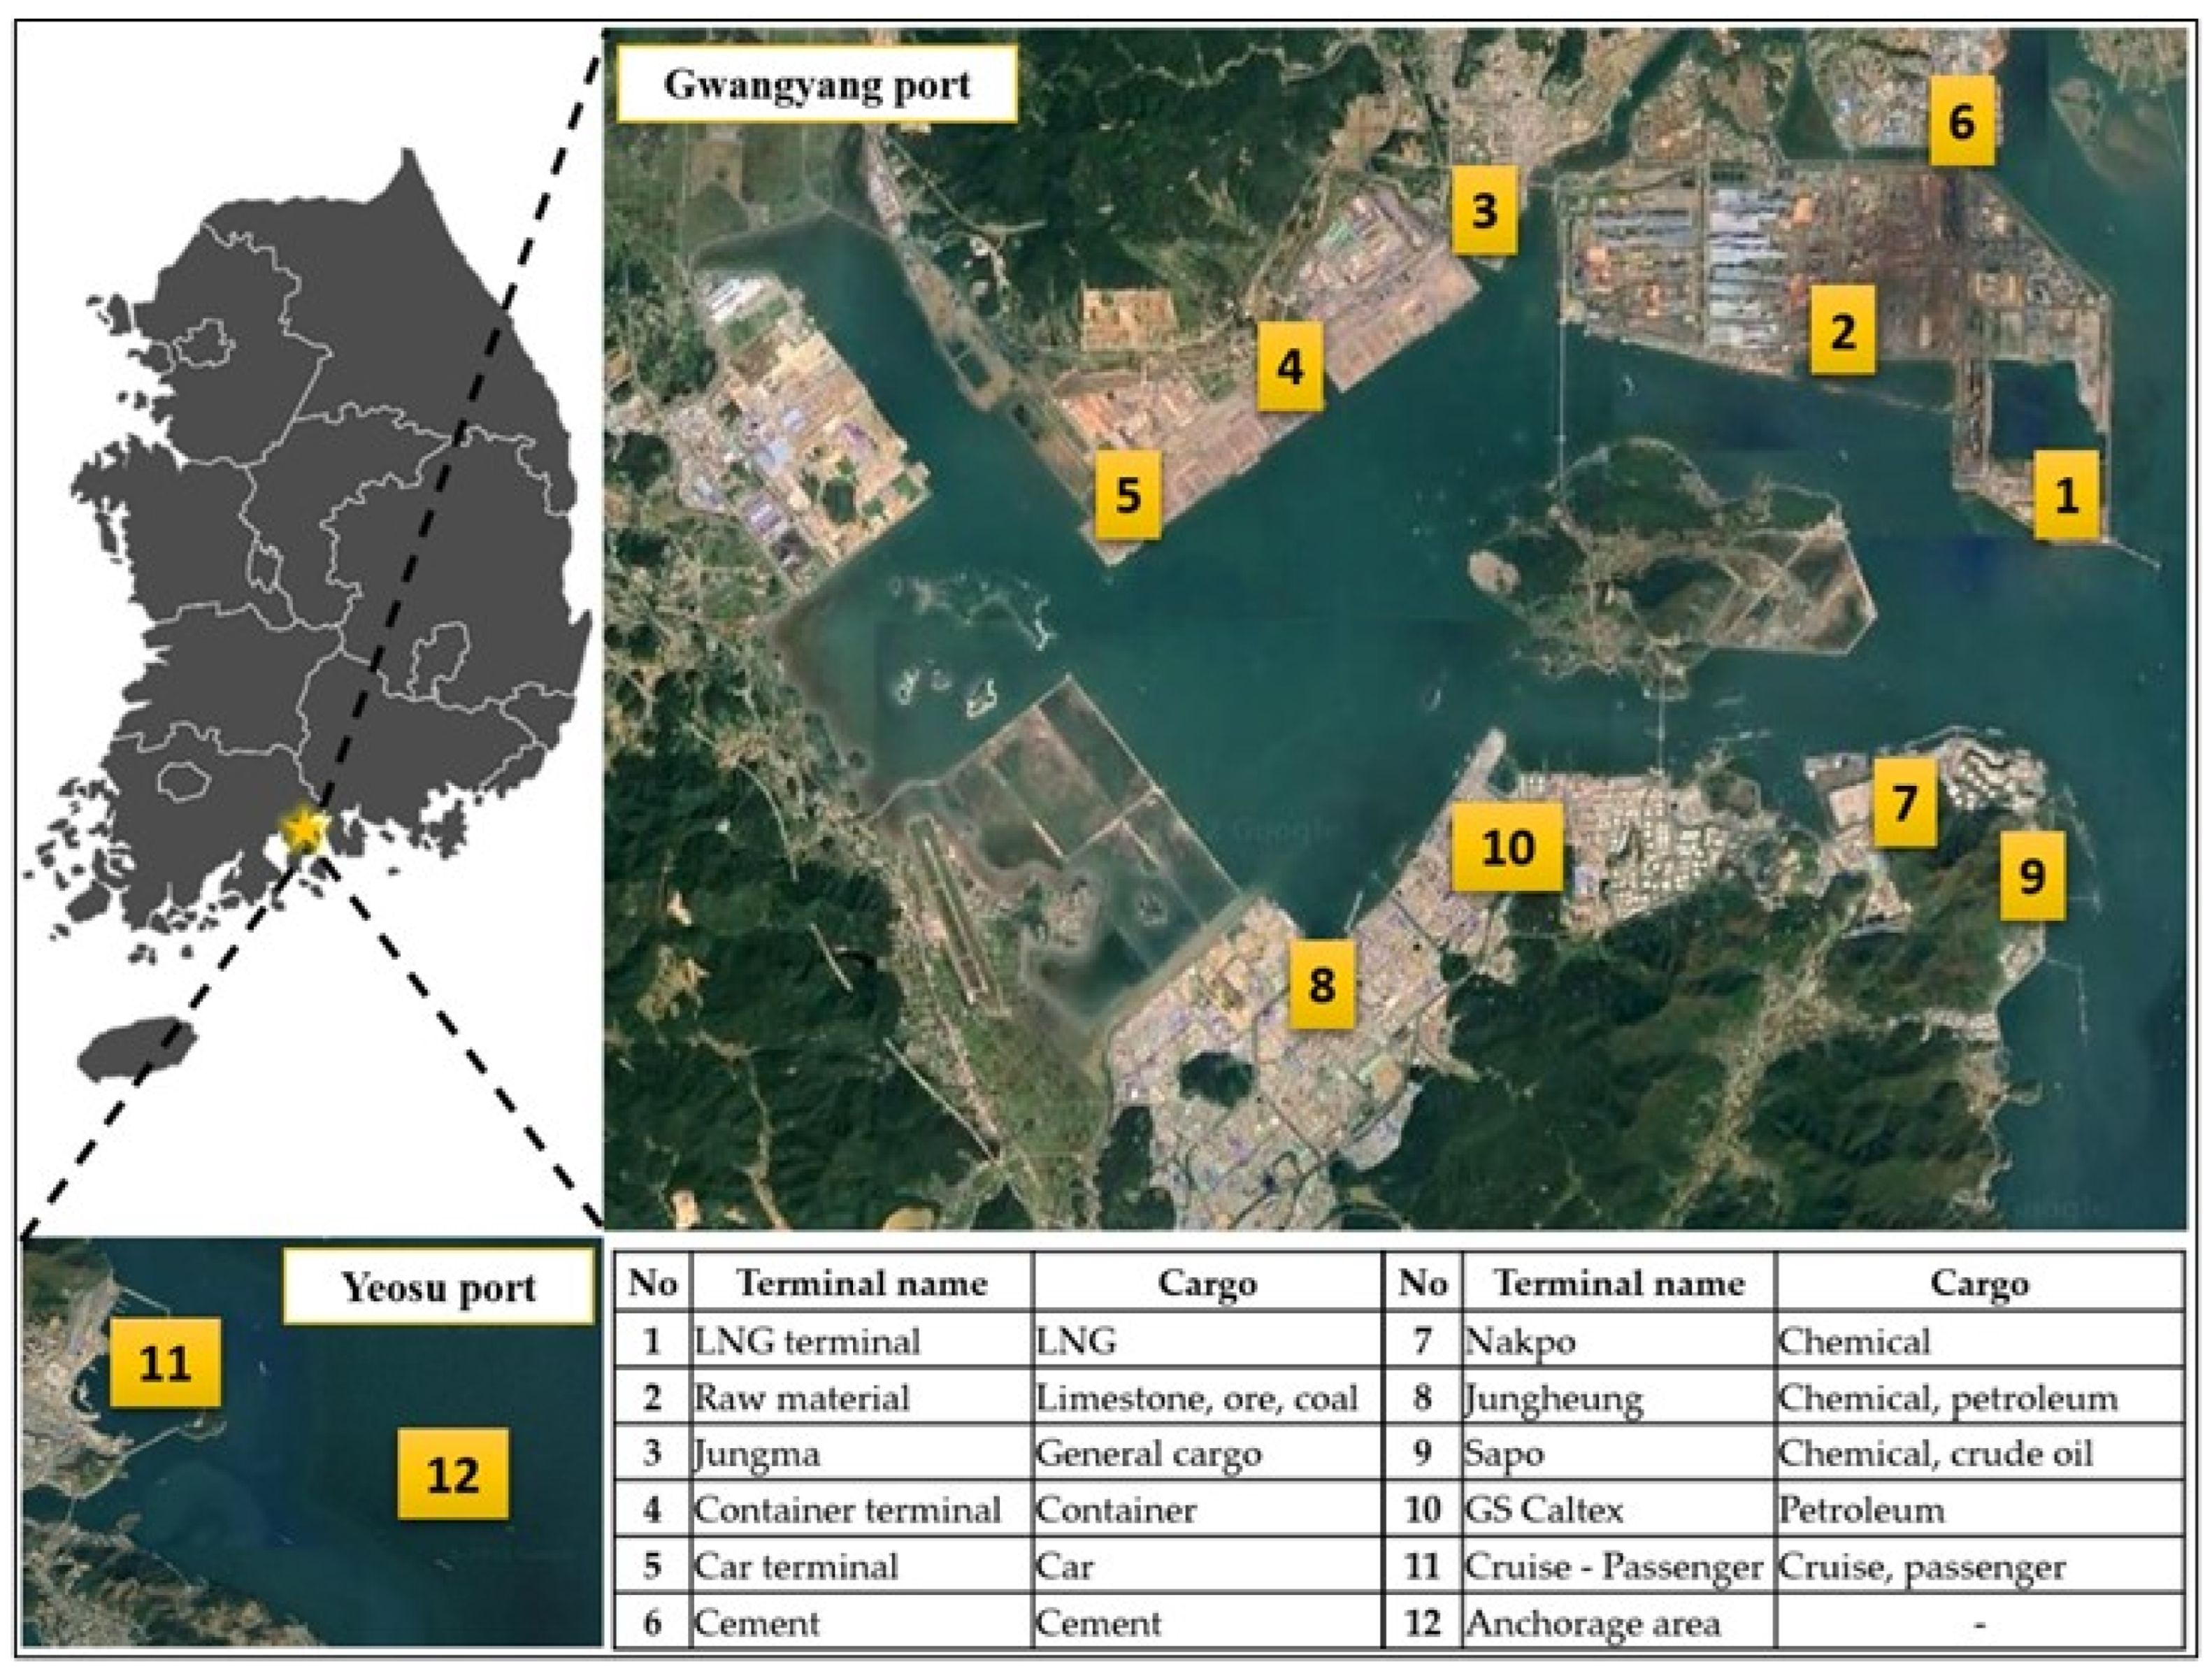
Yeosu and Gwangyang ports are located on the southwestern coast of the country, known as a multifunctional port stretching along 145.19 km2 of the harbor area. The two ports share a close geographical location with Yeosu port being located at the gateway leading to Gwangyang port. Naturally blessed with a favorable port environment and located at the main sea route, they are being developed as Korea’s largest industry cluster port leading the nation’s economic development and the logistics hub of Northeast Asia in the 21st century with vast hinterlands.
Figure 1 presents the main terminal’s location inside the port area. It was shown in the map that there were ten major terminals in Gwangyang port, namely the LNG terminal, raw material terminal, Jungma general cargo terminal, container terminal, car terminal, cement terminal, Nakpo terminal, Jungheung terminal, Sapo terminal, and GS Caltex terminal. Meanwhile in Yeosu port, apart from the cruise/passenger terminal, a large anchorage area for ships waiting and anchoring was presented. Additionally, there are some other smaller terminals in Yeosu and Gwangyang ports that were not listed here.
Regarding total cargo volume in 2021 Gwangyang port was ranked number two after handling 292 million tons of cargo, surpassed by Busan port with 442 million tons of cargo throughput. Noticeably, Gwangyang port recorded the first position among ports in Korea in bulk and liquid cargo while followed by Busan and Incheon ports in container throughput in 2021. In terms of Yeosu port, the total cargo throughput was only 3.3 million tons (ranked 22nd nationwide), in which the volume of 3.2 million tons was from liquid cargo while the volume of 119 thousand tons was from bulk cargo. The detailed information on cargo volume in some Korean ports in 2021 is noted in
Table 1 below.
This research aims to estimate the in-port emissions from two target ports in 2019. Due to the impact of the COVID-19 pandemic during the last two years, the volume of cargo throughput and the number of ships in and out of Yeosu and Gwangyang ports witnessed a dramatic fluctuation in 2020 and 2021. Moreover, from 2020, some new international and national regulations on controlling air emissions in the port area would enter into force, for example, the new IMO regulation on the sulfur content of fuel oil from 3.5% to 0.5%; the vessel speed reduction program and SOx Emission Control Area regulation in five major ports in Korea, etc. Therefore, the reason why the year 2019 was chosen for the extent of this study is that the authors tried to estimate the emissions amount before the standards were put into practice. The comparison between the two phases will be conducted in the next study in the future.
During the year, there were 4516 ocean-going vessels operated at the port area, which contributed to 28,983 calls. A call means an intermediate stop for a ship on its scheduled journey for cargo operation or taking on supplies or fuel, which is counted when a ship gets into and gets out of port. The data were reported from the Korean Port Management Information System (Port-MIS). The ship call’s statistical information is shown in
Table 2 below.
In general, most of the ship calls at Yeosu and Gwangyang ports in 2019 came from the tanker fleet, which accounted for nearly 40% of total ship calls. Container, general cargo, and bulk ships were followed with the number of 7583 calls (26%), 5738 calls (20%), and 3560 calls (12%), respectively. In contrast, only 2% was the percentage of Ro-Ro ships and 1% was from other ships (which included passenger ships, cruise ships, and reefer) during 2019. In the case of Yeosu port, calls were reported in the anchorage area due to vessels not being able to proceed directly to the loading/unloading terminal and having to wait for an appropriate terminal or for their cargo to become available in Gwangyang port during their port call.
4. Methodology and Data
Ship emissions in this study were calculated by the ship activity-based method to estimate some main air pollutants (NO
x, SO
x, CO
2, and PM) in the port area. To approach a berth inside the port, a ship is operated in three general modes [
32]. The cruising mode is typically defined as ships moving from the port boundary to the breakwater at a restricted speed. Maneuvering refers to the slow speed movement of the ship between the port’s breakwater and point of berth (usually <1 nautical mile from berth and <5 knots). Hoteling is the mode in which the ship is at berth or anchored with propulsion engines switched off. In-port ship emissions are produced by the ships’ main and auxiliary engines when they are cruising, maneuvering, and hoteling inside port areas [
18,
33,
34].
The equation used to calculate emissions through the activity-based method is expressed as follows:
where ME denotes the main engine power (kW), AE denotes the auxiliary engine power (kW), V denotes the ship’s speed (knots), D denotes the distance of cruising (nm), T denotes the time of maneuvering, hoteling (h), LF
ME denotes the load factor of the main engine, LF
AE denotes load factor of the auxiliary engine, EF
1, EF
2, EF
3 denote the emissions factor (g/kWh) in cruising, maneuvering, and hoteling, respectively [
29,
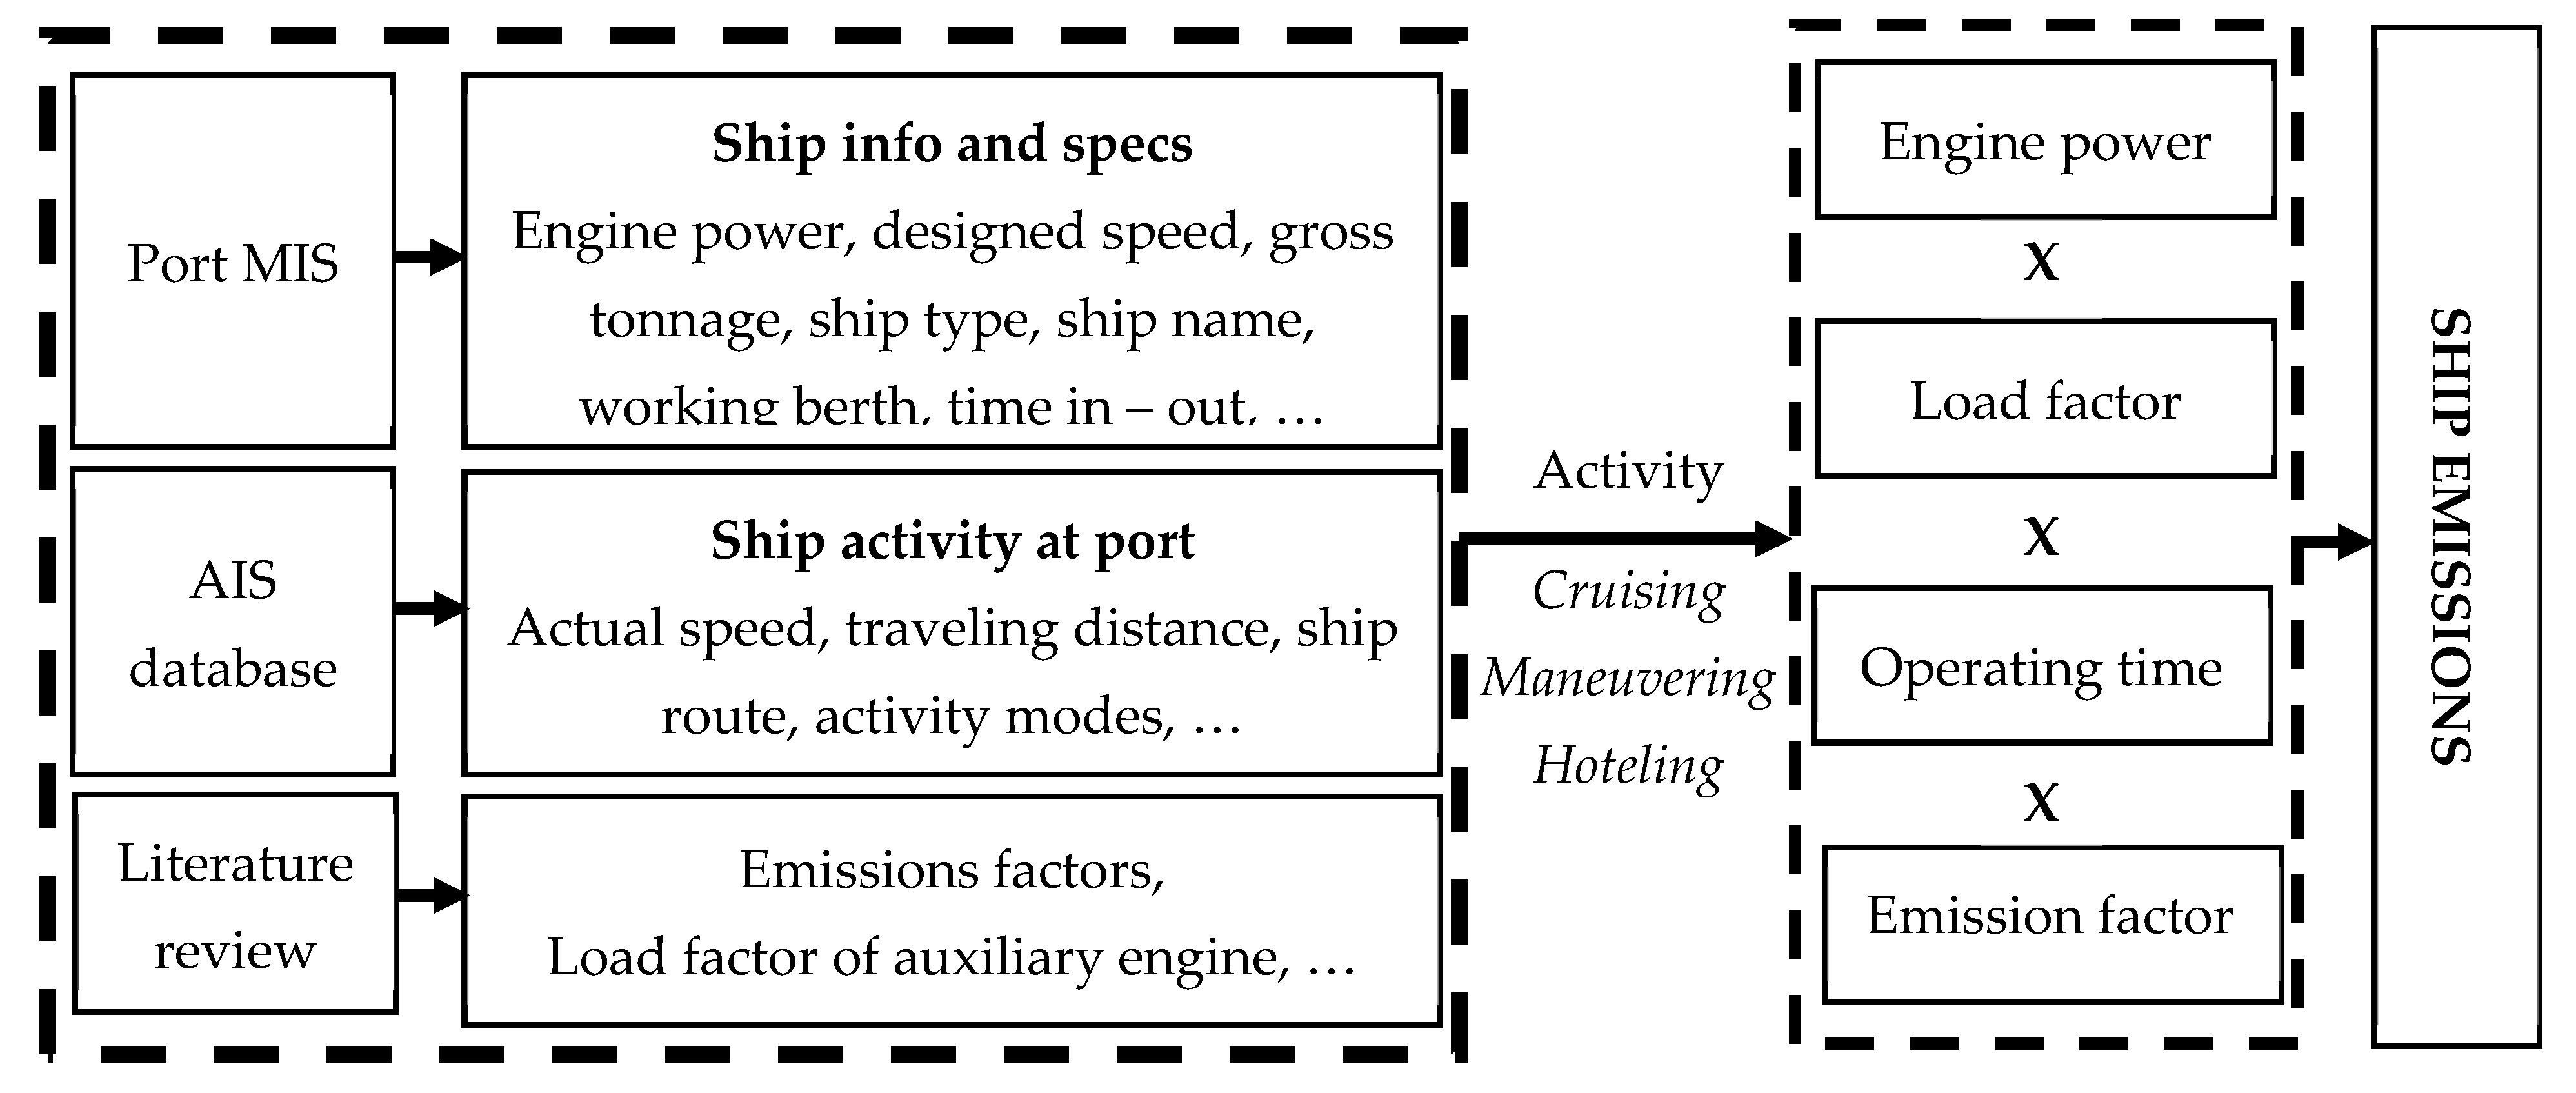
35]. Specifically,
Figure 2 shows the data analysis process for ship emissions calculation.
Since many studies make assumptions on data on ship activity at the port through interviews or literature review, some uncertainties may be found in the output results due to the dissimilarities in natural features at each port, cargo type carried by ship, etc. Therefore, in this study, it is possible to present a more accurate emission inventory because the ship activity data were analyzed in Yeosu and Gwangyang ports exclusively with AIS data. Detailed explanations of the equation parameters, as well as the values and the sources of the parameters, were provided in the sections below.
4.1. Engine Power
To meet the requirement of a detailed and reliable input database, the data on ship specifications including the vessel name, vessel type, engine type, main engine power (ME), weight tonnage (GT), max designed speed (MS), was collected from Korean port management information system (Port-MIS) website and Marine Traffic website. It covered 4516 ships operating at Yeosu and Gwangyang ports in 2019. The database of ships in different classes according to vessel type is described in
Table 3 below. From the summary table, it is reasonable to conclude that the larger the ship size comes with the greater the main engine power and designed speed.
On the other hand, in terms of auxiliary engine power installed, that information was not fully reported because the manufacturer does not necessarily provide it. To deal with the lack of auxiliary engine power information, an estimation based on the given main power engine was calculated and adopted from the US Environmental Protection Agency report [
32]. The auxiliary engine power is estimated from the main engine power mentioned in
Table 3 based on specific ratios by ship type: bulk (22.2%), container (22%), general cargo (19.1%), Ro-Ro (25.9%), tanker (21.1%), others (10.0%) [
32].
4.2. Ship Route and Speed
To determine routes and actual speed changes when ships travel inside the port area from the pilot station to berths, a fleet sample of 30 vessels was selected for each ship type and the average actual speed for each ship activity segment was estimated. In each sample, the number of ships is distributed equally based on the size category mentioned in
Table 3. Regarding the sample of bulk and general cargo ship and tanker ship, 10 ships in small sized category (less than 10,000 dwt), 10 ships in the medium-sized category (10,000–59,999 dwt), and 10 ships in large sized category (more than 60,000 dwt) were chosen. In the case of a container ship, similarly, a number of 10 ships in small sized category (less than 3000 TEU), 10 ships in medium-sized category (3000–7999 TEU), and 10 ships in large sized category (more than 8000 TEU) were collected. It should be noted that to maximize the utilization of container terminals and unused facilities in Gwangyang port, some berths were reallocated to their functions and converted to car terminals to serve car carriers. Therefore, the sample of container ship was also used for Ro-Ro ship in this study.
The real-time ship activity data were obtained and identified ship-by-ship on the online AIS platform of the Alpha Liner website and a set of AIS data in the Yeosu and Gwangyang port area from 22 to 28 September 2014 collected by the authors. AIS messages provide static information (MMSI number, type, and length) and dynamic information (the ship’s position, i.e., latitude and longitude, course over ground (COG), speed over ground (SOG), and UTC. Through analyzing the fleet sample, we can extract a general trendline of speed change when approaching the berth for each ship type. The purpose is to estimate the average speed when ships approach berth inside the port and determine three general modes from this sample, then apply the results to all ship fleets at the port.
Figure 3 illustrates the ship routes and speed changes at the port area for each ship type: container and Ro-Ro, bulk and general cargo, and tanker, respectively.
While the maneuvering mode is often determined within 1 nautical mile from berth and below 3.5 knots in some studies by defaults, a typical ship call in this study was broken down into activity phases by analyzing ship route (from pilot station to berth) and speed change from the above graphs.
In
Figure 3a, when container ships enter the port area from the pilot station, they do not change their speed dramatically and remain at an average speed of 12 knots. However, the speed is lowered remarkably from 9 to 0 knots from the distance of 1.5 nautical miles away from the berth, which is considered the maneuvering phase. On the other hand, regarding the outbound route, the ship’s speed increased quickly from 0 to 10 knots in the first mile, then remained quite stable to the pilot station.
Similarly, about cargo ships, as can be seen in
Figure 3b, the maneuvering phase was determined within 0.8 and 0.7 nautical miles from a berth in inbound and outbound routes, respectively. Ships increase/decrease their speed considerably near berth, from 8.2 knots to 0 while going inbound and from 0 to 7.1 knots while going outbound. In cruising mode, ships move stably at an approximate speed of 9.4 knots. Regarding tanker ships, the maneuvering phase was estimated within about 0.75 nautical miles from berth with a speed of below 10.3 knots in
Figure 3c. The average cruising speed was calculated at about 10 knots. In the anchorage areas in Yeosu port (section A/B and section W), ships waited for their calls to approach Gwangyang port. The maneuvering phase was estimated to be within about 1.4 nautical miles from the berth with a speed of below 8 knots in
Figure 3d. The average cruising speed was calculated at about 9.6 knots. The distance and speed of each ship type operating in the port area were calculated and presented in
Table 4. Data in the others category was the average figures estimated from the other ship types. The cruising distance varies differently depending on the berth location.
4.3. Load Factor
The load factor describes how much power an engine is producing as a fraction of its maximum rated power. In this study, regarding the load factor for the main engine, the main engine load factor is estimated using the propeller law, which says that the main engine load varies with the cube of ship speed: LF = (AS/MS)
3, in which AS is ship actual speed (knots) and MS is designed maximum speed (knots) [
32,
37].
In propeller law, the designed maximum speed (MS) was extracted from the database mentioned in
Table 3 by the authors. Ship speed (AS) was identified based on the AIS data which was analyzed and presented above. The average speed from
Table 3 above was used to estimate the load factor for the main engine in propeller law.
Table 5 shows the load factor of the main engine by ship type calculated based on the ship’s speed by propeller law.
As can be seen in
Table 5, the load factor of the main engine during the outbound phase is higher than in the inbound phase in general. The departure load is typically higher than the arrival load because the engine power is used to leave the dock, while the vessel usually coasts in on arrival. Especially in the case of a tanker ship, when the ship is being positioned against the dolphin, the assist tugboats do most of the work during docking.
Due to limited information related to onboard auxiliary engines, the default values were often applied for the load factor of the auxiliary engine.
Table 6 shows the auxiliary engine load defaults used in this study followed the guidelines of the US Environmental Protection Agency [
32]. The movement of the ship was supported by the coordination of both main and auxiliary engines during the cruising phase while during the maneuvering phase, the auxiliary engine took on the main responsibility because the ship needed to reduce its speed and move slowly toward berths or anchorage areas. Especially, during hoteling mode, the main propulsion engine was off, and only the auxiliary engine was working and responsible for all onboard power or some loading/unloading equipment [
38].
4.4. Hoteling Time
The data for actual operating time for hoteling and anchoring at the port of a ship call was obtained from the Port-MIS website and presented in
Figure 4 below. In
Figure 4, hoteling time was categorized into ship type, in which the maximum and average time were shown.
In general, ships spent an average time of more than 50 h at berths. Specifically, bulk and general cargo ships had the greatest time in the hoteling phase among other ship types at 90.5 and 84.6 h, followed by tanker ships with an average operating time at berths of 49.9 h. Moreover, while the Ro-Ro carrier spent 17.4 h loading/unloading cargo, the container spent only an average time of 9.2 h. In the case of the others category, the average hoteling time was 50.9 h at berths. A maximum of twelve days (293 h) for hoteling at berths was recorded in the case of a general cargo ship.
4.5. Emissions Factor
So far, there is no study estimating local emissions factors for ports in Korea because of the high cost of testing emissions onboard. Therefore, in this research, emissions factors were determined and calculated based on the report published by the International Council on Clean Transportation [
33]. This study considered the new requirements for marine distillate fuels, compared to previous studies.
The emissions factors applied in this study were presented as follows. For the main engine, the emissions factors of NOx, SOx, CO2, and PM are 6.10 g/kWh, 11.35 g/kWh, 670 g/kWh, and 1.43 g/kWh, respectively. For the auxiliary engine, the emissions factors of NOx, SOx, CO2, and PM are 14.70 g/kWh, 11.98 g/kWh, 707 g/kWh, and 1.44 g/kWh, respectively.
5. Results
The results of the emission inventory at the Yeosu and Gwangyang port areas in 2019 calculated by adopting the methodologies above are now presented. This inventory was estimated by ports (Gwangyang, Yeosu, Korea), by ship operating phases (cruising, maneuvering, hoteling), by air pollutant types (NOx, SOx, CO2, PM), and by ship types (bulk, container, general cargo, tanker, Ro-Ro).
The total amount of emitted in-port ship emissions was 558 thousand tons in 2019. Among the ports, Gwangyang port was the most polluted, contributing 87% of the total amount of emissions. In contrast, Yeosu port only shared a small proportion of 13% of the total amount. That is because, in 2019, Gwangyang port itself attracted 24,163 ship calls (about 83% of total calls) and handled a large volume of cargo throughput while Yeosu port served as a waiting area for ships to anchor.
In the case of Gwangyang port, tanker ships contributed the most emissions at up to 47% (227 thousand tons), followed by container ships with a percentage of 27% (130 thousand tons). Bulk carriers and general cargo ships with a percentage of 13% (63 thousand tons) and 10% (50 thousand tons), whereas Ro-Ro only accounted for approximately 3% of the total amount of emissions for each type. On the other hand, the most polluted ship type in Yeosu was tankers with proportions of 47% (34 thousand tons), followed by container ships, bulk ships, and general cargo ships being 20% (15 thousand tons), 12% (8 thousand tons) and 7% (5 thousand tons), respectively, which came from the long anchoring time at anchorage area in Yeosu port, as mentioned in the previous part. The top two ship types causing the most pollution are tanker and container ships, which together accounted for the largest share of 73% of the total amount (405 thousand tons) in Yeosu and Gwangyang ports in 2019, as can be seen in
Table 7. It can be explained that there were a total number of 18, 791 ship calls recorded in 2019 from tanker and container ships, which equals 65% of total calls. Moreover, Gwangyang port was also ranked as number one in the volume of liquid cargo and number three in the volume of container throughput in Korea, in return those two ship types emitted the highest total proportion of air pollution.
In addition, an analysis of how air pollutants were emitted in the port area was conducted based on statistics of ship emissions at each terminal, including eleven main terminals, one anchorage in Yeosu port, and other smaller berths as illustrated in
Figure 1. Among the component terminals, ships operating at the container terminal in Gwangyang port emitted 130 thousand tons, which is the highest level of air pollution, comprising 23% of the total amount of emissions in tons, which came from the fact that a large number of container ships were concentrated at this area. However, the emissions volume from container ships only ranked second, which was surpassed by tanker ships. Instead of being concentrated at one terminal, the air emissions from tanker ships were distributed among small berths, namely the LNG terminal, Nakpo terminal, Jungheung terminal, Sapo terminal, and GS Caltex terminal, with a total volume of 227 thousand tons (over 40.7% of total ship emissions). Moreover, the anchorage area in Yeosu—the area where ships wait for berth call—alone contributed to the emissions amount of 72 thousand tons, which equals 13% of the total volume.
In addition, during the time at port, ship activities were divided into three modes, in which each mode emitted a different amount of air pollution. Specifically,
Table 8 presents the ship emissions in each operating phase. In general, the largest share of total emissions was from hoteling mode at 66% (184 thousand tons), followed by cruising mode with 28% and maneuvering mode with only 6%. While hoteling mode, ships emitted 310 thousand tons at Gwangyang port and 58 thousand tons at Yeosu port, which are 64% and 81% of the total emissions of each port, respectively. In comparison with the emission inventory estimated in Incheon port, the proportions were 51% in cruising, 2% in maneuvering, and 47% in hoteling [
18]. The difference in results between the two ports can be mainly explained by the fact that ships spend a relatively long time at berths or anchorage areas in Yeosu and Gwangyang ports than in Incheon ports. The average hoteling time of bulk carriers, general cargo, and tanker ships in Incheon port was 69.7, 34.2, and 18 h while the obtained numbers in Yeosu and Gwangyang port were 90.5, 84.6, and 49.9 h, respectively. It was declared that ships had to wait for a long time in Gwangyang port, which was caused by the problems of the berthing facility, the operational skill of cargo handling, and the cargo handling facilities, such as the loading arm [
39]. Additionally, while the average speed when approaching the berth between the two ports shared quite the same figures (about 12 knots in cruising and about 3.5 knots in maneuvering), the transit distance inside the port area in Yeosu and Gwangyang port was shorter in Incheon port (about 28 nautical miles), which leads to a smaller percentage in cruising mode compared to other modes.
To understand which air pollutants dominated at Yeosu and Gwangyang ports in 2019, the emissions from the ship were categorized by pollutants in
Table 9. During 2019, ships emitted 9.5 thousand tons of NO
x, 9.1 thousand tons of SO
x, 538 thousand tons of CO
2, and 1.1 thousand tons of PM at ports. Among pollutants calculated, CO
2 accounted for the largest share of emissions, at 96% of the total volume at all ports in this study. NO
x and SO
x both shared the same proportion of about 2%, while PM contributed the least amount compared to the others. Despite the small percentage, NO
x, SO
x, and PM are both proven to have a considerably negative impact on human health [
2]. Therefore, it emphasized the necessity of ECAs to improve the air quality in the coastal area. With a 0.1% sulfur content in fuel now applied in the ECA, it is estimated that the amount of SO
x will be reduced by 10 times the current amount [
18].
Lastly, a comparison between Yeosu and Gwangyang port and Busan port in ship emissions was conducted. Emission inventory in Busan port in 2019 using a bottom-up approach based on AIS data was calculated [
25]. In Busan port, an estimation of ship emissions (NO
x, SO
x, CO
2, PM) of 2155 thousand tons was estimated from 47,831 ship calls, in which the percentage of 30%, 24%, 18%, and 14% of total calls were from container ships, an oil tanker, conventional cargo ships, and general cargo ships, respectively, while the proportion of only 14% was from other ship types. In 2019, Busan port emitted a ship emissions volume of 2155 thousand tons to the coastal area while the amount of 558 thousand tons was calculated in Yeosu and Gwangyang ports. However, it must be noted the results of Yeosu and Gwangyang ports compared with Busan port showed that the emission inventory equaled 26% of Busan’s volume while the ship calls were about 60% (28,983 calls compared with 47,831 calls). On average, the ship emissions in Yeosu and Gwangyang ports were 19.3 tons/call while the figures estimated in Busan port were 45.1 tons/call.
6. Conclusions
The study provided a ship emission estimation at Yeosu and Gwangyang port areas in 2019 based on a bottom-up approach. The total emission inventory was estimated by ports (Gwangyang, Yeosu port), by ship operating phases (Cruising, Maneuvering, Hoteling), by air pollutant types (NOx, SOx, CO2, PM), and by ship types (bulk, container, general cargo, tanker, Ro-ro), which provides a comprehensive and detailed overview of the air pollution from ships at the port area.
Noticeably, a detailed and reliable database of ship specifications including the vessel name, vessel type, engine type, main engine power (ME), weight tonnage (GT), and max designed speed (MS) was collected by authors and used as the input data for calculation.
Moreover, regarding load factors for the main engine, while some studies referred to default values from other international studies, this study calculated load factors for each ship based on the ship’s speed. In addition, a sample of 30 vessels for each ship type was collected and analyzed to classify ship operating modes into cruising, maneuvering, and hoteling, which is more detailed and correct.
However, the emissions from the ship were only estimated for the year 2019 in this study. The explanation for this is that from 2020, some new international and national regulations on controlling air emissions in the port area would enter into force, which requires more effort to update emissions factors and adjust in-port ship activity data. In the future, the authors may extend this study to compare the emission inventory before and after those policies came into effect.
In addition, it was suggested that future studies can apply these results to develop further research on evaluating the environmental and social costs of pollution and assessing the efficiency of the ports with the concern of environmental factors. Additionally, the enormous air emission inventory while working in the port area also attracted more attention to pollution prevention and control. More significant efforts are necessary to improve air quality in a coastal area. For example, due to the fact that ships spend a lot of time waiting for cargo handling at berths as well as waiting at the anchorage, it led to the highest amount of emissions in hoteling phase. Therefore, enhancing loading and unloading procedures to reduce unnecessary hoteling time (especially with a high volume of ship call like container and tanker ships) and avoid congestion is considered as one of the urgent measures proposed to the port authority. During the time at berths, instead of using energy from ship’s engine causing air emissions to the environment, it is suggested to use onshore power supplies or use greener alternative fuels.
However, some average inputs were adopted from some earlier studies, which may be not suitable in the Korean context (e.g., auxiliary engine power, auxiliary engine load factor, emissions factor). Additionally, the emission factors tend to increase at low loads when main engine load fell below 20%. The low load adjustment factor of ship’s main engine also should be considered in the next studies. In addition, due to the limited studies on ship emissions in Korea in general and in Yeosu and Gwangyang port area specifically, there is a lack of criteria to verify the output results. Further work is needed to improve the outcomes of this study and minimize the scale of uncertainties.


