Environmental Benefits of Ammonia Reduction in an Agriculture-Dominated Area in South Korea
Abstract
:1. Introduction
2. Methods
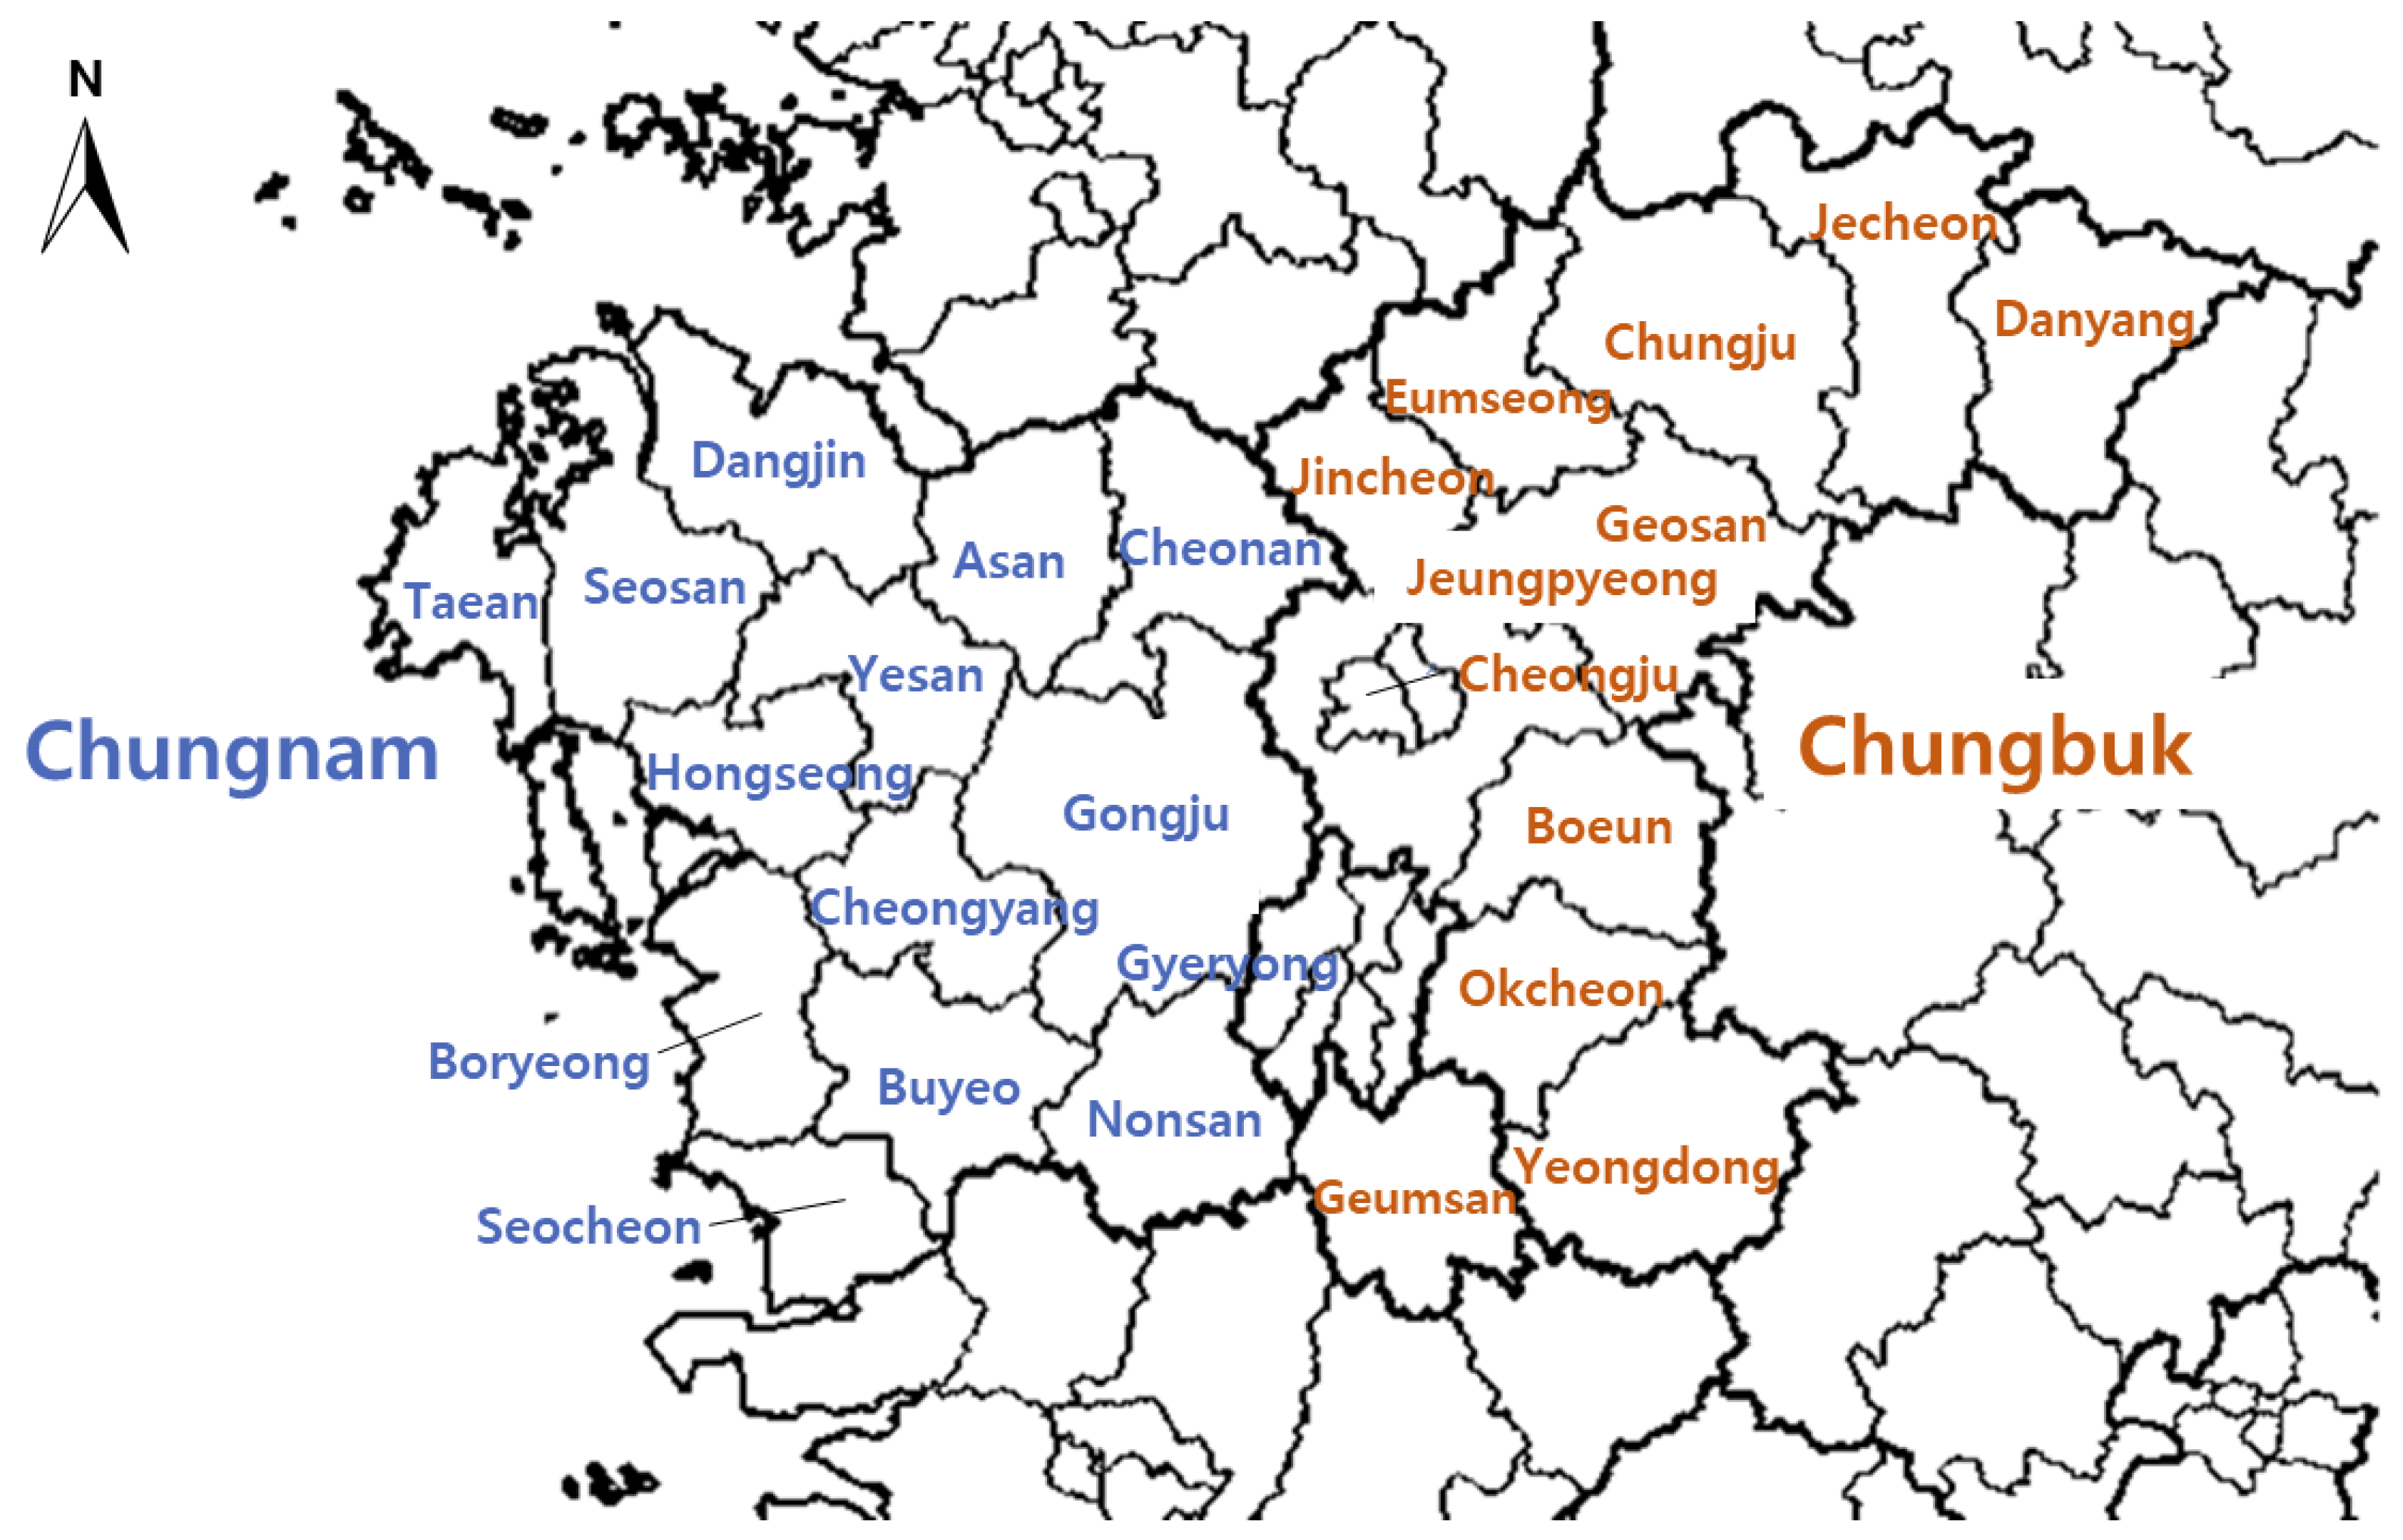
2.1. Study Area
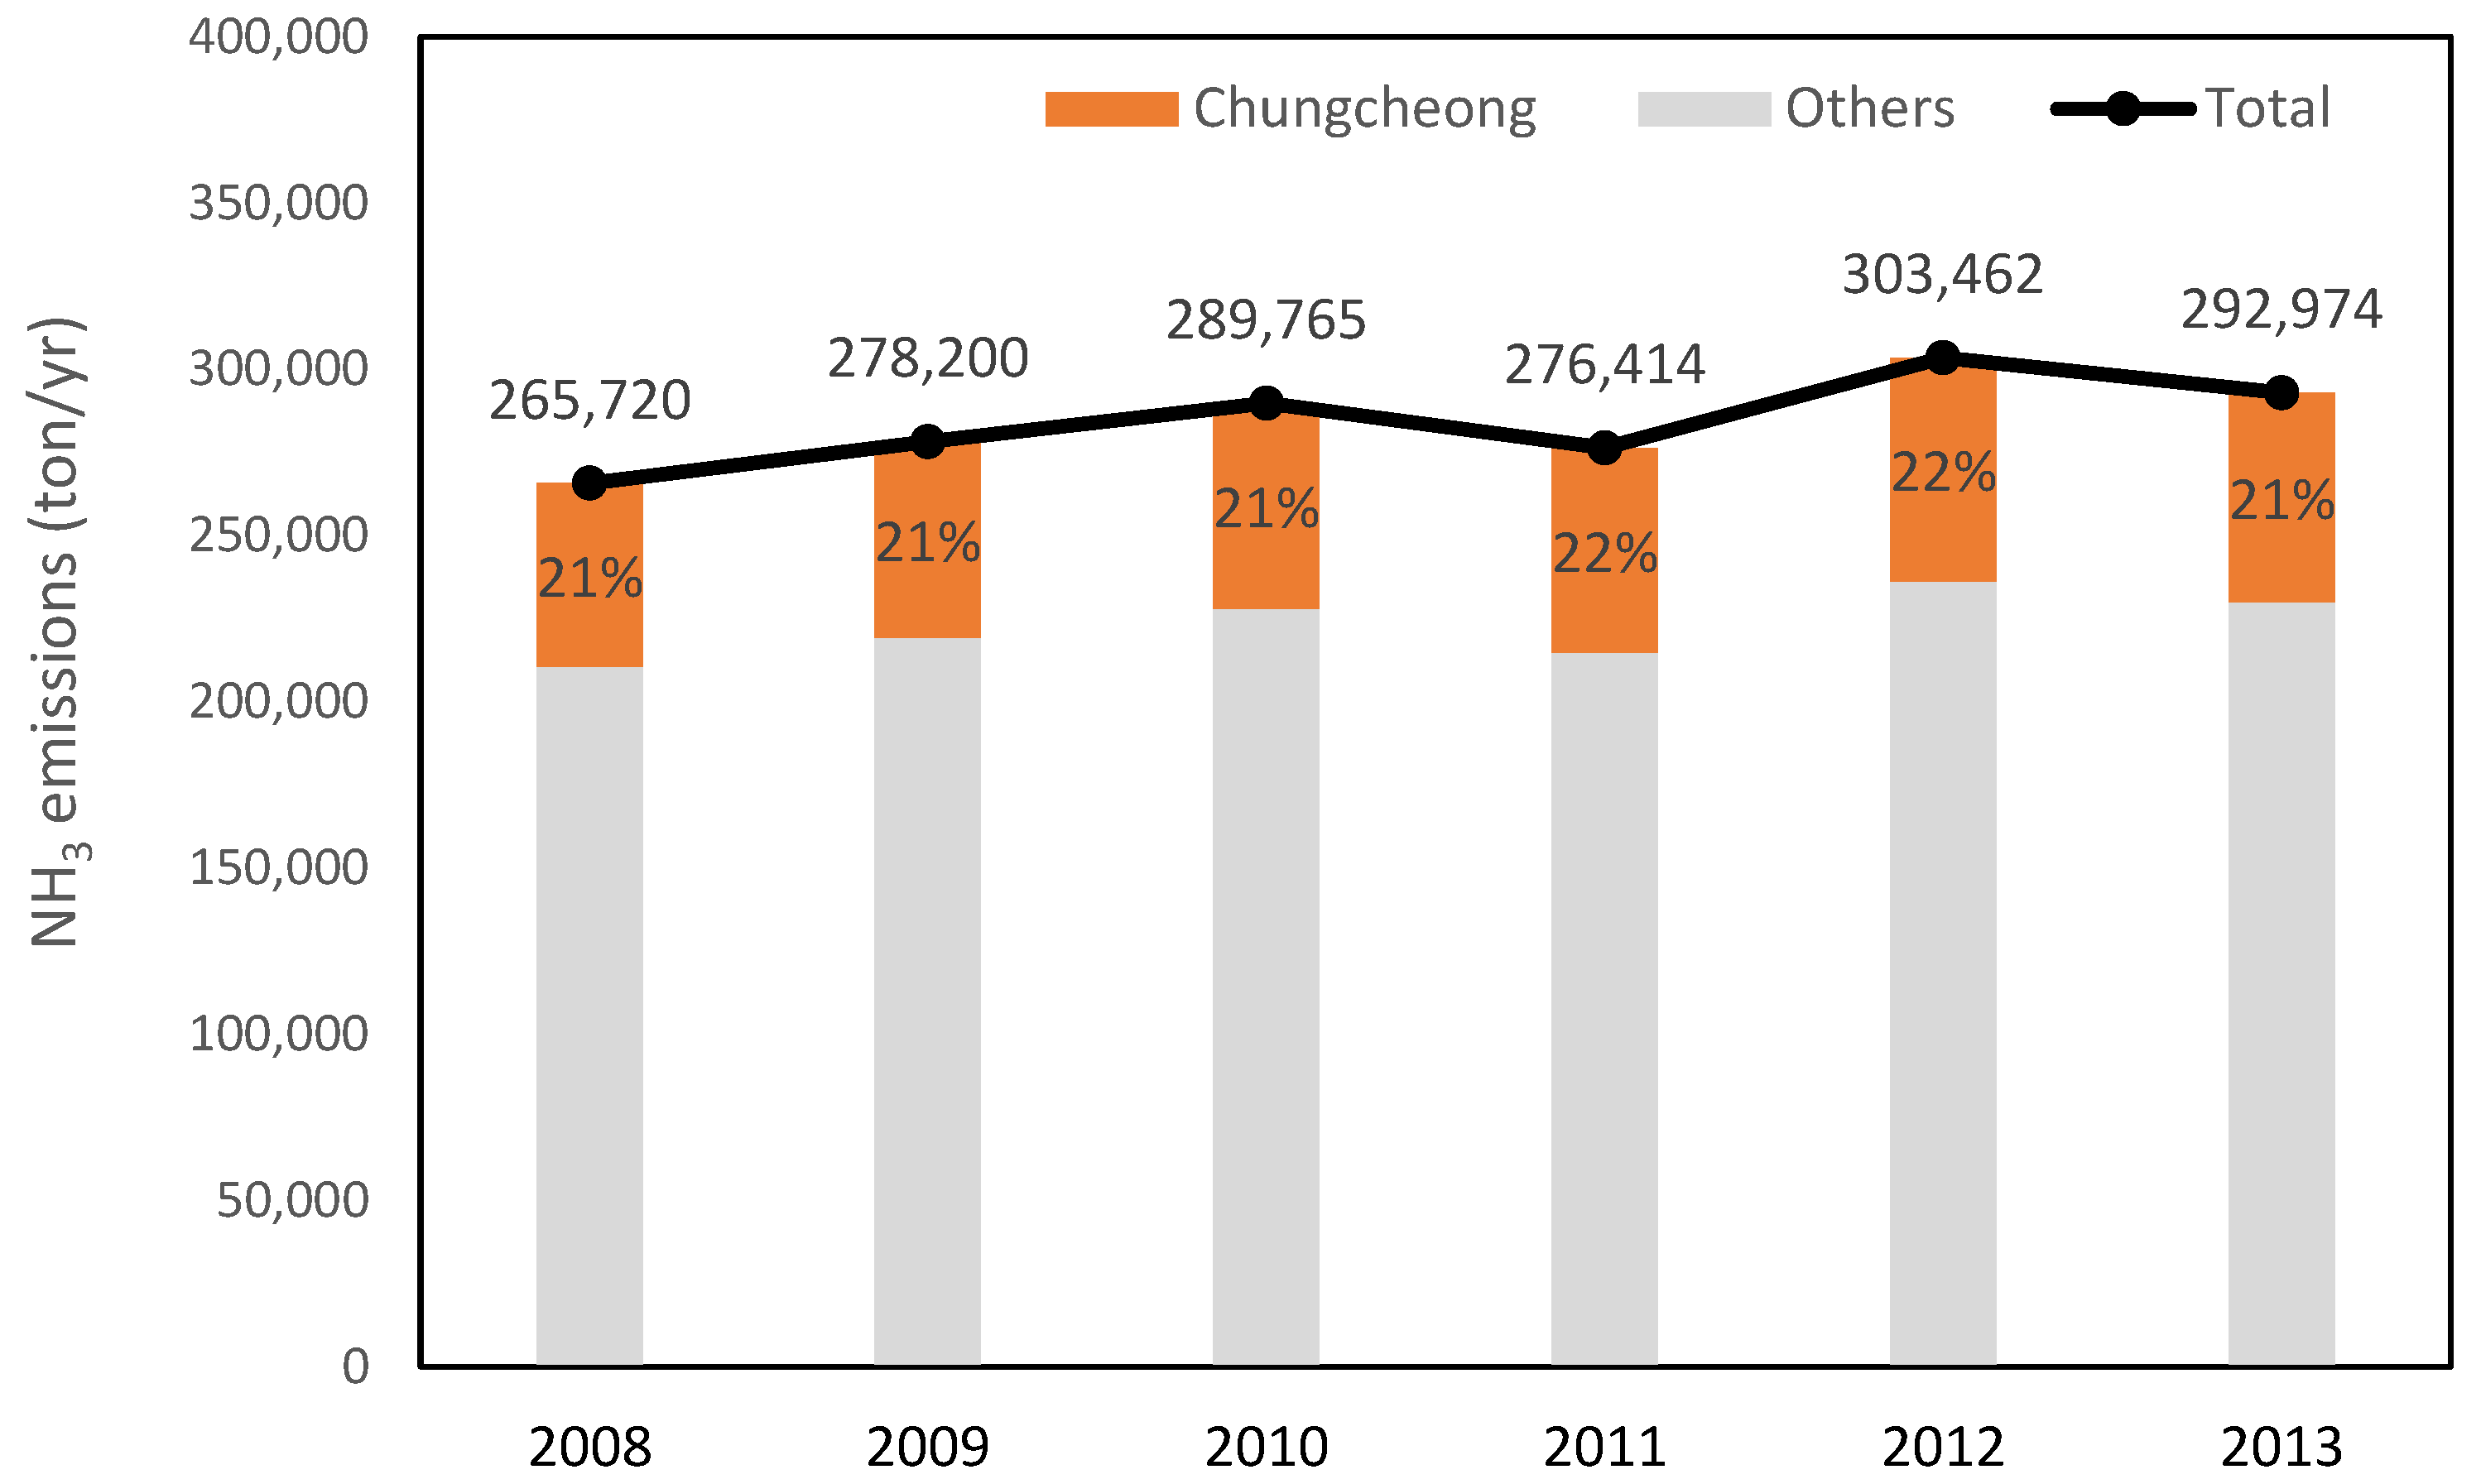
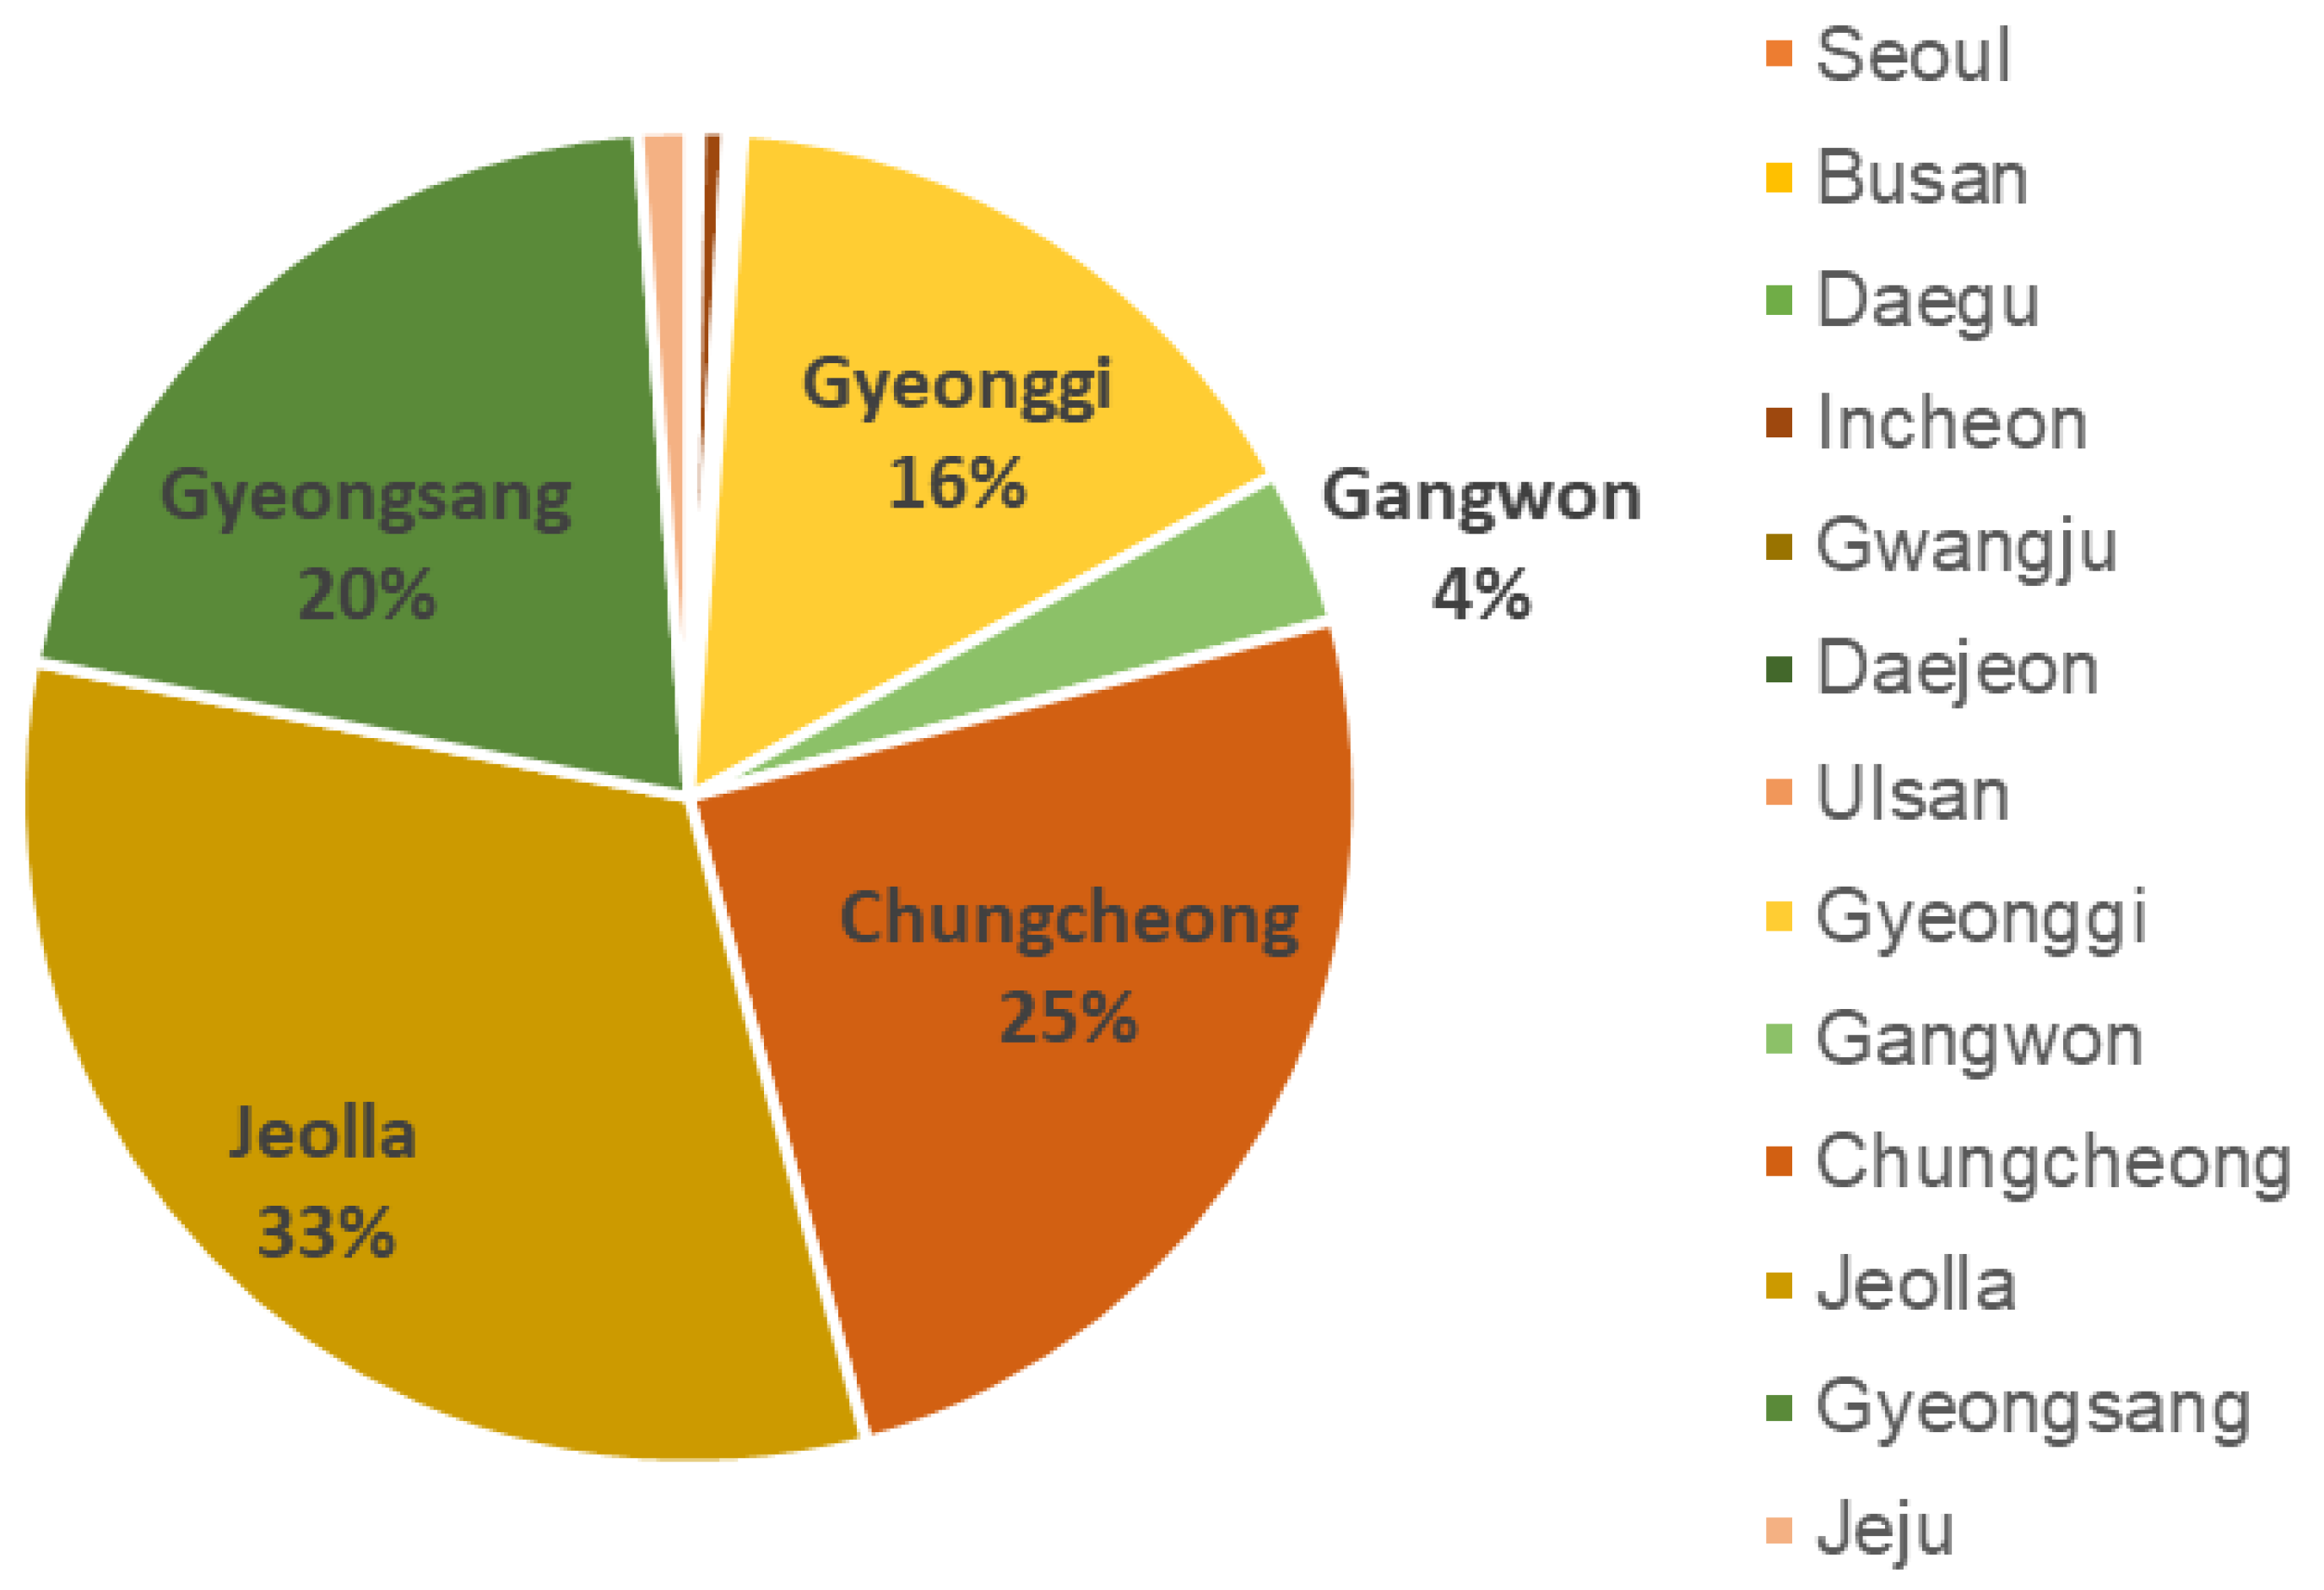
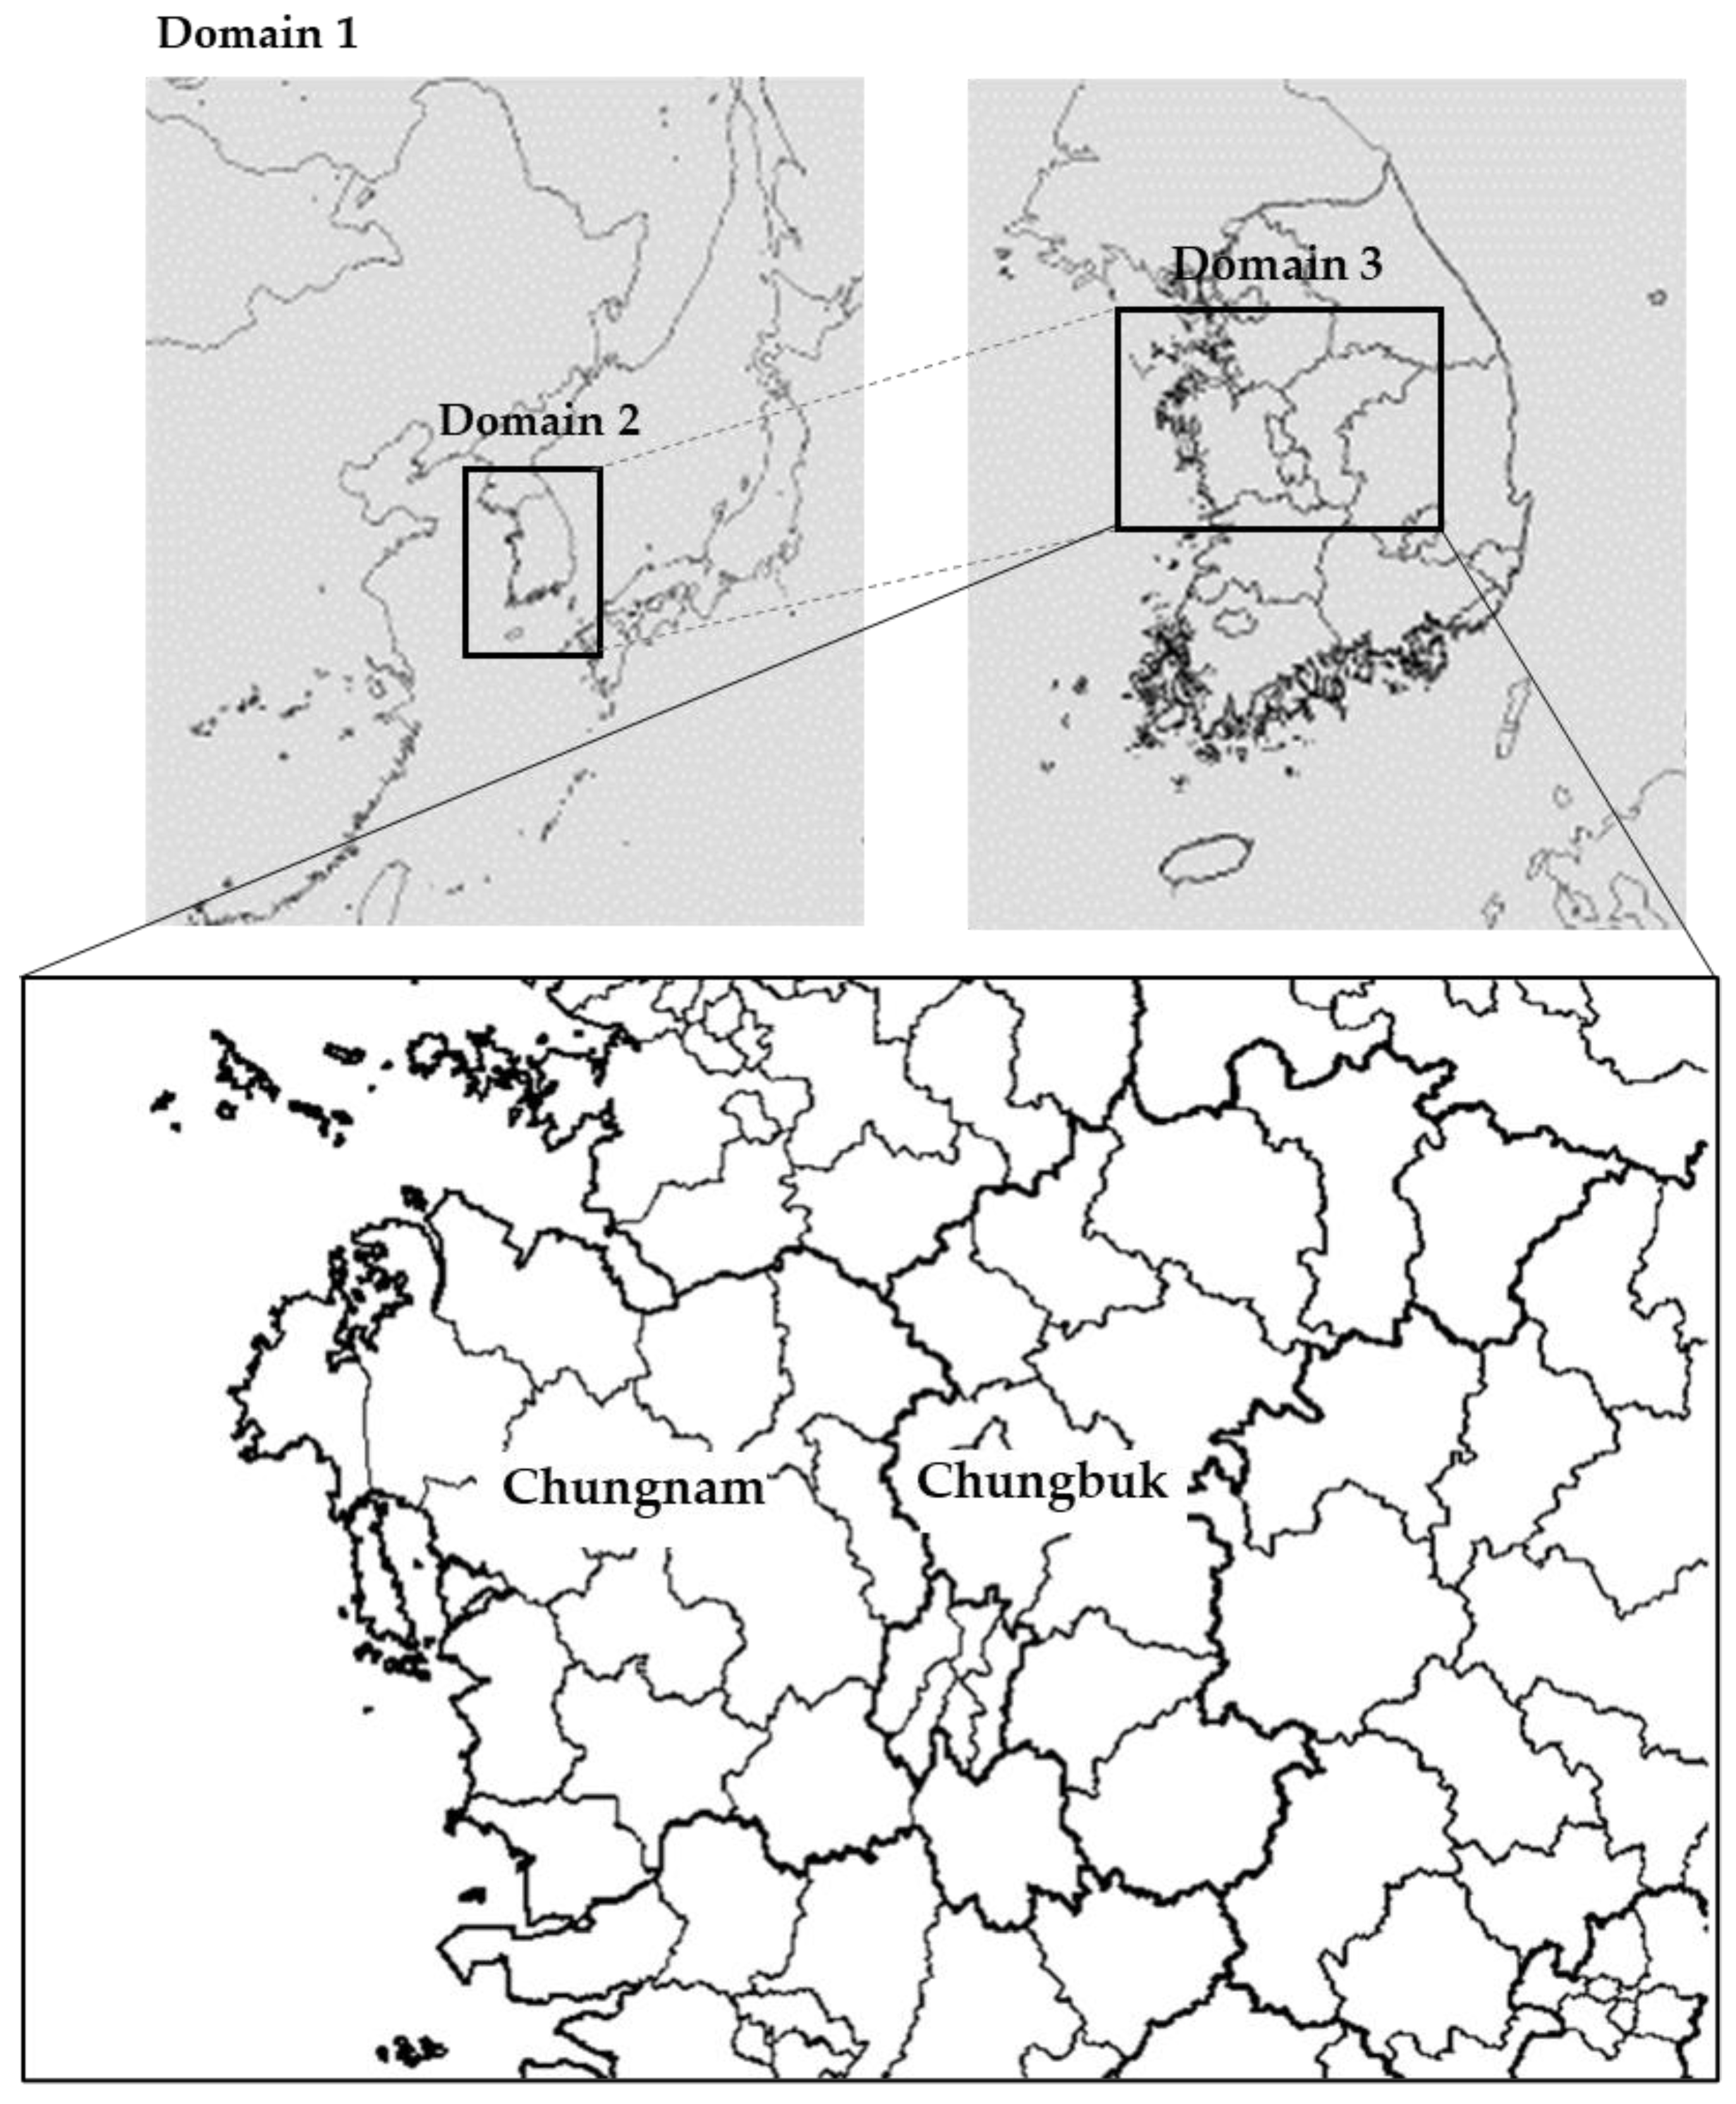
2.2. Model Description and Emission Inventory
2.3. Emission Scenarios
2.4. Target Period
2.5. Model Performance
3. Results and Discussions
3.1. Base Case
3.2. Benefits of Agricultural Emission Control (S1)
3.3. Benefits of Industrial Emission Control (S2)
4. Conclusions
Author Contributions
Funding
Conflicts of Interest
References
- Feng, S.; Gao, D.; Liao, F.; Zhou, F.; Wang, X. The health effects of ambient PM2.5 and potential mechanisms. Ecotoxicol. Environ. Saf. 2016, 128, 67–74. [Google Scholar] [CrossRef] [PubMed]
- World Health Organization and Regional Office for Europe. Health Effects of Particulate Matter. Available online: http://www.euro.who.int/pubrequest (accessed on 22 January 2022).
- Wu, W.; Zhang, Y. Effects of particulate matter (PM2.5) and associated acidity on ecosystem functioning: Response of leaf litter breakdown. Environ. Sci. Pollut. Res. 2018, 25, 30720–30727. [Google Scholar] [CrossRef] [PubMed]
- State of Global Air. Air Pollution’s Impact on Health: A Global Snapshot; Health Effects Institute: Boston, MA, USA, 2020. [Google Scholar]
- Levinson, A. Valuing public goods using happiness data: The case of air quality. J. Public Econ. 2012, 96, 869–880. [Google Scholar] [CrossRef]
- Lavy, V.; Roth, S. The Impact of Short Term Exposure to Ambient Air Pollution on Cognitive Performance and Human Capital Formation; National Bureau of Economic Research: Cambridge, MA, USA, 2014. [Google Scholar]
- Fu, S.; Viard, V.B.; Zhang, P. Air Pollution and Manufacturing Firm Productivity: Nationwide Estimates for China. Econ. J. 2021, 131, 3241–3273. [Google Scholar] [CrossRef]
- Lauri, M. Quantifying the Economic Costs of Air Pollution from Fossil Fuels Key Messages. 2020. Available online: https://energyandcleanair.org/publications/costs-of-air-pollution-from-fossil-fuels/ (accessed on 22 January 2022).
- Wu, R.; Dai, H.; Geng, Y.; Xie, Y.; Masui, T.; Liu, Z.; Qian, Y. Economic Impacts from PM2.5 Pollution-Related Health Effects: A Case Study in Shanghai. Environ. Sci. Technol. 2017, 51, 5035–5042. [Google Scholar] [CrossRef] [PubMed]
- Butt, E.W.; Turnock, S.; Rigby, R.; Reddington, C.; Yoshioka, M.; Johnson, J.; Regayre, L.; Pringle, K.; Mann, G.; Spracklen, D. Global and regional trends in particulate air pollution and attributable health burden over the past 50 years. Environ. Res. Lett. 2017, 12, 104017. [Google Scholar] [CrossRef]
- Akimoto, H. Global Air Quality and Pollution. Science 2003, 302, 1716–1719. [Google Scholar] [CrossRef] [Green Version]
- Davuliene, L.; Jasineviciene, D.; Garbariene, I.; Andriejauskiene, J.; Ulevicius, V.; Bycenkiene, S. Long-term air pollution trend analysis in the South-eastern Baltic region 1981–2017. Atmos. Res. 2021, 247, 105191. [Google Scholar] [CrossRef]
- World Health Organization. Health Aspects of Air Pollution Results from the WHO Project ‘Systematic Review of Health Aspects of Air Pollution in Europe’; World Health Organization: Geneva, Switzerland, 2004. [Google Scholar]
- Mage, D.; Ozolins, G.; Peterson, P.; Webster, A.; Orthofer, R.; Vandeweerd, V.; Gwynne, M. Urban air pollution in megacities of the world. Atmos. Environ. 1996, 30, 681–686. [Google Scholar] [CrossRef]
- OECD. Air Quality and Health: Exposure to PM2.5 Fine Particles; OECD: Paris, France, 2019. [Google Scholar]
- Lee, M. An analysis on the concentration characteristics of PM2.5 in Seoul, Korea from 2005 to 2012. Asia-Pac. J. Atmos. Sci. 2014, 50, 585–594. [Google Scholar] [CrossRef]
- Han, C.; Kim, S.; Lim, Y.H.; Bae, H.J.; Hong, Y.C. Spatial and temporal trends of number of deaths attributable to ambient PM2.5 in the Korea. J. Korean Med. Sci. 2018, 33, 1–4. [Google Scholar] [CrossRef] [PubMed]
- Sun, Y.; Wang, Z.; Wild, O.; Xu, W.; Chen, C.; Fu, P.; Du, W.; Zhou, L.; Zhang, Q.; Han, T.; et al. ‘APEC blue’: Secondary aerosol reductions from emission controls in Beijing. Sci. Rep. 2016, 6, 20668. [Google Scholar] [CrossRef] [PubMed] [Green Version]
- Zhang, Y.; Lang, J.; Cheng, S.; Li, S.; Zhou, Y.; Chen, D.; Zhang, H.; Wang, H. Chemical composition and sources of PM1 and PM2.5 in Beijing in autumn. Sci. Total Environ. 2018, 630, 72–82. [Google Scholar] [CrossRef] [PubMed]
- Pozzer, A.; Tsimpidi, A.P.; Karydis, V.A.; de Meij, A.; Lelieveld, J. Impact of agricultural emission reductions on fine-particulate matter and public health. Atmos. Chem. Phys. 2017, 17, 12813–12826. [Google Scholar] [CrossRef] [Green Version]
- Kleindienst, T.; Lewandowski, M.; Offenberg, J.; Edney, E.; Jaoui, M.; Zheng, M.; Ding, X.; Edgerton, E. Contribution of primary and secondary sources to organic aerosol and PM2.5. J. Air. Waste Manag. Assoc. 2010, 60, 1388–1399. [Google Scholar] [CrossRef] [PubMed] [Green Version]
- Lonati, G.; Giugliano, M.; Ozgen, S. Primary and secondary components of PM2.5 in Milan (Italy). Environ. Int. 2008, 34, 665–670. [Google Scholar] [CrossRef]
- Cheng, B.; Wang, L. Spatial and temporal variations of pm2.5 in north carolina. Aerosol. Air Qual. Res. 2019, 19, 665–670. [Google Scholar]
- Wang, X.; Gemayel, R.; Heyeck, N.; Perrier, S.; Charbonnel, N.; Xu, C.; Chen, H.; Zhu, C.; Zhang, L.; Wang, L.; et al. Atmospheric Photosensitization: A New Pathway for Sulfate Formation. Environ. Sci. Technol. 2020, 54, 3114–3120. [Google Scholar] [CrossRef]
- Tian, M.; Liu, Y.; Yang, F.; Zhang, L.; Peng, C.; Chen, Y.; Shi, G.; Wang, H.; Luo, B.; Jiang, C.; et al. Increasing importance of nitrate formation for heavy aerosol pollution in two megacities in Sichuan Basin, southwest China. Environ. Pollut. 2019, 250, 898–905. [Google Scholar] [CrossRef]
- Jorga, S.D.; Kaltsonoudis, C.; Liangou, A.; Pandis, S.N. Measurement of Formation Rates of Secondary Aerosol in the Ambient Urban Atmosphere Using a Dual Smog Chamber System. Environ. Sci. Technol. 2020, 54, 898–905. [Google Scholar]
- Behera, S.N.; Sharma, M. Reconstructing primary and secondary components of PM2.5 composition for an Urban Atmosphere. Aerosol. Sci. Technol. 2010, 44, 983–992. [Google Scholar] [CrossRef] [Green Version]
- Viatte, C.; Petit, J.; Yamanouchi, S.; van Damme, M.; Doucerain, C.; Germain-Piaulenne, E.; Gros, V.; Favez, O.; Clarisse, L.; Coheur, P.; et al. Ammonia and pm2.5 air pollution in paris during the 2020 covid lockdown. Atmosphere 2021, 12, 160. [Google Scholar] [CrossRef]
- Hristov, A.N. Technical note: Contribution of ammonia emitted from livestock to atmospheric fine particulate matter (PM2.5) in the United States. J. Dairy Sci. 2011, 94, 3130–3136. [Google Scholar] [CrossRef] [PubMed]
- Aneja, V.P.; Blunden, J.; Roelle, P.; Schlesinger, W.; Knighton, R.; Niyogi, D.; Gilliam, W.; Jennings, G.; Duke, C. Workshop on Agricultural Air Quality: State of the science. Atmos. Environ. 2008, 42, 3195–3208. [Google Scholar] [CrossRef]
- Behera, S.N.; Sharma, M.; Aneja, V.P.; Balasubramanian, R. Ammonia in the atmosphere: A review on emission sources, atmospheric chemistry and deposition on terrestrial bodies. Environ. Sci. Pollut. Res. 2013, 12, 8092–8131. [Google Scholar] [CrossRef] [PubMed]
- Shin, D. The Necessity and Policy Plan for Ammonia Management to Improve Fine Dust (PM2.5), Korea Environment Institute. Available online: http://repository.kei.re.kr/handle/2017.oak/22249 (accessed on 23 January 2022).
- Shin, D.; Joo, H.; Seo, E.; Kim, C. Management Strategies to Reduce PM-2.5 Emission: Emphasis-Ammonia; Korea Environment Institute: Sejong, Korea, 2017. [Google Scholar]
- Korea National Statistical Office. Result of the Livestock Trend Survey in the 2nd Quarter of 2017. Available online: http://m.kostat.go.kr/board/file_dn.jsp?aSeq=361868&ord=1 (accessed on 24 February 2022).
- Kim, M.S.; Koo, N.I.; Kim, J.G. A comparative study on ammonia emission inventory in livestock manure compost application through a foreign case study. Korea Soc. Environ. Biol. 2020, 38, 71–81l. [Google Scholar] [CrossRef]
- KOSIS. Land Area by City, County, Field Type. Available online: https://kosis.kr/statisticsList/statisticsListIndex.do?vwcd=MT_ZTITLE&menuId=M_01_01#content-group (accessed on 16 February 2022).
- Kim, H.C.; Kim, S.; Lee, S.H.; Kim, B.U.; Lee, P. Fine-scale columnar and surface nox concentrations over South Korea: Comparison of surface monitors, tropomi, cmaq and capss inventory. Atmosphere 2020, 11, 101. [Google Scholar] [CrossRef] [Green Version]
- Ministry of Environment. 2017 Yearbook of Atmospheric Environment; Ministry of Environment: Seojong, Korea, 2017. [Google Scholar]
- Chang, J.; Hanna, S. Air quality model performance evaluation. Meteorol. Atmos. Phys. 2004, 87, 167–169. [Google Scholar] [CrossRef]
- Kang, Y.H.; Oh, I.B.; Jeong, J.H.; Kim, Y.K.; Kim, S.T.; Kim, E.H.; Hong, J.H.; Lee, D.G. Comparison of CMAQ Ozone Simulations with Two Chemical Mechanisms (SAPRC99 and CB05) in the Seoul Metropolitan Region. J. Environ. Sci. Int. 2016, 25, 85–97. [Google Scholar] [CrossRef]
- Ghim, Y.S.; Choi, Y.J.; Kim, S.T.; Bae, C.H.; Park, J.S.; Shin, H.J. Model Performance Evaluation and Bias Correction Effect Analysis for Forecasting PM2.5 Concentrations. J. Korean Soc. Atmos. Environ. 2017, 33, 11–18. [Google Scholar] [CrossRef]
- Kim, D.Y. PM Analysis Using CMAQ in Seoul Metropolitan Area, Gyeonggi Research Institute. Available online: https://www.dbpia.co.kr/journal/articleDetail?nodeId=NODE01446673 (accessed on 17 February 2022).
- Yang, X.; Wu, Q.; Zhao, R.; Cheng, H.; He, H.; Ma, Q.; Wang, L.; Luo, H. New method for evaluating winter air quality: PM2.5 assessment using Community Multi-Scale Air Quality Modeling (CMAQ) in Xi’an. Atmos. Environ. 2019, 211, 18–28. [Google Scholar] [CrossRef]
- Pinder, R.W.; Dennis, R.L.; Bhave, P.V. Observable indicators of the sensitivity of PM2.5 nitrate to emission reductions-Part I: Derivation of the adjusted gas ratio and applicability at regulatory-relevant time scales. Atmos. Environ. 2008, 42, 1275–1286. [Google Scholar] [CrossRef]
- Seinfeld, J.H.; Pandis, S.N. Atmospheric Chemistry and Physics: From Air Pollution to Climate Change; John Wiley & Sons: New York, NY, USA, 2006; p. 5. [Google Scholar]
- Southern Oxidants Study, In Lessons That Are Available to Be Learned from the Southern Oxidants Study. Available online: https://www.ncsu.edu/sos/x.html (accessed on 31 January 2022).





| Region | Beef Cattle | Dairy Cattle | Swine | Poultry | Duck | Total |
|---|---|---|---|---|---|---|
| Seoul | 127 | 21 | - | - | - | 148 |
| Busan | 1575 | 378 | 5806 | 93,264 | - | 101,023 |
| Daegu | 18,426 | 1267 | 8114 | 388,500 | - | 416,307 |
| Incheon | 19,104 | 2675 | 40,325 | 1,175,700 | - | 1,237,804 |
| Gwangju | 6525 | 674 | 8269 | 141,700 | - | 157,168 |
| Daejeon | 6079 | - | 60 | 98,200 | - | 104,339 |
| Ulsan | 28,232 | 777 | 25,589 | 481,081 | - | 535,679 |
| Gyeonggi | 274,776 | 163,486 | 1,866,428 | 27,710,065 | 205,600 | 30,220,355 |
| Gangwon | 207,235 | 17,567 | 453,137 | 6,502,703 | 2080 | 7,182,722 |
| Chungcheong | 567,489 | 94,433 | 2,728,372 | 44,147,120 | 650,956 | 48,188,370 |
| Jeolla | 767,005 | 59,707 | 2,329,466 | 54,546,211 | 5,044,435 | 62,746,824 |
| Gyeongsang | 856,847 | 57,187 | 2,394,658 | 35,743,902 | 540,465 | 39,593,059 |
| Jeju | 32,326 | 4003 | 571,684 | 1,715,033 | 16,300 | 2,339,346 |
| Total | 2,785,746 | 402,175 | 10,431,908 | 172,743,479 | 6,459,836 | 192,823,144 |
| Livestock Type | Subdivision | Emission Factor (kg-NH3/Head) |
|---|---|---|
| Beef cattle | Under 1 year old | 11.8 |
| 1–2 years old | 14.0 | |
| Over 2 years old | 16.8 | |
| Dairy cattle | - | 24.6 |
| Swine | Nursery pig | 4.4 |
| Glowing pig | 8.7 | |
| Fatting pig | 11.4 | |
| Sow | 21.4 | |
| Poultry | Laying hen | 0.37 |
| Broiler | 0.28 | |
| Other poultry | Duck | 0.92 |
| Region | Farmland (km2) | Ratio (%) |
|---|---|---|
| Seoul | 4 | 0.0 |
| Busan | 57 | 0.4 |
| Daegu | 81 | 0.5 |
| Incheon | 190 | 1.2 |
| Gwangju | 94 | 0.6 |
| Daejeon | 39 | 0.2 |
| Ulsan | 105 | 0.7 |
| Gyeonggi | 1657 | 10.2 |
| Gangwon | 1031 | 6.4 |
| Chungcheong | 3283 | 20.3 |
| Jeolla | 4931 | 30.4 |
| Gyeongsang | 4124 | 25.4 |
| Jeju | 611 | 3.8 |
| Total | 16,208 | 100.0 |
| Model | Parameter | Selected Option |
|---|---|---|
| CMAQ | Gas-phase chemical mechanism | CB05 |
| Aerosol module | AERO5 | |
| Chemical mechanism | SAPRC99 | |
| Advection scheme | YAMO | |
| WRF | Microphysics | WSM6 |
| Shortwave radiation | Dudhia | |
| Longwave radiation | RRTM | |
| Cumulus parameterization | Kain–Fritsch | |
| Planetary boundary layer | Yonsei University Scheme | |
| Land surface model | Noah |
| Scenario | Point Source Emissions from Chungcheong (ton/yr) | ||||||
| CO | NOx | SOx | VOCs | PM2.5 | PM10 | NH3 | |
| Base | 18,611 | 85,449 | 58,270 | 33,910 | 2674 | 3600 | 11,111 |
| S1 | 18,611 | 85,449 | 58,270 | 33,910 | 2674 | 3600 | 11,111 |
| S2 | 18,611 | 53,970 (−31,479) | 28,397 (−29,873) | 30,747 (−3163) | 2277 (−397) | 3600 | 11,111 |
| Scenario | Area Source Emissions from Chungcheong (ton/yr) | ||||||
| CO | NOx | SOx | VOCs | PM2.5 | PM10 | NH3 | |
| Base | 60,055 | 21,413 | 18,090 | 75,942 | 12,222 | 21,820 | 55,045 |
| S1 | 60,055 | 21,413 | 18,090 | 75,942 | 12,222 | 21,820 | 38,859 (−16,186) |
| S2 | 60,055 | 21,413 | 18,090 | 75,942 | 12,222 | 21,820 | 55,045 |
| NOx | SOx | VOCs | PM2.5 | |
|---|---|---|---|---|
| Chungbuk | 27% | 17% | 8% | 15% |
| Chungnam | 44% | 55% | 13% | 15% |
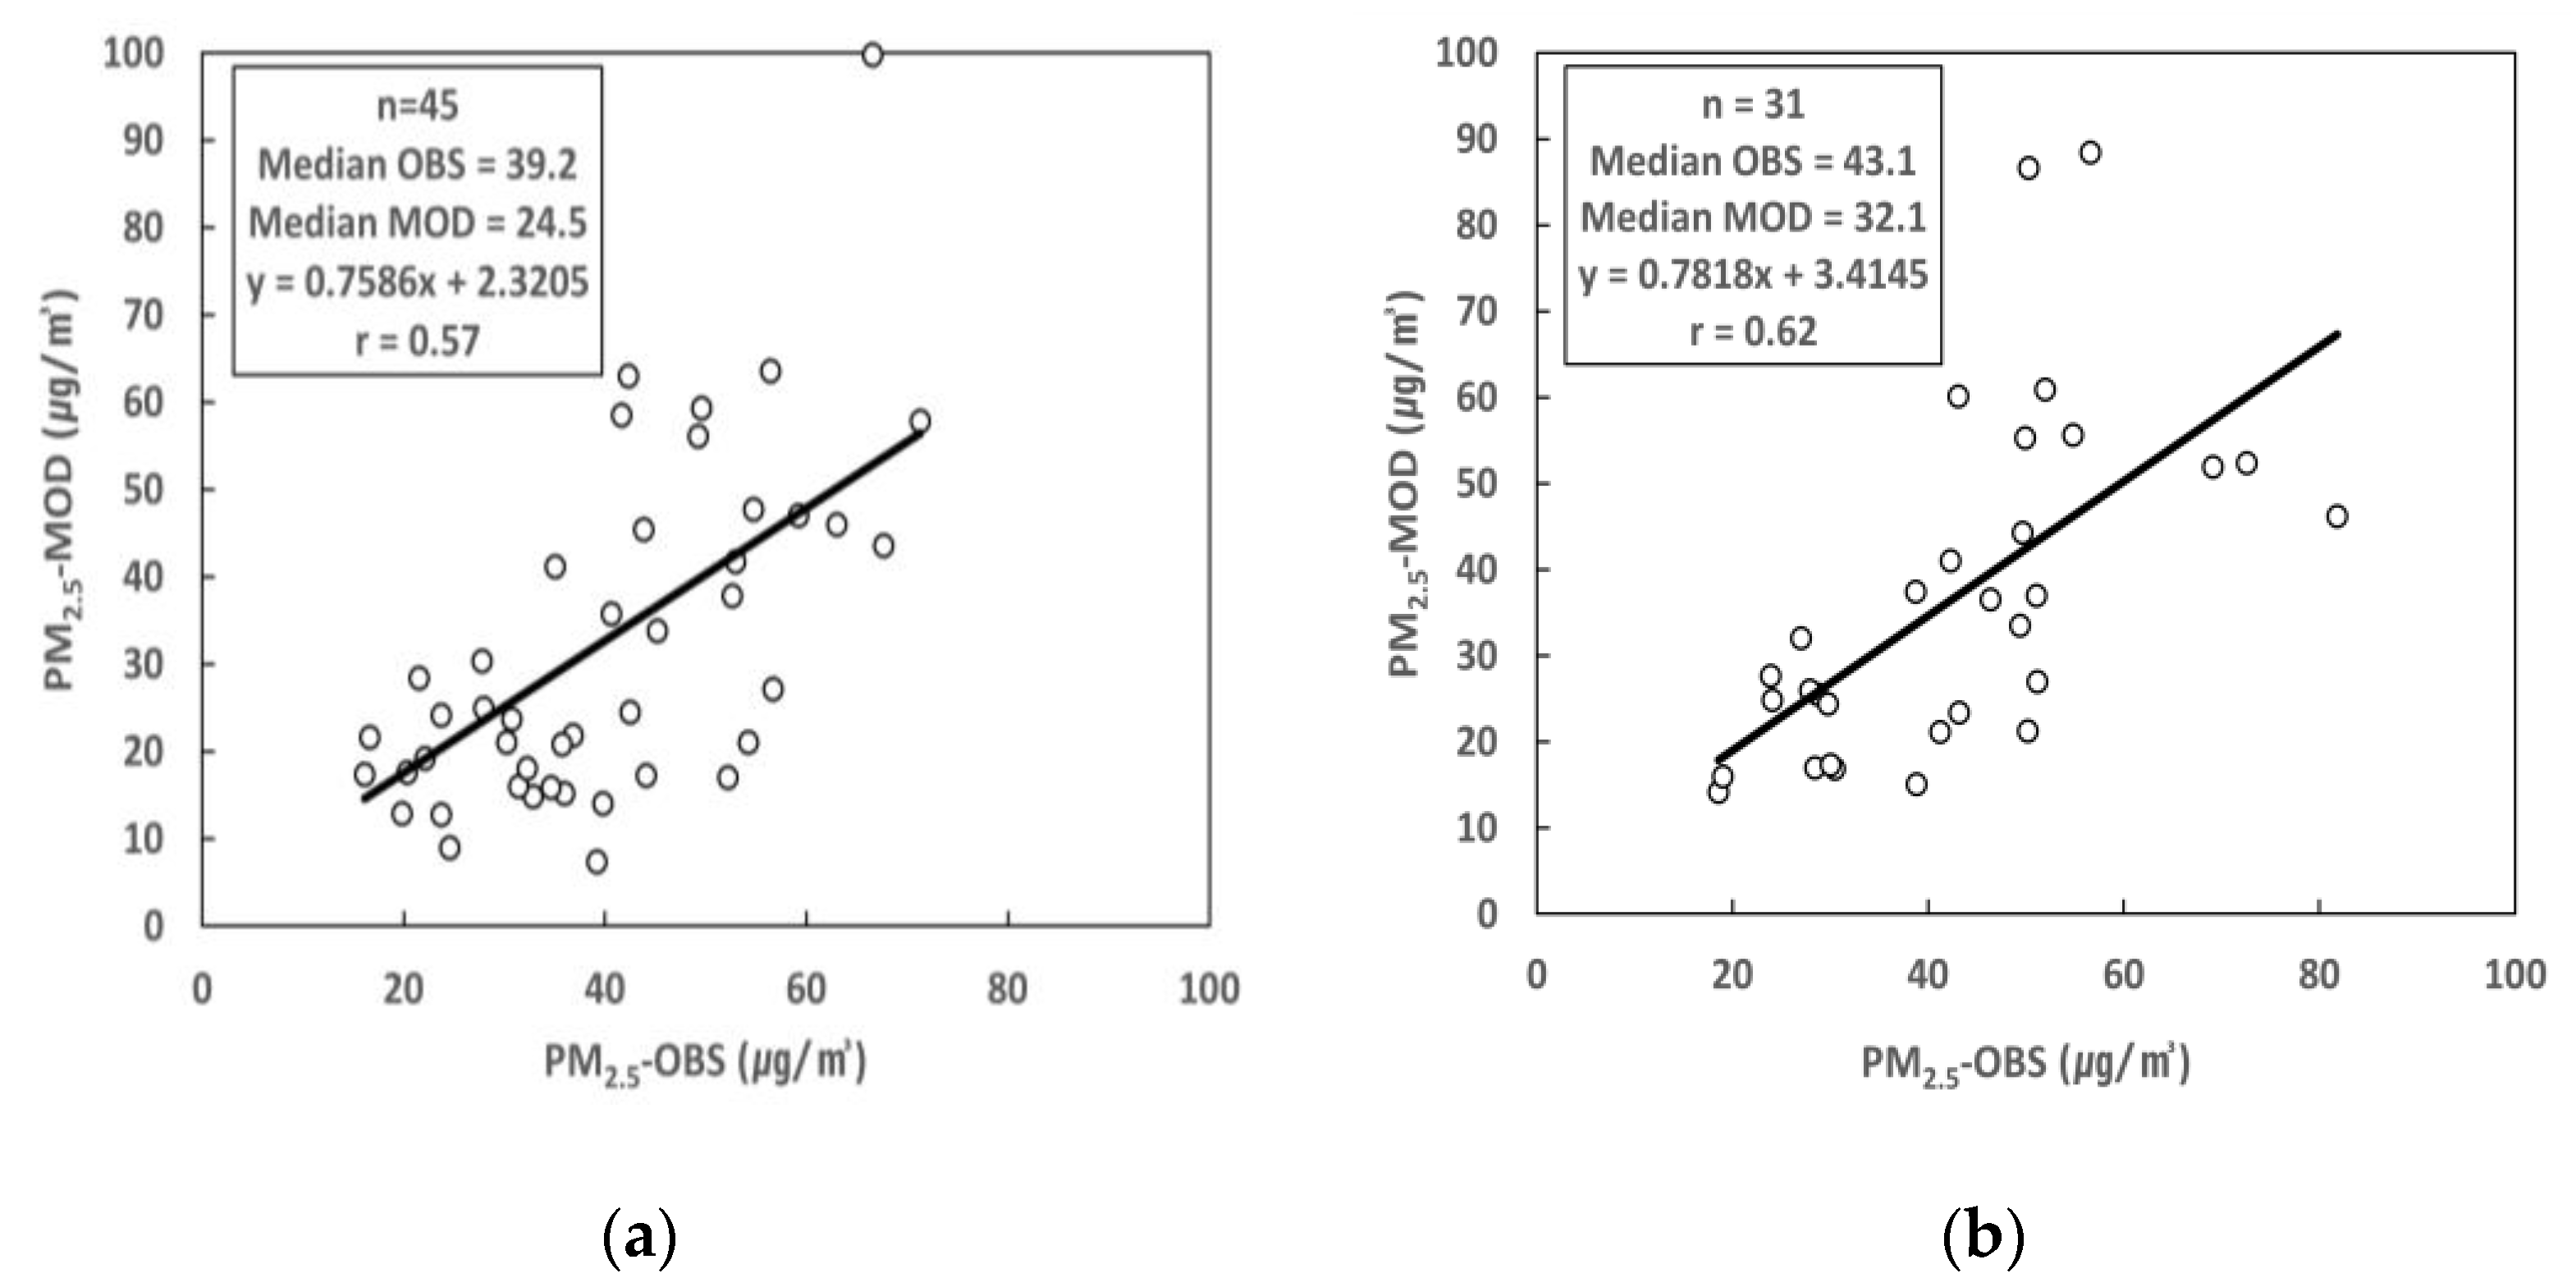
| Statistic | Cheongju | Cheonan |
|---|---|---|
| MB | −7.26 | −5.87 |
| IOA | 0.71 | 0.74 |
| FAC2 | 0.82 | 0.86 |
| R | 0.57 | 0.62 |
| Mean (µg/m3) | Cheongju | Cheonan |
|---|---|---|
| OBS | 39.7 | 42.6 |
| MOD | 32.4 | 36.7 |
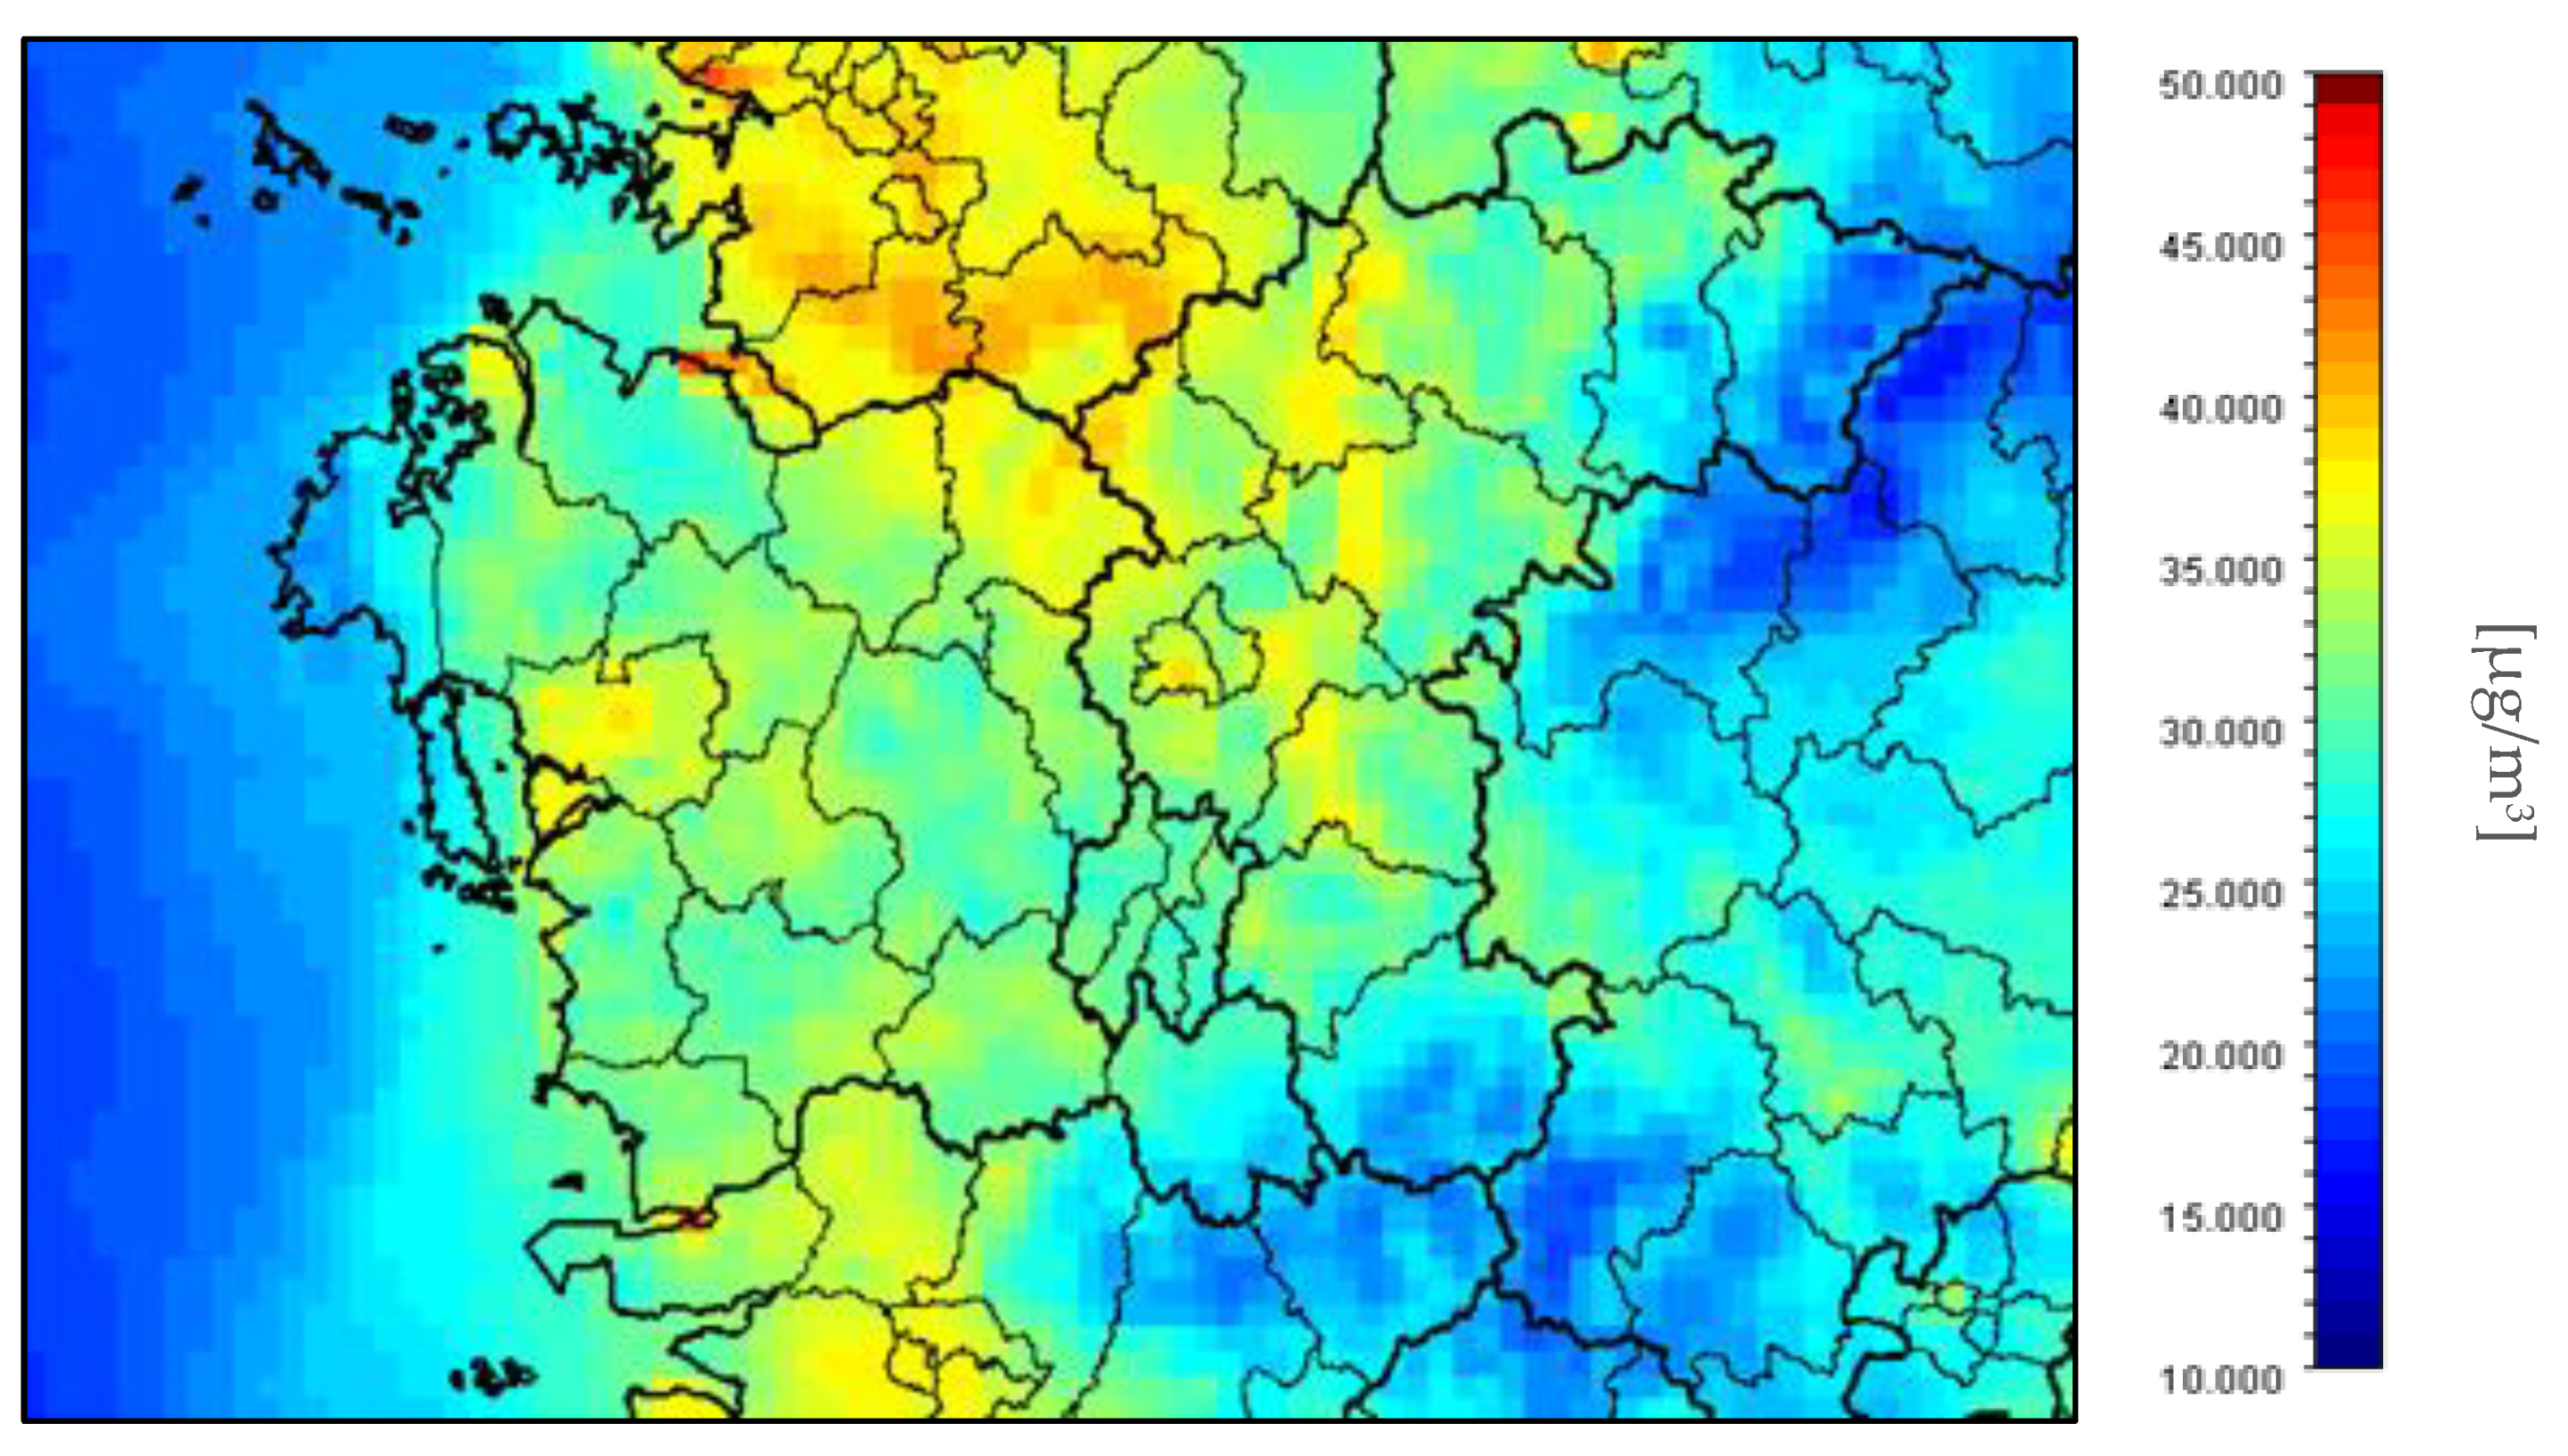
| Chungbuk | Chungnam | ||
|---|---|---|---|
| City | PM2.5 Conc. (µg/m3) | City | PM2.5 Conc. (µg/m3) |
| Cheongju | 35.8 | Gongju | 29.3 |
| Goesan | 30.9 | Geumsan | 26.3 |
| Danyang | 26.0 | Hongseong | 36.2 |
| Jincheon | 33.9 | Nonsan | 34.2 |
| Boeun | 31.8 | Dangjin | 28.1 |
| Chungju | 32.3 | Seosan | 31.5 |
| Eumseong | 34.6 | Boryeong | 31.8 |
| Yeongdong | 24.7 | Asan | 33.2 |
| Jecheon | 31.5 | Cheonan | 36.7 |
| Okcheon | 32.1 | Buyeo | 30.9 |
| Jeungpyeong | 34.7 | Seocheon | 31.3 |
| Gyeryong | 31.3 | ||
| Yesan | 32.8 | ||
| Average | 31.65 | Average | 31.58 |
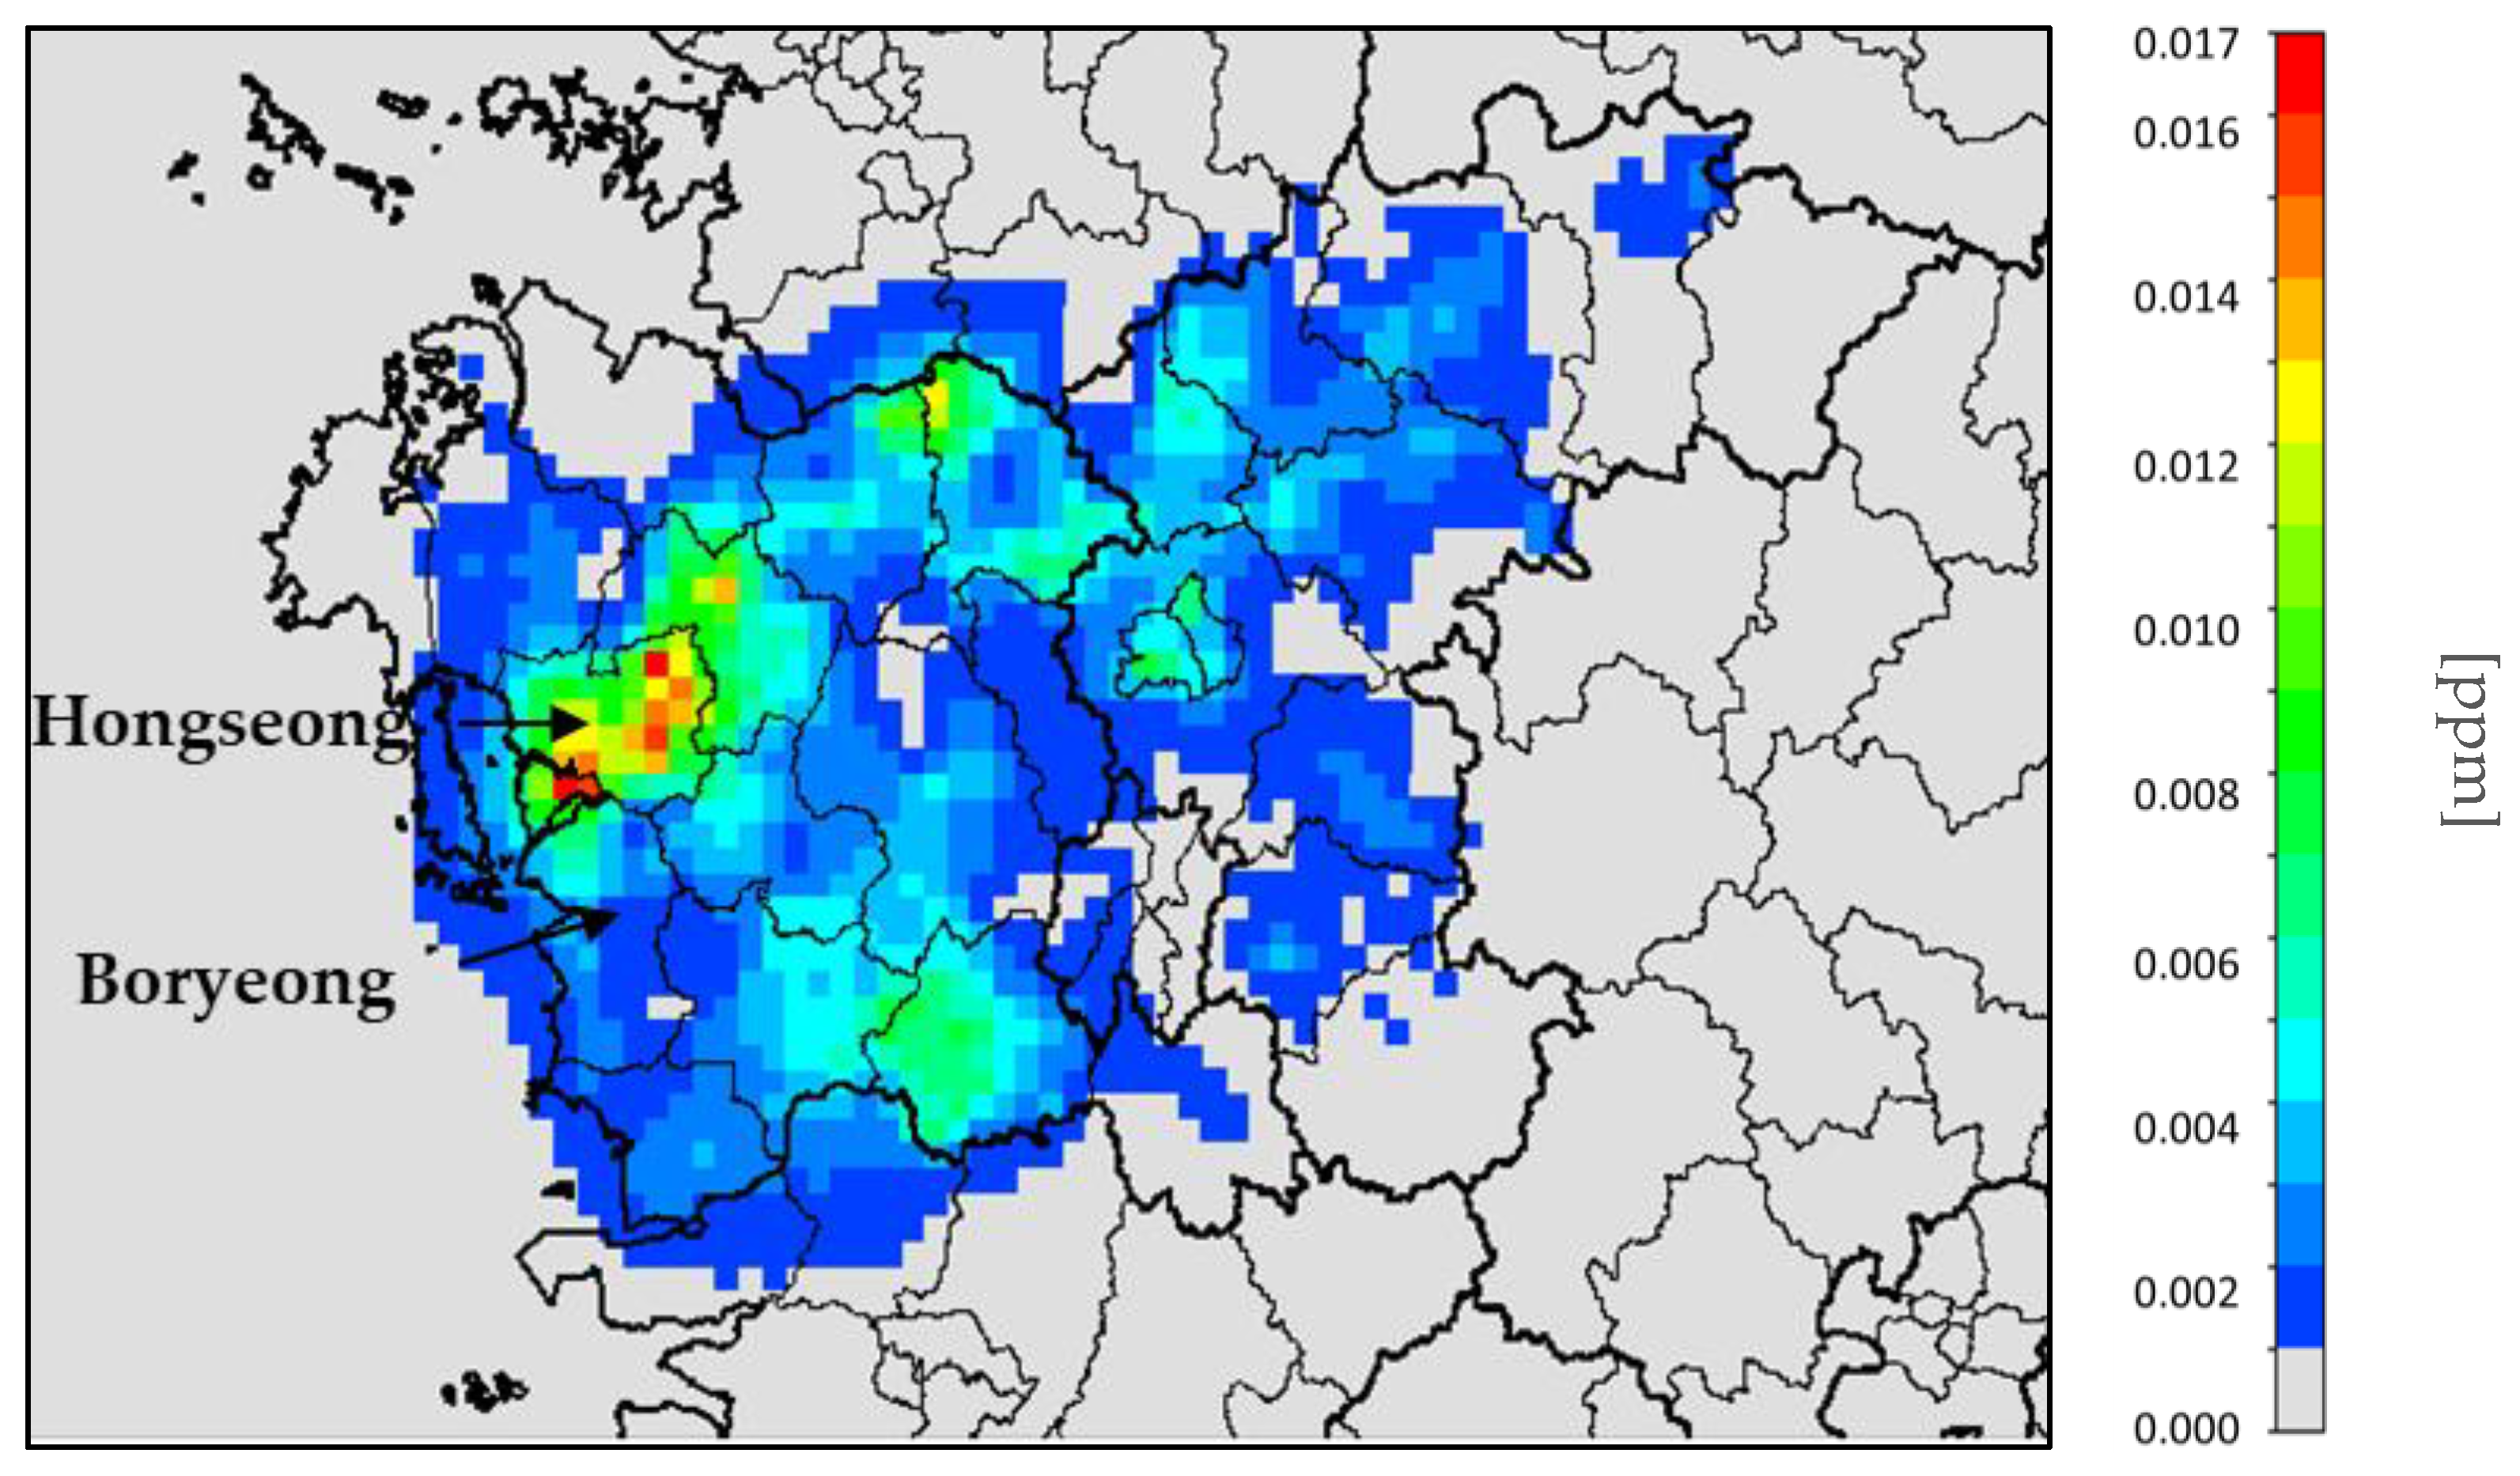
| Region | PM2.5 Change (µg/m3) | Improvement Rate (%) |
|---|---|---|
| Chungbuk | −1.1 | 3.6 |
| Chungnam | −1.1 | 3.5 |
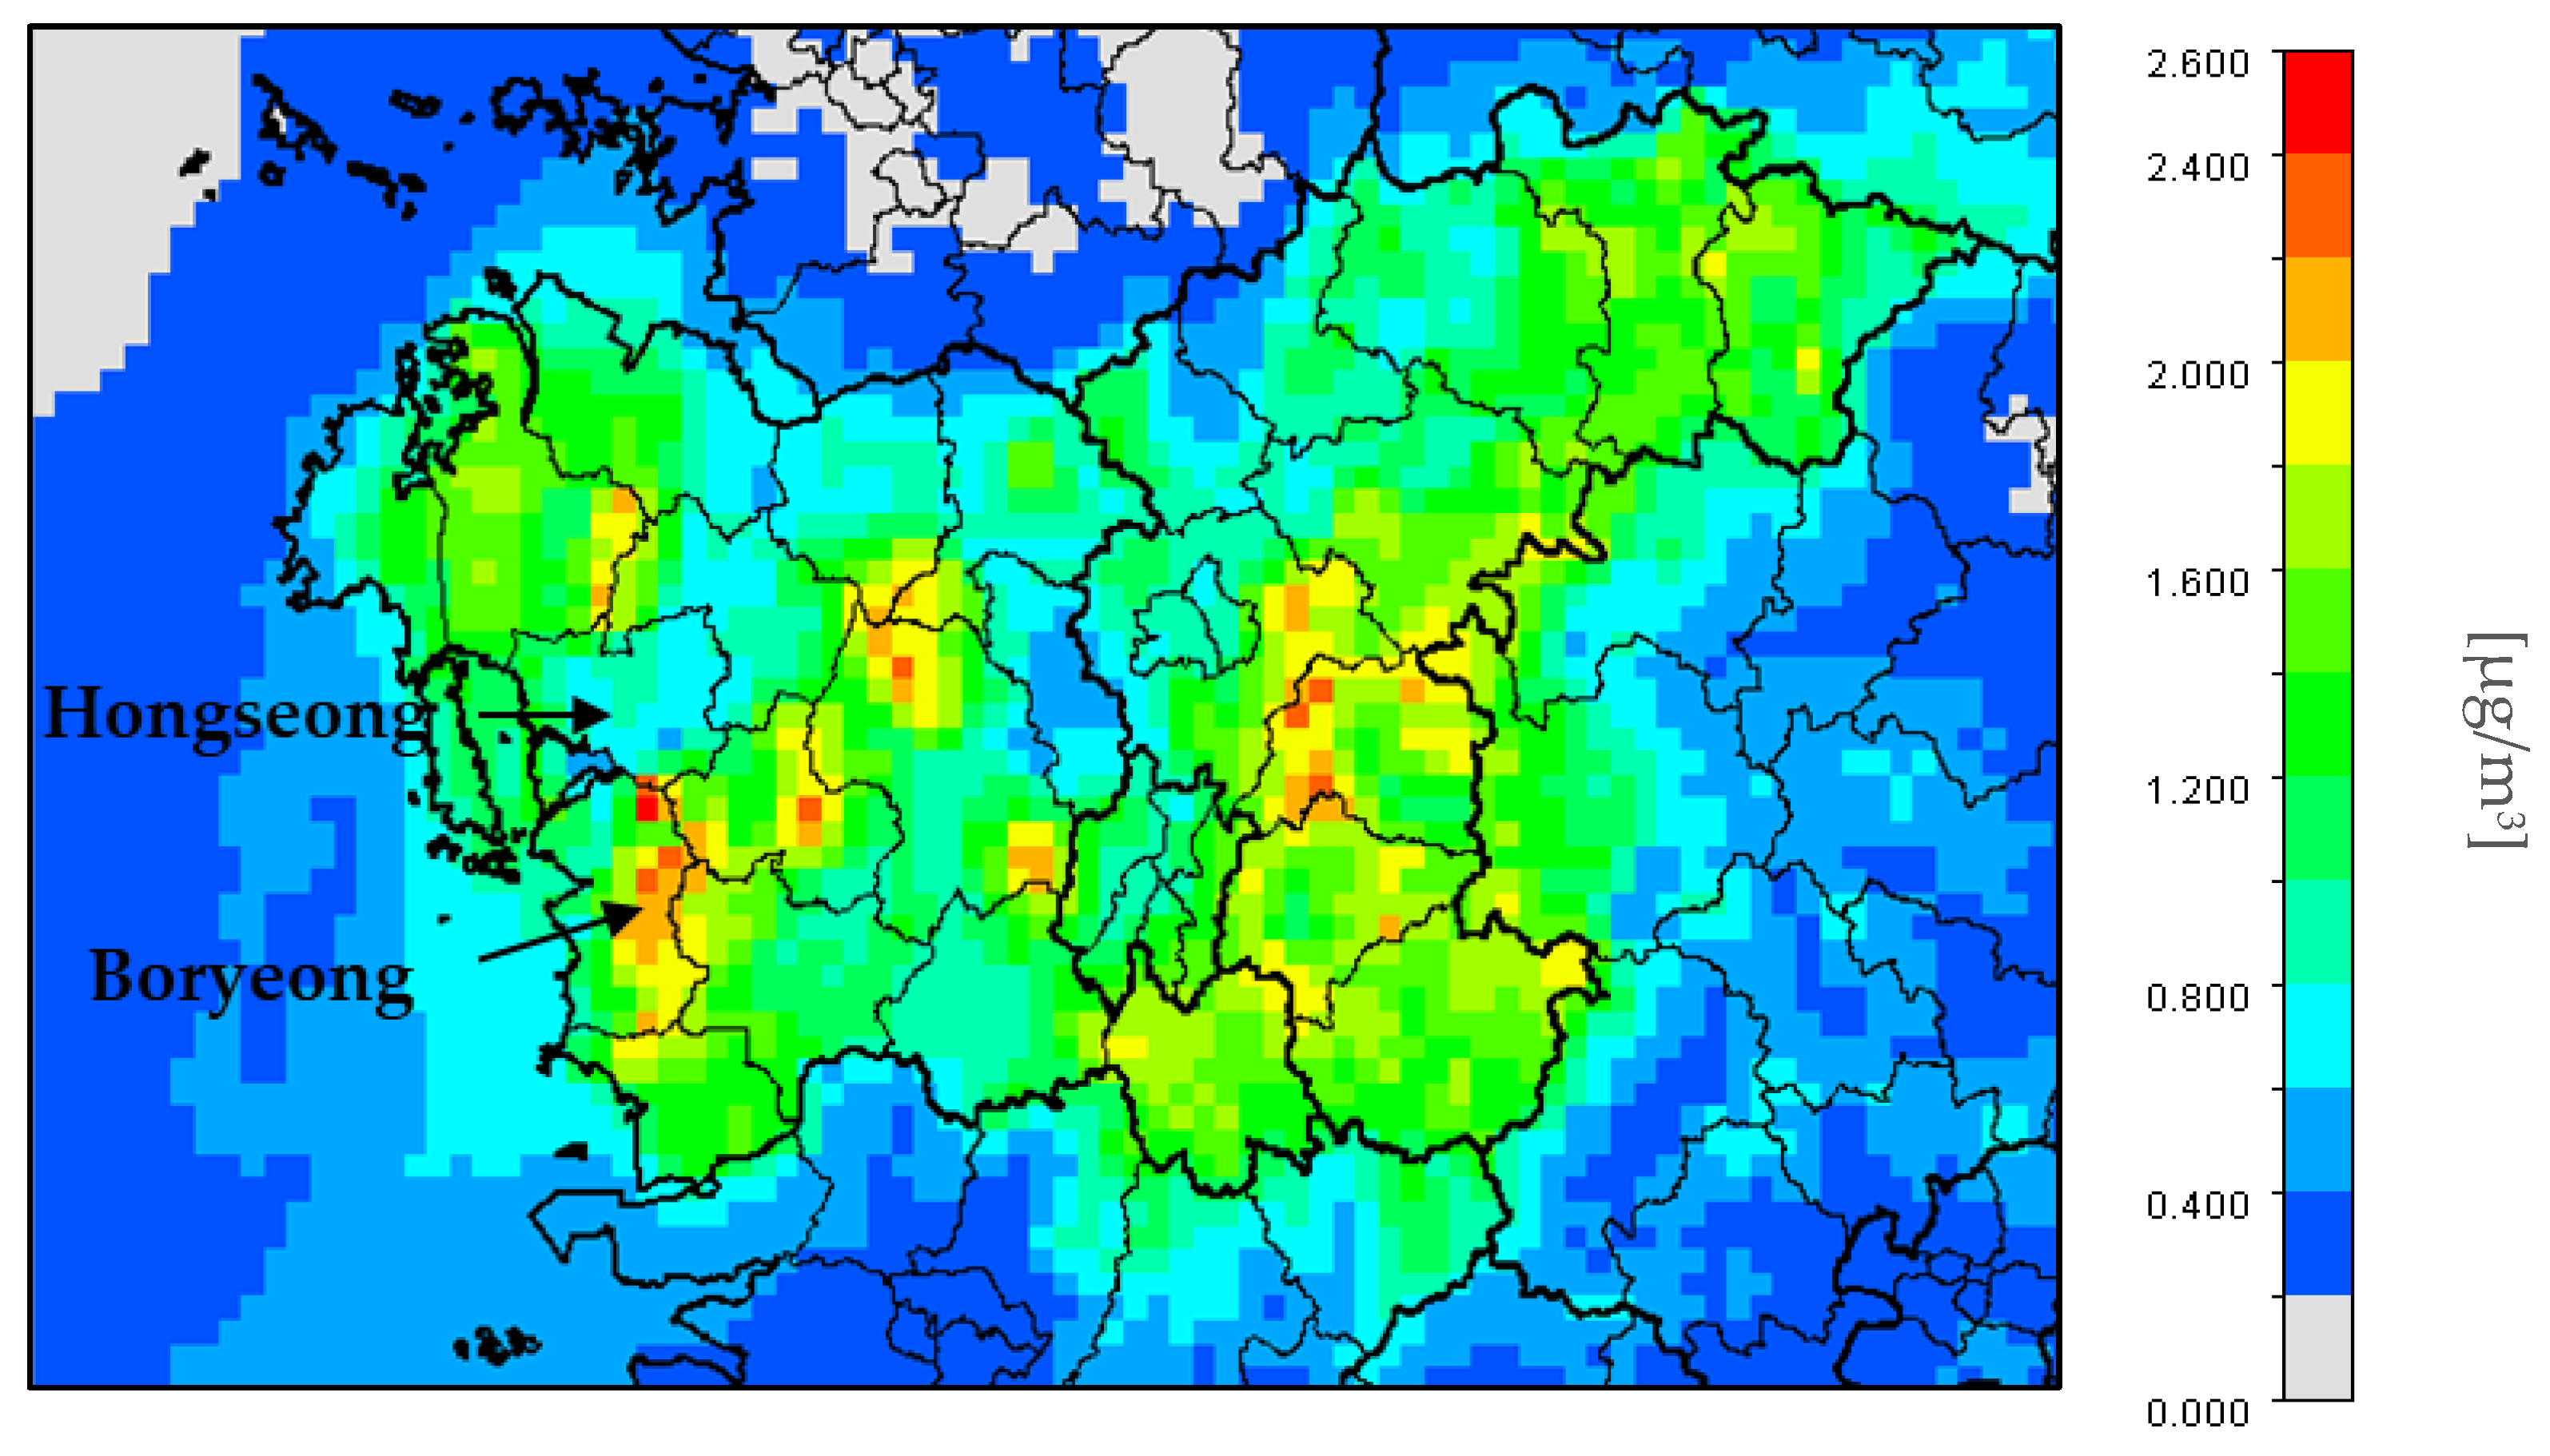
| Region | PM2.5 Change (µg/m3) | Improvement Rate (%) |
|---|---|---|
| Chungbuk | −0.2 | 0.7 |
| Chungnam | −0.3 | 1.1 |
Publisher’s Note: MDPI stays neutral with regard to jurisdictional claims in published maps and institutional affiliations. |
© 2022 by the authors. Licensee MDPI, Basel, Switzerland. This article is an open access article distributed under the terms and conditions of the Creative Commons Attribution (CC BY) license (https://creativecommons.org/licenses/by/4.0/).
Share and Cite
Choi, H.; Sunwoo, Y. Environmental Benefits of Ammonia Reduction in an Agriculture-Dominated Area in South Korea. Atmosphere 2022, 13, 384. https://doi.org/10.3390/atmos13030384
Choi H, Sunwoo Y. Environmental Benefits of Ammonia Reduction in an Agriculture-Dominated Area in South Korea. Atmosphere. 2022; 13(3):384. https://doi.org/10.3390/atmos13030384
Chicago/Turabian StyleChoi, Hyojeong, and Young Sunwoo. 2022. "Environmental Benefits of Ammonia Reduction in an Agriculture-Dominated Area in South Korea" Atmosphere 13, no. 3: 384. https://doi.org/10.3390/atmos13030384
APA StyleChoi, H., & Sunwoo, Y. (2022). Environmental Benefits of Ammonia Reduction in an Agriculture-Dominated Area in South Korea. Atmosphere, 13(3), 384. https://doi.org/10.3390/atmos13030384


