Article

Aviation Turbulence Forecasting over the Portuguese Flight Information Regions: Algorithm and Objective Verification

by
Margarida Belo-Pereira
1,2
1
Instituto Português do Mar e da Atmosfera, Divisão de Meteorologia Aeronáutica, Rua C do Aeroporto, 1749-077 Lisboa, Portugal
2
Centre for the Research of Agroenvironmental and Biological Sciences, CITAB, Universidade de Trás-os-Montes e Alto Douro, UTAD, 5000-801 Vila Real, Portugal
Atmosphere 2022, 13(3), 422; https://doi.org/10.3390/atmos13030422
Submission received: 21 January 2022 / Revised: 2 March 2022 / Accepted: 3 March 2022 / Published: 5 March 2022
(This article belongs to the Special Issue Atmospheric Turbulence: Observations and Models)

Abstract

:
Aviation turbulence remains one of the leading causes of weather-related aviation accidents. Therefore, turbulence prediction is a major concern of aviation forecasters. This paper describes the turbulence index ( TURB IPMA ) developed and used operationally at the Portuguese Institute of Sea and Atmosphere (IPMA), based on several diagnostics derived from ECMWF forecasts, using a new calibration approach. The forecast skill of the TURB IPMA and of individual diagnostics are evaluated using turbulence observations over the Portuguese Flight Information Regions and surrounding areas, for 12 months between February 2020 and March 2021 (excluding May and June). The forecasting skill of the predictors is discussed in terms of the Relative Operating Characteristic (ROC) curves, which is widely applied, but also in terms of novel measures such as the Symmetric Extremal Dependence Index (SEDI) and Symmetric Extreme Dependency Score (SEDS). The new measures are particularly relevant in assessing forecasts of rare events, such as moderate-or-greater turbulence. The operational index outperforms individual diagnostics (such as Ellrod) in terms of all verification measures. Furthermore, the use of a new Richardson number function was proven to be beneficial. Finally, the turbulence prediction by IPMA was comparable to that of the London WAFC for one turbulence episode.

1. Introduction

Aviation turbulence, experienced as in-flight bumpiness, is atmospheric turbulence caused by turbulent eddies with scales that can affect aircraft in flight. These scales range from about 100 m to 1 km and aircraft bumpiness is most pronounced when the size of the turbulent eddies encountered is about the size of the aircraft [1,2]. For commercial aircraft, this would correspond to eddy dimensions of approximately 100 m [2]. Turbulence remains a major aviation hazard as it is the leading cause of weather-caused accidents worldwide at cruise and descent phases [3]. For instance, from 2000 to 2011, in the USA, over 70% of weather-related accidents involving commercial jet aircraft at cruising levels are related to turbulence [4]. Furthermore, turbulence is responsible for tens of millions of losses for the aviation industry per year due to customer injury claims and aircraft damage [2].
Aviation turbulence can have different sources, namely convective clouds, upper-level fronts, mountain waves [1,5,6,7,8,9]. Turbulence not associated with convective clouds is referred to as clear-air turbulence (CAT) and is particularly hazardous to aviation because it cannot be detected by satellite or on-board radar [10]. Therefore, forecasting turbulence within stratiform clouds or cloud-free areas is of the utmost importance.
Turbulence scales affecting aviation are inferior to 1 km, which is smaller than a grid box of operational numerical weather prediction (NWP) models [2]. Thus, turbulence cannot be explicitly predicted, and, consequently, several diagnostic indicators have been used to predict the areas of the atmosphere where turbulence is likely to occur. In particular, Ellrod indices [2,10,11,12,13] and the Richardson number [5,10,14] have been widely used. These and other turbulence indicators have been utilized by the two World Area Forecast Centres (WAFCs)—London (Met Office) and Washington (National Oceanic and Atmospheric Administration, NOAA)—that are responsible for providing operational turbulence forecasts to Meteorological Watch Offices (MWOs), which are used by pilots and flight planners around the world [15,16]. Until recently, these turbulence forecasts were provided worldwide with a horizontal grid spacing of 1.125°. Since November 2020, these forecasts are provided with a horizontal grid spacing of 0.25° up to 36 h forecast with 3 h steps, for nine vertical layers above 10,000 ft.
Instituto Português do Mar e da Atmosfera (IPMA), as MWO, is responsible for preparing and disseminating Significant Meteorological Information (SIGMET: information issued by a meteorological watch office concerning the occurrence or expected occurrence of specified en-route weather and other phenomena in the atmosphere that may affect the safety of aircraft operations) to two Flight Information Regions (FIR): Lisbon (EUR Region) and Santa Maria Oceanic (NAT Region), which cover an area of about 6 million sq. km (see Figure 1). In particular, SIGMET of turbulence is issued when severe turbulence has occurred, or it is expected to occur [16]. Therefore, the accuracy of turbulence forecasts based on NWP outputs is of the utmost importance.
The first goal of the present paper is to describe the algorithm of the turbulence index, based on an integrated approach, developed at IPMA ( TURB IPMA ). This index uses forecasts of the European Centre for Medium-Range Weather Forecasts (ECMWF) deterministic model and provides to the Portuguese MWO operational hourly turbulence forecasts up to 48 h and tri-hourly forecasts up to 60 h. The availability of hourly forecasts is considered a significant asset by forecasters. Although the early version of TURB IPMA was implemented in 2015 at the Portuguese MWO, it has been documented only at IPMA to date. Aviation forecasters use TURB IPMA and the WAFC products as guidance tools to forecast severe turbulence conditions and to issue SIGMET information if it is justified. The use of ECMWF may be an advantage because this model outperforms the NWP global models operational at both WAFCs [17] and for consistency reasons, as forecasters at IPMA diagnose the synoptic environment primarily by relying on ECMWF forecasts. The second aim of this study is to provide a performance assessment of several turbulence diagnostics, and of TURB IPMA , using novel verification measures.
This paper is organized as follows: Section 2 describes the data and the verification methodology used in this study. The results are presented and discussed in Section 3. This section provides characteristics of the turbulence data and analysis of the distribution of model turbulence indicators. Besides, Section 3 provides the assessment of the performance of several turbulence indicators and the description of the turbulence algorithm applied operationally at the Portuguese MWO. Additionally, the performance of this index is analyzed, and the comparison between this index and the WAFC product is presented for one turbulence episode as an example. Finally, Section 4 highlights the main conclusions.

2. Materials and Methods

2.1. Turbulence Data

This study uses special air-reports (pilot’s reports, AIREP hereafter) and derived equivalent vertical gust velocity (DEVG) from Aircraft Meteorological Data Relay (AMDAR) for the period from February 2020 to March 2021, excluding May, June, and 20 days of April. The DEVG is a turbulence indicator estimated from vertical acceleration, which also depends on aircraft mass, equivalent air speed, and empirical constants [18,19]. Sherman [18] proposed using 9 m s−1 as the criterion for severe (SEV) turbulence. Truscott [19] classified the turbulence severity in four classes. Null (NON) turbulence when DEVG < 2 m s−1; Light (LGT) turbulence is defined as 2 ≤ DEVG < 4.5 m s−1; moderate turbulence is defined as 4.5 ≤ DEVG < 9 m s−1; severe turbulence for DEVG ≥ 9 m s−1 [19]. The DEVG indicator has been utilized in statistical analyses on aviation turbulence, e.g., [10,20,21], and in evaluations of the performance of turbulence forecasts based on NWP models, e.g., [13,20,22,23]. However, due to uncertainties in the empirical parameters used in the DEVG computation, DEVG can contain misleading values, mostly during the ascent and descent phases [19,20]. Therefore, DEVG data is used only for levels above FL150, in agreement with previous studies, e.g., [20,22,24]. Note that the flight level (FL) is a surface of constant atmospheric pressure (expressed as pressure altitude in hundreds of feet) which is related to 1013.2 hPa, based on the assumption of the International Standard Atmosphere [16].
The Eddy Dissipation Rate (EDR) is also used as a measure of turbulence and is the International Civil Aviation Organization (ICAO) standard for reporting turbulence [16]. However, in the study area, EDR data is not available and the AIREPs contains only information about moderate and severe turbulence. Therefore, the use of DEVG was the only option to complement the AIREP data.

2.2. Forecast Data and Turbulence Indicators

This study uses hourly forecasts from the ECMWF deterministic model for the period from February 2020 to March 2021, excluding May, June, and 20 days of April. The model uses a cubic-octahedral spectral transform discretization, which corresponds to a grid spacing of approximately 9 km [25]. It has 137 vertical levels and the lowest level is located at nearly 10 m above ground. In the troposphere, the vertical grid-spacing increases from 20 m near the surface to 290 m above 6 km. At IPMA, operationally, the turbulence indicators are computed using the ECMWF forecasts in a small domain covering mainland Portugal with a resolution of 0.1° and on a large domain with a horizontal resolution of 0.2°, including the two Portuguese FIRs and surrounding areas (see Figure 1). The turbulence diagnostics tested in this study are described in Appendix A. These diagnostics are calculated at ECMWF model levels for levels above 800 hPa, and, prior to their calculation, the model fields were smoothed using a 9-point smoothing filter. All 9 points were multiplied by their weights and summed, then divided by the total weight to obtain the smoothed value. The centre point received a weight of 1.0, and the points on either side and above and below received a weight of 0.5, and the corner points received a weight of 0.3. The turbulence forecast at the lower levels is beyond the scope of this study and will be the focus of forthcoming research. In the lower troposphere, it may be better to calculate turbulence diagnostics at constant heights, rather than at model levels, where shear may be created only by terrain gradients.

2.3. Verification Methodology

The use of contingency tables has been widely applied in the evaluation of forecasts of turbulence [10,22,23,26], where forecasts and observations are expressed in binary terms, by defining an event (yes) if turbulence was observed and a non-event (no) if there was no turbulence. A simple 2 × 2 contingency table (Table 1) contains four elements: hits (YY), false alarms (YN), misses (NY), and correct negatives (NN): where YY are the number of correctly predicted events; NY denotes the number of events that occurred but were not predicted; YN are the number of predictions of an event when the event was not observed; and NN represents the number of times an event was not observed and not predicted.
Several scores can be determined from a contingency table [27]. The bias rate (BIAS) is (YY + YN)/(NY + YY). The fraction of correctly forecast events, POD = YY/(YY + NY), is defined as the probability of detection [27,28,29] or as hit rate [22,23,30]. The probability of false detection (also known as false alarm rate) is defined as the ratio of false alarms to the total numbers of nonevents: POFD = YN/(YN + NN) = 1 − PODNO, where PODNO = NN/(YN + NN) is the probability of detection of non-events. The True Skill Statistic (TSS), also known as Hanssen–Kuipers (H-K) Discriminant, is defined as TSS = POD − POFD.
Another measure commonly used to assess the quality of a forecast system [10,14,22,23,28,29] is the relative operating characteristic (ROC; Mason [31]). For each 2 × 2 contingency table, the corresponding POD and POFD can be determined for different thresholds of the model predictors. Then, the ROC curve is defined by a set of POD and POFD values for these thresholds. If a forecast system is skillful (POD > POFD), the ROC curve will lie above the 45° line from the origin and the total area beneath the ROC curve (hereafter AUC) will be greater than 0.5 [31]. Therefore, for a perfect forecast, AUC will be equal to 1; on the other hand, an ROC curve coincident with the diagonal line indicates no skill and AUC = 0.5. The ROC curve can also be useful to determine what POD threshold would yield an acceptable POFD.
However, some previous studies have shown that many measures based on 2 × 2 contingency tables (e.g., POD, POFD, TSS, Heidke skill score) converge to trivial values (either to 0 or 1) as the rarity of the event increases, i.e., when the correct negative term dominates the contingency table [32,33]. Thus, to overcome some of the shortcomings of these verification measures, new scores have been derived. Namely, Hogan et al. [33] proposed the Symmetric Extreme Dependency Score (SEDS), defined as:
S E D S = l o g ( q ) log ( P O D ) log ( B R ) + log ( P O D )                
where q = ( YY + YN ) / N is the relative frequency with which the event was predicted and B R = ( Y Y + N Y ) / N is the base rate and N is the sample size. Thus, BR is the relative frequency of occurrence of the event and therefore rare events have low base rates.
More recently, Ferro and Stephenson [30] proposed the symmetric extremal dependence index (SEDI):
S E D I = l o g ( P O F D ) l o g ( P O D ) + l o g ( 1 P O D ) l o g ( 1 P O F D ) l o g ( P O D ) + l o g ( P O F D ) + l o g ( 1 P O D ) + l o g ( 1 P O F D )
Goecke and Machulskaya [26] also applied this score to evaluate the performance of turbulence forecasts. The use of SEDI for this purpose was also suggested by [1] (pp. 272–273).

3. Results and Discussion

The performance of the ECMWF-based turbulence predictors, presented in this section, is evaluated against DEVG and AIREP observations, made over 12 months between February 2020 and March 2021 (excluding May and June).

3.1. Characterization of Turbulence Observations

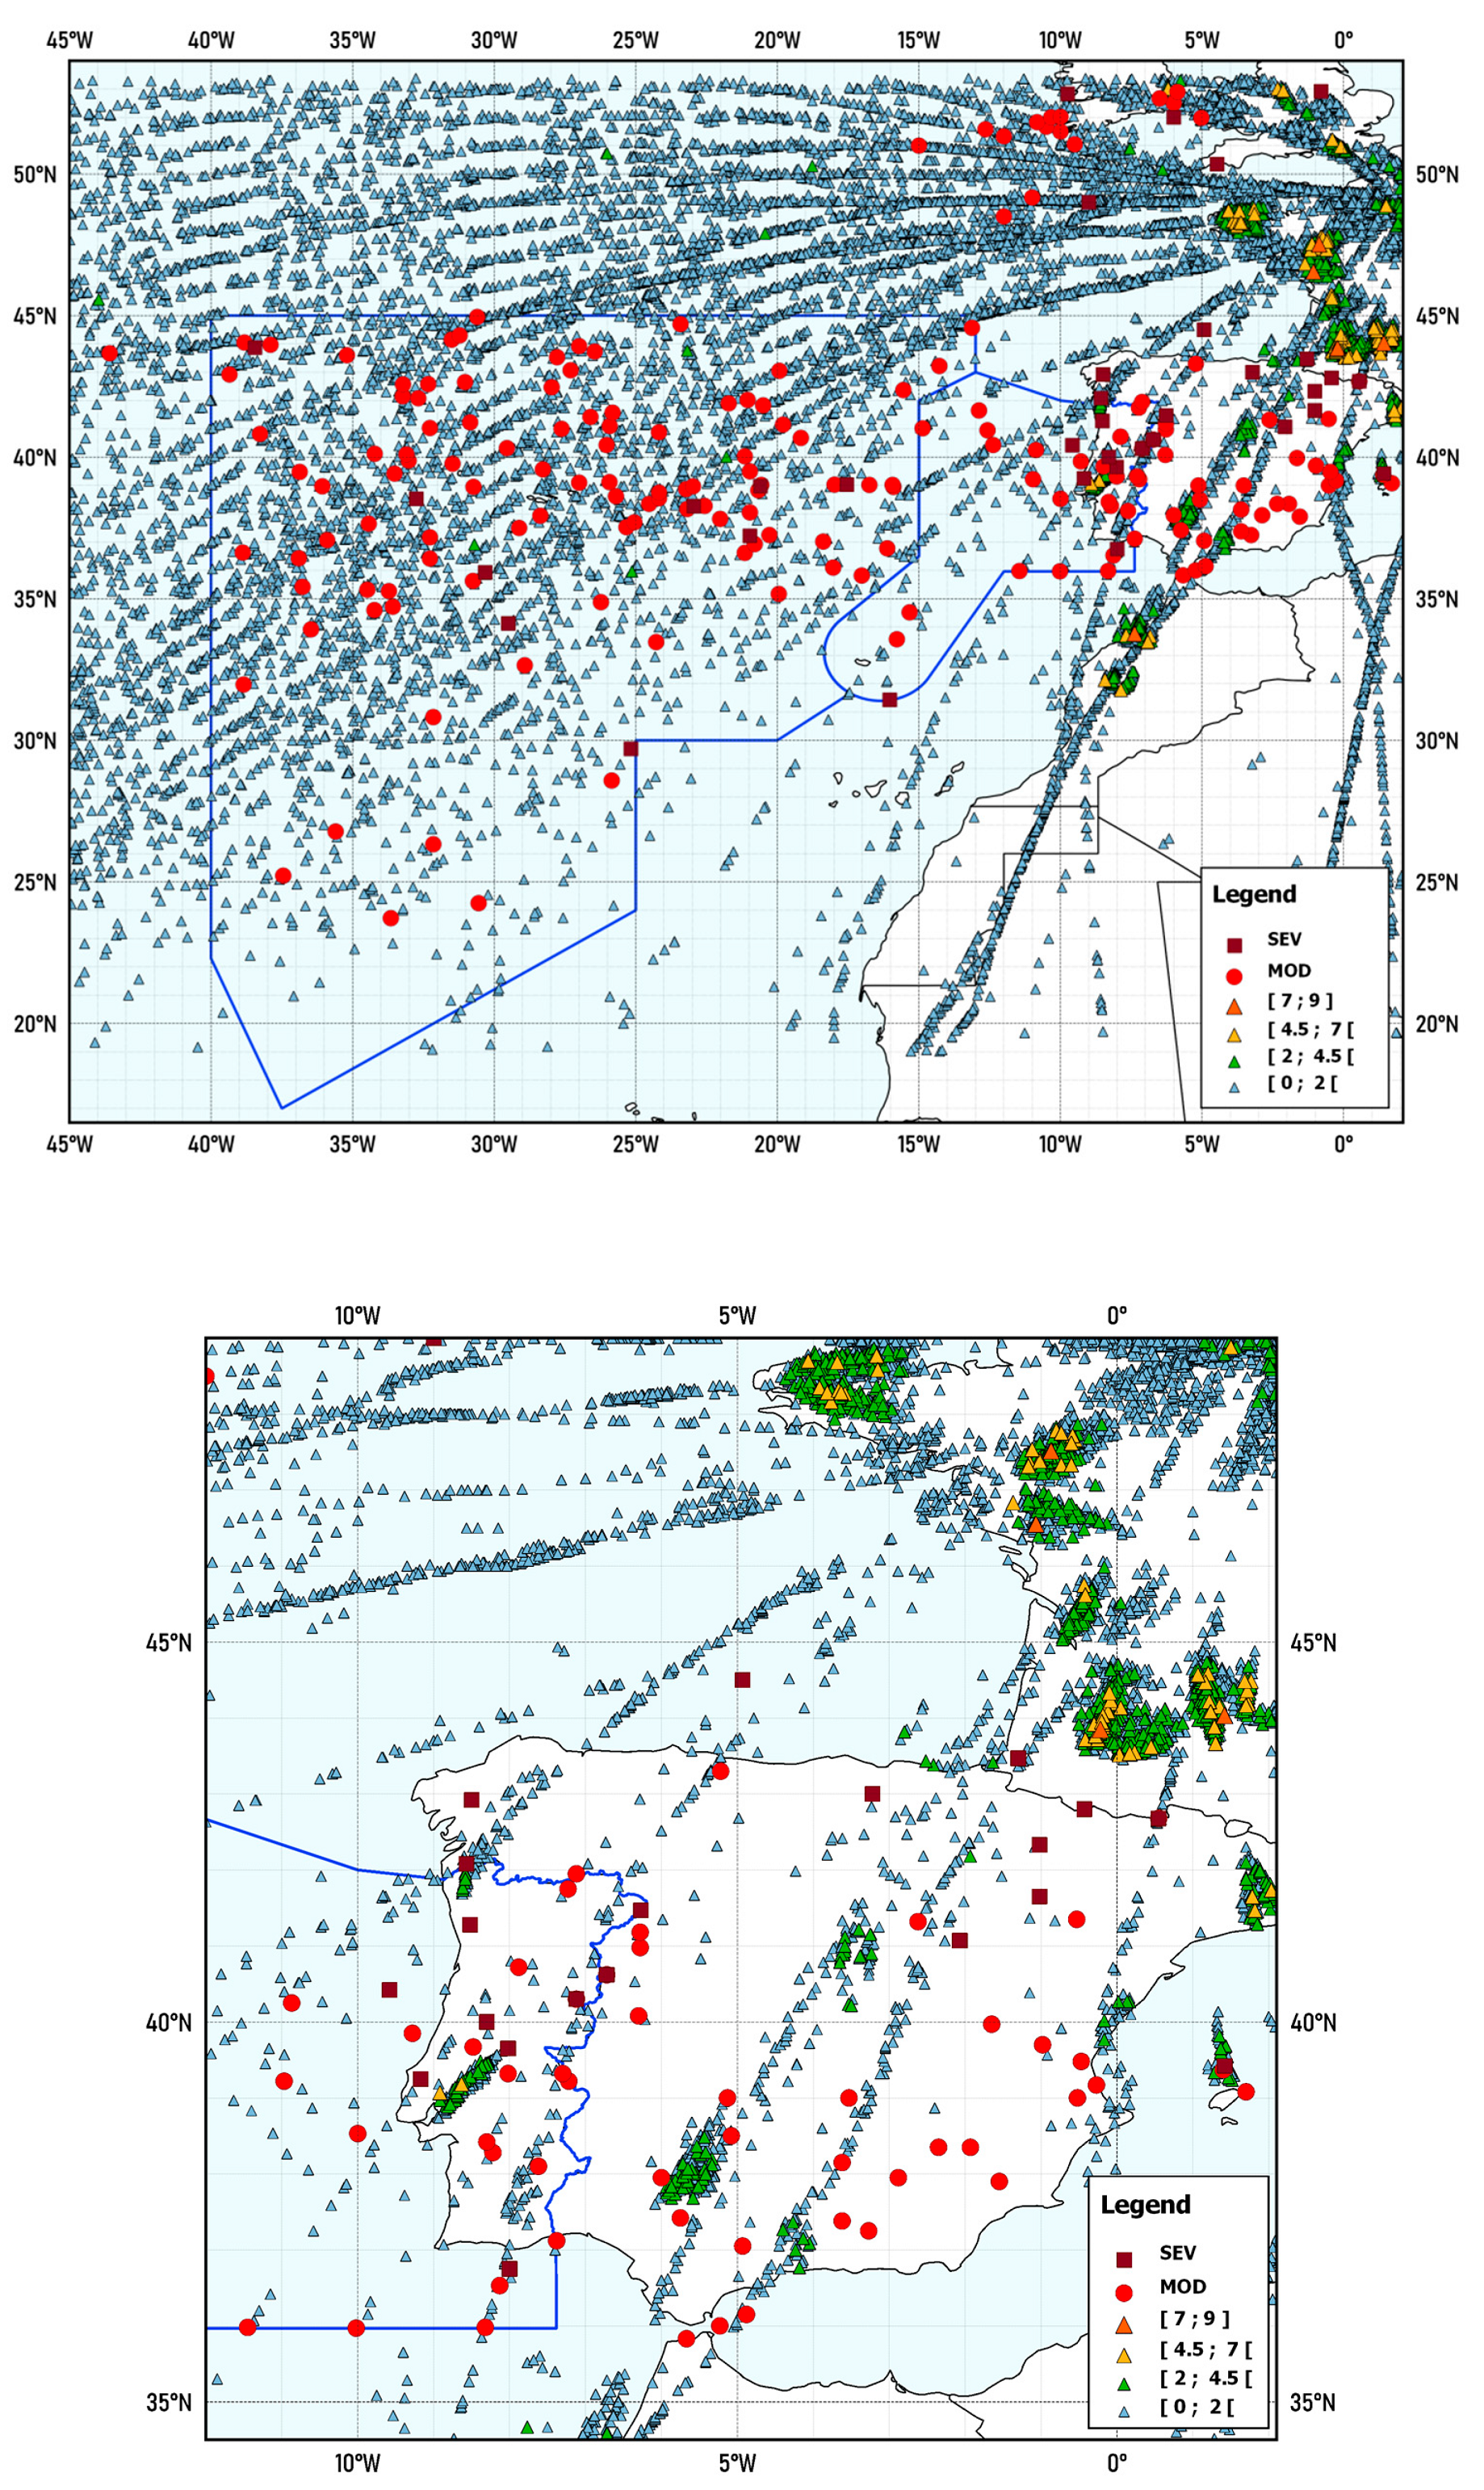
In the study period, the turbulence data included 19,120 DEVG observations and 222 AIREPs, totaling 19,342 observations. The location of these observations over the Portuguese FIRs and surrounding areas is shown in Figure 2, displaying AIREPs dispersedly distributed and DEVG exceeding 4.5 m s−1 more concentrated over land. For levels above FL280, the 90th and 99th percentile are 0.4 and 1.9 m s−1, respectively. These values are smaller than those found by Kim et al. [24] for a 39-month period from Hong Kong-based airlines, where, for instance, the 90-percentile varied between 0.63 and 1.3 m s−1, depending on the aircraft type.
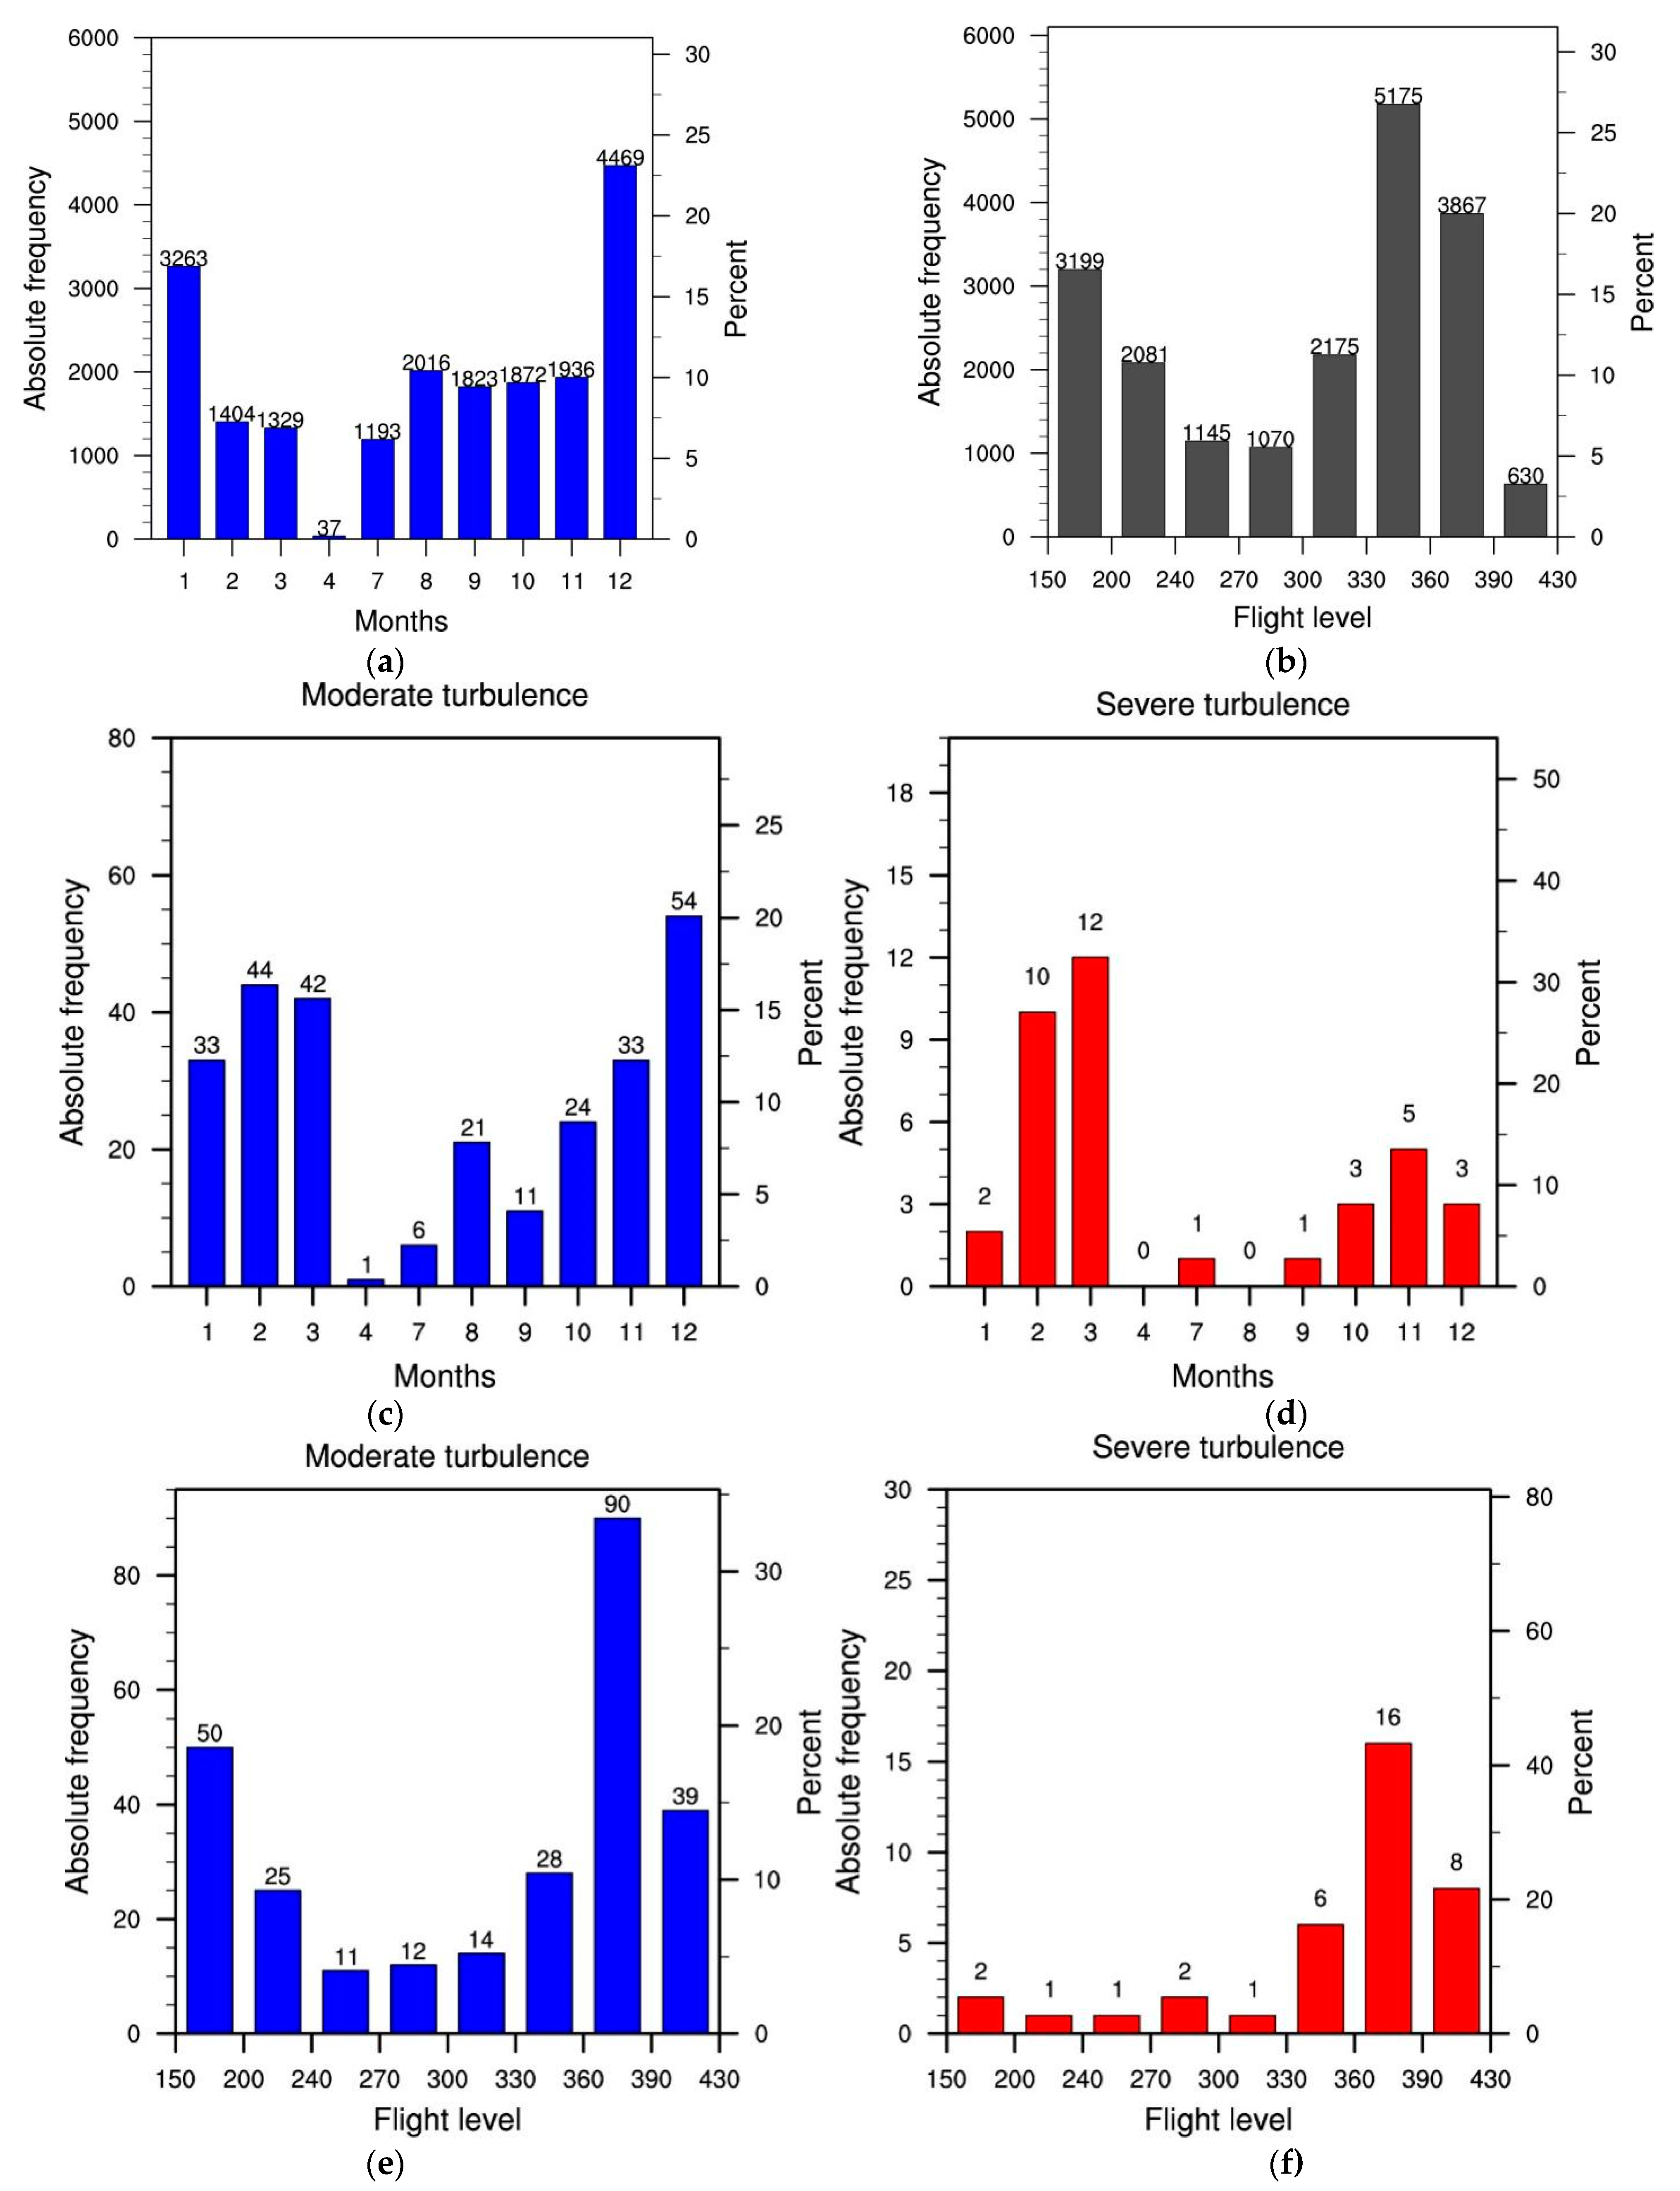
Null cases represent about 92.4% and are mostly distributed over sea, while LGT turbulence represents 7.2% of the DEVG data. Moderate turbulence cases represent approximately 1.4% of total data and 0.44% of the DEVG data. Severe turbulence represents 0.2% of the total data (see Table 2). The majority of observations were recorded in December and January, comprising 40% of the data. Another 40% of the data is concentrated between August and November (Figure 3a). Most of the data is registered between FL300 ( ~ 30,000 ft) and FL390, totaling almost 60% (Figure 3b).
Moderate or greater turbulence (MOG) was observed most frequently in autumn and winter (Figure 3c,d). It is also relevant to note that the monthly relative frequency (turbulence events divided by the number of observations in each month) of MOG turbulence is maximum in February and March (≥3.1% for MOD and 0.7–0.9% for SEV turbulence). The observations of MOD and SEV turbulence have the maximum absolute frequency in FL360/390 layer, registering 90 and 16 encounters, respectively (Figure 3e,f). Besides, the relative frequency (turbulence events divided by the number of observations in each layer) of MOG turbulence peaks in the FL390/430 layer (6.2% for MOD and 1.3% for SEV turbulence) and presents the second maximum in the FL360/390 layer (compare Figure 3e,f and Figure 3b). Moreover, moderate turbulence has a second maximum (50) in the layer between FL150 and FL200 (Figure 3e), corresponding to a monthly relative frequency of 1.6% (Figure 3b,e).

3.2. Distribution of Turbulence Indicators

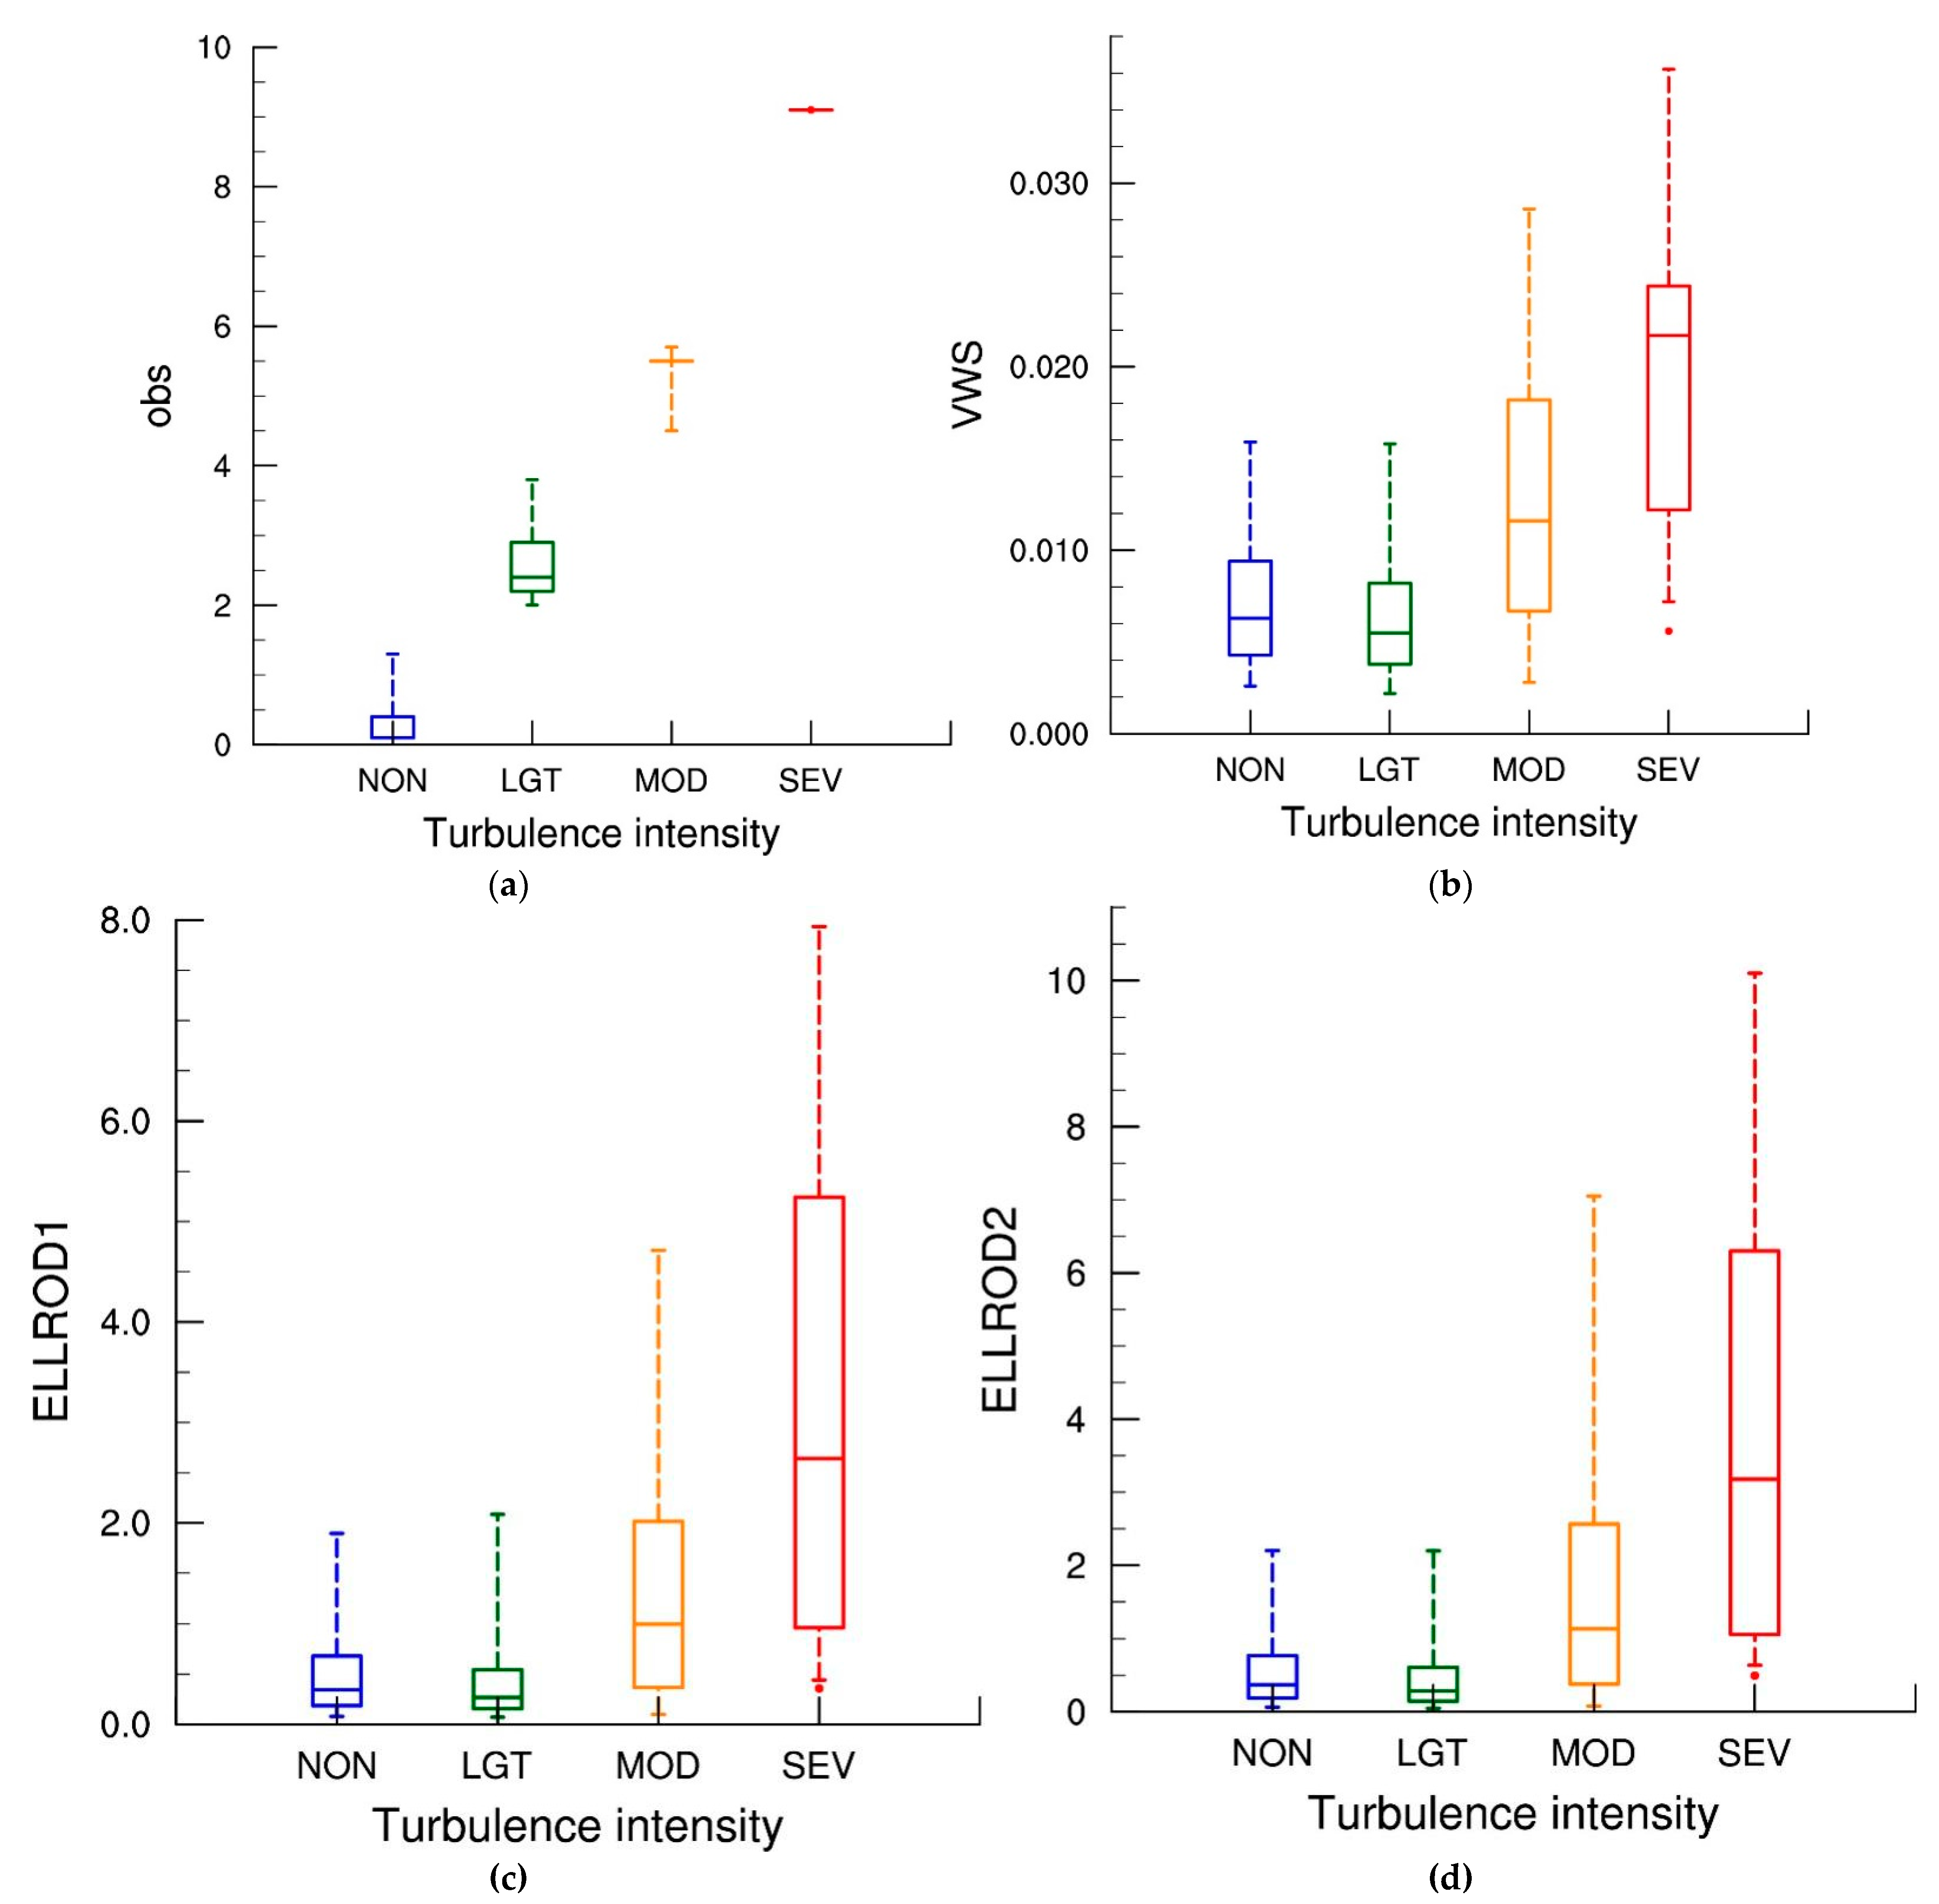
Figure 4a depicts the box-plots of the distribution of turbulence observations for four turbulence intensity classes (NON, LGT, MOD, and SEV). This box-plot uses only DEVG data for NON and LGT turbulence, but also uses AIREP data for MOD turbulence. The largest DEVG value is less than 9 m s−1, and therefore the SEV observations contain only AIREP data. Each AIREP reporting moderate and severe turbulence was assigned a DEVG value of 5.5 and 9.5 m s−1.
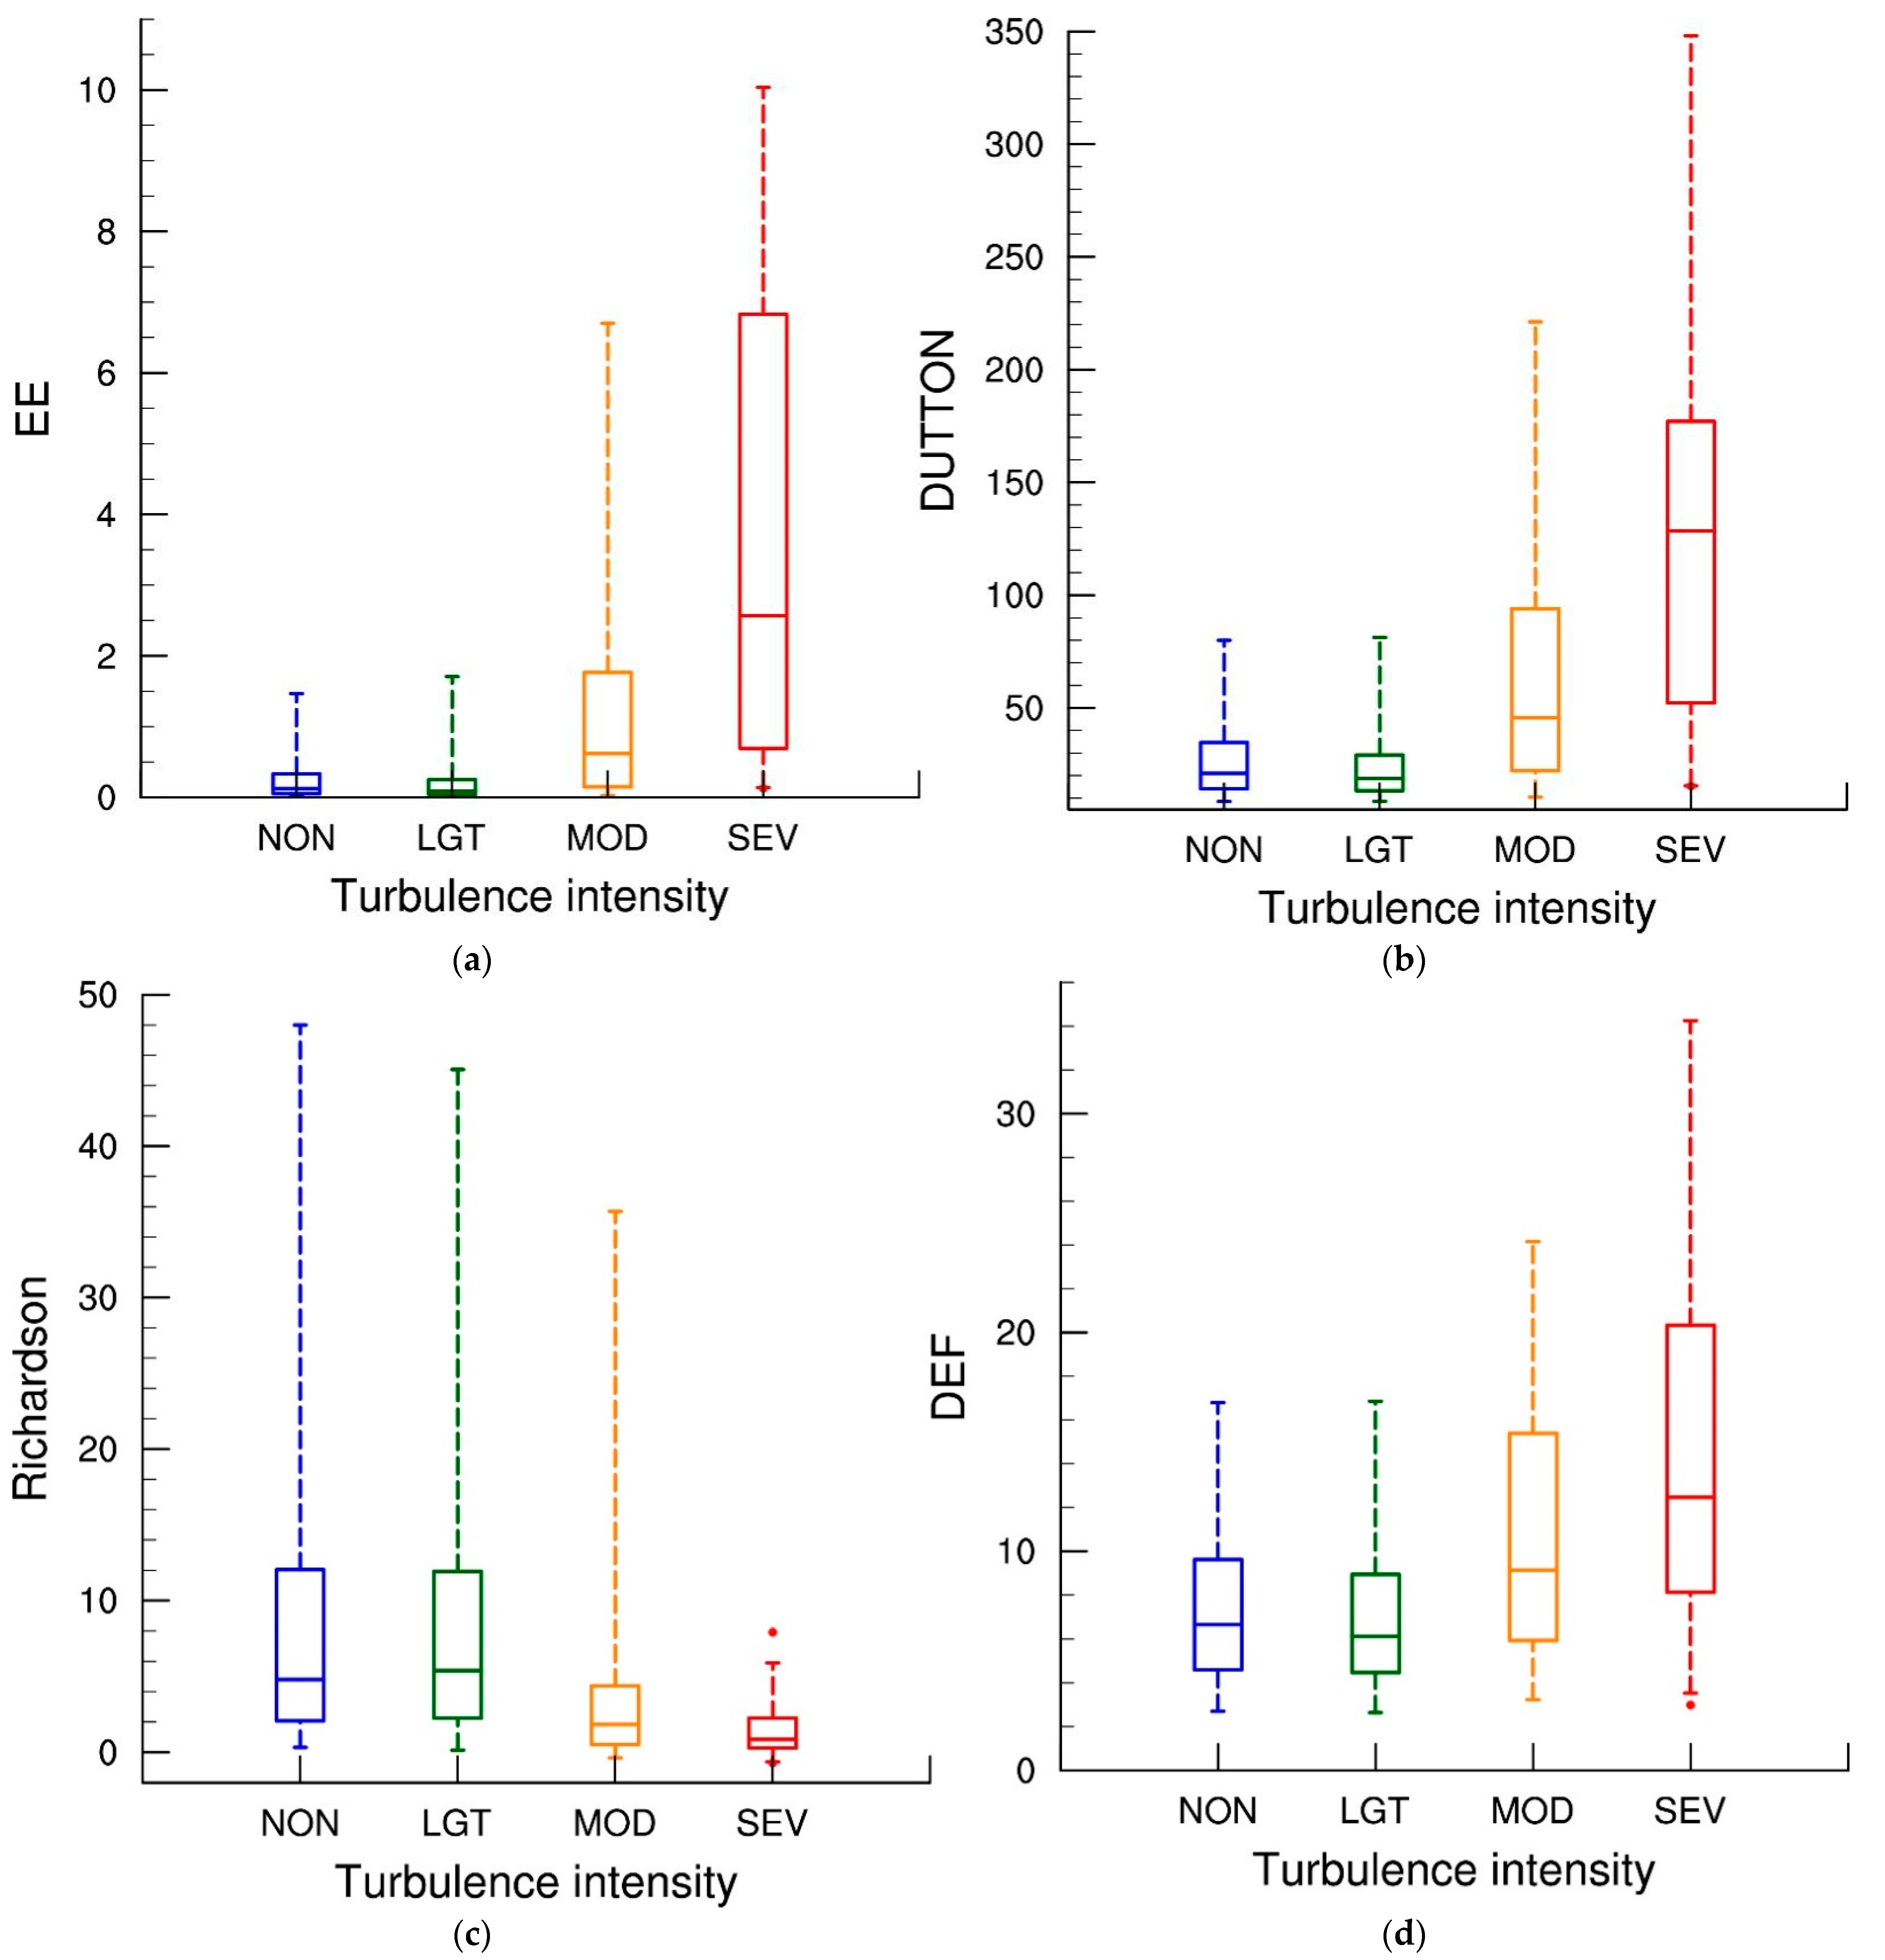
Figure 4a also shows that most of the NON turbulence events have DEVG less than 0.5 m s−1. The median value of DEVG is 2.4 m s−1 and 5.5 m s−1, respectively, for LGT and MOD turbulence. The box-plots of the distribution of turbulence forecast indicators for four classes of turbulence intensity (NON, LGT, MOD, and SEV) are shown in Figure 4 and Figure 5. The values of the turbulence prediction indicators correspond to their maximum value at the eight grid points (including two vertical levels) closest to the location and time (within a time window of ± 25 min) of the observation for each observed turbulence category.
In general, the NWP turbulence indicators show similar distributions for NON and LGT events, depicting slightly lower values for LGT events. This result indicates that these turbulence indicators have difficulty in distinguishing between null and light turbulence encounters (Figure 4 and Figure 5). In addition, uncertainties in DEVG (referred by Kim et al. [24]) may also contribute to this outcome.
The distribution of the Richardson number ( R i ) reveals lower values for SEV and MOD turbulence than for the other classes, with a 75th percentile of 4.4 and 2.3, respectively, for MOD and SEV turbulence (Figure 5c). It is relevant to remember that Kelvin–Helmholtz instability (KHI) is a known source of CAT [34,35], and that this instability is favored when R i is less than the critical Richardson number (Ric), close to 0.25 [34,36,37,38]. However, due to the relatively coarse resolutions from the NWP models, the Richardson number computed using outputs from these models rarely reached values lower than 0.5 [39] and therefore the thresholds of Ric may be larger than the theoretical values, as suggested by Figure 5c.
The other turbulence indicators present higher values as the turbulence severity increases. For instance, the 25th percentile of SEV encounters is slightly higher than the median of the MOD distribution, except for the DEF indicator (Figure 4 and Figure 5). Moreover, the median of the MOD encounters is clearly higher than the 75th percentile of the LGT distribution.

3.3. Description and Evaluation of the Operational Turbulence Index

This section describes the methodology applied to generate the operational turbulence index used at the Portuguese MWO.

3.3.1. The Turbulence Predictors

Previous studies have shown that combining several turbulence predictors, rather than using only one predictor, improved the forecasting skill [2,10,13,26]. This approach, where an index results from a linear combination of the individual predictors, is known as the integrated approach. However, the units and magnitudes of each turbulence diagnostic are different from each other, so some normalization is required. In this study, the turbulence diagnostics are normalized using Equation (3). The conversion coefficients ( bb i and f i), presented in Table 3, are obtained from the best-fit between the quantiles of observations and each turbulence predictor. The best-fit was obtained using a simple linear regression model, where the coefficients bb i and f i were determined using the method of least squares. In this procedure, the predictors could be the turbulence indices or a function of a given turbulence index. The tested functions were the logarithmic (log) and square root (SQRT). The use of these functions produces smoother fields. The SQRT function provides better performance for five predictors, whereas the logarithm provides better skill for the other four predictors (not shown). The regression fits for SQRT (VWS) and log(CAT1 + 1) are illustrated in Figure 6. Table 3 also indicates the function used for each turbulence indicator.
  I T i = b b i × f u n ( max ( 0 , T u i × c c i + a i ) ) + f i

3.3.2. Evaluation of the Individual Turbulence Predictors

In this section, the assessment of the performance of the turbulence indicators expressed in Equation (3) (see also Appendix A) and two additional turbulence diagnostics based on R i (RICH1 and RICH2) are presented. These indexes are defined as:
R I C H 1 = M I N ( 10 , M A X ( 0.01 , a a ) ) ; a a = 5.6 2.2 log ( M A X ( R i , 0.09 ) )
R I C H 2 = M A X ( 0.01 , a a ) ; a a = 10 [ ( 1 R i / 10 ) ]
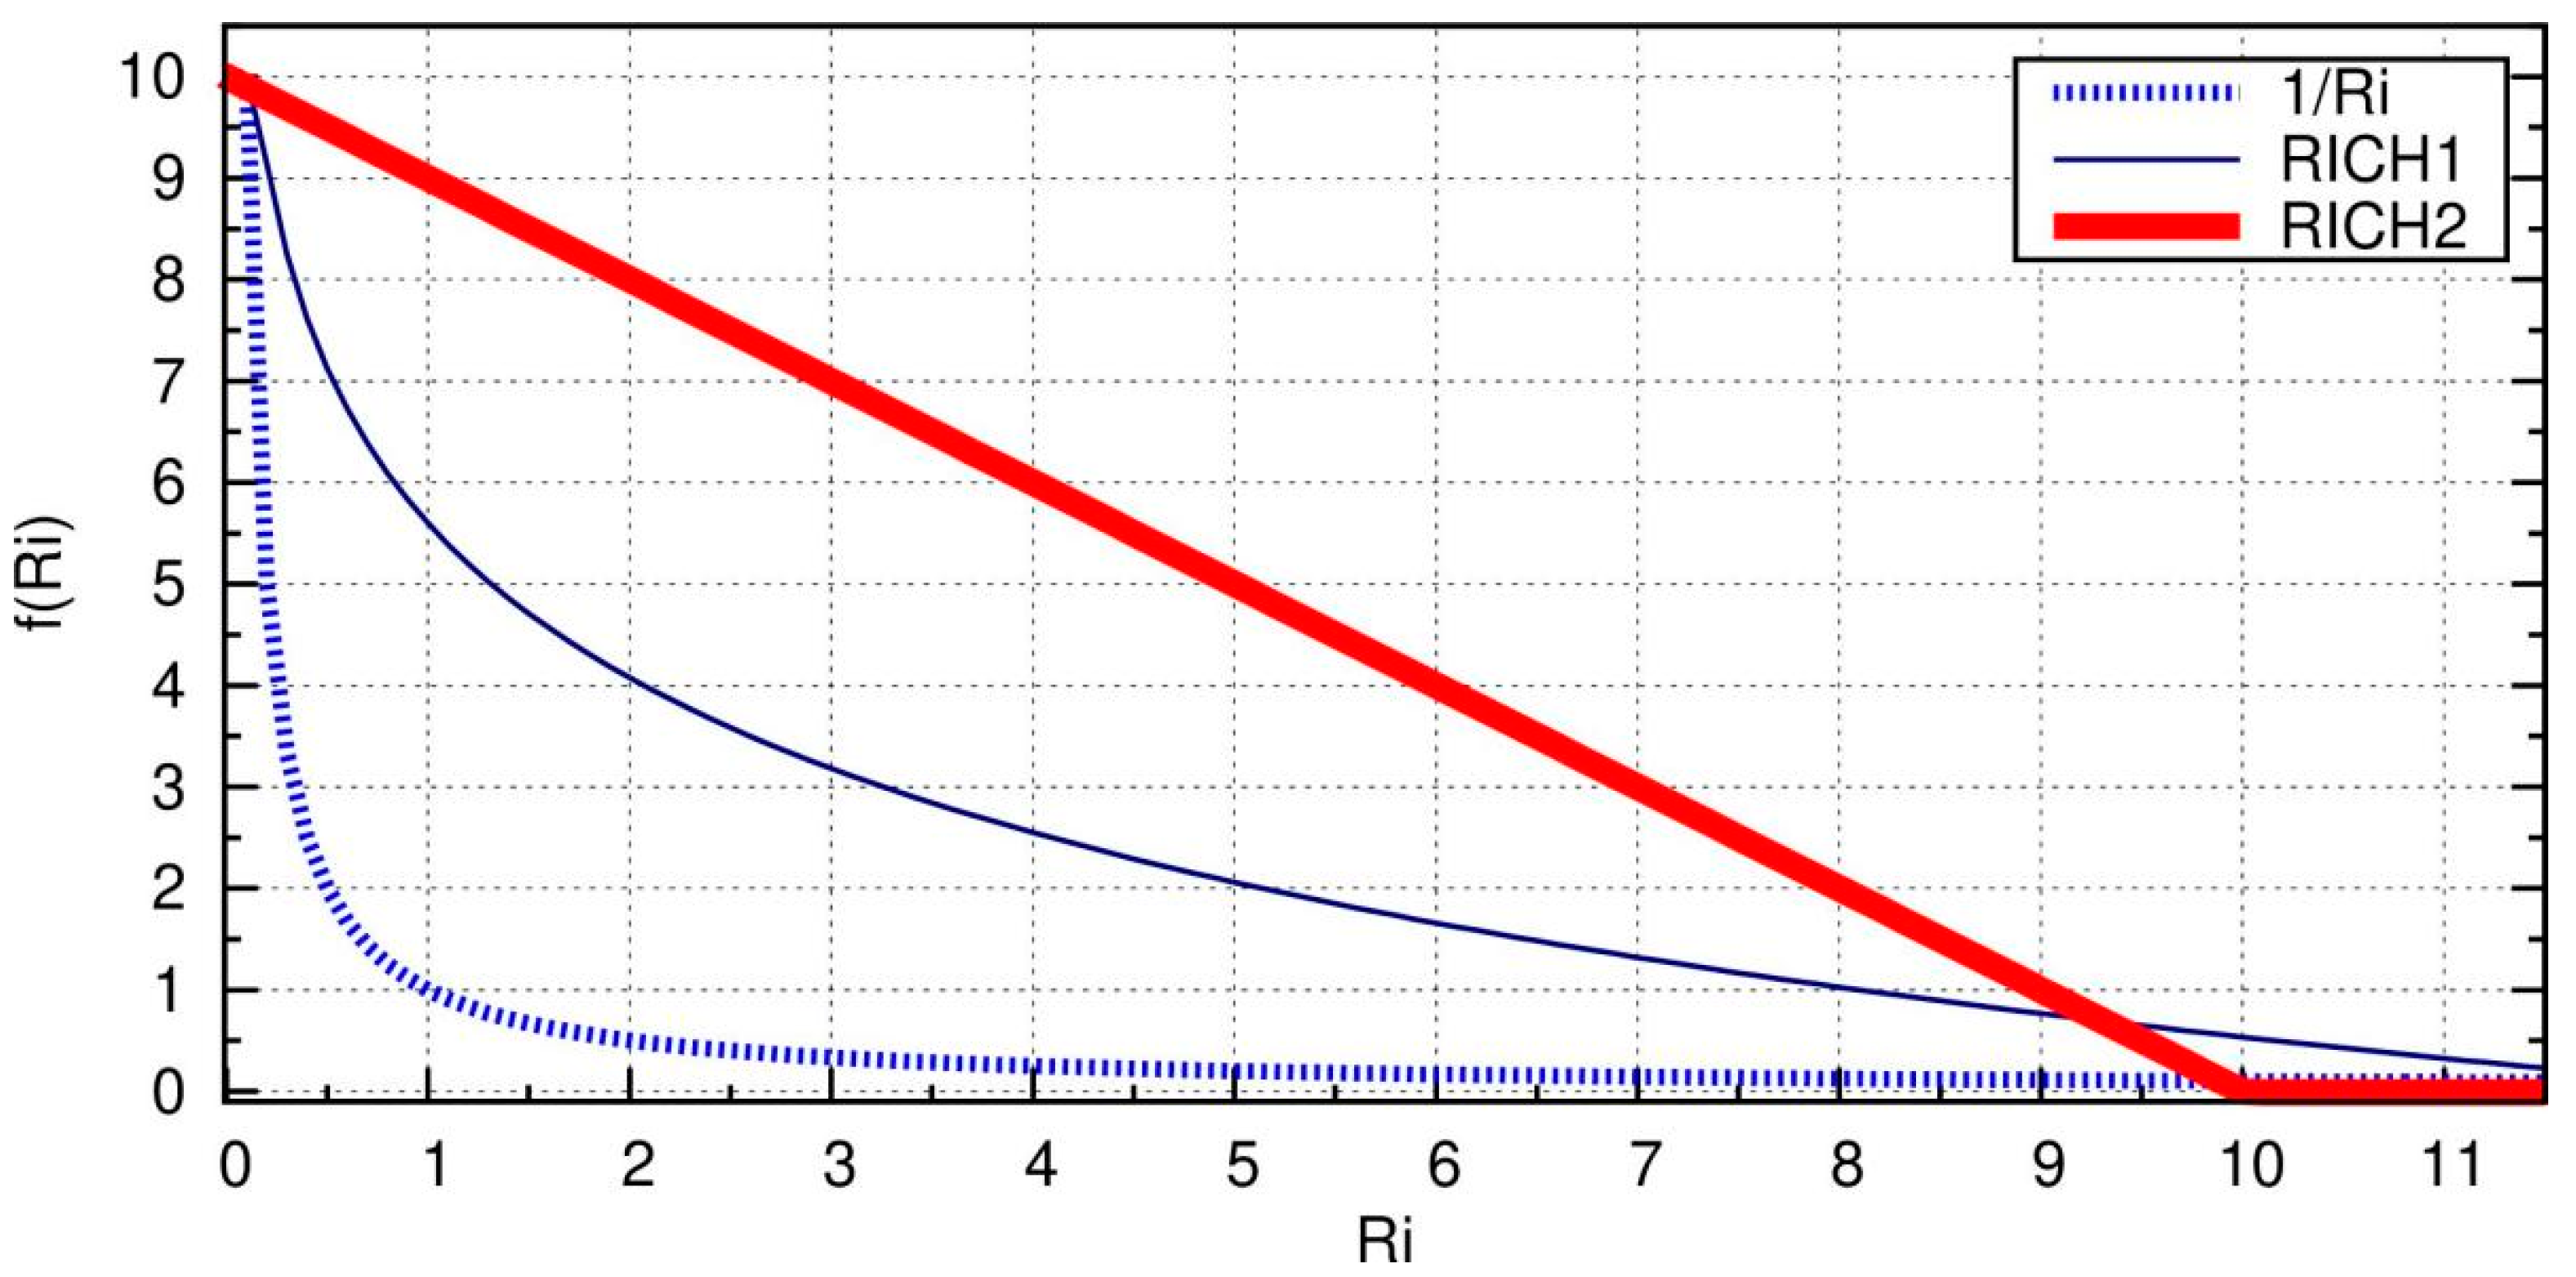
Sharman and Pearson [40] used the inverse of the Richardson number. Figure 7 compares the decrease of 1/ R i , RICH1, and RICH2 with R i , illustrating that RICH1 decays with R i more steeply than RICH2, but more slowly than 1/ R i .
The forecasting performance of all turbulence predictors is evaluated against the DEVG and AIREP data for 12 months. The verification data utilized here is independent of the training data (used in Section 3.1), though cover the same period and have similar characteristics (not shown).
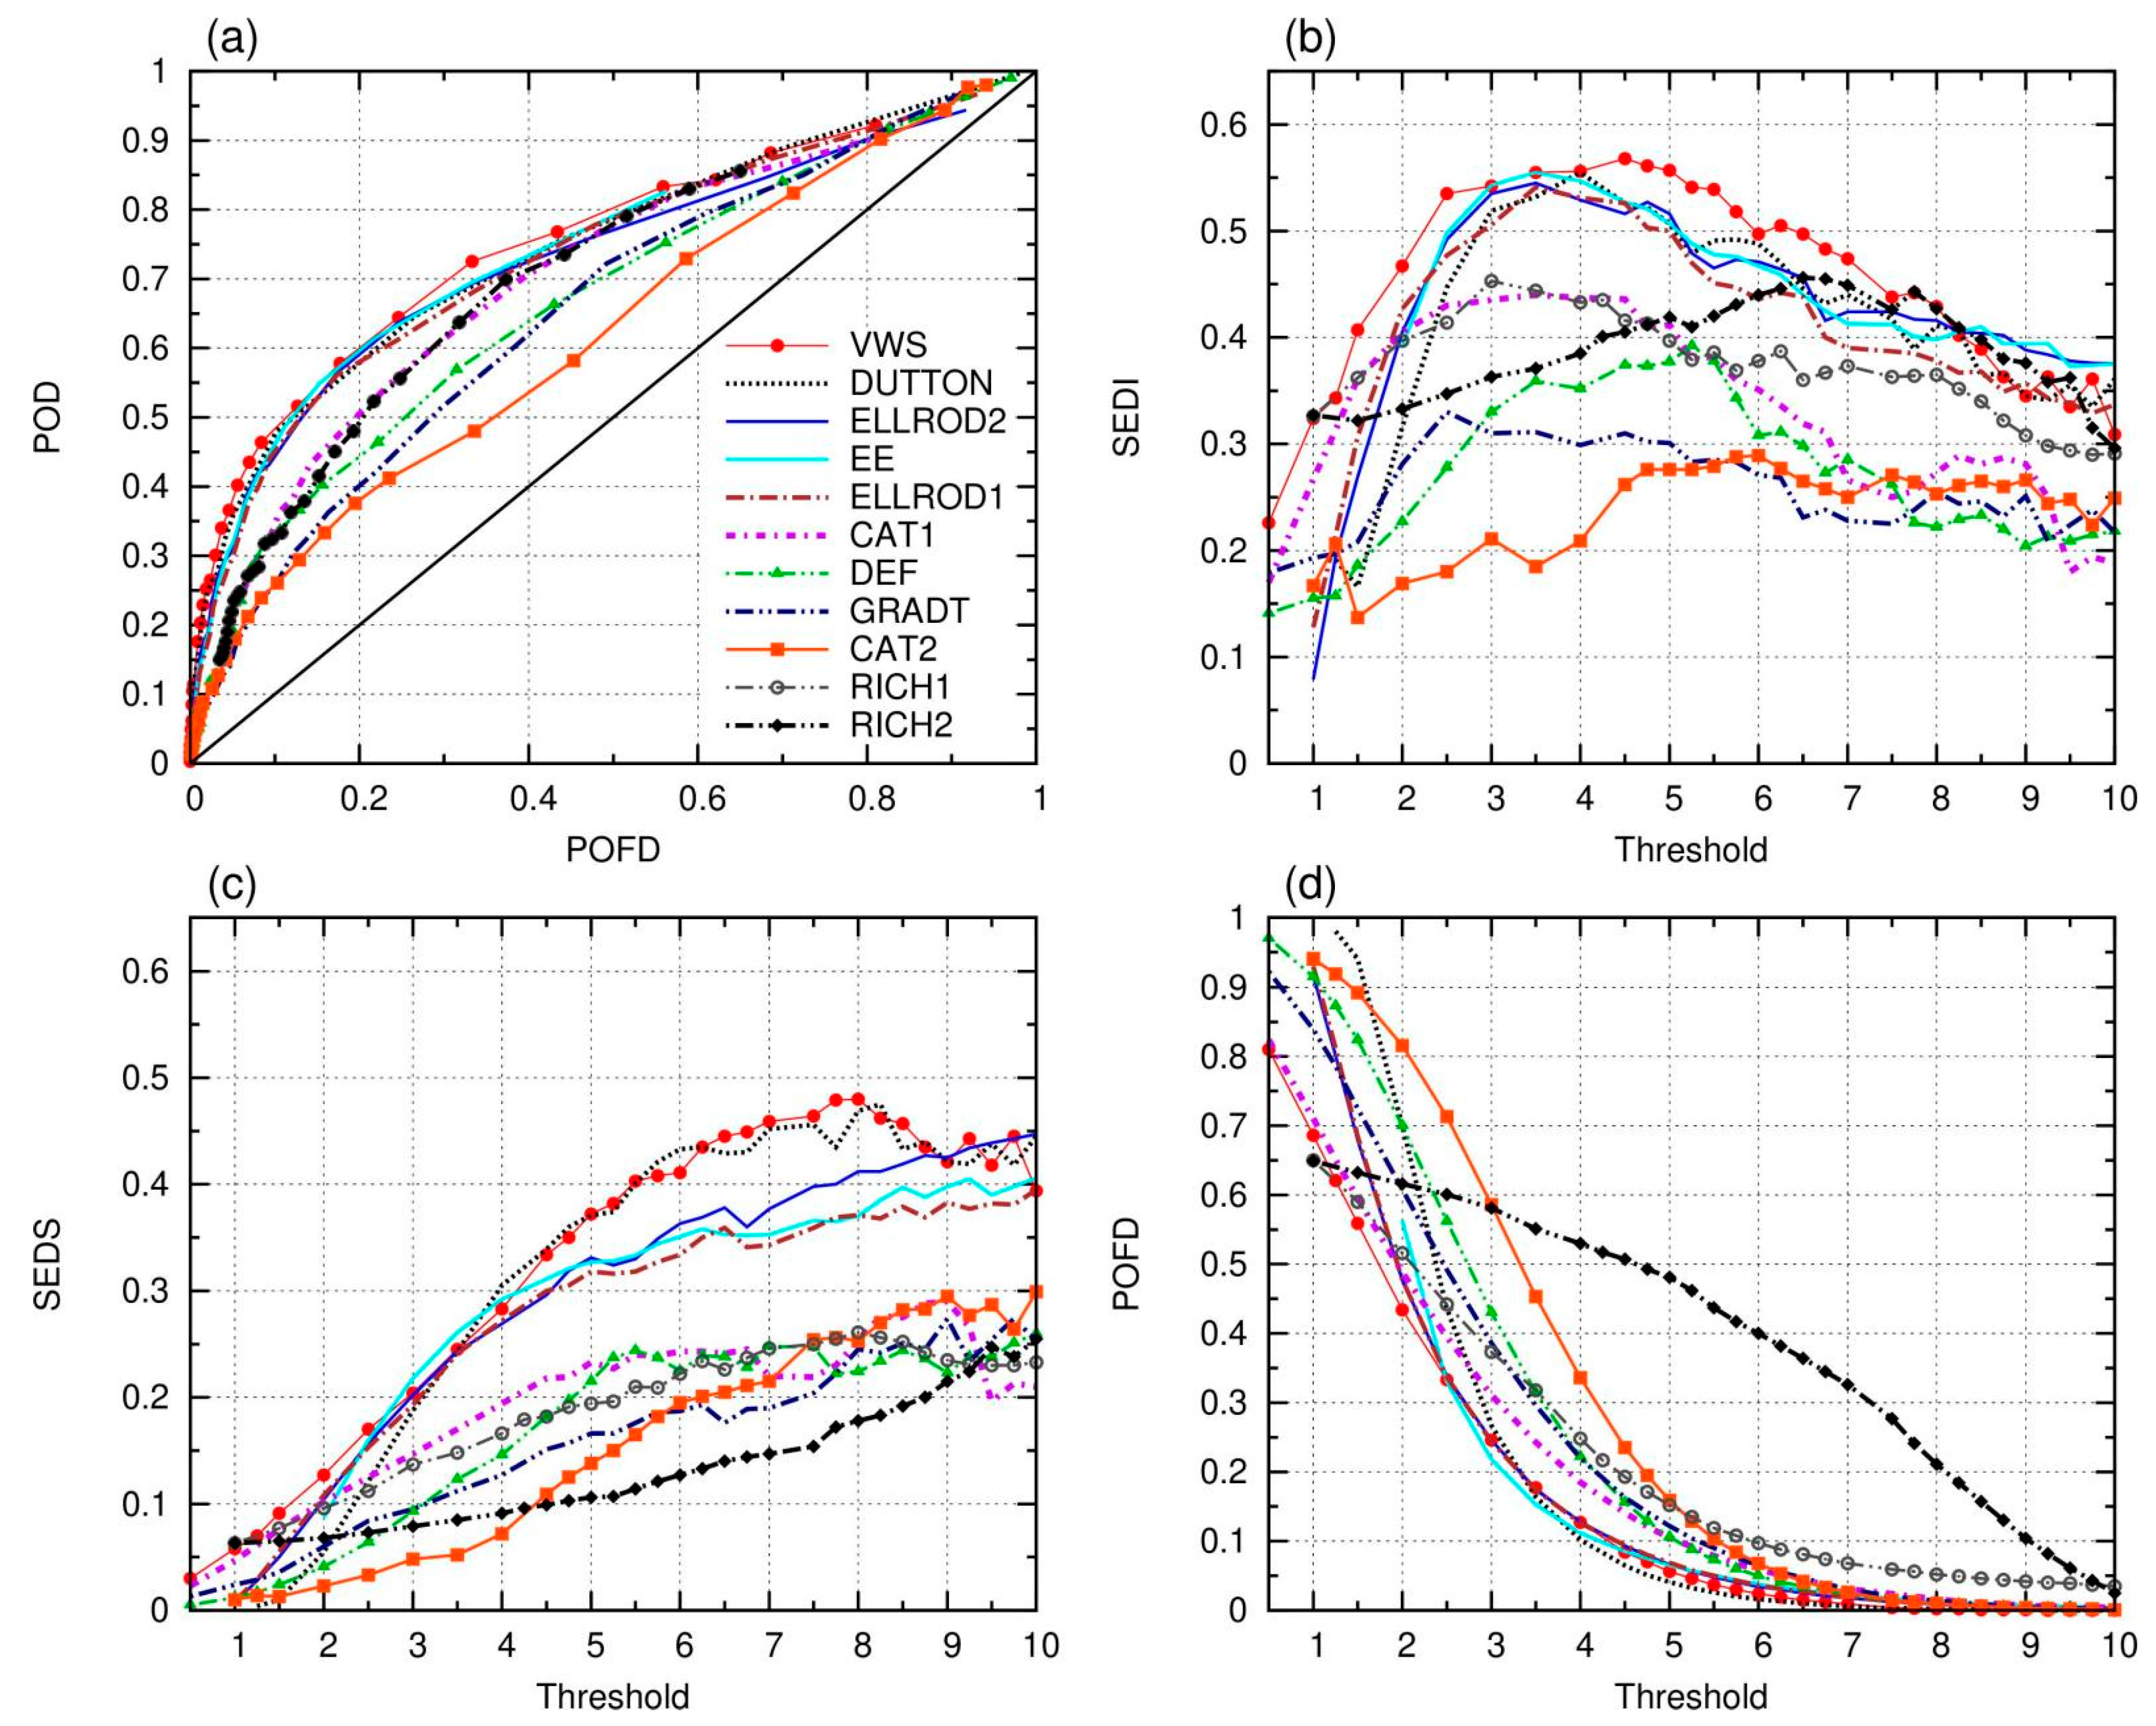
The performance skill of the turbulence indicators to discriminate between MOG turbulence and weaker (NON and LGT) turbulence is depicted in Figure 8. The ROC curves show that five indicators (VWS, DUTTON, ELLROD indices, and EE) have the highest area under the ROC curve (with AUC varying between 0.730 for ELLROD2 and 0.756 for VWS). This indicates that these turbulence predictors perform similarly, outperforming the other predictors (Figure 8a). On the other hand, CAT2 and GRADT have an ROC curve closer to the diagonal, demonstrating the worst performance, with AUC = 0.620 and AUC = 0.655, respectively. In terms of ROC curves, RICH2 and CAT1 reveal an intermediate skill, with AUC ~ 0.71.
Nonetheless, it is worth mentioning that other verification measures are more suitable for assessing the forecasting skill of rare events, namely SEDI and SEDS (see Section 2.3). These scores confirm that VWS and DUTTON have the best forecasting performance. The ELLROD and EE indices have slightly lower skill than VWS and DUTTON. The poor performance of CAT2 and GRADT is also confirmed by SEDI and SEDS (Figure 8b,c). However, there are two interesting differences between the SEDI and SEDS scores. The first difference is related to the choice of the optimal thresholds of the turbulence predictors. SEDI peaks at threshold values between 3 and 5.5 for most predictors (Figure 8b). In contrast, in general, SEDS increases as the threshold increases up to 8 to 10 (Figure 8c). This increase is accompanied by a decrease in POFD (Figure 8d) and BIAS (not shown). For thresholds lower than 4.5, BIAS has values greater than 7, revealing a large overestimation of MOG events (not shown). In the case of RICH1, SEDS achieves the maximum value of 0.25 at a threshold of 8 and SEDI reaches the maximum value of 0.45 at a threshold of 3. The second difference between SEDI and SEDS concerns the evaluation of the RICH2 skill. In terms of SEDI, RICH2 shows an intermediate performance, while in terms of SEDS, RICH2 (along with GRADT) performs the poorest. Note that RICH2 has the highest POFD values, revealing the highest tendency to over-predict MOG events (Figure 8d). These differences between SEDI and SEDS suggest that SEDS penalizes over-prediction more than SEDI. This result is consistent with Goecke and Machulskaya’s [26] study, stating that SEDI favors POD more than it penalizes false alarms.

3.3.3. Combination of Turbulence Diagnostics

As mentioned above, an integrated approach reveals a considerable improvement of the skill of turbulence forecast [2,10,13,26]. Moreover, turbulence predictors have been normalized by the local Richardson number [15] because previous studies found that the introduction of this normalization leads to a better agreement between forecasts and observations, e.g., [40]. These turbulence diagnostics can be combined into a single turbulence index using a weighted average of several indices, where the weights are given by the AUC, following the approach of Sharman et al. [2] and Sharman and Pearson [40]:
MULTI = i = 1 N w i   max ( 0 ,   I T i ) , w i   = A U C i 2 / i = 1 N A U C i 2
where N = 9 and I T i are defined in Equation (3) and Table 3, using the calibration approach described in Section 3.3.1.
The performance of a combined index depends on the predictors used. Therefore, a sensitivity study is given in this section. Table 4 presents the different combined indices. The MULTI6 index combines six indices, excluding the two worst-performing indices and ELLROD1 (which is highly correlated with ELLROD2). The MULTI5 index combines the five best-performing indices. The MULTI3 index combines only the EE, ELLROD2, and DUTTON indices.
The indices described in Equation (6) and Table 4 can also be combined with RICH1 or RICH2 as follows:
MULTI - RI1 = ( 1 c o e f )   M U L T I + c o e f × R I C H 1
MULTI - RI2 = ( 1 c o e f )   M U L T I + c o e f × R I C H 2
MAX - RI2 - m = m i n ( m a x ( I T i ) , R I C H 2 )
Figure 9a shows the performance of the combined indices in terms of SEDI and SEDS scores for unbiased forecasts (BIAS   ~   1). The importance of comparing unbiased predictions when using SEDI and SEDS to evaluate forecasting skills was stressed by Ferro and Stephenson [30]. This is particularly important for SEDI because this measure penalizes underprediction more than overprediction. Figure 9a reveals different outcomes. First, MULTI3 index performs similarly to MULTI5, MULTI6, and MULTI indices, indicating that adding other highly correlated indices or indices with a worse performance has no positive impact on forecasting skill. Secondly, the use of the Richardson number is beneficial. Moreover, the use of RICH2 is more advantageous than the use of RICH1 and this benefit is more noticeable as more predictors are utilized. Thus, MULTI-RI2 and MULTI6-RI2 outperform all other indices. This result was also verified in terms of the ability to predict SEV turbulence (not shown).
Figure 9b shows the performance of the combined indices using RICH1 and RICH2 (see Equations (7)–(9)) and depicts their skill as a function of the weighting coefficient (coef). It is clear that, as the coef increases from 0.1 to 0.25, the forecasting skill of the indices increases, reaching its maximum for coef = 0.25. This result was also confirmed by the SEDS and AUC scores (not shown).
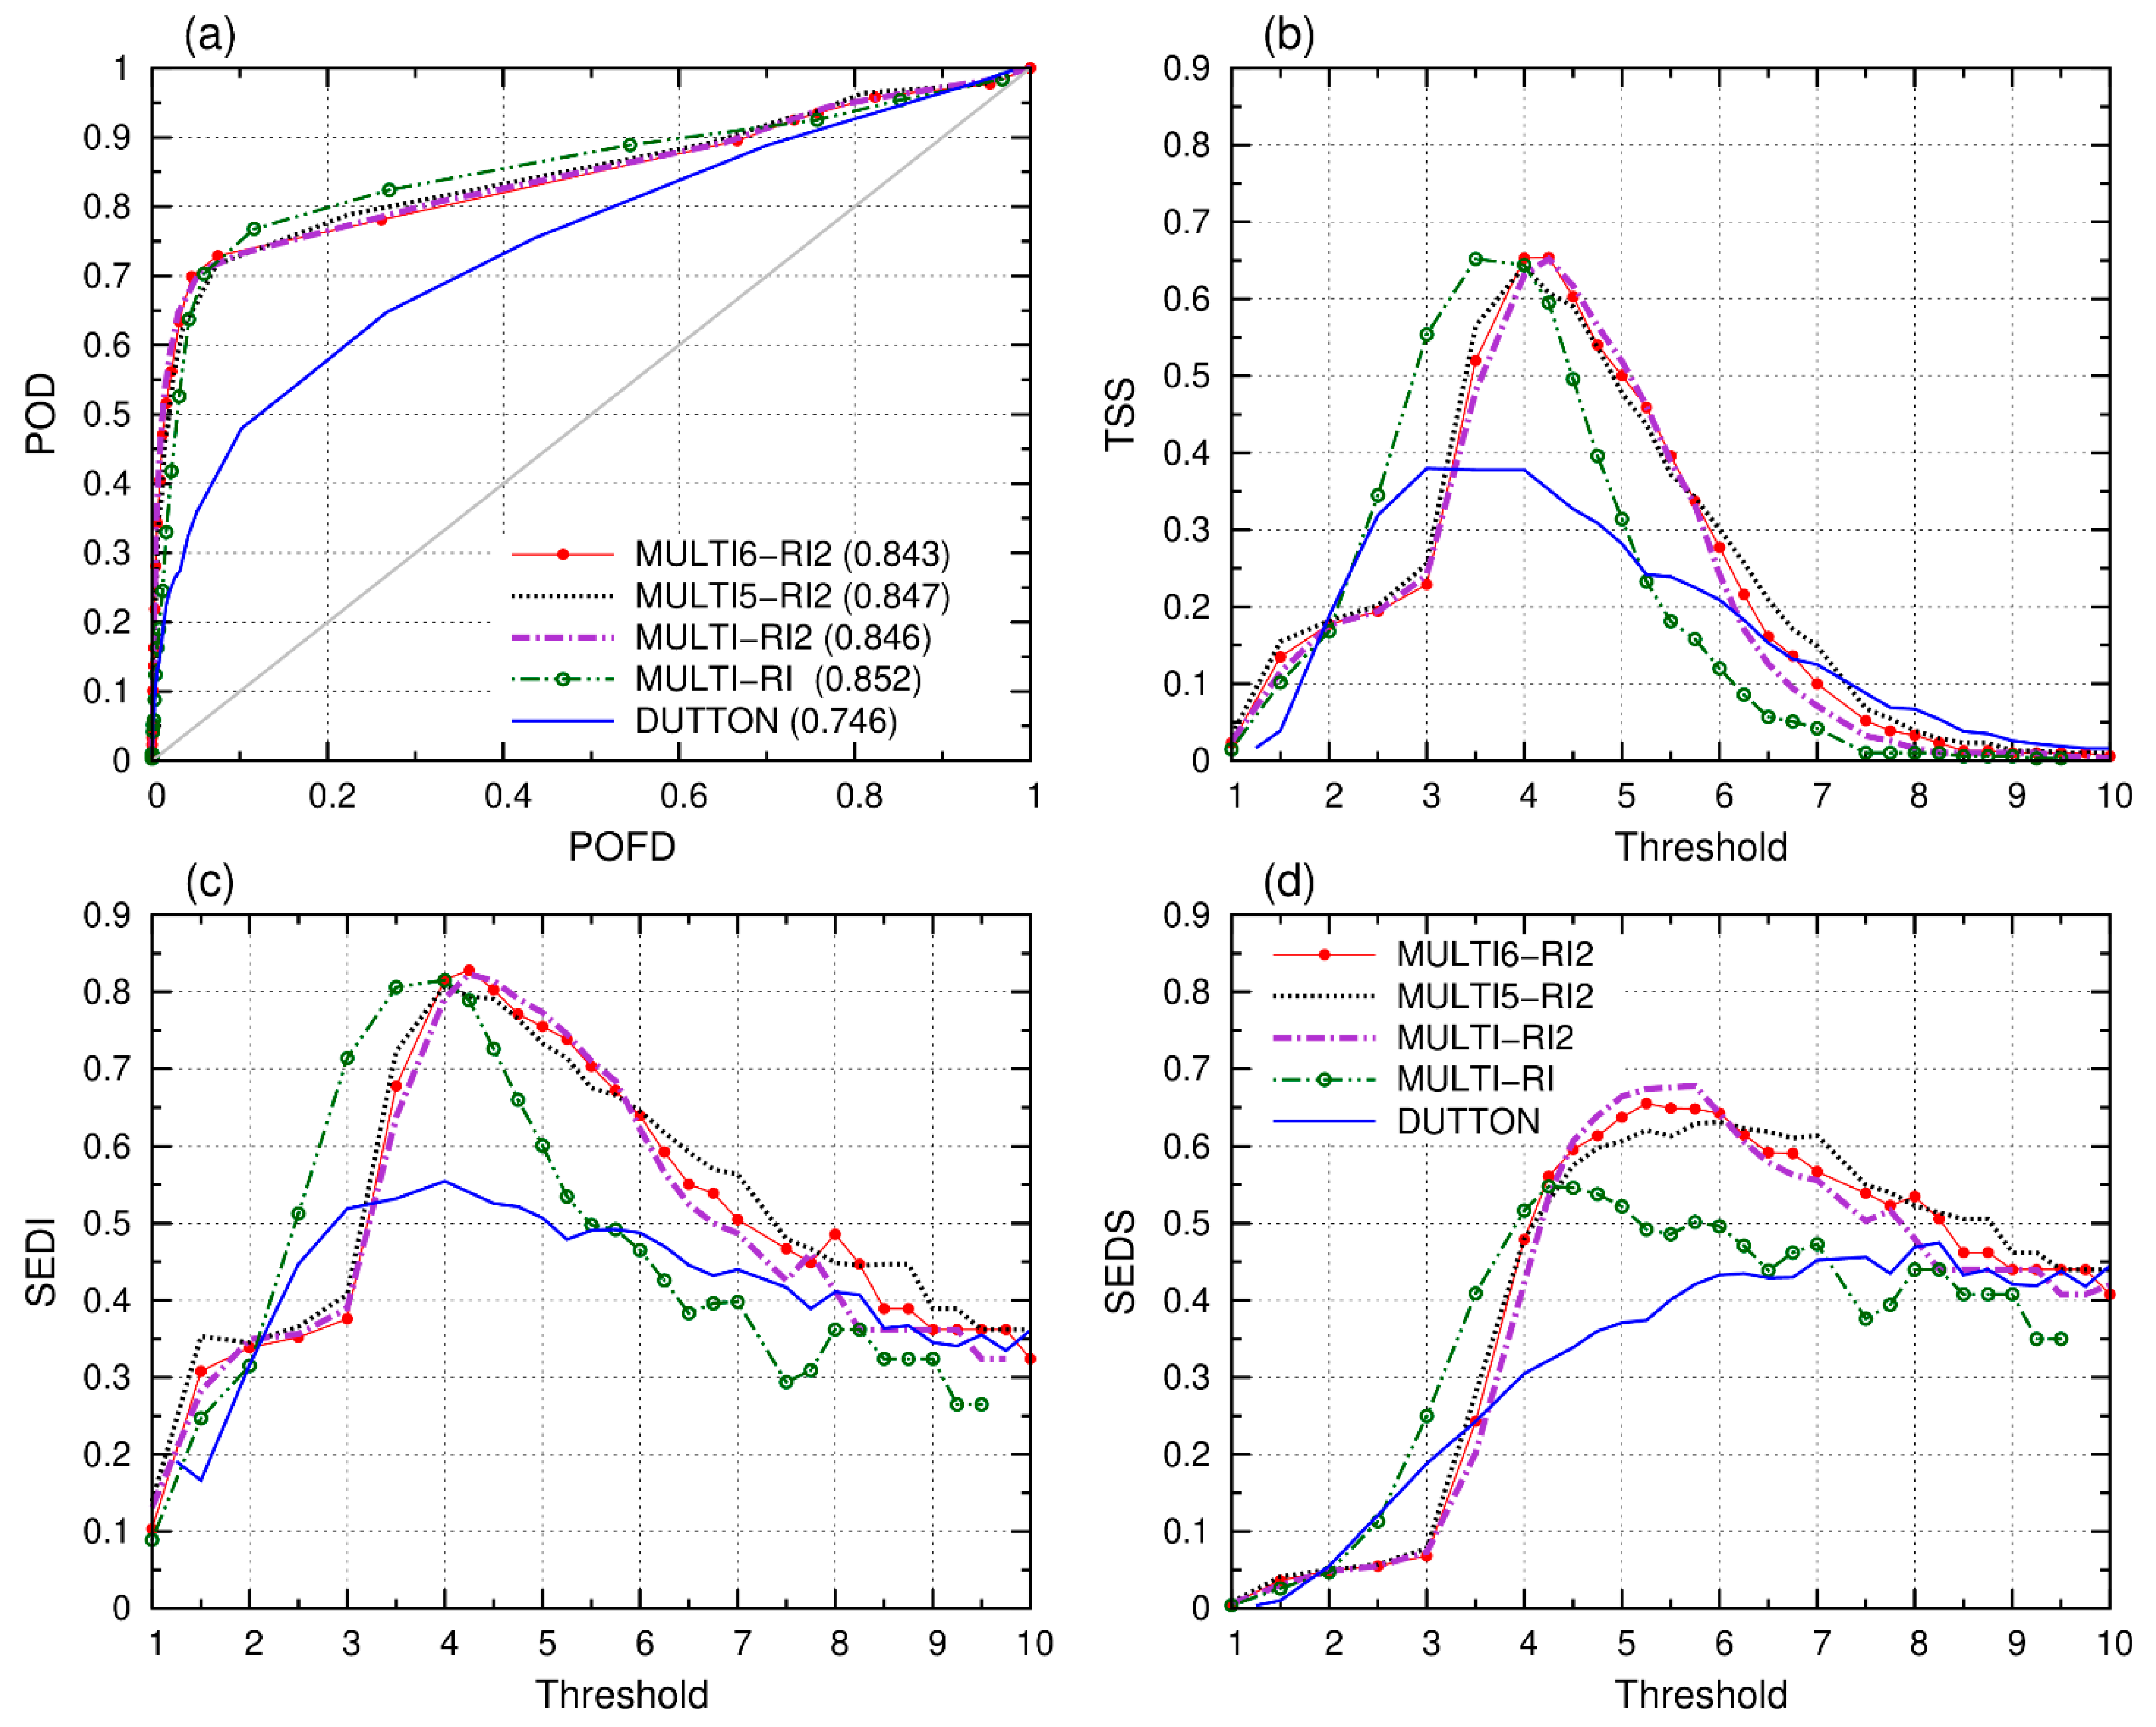
Figure 10 shows the performance of the best-combined turbulence indices to correctly capture MOG turbulence. It also compares their skill to the DUTTON index (one of the most skillful turbulence diagnostics). The area under the ROC curve is considerably higher for the combined indices using Ri than for the DUTTON index, illustrating the higher skill of these indices when compared to the individual turbulence diagnostics. The other verification measures confirm this result (Figure 10b–d). In terms of SEDI and TSS scores, the use of RICH1 and RICH2 appears to be equally beneficial. However, SEDS reveals that the use of RICH2 is more advantageous than the use of RICH1 (Figure 10d).
Figure 10 also shows that the optimal threshold depends on the verification measure. SEDI and TSS peak for the same thresholds for all turbulence indices (Figure 10b,c). In contrast, SEDS reaches the maximum values for higher thresholds than the other scores (Figure 10d). As mentioned in Section 3.3.2, this reflects the fact that SEDS penalizes overprediction more than SEDI. This is discussed in more detail in the next section.

3.3.4. The Operational Turbulence Index and Its Forecasting Skill

In the previous section, it was shown that MULTI6-RI2 and MULTI-RI2 outperform the other indices. Thus, considering the tradeoff between performance and efficiency, the turbulence index which is operationally used at IPMA ( TURB IPMA ) is the MULTI6-RI2 index with coef = 0.25 (see Section 3.3.3). In this section, the performance of TURB IPMA is discussed in detail.
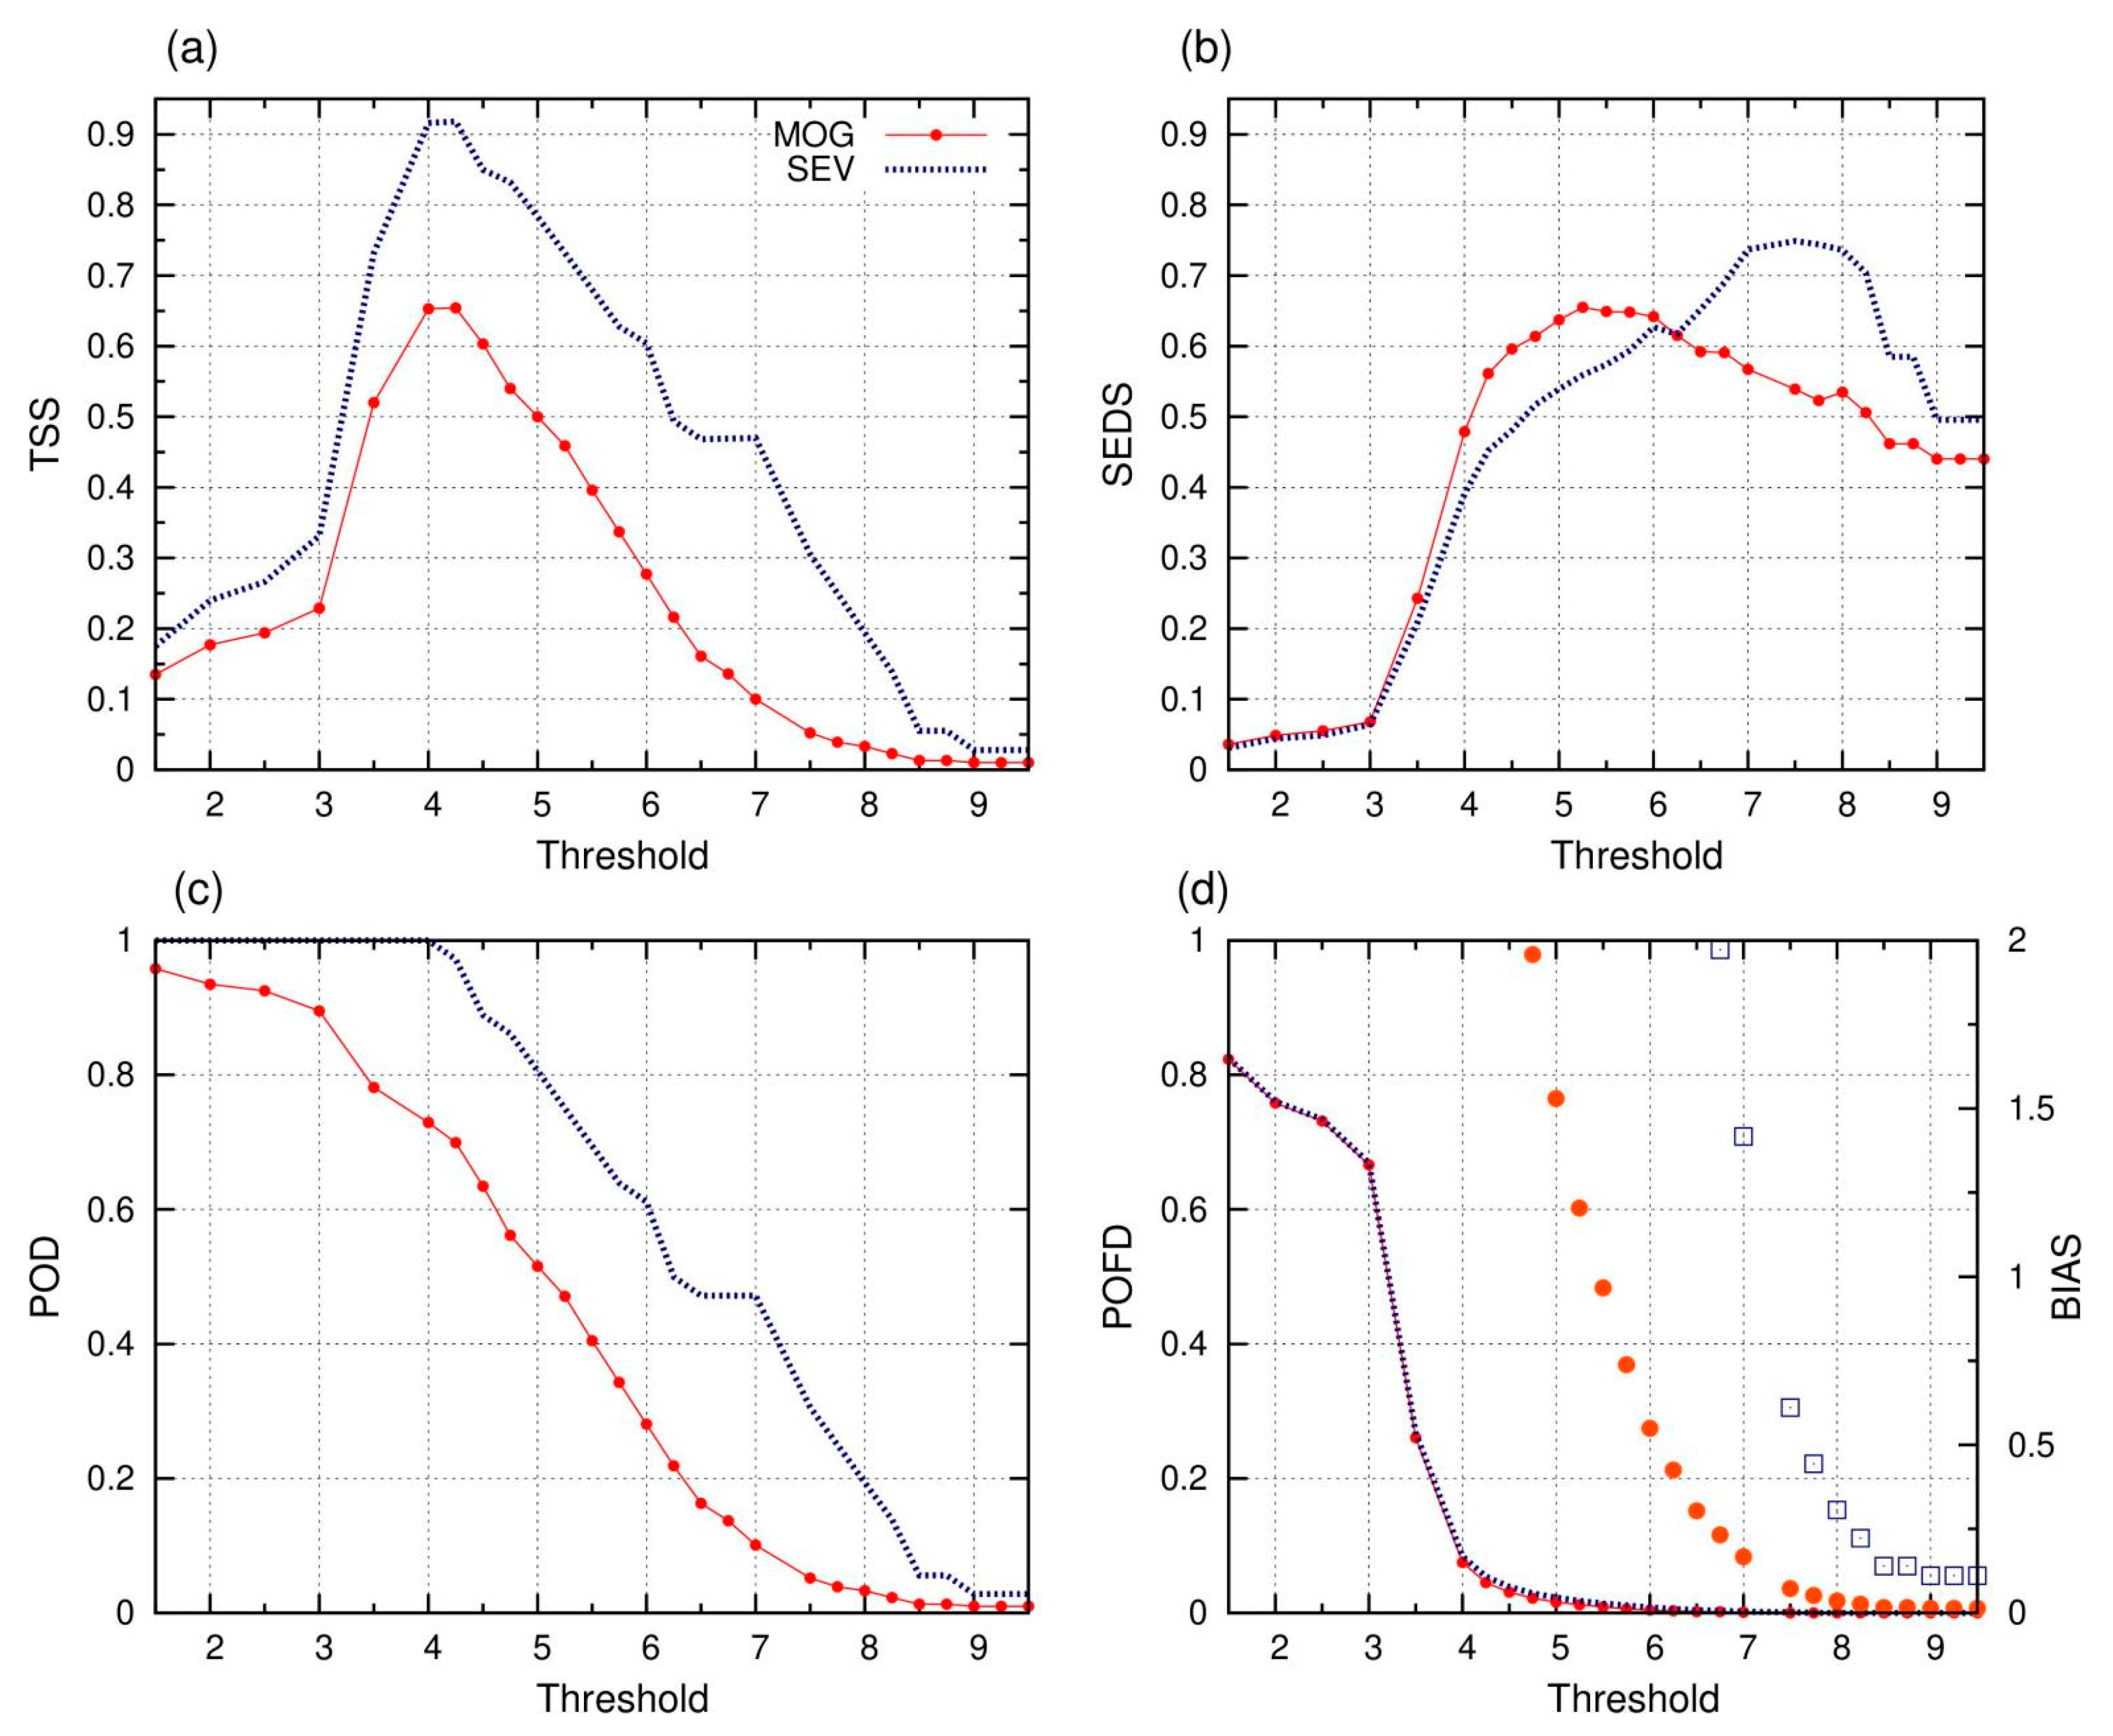
Figure 11 compares the scores that evaluate the performance of TURB IPMA concerning the forecast of MOG and SEV turbulence. From this figure, it is evident that the optimal threshold depends on the verification measure, as shown in Figure 10. It is noteworthy that, when using the TSS score, the optimal threshold is the same for both MOG and SEV turbulence classes (Figure 11a), which is not acceptable in an operational forecasting system. Moreover, in terms of TSS, TURB IPMA appears to be considerably more skillful at correctly distinguishing between SEV turbulence and other classes than it is at discriminating between MOG and other turbulence classes. This may be explained by the fact that, as the rarity of the predicted event increases (the base rate decreases), the contingency table becomes overwhelmingly dominated by the correct predictions of non-events. In this case, TSS can thus be maximized by maximizing the POD [27], regardless of the bias rate. This applies here in the evaluation of severe turbulence forecasts, for which the base rate is 0.002. Note that, for a threshold of 4 to 4.25, TSS is maximum ( ~ 0.92) and POD   0.97 (Figure 11a,c), but the BIAS 30 (Table 5), revealing a large overestimation of severe turbulence events.
Figure 11 also shows that, concerning the forecast of MOG turbulence, SEDS peaks at the threshold of 5.25 when POD is 0.47 and the BIAS is 1.2. In contrast, TSS peaks at the threshold of 4 (Figure 11a), when BIAS ~ 5.4 (Table 5). In addition, according to SEDS, the optimal threshold for forecasting severe turbulence is 7.5 (Figure 11b). In this case, BIAS ~ 0.6 and POD = 0.31. In the operational practice, a forecaster can use a slightly lower threshold, for instance 7, which guarantees a higher POD (0.47), with a BIAS ~ 1.4 (Table 5).
It is important to note that the choice of the optimal threshold should take into account that, for certain meteorological phenomena, the cost of a false negative (miss) is worse than a false alarm. In this case, it is better to have a moderately biased forecast, which guarantees a certain probability of detection. Following this reasoning, operationally, for the forecast of moderate turbulence, the threshold chosen is 5 (see the corresponding Table 6). For this threshold, SEDI and SEDS values are close to their maximum values and, simultaneously, POD = 0.52 and BIAS ~ 1.5. For a higher threshold, POD is too low, while, for lower threshold values, BIAS is too high (see Table 5).

3.4. The Operational Turbulence Index

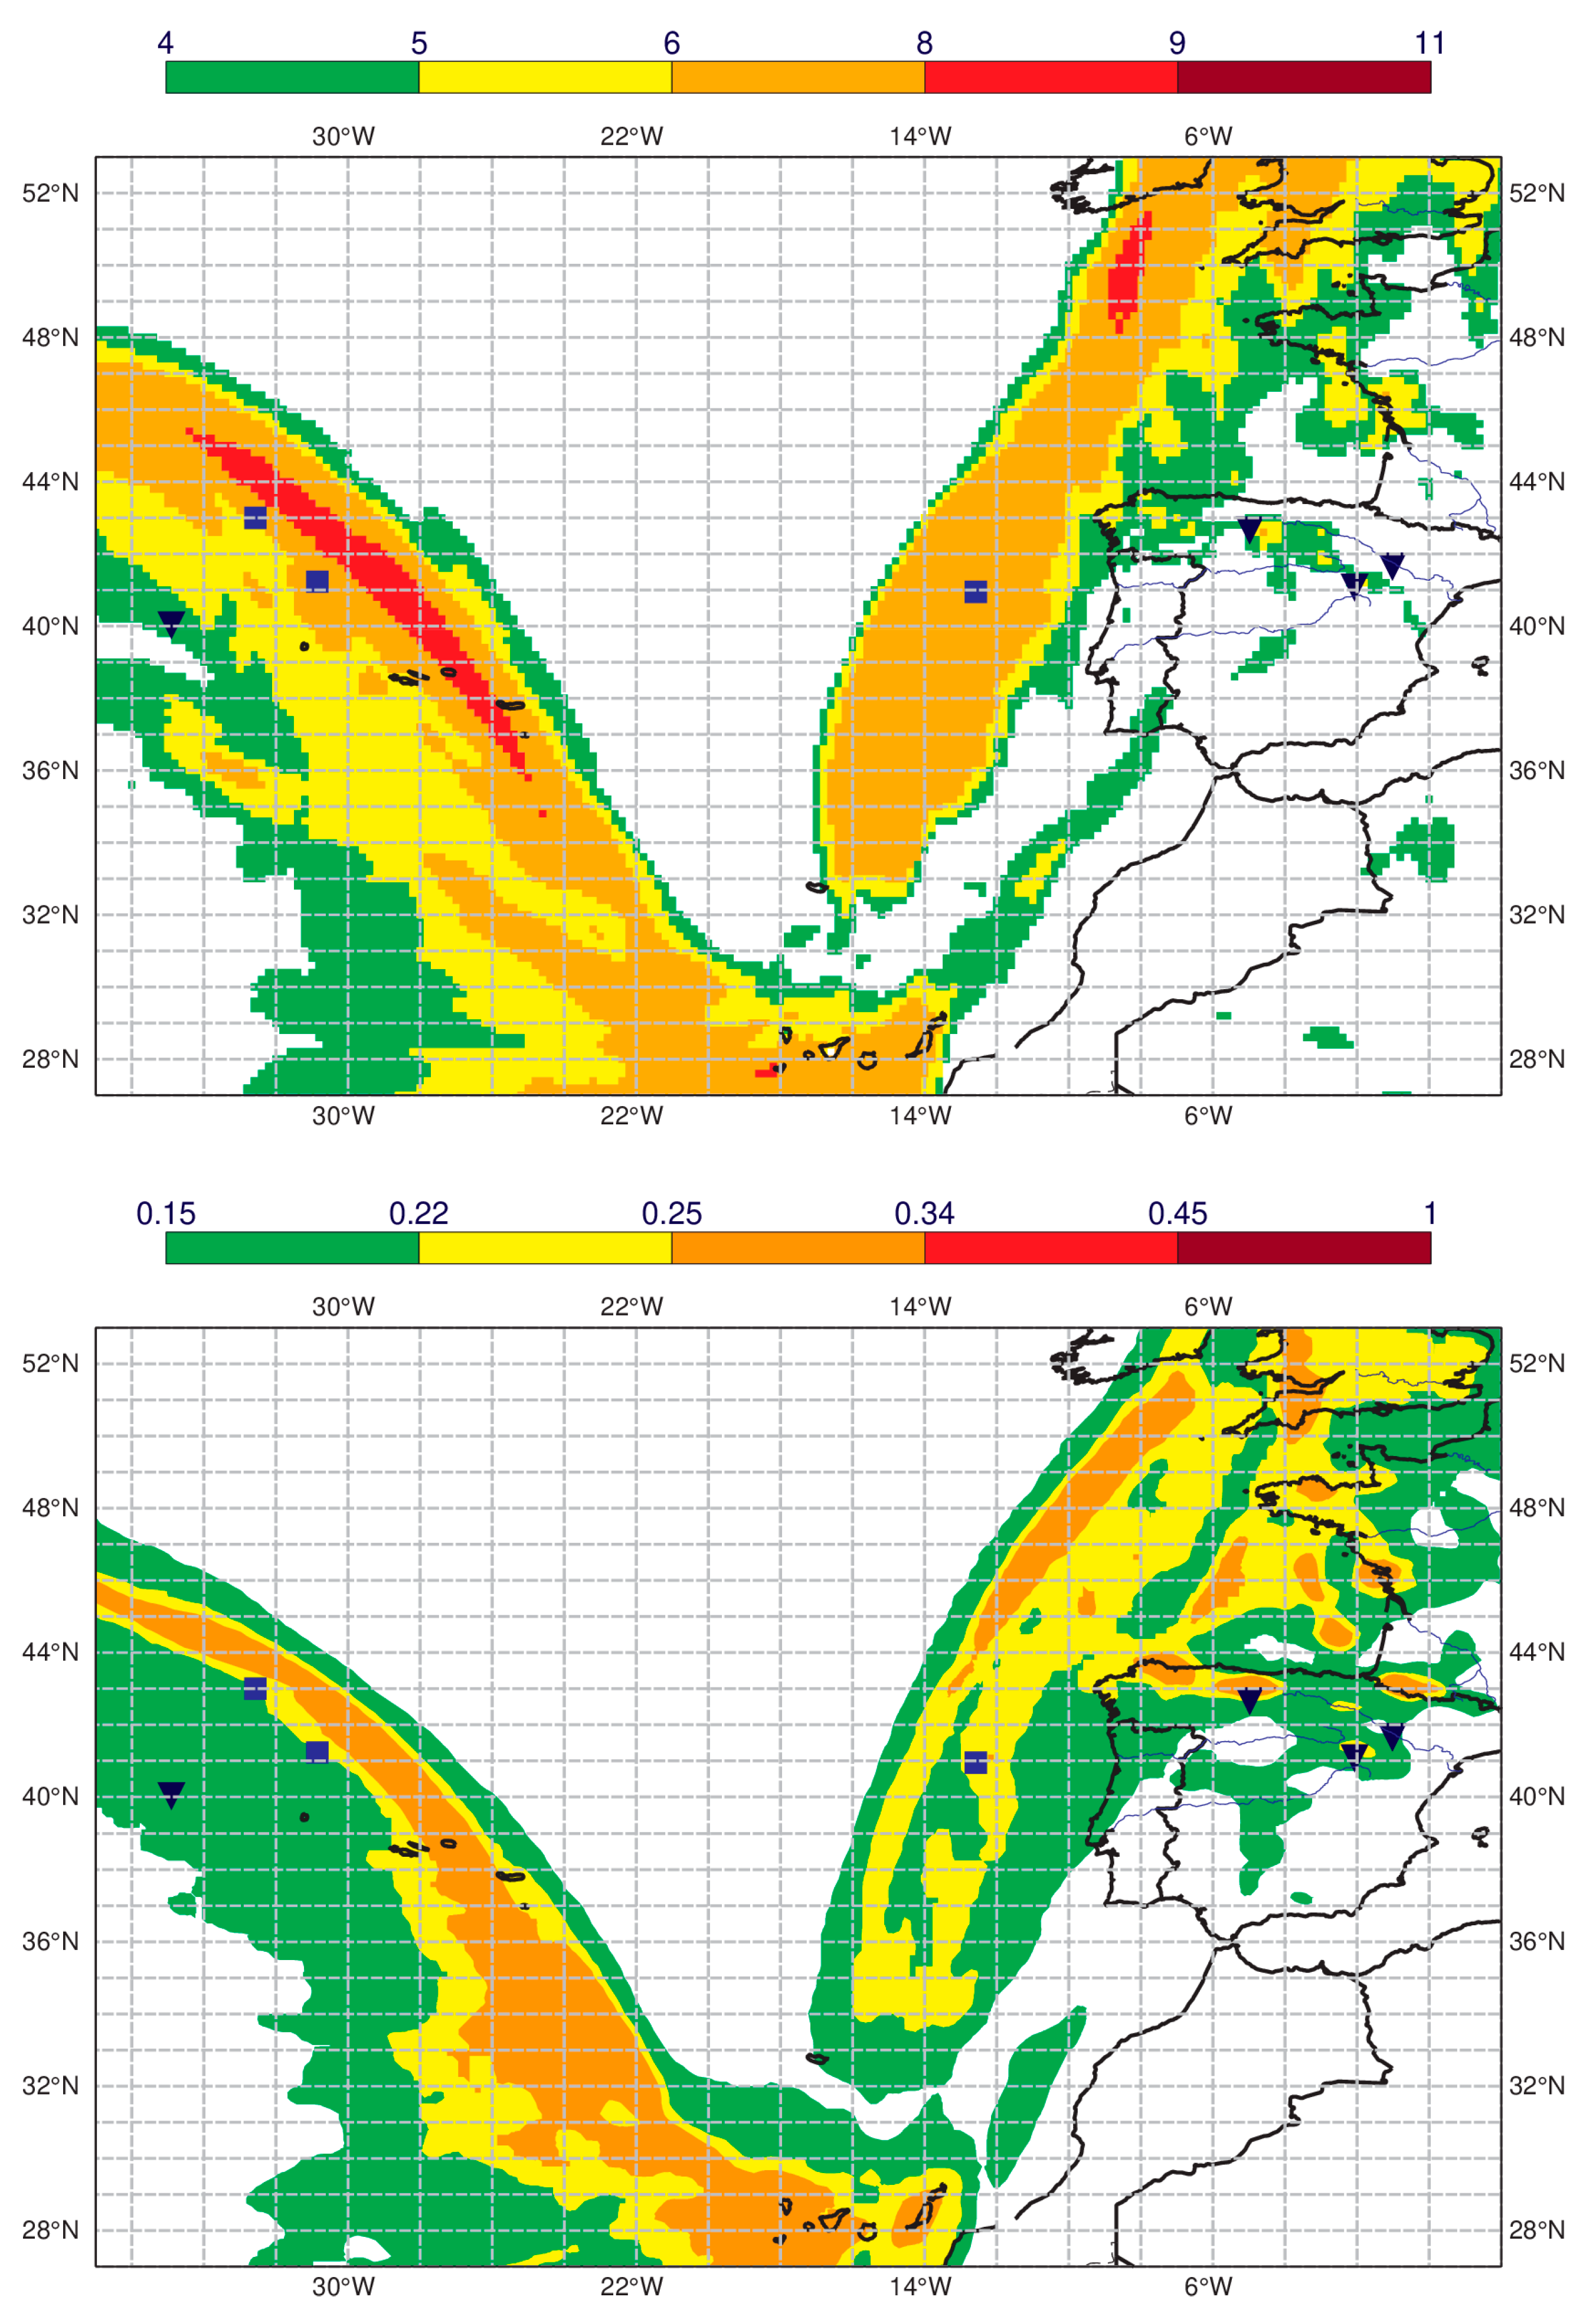
In the operational practice, a final step is applied to the TURB IPMA index. The maximum value of TURB IPMA   (TURBMAX) and average value for TURB IPMA     5 (TURBMEAN) in a given layer is calculated. The final index (TURBLAYER) is the average of TURBMAX and TURBMEAN. On 20 February 2021, the Canadian and Portuguese MWOs issued turbulence SIGMETs, respectively, for Gander and Santa Maria Oceanic FIRs. These turbulence zones lie on the western edge of an upper-level trough (not shown). Figure 12 shows the TURBLAYER and turbulence product from London WAFC, both for the FL300/390 layer. Note that the scales of these products differ since the latter product was calibrated with EDR data [15]. An EDR greater than 0.22 and 0.34 m2/3 s–1 indicates moderate and severe intensities of turbulence for mid-size aircraft [15]. Both products predict a large area of turbulence associated with the upper-level trough, which extends to middle levels (not shown). Despite the similarities between the spatial patterns of these two indices, there are some differences regarding turbulence intensities. For example, TURB IPMA predicts favourable conditions for severe turbulence northwest of the Azores and over the central Azores archipelago. In contrast, the WAFC EDR product predicts only severe turbulence in two small areas, one over the Canary Islands and one northwest of the Azores archipelago in the FL240/300 layer (not shown) and no severe turbulence in the FL300/390 layer. It is also worth mentioning that both products appear to underestimate the severity of the turbulence reported in the northeastern region of the Iberian Peninsula and also in the Atlantic west of the Azores. One of the severe turbulence AIREPs in the Iberian Peninsula was due to mountain wave turbulence. It is expected that the IPMA index underestimates mountain wave turbulence because it does not include specific mountain wave diagnostics (as proposed by Kim et al. [14,15]). Moreover, diagnostics derived from a non-hydrostatic model with higher resolution (grid spacing < 3 km) would be more suitable for this purpose.

4. Conclusions

The performance of several turbulence diagnostics derived from ECMWF forecasts are evaluated over Portuguese flight information regions (FIR) and surrounding areas for the period February 2020 to March 2021, excluding May and June. In addition, the algorithm developed and used operationally by aviation meteorologists at IPMA to forecast moderate and severe turbulence over Portuguese FIRs is also discussed. The forecasts were compared with turbulence observations from special air reports and DEVG data from AMDARs received at the Portuguese MWO.
Previous studies have shown that a combined turbulence index, using multiple turbulence diagnostics instead of using only one turbulence diagnostic, leads to a considerable improvement in the turbulence forecasting skill [2,10,13,26]. The present study uses a new approach to combine different NWP-based turbulence diagnostics to obtain the turbulence index used operationally in IPMA ( TURB IPMA ). This index combines six turbulence diagnostics (VWS, DUTTON, ELLROD2, EE, CAT1, and DEF) with a new function of Richardson number (RICH2). The choice of these predictors and of the weight given to RICH2 were established through a sensitivity analysis. The use of RICH2 has proven to be beneficial, even when compared to another Ri function. The VWS, DUTTON, EE, and ELLROD2 indices outperform the other turbulence diagnostics. Thus, the weight coefficient for these indicators is higher than for the other two predictors, as has been shown in previous studies [2,10,13,26].
The objective verification approach in this paper uses not only the Relative Operating Characteristic curves but also novel measures such as the recently proposed Symmetric Extreme Dependence Index (SEDI) and Symmetric Extreme Dependence Index (SEDS). These measures are particularly suitable for assessing the forecasting skill of rare events [30,33] such as moderate or greater turbulence, which accounts for 1.6% of the total data.
The prediction of moderate and severe turbulence depends on the choice of the optimal threshold. However, this optimal threshold varies with the verification measure used. The results show that TSS and SEDI achieve a higher value for lower thresholds compared to SEDS. This is because, when the contingency table becomes dominated by the correct predictions of non-events, both TSS and SEDI penalize under-prediction more than over-prediction. The referred drawback of SEDI can be minimized by forcing the forecast to be unbiased (BIAS = 1), as suggested by Ferro and Stephenson [30]. In this regard, the use of SEDS is beneficial, especially as the rarity of the event increases. To the author’s knowledge, this is the first study using SEDS to evaluate the performance of turbulence forecasts. The properties of SEDS allow its application to assess the forecast performance of severe turbulence (a rare event), which is usually not addressed. In general, previous studies evaluate the forecasting skill of forecasts of moderate-or-greater turbulence [2,10,15,22,23]. However, this information is insufficient for aviation forecasters, who must issue SIGMETs when severe turbulence is expected to occur.
Studies comparing the performance of the ECMWF model with other models in terms of turbulence diagnostics are still lacking. Therefore, it would be worthwhile to compare the IPMA (ECMWF-based) and WAFC turbulence products for a sufficiently long period (such as two years). Furthermore, in the future, it would be relevant to investigate the impact of using other turbulence diagnostics, such as divergence and vertical velocity, and adding to the operational index mountain wave turbulence diagnostics as used by Kim et al. [15].

Funding

This work is funded by National Funds by FCT—Portuguese Foundation for Science and Technology, under the project UIDB/04033/2020.

Institutional Review Board Statement

Not applicable.

Informed Consent Statement

Not applicable.

Data Availability Statement

Data is not publicly available.

Acknowledgments

The author thanks Filipe Ferreira for the production of Figure 1 and Figure 2. The comments of Isabel Soares are acknowledged. Finally, the author would like to thank the three anonymous reviewers for their very useful contributions.

Conflicts of Interest

The author declares no conflict of interest.

Appendix A

Ten NWP based turbulence indicators commonly used in aviation meteorology applications [2,10,13] were evaluated in this study.
Vertical Wind Shear
Vertical wind shear is recognized as a primary source of CAT [41] and is defined as:
VWS = ( u z ) 2 + ( v z ) 2
with u and v denoting the zonal and meridional components of the wind, respectively.
Deformation
Total deformation is also associated with turbulence [11,41] and is defined as DEF2 = DST2 + DSH2, where DSH represents the shearing deformation and DST is the stretching deformation:
DST = u x v y ;   DSH = v x + u y
Brown Index
According to Gill and Buchanan [13] and Sharman et al. [2], the Brown Index (EE) is defined as:
EE = 1 24 V W S 2 ( 0.3 ζ a 2 + DSH 2 + DST 2 ) ,     ζ a = ( v x u y ) + f
with ζ a denoting the absolute vorticity and f the Coriolis frequency.
ELLROD Indexes
The first version of Ellrod indices is defined as:
ELLROD1 = V W S × D E F ,
The second version of the index (ELLROD2) is similar to the ELLROD1, except that it incorporates a convergence term, ( u x + v y ) , as is shown in Equation (A5):
ELLROD2 = V W S [ D E F ( u x + v y ) ]
DUTTON Index
The DUTTON index [13,42] is defined as:
D U T T O N = 1.25   H W S k + ( 0.25   V W S k 2 ) + 10.5 ,  
where V W S k = V W S × 10 3 denotes the vertical wind shear in ms−1 km−1 and H W S k = H W S × 10 5 denotes the horizontal wind shear in ms−1/100 km and H W S (in s−1) is defined as:
H W S = 1 V V 2 ( u v u x u 2 u y + v 2 v x u v v y )
with VV denoting the horizontal wind speed.
CAT1 and CAT2
The CAT1 turbulence indicator is based on Model Output Statistics [2] and is defined as:
CAT1 = V V × D E F ,
The deformation combined with vertical gradient of temperature can also be used as predictor of turbulence:
CAT2 = | T z | × D E F ,
Horizontal Temperature Gradient
The horizontal temperature gradient (GRADT) is related to the vertical wind shear from the thermal wind relation and is a measure of the deformation [2], being used also as a turbulence indicator:
GRADT = ( T x ) 2 + ( T y ) 2
with T denoting air temperature.
Richardson Number
The Richardson number ( R i ) is a non-dimensional number, with the numerator representing the stratification and the denominator representing the vertical wind shear: R i = N 2 V W S 2   , where N 2 = g θ ( θ z )   is the Brunt–Väisälä frequency and θ is potential temperature.

References

  1. Sharman, R.; Lane, T. Aviation Turbulence: Processes, Detection, Prediction; Springer International Publishing: Cham, Switzerland, 2016; pp. 42–273. [Google Scholar]
  2. Sharman, R.; Tebaldi, C.; Wiener, G.; Wolff, J. An Integrated Approach to Mid- and Upper-Level Turbulence Forecasting. Weather Forecast. 2006, 21, 268–287. [Google Scholar] [CrossRef]
  3. Mazon, J.; Rojas, J.I.; Lozano, M.; Pino, D.; Prats, X.; Miglietta, M.M. Influence of meteorological phenomena on worldwide aircraft accidents, 1967–2010. Met. Apps. 2018, 25, 236–245. [Google Scholar] [CrossRef]
  4. Gultepe, I.; Sharman, R.; Williams, P.D.; Zhou, B.; Ellrod, G.; Minnis, P.; Trier, S.; Griffin, S.; Yum, S.S.; Gharabaghi, B.; et al. A Review of High Impact Weather for Aviation Meteorology. Pure Appl. Geophys. 2019, 176, 1869–1921. [Google Scholar] [CrossRef]
  5. Kim, J.; Chun, H. A Numerical Study of Clear-Air Turbulence (CAT) Encounters over South Korea on 2 April 2007. J. Appl. Meteor. Climatol. 2010, 49, 2381–2403. [Google Scholar] [CrossRef]
  6. Lane, T.P.; Sharman, R.D.; Trier, S.B.; Fovell, R.G.; Williams, J.K. Recent Advances in the Understanding of Near-Cloud Turbulence. Bull. Am. Meteorol. Soc. 2012, 93, 499–515. [Google Scholar] [CrossRef] [Green Version]
  7. Sharman, R.D.; Trier, S.B.; Lane, T.P.; Doyle, J.D. Sources and dynamics of turbulence in the upper troposphere and lower stratosphere: A review. Geophys. Res. Lett. 2012, 39, L12803. [Google Scholar] [CrossRef] [Green Version]
  8. Lee, D.; Chun, H. A Numerical Study of Aviation Turbulence Encountered on 13 February 2013 over the Yellow Sea between China and the Korean Peninsula. J. Appl. Meteor. Climatol. 2018, 57, 1043–1060. [Google Scholar] [CrossRef]
  9. Maruhashi, J.; Serrão, P.; Belo-Pereira, M. Analysis of Mountain Wave Effects on a Hard Landing Incident in Pico Aerodrome Using the AROME Model and Airborne Observations. Atmosphere 2019, 10, 350. [Google Scholar] [CrossRef] [Green Version]
  10. Kim, J.; Chun, H.; Sharman, R.D.; Keller, T.L. Evaluations of Upper-Level Turbulence Diagnostics Performance Using the Graphical Turbulence Guidance (GTG) System and Pilot Reports (PIREPs) over East Asia. J. Appl. Meteor. Climatol. 2011, 50, 1936–1951. [Google Scholar] [CrossRef]
  11. Ellrod, G.P.; Knapp, D.I. An Objective Clear-Air Turbulence Forecasting Technique: Verification and Operational Use. Weather Forecast. 1992, 7, 150–165. [Google Scholar] [CrossRef] [Green Version]
  12. Ellrod, G.P.; Knox, J.A. Improvements to an Operational Clear-Air Turbulence Diagnostic Index by Addition of a Divergence Trend Term. Weather Forecast. 2010, 25, 789–798. [Google Scholar] [CrossRef]
  13. Gill, P.G.; Buchanan, P. An ensemble based turbulence forecasting system. Met. Apps. 2014, 21, 12–19. [Google Scholar] [CrossRef]
  14. Kim, J.; Sharman, R.D.; Benjamin, S.G.; Brown, J.M.; Park, S.; Klemp, J.B. Improvement of Mountain-Wave Turbulence Forecasts in NOAA’s Rapid Refresh (RAP) Model with the Hybrid Vertical Coordinate System. Weather Forecast. 2019, 34, 773–780. [Google Scholar] [CrossRef]
  15. Kim, J.; Sharman, R.; Strahan, M.; Scheck, J.W.; Bartholomew, C.; Cheung, J.C.H.; Buchanan, P.; Gait, N. Improvements in Nonconvective Aviation Turbulence Prediction for the World Area Forecast System. Bull. Am. Meteorol. Soc. 2018, 99, 2295–2311. [Google Scholar] [CrossRef] [Green Version]
  16. ICAO. Meteorological Service for International Air Navigation: Annex 3 to the Convention on International Civil Aviation, 20th ed.; International Standards and Recommended Practices; International Civil Aviation Organization: Montreal, QC, Canada, 2018; p. 224, July 2018. [Google Scholar]
  17. Haiden, T.; Martin, J.; Frédéric, V.; Zied, B.-B.; Laura, F.; Fernando, P. Evaluation of ECMWF Forecasts, Including the 2021 Upgrade; Technical Memorandum; European Centre for Medium Range Weather Forecasts: Reading, UK, 2021; No. 884. [Google Scholar]
  18. Sherman, D.J. The Australian Implementation of AMDAR/ACARS and the Use of Derived Equivalent Gust Velocity as a Turbulence Indicator; Aeronautical Research Laboratories Structures Rep. 418: Melbourne, Australia, 1985; p. 28. [Google Scholar]
  19. Truscott, B.S. EUMETNET AMDAR AAA AMDAR Software Developments-Technical Specification; E_AMDAR/TSC/003; Met Office: Exeter, UK, 2000; p. 18. [Google Scholar]
  20. Kim, S.-H.; Chun, H.-Y. Aviation turbulence encounters detected from aircraft observations: Spatiotemporal characteristics and application to Korean Aviation Turbulence Guidance. Met. Apps. 2016, 23, 594–604. [Google Scholar] [CrossRef]
  21. Kim, S.-H.; Chun, H.-Y.; Kim, J.-H.; Sharman, R.D.; Strahan, M. Retrieval of eddy dissipation rate from derived equivalent vertical gust included in Aircraft Meteorological Data Relay (AMDAR). Atmos. Meas. Tech. 2020, 13, 1373–1385. [Google Scholar] [CrossRef] [Green Version]
  22. Gill, P.G. Objective verification of World Area Forecast Centre clear air turbulence forecasts. Met. Apps. 2014, 21, 3–11. [Google Scholar] [CrossRef]
  23. Storer, L.N.; Gill, P.G.; Williams, P.D. Multi-model ensemble predictions of aviation turbulence. Meteorol Appl. 2019, 26, 416–428. [Google Scholar] [CrossRef] [Green Version]
  24. Kim, S.; Chun, H.; Chan, P.W. Comparison of Turbulence Indicators Obtained from In Situ Flight Data. J. Appl. Meteor. Climatol. 2017, 56, 1609–1623. [Google Scholar] [CrossRef]
  25. Malardel, S.; Wedi, N.; Deconinck, W.; Diamantakis, M.; Kühnlein, C.; Mozdzynski, G.; Hamrud, M.; Smolarkiewicz, P. A New Grid for the IFS. ECMWF Newsletter No. 146. 2016. Available online: https://www.ecmwf.int/en/elibrary/15041-newsletter-no-146-winter-2015-16 (accessed on 12 January 2022).
  26. Goecke, T.; Machulskaya, E. Aviation Turbulence Forecasting at DWD with ICON: Methodology, Case Studies, and Verification. Mon. Weather Rev. 2021, 149, 2115–2130. [Google Scholar] [CrossRef]
  27. Doswell, C.A., III; Davies-Jones, R.; Keller, D.L. On Summary Measures of Skill in Rare Event Forecasting Based on Contingency Tables. Weather Forecast. 1990, 5, 576–585. [Google Scholar] [CrossRef] [Green Version]
  28. McCann, D.W.; Knox, J.A.; Williams, P.D. An improvement in clear-air turbulence forecasting based on spontaneous imbalance theory: The ULTURB algorithm. Met. Apps. 2012, 19, 71–78. [Google Scholar] [CrossRef]
  29. Pearson, J.M.; Sharman, R.D. Prediction of Energy Dissipation Rates for Aviation Turbulence. Part II: Nowcasting Convective and Nonconvective Turbulence. J. Appl. Meteor. Climatol. 2017, 56, 339–351. [Google Scholar] [CrossRef] [Green Version]
  30. Ferro, C.A.T.; Stephenson, D.B. Extremal Dependence Index: Improved Verification Measures for Deterministic Forecasts of Rare Binary Events. Weather Forecast. 2011, 26, 699–713. [Google Scholar] [CrossRef] [Green Version]
  31. Mason, I. A model for assessment of weather forecasts. Aust. Meteor. Mag. 1982, 30, 291–303. [Google Scholar]
  32. Stephenson, D.B.; Casati, B.; Ferro, C.A.T.; Wilson, C.A. The extreme dependency score: A non-vanishing measure for forecasts of rare events. Met. Apps. 2008, 15, 41–50. [Google Scholar] [CrossRef]
  33. Hogan, R.J.; O’Connor, E.J.; Illingworth, A.J. Verification of cloud-fraction forecasts. Q.J.R. Meteorol. Soc. 2009, 135, 1494–1511. [Google Scholar] [CrossRef]
  34. Atlas, D.; Metcalf, J.I.; Richter, J.H.; Gossard, E.E. The Birth of “CAT” and Microscale Turbulence. J. Atmos. Sci. 1970, 27, 903–913. [Google Scholar] [CrossRef] [Green Version]
  35. Browning, K.A. Structure of the atmosphere in the vicinity of large-amplitude Kelvin-Helmholtz billows. Q.J.R. Meteorol. Soc. 1971, 97, 283–299. [Google Scholar] [CrossRef]
  36. Chapman, D.; Browning, K.A. Release of potential shearing instability in warm frontal zones. Q. J. R. Meteorol. Soc. 1999, 125, 2265–2289. [Google Scholar] [CrossRef]
  37. Thorpe, S.A. The axial coherence of Kelvin–Helmholtz billows. Q.J.R. Meteorol. Soc. 2002, 128, 1529–1542. [Google Scholar] [CrossRef]
  38. Medina, S.; Houze, R.A., Jr. Kelvin–Helmholtz waves in extratropical cyclones passing over mountain ranges. Q.J.R. Meteorol. Soc. 2016, 142, 1311–1319. [Google Scholar] [CrossRef] [Green Version]
  39. Storer, L.N.; Williams, P.D.; Gill, P.G. Aviation Turbulence: Dynamics, Forecasting, and Response to Climate Change. Pure Appl. Geophys. 2019, 176, 2081–2095. [Google Scholar] [CrossRef] [Green Version]
  40. Sharman, R.D.; Pearson, J.M. Prediction of Energy Dissipation Rates for Aviation Turbulence. Part I: Forecasting Nonconvective Turbulence. J. Appl. Meteor. Climatol. 2017, 56, 317–337. [Google Scholar] [CrossRef]
  41. Knox, J.A. Possible mechanisms of clear-air turbulence in strongly anticyclonic flows. Monthly Weather Review. 1997, 125, 1251–1259. [Google Scholar] [CrossRef]
  42. Overeem, A. Verification of Clear-Air Turbulence Forecasts; Technisch Rapport; KNMI: De Bilt, The Netherlands, 2002. [Google Scholar]
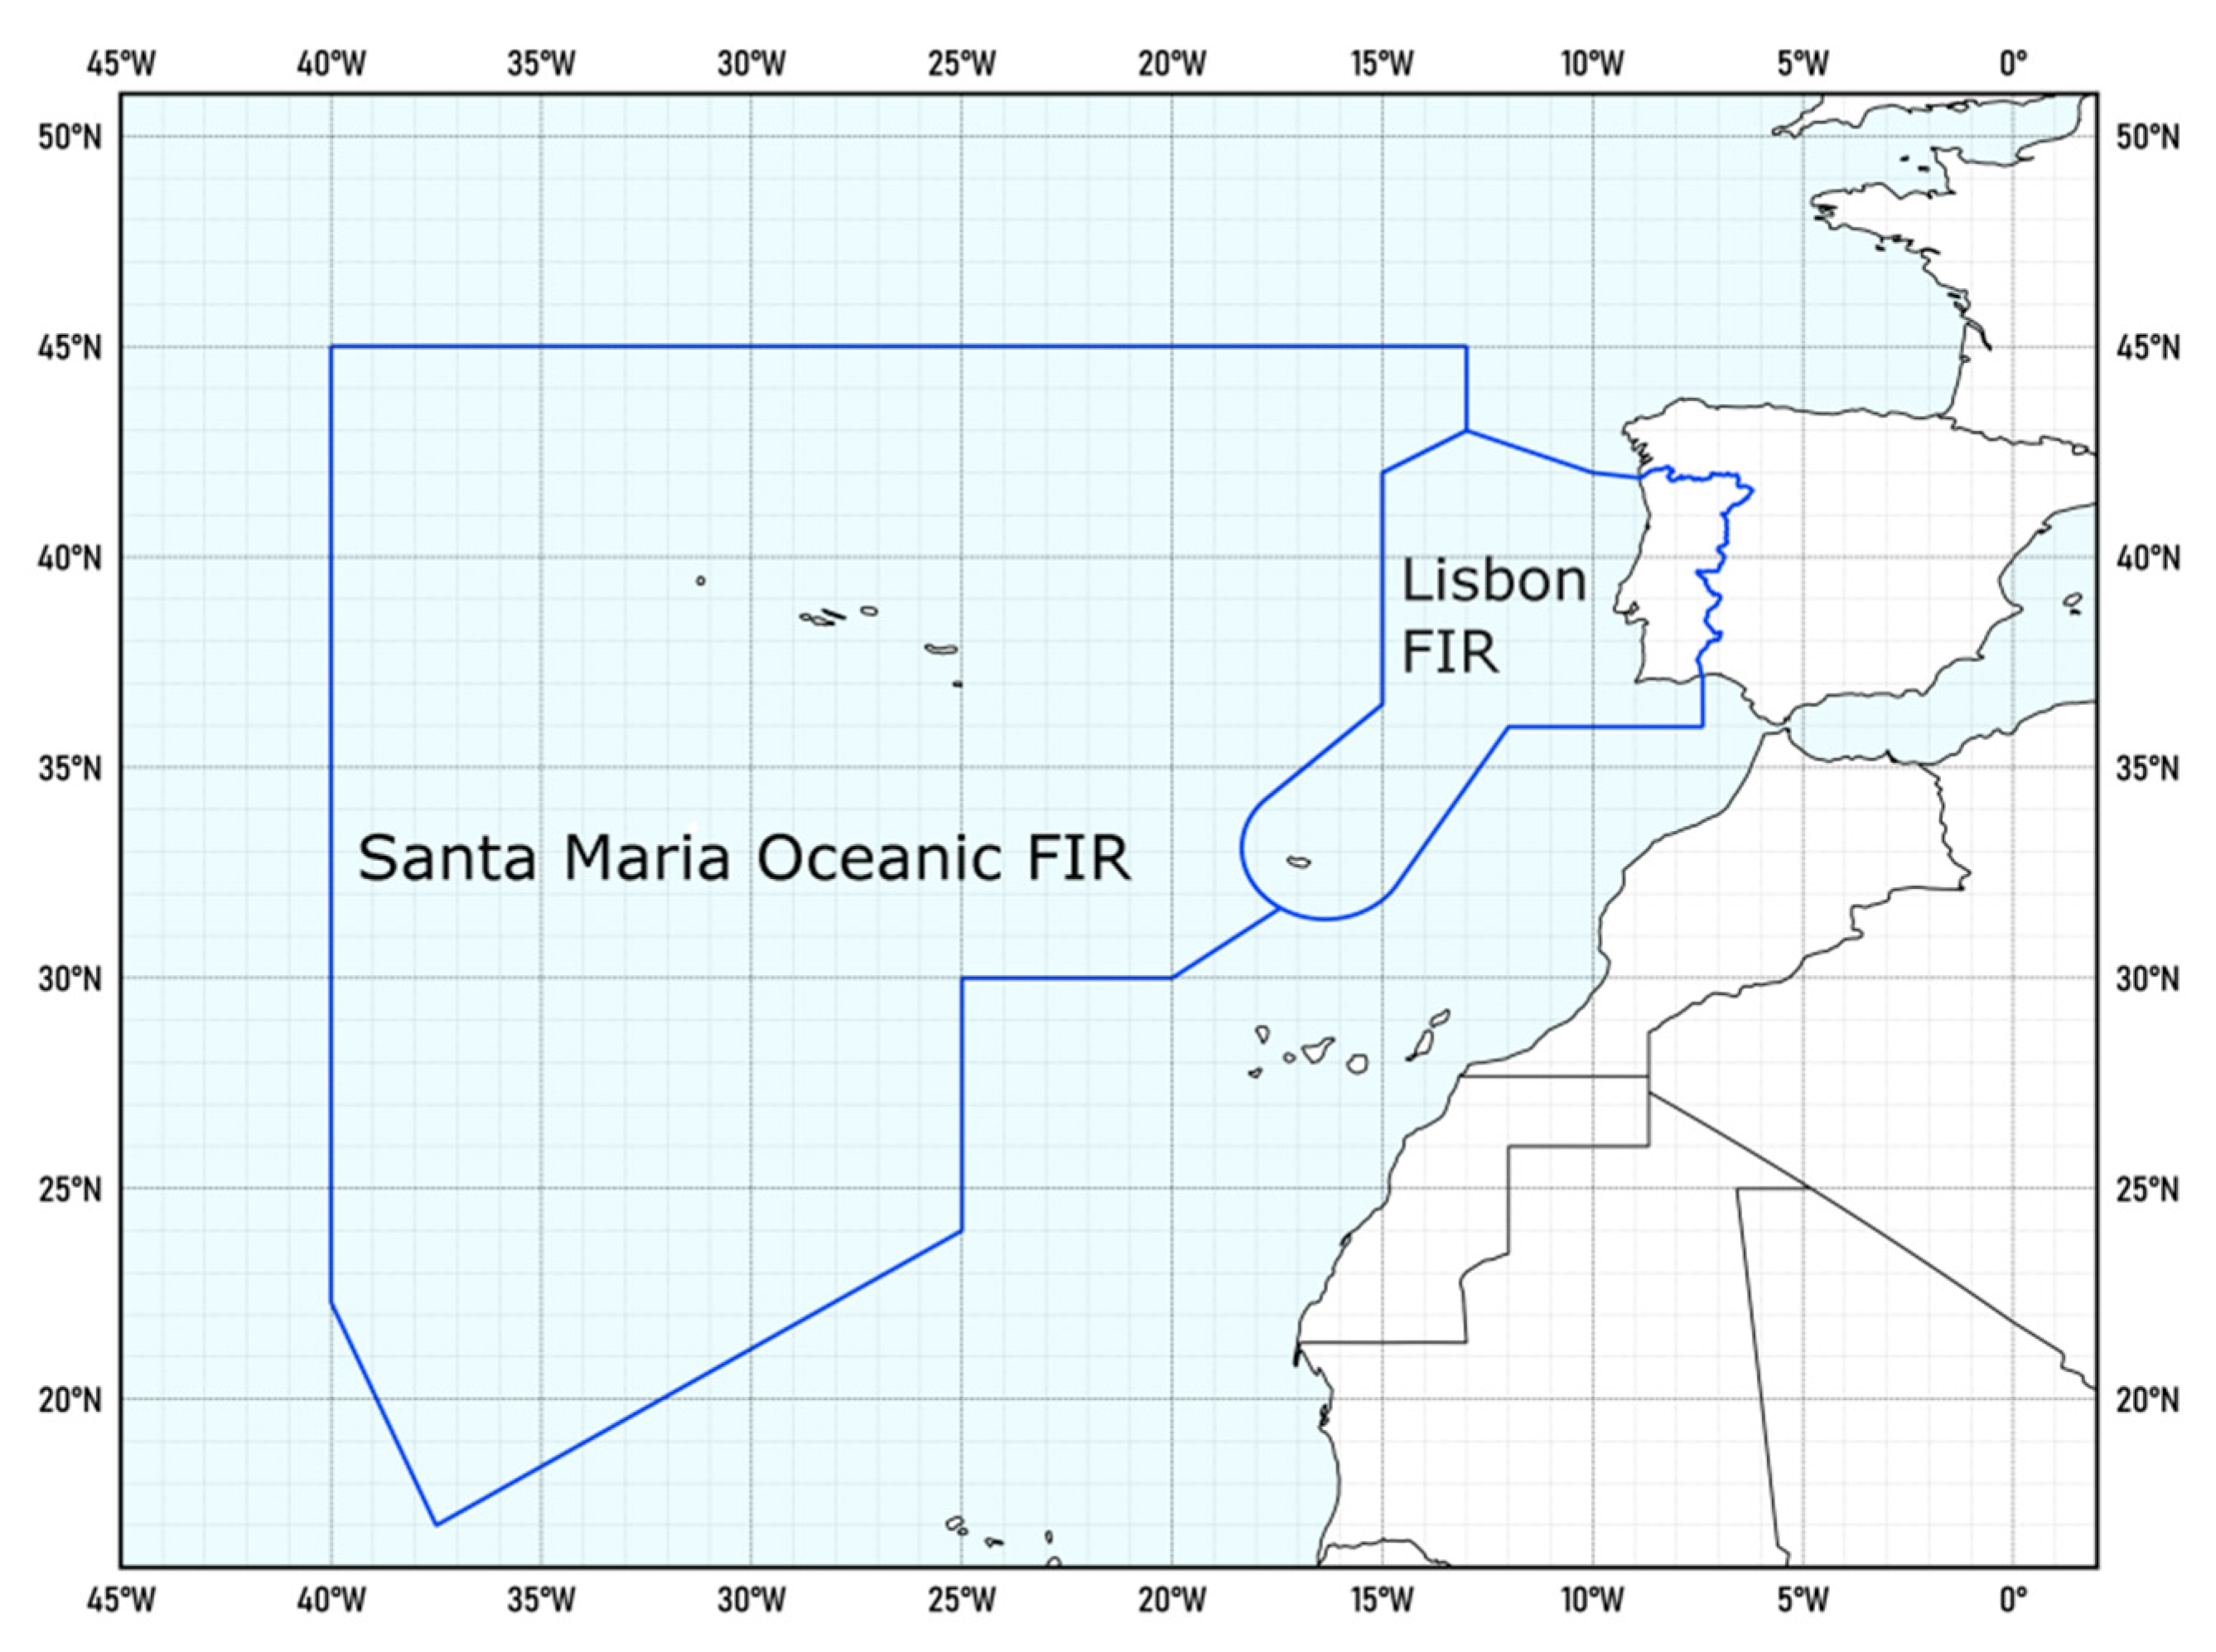
Figure 1. Portuguese flight information regions.
Atmosphere 13 00422 g001
Figure 2. Geographical locations of turbulence encounters, from AIREPs and AMDAR (DEVG values), at altitudes above FL150 (>5 km) for the period from February 2020 to March 2021, excluding May and June. The square and circles represent AIREP data and the triangles represent the DEVG (m s−1) values.
Atmosphere 13 00422 g002
Figure 3. Distribution of turbulence observations by (a) months and (b) altitude. Distribution of moderate turbulence encounters by (c) months and (e) altitude. Distribution of severe turbulence encounters by (d) months and (f) altitude. The number of reports is also included in each figure.
Atmosphere 13 00422 g003
Figure 4. Box-plots of the distribution of: (a) turbulence observations (m s−1), (b) VWS (s−1), (c) ELLROD1 (10−6 s−2), and (d) ELLROD2 (10−6 s−2). These box-plots were constructed for four classes of turbulence (NON, LGT, MOD, and SEV). Statistical parameters in the box-plot are the 95th and 5th percentiles (upper and lower tick marks, respectively), 75th and 25th percentiles (upper and lower boundaries, respectively), and median (line inside the boxes).
Atmosphere 13 00422 g004
Figure 5. Box-plots of the distribution of: (a) EE (10−9 m2 s−3), (b) DUTTON (m s−1 km−1), (c) Richardson number, and (d) DEF (10−6 s−1). These box-plots were constructed for four classes of turbulence (NON, LGT, MOD, and SEV). Statistical parameters in the box-plot are the 95th and 5th percentiles (upper and lower tick marks, respectively), 75th and 25th percentiles (upper and lower boundaries, respectively) and median (line inside the boxes).
Atmosphere 13 00422 g005
Figure 6. Quantiles of observations and (a) SQRT(VWS) and (b) log(CAT1 + 1). The scatters correspond to quantiles (25 and 50 for null turbulence; 50 for LGT; 50, 75, 80, 90, and 95 for MOD and SEV turbulence). The Pearson correlation ( r ) is also indicated.
Atmosphere 13 00422 g006
Figure 7. Variation of 1/ R i , RICH1, and RICH2 with R i .
Atmosphere 13 00422 g007
Figure 8. (a) ROC curves, (b) SEDI, (c) SEDS, and (d) POFD as a function of the threshold for several individual turbulence indicators (lines). The closer the ROC curve is to the upper left corner of the graph, the more skillful the index is. The ROC curves are defined by pairs of POD and POFD, computed for the various thresholds of the NWP-based turbulence indicators.
Atmosphere 13 00422 g008
Figure 9. (a) SEDI and SEDS, regarding the ability to predict MOG turbulence, for different combined indices with coef = 0.25. The values of these scores correspond to their maximum for the threshold that has a BIAS close to 1. (b) Performance of the indices as a function of the value of coef.
Atmosphere 13 00422 g009
Figure 10. (a) ROC curves, (b) TSS, (c) SEDI, and (d) SEDS as function of the threshold. The AUC values are in parentheses in (a).
Atmosphere 13 00422 g010
Figure 11. Skill of TURB IPMA regarding the ability to predict MOG and SEV turbulence. (a) TSS, (b) SEDS, (c) POD, and (d) POFD for different thresholds. In (d) BIAS should read on the right y-axis for MOG (circles) and SEV (open squares) turbulence.
Atmosphere 13 00422 g011
Figure 12. TURBLAYER (top panel) and EDR product from London WAFC (bottom panel), for the FL300/390 layer. Both forecasts are valid at 15UTC on 20 February 2021. The square and the inverted triangle represent, respectively, moderate (MOD) and severe (SEV) turbulence reports above FL350.
Atmosphere 13 00422 g012
Table 1. A simple 2 × 2 contingency table, expressing the joint occurrence of a turbulence index greater than or less than some threshold value fi and an observation greater or less than threshold value oi.
ForecastObservation
Obs < oi (No) Obs ≥ oi (Yes)
Index < fi (No)NNNY
Index ≥ fi (Yes)YNYY
Table 2. Absolute frequency of DEVG and AIREP data. The turbulence observations total 19,342 cases.
AMDAR DEVG (m s−1)AIREP
NON (0–2)LGT (2–4.5)MOD (4.5–7)MOD-SEV (7–9)MODSEV
17,659 1377 76818537
Table 3. Parameters and functions used in the regression for each turbulence indicator in Equation (3).
T u i f u n b b i c c i a i f i
EElog4.313111.604
ELLROD1log4.603110.601
ELLROD2log4.107110.658
VWSSQRT7.2391000−3.995
DUTTONSQRT0.54710−0.131
CAT1log3.533110.488
DEFSQRT2.1410−2.773
GRADTSQRT4.6971000−2.549
CAT2SQRT2.3351000−1.503
Table 4. Combined turbulence indices and their weighting factors.
PredictorAUCCombined Turbulence Index
MULTIMULTI6MULTI5MULTI3
EE0.744 w i   = AUC2 w i   = AUC2 w i   = AUC2 w i   = AUC2
ELLROD10.735 w i   = AUC2 w i   = 0 w i   = AUC2 w i   = 0
ELLROD20.730 w i   = AUC2 w i   = AUC2 w i   = AUC2 w i   = AUC2
VWS0.756 w i   = AUC2 w i   = AUC2 w i   = AUC2 w i   = 0
DUTTON0.746 w i   = AUC2 w i   = AUC2 w i   = AUC2 w i   = AUC2
CAT10.703 w i   = AUC2 w i   = AUC2 w i   = 0 w i   = 0
DEF0.669 w i   = AUC2 w i   = AUC2 w i   = 0 w i   = 0
GRADT0.655 w i   = AUC2 w i   = 0 w i   = 0 w i   = 0
CAT20.620 w i   = AUC2 w i   = 0 w i   = 0 w i   = 0
Table 5. Scores of TURB IPMA concerning the forecast of MOD and SEV turbulence.
ScoresThresholds for MOD Turbulence
44.55 15.255.5
POD0.730.640.520.470.41
POFD0.080.030.020.010.01
BIAS5.422.581.531.200.97
SEDI0.820.800.760.740.70
SEDS0.480.600.640.660.65
ScoresThresholds for Severe Turbulence
4.257.07.57.758
POD0.970.470.310.250.19
POFD0.050.000.000.000.00
BIAS301.420.610.440.31
SEDI0.980.810.740.710.68
SEDS0.450.740.750.740.74
1 Threshold used for MOD turbulence.
Table 6. A 2 × 2 contingency table for the verification of the index TURB IPMA for a threshold of 5. MOG turbulence is considered an event. In this case, the base rate is 0.016.
ForecastObservation
NoYes
T U R B I P M A < 5 (No)18,727148
T U R B I P M A ≥ 5 (Yes)310158
Publisher’s Note: MDPI stays neutral with regard to jurisdictional claims in published maps and institutional affiliations.