Article

Comparison of COSMIC and COSMIC-2 Radio Occultation Refractivity and Bending Angle Uncertainties in August 2006 and 2021

1
COSMIC Program, University Corporation for Atmospheric Research, Boulder, CO 80301, USA
2
Danish Meteorological Institute, DK-2100 Copenhagen, Denmark
*
Author to whom correspondence should be addressed.
Atmosphere 2022, 13(5), 790; https://doi.org/10.3390/atmos13050790
Submission received: 4 April 2022 / Revised: 3 May 2022 / Accepted: 10 May 2022 / Published: 12 May 2022
(This article belongs to the Special Issue Advances in GNSS Radio Occultation Technique and Applications)

Abstract

:
We compare the random error statistics (uncertainties) of COSMIC (Constellation Observing System for Meteorology, Ionosphere and Climate, C1) and COSMIC-2 (C2) radio occultation (RO) bending angles and refractivities for the months of August 2006 and 2021 over the tropics and subtropics using the three-cornered hat method. The uncertainty profiles are similar for the two RO missions in the troposphere. However, a higher percentage of C2 profiles reach close to the surface in the moisture-rich tropics, an advantage of the higher signal-to-noise ratio (SNR) in C2. C2 uses signals from both GPS (Global Positioning System) and GLONASS Global Navigation System Satellites (GNSS). The GPS occultations show smaller uncertainties in the stratosphere and lower mesosphere (30–60 km) than the GLONASS occultations, a result of more accurate GPS clocks. Therefore, C2 (GPS) uncertainties are smaller than C1 uncertainties between 30–60 km while the C2 (GLONASS) uncertainties are larger than those of C1. The uncertainty profiles vary with latitude at all levels. We find that horizontal gradients in temperature and water vapor, and therefore refractivity, are the major cause of uncertainties in the tropopause region and troposphere through the violation of the assumption of spherical symmetry in the retrieval of bending angles and refractivity.

1. Introduction

Since the launch of the GPS/Meteorology (GPS/MET) mission in 1995 [1], radio occultation (RO) using the Global Navigation Satellite System (GNSS) has become an important satellite remote sensing technique to observe the atmosphere, including the ionosphere, stratosphere, and troposphere. The Constellation Observing System for Meteorology, Ionosphere and Climate (COSMIC, also called FORMOSAT-3 in Taiwan), launched in 2006, became the first RO mission to provide a sufficient number of global observations per day (2500–3000) to make a significant positive impact on global numerical weather prediction (NWP) [2,3,4,5,6,7,8,9,10,11,12,13,14]. Subsequent RO observations from MetOp, KOMPSAT-5, and others, and recently commercial missions, provide additional RO observations that have contributed to operational NWP and research. RO observations have also made significant contributions to climate science because of their stability, high vertical resolution, and relatively small biases (e.g., [15,16,17,18]. Ho et al. [19] provide a review of COSMIC accomplishments and discuss future RO challenges.
On 25 June 2019, COSMIC-2 (C2) was launched. Representing a significant step forward in RO observations of the tropics and subtropics [20], C2 provides more than 5000 vertical profiles of bending angles and refractivities per day. Compared to COSMIC (C1) and other RO missions, C2 has a higher signal-to-noise ratio (SNR), which results in a larger percentage of profiles reaching close to the surface in the moist tropics [20,21]. Here, SNR is defined as the ratio of the signal to receiver thermal noise at the top of the atmosphere (60–80 km) [20]. It is measured in v/v and is determined by antenna gain, the GNSS transmitter power, receiver noise, local multipath (signals scattered off the spacecraft near the antenna), and observational geometry [22,23]. SNR is a factor, but not the only one, in determining the total RO retrieval uncertainty (random error statistics) in bending angle (BA) and refractivity (N), which are calculated farther down in the processing chain [24,25].
To effectively use observations in research, calibration and validation of other observations, and operational NWP, it is important to know and understand their random and bias error statistics. In NWP data assimilation, observations are inversely weighted by their random error covariances [26,27]. Biases in observations are reduced by careful calibration of instruments or bias corrections. However, estimating random errors (uncertainties) or biases is difficult because the truth is never known and in fact depends on the spatial and temporal scales (footprints) of the atmospheric volume being considered. Thus, errors are often estimated by comparing observations or model data sets with another trusted data set. RO errors have been estimated by comparison with radiosondes [28,29,30,31,32,33], other satellite soundings [34,35,36,37], aircraft observations [38], and models [39,40,41,42].
Methods for estimating RO error statistics include the apparent error method using the difference between observations and short-range model forecasts [28,43]. The Desroziers method [26] uses observation-minus-background (O-B) and observation-minus-analysis (O-A) statistics to estimate observation error statistics in operational forecast models. The three-cornered hat (3CH) method uses three data sets (observations and/or models) together in triplets to estimate the uncertainties of each data set simultaneously [39,40,41]. Although the two methods may appear quite different, the Desroziers and the 3CH methods give identical estimates of the observational error variance in models with an optimal data assimilation system if the 3CH method uses the background and analysis data sets from the model used to assimilate the observations as the two ancillary data sets in the 3CH triplets [44]. Semane et al. [42] found close agreement between the uncertainty estimates of C2 using the Desroziers and 3CH methods with different ancillary data sets.
This study extends the previous studies comparing C2 with C1 of [20,21,45]. Schreiner et al. [20] compared C2 data in October 2019, shortly after launch, to radiosondes (RS), short-term forecasts from the European Centre for Medium-Range Weather Forecasts (ECMWF), the National Centers for Environmental Prediction (NCEP), and the MERRA-2 (NASA Modern-Era Retrospective Analysis for Research and Applications version 2) reanalysis using the 3CH method and found that the refractivity uncertainty statistics for C2 were similar to those from C1 obtained by [39]. In a more extensive study, [21] Ho et al., compared C2 BA, N, and temperature and water vapor (derived from a one-dimensional variational procedure) to C1 and other RO missions as well as more than 3000 Vaisala RS41 RS that were co-located within 300 km and 2 h of the RO profiles. They found somewhat closer agreement between the C2 and RS water vapor values, but in general they concluded that “the COSMIC-2 data quality in terms of stability, precision, accuracy, and uncertainty of the accuracy is very compatible with those from COSMIC-1.” However, in agreement with [20], they found that the C2 profiles penetrated closer to the surface than C1 and other RO missions, and that the penetration depth increased with increasing SNR.
Another difference between the C1 and C2 missions is that C2 uses GLONASS as well as GPS. Larger GLONASS clock errors result in larger BA standard deviations (STD) from climatology between 60 and 80 km [20] (As noted in [20], these errors can be reduced by reducing the clock interpolation intervals from 30 s, which is currently used in the near-real-time CDAAC processing, to 1 s). The effect of these larger clock errors on the 3CH uncertainty estimates in the 30–60 km altitude range are significant, as shown below in Section 5.4. Comparisons of C2 with C1 in which the C2 sample contains both GPS and GLONASS are thus biased in favor of C1 in the stratosphere and lower mesosphere. Therefore, when comparing C2 and C1 in this paper, we use only C2 GPS occultations.
In this paper, we compare the random error statistics of C1 and C2 BA and N from the surface to 60 km using the 3CH method for the month of August in 2006 and 2021. The C1 and C2 missions did not overlap in time sufficiently to produce enough collocated observations for a comparison of a large identical sample [21], so we use the same month in different years in which there are abundant C1 and C2 observations. This comparison will provide insight into the differences in RO data produced by missions with different SNRs and further elucidate the error characteristics of these two RO data sets.

2. Summary of Three-Cornered Hat Method and the Data Sets

2.1. Three-Cornered Hat Method of Estimating Error Statistics

The three-cornered hat (3CH) method estimates the error variances of three different datasets X, Y, and Z that are collocated in space and time. The data sets may be different observations or models, or a combination of observation and model data. The exact equations for the random error variances (uncertainties) are [40]:
Var err X = 1 2 { E [ X Y 2 ] + E [ X Z 2 ] E [ Y Z 2 ] } 1 2 b X Y 2 + b X Z 2 b Y Z 2 + E ε X ε Y + E ε X ε Z E ε Y ε Z
where ε denotes the random errors and b the mean biases between two data sets, e.g., bXY = E[XY]. The expressions for Y and Z are similar and are given in [40]. The error variance estimates for each data set are computed from (1) by neglecting the unknown error covariance terms, which occur as a result of correlations of errors among the three data sets. The details and the possible sources of error correlations are presented in [40,41].
The collocation process is the most difficult part of the 3CH process and must be done carefully to minimize errors introduced by the temporal and spatial (horizontal and vertical) interpolations. To collocate the model data sets to the RO locations, the model temperature and water vapor are interpolated in space and time to the RO locations taking into account the tangent point drift of the occultation as in [41].

2.2. Data Sets

Estimating the uncertainties of C1 or C2 using the 3CH method requires two independent ancillary data sets. The accuracy of the 3CH method (as with any method comparing two or more data sets) depends on zero or negligible correlations of random errors between the different data sets. Thus, for the C1 and C2 uncertainty estimates, we choose ancillary model data sets that do not assimilate these observations.
For both 2006 and 2021, we use the ECMWF fifth-generation reanalysis (ERA5) and MERRA-2 reanalysis. Both reanalyses assimilate C1 data, but we use MERRA-2 six-hour-old analyses and ERA5 short-term (6–18-h) forecasts that are initialized prior to the time of the observations being studied, in order that they will not have assimilated the observations in the sample, and hence their random errors and those of the observations being evaluated should be nearly uncorrelated.
Although neither of the model data sets should have significant error correlations with C1 or C2, they may have some error correlations with each other. These can occur through similar vertical and horizontal footprints (representativeness) or, as discussed in [41], because the reanalyses assimilate many of the same observations and have similar physics. Thus, there may be some correlation of errors and resulting error covariances between ERA5 and MERRA-2.
We have found through many 3CH experiments that the uncertainty estimates of one data set in the 3CH triplets are not sensitive to small variations in the uncertainties of the other two data sets in the triplet. Therefore, the use of short-term forecasts or somewhat earlier analyses of these ancillary data sets, while producing slightly larger uncertainty estimates of these data sets, does not significantly affect the estimates of the first data set (C1 or C2).

2.2.1. COSMIC and COSMIC-2 Radio Occultation Bending Angles and Refractivities

The C1 and C2 RO observations are processed by the COSMIC Data Analysis and Archive Center (CDAAC) described in https://cdaac-www.cosmic.ucar.edu/cdaac/doc/overview.html (accessed on 4 March 2022). The high-resolution atmPrf data are used for both C1 and C2. The C1 data are the data reprocessed in 2021, and C2 data are the data processed in near-real time. The 2021 version of C1 is processed using a number of changes from the 2013 processing and is described in [46]. One change is in the lowest level of the reported bending angle and other products: a less conservative approach is taken, which increases the percentage of C1 profiles reaching the lowest levels compared to the 2013 version.
The latitudinal distribution of C1 and C2 is quite different, as shown in [21], with C1 in a polar orbit having a minimum at the Equator, and C2 in an equatorial orbit having a maximum at the Equator. Because RO errors vary with latitude [41], these different distributions will affect the comparison unless the samples are corrected to make the distributions consistent. To do this, we adjust the number of C1 and C2 observations in each 5° latitude band to make the percentages of C1 and C2 in each latitude band equal. We do not compute the statistics poleward of 45° where the number of C2 observations is small.

2.2.2. ERA5 (ECMWF Reanalysis Fifth Generation)

ERA5 is the fifth-generation ECMWF reanalysis [47] replacing ERA-Interim. It has a horizontal resolution of 31 km and 137 levels, with a top at 0.01 hPa (approximately 80 km). Because ERA5 assimilates C1 data, we use short-term forecasts initialized 6–18 h prior to the time of the RO observation in the 3CH calculations.

2.2.3. MERRA-2 Reanalysis

MERRA-2 is currently NASA’s most recent reanalysis [48]. It has a horizontal resolution of 55 km and 72 vertical levels, with a top at 0.01 hPa. Because it assimilates C1 data, we use a 6-h-old MERRA-2 analysis for the C1 and C2 uncertainty estimates to avoid error correlations with C1.

3. Sources of Radio Occultation Errors

In this section, we summarize the main sources of errors in RO observations of bending angles and refractivities based on previous studies, which provide more detail (e.g., [22,23,25,28,49,50,51,52,53,54]. Table 1 summarizes the main sources of RO random and bias errors, as well as additional factors that affect the estimates of these errors when RO retrievals are compared with other data sets.
Above 30 km, errors are highly variable from occultation to occultation and are dominated by receiver thermal noise, which is directly related to SNR and other measurement errors and residual ionospheric errors (RIE), which are not affected by SNR. The RIE, which depend on ionospheric disturbances and horizontal asymmetries in the ionosphere, vary with latitude and solar and local diurnal cycles [22,23,54,55,56,57]. The use of climatological data for optimization of the BA for calculation of refractivity is another source of uncertainty above 30 km [58]. Because the magnitude of the true BA decreases exponentially with altitude, while the errors remain relatively constant above 30 km, the relative errors (ratio of errors to true value) increase and at some point (above 50 km) exceed 100% [28,51,59,60].
Kursinski et al. [22] indicate that the greatest RO accuracy and smallest uncertainties are expected between 5 and 30 km. The high accuracy and precision in this region (the so-called RO “sweet spot”) has been confirmed by many studies using real RO data [21,28,39,41].
In the upper troposphere–lower stratosphere (UTLS, 10–20 km mean sea level (MSL) altitude), horizontal gradients in temperature and the transition from geometric optics to wave optics in the retrievals, which varies with the processing center, create uncertainties. In the troposphere, horizontal gradients in temperature and moisture and superrefraction (ducting) cause errors, especially in the moist lower troposphere [51]. Strong vertical gradients of temperature or water vapor, such as those that occur near the top of the atmospheric boundary layer (ABL), can cause vertical refractivity gradients to exceed the critical -157 N-units per km that indicates superrefraction.
Since early studies such as [61], many studies have shown that atmospheric inhomogeneities and spatial variability (horizontal gradients and vertical perturbations in temperature and water vapor and therefore refractivity) are important in creating RO uncertainties (e.g., [22,23,28,50,51,52,62,63,64,65,66]. In a spherically symmetric atmosphere, each ray has a unique impact parameter that is constant along the ray [67]. Departures from spherical symmetry cause variations in the impact parameter along a ray and errors in the retrieved bending angles in the early stages of the retrieval process. These departures cause corresponding errors in refractivity, which is computed from bending angles using the Abel transform under the assumption of spherical symmetry [62,64,68]. Healy [64], in retrieval simulations using ray tracing and mesoscale model data, found that horizontal gradients caused significant errors in the impact parameter (~100 m), bending angle (~3–10%), and refractivity (~1.0%) in the lower troposphere.
If RO observations are interpreted as profiles of in situ measurements along the tangent points (as we do in this paper), the errors due to a lack of spherical symmetry can be attributed to the observations. In data assimilation, such errors can be reduced by using observation operators that more accurately simulate how the observations are made, e.g., by two- or three-dimensional forward modeling [3,62,69]. Therefore, using less sophisticated observation operators in data assimilation (e.g., the Abel transform), such errors should be attributed to the observation operator [24,51]. Whether they are attributed to the observations or to the observation operator [70] is a matter of definition that depends on the context in which the data are used. In any case they can be considered to be errors of representativeness, and when interpreting the RO observations as in situ measurements, these errors of representativeness dominate in the troposphere and lower stratosphere.
When RO errors are estimated by comparing two or more data sets, representativeness differences can be an important factor. In addition to the representativeness errors due to lack of spherical symmetry and forward modeling, there are also representativeness differences due to different footprints of the RO and other data sets. These representativeness differences occur because different observing systems represent averages of atmospheric properties over different horizontal and vertical scales; they are not related to the fundamental or intrinsic errors of any data set. Representativeness differences are largest where the atmospheric temporal and spatial variability, which is related to horizontal and vertical gradients, is greatest. Large gradients are common in the ABL and UTLS, but can occur anywhere in the troposphere with fronts or in the stratosphere with gravity waves.
Because of interest in how the uncertainties in RO may be reduced in future missions, as well as interest in the effect of the signal-to-noise ratio (SNR) on RO quality, it is important to discuss how the various sources of uncertainty in Table 1 are affected by SNR. Higher SNR reduces the receiver thermal noise [52] and tracking errors, but has little or no effect on the other sources of uncertainty, in particular the effect of ionospheric residuals, horizontal gradients of temperature and moisture, and representativeness differences. Thus, while higher SNR leads to deeper penetration into the lower moist troposphere, higher SNR may not lead to smaller overall RO uncertainties. In fact, because higher SNR produces more observations in the difficult-to-observe parts of the atmosphere—those often containing large horizontal gradients—the statistics of high SNR RO data may indicate higher uncertainties than those with low SNR.

4. Atmospheric Structure during August 2006 and 2021

In comparing two samples of RO observations, it is important that the atmospheric conditions be similar. In this section, we compare the mean temperature and water vapor structures during the months of August 2006 and 2021. We also show vertical profiles of the STD of the bending angles and refractivities as well as the means and the STD of the horizontal gradients of refractivity and bending angles for the August 2021 data because these are related to their error statistics.
Figure 1a–d shows vertical cross sections of zonal mean temperature and specific humidity for August 2006 and 2021 from 50° S to 50° N. Figure 1e,f shows the corresponding differences. The mean temperature cross section shows an asymmetric hemispheric structure in the troposphere with warmer air in the Northern Hemisphere. The temperature differences in the troposphere are less than 1.5 K, but are larger in the stratosphere and mesosphere (up to 5 K colder in some places). The temperature difference structure is likely related to the phase offset of the quasi-biennial oscillation (QBO, [71]. The QBO in 2006 was in the westerly phase throughout the 40–60 km range, while it was transitioning to the easterly phase in 2021. The specific humidity cross section shows a strong latitudinal variation, with a maximum between 10° N and 20° N. The differences in zonal mean specific humidity between 2021 and 2006 are all less than 1.0 g/kg.
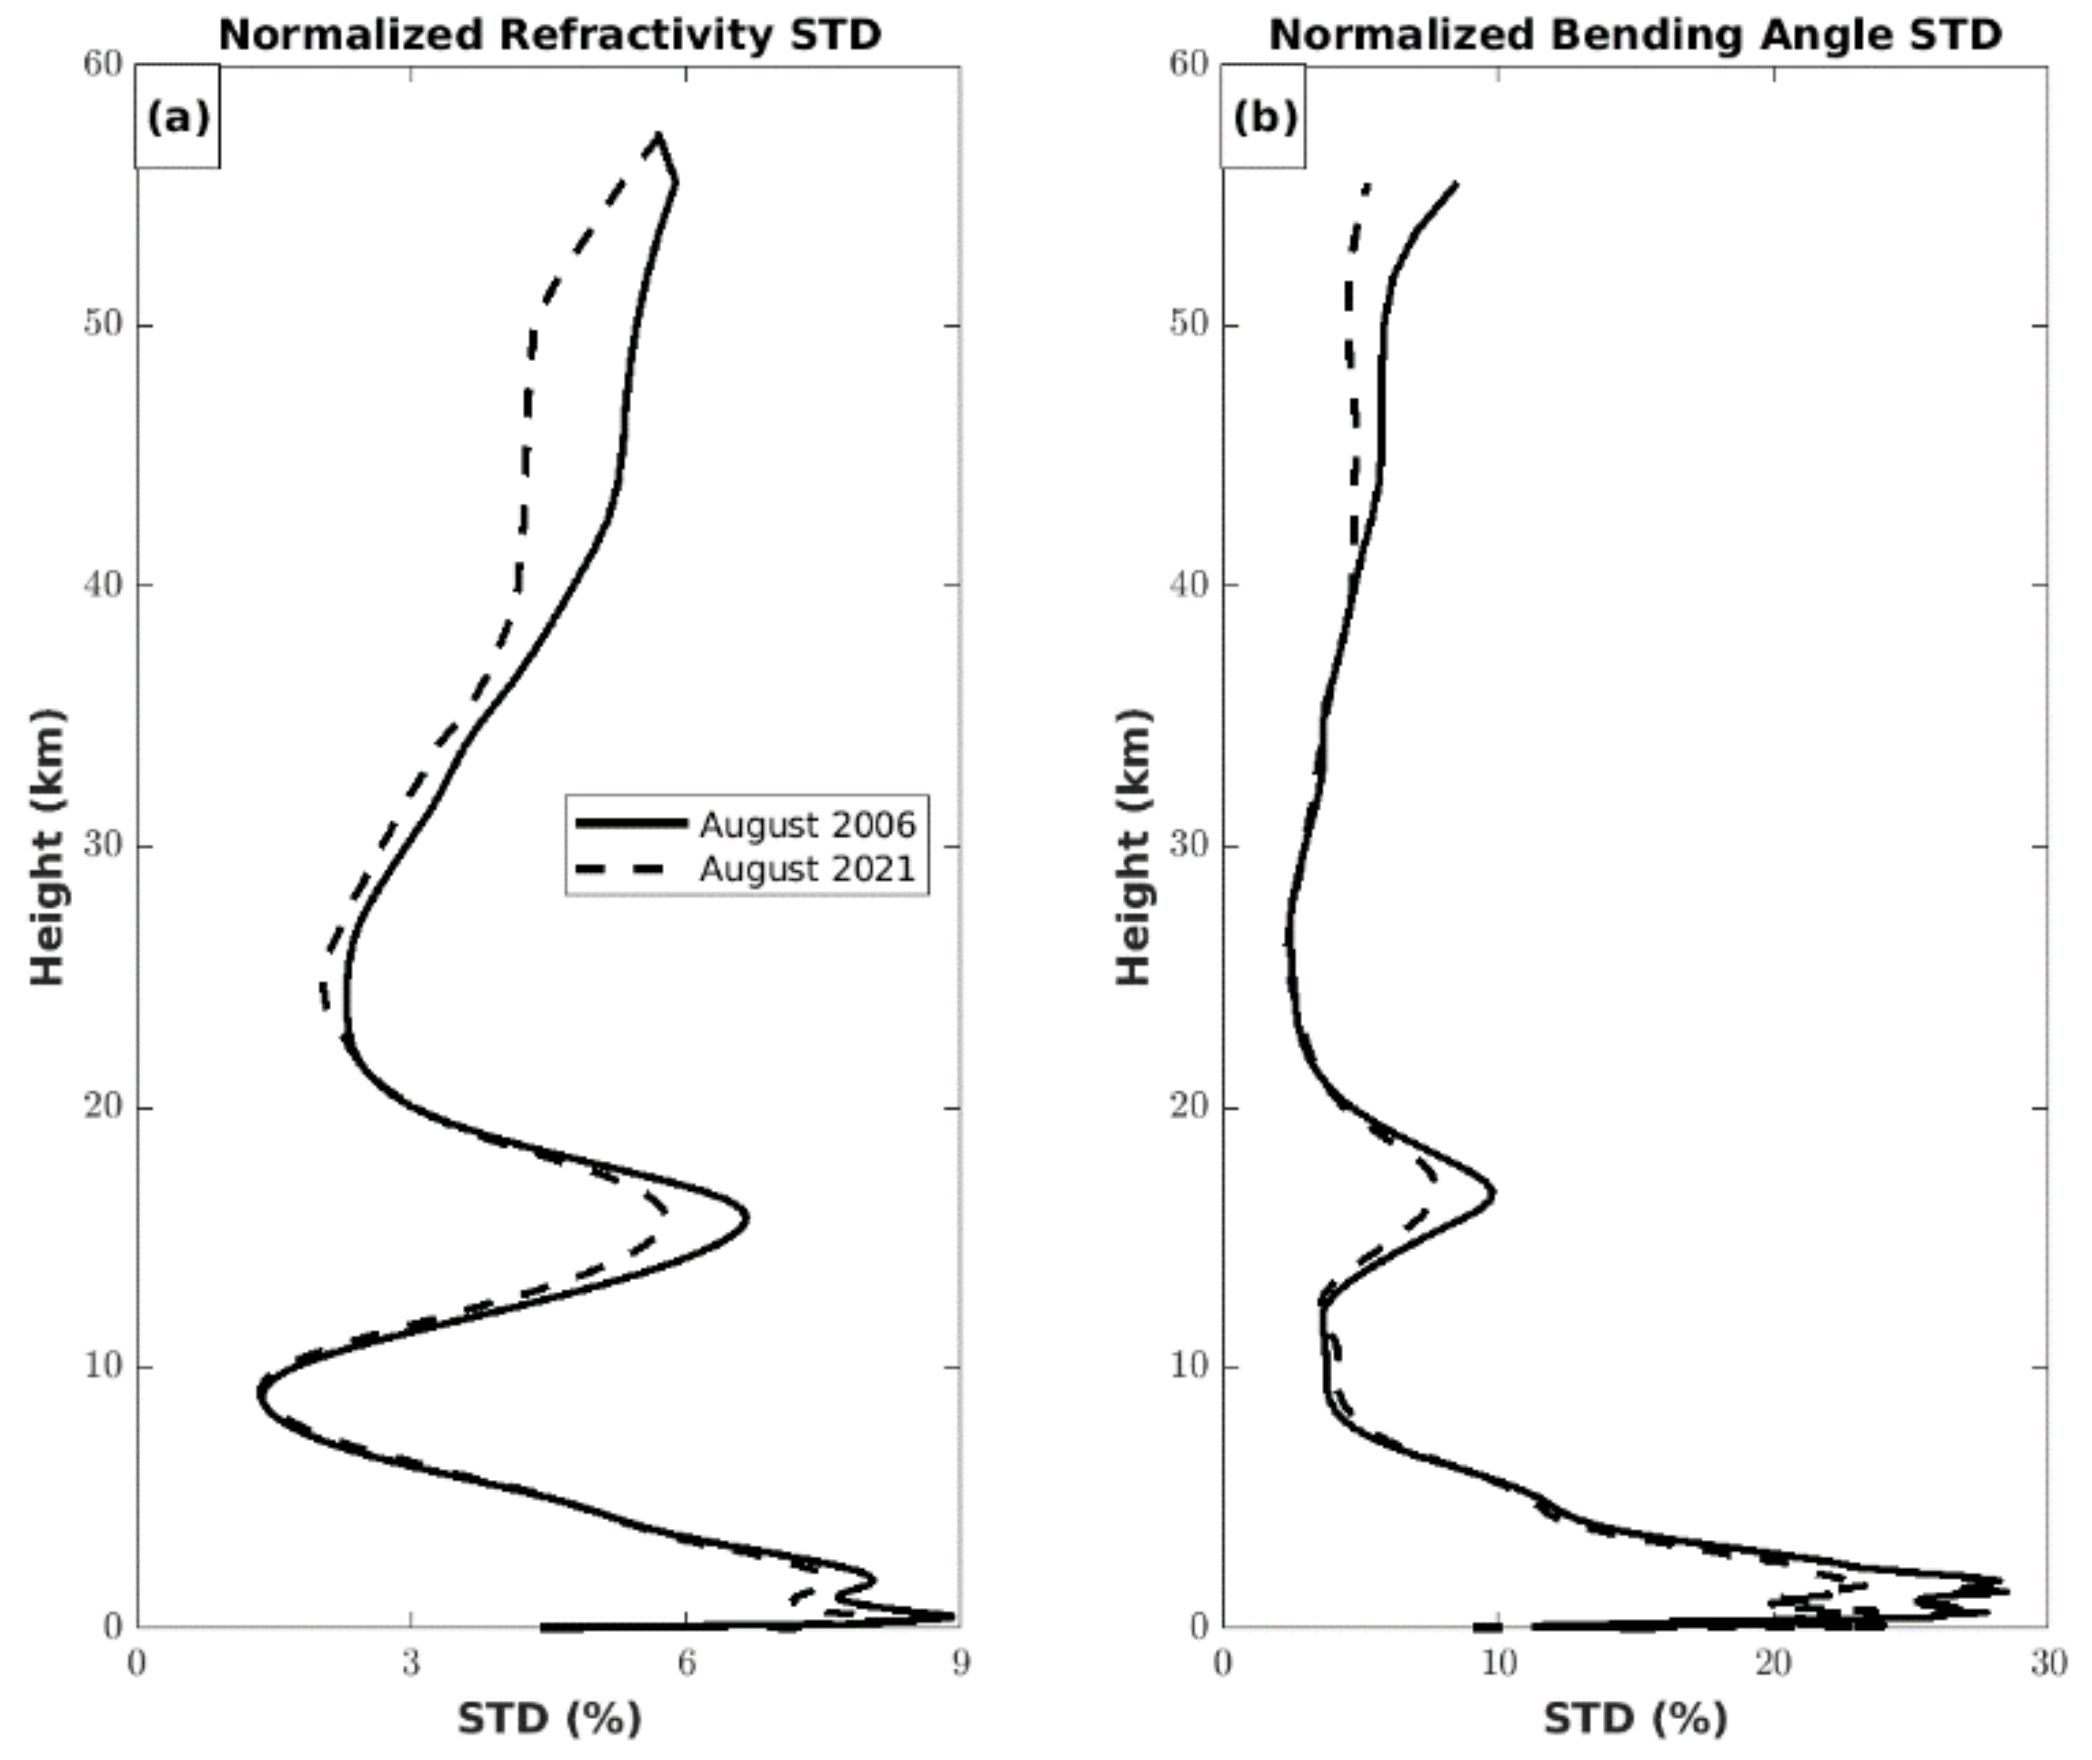
Uncertainties in all data sets are related to atmospheric variability in space and time. Where the atmosphere is highly variable, the uncertainties of models and observations are greater than in quiet, undisturbed regions of the atmosphere. To illustrate this variability, we show vertical profiles of the normalized ERA5 refractivity and bending angle standard deviations for the August 2006 and 2021 samples in Figure 2. Three layers of high variability are seen: ABL 0–3 km, UTLS 10–20 km, and above 40 km (likely due to gravity waves). These profiles have a similar vertical structure to the estimates of RO uncertainty found in previous studies and in this study, as shown in the next section, with maxima near the top of the ABL, a minimum around 8 km, a small maximum in the tropopause region, and an increase from 30–60 km.
The regions of high variability are also regions of large horizontal gradients of refractivity and the associated lack of spherical symmetry. As discussed in the previous section, horizontal inhomogeneities cause significant uncertainties in the tropopause region and the lower troposphere. We computed the mean and standard deviations of the horizontal gradients of temperature, specific humidity, and refractivity by 10° latitude bands for August 2021 from ERA5. The horizontal gradients are computed at each grid point in the ERA5 data interpolated to constant MSL height surfaces according to
A = [ Δ A / Δ X 2 + Δ A / Δ Y 2 ] 1 / 2
where A is temperature, specific humidity, or refractivity and ∆X and ∆Y are distances corresponding to 2° latitude and longitude spacing.
Figure 3 shows vertical profiles of the mean and STD of the horizontal gradients of temperature, specific humidity, and normalized N for five latitude bands. The average temperature gradients and their STD vary from approximately 0.5 to 2 K per 100 km throughout the entire troposphere and stratosphere. The specific humidity gradients and their standard deviations are a maximum of about 2 g/kg per 100 km in the lower troposphere. These gradients determine the N gradients, which are at a maximum around 2 km, decrease upward to a minimum around 10 km, and then increase slowly upward. The maximum N gradients of between about 6 and 13 N units/100 km are similar to the values in [69]. The N profiles show secondary maxima in the UTLS (approximately 12–18 km). There is considerable variation of the N gradient with latitude in the troposphere for this month, with largest gradients between 30–50° N and smallest gradients in the high southern latitudes (30–50° S). As shown later, the vertical structure of the N gradient is similar to that of the error estimates of the RO BA and N in the troposphere and lower stratosphere, indicating that the errors due to the lack of spherical symmetry dominate the causes of RO uncertainties throughout this region.

5. Comparison of COSMIC and COSMIC-2

5.1. Penetration Depths of COSMIC and COSMIC-2

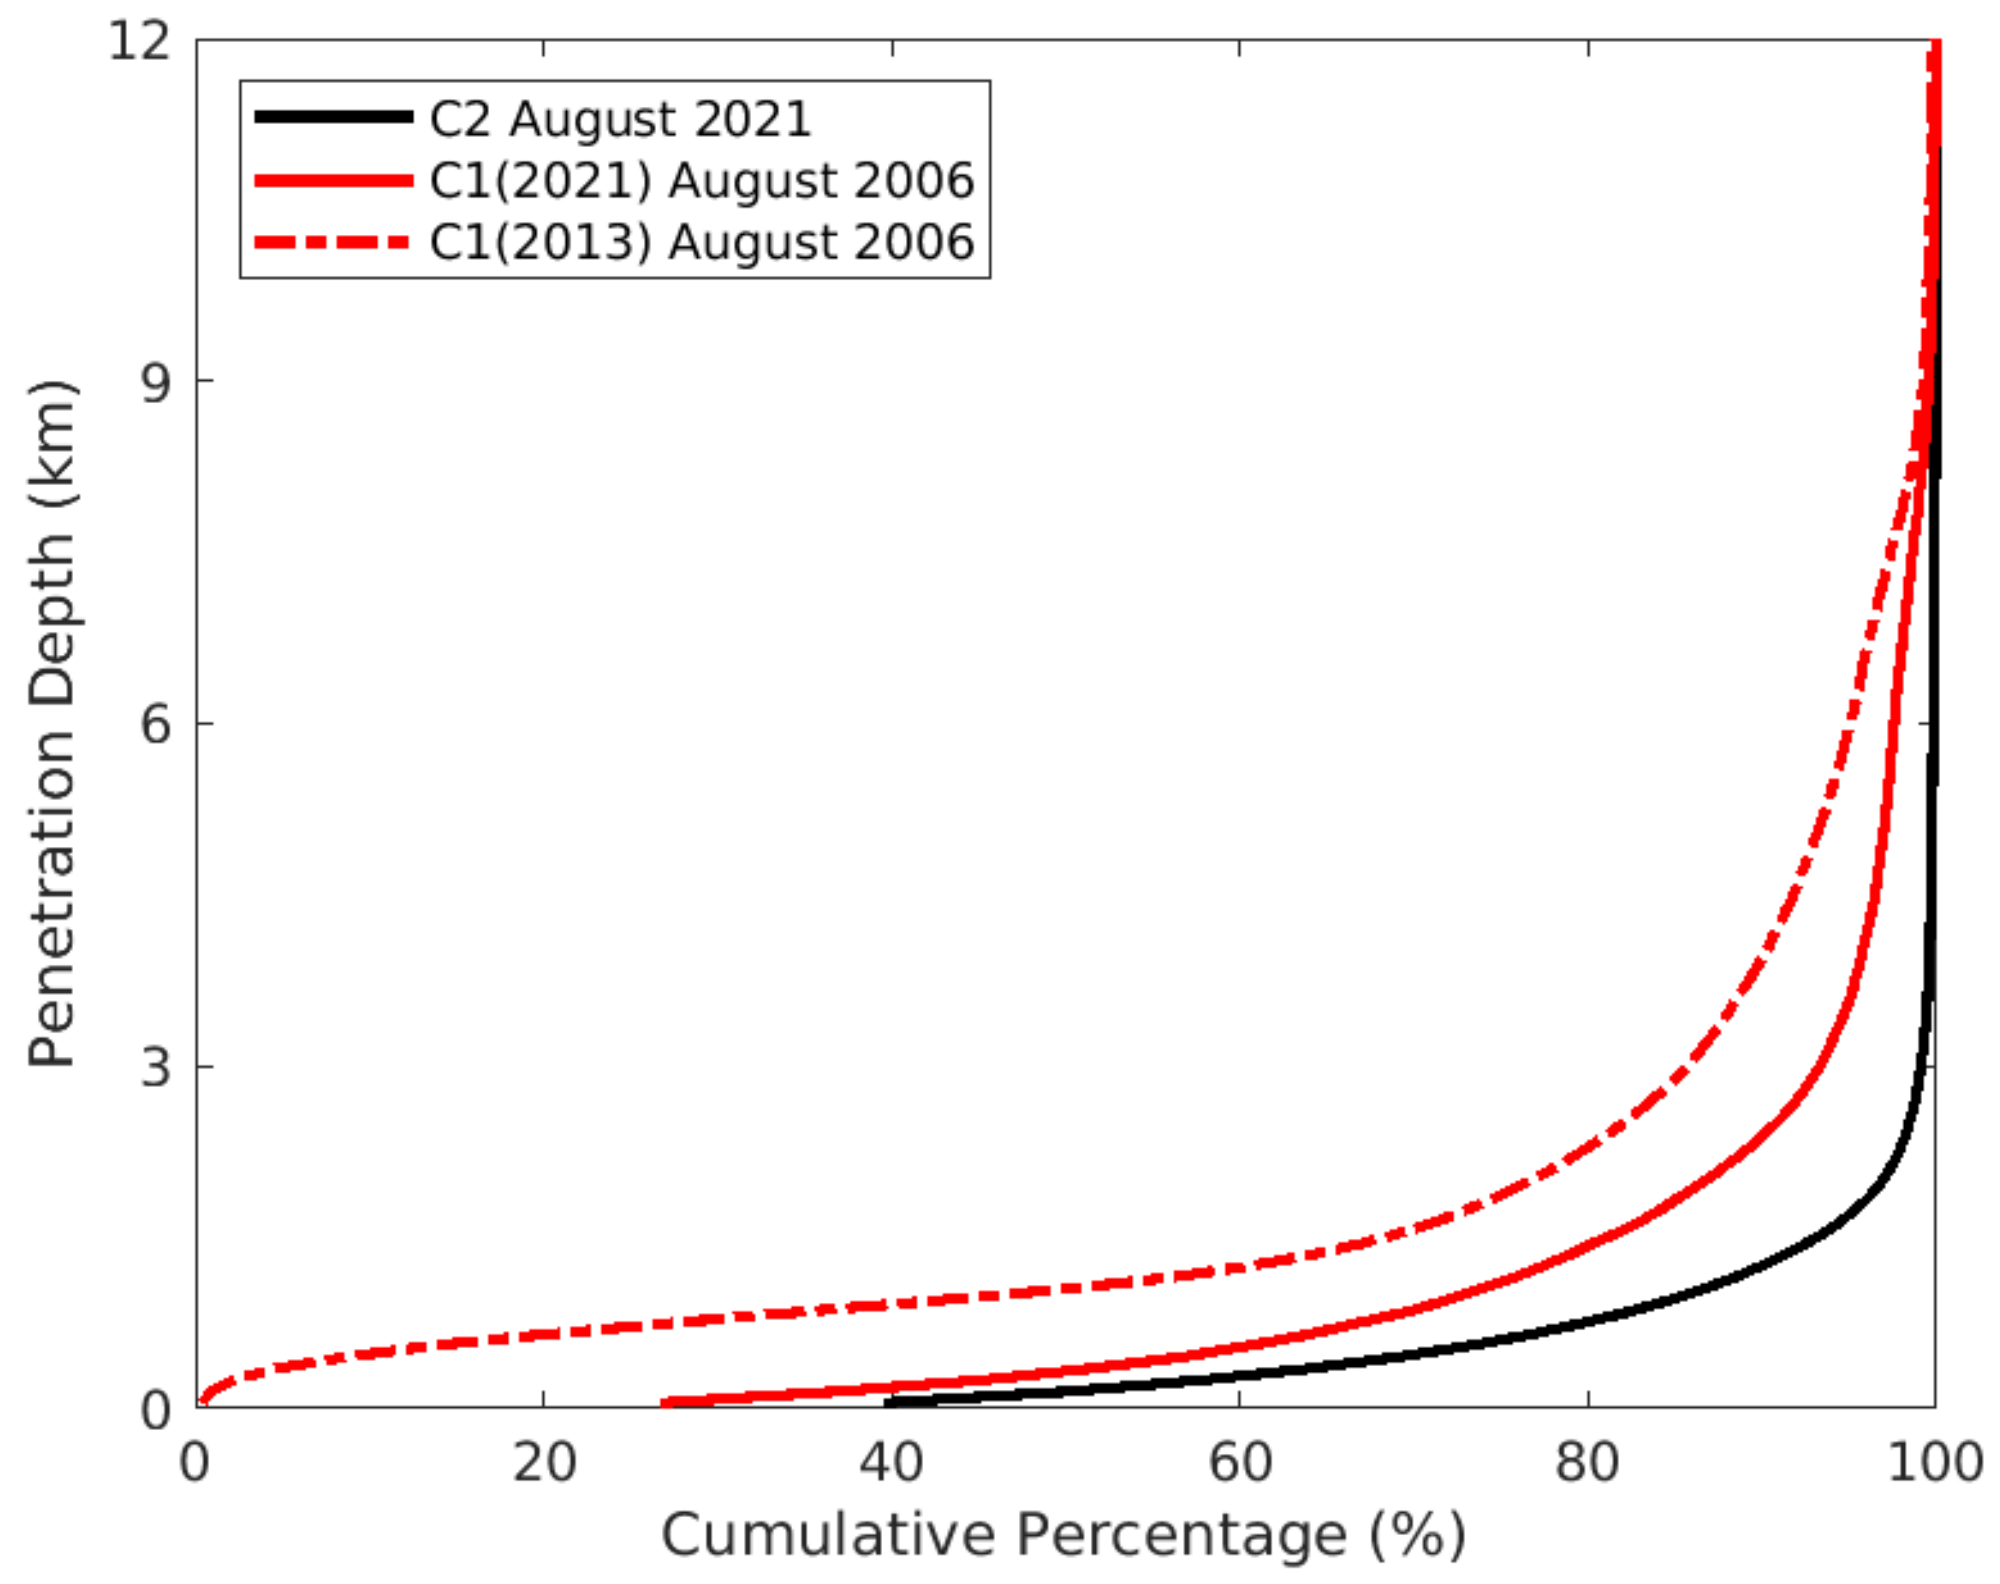
As discussed above, high SNR is important in determining the penetration depth of RO soundings in the moist lower troposphere. Figure 4 compares the cumulative percentage of C1 and C2 (both GLONASS and GPS) profiles reaching each level. Two versions of the CDAAC processing for C1 are shown; the 2021 version (solid red) shows deeper penetration than the 2013 version (dashed red profile). However, a substantially higher percentage of the higher SNR C2 profiles reach all levels below 9 km compared to both of the lower SNR C1 profiles, with 50% of all C2 profiles reaching within 200 m of the surface. These results agree with [20] and confirm the importance of high SNR in occultations reaching close to the surface.

5.2. Differences between C2 GPS and GLONASS Uncertainties

In this section we consider the effect of the larger GLONASS clock errors, which contribute to the RO measurement errors, compared to those of GPS. Sokolovskiy et al. [45] and Ho et al. [21] found little difference in the RO refractivity retrievals in the troposphere, but the effect of clock errors was not significant in the troposphere. As noted above, Schreiner et al. (2020) found larger bending angle standard deviations between 60–80 km for GLONASS compared to GPS. However, they did not show how these differences affect the uncertainties in the stratospheric RO profiles.
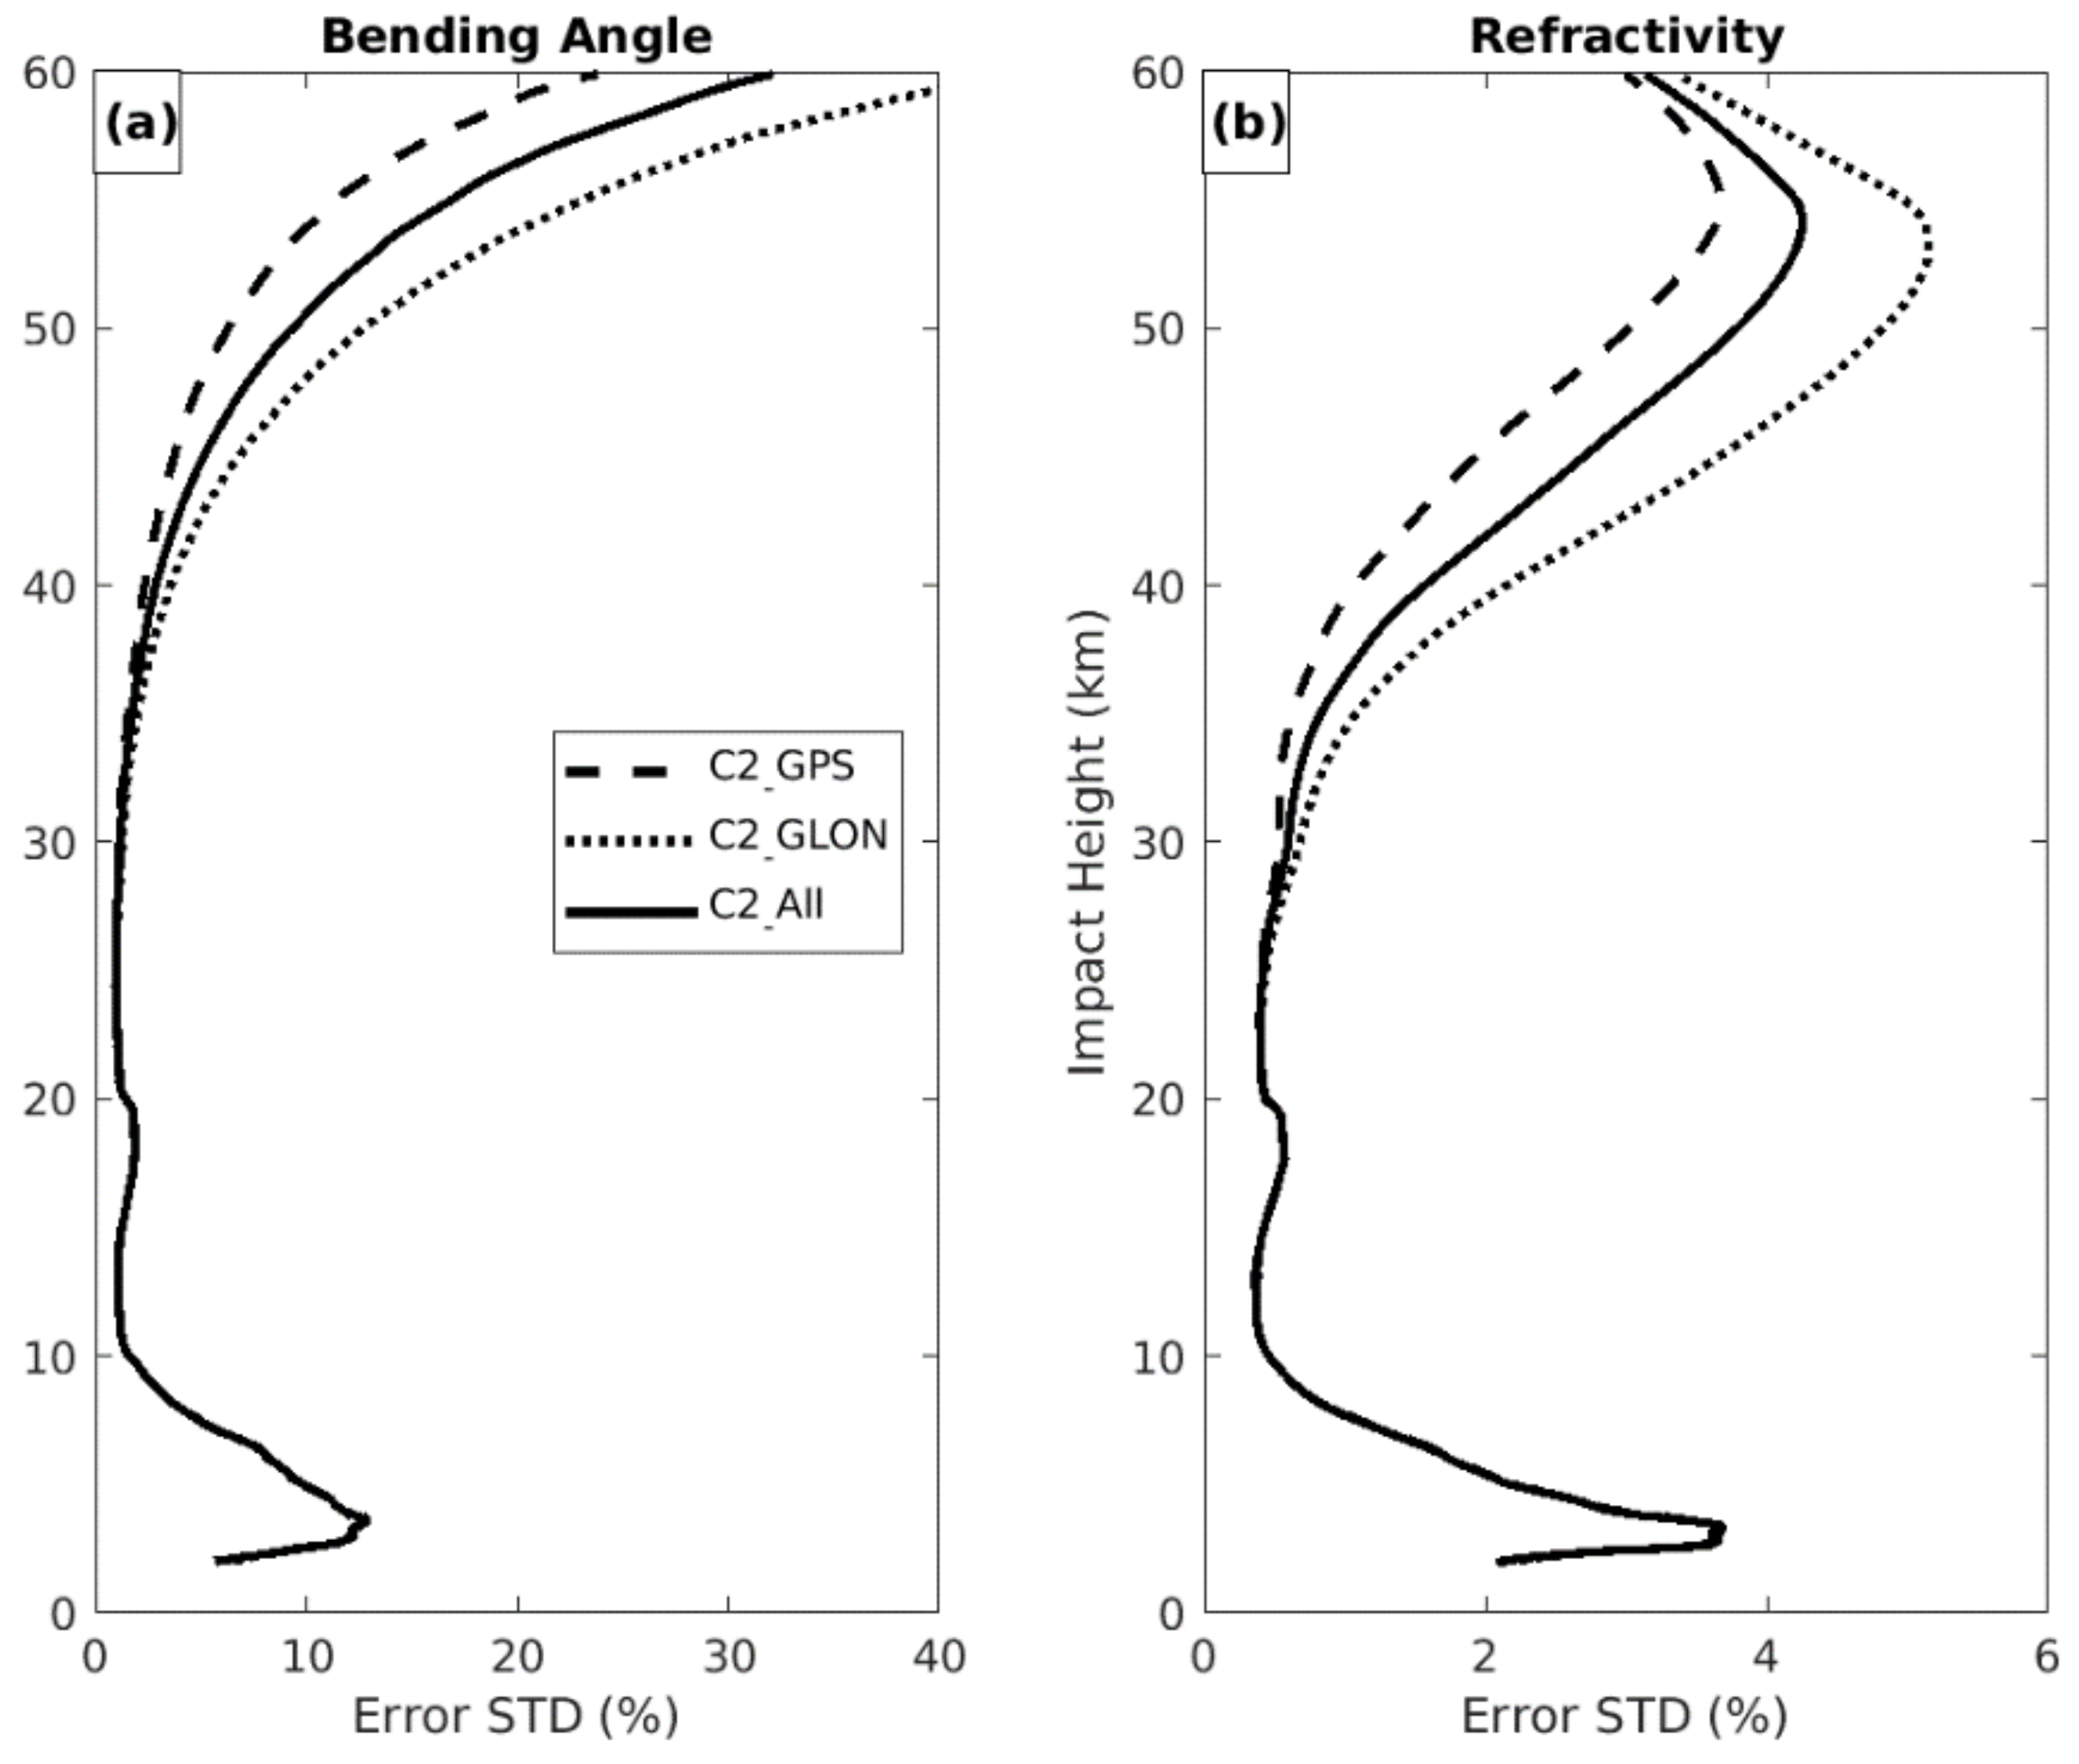
We found smaller uncertainties for C2 bending angles and refractivities from GPS occultations compared to those from GLONASS above 30 km (Figure 5). The STD of bending angle errors for C2 (GPS) is approximately half that of C2 (GLONASS) above 40 km. These differences could be important in the error models used in data assimilation. The differences below 30 km are very small, in agreement with Sokolovskiy et al. [45] and Ho et al. [21].
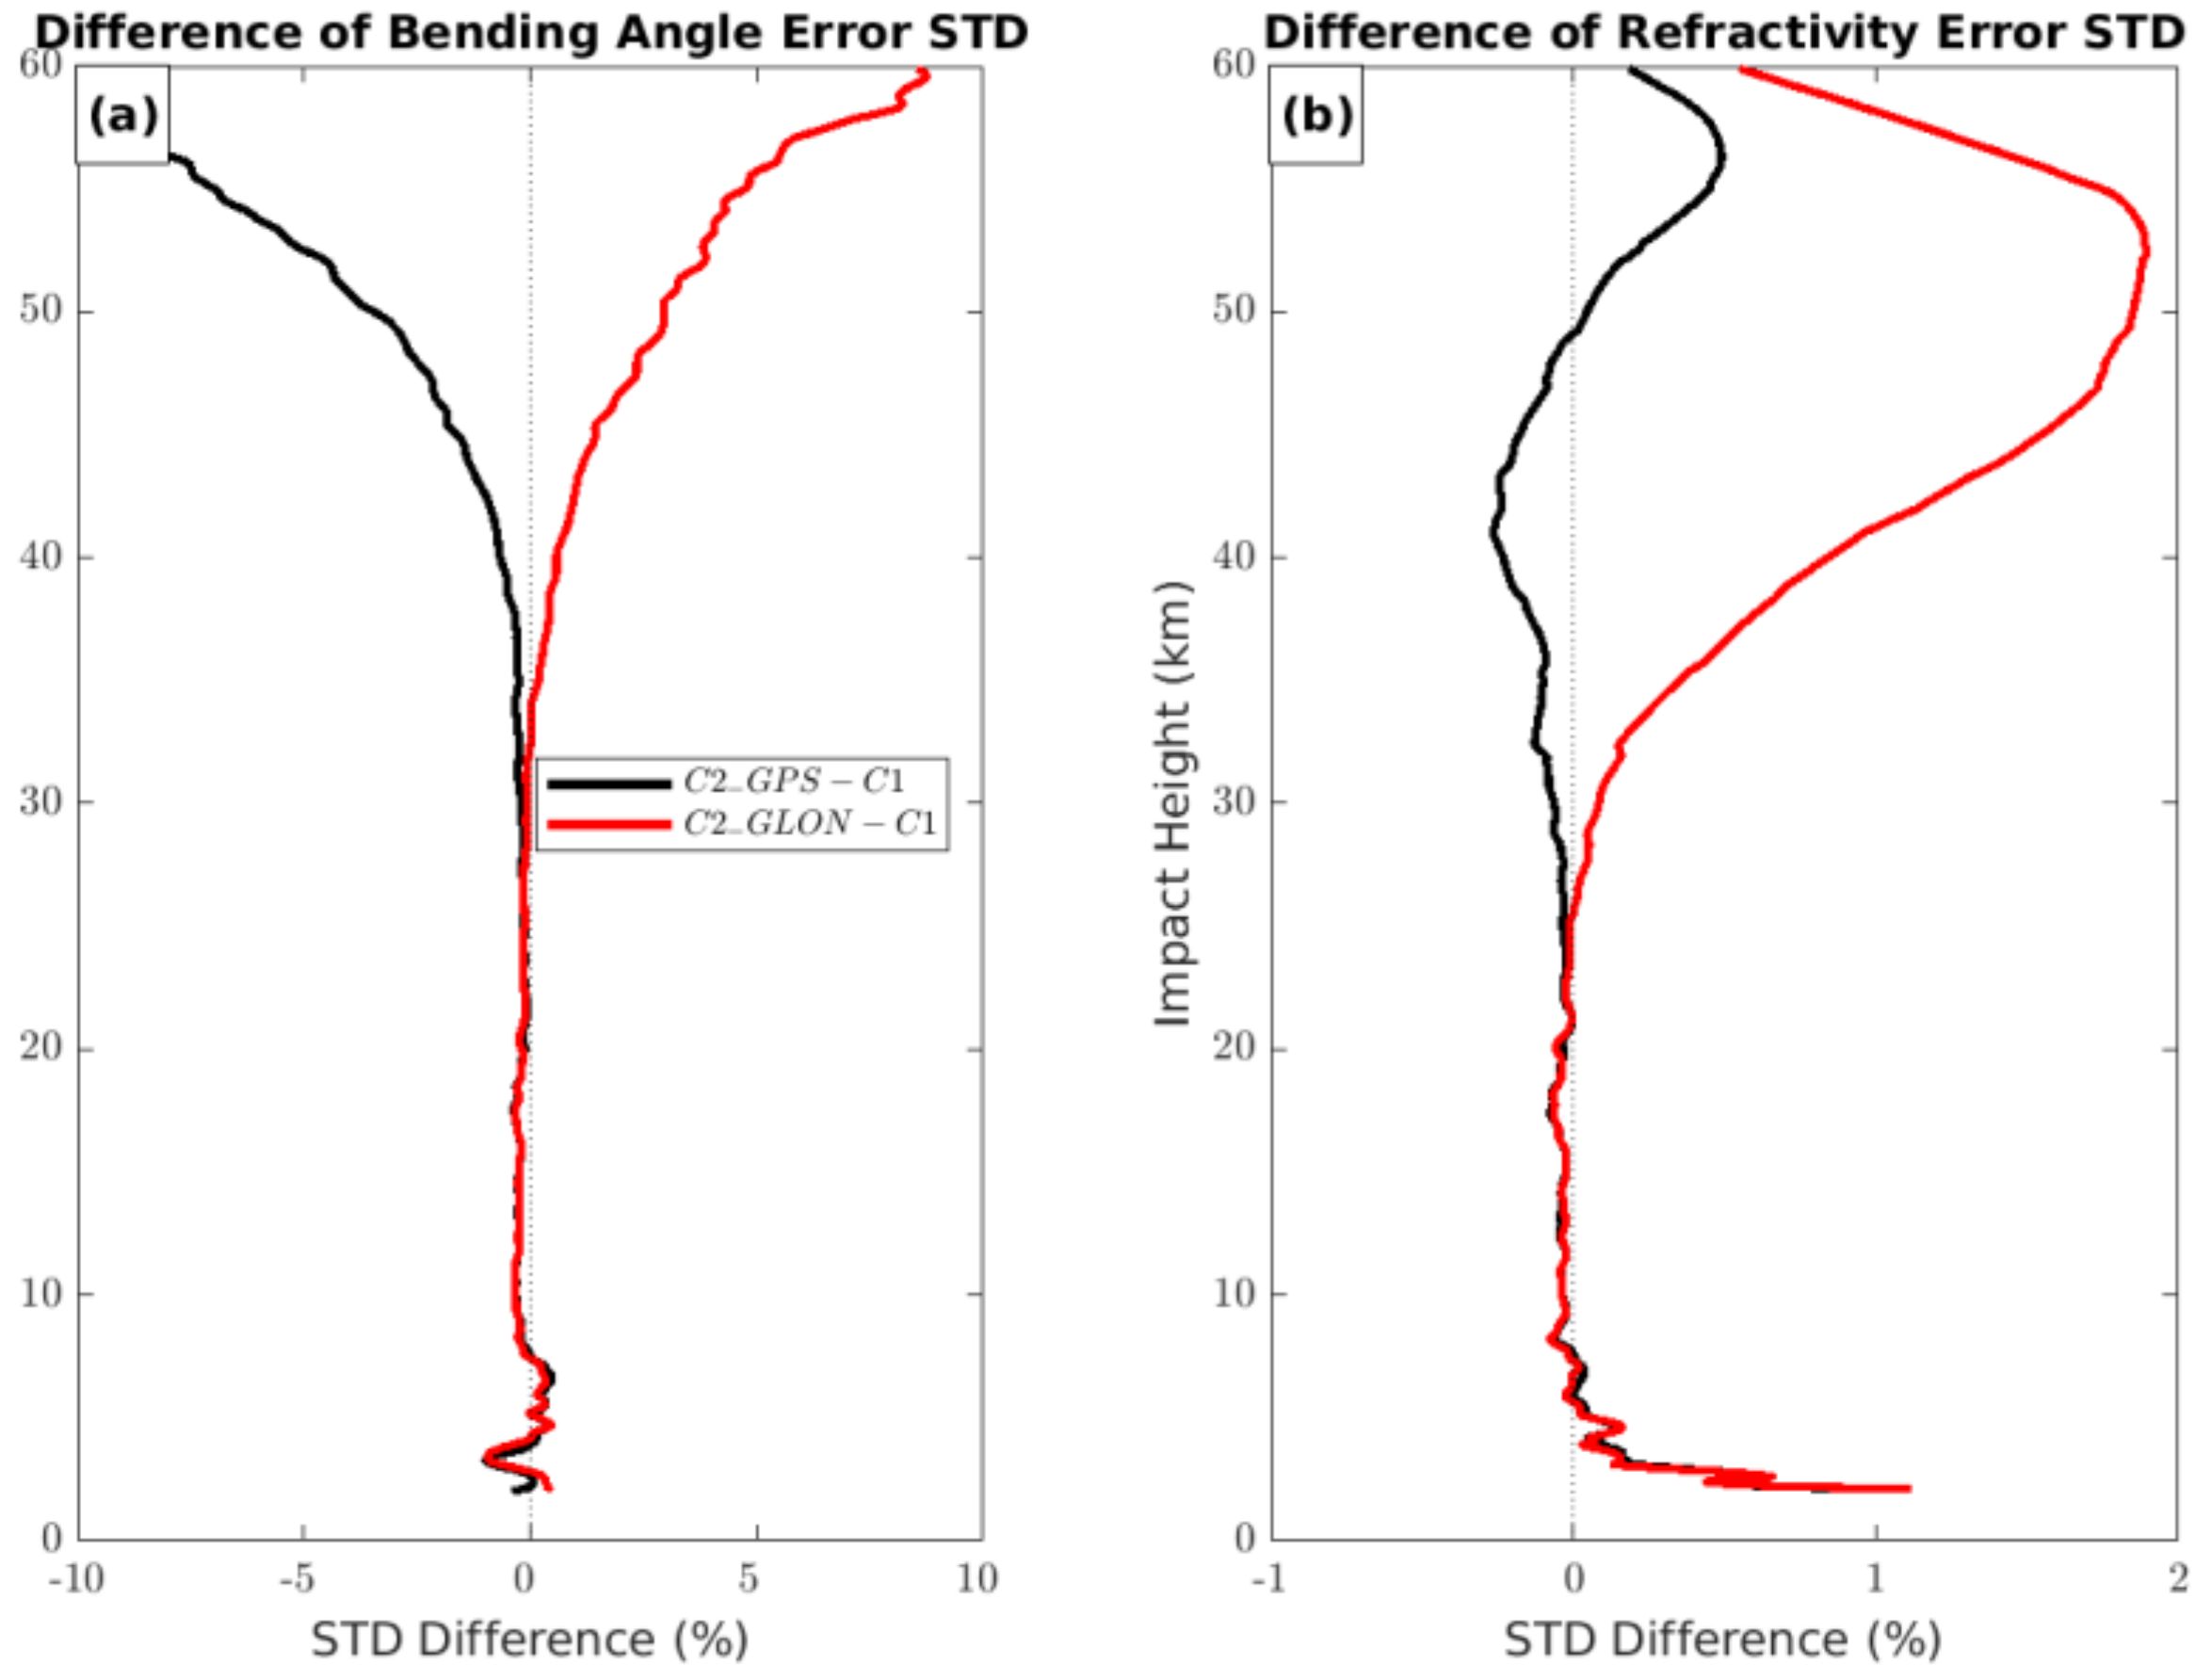
The different uncertainties for C2 (GPS) and C2 (GLONASS) above 30 km make a large difference when comparing C2 with C1 (Figure 6). The bending angle uncertainties for C2 (GPS) are lower than those of C1, while they are higher for C2 (GLONASS). The lower uncertainties for C2 (GPS) than C1 are likely due to the better receiver clocks on C2, as well as higher SNR. Both will reduce the measurement errors for C2 compared to C1. The higher upper level BA uncertainties for C2 (GLONASS) compared to C1 indicate that the higher GLONASS clock errors dominate the effect of the differences in receiver clock errors and SNR effects between C2 and C1.

5.3. Uncertainty Estimates of COSMIC and COSMIC-2
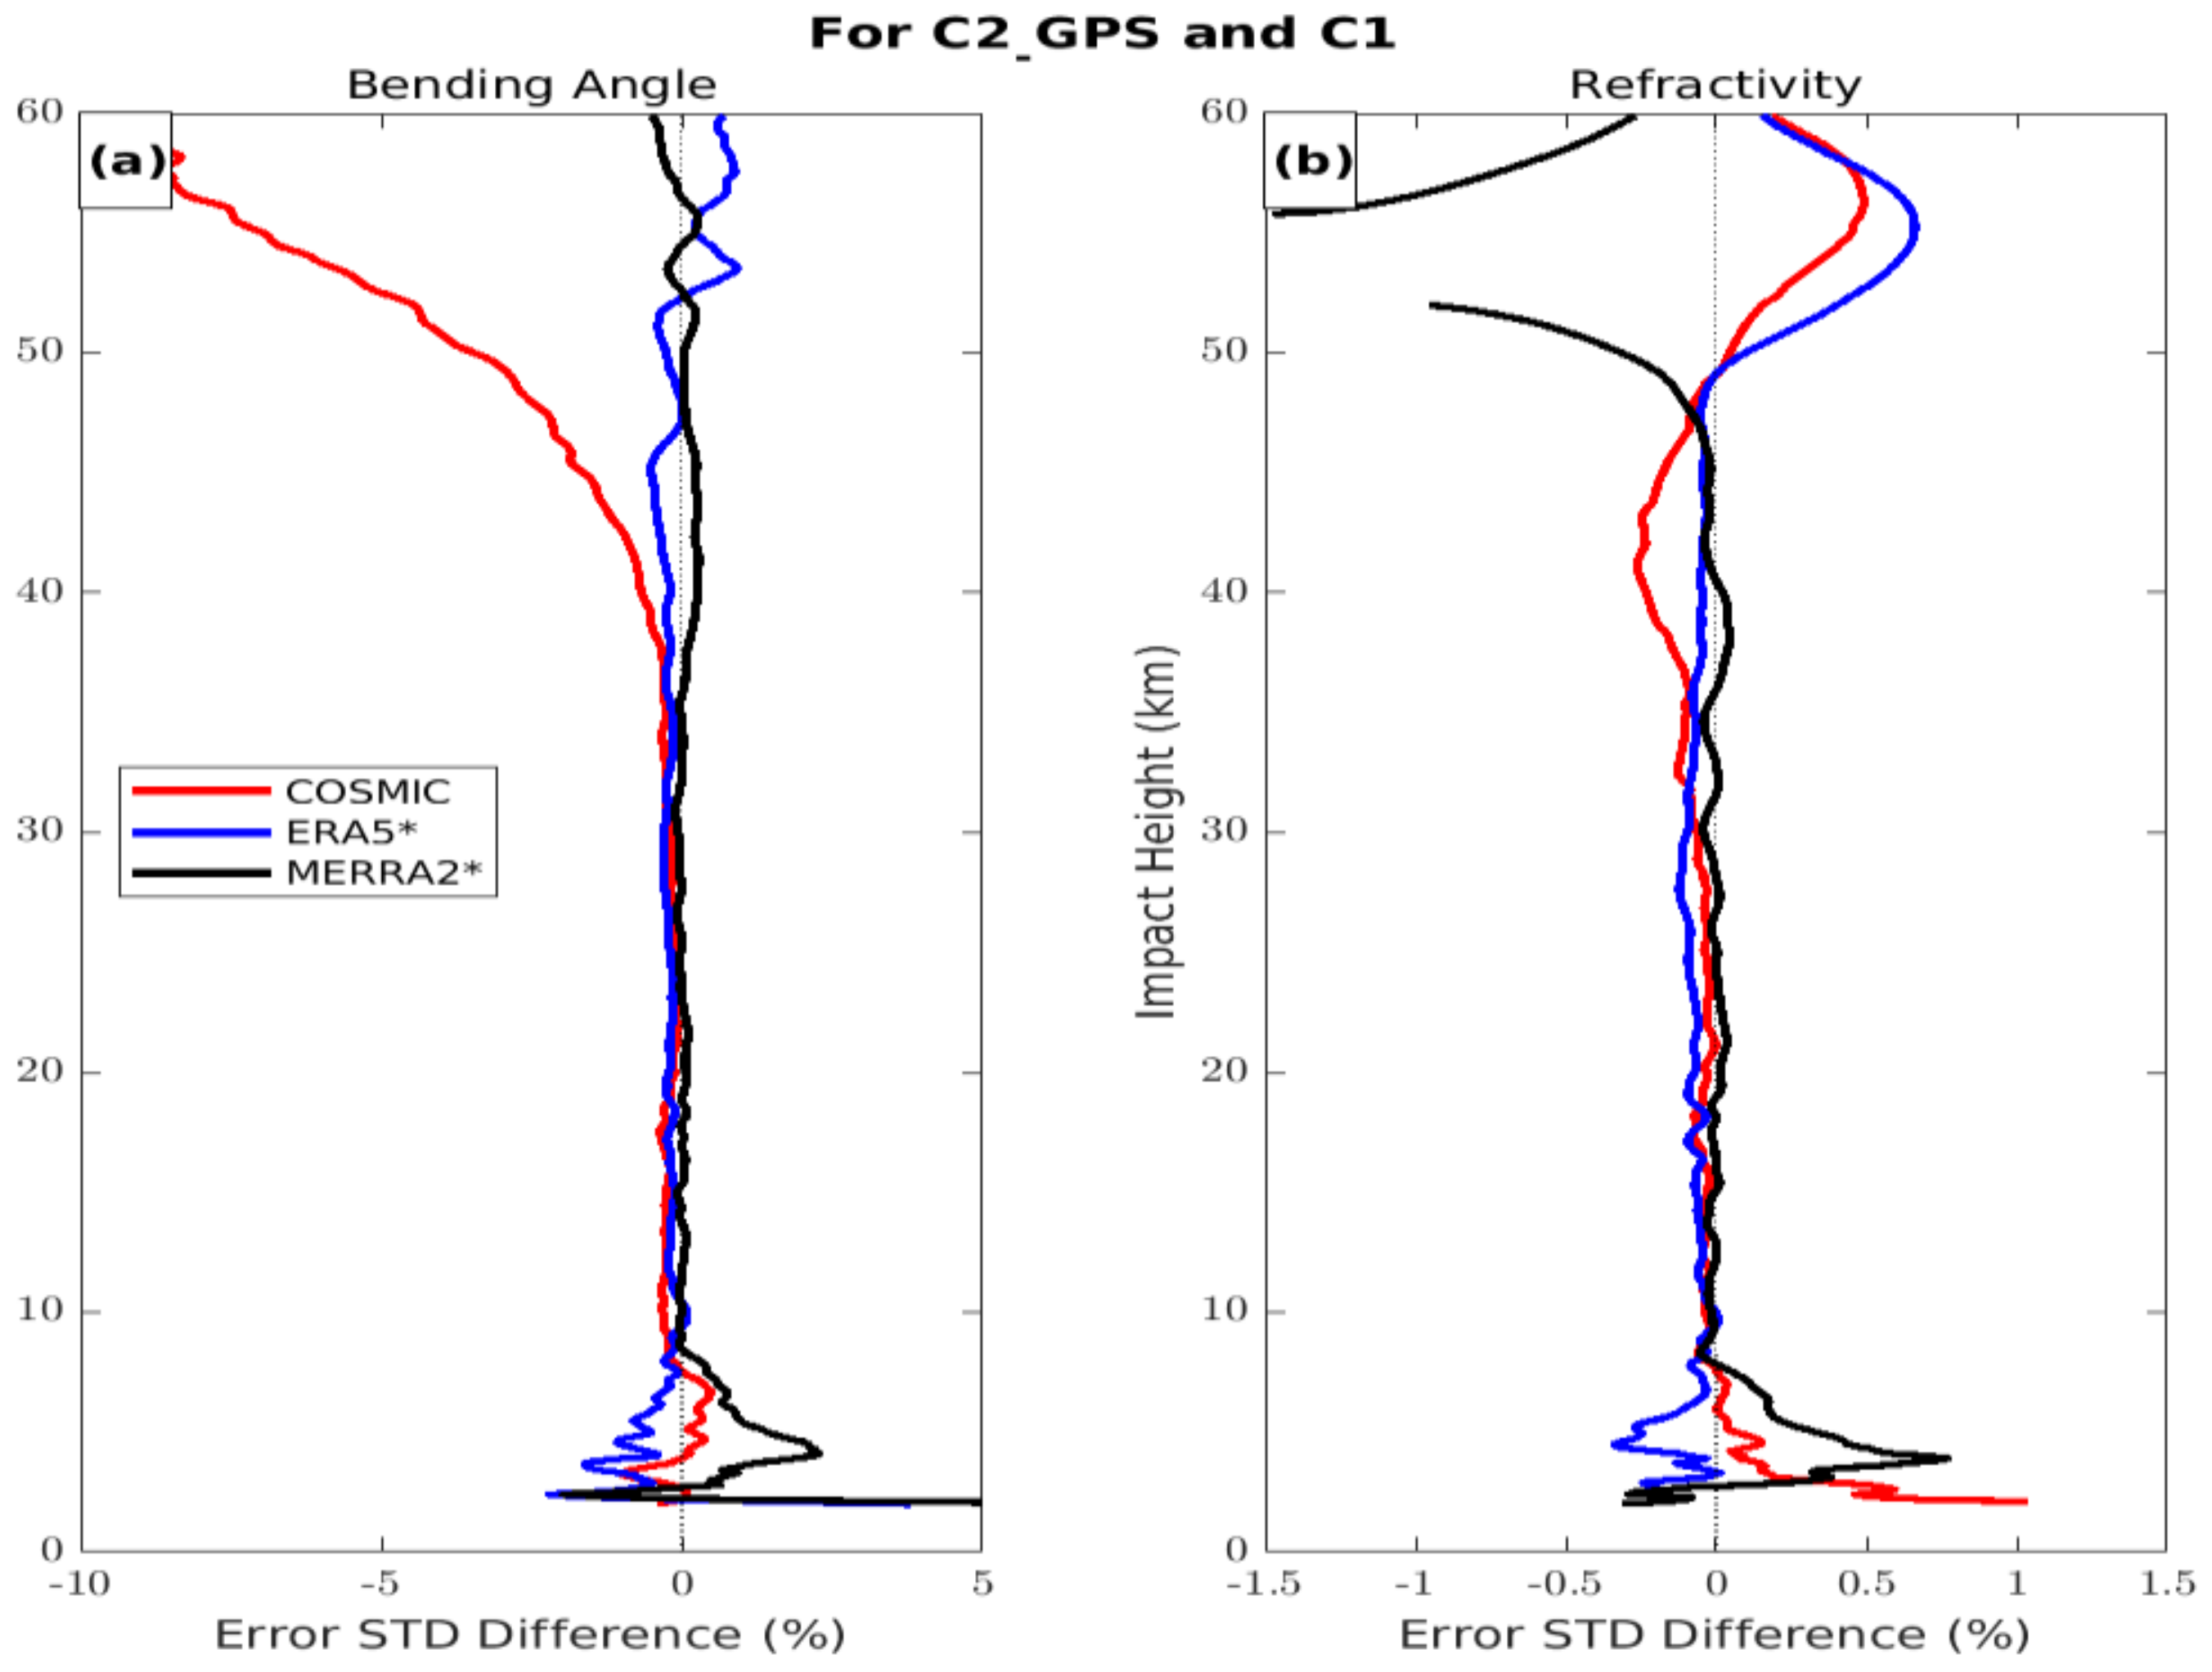
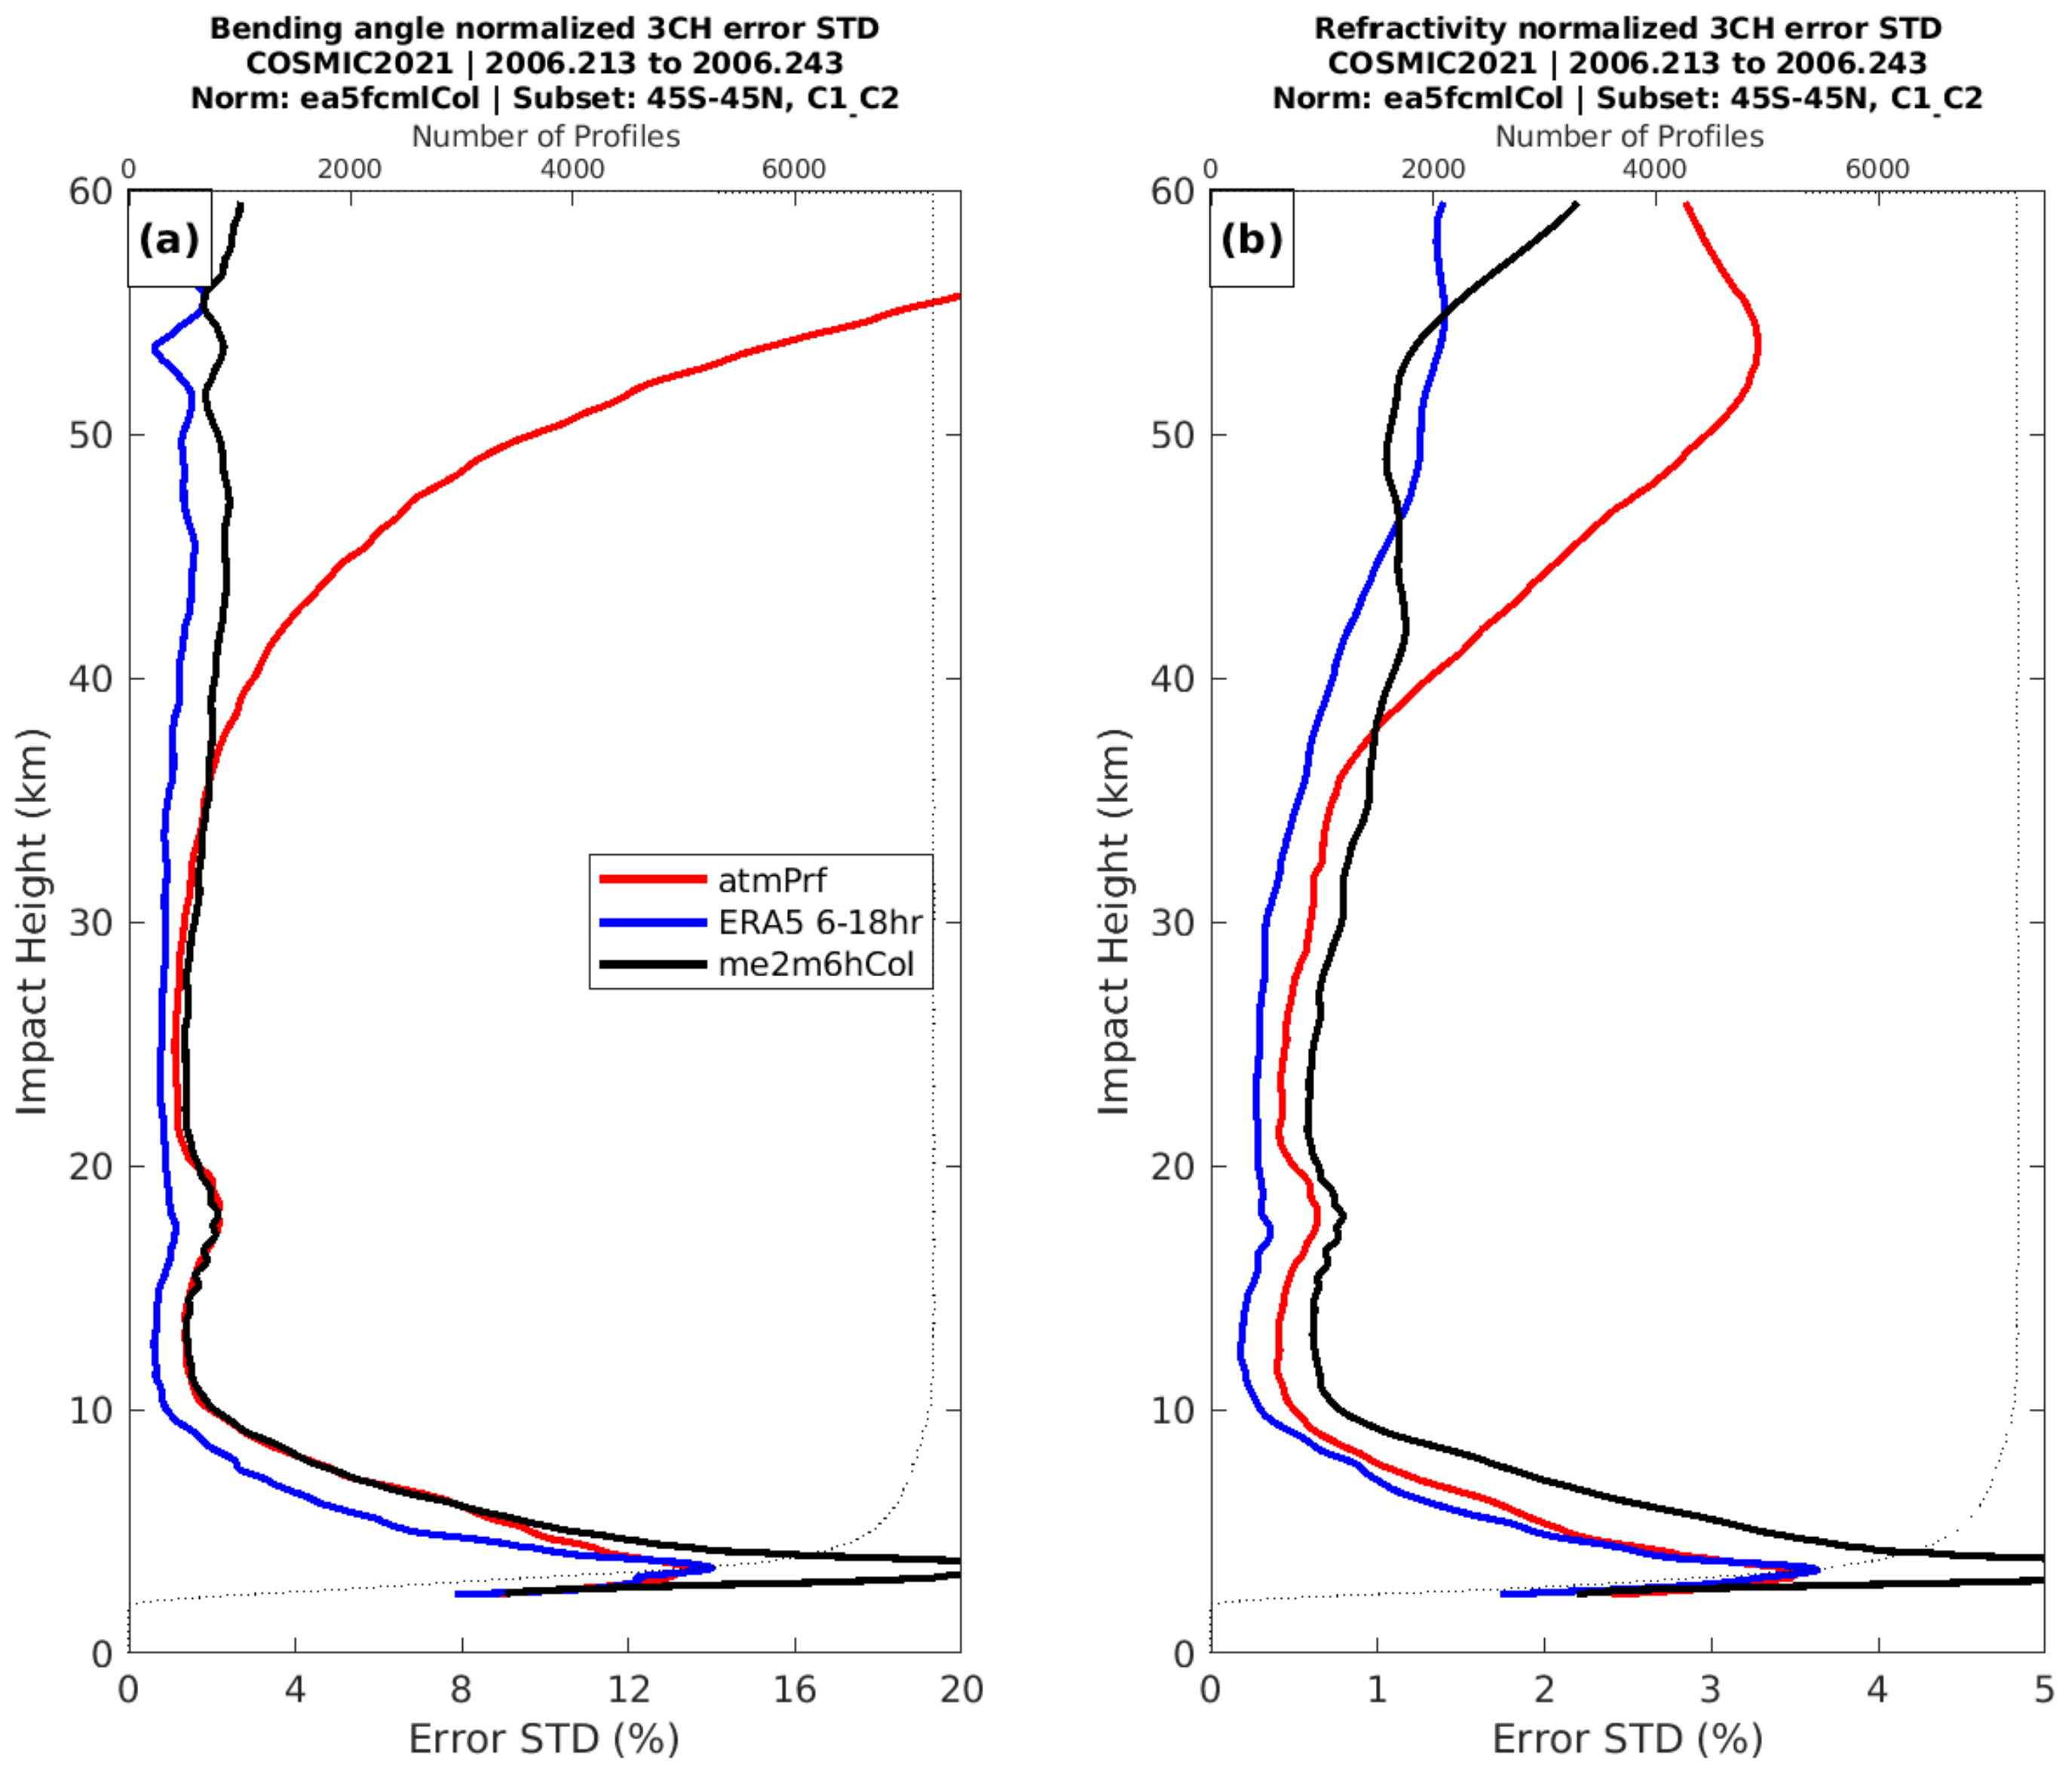
Figure 7 shows vertical profiles of 3CH estimated error standard deviations of C1 data (all versions of C1 are the 2021 version in the rest of Section 5) and the two model data sets ERA5 and MERRA-2. All data sets are normalized by the sample mean of ERA5. The refractivity and bending angle errors show a similar vertical structure, with maxima near the top of the ABL at about 3 km impact height, a minimum near 10 km, a small local maximum in the tropopause region between 15–20 km, and a rapid increase from 30 to 60 km. The maxima near the ABL top and the tropopause region coincide with the high level of atmospheric variability and large horizontal gradients in these regions (Figure 2 and Figure 3). The model estimated error profiles also show maxima at these two levels for the same reasons. Above 30 km, the estimated errors of all the data sets increase, but the RO relative errors increase much faster than the model errors, indicating that ionospheric residual errors together with receiver thermal noise and clock errors play an increasingly dominant role in determining the relative RO errors at higher levels in the stratosphere. Above 50 km, the RO N and BA uncertainties become comparable to the N and BA standard deviations (Figure 2), indicating little information in the RO observations above this level [42,72]. It is noteworthy that in contrast to the RO BA uncertainties that increase steadily above 40 km, the RO N uncertainties reach a maximum around 52 km and then decrease above, a result of the increasing impact of high-level climatology in the retrieval of N from the optimized BA [28].
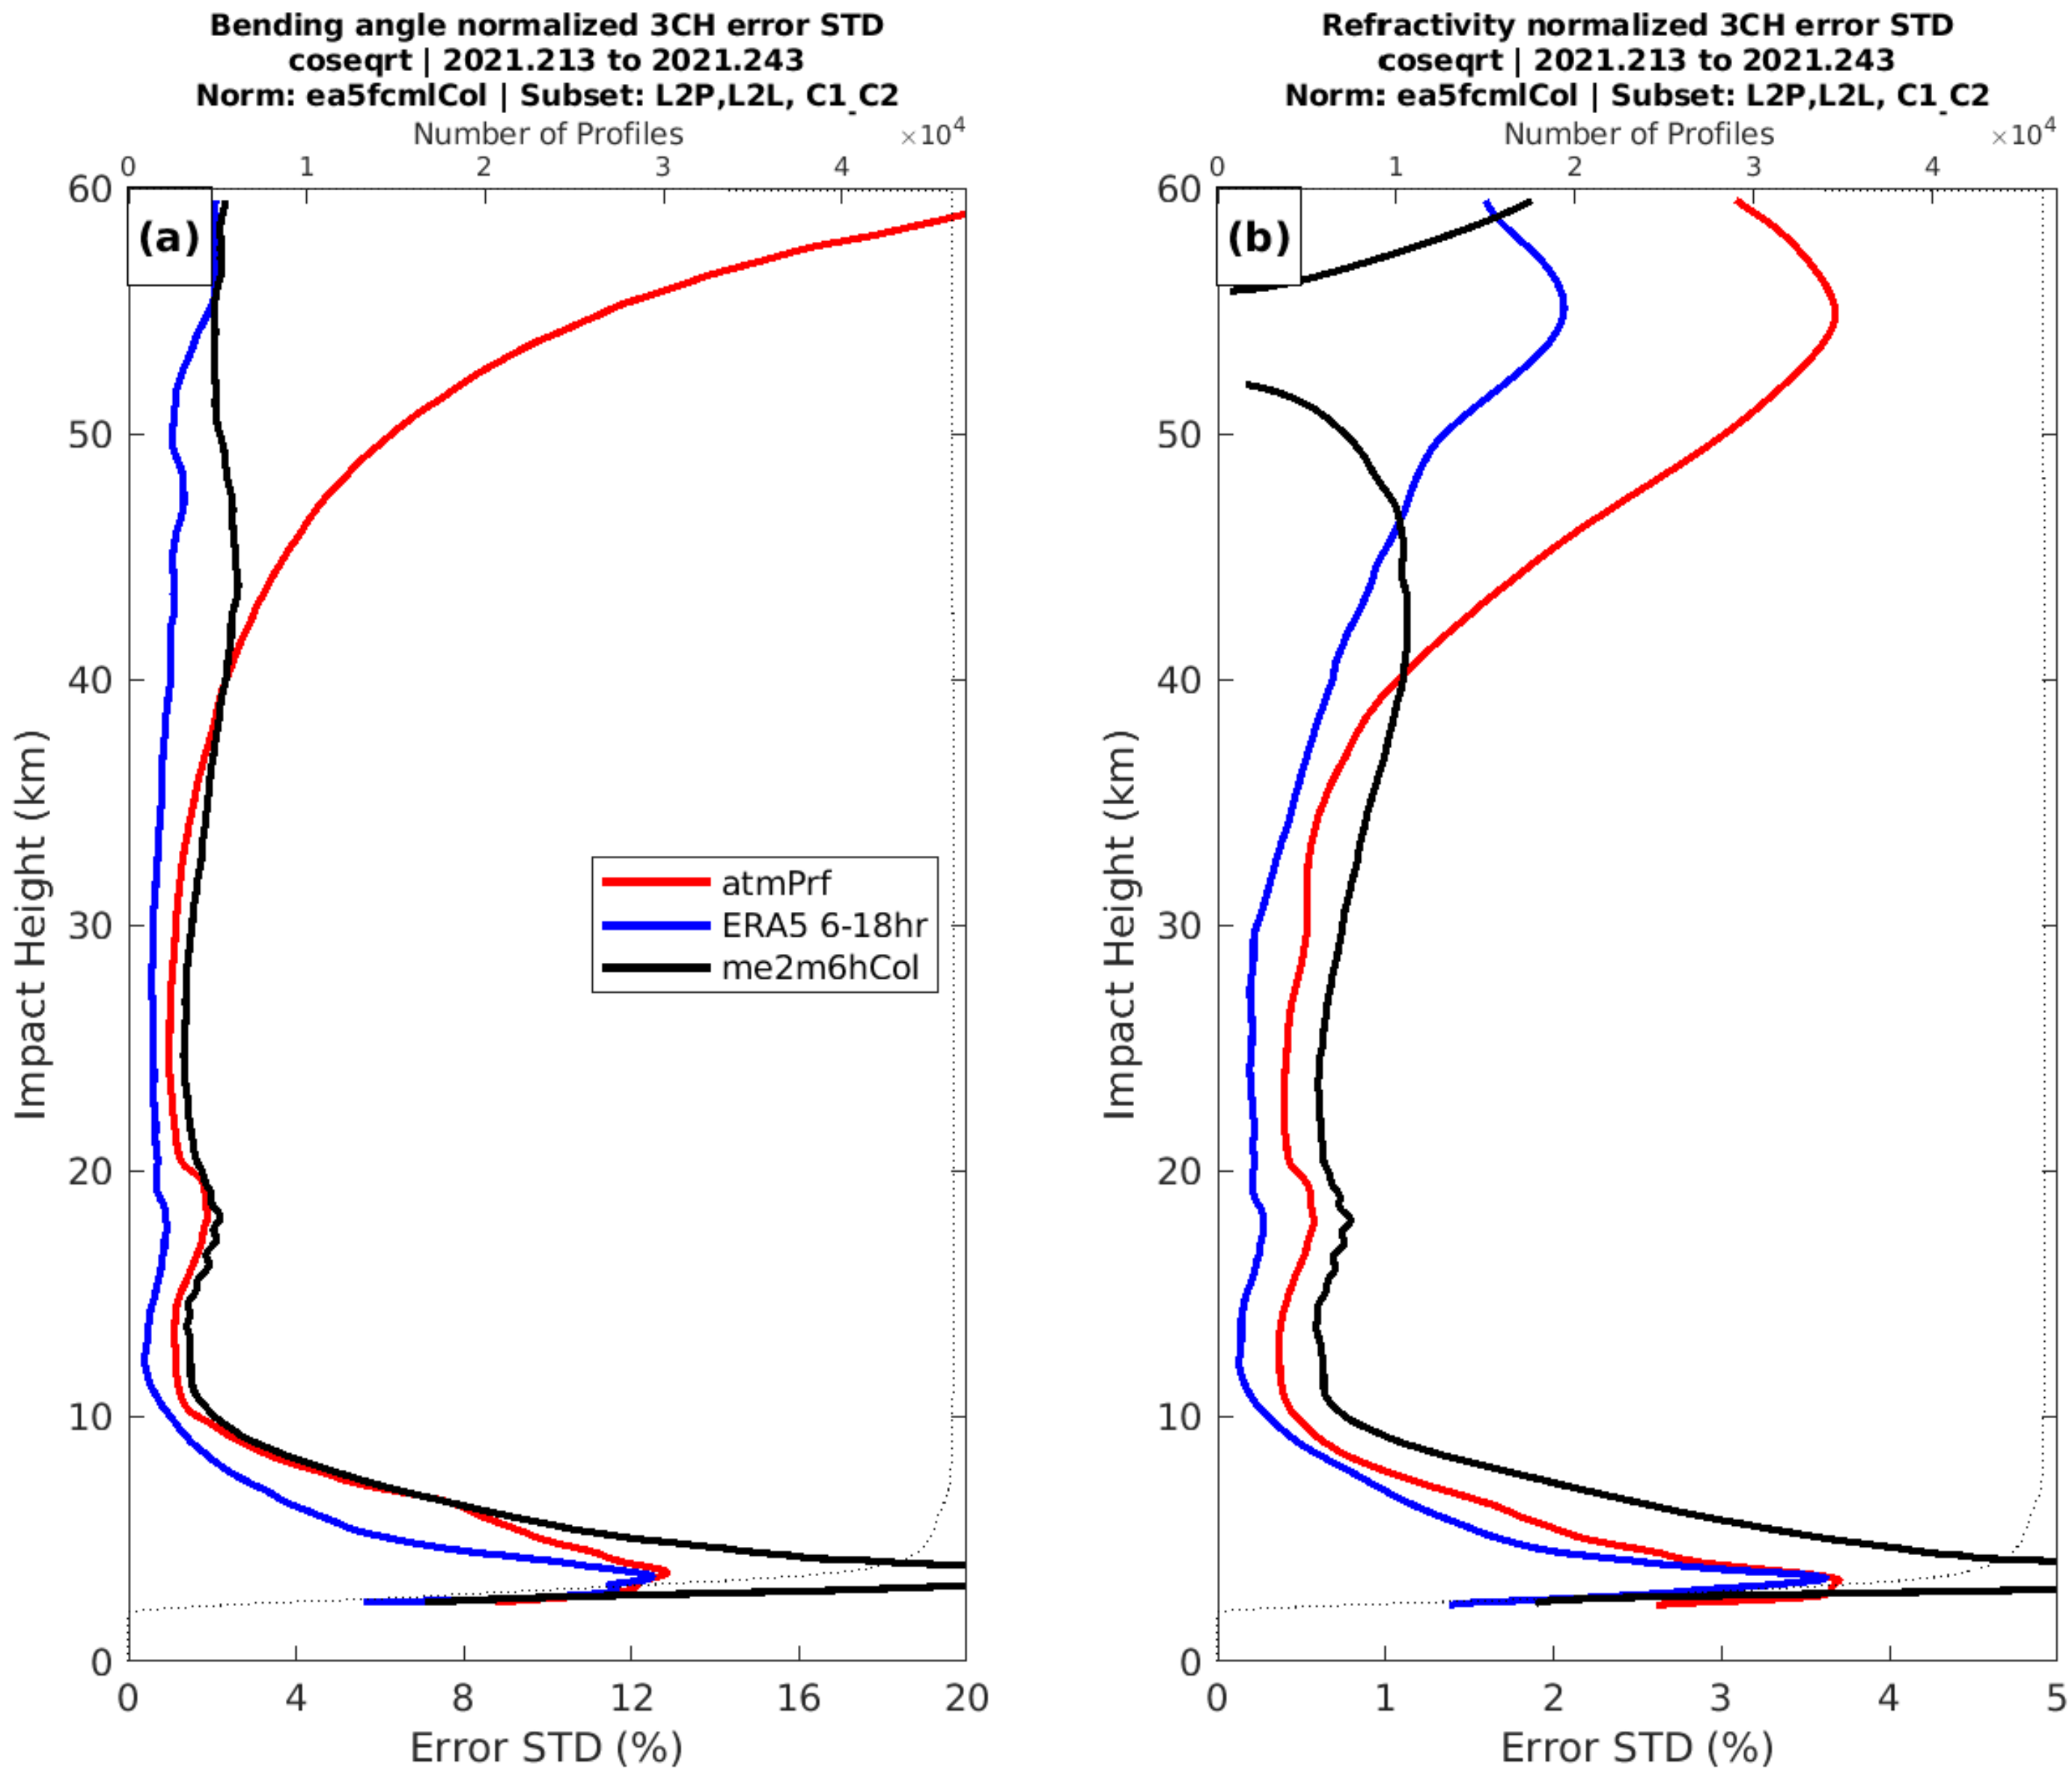
Figure 8 shows the vertical profiles of the uncertainty estimates of BA and N of C2 (GPS only), ERA5, and MERRA-2 for August 2021. The overall structures are quite similar to those of C1 (Figure 7) in the troposphere and lower stratosphere. The largest differences appear in the upper stratosphere–lower mesosphere (40–60 km), where the C2 BA uncertainties are considerably smaller than those of C1 (also shown in Figure 9). The undefined MERRA-2 estimated error STD between 52 and 56 km are a result of negative error variances, which can occur under certain conditions [40,73]. In this case, the negative error variance estimates likely occur because the MERRA-2 errors are small (N error variances above 10 km are generally less than 1%2) and, as discussed in Section 2.2, there are likely small error covariances between ERA5 and MERRA-2. The 3CH method can also yield negative error variances when one of the data sets has much larger errors than the other two, and in this case C2 errors are much larger than ERA5 and MERRA-2 above 50 km. However, the negative error variances are of little importance to the results of this paper.
Figure 9 shows the difference between C2 (August 2021) and C1 (August 2006) in estimated N and BA error STD. The C2 BA uncertainties are smaller than those of C1 at all levels except about 4–8 km impact height where they are very slightly larger, but the differences between the 4 km and 40 km impact heights are very small. Differences are largest above 40 km, but the differences are smaller than the uncertainty estimates themselves. Paradoxically, the C2 BA error estimates are smaller than those for C1, while the C2 refractivity error estimates are larger in two layers: below 4 km impact height and above 50 km. (The same paradox occurs when the STD of the differences between C2 and C1 and ERA5 and MERRA-2 bending angles are compared with those of refractivities (not shown). The C2 BA STD differences are smaller than those of C1, but the N STD of differences are larger). This paradox in the overall sample statistics in the upper levels is a result of the differences in the higher latitudes (35°–45° S and 35°–45° N), as shown in Section 5.4, There are several possible reasons for this paradox. First, it is important to note that the N values that are used in these error estimates are computed from the statistically optimized BA using the Abel transform (Equation (3) below), not the observed BA profiles used to compute the error estimates of the BA. The optimized BA are linearly weighted combinations of the observed BA and climatological (The BA climatology is computed from the NCAR climatological pressure and temperature profiles) BA between 35 and 60 km. At 35 km and below, the optimized BA are equal to the observed BA. Above 35 km, the optimized BA are increasingly weighted by climatology and above 50 km are weighted more than 50% to the climatological values. Therefore, the error characteristics of the observed and optimized BA profiles may be significantly different, especially above 50 km, because the optimized BA is blended with the climatology. In addition, the real atmospheric states in August 2021 and 2006 are slightly different, and thus the effect of climatology on the optimized BA and N profiles is different.
More generally, the shape and magnitudes of the BA and N error estimate profiles are not the same. Refractivities are computed via the Abel integral transform, which integrates over-optimized bending angles from impact parameter a to ∞ (Equation (3)). Thus, N error is vertically accumulated BA errors assigned at the lower integral bound [58,68].
n a = exp 1 π a α x x 2 a 2 d x
The reasons for the observed paradox near the surface are likely different because in the lower troposphere, climatology plays an insignificant role in the optimized BA used to compute N. Here, the paradox may be related to the different effects of horizontal refractivity gradients and the resulting violation of the spherical symmetry assumption on the retrievals of BA and N. In the RO retrievals, BA are computed first from the excess phase observations, and then N is computed from the BA using the Abel transform (Equation (3)). Both calculations assume spherical symmetry.
The models do not show the paradox of larger N errors with smaller BA errors (Figure 9). For the models, N is computed first from the model temperatures and water vapor pressure, and then the BA are computed from a forward model using the Abel integral.
α a = 2 a a d ln n / d x x 2 a 2 d x
We do not fully understand these results; they reflect the complex assumptions, different time periods, and computational factors described above and are likely not physically meaningful.
Figure 9. Differences in 3CH error STD estimates of (a) bending angle and (b) refractivity for C2 (GPS only) and C1 and the two reanalyses between August 2021 and August 2006.
Atmosphere 13 00790 g009

5.4. Latitudinal Variations of C2 Uncertainty Estimates and Differences from C1

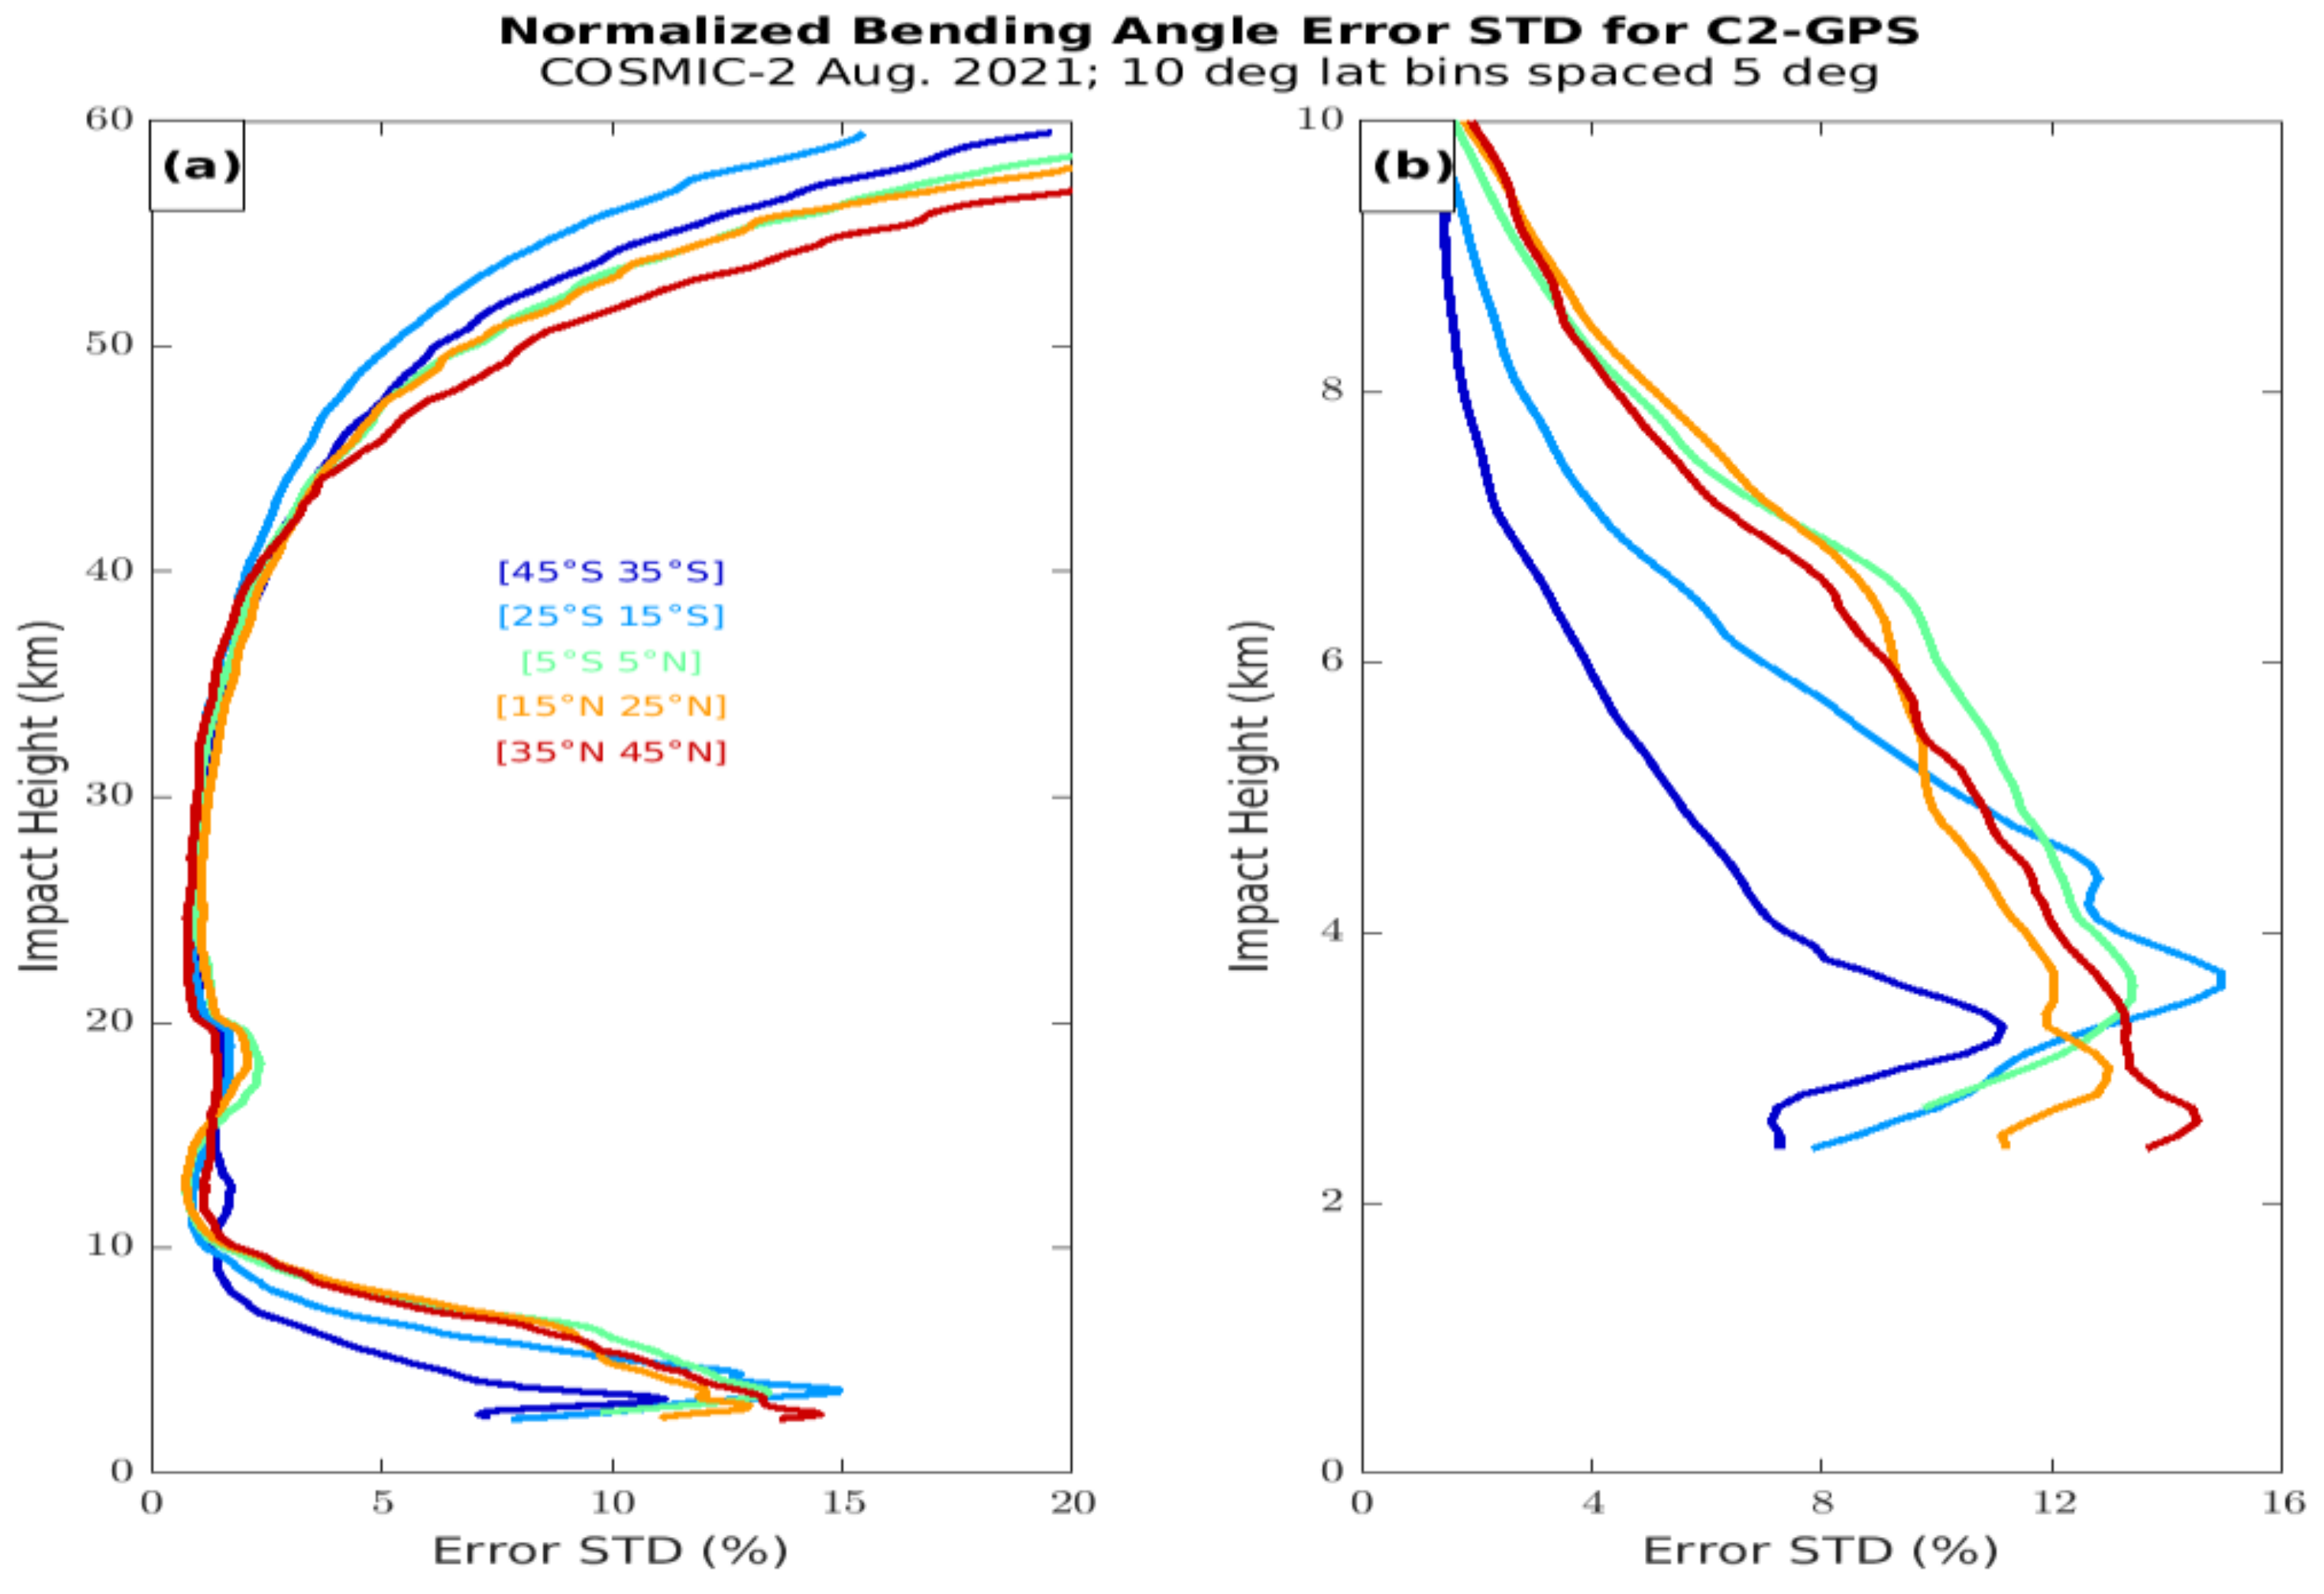
The uncertainty estimates of the bending angle and refractivity vary with latitude. We show the BA uncertainty estimates by 10° latitude bands in Figure 10 for August 2021. Above 40 km, the BA uncertainties are largest at latitudes 35–45° N and lowest at latitudes 25–45° S. The differences at these high levels are likely related to latitudinal variations in ionospheric residual errors [23,28,54]. In the troposphere, the differences are likely related to latitudinal variations in horizontal gradients of refractivities, and the smallest uncertainties are in latitudes 35–45° S. Below 6 km impact height, the latitudinal variation is more complex, probably reflecting differences in mean ABL height. While the shapes of the profiles are similar at most latitudes, the estimates can vary at certain levels by a factor of two or three, which may be impactful in the assimilation of bending angles in NWP models.
Figure 11 shows the differences between C2 and C1 refractivities and bending angles for five 10° latitude bands. Above 10 km, the C2 BA uncertainties are smaller than those of C1 at all latitudes. C2 refractivity uncertainties are also lower than those of C1 at low latitudes, but they are larger at high latitudes (the aforementioned paradox). In the troposphere, the differences between C2 and C1 BA and N uncertainties vary with no obvious latitude dependency, although the C2 uncertainties are noticeably larger than those of C1 between 35–45° N.

6. Summary and Conclusions

We estimated the random error statistics (uncertainties) of bending angles and refractivities from two radio occultation (RO) missions, COSMIC (C1) and COSMIC-2 (C2), using the three-cornered hat (3CH) method for two months, August 2006 and August 2021. C2 has a higher signal-to-noise ratio (SNR) on average than C1 and also smaller receiver clock errors. C2 also retrieves both GPS and GLONASS GNSS occultations, which have different transmitter clock errors. Thus, these results provide insight into the impact of SNR and clock (receiver and transmitter) errors on the random error statistics of RO observations, which are important for optimal assimilation of RO observations in numerical weather prediction models.
We reviewed the major sources of errors in RO bending angles and refractivities: measurement errors, errors due to atmospheric effects, and representativeness errors. SNR and clock errors affect the measurement errors at high altitudes, but have little effect on uncertainties below 30 km. The most significant source of bending angle and refractivity uncertainties above 30 km is ionospheric residuals. Below 30 km (especially in the lower troposphere), the dominant source of uncertainty is horizontal gradients of refractivity and the associated departures from spherical symmetry. Since the errors in bending angle and refractivity caused by these atmospheric gradients are not affected by the SNR, the uncertainties associated with the higher SNR C2 are similar to those of C1 in the troposphere and lower stratosphere.
The larger GLONASS clock errors in these C2 data make a noticeable difference in the bending angle and refractivity uncertainties in the 30–60 km altitude range (stratosphere and lower mesosphere). Below 30 km, we find almost no difference in the uncertainties of the C2 GPS and GLONASS occultations.
The uncertainty profiles are similar for the C1 and C2 missions between approximately 2 km and 35 km above mean sea level. Small differences in the error estimates exist in the lowest two km, but these differences are small compared to the uncertainty estimates themselves. C2 (GPS) uncertainties are considerably less than C1 uncertainties from 35–60 km.
As found in previous studies, a higher percentage of C2 profiles reach close to the surface in the moisture-rich tropics, an important advantage of the higher SNR in C2. Approximately 50% of all C2 profiles reach within 200 m of the surface.
The uncertainties in both RO missions are maximum near the top of the atmospheric boundary layer (ABL) and decrease downward toward the surface and upward to the upper troposphere. A small relative maximum exists in the UTLS (between 10 and 20 km). These maxima are closely related to maxima in atmospheric variability and horizontal gradients of temperature and water vapor. Both the ABL and tropopause structures as well as the estimated RO uncertainties vary with latitude from 45° S to 45° N. Above 20 km, the relative uncertainties increase with height and approach the standard deviation of variations in the RO observations above 50 km.

Author Contributions

Conceptualization and writing, R.A., J.S. and S.S.; computations, J.S. and X.F., analysis and interpretation, all authors. All authors have read and agreed to the published version of the manuscript.

Funding

This work was supported by NSF Grant AGS-2054356, NASA Contract 80NSSC22K0658, and NOAA Contract NA21OAR4310383.

Institutional Review Board Statement

Not applicable.

Informed Consent Statement

Not applicable.

Data Availability Statement

COSMIC and COSMIC-2 data were obtained from CDAAC (https://cdaac-www.cosmic.ucar.edu (accessed on 4 March 2022)). ERA5 data were obtained from the ECMWF data archive (https://apps.ecmwf.int/data-catalogues/era5/?class=ea (accessed on 1 March 2022). MERRA-2 data were obtained from the NASA Data and Information Services Center (https://disc.gsfc.nasa.gov/ (accessed on1 March 2022).

Acknowledgments

We thank Sergey Sokolovskiy and Tae-Kwon Wee for their inciteful discussions and Eric DeWeaver (NSF) and Jack Kaye (NASA) for their long-term support of COSMIC.

Conflicts of Interest

The authors declare no conflict of interest.

References

  1. Ware, R.; Exner, M.; Feng, D.; Gorbunov, M.; Hardy, K.; Herman, B.; Kuo, Y.; Meehan, T.; Melbourne, W.; Rocken, C.; et al. GPS sounding of the atmosphere from Low Earth Orbit: Preliminary results. Bull. Am. Meteorol. Soc. 1996, 77, 19–40. [Google Scholar] [CrossRef] [Green Version]
  2. Healy, S.B.; Thépaut, J.N. Forecast impact experiment with GPS radio occultation measurements. Q. J. R. Meteorol. Soc. 2006, 132, 605–623. [Google Scholar] [CrossRef]
  3. Healy, S.B.; Eyre, J.R.; Hamrun, M.; Thépaut, J.N. Assimilating GPS radio occultation measurements with two-dimensional bending angle observation operators. Q. J. R. Meteorol. Soc. 2007, 133, 1213–1227. [Google Scholar] [CrossRef]
  4. Healy, S.B. Forecast impact experiment with a constellation of GPS radio occultation receivers. Atmos. Sci. Lett. 2008, 9, 111–118. [Google Scholar] [CrossRef]
  5. Aparicio, J.M.; Deblonde, G. Impact of the assimilation of CHAMP refractivity profiles on Environment Canada global forecasts. Mon. Weather Rev. 2008, 136, 257–275. [Google Scholar] [CrossRef]
  6. Poli, P.; Moll, P.; Puech, D.; Rabier, F.; Healy, S.B. Quality control, error analysis, and impact assessment of FORMOSAT-3/COSMIC in numerical weather prediction. Terr. Atmos. Ocean. Sci. 2009, 20, 101–113. [Google Scholar] [CrossRef] [Green Version]
  7. Poli, P.; Healy, S.B.; Dee, D.P. Assimilation of global positioning system radio occultation data in the ECMWF ERAi reanalysis. Q. J. R. Meteorol. Soc. 2010, 136, 1972–1990. [Google Scholar] [CrossRef]
  8. Cardinali, C. Monitoring the observation impact on the short-range forecast. Q. J. R. Meteorol. Soc. 2009, 135, 239–250. [Google Scholar] [CrossRef]
  9. Rennie, M.P. The impact of GPS radio occultation assimilation at the. Meteorological Office. Q. J. R. Meteorol. Soc. 2010, 136, 116–131. [Google Scholar] [CrossRef]
  10. Cardinali, C.; Healy, S. Impact of GPS radio occultation measurements in the ECMWF system using adjoint based diagnostics. Q. J. R. Meteorol. Soc. 2014, 140, 2315–2320. [Google Scholar] [CrossRef]
  11. Bonavita, M. On some aspects of the impact of GPSRO observations in global numerical weather prediction. Q. J. R. Meteorol. Soc. 2014, 140, 2546–2562. [Google Scholar] [CrossRef] [Green Version]
  12. Bauer, P.; Radnóti, G.; Healy, S.; Cardinali, C. GNSS Radio Occultation Constellation Observing System Experiments. Mon. Weather Rev. 2014, 142, 555–572. [Google Scholar] [CrossRef]
  13. Chen, Y.-C.; Hsieh, M.-E.; Hsiao, L.-F.; Kuo, Y.-H.; Yang, M.-J.; Huang, C.-Y.; Lee, C.-S. Systematic evaluation of the impacts of GPSRO data on the prediction of typhoons over the northwestern Pacific in 2008–2010. Atmos. Meas. Tech. 2015, 8, 2531–2542. [Google Scholar] [CrossRef] [Green Version]
  14. Ruston, B.; Healy, S. Forecast Impact of FORMOSAT-7/COSMIC-2 GNSS Radio Occultation Measurements. Atmos. Sci. Lett. 2020, 22, e1019. [Google Scholar] [CrossRef]
  15. Lackner, B.C.; Steiner, A.K.; Kirchengast, G.; Hegerl, G.C. Atmospheric climate change detection by radio occultation data using a fingerprinting method. J. Clim. 2011, 24, 5275–5291. [Google Scholar] [CrossRef] [Green Version]
  16. Steiner, A.K.; Lackner, B.C.; Pirscher, B.; Borsche, M.; Foelsche, U. Atmospheric temperature change detection with GPS radio occultation 1995 to 2008. Geophys. Res. Lett. 2009, 36, L18702. [Google Scholar] [CrossRef] [Green Version]
  17. Steiner, A.K.; Lackner, B.C.; Ladstädter, F.; Scherllin-Pirscher, B.; Foelsche, U.; Kirchengast, G. GPS radio occultation for climate monitoring and change detection. Radio Sci. 2011, 46, RS0D24. [Google Scholar] [CrossRef] [Green Version]
  18. Steiner, A.K.; Ladstädter, F.; Ao, C.O.; Gleisner, H.; Ho, S.P.; Hunt, D.; Schmidt, T.; Foelsche, U.; Kirchengast, G.; Kuo, Y.H.; et al. Consistency and structural uncertainty of multi-mission GPS radio occultation records. Atmos. Meas. Tech. 2020, 13, 2547–2575. [Google Scholar] [CrossRef]
  19. Ho, S.-P.; Anthes, R.A.; Ao, C.O.; Healy, S.; Horanyi, A.; Hunt, D.; Mannucci, A.J.; Pedatella, N.; Randel, W.J.; Simmons, A. The COSMIC/FORMOSAT-3 radio occultation mission after 12 years: Accomplishments, remaining challenges, and potential impacts of COSMIC-2. Bull. Am. Meteorol. Soc. 2020, 101, E1107–E1136. [Google Scholar] [CrossRef] [Green Version]
  20. Schreiner, W.S.; Weiss, J.P.; Anthes, R.A.; Braun, J.; Chu, V.; Fong, J.; Hunt, D.; Kuo, Y.-H.; Meehan, T.; Serafino, W.; et al. COSMIC-2 radio occultation-first results. Geophys. Res. Lett. 2020, 47, e2019GL086841. [Google Scholar] [CrossRef]
  21. Ho, S.P.; Zhou, X.; Shao, X.; Zhang, B.; Adhikari, L.; Kireev, S.; He, Y.; Yoe, J.G.; Xia-Serafino, W.; Lynch, E. Initial assessment of the COSMIC-2/FORMOSAT-7 neutral atmosphere data quality in NESDIS/STAR using in situ and satellite data. Remote Sens. 2020, 12, 4099. [Google Scholar] [CrossRef]
  22. Kursinski, E.R.; Hajj, G.A.; Hardy, K.R.; Schofield, J.T.; Linfield, R. Observing Earth’s atmosphere with radio occultation measurements. J. Geophys. Res. 1997, 102, 23429–23465. [Google Scholar] [CrossRef]
  23. Lohmann, M. Analysis of Global Positioning System (GPS) radio occultation measurement errors based on Satellite de Aplicaciones Cientificas-C (SAC-C) GPS radio occultation data recorded in open-loop and phase-locked-loop mode. J. Geophys. Res. 2007, 112, D09115. [Google Scholar] [CrossRef] [Green Version]
  24. Syndergaard, S.; Kuo, Y.-H.; Lohmann, M.S. Observation operators for the assimilation of occultation data into atmospheric models: A review. In Atmosphere and Climate-Studies by Occultation Methods; Foelsche, U., Kirchengast, G., Steiner, A., Eds.; Springer: Berlin/Heidelberg, Germany, 2006; pp. 205–224. [Google Scholar] [CrossRef]
  25. Wee, T.-K.; Kuo, Y.-H. A perspective on the fundamental quality of GPS radio occultation data. Atmos. Meas. Tech. 2015, 8, 4281–4294. [Google Scholar] [CrossRef] [Green Version]
  26. Desroziers, G.; Berre, L.; Chapnik, B.; Poli, P. Diagnosis of observation, background and analysis-error statistics in observation space. Q. J. R. Meteorol. Soc. 2005, 131, 3385–3396. [Google Scholar] [CrossRef]
  27. Fletcher, S.J. Data Assimilation for the Geosciences; Elsevier: New York, NY, USA, 2017; p. 941. ISBN 978-0-12-80444-5. [Google Scholar]
  28. Kuo, Y.-H.; Wee, T.-K.; Sokolovskiy, S.; Rocken, C.; Schreiner, W.; Hunt, D.; Anthes, R.A. Inversion and error estimation of GPS radio occultation data. J. Meteorol. Soc. Jpn. 2004, 82, 507–531. [Google Scholar] [CrossRef] [Green Version]
  29. Kuo, Y.-H.; Schreiner, W.S.; Wang, J.; Rossiter, D.L.; Zhang, Y. Comparison of GPS radio occultation soundings with radiosondes. Geophys. Res. Lett. 2005, 32, L05817. [Google Scholar] [CrossRef] [Green Version]
  30. He, W.; Ho, S.; Chen, H.; Zhou, X.; Hunt, D.; Kuo, Y. Assessment of radiosonde temperature measurements in the upper troposphere and lower stratosphere using COSMIC radio occultation data. Geophys. Res. Lett. 2009, 36, L17807. [Google Scholar] [CrossRef] [Green Version]
  31. Ho, S.-P.; Zhou, X.; Kuo, Y.; Hunt, D.; Wang, J. Global Evaluation of Radiosonde Water Vapor Systematic Biases using GPS Radio Occultation from COSMIC and ECMWF Analysis. Remote Sens. 2010, 2, 1320–1330. [Google Scholar] [CrossRef] [Green Version]
  32. Sun, B.; Reale, A.; Seidel, D.J.; Hunt, D.C. Comparing radiosonde and COSMIC atmospheric profile data to quantify differences among radiosonde types and the effects of imperfect collocation on comparison statistics. J. Geophys. Res. 2010, 115, D23104. [Google Scholar] [CrossRef] [Green Version]
  33. Ladstädter, F.; Steiner, A.K.; Schwärz, M.; Kirchengast, G. Climate intercomparison of GPS radio occultation, RS90/92 radiosondes and GRUAN from 2002 to 2013. Atmos. Meas. Tech. 2015, 8, 1819–1834. [Google Scholar] [CrossRef] [Green Version]
  34. Ho, S.-P.; Kuo, Y.-H.; Zeng, Z.; Peterson, T. A comparison of lower stratosphere temperature from microwave measurements with CHAMP GPS RO data. Geophys. Res. Lett. 2007, 34, L15701. [Google Scholar] [CrossRef] [Green Version]
  35. Ho, S.-P.; Goldberg, M.; Kuo, Y.-H.; Zou, C.-Z.; Schreiner, W. Calibration of temperature in the lower stratosphere from microwave measurements using COSMIC radio occultation data: Preliminary results. Terr. Atmos. Ocean. Sci. 2009, 20, 87–100. [Google Scholar] [CrossRef] [Green Version]
  36. Feltz, M.L.; Knuteson, R.; Ackerman, S.; Revercomb, H. Application of GPS RO to the assessment of temperature profile retrievals from microwave and infrared sounders. Atmos. Meas. Tech. 2014, 7, 3751–3762. [Google Scholar] [CrossRef] [Green Version]
  37. Vergados, P.; Mannucci, A.J.; Ao, C.O. Assessing the performance of GPS radio occultation measurements in retrieving tropospheric humidity in cloudiness: A comparison study with radiosondes, ERA-Interim, and AIRS data sets. J. Geophys. Res. Atmos. 2014, 119, 7718–7731. [Google Scholar] [CrossRef]
  38. Rieckh, T.; Anthes, R.; Randel, W.; Ho, S.-P.; Foelsche, U. Evaluating tropospheric humidity from GPS radio occultation, radiosonde, and AIRS from high-resolution time series. Atmos. Meas. Tech. 2017, 11, 3091–3109. [Google Scholar] [CrossRef] [Green Version]
  39. Anthes, R.A.; Rieckh, T. Estimating observation and model error variances using multiple data sets. Atmos. Meas. Tech. 2018, 11, 4239–4260. [Google Scholar] [CrossRef] [Green Version]
  40. Sjoberg, J.P.; Anthes, R.A.; Rieckh, T. The three-cornered hat method for estimating error variances of three or more data sets-Part I: Overview and Evaluation. J. Atmos. Ocean. Technol. 2021, 38, 555–572. [Google Scholar] [CrossRef]
  41. Rieckh, T.; Sjoberg, J.; Anthes, R.A. The three-cornered hat method for estimating error variances of three or more data sets-Part II: Evaluating radio occultation and radiosonde observations, global model forecasts, and reanalyses. J. Atmos. Ocean. Technol. 2021, 38, 1777–1796. [Google Scholar] [CrossRef]
  42. Semane, N.; Anthes, R.; Sjoberg, J.; Ruston, B.; Healy, S. Comparison of Desroziers and Three-Cornered Hat Methods for Estimating COSMIC-2 Bending Angle Uncertainties. J. Atmos. Ocean. Tech. 2022, 39. (in press). [Google Scholar] [CrossRef]
  43. Hollingsworth, A.; Lönnberg, P. The statistical structure of short-range forecast errors as determined from radiosonde data. Part I: The wind field. Tellus A Dyn. Meteorol. Oceanogr. 1986, 38, 111–136. [Google Scholar] [CrossRef] [Green Version]
  44. Todling, R.; Semane, N.; Anthes, R.; Healy, S. The relationship between Desroziers and Three-Cornered Hat methods. Q. J. R. Meteorol. Soc. 2022, 142, 65–78. [Google Scholar]
  45. Sokolovskiy, S.; Schreiner, W.; Weiss, J.; Zeng, Z.; Hunt, D.; Braun, J. Initial Assessment of COSMIC-2 Data in the Lower Troposphere (LT) Joint 6th ROM SAF Data User Workshop and 7th IROWG Workshop; Konventum: Elsinore, Denmark, 2019; Available online: https://www.romsaf.org/romsaf-irowg-2019/en/open/1570202428.cf195c6aa62789cfb81f06d529ecdf0f.pdf/Sokolovskiy__IROWG-UCAR-C2-LT_Final.pdf (accessed on 4 March 2022).
  46. Sokolovskiy, S. Standard RO Inversions in the Neutral Atmosphere 2013–2020 (Processing Steps and Explanation of Data). 2021. Available online: https://www.cosmic.ucar.edu/sites/default/files/2021-09/cdaac_ro_retrieval_description_v1.pdf (accessed on 27 January 2022).
  47. Hersbach, H.; Bell, B.; Berrisford, P.; Hirahara, S.; Horányi, A.; Muñoz-Sabater, J.; Nicolas, J.; Peubey, C.; Radu, R.; Schepers, D. The ERA5 global reanalysis. Q. J. R. Meteorol. Soc. 2020, 146, 1999–2049. [Google Scholar] [CrossRef]
  48. Gelaro, R.; McCarty, W.; Suárez, M.J.; Todling, R.; Molod, A.; Takacs, L.; Randles, C.A.; Darmenov, A.; Bosilovich, M.G.; Reichle, R.; et al. The Modern-Era Retrospective Analysis for Research and Applications, version 2 (MERRA-2). J. Clim. 2017, 30, 5419–5454. [Google Scholar] [CrossRef]
  49. Melbourne, W.G.; Davis, E.S.; Duncan, C.B.; Hajj, G.A.; Hardy, K.R.; Kursinski, E.R.; Meehan, T.K.; Young, L.E.; Yunck, T.P. The Application of Spaceborne GPS to Atmospheric Limb Sounding and Global Change Monitoring; JPL Publication: La Cañada Flintridge, CA, USA, 1994; pp. 18–94, 147. Available online: https://ntrs.nasa.gov/citations/19960008694 (accessed on 4 March 2022).
  50. Ahmad, B.; Tyler, G.L. Systematic errors in atmospheric profiles obtained from Abelian inversion of radio occultation phase data. Effects of large-scale horizontal gradients. J. Geophys. Res. 1999, 104, 3971–3992. [Google Scholar]
  51. Syndergaard, S.; Kursinski, E.R.; Herman, B.; Lane, E.M.; Flittner, D.E. A Refractive Index Mapping Operator for Assimilation of Occultation Data. Mon. Weather Rev. 2005, 133, 2650–2668. [Google Scholar] [CrossRef]
  52. Withers, P. Prediction of uncertainties in atmospheric properties measured by radio occultation experiments. Adv. Space Res. 2010, 46, 58–73. [Google Scholar] [CrossRef]
  53. Lonitz, K.; Marquardt, C.; Bowler, N.; Healy, S. Impact Assessment of Commercial GNSS-RO Data; ECMWF Technical Note, Contract Report ESA Contract No. 4000131086120/NL/FF/a; European Centre for Medium Range Weather Forecasts: Reading, UK, 2021. [Google Scholar] [CrossRef]
  54. Lohmann, M.S. Application of dynamical error estimation for statistical optimization of radio occultation bending angles. Radio Sci. 2005, 40, RS3011. [Google Scholar] [CrossRef] [Green Version]
  55. Mannucci, A.J.; Ao, C.O.; Pi, X.; Iijima, B.A. The impact of large scale ionospheric structure on radio occultation retrievals. Atmos. Meas. Tech. 2011, 4, 2837–2850. [Google Scholar] [CrossRef] [Green Version]
  56. Danzer, J.; Scherllin-Pirscher, B.; Foelsche, U. Systematic residual ionospheric errors in radio occultation data and a potential way to minimize them. Atmos. Meas. Tech. 2013, 6, 2169–2179. [Google Scholar] [CrossRef] [Green Version]
  57. Coleman, C.J.; Forte, B. On the residual ionospheric error in radio occultation measurements. Radio Sci. 2017, 52, 918–937. [Google Scholar] [CrossRef] [Green Version]
  58. Gobiet, A.; Kirchengast, G. Advancements of Global Navigation Satellite System radio occultation retrieval in the upper stratosphere for optimal climate monitoring utility. J. Geophys. Res. 2004, 109, D24110. [Google Scholar] [CrossRef] [Green Version]
  59. Hocke, K. Inversion of GPS meteorology data. Ann. Geophys. 1997, 15, 443–450. [Google Scholar] [CrossRef]
  60. Syndergaard, S. On the ionosphere calibration in GPS radio occultation measurements. Radio Sci. 2000, 35, 865–883. [Google Scholar] [CrossRef]
  61. Gurvich, A.S.; Sokolovskiy, S.V. Reconstruction of a pressure field by remote refractometry from space. Izv. Atmos. Ocean. Phys. 1985, 21, 7–13. [Google Scholar]
  62. Zou, X.; Vandenberghe, F.; Wang, B.; Gorbunov, M.E.; Kuo, Y.-H.; Sokolovskiy, S.; Chang, J.C.; Sela, J.G.; Anthes, R.A. A ray-tracing operator and its adjoint for use in GPS/MET refraction angle measurements. J. Geophys. Res. 1999, 104, 22301–22318. [Google Scholar] [CrossRef] [Green Version]
  63. Zou, X.; Liu, H.; Anthes, R.A. A statistical summary of errors in the calculation of radio-occultation bending angles caused by a 2D approximation of ray tracing and the assumption of spherical symmetry of the atmosphere. J. Atmos. Ocean. Tech. 2002, 19, 51–64. [Google Scholar] [CrossRef]
  64. Healy, S.B. Radio occultation bending angle and impact errors caused by horizontal refractive index gradients in the troposphere: A simulation study. J. Geophys. Res. 2001, 106, 11875–11889. [Google Scholar] [CrossRef]
  65. Foelsche, U.; Kirchengast, G. Sensitivity of GNSS occultation profiles to horizontal variability in the troposphere: A simulation study. In Occultations for Probing Atmosphere and Climate, 2004; OPAC-1; Springer: New York, NY, USA, 2004; pp. 127–136, 408. ISBN 3-540-22350-9. [Google Scholar]
  66. Sokolovskiy, S.; Kuo, Y.-H.; Wang, W. Assessing the Accuracy of a Linearized Observation Operator for Assimilation of Radio Occultation Data: Case Simulations with a High-Resolution Weather Model. Mon. Weather Rev. 2005, 133, 2200–2212. [Google Scholar] [CrossRef] [Green Version]
  67. Gorbunov, M.E.; Lauritsen, K.B. Error estimate of bending angles in the presence of strong horizontal gradients. In New Horizons in Occultation Research; Steiner, A., Pirscher, B., Foelsche, U., Kirchengast, H., Eds.; Springer: New York, NY, USA, 2009; pp. 17–26. [Google Scholar] [CrossRef]
  68. Wee, T.-K. A variational regularization of Abel transform for GPS radio occultation. Atmos. Meas. Tech. 2018, 11, 1947–1969. [Google Scholar] [CrossRef] [Green Version]
  69. Liu, H.; Zou, X. Comparison of GNSS Bending Angle Simulations from the 1D Abel Transform and 2D Raytracing Operators in the Tropical Lower Troposphere. J. Aeronaut. Astronaut. Aviat. 2018, 50, 405–414. [Google Scholar] [CrossRef]
  70. Schlatter, T.W. Variational assimilation of meteorological observations in the lower atmosphere: A tutorial on how it works. J. Atmos. Sol.-Terr. Phys. 2000, 62, 1057–1070. [Google Scholar] [CrossRef]
  71. Baldwin, M.P.; Gray, L.J.; Dunkerton, T.J.; Hamilton, K.; Haynes, P.H.; Randel, W.J.; Holton, J.R.; Alexander, M.J.; Hirota, I.; Horinouchi, T. The quasi-biennial oscillation. Rev. Geophys. 2001, 36, 179–229. [Google Scholar] [CrossRef]
  72. Healy, S. Estimates of GNSS radio occultation bending angle and refractivity error statistics. ROM SAF Rep. 2016, 26, 27. Available online: https://www.romsaf.org/general-documents/rsr/rsr_26.pdf (accessed on 4 March 2022).
  73. Rieckh, T.; Anthes, R.A. Evaluating two methods of estimating error variances using simulated data sets with known errors. Atmos. Meas. Tech. 2018, 11, 4309–4325. [Google Scholar] [CrossRef] [Green Version]
Figure 1. Vertical cross sections of (a,c) mean zonal temperature from 0–60 km MSL and (b,d) mean specific humidity from 0–10 km MSL for August 2006 and 2021. Differences are shown in (e) and f) (August 2021 minus August 2006). Computed from the full ERA5 data set.
Atmosphere 13 00790 g001
Figure 2. Standard deviations of ERA5 (a) normalized refractivity and (b) normalized bending angles. Solid profiles are August 2006 and dashed profiles are August 2021. Based on ERA5 data used in the 3CH error estimates and equalized C1 and C2 latitude samples.
Atmosphere 13 00790 g002
Figure 3. Vertical profiles of the mean and standard deviations of the horizontal gradients of T in K/100 km (top row, (a,b)); q in g/kg/100 km (second row, (c,d)); refractivity in N-units/100 km (third row, (e,f)); and normalized N in %/100 km (bottom row, (g,h)). Gradients are computed from ERA5 reanalysis on constant MSL height surfaces for August 2021 and are presented for five latitude bands with 10° width.
Atmosphere 13 00790 g003
Figure 4. Penetration depths (minimum heights above ground level) of C1 in August 2006 (red) and C2 in August 2021 (black). The dashed red curve is C1 with 2013 processing, while the solid red curve is C1 with 2021 processing.
Atmosphere 13 00790 g004
Figure 5. C2 uncertainties (3CH error STD) for August 2021 for all profiles (GPS and GLONASS, solid line), GPS only (dashed line), and GLONASS only (dotted line). (a) bending angle, (b) refractivity.
Atmosphere 13 00790 g005
Figure 6. Differences of uncertainties (3CH error STD) of C2 (GPS, black) and C2 (GLONASS, red) and C1; bending angle (a) and refractivity (b). Negative values indicate C2 uncertainties are smaller than those of C1.
Atmosphere 13 00790 g006
Figure 7. Vertical profiles of error STD (uncertainties) of the bending angle (a) and refractivity (b) for C1 (atmPrf), ERA5, and MERRA-2 for August 2006.
Atmosphere 13 00790 g007
Figure 8. Vertical profiles of error STD (uncertainties) of bending angle (a) and refractivity (b) of C2 (GPS only), ERA5, and MERRA-2 for August 2021.
Atmosphere 13 00790 g008
Figure 10. 3CH estimates of bending angle error STD for C2 (GPS) for August 2021 by 10° latitude bands. (a) 0–60 km. (b) enlargement of (a) to highlight 0–10 km.
Atmosphere 13 00790 g010
Figure 11. Differences in 3CH error STD of C2 (GPS only) minus C1 for bending angle (a) and refractivity (b).
Atmosphere 13 00790 g011
Table 1. Major sources of random errors (uncertainties) and bias errors in radio occultation observations and additional sources introduced by error estimates made by comparison with other data sets.
SourcePredominant AltitudesComments
Orbit, receiver thermal noise, transmitter and receiver clock errorsUpper levels, above 30 kmDecrease exponentially with decreasing altitude.
Satellite multipathUpper levels, above 30 kmInterference from signals scattered off solar panels and other objects on the satellite. Probably small.
Ionospheric residuals: remaining errors after correction due to ionospheric disturbances and scintillationsUpper levels, above 30 km. F2 scintillation can affect profiles at all levels.Dominant source of uncertainty above 30 km. Effect varies with solar and local diurnal cycles and latitude. Primarily random errors, although there are small systematic higher-order residual errors that can be important for climate applications. Scintillations from sporadic-E are the biggest challenge.
Upper boundary condition: initialization of retrieval; optimal estimation of BAUpper levels, above 30 kmStatistical optimization reduces uncertainty but may introduce bias errors.
L1 and L2 receiver tracking errorsMainly in the troposphere, 0–10 kmReduced using open-loop tracking. Deeper useful signal can be obtained with more power (antenna gain).
Transformation of reference frame to local center of Earth’s curvatureLower levels, below ~20 kmCorrection for Earth’s oblateness. Residual error after correction is mostly random but with vertical correlations.
Horizontal variations in refractivity (function of temperature and/or water vapor) producing a lack of spherical symmetryUTLS and troposphere, especially the lower troposphereRepresentativeness error when RO observations are interpreted as in situ measurements.
Geometric or wave optics retrievalAll levelsBoth assume spherical symmetry. Vertical resolution of GO lower than WO, so the vertical footprint varies. Vertical filtering can reduce this.
Transition from geometric optics (GO) to wave optics (WO)Tropopause region, 10–20 km.Transition methods vary. EUMETSAT has no transition and uses WO at all levels.
Superrefraction (SR) or ducting in atmosphereLower troposphere, especially at the ABL topCan calculate a BA profile in SR, but a unique refractivity profile is indeterminant from BA (underdetermined problem). Creates significant negative bias in N and BA.
Atmospheric multipathMoist lower troposphereResults in tracking errors. Multipath disentanglement assumes spherical symmetry.
Surface reflectionsLower troposphereWith assumption of spherical symmetry, direct and reflected rays can be separated by wave optics multipath disentanglement. Since reflected rays have smaller BA than direct rays, extraction of BA from a mixed spectrum may result in additional negative BA bias.
Other data sets (models and observations other than RO) Differences introduced when data sets other than RO observations are used to compare with RO.
Horizontal variability or gradients in refractivityUTLS and troposphere, especially the lower troposphereCreates horizontal representativeness (footprint) differences and collocation errors, as well as errors in the forward model.
Vertical variability, especially inversionsUTLS and lower troposphere, especially near the ABL topCreates vertical representativeness (footprint) differences and collocation errors.
Temporal variabilityAll levelsMinor, through collocation errors.
Forward modeling errorsUTLS and lower troposphere, especially near the ABL topPart of representativeness error. Temperature, pressure, and water vapor must be converted to RO bending angles using forward models. Use of two- or three-dimensional forward modelling can reduce representativeness errors resulting from a lack of spherical symmetry.
Error correlations of data set with RO observationsAll levelsExample is a model analysis or forecast that assimilates RO observations. Accuracy of error estimates is decreased with error correlations among the comparative DS values.
Quality controlAll levelsWill change estimated error statistics; more stringent QC produces smaller estimated error statistics but reduces the number of observations in a sample.
Publisher’s Note: MDPI stays neutral with regard to jurisdictional claims in published maps and institutional affiliations.