
Analysing the Main Standards for Climate-Induced Mechanical Risk in Heritage Wooden Structures: The Case of the Ringebu and Heddal Stave Churches (Norway)


Abstract
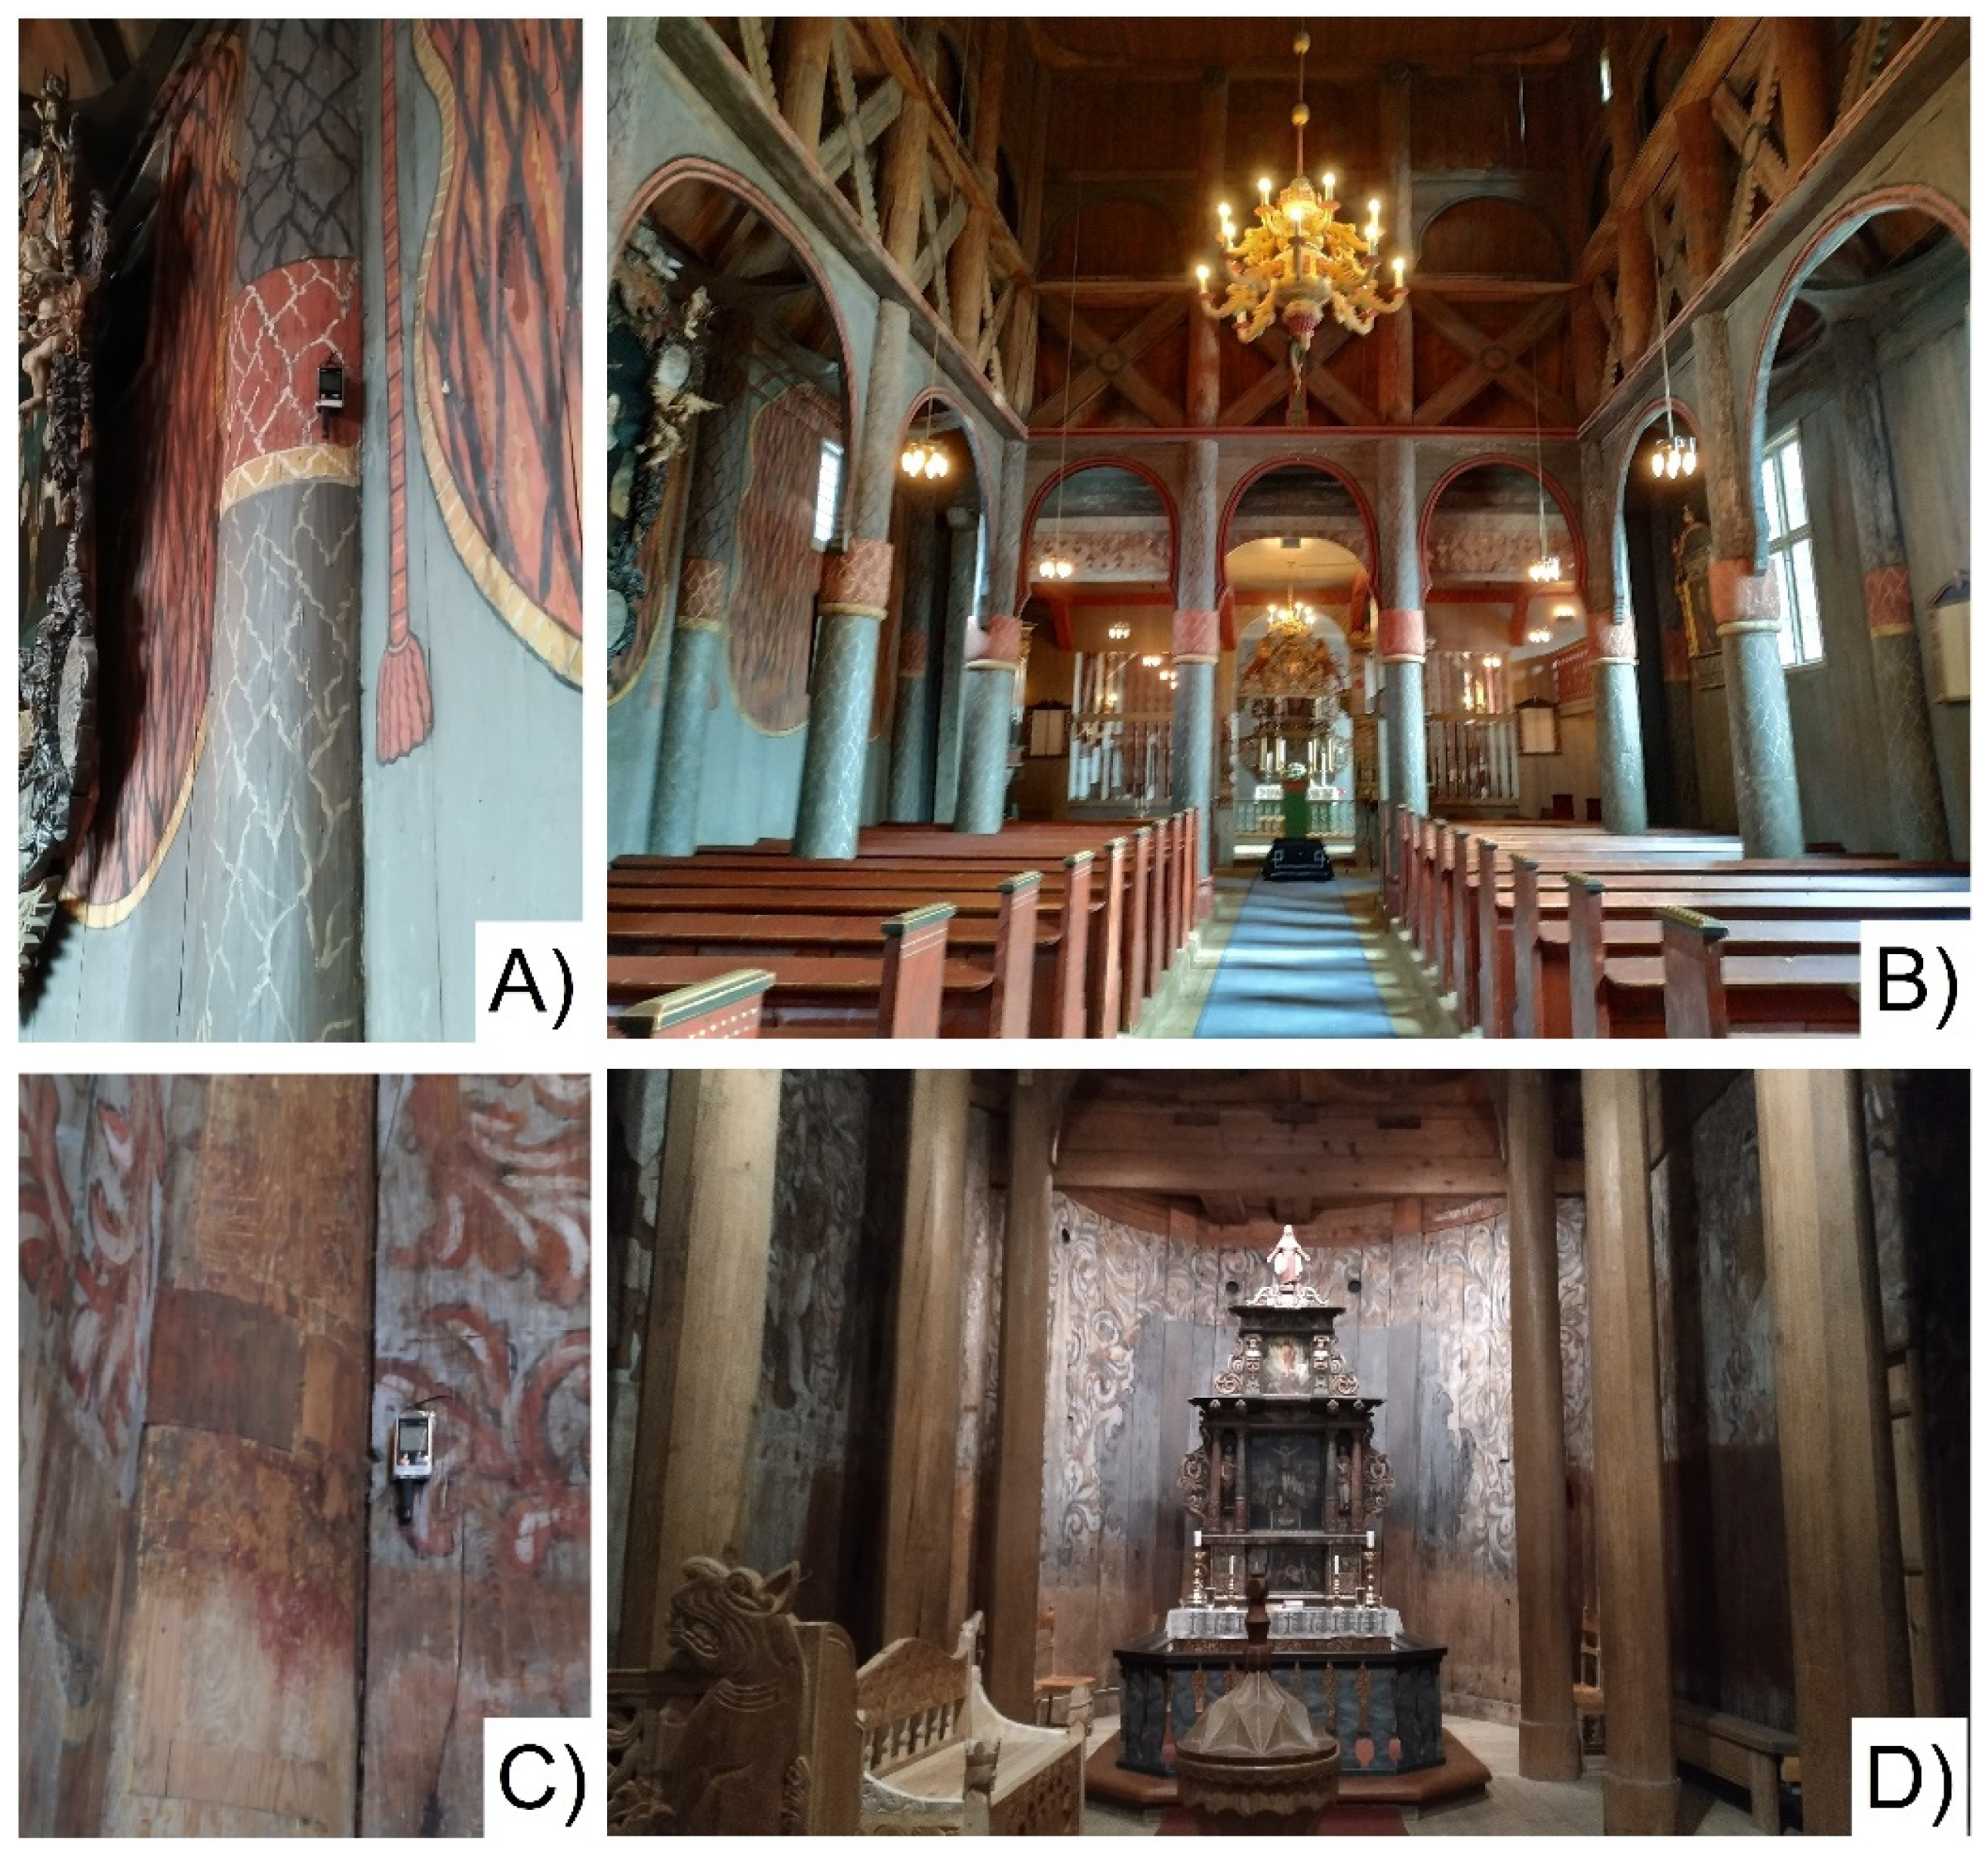
:1. Introduction
2. Materials and Methods
3. Results and Discussion
3.1. General Assessments on Microclimate
3.2. Implementation of the Standards
- (i).
- The “tailored to the case study” policies have been introduced through the EN 15757 and have shown to be quite reliable in the first analysis, even if improvable;
- (ii).
- Each museum/gallery/historic building has its own budget to rely on and its proper source of energy support, depending on the country it is in and on the national politics in matters of conservation and energy sources. This means that the implementation of generalized guidelines does not reflect the actual possibilities and needs anymore.
- (i).
- Limiting the use of artificial heating from November to February as much as possible. The limit needs to be set not only on the duration of the heated periods (in Heddal, the heated period lasts several months and is extremely energy-consuming) but particularly on their entity (in Ringebu, the indoor environment sometimes reaches a T of 20 °C, while the natural outdoor T is −10 °C).
- (ii).
- Limiting the number of waivable events in cold periods of the year or shifting them to temperate months, thus avoiding a severe use of artificial heating and implementing a mild artificial microclimate policy exclusively during the mid-seasons.
4. Conclusions
- (i).
- A critical discussion on the optimal climatic thresholds defined by the protocols allowed to delineate the points of weakness of the protocols themselves, in relation to the actual data collected through the monitoring campaign;
- (ii).
- Standards based on fixed thresholds (UNI 10829, D. Lgs. 122 art. 150 par. 6, EN 16893, ISO 19815, ASHRAE Chap. 24) have been based on enlarging the allowable range for RH over time, due to economic and energetic reasons. This is translated in a possible underestimation of the actual climate-induced mechanical risk on assets and artefacts made of wood;
- (iii).
- The only standard based on moving thresholds is the EN15757, which defines the allowable range for RH following the actual trend of the climatic timeseries;
- (iv).
- Applying the standards’ (fixed and moving) thresholds to real microclimatic data has brought to light that severe variations of RH occur even in the areas that are considered safe by the protocols (Figure 5).
Author Contributions
Funding
Institutional Review Board Statement
Informed Consent Statement
Data Availability Statement
Acknowledgments
Conflicts of Interest
Appendix A

References
- Verticchio, E.; Frasca, F.; Bertolin, C.; Siani, A.M. Climate-Induced Risk for the Preservation of Paper Collections: Comparative Study among Three Historic Libraries in Italy. Build. Environ. 2021, 206, 108394. [Google Scholar] [CrossRef]
- Guideline on Technical and Scientific Criteria and Standards of Functioning and Development of Museum; Dlgs 122/98 Art. 150 Par6; Springer: Berlin/Heidelberg, Germany, 2001.
- UNI 10829 Standard; Beni di Interesse Storico e Artistico—Condizioni Ambientali di Conservazione—Misurazione ed Analisi. Ente Nazionale Italiano di Unificazione: Milan, Italy, 1999.
- EN 15757 Standard; Conservation of Cultural Property—Specifications for Temperature and Relative Humidity to Limit Climate-Induced Mechanical Damage in Organic Hygroscopic Materials. Irish Standard: Dublin, Ireland, 2010.
- UNI EN 16893; Conservazione Del Patrimonio Culturale—Specifiche per La Scelta Del Luogo, La Costruzione e Le Modifiche Di Edifici o Sale Finalizzate Al Deposito o All’esposizione Di Collezioni Del Patrimonio Culturale. UNI – Ente Nazionale Italiano di Unificazione: Milan, Italy, 2018.
- ISO 19815; Management of the Environmental Conditions for Archive and Library Collections. ISO: Geneva, Switzerland, 2018.
- Chapter 24, Museums, Galleries, Archives, and Libraries. In ASHRAE Handbook—HVAC Applications; American Society of Heating, Refrigerating and Air- Conditioning Engineers: Atlanta, GA, USA, 2019.
- Huijbregts, Z.; Kramer, R.P.; Martens, M.H.J.; van Schijndel, A.W.M.; Schellen, H.L. A Proposed Method to Assess the Damage Risk of Future Climate Change to Museum Objects in Historic Buildings. Build. Environ. 2012, 55, 43–56. [Google Scholar] [CrossRef]
- Camuffo, D.; Bertolin, C.; Bonazzi, A.; Campana, F.; Merlo, C. Past, Present and Future Effects of Climate Change on a Wooden Inlay Bookcase Cabinet: A New Methodology Inspired by the Novel European Standard EN 15757:2010. J. Cult. Herit. 2014, 15, 26–35. [Google Scholar] [CrossRef]
- Bertolin, C.; Camuffo, D.; Bighignoli, I. Past Reconstruction and Future Forecast of Domains of Indoor Relative Humidity Fluctuations Calculated According to EN 15757:2010. Energy Build. 2015, 102, 197–206. [Google Scholar] [CrossRef]
- Silva, H.E.; Henriques, F.M.A. Hygrothermal Analysis of Historic Buildings: Statistical Methodologies and Their Applicability in Temperate Climates. Struct. Surv. 2016, 34, 12–23. [Google Scholar] [CrossRef]
- Silva, H.E.; Henriques, F.M.A. Preventive Conservation of Historic Buildings in Temperate Climates. The Importance of a Risk-Based Analysis on the Decision-Making Process. Energy Build. 2015, 107, 26–36. [Google Scholar] [CrossRef]
- Muñoz-González, C.M.; León-Rodríguez, A.L.; Navarro-Casas, J. Air Conditioning and Passive Environmental Techniques in Historic Churches in Mediterranean Climate. A Proposed Method to Assess Damage Risk and Thermal Comfort Pre-Intervention, Simulation-Based. Energy Build. 2016, 130, 567–577. [Google Scholar] [CrossRef]
- García-Diego, F.J.; Verticchio, E.; Beltrán, P.; Siani, A. Assessment of the Minimum Sampling Frequency to Avoid Measurement Redundancy in Microclimate Field Surveys in Museum Buildings. Sensors 2016, 16, 1291. [Google Scholar] [CrossRef] [PubMed]
- Frasca, F.; Siani, A.M.; Casale, G.R.; Pedone, M.; Bratasz, Ł.; Strojecki, M.; Mleczkowska, A. Assessment of Indoor Climate of Mogiła Abbey in Kraków (Poland) and the Application of the Analogues Method to Predict Microclimate Indoor Conditions. Environ. Sci. Pollut. Res. 2017, 24, 13895–13907. [Google Scholar] [CrossRef] [PubMed]
- Arfvidsson, J.; Bjelke-Holtermann, B.; Mattsson, J. Status Determination of a Historical Building Including Measures for Three Different Scenarios. Energy Procedia 2017, 132, 939–944. [Google Scholar] [CrossRef]
- Marchetti, A.; Pilehvar, S.; Hart, L.; Leyva Pernia, D.; Voet, O.; Anaf, W.; Nuyts, G.; Otten, E.; Demeyer, S.; Schalm, O.; et al. Indoor Environmental Quality Index for Conservation Environments: The Importance of Including Particulate Matter. Build. Environ. 2017, 126, 132–146. [Google Scholar] [CrossRef]
- ASHRAE Handbook—HVAC Applications; American Society of Heating Refrigerating and Air-Conditioning Engineers: Atlanta, GA, USA, 2011; ISBN 9781936504077.
- Thomson, G. The Museum Environment; Butterworths: London, UK, 1978. [Google Scholar]
- Bertolin, C.; Karvan, P.; Berto, F. Natural Climate Stress Caused by a Hygric Change on Coated Pine Samples: Theoretical Formulation and Experimental Validation. Eng. Fail. Anal. 2021, 129, 105669. [Google Scholar] [CrossRef]
- Califano, A.; Baiesi, M.; Bertolin, C. Novel Risk Assessment Tools for the Climate-Induced Mechanical Decay of Wooden Structures: Empirical and Machine Learning Approaches. Forces Mech. 2022, 7, 100094. [Google Scholar] [CrossRef]
- Kompatscher, K.; Kramer, R.P.; Ankersmit, B.; Schellen, H.L. Intermittent Conditioning of Library Archives: Microclimate Analysis and Energy Impact. Build. Environ. 2019, 147, 50–66. [Google Scholar] [CrossRef]
- Coelho, G.B.A.; Entradas Silva, H.; Henriques, F.M.A. Impact of Climate Change in Cultural Heritage: From Energy Consumption to Artefacts’ Conservation and Building Rehabilitation. Energy Build. 2020, 224, 110250. [Google Scholar] [CrossRef]
- Silva, H.E.; Henriques, F.M.A. Microclimatic Analysis of Historic Buildings: A New Methodology for Temperate Climates. Build. Environ. 2014, 82, 381–387. [Google Scholar] [CrossRef]
- Huerto-Cardenas, H.E.; Aste, N.; Del Pero, C.; Della Torre, S.; Leonforte, F. Effects of Climate Change on the Future of Heritage Buildings: Case Study and Applied Methodology. Climate 2021, 9, 132. [Google Scholar] [CrossRef]


| Document | Year | Type | Indications | Active (Yes/No) | Ref. |
|---|---|---|---|---|---|
| D. Lgs. 112/98, art. 150, par. 6 | 1998 | Legislative Decree | For wooden manufacts RH = 40% ÷ 65%, T = 19°C ÷ 24 °C | N | [2] |
| UNI 10829 | 1999 | Standard | For wooden furniture and sculptures RH = 50% ÷ 60%, T = 19°C ÷ 24 °C | Y | [3] |
| EN 15757 | 2010 | Standard | RH = limited within safe bands, T = no limits | Y | [4] |
| EN 16893 | 2018 | Standard | For organic hygroscopic materials RH = 30% ÷ 65% | Y | [5] |
| ISO 19815 | 2018 | Standard | For organic hygroscopic materials RH = 30% ÷ 65% | Y | [6] |
| ASHRAE Handbook (Chapter 24) | 2019 | Guidelines | For historical buildings, the B climate class is recommended: RH = 30% ÷ 70% | Y | [7] |
| Church | Type of Heating | Heated Period |
|---|---|---|
| Ringebu | Sporadic (only in case of events)—SIH | Mid-September–Mid-April |
| Heddal | Continuous (≈5 °C) and sporadic (in case of events)—CMH | October–May |
Publisher’s Note: MDPI stays neutral with regard to jurisdictional claims in published maps and institutional affiliations. |
© 2022 by the authors. Licensee MDPI, Basel, Switzerland. This article is an open access article distributed under the terms and conditions of the Creative Commons Attribution (CC BY) license (https://creativecommons.org/licenses/by/4.0/).
Share and Cite
Califano, A.; Baiesi, M.; Bertolin, C. Analysing the Main Standards for Climate-Induced Mechanical Risk in Heritage Wooden Structures: The Case of the Ringebu and Heddal Stave Churches (Norway). Atmosphere 2022, 13, 791. https://doi.org/10.3390/atmos13050791
Califano A, Baiesi M, Bertolin C. Analysing the Main Standards for Climate-Induced Mechanical Risk in Heritage Wooden Structures: The Case of the Ringebu and Heddal Stave Churches (Norway). Atmosphere. 2022; 13(5):791. https://doi.org/10.3390/atmos13050791
Chicago/Turabian StyleCalifano, America, Marco Baiesi, and Chiara Bertolin. 2022. "Analysing the Main Standards for Climate-Induced Mechanical Risk in Heritage Wooden Structures: The Case of the Ringebu and Heddal Stave Churches (Norway)" Atmosphere 13, no. 5: 791. https://doi.org/10.3390/atmos13050791