Article

Response of Very Small Glaciers to Climate Variations and Change: Examples from the Pirin Mountains, Bulgaria

Department of Geography, Ecology and Environmental Protection, Faculty of Mathematics and Natural Sciences, South-West University “Neofit Rilski”, ul. Ivan Mihailov 66, 2700 Blagoevgrad, Bulgaria
Atmosphere 2022, 13(6), 859; https://doi.org/10.3390/atmos13060859
Submission received: 31 March 2022 / Revised: 19 May 2022 / Accepted: 21 May 2022 / Published: 24 May 2022
(This article belongs to the Special Issue Atmospheric Composition and Regional Climate Studies in Bulgaria)

Abstract

:
Very small glaciers (glacierets) react strongly to climatic variations. This is well expressed in their interannual size changes, which are most evident in autumn, at the end of the glacial mass balance year. This study presents results from the detailed research of two very small glaciers in the highest northern part of the Pirin Mountains of Bulgaria: Snezhnika and Banski suhodol. Systematic size measurements of these firn-ice bodies, which started in the 1990s and have been made simultaneously for a period of 13 years, show large inter-annual amplitudes against the background of a decreasing trend in response to climate warming. However, the relations are not straightforward, which is demonstrated when comparing size changes to climate data, including logger data obtained from glacier vicinity. This fact makes predictions for the changes in the local climate of high mountain cirques still relatively uncertain.

1. Introduction

1.1. Introduction to the Problem
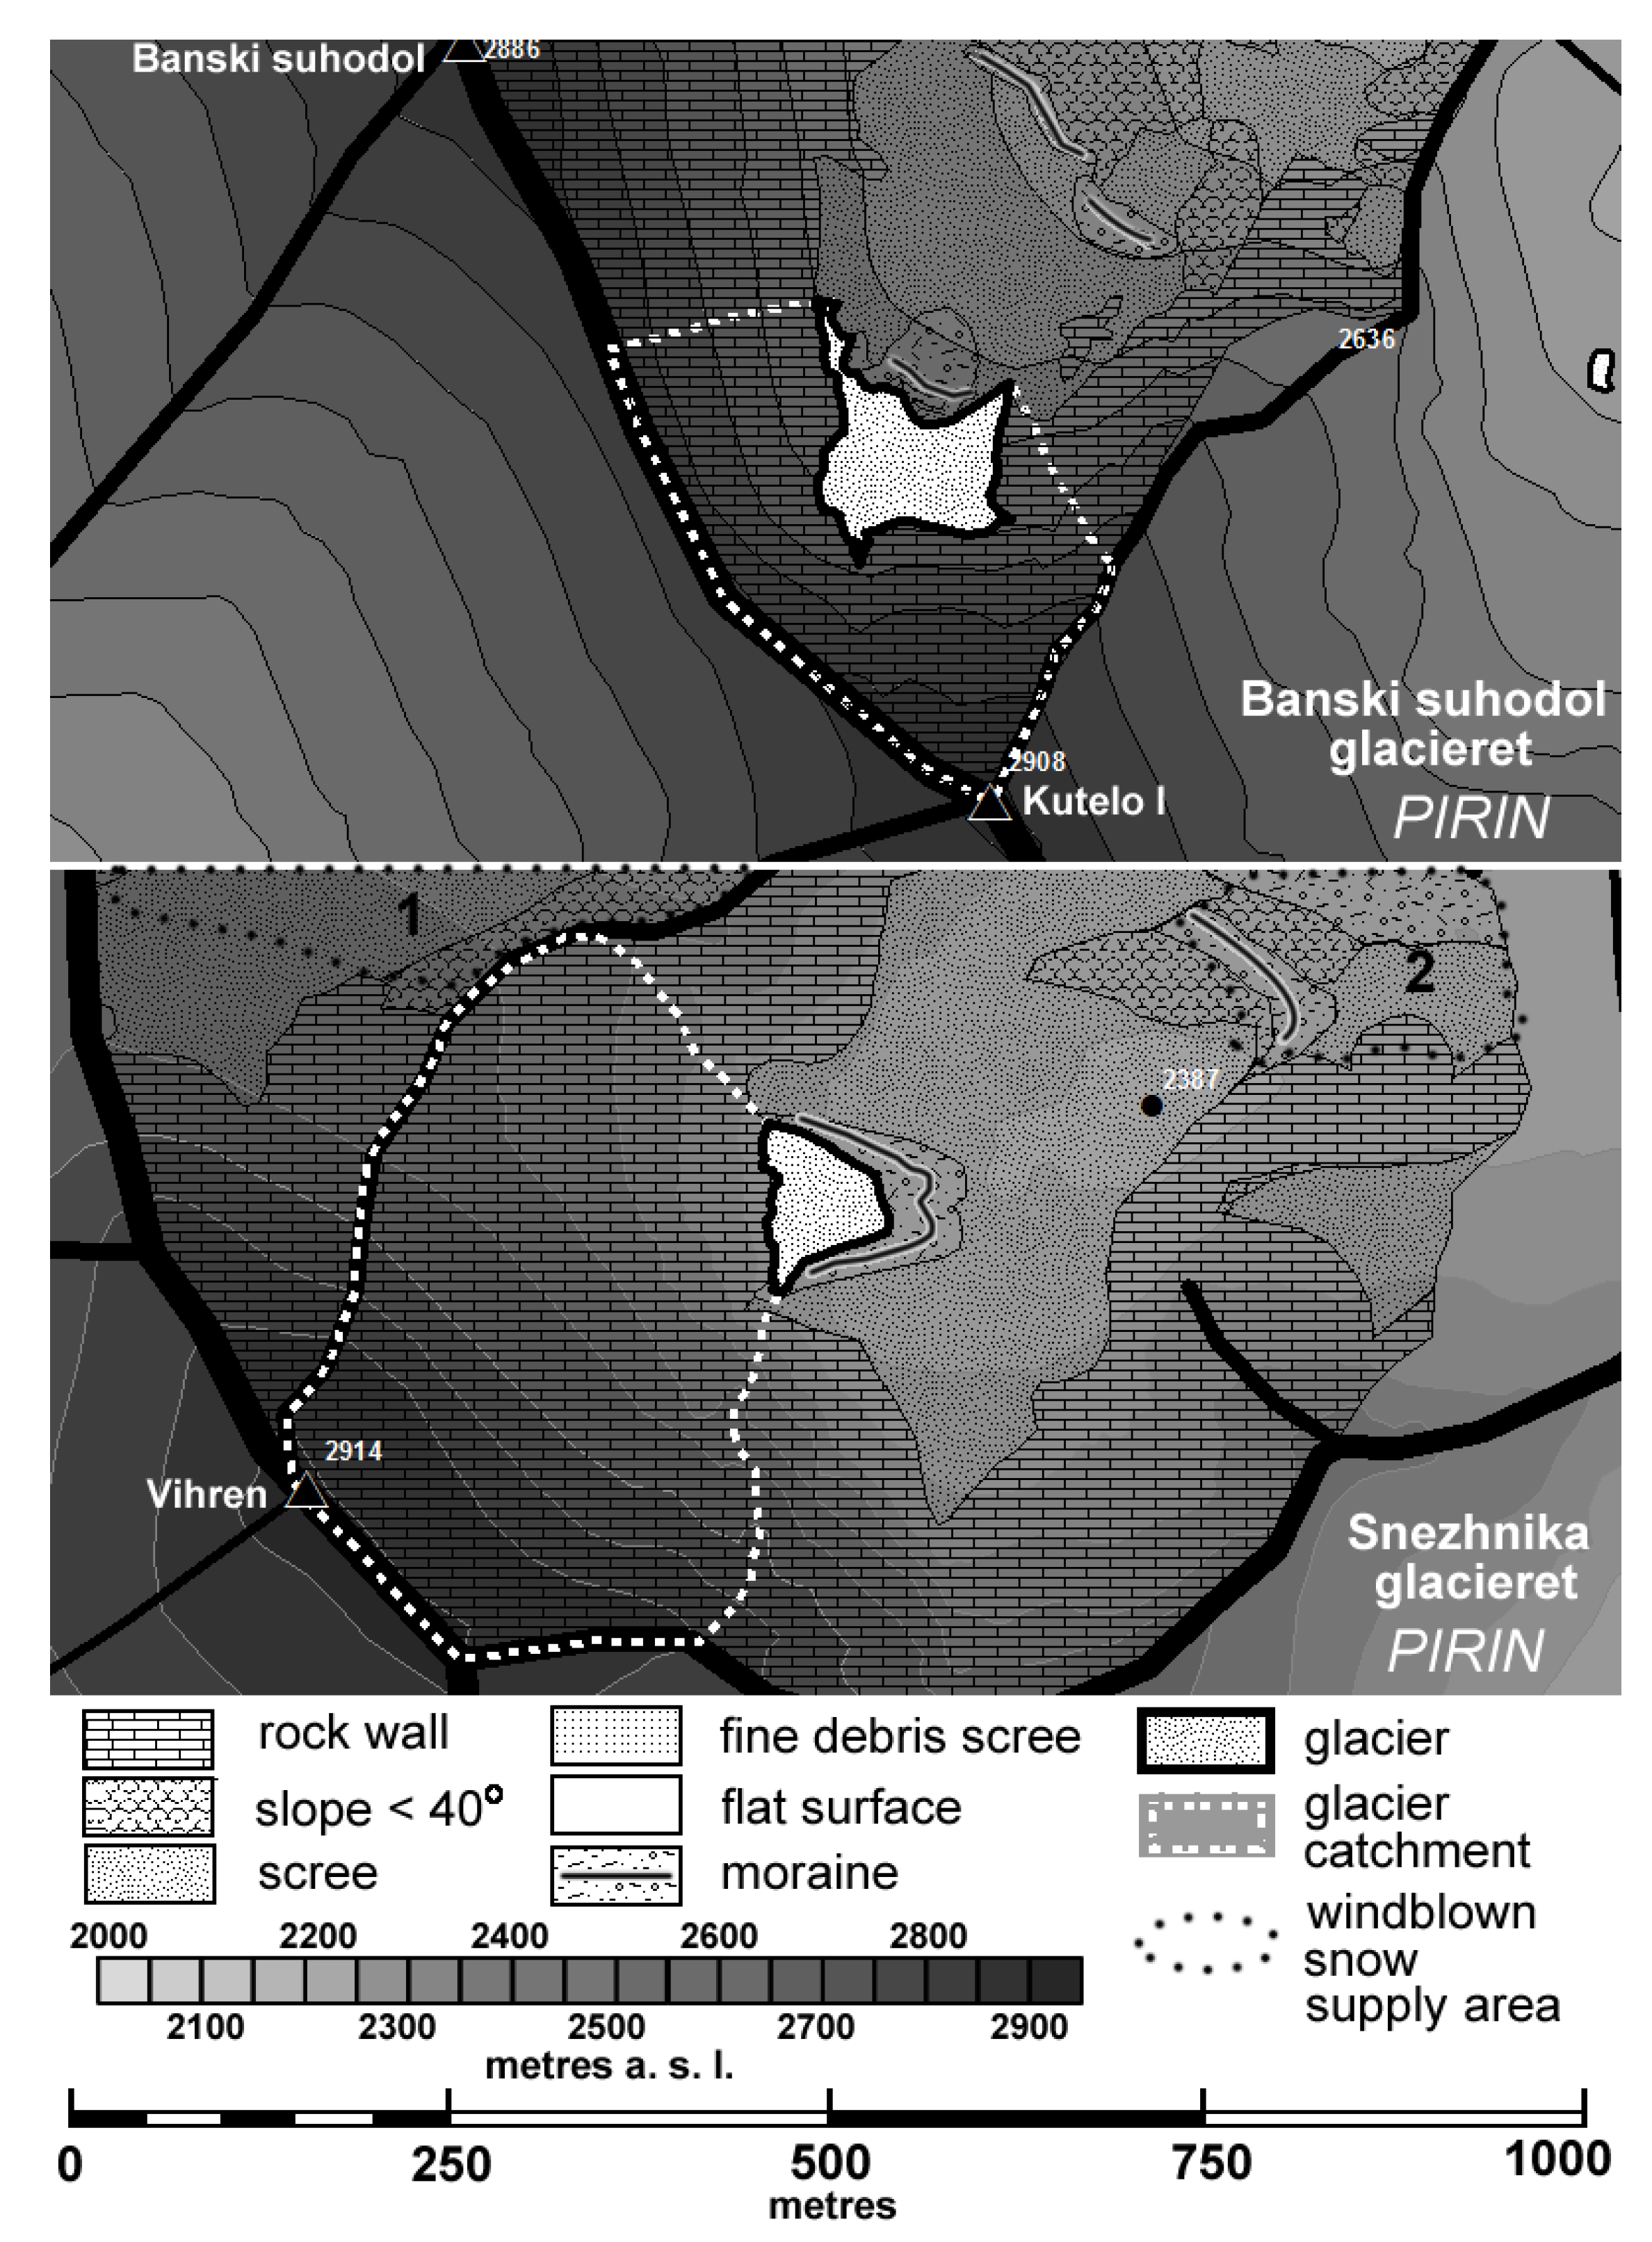
Glaciers have been considered worldwide as one of the best indicators of climate variations and change [1,2,3,4]. Very small glaciers (sensu [5]), in particular, are especially appropriate to demonstrate the effects of short-term climatic variations [6], as in a given year their entire surface is most often subject to either positive or negative mass balance [2,6,7]. The relation between glacier size and climatic factors is, however, not straightforward for small glaciers, as the smaller a glacier is, the stronger the influence of local topography over the persistence of the firn-ice body.
As a result of the extensive research which has been undertaken in the last three decades, it has been proved that a number of permanent firn-ice bodies still persist in the highest mountain areas on the Balkan Peninsula, and that at least some of them still have characteristicsof very small glaciers [8]. Examples of this include two glacierets in the Pirin Mountains of Bulgaria, the Debeli namet glacier in the Durmitor massif of Montenegro, and several glacierets in the central parts of Prokletije Mountains of Albania [2,3,6,8,9,10,11,12,13,14].
In environments which are marginal in terms of glacier formation and preservation [2,3,6], it is often complicated to properly distinguish between the different firn-ice body categories. The two largest firn-ice bodies in the Pirin Mountains were categorized as very small glaciers (glacierets, Mikrogletscher by [6]) on the basis of their morphology: a surface almost clean of debris, several decades to a century old ice near the bottom [6], clear indications of rotational downslope movement [13,15], and very fresh glacial striations on the easily dissolvable marble bedrock [8]. However, in the years of severe shrinkage, those firn-ice bodies rather resembled glacial ice patches as defined by [16]. In the Northern Pirin Mountains there are also several other firn-ice bodies that closely match the definition of an ice patch (sensu [16]): stagnant masses with low surface inclination which fill glacio-karstic dolines [8] (they are not subject of this study, however).
Typically, most firn-ice bodies in the Balkans undergo large interannual size fluctuations, and for them it is not uncommon to temporarily switch between various categories (glaciers, glacierets, ice patches). For example, in 2017 most of the glacierets in the Dinaric Mountains, and also the Debeli namet glacier, turned into stagnant ice patches with no indications of motion, completely or partly covered by debris, but in the next year they returned to their “normal” state [14,15]. As small firn-ice bodies are very dynamic in temporal aspect, what matters most for their proper categorization (as glaciers, glacierets, ice patches, snow patches, etc.) is their long-term prevalent state over recent decades.
Perennial preservation of snow and ice at several sites, particularly in these mountain locations, is favored by the relatively high altitude of cirque floors (from the Pleistocene glaciation), by the carbonate rocks (limestone, marble) which have a light color and high albedo, by the seepage of waters underground down in the karstic caverns during spring snowmelt (thus glacierets and snow patches suffer much less intensive basal melt), by the presence of deep, strongly shaded locations on cirque floors, and by the considerable inputs in such locations of avalanche and windblown snow [2,15,17].
The annual cycle of such small glaciers comprises two seasonal phases: accumulation season, which in our geographical conditions lasts approximately from November to April, and the ablation season, from May to October. In autumn, the state of glacierets represents the balance between the two seasons. This time has been accepted as the end of ice bodies’ hydrological, or mass-balance, year [18,19].
The present work focuses in detail on the interannual dynamics of the two glacierets in the Pirin Mountains of Bulgaria and discusses the relations between glacier behavior and recent climatic variations. In support, data about ground temperature from loggers installed at sites near the glacierets are used. The main goal of the study is to evaluate the reaction of small glacial bodies in our region to the contemporary climate change, which for the high mountains has been expressed most of all by increase in temperatures.

1.2. Study Area

The Pirin Mountains, situated in SW Bulgaria, are part of the vast Rila-Rhodope massif. The mountains represent a horst of a rhomboid configuration [20,21] (Figure 1). Their highest summits, which rise 2000–2500 m above the surrounding valleys and depressions, exceed the altitude of 2800 m above sea level and culminate at the 2914 m high Vihren peak (third highest on the Balkans).
The Pirin Mountains are mainly built up of granitoids and metamorphic rocks [21]. Three granitic intrusions constitute the geological core of the massif. They are exposed in the northwest, in the center, and in the southern part of Pirin. Around and between the granitic bodies, a series of gneiss, schist, and marble are widely exposed [20]. In the northern part of the Pirin Mountains, marbles build up a compact ridge shaped as an arch, open to the southwest, which is the highest section of all the Pirin Mountains. Some sedimentary and volcanic rocks are found in mountain periphery.
The current climate of Pirin is a mountain modification of a Mediterranean climate with some temperate influences. Its montane character is demonstrated by the difference in mean annual air temperature: about +14 °C at Sandanski (190 m a.s.l.) and −1.4 °C at Vihren peak [22]. Annual precipitation in the high mountain area is estimated to be around 1100 mm/y, most of which falls between November and April [23]. According to the Köppen–Geiger classification, the climate of Pirin changes in altitude from hot summer Mediterranean (Csa) in the lower foothills to damp temperate (Cfb) at 700–1000 m a.s.l., humid continental (D) above 1000 m a.s.l., and tundra climate (E) above 2000 m a.s.l. [24].
During the Pleistocene ice ages, the Pirin Mountains were subject to an extensive valley glaciation. If the findings of [25] in the neighboring Rila Mountains and the similarity in the state of Pirin and Rila moraines are taken in mind, glaciers reached their maximum extent in the Last Glacial Maximum, when the glacier equilibrium line altitude (ELA) dropped down to 2200–2250 m [20,21]. More than 35 cirques were formed in the high mountain zone [26], and at their maximum extent, valley glaciers reached down to 1200–1500 m a.s.l. The extensive Pleistocene glaciers eroded the mountain, dissected the relief, and provided favorable conditions for snow accumulation and preservation, especially in high cirques.
Both glacierets are situated on a carbonate (marble) bedrock, while on silicate rocks perennial snow or ice masses are missing, both in Pirin and in the neighboring higher Rila Mountains.
Snezhnika glacieret (Figure 2a) is located between 2400 and 2450 m a.s.l. in the glacio-karstic cirque Golemia Kazan, at the NE foot of Vihren peak. The glacieret has an eastern exposure, a shield-like shape, and a slightly concave surface, with inclinations usually ranging from 15–20° at the base to 35-40° in the upper end. The average area for the last 25 years has been about 0.5 ha, and the maximum thickness usually ranges between 10–12 m [6,15,27,28]. The glacieret is backed by the 450 m high NE wall of Vihren peak, shaped like a funnel with an almost vertical lower section. The funnel collects the avalanche snow in winter from an area that is more than 20 times larger than the glacieret itself, producing sometimes 20 m thick accumulations [29,30]. This phenomenon allows the glacieret to survive summers despite its half-sunlit location (there are few hours of direct sunshine over glacieret surface even in November) [15]. The glacieret is surrounded by a morainic ridge of angular boulders, which rises 2 to 5 m above the glacieret surface.
At present, Snezhnika glacieret is considered the southernmost ice body in Europe [9].
Banski suhodol glacieret (Figure 2b) is situated about 1 km to the northwest from Snezhnika, at altitudes between 2620 and 2700 m in the upper section of the large Banski suhodol cirque [8,31]. It has a northern exposure and is backed by a 110–220 m high marble wall. In the period 2009–2021, this glacieret had an average area of 1 ha. In August 2017, the maximum thickness of the glacier was about 17 m—data were obtained by geophysical sounding ([28]). The glacieret has a complicated contour and a slightly concave surface. Near its front, bedrock with fresh glacial striations is often exposed in autumn, especially when the size is smaller than average. A series of two morainic ridges have been developed, but only in the central section of the glacieret front, while at both ends the debris is being constantly removed by avalanches and debris flows.

2. Materials and Methods

2.1. Measurements of Glacieret Size

We measured the size (real surface area) of Snezhnika glacieret once every year over the period 2008–2021, and the size of Banski suhodol glacieret once every year from 2009–2021. Measurements were taken in autumn, usually between September 10 and November 1, by an application of various techniques: measurements of distances on the field with a measuring tape and a laser range finder, repetitive photography from fixed positions (similar techniques have been implemented in the Himalayas by [4]), and also GPS measurements, which were taken into account with caution, due to the weak signal in the deep cirques, especially close to the rock walls.
For calculating the size of Snezhnika glacieret, its perimeter was measured as a sum of the lengths of multiple straight lines. Such an approach was possible due to the relatively simple contour of the surface. For Banski suhodol glacieret, the first measurement in 2009 was taken with a tape, as a grid of lengths and widths, which were then overlayed on a satellite image to outline the glacieret’s quite complicated contour. For registering the subsequent changes, multiple methods were used. Five fixed points were marked with paint on the moraine ridge near the glacieret, and distances between those points and the position of glacieret front were measured. Four fixed remote positions for repetitive photographing have been marked with paint on the ground: one on a roche moutonnee 500 m to the northwest, to register variations in the upper parts of the glacieret, and three on the main ridge above the rock wall to the south, to record changes in the front.
For the final calculation of glacierets surface area, data obtained from the field (distances, images) were digitized and processed in ArcGIS in the correct scale.

2.2. Collection of Climatic Data

Climatic data were collected from climate archives and from stationary equipment on the field.
At Kazana shelter, data about air temperature are available only for 1957–1961 [30], and for the period after 2011 from the automatic weather station (AWS) (published data until 2015 [22]), with some missing months in the time since (this station is shown with a green star in Figure 1). Such limited dataset cannot be used for the analysis for the whole period. That is why, for the assessment of climatic conditions in Northern Pirin, climate data from the Musala peak weather station (Rila, 2925 m a.s.l.), which encompasses the whole period of 1994–2021, were used [32]. Such dataproved reliable for analysis of the discussed site in a number of previous studies [15,33,34,35].
Mean daily air temperatures from the Musala peak weather station correlate very well with data from instrumental measurements in Golemia Kazan cirque, collected at Kazana shelter AWS (2445 m a.s.l.) [22]. The Pearson correlation coefficient between mean daily temperatures at the two stations for the period 2011–2015 is +0.97. The average difference of temperature between the two stations was 4.1 °C, without considerable monthly or seasonal deviations from the mentioned value. Accordingly, temperatures for the vicinity of Snezhnika glacieret were derived from the temperatures at Musala peak by adding the mentioned difference. By extrapolation, using the lapse rate between Musala peak and Kazana shelter, air temperatures for the area around Banski suhodol glacieret can be considered 2.4 °C warmer than at Musala peak.
The mentioned air temperatures, obtained by extrapolation, characterize conditions close to an open slope. To gain better knowledge about the local climate of the glacierets, ground temperature at 50 cm depth in the debris material of the moraines surrounding the glacierets has been recorded on an hourly basis in two locations (Figure 1): at 2410 m near Snezhnika glacieret (since September 2016), and at 2620 m near Banski suhodol glacieret (since October 2017). In addition, automated climatic measurements were organized on Vihren peak in October 2014. Data about air temperature and relative humidity at 2 m height above ground have been collected ever since.
Ground and air temperature data were periodically downloaded on site (loggers have no internet transition) and processed in Excel, where daily and monthly averages were calculated.
On the basis of the data, recorded by the stationary device on the field, the following temperature derivatives were calculated:
Mean monthly temperature.
Sum of mean daily temperatures for the days with positive average temperature (also mentioned below as sum of positive daily temperatures), calculated by summing mean daily temperatures from all days of the particular hydrological year, in which those temperatures were above 0 °C. The sum of positive daily temperatures is used to evaluate the temperature conditions for ablation during the hydrological cycle of glacierets.
Using data about ground temperature, it is possible to outline periods of snow cover, when loggers show values close to 0 °C, summer periods with positive daily means and pronounced diurnal variations of temperature, and periods of dry cold, when temperatures are mostly negative. In addition, during the winter there can be distinguished periods of thick snow cover (with temperatures constantly around 0 °C) and periods with thin snow cover (with temperatures below 0 °C and no diurnal changes).

2.3. Data Processing

Annual data from measured glacieret sizes for the periods of our observation (2008–2021 for Snezhnika glacieret and 2009–2021 for Banski suhodol) were introduced and processed in Excel, together with the data of the sizes of Snezhnika from earlier years (1994–2007), taken from [6,10]. Mean values were calculated and major trends of change were retrieved. Variation coefficients (Cv) were calculated using the formula
CV = (SD/x) × 100
where SD is the standard deviation, and x is the respective mean value.
Climate data from the weather station at Musala peak (monthly values) were used to calculate a set of climatic variables for the analysis (in order to be consistent with the glacieret sizes, they were calculated according to the duration of the glacieret hydrological year). The following climatic variables were calculated for the hydrological years 2008/2009 to 2020/2021 (Table 1):
Mean annual temperature: average of mean monthly temperatures for the period November–October in the following calendar year.
Mean temperature for the ablation season: average of mean monthly temperatures for the months November to April.
Mean summer temperature: average of daily temperatures for the period 16 May–15 September.
Mean annual precipitation: sum of precipitation for the particular hydrological year (from November to October in the following calendar year).
Precipitation for the accumulation season, in particular for the winter–early spring: sum of precipitation for the period December–April.
Precipitation for the ablation season: sum of precipitation for the period May–October.
In Table 2, anomalies are calculated by comparing the values for each particular year to the 2008/2009–2020/2021 averages. Temperature anomalies are presented as differences from the average, while precipitation and surface area anomalies are expressed as percentage from the average.
For the particular analyses, temperature data from the Musala peak weather station were corrected according to the altitude of each glacieret (as was discussed in the previous sub-chapter). In addition to the three temperature variables mentioned above, sums of mean daily temperatures above 0 °C (sums of positive daily temperatures) were also calculated for each particular hydrological year.
Consequently, data rows for glacieret area were correlated to the main temperature variables. Pearson correlation coefficient (rxy) was calculated, following the equation
r x y = i = 1 n ( x i x ¯ ) ( y i y ¯ ) j = 1 n ( x i x ¯ ) 2 j = 1 n ( y i y ¯ ) 2
where x and y are the variables to be compared, xi and yi are the individual values, x ¯ and y ¯ are the averages, and n is the number of values in the data row.
In the graphs, which represent the relations between glacieret areas and the sums of positive daily temperatures (as defined above) (see Section 3 and Section 3.3.2, the lines of linear relationship were obtained using a linear regression model in Excel. Relationship lines are curved, because when glacieret sizes become smaller, the topography provides more favorable conditions for firn-ice preservation.
In the graphs in Section 3.3.2, for evaluation of the diversion of the points up or down from the Excel derived trendlines, a simple, purely graphical approach was applied: a diversion coefficient D, was introduced, which uses relative units. In order to obtain a proper resolution and to use convenient values, a value of +5 was assigned to the greatest diversion of a point above the line (that was the value recorded in 2012), and the diversions of all other points were proportionally calculated using this value.
The correlations between the values of D and precipitation variables from Musala peak were calculated using the mentioned Formula (2).

3. Results

3.1. Glacieret Size

The size of the monitored glacierets varied significantly from year to year, with changes in surface area ranging between 50 and 200% (Figure 3). At both glacierets a slight long-term downward trend in the recorded surface areas is present for the whole observation period. Three of the last five years (2017, 2019, and 2020) were characteristic with very low sizes, 2019 being the smallest on record for the glacierets in the Pirin Mountains.
Banski suhodol glacieret has a much smaller amplitude of interannual size variations than Snezhnika glacieret. For the common period of observation (2009–2021), the variation coefficient (Cv) is 0.15 for Banski suhodol glacieret, while for Snezhnika it is 0.28 (and 0.25 for the whole period of regular monitoring, 1994–2021). The observed differences can be explained by the different topographical conditions of both glacierets (Figure 4).
Banski suhodol glacieret is located on a northern exposure, at high elevation, which provides for relatively low temperatures all year round. Such a location is among the most favorable for annual preservation of snow and ice, at least in Bulgaria, and suggests for relatively stable local climate conditions.
On the other hand, Snezhnika glacieret is situated on an eastern exposure, at elevation about 200 m lower than the other glacieret, and receives direct sunshine for several hours, even in winter months. Its survival in such conditions is supported by the great input of avalanche snow from the funnel-shaped rock wall of Vihren peak. The topographic calculations show that the snow catchment area that leads onto the surface of Snezhnika is about 22 times larger than the usual surface area of the glacieret is at the end of the balance year [15]. This allows for the accumulation of snow over 20 m thick in some winters. Due to these topography differences, Snezhnika glacieret is much more dependent on the variations of winter precipitation and the avalanche activity than Banski suhodol glacieret, as the snow catchment area of the latter is only about 5.5 times larger than its average surface area, and it is therefore more directly dependent on temperature.

3.2. Climatic Variables

Table 1 and Table 2 compare climatic data from Musala peak with the measured areas of Snezhnika and Banski suhodol glacierets. Data are here presented for the period of our measurements (2008–2021 for Snezhnika and 2009–2021 for Banski suhodol). Climatic averages and cumulatives are shown according the glacierets’ hydrological (mass-balance) year, which, in general, lasts from November to October [18] (and conveniently matches the hydrological year accepted for rivers in Bulgaria [36,37]). Table 1 shows absolute values, while Table 2 presents the same data in relation to the average for the researched period. For the researched period, the mean annual air temperature at Musala peak was 1.7 °C, 1.4 °C higher than the 1961–1990 average. Annual precipitation ranged from 1020 to 602 mm. At Musala, the precipitation regime has two maxima: in winter (January–March) and late spring (May–June). For Pirin, a greater share of winter precipitation is to be expected, due to the southerly location and the Mediterranean precipitation regime of the stations in the Pirin foothills. When presenting precipitation for the glacier accumulation season, November sums are not taken into account, as they are usually of a mixed character (rain/snow) and do not significantly contribute to snow accumulation.
Table 2 is more informative of interannual climate variations. Obvious from the table is the increase of the ablation temperatures in recent years. Concerning precipitation, the frequent occurrence of relatively drier winters: in 2014 to 2016 and in 2019, contributed to the size minimums registered in 2019–2020. In addition, a more pronounced shrinkage trend of Banski suhodol is demonstrated by the discussed data.

3.3. Climatic Factors Influencing Short-Term and Long-Term Size Variations of Glacierets

3.3.1. General Climate Conditions

Based on data from Musala peak and the measured local temperature at Kazana shelter, the average annual temperature at 2440 m for the last 16 years (2006–2021) is about +2.3 °C, while at 2650 m it is +0.6 °C. At Snezhnika, conditions for snow accumulation prevail from the third decade of November to mid-April (Figure 5, left). For Banski suhodol, the same period lasts from the beginning of November to the end of April (Figure 5, right).
During the last three decades, a general increase in temperature has been registered, along with a high interannual variability (Figure 6).
The lack of reliable data about precipitation for the high parts of the Pirin Mountains predicates the usage of information from remote stations. Musala peak (2925 m a.s.l.) has an average annual amount of 836 mm for the period 2006–2021 and a regime with a long period of increased monthly amounts (from December to June) and a minimum in November (Figure 7).
On the other hand, Sandanski (at 190 m a.s.l. on the SW foot of Pirin) has much lower annual precipitation, 532 mm on average, with a maximum in October, relatively high monthly amounts from November to June, and a minimum in August. In the last 15 years, precipitation regimes at these two places, which for the standard period (1961–1990) appear very different, seem to have converged, and appear more similar now. It is to be expected the precipitation regime in the alpine zone of Northern Pirin is closer to that at Musala peak.

3.3.2. Determining Climatic Factors

The analysis of climatic variables based on data from Musala peak with an extrapolation for the altitude of 2450 m a.s.l. has proved that the main factor which determines the particular size of Snezhnika glacieret is the temperature during the ablation season.
The correlation (Pearson correlation coefficient, rxy) between the glacieret area and the sum of daily temperatures for the days with average temperature above 0 °C (sum of positive daily temperatures) for a 28-year observation period (1994–2021) was −0.75 (Table 3). This correlation was very stable through the years. Absolutely the same value, −0.75, has the correlation coefficient (rxy) between the size of the other Pirin glacieret, Banski suhodol and the sum of positive daily temperatures, extrapolated for altitude of 2650 m. Graphical representations of these dependencies are shown on Figure 8.
Deviations of the points on Figure 8a,b, above and below the regression lines are obviously caused by factors other than summer temperature. In Table 4, these deviations are presented with a deviation coefficient (D), geometrically calculated on the graphs of Figure 8 (see Materials and Methods chapter).
Positive values of D in Table 4 mean that for that particular year, the points, which illustrate the relationship between sum of positive daily temperatures and glacieret area, stand above the relationship line, i.e., the glacieret has increased its size more than ablation temperatures for that year suggest, due to a contribution from other factors. The negative values of the coefficient D should be interpreted in the opposite way, respectively.
Comparisons between the values of D and precipitation data from Musala peak on a seasonal basis (for example, the precipitation during the glacierets’ accumulation season) do not show any relationship. However, when experimenting with cumulative daily precipitation from days when temperatures were below a certain threshold, it was found that fair relationships exist between the interannual differences of the coefficient D (the colored columns in Table 4) and the sums of precipitation for the days when temperatures at Musala peak were below −1 °C (in fact, the snow precipitation): the Pearson correlation coefficient, resulting from these calculations, is +0.62 for Banski suhodol glacieret (for the period 2009–2021), and for Snezhnika glacieret it is +0.68 for the same period, and +0.64 for the whole period of available annual size measurements (1998–2021). This should illustrate the role of winter precipitation as a secondary factor for glacieret interannual size variations. Uncertainties in data used are related to the lack of local precipitation data from the high mountain area of the Pirin Mountains (data are used from Musala peak which is 55 km away to the north from the study area) and other, tertiary factors, one of which might be, for example, avalanche activity (dependent on very short temperature fluctuations and occurrence of intense precipitation events), intense summer rains and their melting effects, et cetera. When using precipitation data from Sandanski, their correlation to the differences in the D coefficient is much weaker and not statistically significant.

3.3.3. Variations of Local Climatic Conditions

In fact, local climatic conditions near glacieret surfaces are quite different from what is inferred for open slopes and air temperatures. Usually, the accumulation season at Snezhnika (230–270 days) is about 2.5 times longer than the ablation season, and, at Banski suhodol it can even exceed three times (Table 5 and Table 6). In autumn there are normally 1 to 3 weeks of dry cold, when ablation is halted but no considerable snow falls. In addition, due to the higher altitude and shadier aspect, ablation over the surface of Banski suhodol glacieret starts about a month later than at the surface of Snezhnika.
For Snezhnika, the 2017/2018 hydrological year had the longest accumulation season followed by 2020/2021, while the shortest was in 2018/2019. These differences correspond to the registered glacieret sizes. At Banski suhodol, the ablation period appears to be 24–30 days shorter than at Snezhnika.
At Snezhnika, annual ground temperatures varied between +1.4 and +2.1 °C (Table 7). August was the warmest month, and values for June and July varied greatly depending on the exact beginning of ablation (the complete thaw of the snow cover for the particular year). The hot summer of 2021, demonstrated by the unprecedently high August temperatures, did not have a catastrophic ablation effect on the glacierets due to the delayed start of ablation.
During the ablation season, temperatures in the moraine near Snezhnika glacieret show a distinctive mode of diurnal variations, usually in the order of 3 to 4 °C. In some cases, amplitudes up to 5 °C were recorded. The absolute minimum, −6.8 °C, was measured in the early hours of the night of November 21, 2020, during the autumn frost period before the first winter snow. On the other hand, the absolute maximum was reached at 4 PM on both 6 and 7 August 2017, when the temperature climbed to +17.6 °C. A temperature value of +17 °C was also recorded on 12 August 2019, while the maximum monthly mean from August 2021 was achieved not through record highs, but through a long series of warm days (with the highest value of +15.5 °C). For comparison, the summer of 2018 was characterized by much lower averages, and also lower absolute maximum: +11.8 °C, measured at 3 PM on 14 August.
Climatic conditions around the other glacieret, Banski suhodol, are much harsher (Table 8). Annual temperatures are around 0 °C, and temperatures registered during the accumulation season are about 1 °C lower than at Snezhnika, probably due to the more open position of Banski suhodol moraine and the thinner snow cover. Mean monthly temperatures during the ablation season are 3 to 5 °C lower than the same at Snezhnika; however, the absolute maximum for that short measurement period was competitive: +16.6 °C at 3 p.m. on 12 August 2019. For the cooler summer of 2018, the maximum was +9.3 °C (23 August at 4 p.m.). The absolute minimum of −9.3 °C was recorded on 16 November 2018 at 5 a.m.
Actual sums of positive daily temperatures measured on the ground near Snezhnika glacieret for the period 2016/2017 to 2020/2021 hydrological years (Table 9) are much lower (35 to 49%) than the values extrapolated from air temperatures at Musala peak. Considerable ablation heat is induced only in July, August, and September. The relatively small but regular sums for October define it as the end of ablation season. Some tendency towards an increase of October ablation intensity can be derived from the data in Table 9. Sums of positive daily temperatures around Banski suhodol (Table 10) are less than a half of those registered near Snezhnika. The sum was only 175 °C for the whole of 2018, and more than doubled in the next year, which imposed a strong impact on the glacieret size.
Temperature conditions near glacieret surface are directly expressed in the interannual variations of glacieret size. However, here, also the glacieret size of the previous year must be born in mind as a starting point of the mass balance year. Despite the higher summer ablation the size of Snezhnika in the autumn of 2017 was greater than that in 2020, because its size in 2016 was larger than in 2019.
In general, the long retention of snow cover over the glacieret surface until middle or late summer delays the start of active ablation and insulates the firn-ice bodies from the direct impact of air temperature. In this context, high air temperatures in June and July are not in direct relation to glacieret ablation (they have an impact on thawing the snow cover, not the glacieret itself). For Snezhnika glacieret in particular, the thickness of snow cover in early summer is highly variable and depends on avalanche activity in spring [30].

4. Discussion

Recent changes in the size of glacierets in the Pirin Mountains are mainly driven by the variations in summer temperatures, which, in the longer term, have a tendency to rise. Indeed, some shrinkage trends have been already observed, but relations are not straightforward due to the influence of secondary climatic factors and the effects of topography. Until 2016, Snezhnika glacieret, which has been regularly monitored for the last 25 years, demonstrated a long-term stagnation. The main reason was the changes in winter precipitation, which were lower than average before 2004 and higher in 2005–2013 [32,34]. The years 2014-2021 are marked by highly changeable precipitation (in both winter and summer), which complicates the predictions about the future of the glacierets. Severe shrinkages (when compared with the size from the previous year) followed either after hot and dry summers (such as in 2012 and 2019) or after seasons with abundant summer rains (such as in 2014, 2017, and 2020). Sporadic, but intense, warm summer rain events can occasionally have a crucial role in the diminishing, in particular, of the firn-ice bodies in some summers [38].
Other glacierets in our region (the Balkans) are in the highest parts of the Dinaric Mountains (Prokletije and Durmitor). Durmitor’s Debeli namet glacier has been regularly monitored since 2003, but several size measurements were made also in the 1990s [14,15,39]. Data about three glacierets and two summer-lasting show patches in central Prokletije have been gathered since 2006 [3,11,40] and systematically since 2011 [14]. Despite some similarities in the behavior of these firn-ice bodies to that of Pirin glacierets (for example, the increases of size in 2013 and 2018, the lows in 2012, 2017, and 2020), the mode of their changes and development differs due to the inequality of the climatic factors that drive those changes, especially in the short term. As the glaciers in the Dinaric Mountains exist in a more maritime climate, they are more strongly dependent on precipitation. Although annual precipitation does not change significantly in the long term, the share of snow in winter tends to decrease as a result of rising temperatures, and rains increase their negative impact on glaciers, especially in summer when they are warm.
Over the last decade, clear 3 to 4 year-long “recharge–exhaust” cycles are observable in the glaciers in Prokletije and Durmitor [14,15]. After a year with a significantly positive snow balance, several years follow in which glacier sizes are gradually diminished until the next recharge year comes. “Recharge years” were 2010, 2013, 2018, and, most probably, 2021. Such patterns can be related to the activity of Mediterranean cyclones, and are not typical for Pirin glacierets, where groups of fewer years of similar sizes are followed by one to twoyears with sizes contrasting to the previous.
Mediterranean circulation does also affect the Eastern Balkans, but its impact is modified by the “rain-absorbing effect” of the Dinaric mountain barrier, which leaves the central and eastern part of the peninsula in a precipitation shadow, especially in winter. Another factor is the sporadic occurrence of invasions of cold air from northeast over the Rhodopean massif, which causes freezing dry weather in winter and cool, cloudy, but relatively rainless conditions in part of summer (sometimes, such masses pass over Bulgaria and collide with the damp Adriatic air over the Dinaric range, producing short-lasting but intense summer rains).
Small glaciers in the Western Balkans, in the Apennines, and the Alpine region show great short-term amplitudes of variation, which pose a threat to their existence in periods of strongly expressed minimums of size. For example, after several years of low winter precipitation, the hot summer of 2017 almost made the small glaciers in the Dinaric Mountains disappear, and most of them were reduced to tiny ice patches [14]. Such severe minimums were, e.g., recorded for Triglav glacier in 2012 [41,42] and for Montasio occidentale glacier in 2015 [43] during similar climatic conditions (dry winter, hot summer).
In general, the increased continentality of climate over the Eastern Balkans “smoothes” interannual climatic variations and determines a greater stability of Pirin glacierets in comparison with similar features in the region that exist in a more maritime climate. In the context of stability, Pirin glaciers show similarity to the Mięguszowiecky glacieret in the High Tatras, which exists in relatively continental conditions and has also expressed weak long-term shrinkage trends over recent decades [38]. For the very small glaciers in Switzerland, which are more than one thousand in number, it was found [5] that the most stable glaciers which are projected to survive at least for the climate changes projected until 2050, are those situated at very low elevation (up to 600 m below the current regional ELA). They are found in regions with steep topographic gradients, on strongly shaded and/or avalanche prone locations. Similar are the environmental conditions also for the glacierets in the Pirin Mountains.
This enhanced stability of the glacierets in Pirin is also illustrated by their relatively small post-Little Ice Age shrinkage compared to a number of small glaciers in the Mediterranean region in the Dinaric Mountains, the Apennines, the southeastern Alps, and elsewhere [41,42,43,44,45,46,47,48,49,50,51,52,53], which have reduced their areas from several times to several tens of times, and their volumes often hundreds of times.
According to the recent studies, the average area of Snezhnika glacieret for the last 25 years has been about 55% of its maximum extent during the Little Ice Age (LIA) and the average area of Banski suhodol glacieret has been about 60% (data from [28,52]). Such a retreat appears quite moderate when compared to the recession of a large number of glaciers and very small glaciers in the other mountains of the Mediterranean which have similar altitude to the Pirin Mountains. For example, between the LIA and 2012, the total area of the small glaciers in the Julian Alps decreased from 2.367 to 0.383 km2, and the largest of them, Canin glacier, shrank by 88% [54]. Triglav glacier in the Julian Alps of Slovenia diminished even more: from 22 ha in 1897 to between 0.7 and2 ha in 2000–2014 [41,55], the Calderone glacier in the Apennines—from 9.88 ha in 1884 to 3.5 ha in 2006 [45,56], Debeli Namet glacier in the Durmitor—from 11 ha in 1878 to an average of 2.1 ha for 2011–2021 [14,15,46], Aneto glacier in the Pyrenees—from 245 ha in 1850 to 48 ha in 2017 [57,58]; and Monte Perdido glacier in the Pyrenees (from 556 ha in 1850 to 38 ha in 2016) [50,53]).
Similar comparisons concern volume losses: since the end of the Little Ice Age, the two studied glacierets in the Pirin Mountains have lost 60–80% of their volume [28], while the very small glaciers in the Julian Alps have shrunk by 96% [54] (99% volume loss for Trigav glacier in particular [55]).
Studies of the dynamics of very small glaciers have shown that the long-term evolution of these firn-ice bodies depends not only on climatic conditions (for example, continentality), but also on their size. The smaller the glacier, the stronger the impact of topography and the better the local conditions for firn and ice preservation. For example, the tiny glaciers (glacierets) Skuta and Montasio occidentale, which are situated in deep depressions and are mainly fed by avalanches, lost only about 30% from their LIA surface area (but underwent considerable thinning) [54,59,60,61].
In the longer-term context, the post-LIA recession of the glaciers in the Dinaric mountains, the southeastern Alps, the Apennines, and the Pyrenees comprised periods of rapid retreat, separated by episodes of relative stagnation and even minor advances [45,54,55,56,62]. In the last two decades, many of these previously much larger glaciers have turned into glacierets and entered a stagnation phase: being restricted to only the most favorable locations, these tiny bodies came under increased topo-climatic control, and, to some extent, “decoupled” from global climate [59,62].
The threshold “decoupling” size depends on the particular topography of each site, and it is usually not larger than 1 ha to several hectares [14,62]. The glaciers in the Dinaric range underwent this stage much earlier than those in the southeastern Alps and the Apennines, probably in the first decades of the twentieth century, according to the geomorphological evidence (moraines) and geographical descriptions [63,64,65]. The two glacierets in the Pirin Mountains were probably in a “decoupled” state already during the LIA, and at least since the middle of the 20th century, as very small glaciers in the Balkans have demonstrated relatively modest trends of shrinkage [27,39]. In contrast, some of the larger cirque glaciers in the Mediterranean, such as, e.g., Monte Perdido in the Pyrenees and Marmolada in the Dolomites, still have not reached the decoupling size threshold, and are undergoing a rapid retreat at present [50,51].
Despite the fact that “decoupled” glacierets demonstrate enhanced resilience to climate change due to strong topo-climatic influences, they are not in a balanced state under the conditions of recent active warming, which has been witnessed by the recently observed slight long-term downward trends. In this regard, it is expected that the minimums in the interannual variation of the size of these small firn-ice bodies will become increasingly pronounced.
If temperature rising trends continue to prevail at their present pace (or become further enhanced), the glacierets in Pirin will be bound to extinction, progressively turning into ice patches. This process will probably last for longer than in other regions of the Mediterranean, but forecasting is complicated due to the strong dependence of small firn-ice bodies on topography and accidental factors such as heavy snowfalls and avalanche events. For example, the glacierets and ice patches in the Julian Alps have been stagnating since the beginning of the 21st century despite the rising temperatures, due to an increase in winter precipitation [55,59,66]. However, for Southern Europe, most forecasts propose a gradual decrease in precipitation over the following decades [67], which will doom Pirin glacierets to a progressive decline. For Snezhnika, in particular, the stable degradation into a snow/ice patch is predicted to occur in about two decades [68].

5. Conclusions

The two tiny glacierets in Bulgaria’s Pirin Mountains are, at present, the southernmost very small glaciers in Europe. Their existence at sites located several hundred meters below the present average glacier equilibrium line altitude (ELA) is determined by the strong impact of local topographic conditions.
The climate of high glacio-karstic cirques is very specific. It is much harsher than that inferred from climatic extrapolations of meteorological data from remote sources. Glacier persistence is favored by the excessively long period of low temperatures and snow cover, which may last up to 250–300 days in a year. The presence of thick snow cover in spring may isolate the glacieret surface from the direct impact of air temperatures and may cause a late start of ablation despite the high temperatures in the first half of summer.
Analysis of the relations between glacieret size (area) and climatic variables showed that calculations based on daily climatic data could provide much better correlations than using monthly temperature and precipitation averages. Short-term size variations of the glacierets in Pirin are mostly related to the temperature conditions during the ablation season, but additionally the size of glacierets from the previous year should be taken into account as a starting point for a given mass-balance year. In the case of Pirin glacierets, winter and summer precipitation play a secondary role, but can exert a considerable effect on the size in some years.
The two glacierets in the Pirin Mountains are examples of relatively long-term stable small firn-ice bodies, which have been relatively “decoupled” from global climate trends due to the effect of topography. Another factor for the relative stability and the modest post-LIA shrinkage is the continentality of climate with small variations in precipitation.
In the last few decades, the glacierets have demonstrated a persistence and a relative stability in conditions of rising temperatures. Decade-term changes in precipitation resulted in a stagnation of glacieret size until 2016. In the years since, a slight retreat trend has started to emerge in response to temperature increase. Bearing in mind the expected general decrease of precipitation in Southern Europe over the coming decades [67], this will probably be a prevalent mode in the forseeable future and will eventually lead to the degradation of these small glaciers into patches of stagnant firn and ice. However, due to the demonstrated greater stability, glacierets in the Pirin Mountains may last for longer than some similar firn-ice bodies in the other mountains throughout the Balkans and the Mediterranean region.

Funding

This work is supported by the South-West University “Neofit Rilski” through the Programme for University grants. Research was funded through various projects, performed through the years: University grants: RP-A10/15, RP-B 4/16, RP-A13/17, RP-A4/18, RP-A3/20 and ERASMUS Programme (2016). The APC was funded by the South-West University “Neofit Rilski”, Blagoevgrad, Bulgaria.

Institutional Review Board Statement

Not applicable.

Informed Consent Statement

Not applicable.

Data Availability Statement

www.stringmeteo.com (accessed on 29 March 2022).

Acknowledgments

I am grateful to the colleagues and friends who supported the fieldwork through all these years: Krasimir Stoyanov, Alexander Gikov, Ilia Mitkov, Brigitte Magori, Flavius-Sorin Sirbu, Mehmed Cholakov, Georgi Gachev, Georgi Manolev, Alexander Pulev, and Miroslav Ivanov.

Conflicts of Interest

The author declares no conflict of interest.

References

  1. Zemp, M.; Paul, F.; Hoelzle, M.; Haeberli, W. Glacier fluctuations in the European Alps, 1850–2000: An overview and spatio-temporal analysis of available data. In Zurich Open Repository and Archive; University of Zurich: Zurich, Switzerland, 2008; Chapter 11; pp. 152–167. [Google Scholar]
  2. Hughes, P.D. Response of a Montenegro glacier to extreme summer heatwaves in 2003 and 2007. Geogr. Ann. 2008, 90, 259–267. [Google Scholar] [CrossRef]
  3. Hughes, P.D. Twenty first century glaciers in the Prokletije Mountains, Albania. Arct. Antarct. Alp. Res. 2009, 41, 455–459. [Google Scholar] [CrossRef] [Green Version]
  4. Mehta, M.; Dobhal, D.P.; Bisht, M.P. Change of Tipra Glacier in the Garhwal Himalaya, India, between 1962 and 2008. Prog. Phys. Geogr. 2011, 35, 721–738. [Google Scholar] [CrossRef]
  5. Huss, M.; Fischer, M. Sensitivity of Very Small Glaciers in the Swiss Alps to Future Climate Change. Front. Earth Sci. 2016, 4, 1–17. [Google Scholar] [CrossRef] [Green Version]
  6. Grunewald, K.; Scheitchauer, J. Klima- und Landschaftgeschichte Sudosteuropas. In Rekonstruktion Anhand von Geoarchiven im Piringebirge (Bulgarien); Rhombos Verlag: Dresden, Germany, 2008. [Google Scholar]
  7. Mehta, M.; Kumar, V.; Garg, S.; Shukla, A. Little Ice Age glacier extent and temporal changes in annual mass balance (2016–2019) of Pensilungpa Glacier, Zanskar Himalaya. Reg. Environ. Change 2021, 21, 21–38. [Google Scholar] [CrossRef]
  8. Gachev, E.; Stoyanov, K.; Gikov, A. Small glaciers on the Balkan Peninsula: State and changes in the last several years. Quat. Int. 2016, 415, 33–54. [Google Scholar] [CrossRef]
  9. Grunewald, K.; Scheithauer, J. Europe’s southernmost glaciers: Response and adaptation to climate change. J. Glaciol. 2010, 56, 129–142. [Google Scholar] [CrossRef] [Green Version]
  10. Grunewald, K.; Scheitchauer, J. Landscape Development and Climate Change. In Southwest Bulgaria (the Pirin Mountains); Springer: Berlin/Heidelberg, Germany, 2011; 161p. [Google Scholar]
  11. Milivojević, M.; Menković, L.; Ćalić, J. Pleistocene glacial relief of the central part of Mt. Prokletije (Albanian Alps). Quat. Int. 2008, 190, 112–122. [Google Scholar] [CrossRef]
  12. Hughes, P.D. Recent behavior of the Debeli namet glacier, Durmitor, Montenegro. Earth Surf. Processes Landf. 2007, 32, 1593–1602. [Google Scholar] [CrossRef]
  13. Gachev, E. The unknown southernmost glaciers of Europe. In Glacier Evolution in a Changing World; Godone, C., Ed.; IntechOpen: Zagreb, Croatia, 2017; pp. 77–102. [Google Scholar] [CrossRef] [Green Version]
  14. Gachev, E. Small glaciers in the Dinaric Mountains after eight years of observation: On the verge of extinction? Acta Geogr. Slov. 2020, 60, 191–211. [Google Scholar] [CrossRef]
  15. Gachev, E.; Mitkov, I. Small glaciers in Pirin (Bulgaria) and Durmitor (Montenegro) as glacio-karstic features. Similarities and differences in their recent behaviour. Quat. Int. 2019, 504, 153–170. [Google Scholar] [CrossRef]
  16. Serrano, E.; González-Trueba, J.J.; Sanjosé, J.J.; Del Río, L.M. Ice patch origin, evolution and dynamics in a temperate high mountain environment: The Jou negro, Picos de Europa (NW Spain). Geogr. Ann. Ser. A Phys. Geogr. 2011, 93, 57–70. [Google Scholar] [CrossRef]
  17. Grunewald, K.; Weber, C.; Scheithauer, J.; Haubold, E. Mikrogletscher als Klimaindikatoren und Umweltarchive in sudosteuropaischen Hochgebirgen?—Untersuchung des Vichrengletschers im Piringebirge (Bulgarien). Zschr. Gletsch. UndGlazialgeol. 2006, 39, 99–114. [Google Scholar]
  18. Gachev, E.; Gikov, A.; Zlatinova, C.; Blagoev, B. Present state of Bulgarian glacierets. Landf. Anal. 2009, 11, 16–24. [Google Scholar]
  19. Cogley, J.G.; Hock, R.; Rasmussen, L.A.; Arendt, A.A.; Bauder, A.; Braithwaite, R.J.; Jansson, P.; Kaser, G.; Möller, M.; Nicholson, L.; et al. Glossary of Glacier Mass Balance and Related Terms. IHP-VII Tech. Doc. Hydrol. 2011. Available online: https://wgms.ch/downloads/Cogley_etal_2011.pdf (accessed on 1 March 2022).
  20. Kanev, D. Geomorphology of Bulgaria; Sofia University Press: Sofia, Bulgaria, 1989; 322p. (In Bulgarian) [Google Scholar]
  21. Georgiev, M. Physical Geography of Bulgaria; Nauka i izkustvo: Sofia, Bulgaria, 1991; 408p. (In Bulgarian) [Google Scholar]
  22. Grunewald, K.; Gachev, E.; Kast, G.; Nojarov, P.; Panayotov, M. Meteorological Observations in National Park ‘Pirin’; IÖR Dresden: Dresden, Germany, 2016. [Google Scholar] [CrossRef]
  23. Velev, S. The Climate of Bulgaria; Heron Press: Sofia, Bulgaria, 2010; 220p. (In Bulgarian) [Google Scholar]
  24. Rachev, G. Climatology—Questions and Answers. Paradigma: Sofia, Bulgaria, 2018; p. 260. (In Bulgarian) [Google Scholar]
  25. Kuhlemann, J.; Gachev, E.; Gikov, A.; Nedkov, S.; Krumrei, I.; Kubik, P. Glaciation in the Rila Mountains (Bulgaria) during the Last Glacial Maximum. Quat. Int. 2013, 293, 51–62. [Google Scholar] [CrossRef]
  26. Georgiev, G. Biogeographical Peculiarities of Bulgaria, Part 1; South-west University Press: Blagoevgrad, Bulgaria, 2000. (In Bulgarian) [Google Scholar]
  27. Grunewald, K.; Scheithauer, J.; Gikov, A. Microglaciers in Pirin Mountain. Probl. Geogr. 2008, 1–2, 159–174. (In Bulgarian) [Google Scholar]
  28. Onaca, A.; Gachev, E.; Ardelean, F.; Ardelean, A.; Perșoiu, A.; Hegyi, A. Small is strong: Post-LIA resilience of Europe’s Southernmost glaciers assessed by geophysical methods. Catena 2022, 213, 106143. [Google Scholar] [CrossRef]
  29. Popov, V. Morphology of the cirque Golemia Kazan—Pirin Mountains. Announc. Inst. Geogr. 1962, 6, 86–99. (In Bulgarian) [Google Scholar]
  30. Popov, V. Observations on the glacieret in the cirque Golemia kazan, the Pirin Mountains. Announc. Inst. Geogr. 1964, 8, 198–207. (In Bulgarian) [Google Scholar]
  31. Gachev, E.; Gikov, A. A description and a first measurement of the glacieret in Banski suhodol cirque. Probl. Geogr. Bulg. Acad. Sci. 2010, 3–4, 90–98. (In Bulgarian) [Google Scholar]
  32. Bulgarian Website for Discussing Weather. Available online: www.stringmeteo.com (accessed on 29 March 2022).
  33. Gachev, E. Inter-annual size variation of Snezhnika glacieret (Pirin Mountains, Bulgaria) in the last ten years. Studia Geomorphol. Carpatho-Balc. 2011, 45, 47–68. [Google Scholar]
  34. Gachev, E. Climatic factors for the inter-annual dynamics of Snezhnika glacieret in Pirin. In Proceedings of the Conference of Bulgarian Geographic Society, Vurshets, Bulgaria, 23–26 September 2016. (In Bulgarian). [Google Scholar]
  35. Nojarov, P.; Gachev, E. Climatic factors for the changes in the size of the glacieret on Golemia Kazan cirque (the Pirin Mountains). In Proceedings from the Conference of the Union of Scientists in Bulgaria, part 1, vol. 2; Neofit Rilski University Press: Blagoevgrad, Bulgaria, 2007; pp. 399–405, ISBN 978-954-680-529-4. (In Bulgarian). [Google Scholar]
  36. Penchev, P. General Hydrology; Nauka i izkustvo: Sofia, Bulgarian, 1975; 386p. (In Bulgarian) [Google Scholar]
  37. Hristova, N. River Waters of Bulgaria. Tiptop Press: Sofia, Bulgarian, 2012; 832p. (In Bulgaria) [Google Scholar]
  38. Gądek, B. The problem of firn-ice patches in the Polish Tatras as an indicator of climatic fluctuations. Geogr. Pol. 2008, 81, 10–25. [Google Scholar]
  39. Djurović, P. The Debeli namet glacier from the twentieth century to the present. Acta Geogr. Slov. 2012, 52, 277–301. [Google Scholar] [CrossRef] [Green Version]
  40. Gachev, E.; Stoyanov, K. Present-day small perennial firn-ice patches in the mountains of the Western Balkan Peninsula. Studia Geomorphol. Carpatho-Balc. 2012, 46, 51–70. [Google Scholar]
  41. Gabrovec, M.; Hrvatin, M.; Komac, B.; Ortar, J.; Pavšek, M.; Topole, M.; Triglav-Čekada, M.; Zorn, M. Triglavski ledenik; Geografija Slovenije 30: Ljubljana, Slovenija, 2014. [Google Scholar]
  42. Triglav-Čekada, M.; Zorn, M. thickness and geodetic mass balance changes for the Triglav glacier (Southeastern Alps) from 1952 to 2016. Acta Geogr. Slov. 2020, 60, 155–174. [Google Scholar] [CrossRef]
  43. De Marco, J.; Carturan, L.; Piermattei, L.; Cucchiaro, S.; Moro, D.; Fontana, G.D.; Cazorzi, F. Minor Imbalance of the Lowermost Italian Glacier from 2006 to 2019. Water 2020, 12, 2503. [Google Scholar] [CrossRef]
  44. Gellatly, A.; Smiraglia, C.; Grove, J.; Latham, R. Recent variations of Ghiacciaio del Calderone, Abruzzi, Italy. J. Glaciol. 1994, 40, 486–490. [Google Scholar] [CrossRef] [Green Version]
  45. Pecci, M.; D’Agata, C.; Smiraglia, C. Ghiacciaio del Calderone (Apennines, Italy): The mass balance of a shrinking Mediterranean glacier. Geogr. Fis. E Din. Quat. 2008, 31, 55–62. [Google Scholar]
  46. Hughes, P.D. Little Ice Age glaciers in the Balkans: Low altitude glaciation enabled by cooler temperatures and local topoclimatic controls. Earth Surf. Processes Landf. 2010, 35, 229–241. [Google Scholar] [CrossRef]
  47. Carturan, L.; Baldassi, G.A.; Bondesan, A.; Calligaro, S.; Carton, A.; Cazorzi, F.; Fontana, G.D.; Francese, R.; Guarnieri, A.; Milan, N.; et al. Current behaviour and dynamics of the lowermost italian glacier (montasio occidentale, julian alps). Geogr. Ann. Ser. A Phys. Geogr. 2013, 95, 79–96. [Google Scholar] [CrossRef]
  48. Hohenwarter, G. The Eiskar—115 years of measurements at the southernmost glacier in Austria. Meteorologica 2013, 102, 26–28. [Google Scholar]
  49. Colucci, R.; Forte, E.; Boccali, C.; Dossi, M.; Lanza, L.; Pipan, M.; Guglielmin, M. Evaluation of internal structure, and mass of glacial bodies by integrated LiDAR and ground penetrating radar surveys: The case study of Canin Eastern Glacieret (Julian Alps, Italy). Surv. Geophys. 2015, 36, 231–252. [Google Scholar] [CrossRef]
  50. López-Moreno, J.; Revuelto, J.; Rico, I.; Chueca-Cía, J.; Julián, A.; Serreta, A.; Serrano, E.; Vicente-Serrano, S.M.; Azorin-Molina, C.; Alonso-González, A.; et al. Thinning of the Monte Perdido Glacier in the Spanish Pyrenees since 1981. Cryosphere 2016, 10, 681–694. [Google Scholar] [CrossRef] [Green Version]
  51. Santin, I.; Colucci, R.R.; Žebre, M.; Pavan, M.; Cagnati, A.; Forte, E. Recent evolution of Marmolada glacier (Dolomites, Italy) by means of ground and airborne GPR surveys. Remote Sens. Environ. 2019, 235, 112715. [Google Scholar] [CrossRef]
  52. Gachev, E. Holocene glaciation in the mountains of Bulgaria. Mediterr. Geosci. Rev. 2020, 2, 103–117. [Google Scholar] [CrossRef]
  53. Moreno, A.; Bartolomé, M.; López-Moreno, J.I.; Pey, J.; Corella, J.P.; García-Orellana, J.; Sancho, C.; Leunda, M.; Gil-Romera, G.; González-Sampériz, P.; et al. The case of a southern European glacier which survived Roman and medieval warm periods but is disappearing under recent warming. Cryosphere 2021, 15, 1157–1172. [Google Scholar] [CrossRef]
  54. Colucci, R.; Žebre, M. Late Holocene evolution of glaciers in the southeastern Alps. J. Maps 2016, 12, 289–299. [Google Scholar] [CrossRef]
  55. Triglav Čekada, M.; Zorn, M.; Colucci, R. Area changes on Canin (Italy) and Triglav glaciers (Slovenia) from 1893 on based on archive imagery and Lidar. Geod. Vestn. 2014, 58, 257–277. [Google Scholar] [CrossRef]
  56. D’Orefice, M.; Pecci, M.; Smiraglia, C.; Ventura, R. Retreat of Mediterranean glaciers since the Little Ice Age: Case study of Ghiacciaio del Calderone, Central Apennines, Italy. Arct. Antarct. Alp. Res. 2000, 32, 197–201. [Google Scholar] [CrossRef]
  57. Gonzalez Trueba, J.J.; Moreno, R.M.; Martínez de Pison, E.; Serrano, E. ‘Little Ice Age’ glaciation and current glaciers in the Iberian Peninsula. Holocene 2008, 18, 551–568. [Google Scholar] [CrossRef]
  58. Campos, N.; Alcal’a-Reygosa, J.; Watson, S.C.; Kougkoulos, I.; Quesada-Roman, A.; Grima, N. Modeling the retreat of the Aneto Glacier (Spanish Pyrenees) since the Little Ice Age, and its accelerated shrinkage over recent decades. Holocene 2021, 31, 1315–1326. [Google Scholar] [CrossRef]
  59. Colucci, R. Geomorphic influence on small glacier response to post-Little Ice Age climate warming: Julian Alps, Europe. Earth Surf. Process. Landf. 2016, 41, 1227–1240. [Google Scholar] [CrossRef]
  60. Pavšek, M. Ledenik pod Skuto kod pokazatelj podnebnih sprememb v slovenskem delu Alp. Dela 2007, 28, 207–219. [Google Scholar] [CrossRef]
  61. Triglav Čekada, M.; Barbo, P.; Pavšek, M.; Zorn, M. Changes in the Skuta Glacier (Southeastern Alps) assessed using non-metric images. Acta Geogr. Slov. 2020, 60, 175–190. [Google Scholar] [CrossRef]
  62. Scotti, R.; Brardinoni, F. Evaluating millennial to contemporary time scales of glacier change in Val Viola, Central Italian Alps. Geogr. Ann. Ser. A Phys. Geogr. 2018, 100, 319–339. [Google Scholar] [CrossRef]
  63. Roth von Telegd, L. Das albanisch-montenegrinische Grenzgebiet bei Plav (Mit besonderer Berücksichtigung der Glazialspuren). In Beiträge zur Geologie von Albanien, Neues Jahrbuch für Mineralogie, Geologie und Paläontologie; Nowack, E., Ed.; Schweizerbert: Stuttgart, Germany, 1923; pp. 422–494. [Google Scholar]
  64. Wilkinson, R. A multi-Proxy Study of Late Holocene Environmental Change in the Prokletije Mountains, Montenegro and Albania. Ph.D. Thesis, University of Manchester, Manchester, UK, 2011. [Google Scholar]
  65. Milivojević, M. Methodology for Reconstruction of Pleistocene Glaciation on the Example of Dinaric-Prokletije Mountains. Ph.D. Thesis, University of Belgrade, Belgrade, Serbia, 2019. [Google Scholar]
  66. Colucci, R.; Žebre, M.; Torma, C.Z.; Glasser, N.; Maset, E.; Del Gobbo, C.; Pillon, S. Recent Increases in Winter Snowfall Provide Resilience to Very Small Glaciers in the Julian Alps, Europe. Atmosphere 2021, 12, 263. [Google Scholar] [CrossRef]
  67. IPCC. Sixth Assessment Report; The Physical Science Basis, Summary for Policymakers: Geneva, Switzerland, 2021. [Google Scholar]
  68. Nojarov, P.; Gachev, E.; Grunewald, K. Recent behavior and possible future evolution of the glacieret in the cirque Golemiya Kazan in the Pirin Mountains under conditions of climate warming. J. Mt. Sci. 2019, 16, 16–29. [Google Scholar] [CrossRef]
Figure 1. Small glaciers (glacierets) in the Northern Pirin Mountains: Snezhnika and Banski suhodol, and sites for stationary climatic measurements.
Atmosphere 13 00859 g001
Figure 2. Snezhnika glacieret with Vihren peak in October 2021 (a) and Banski suhodol glacieret with Kutelo peak in November 2015 (b). Photographs by the author.
Atmosphere 13 00859 g002
Figure 3. Surface area of the glacierets in the Pirin Mountains (real, not projected surface).
Atmosphere 13 00859 g003
Figure 4. Topographic and geomorphological setting of Pirin glacierets.
Atmosphere 13 00859 g004
Figure 5. Average temperature conditions for the altitudes of Snezhnika and Banski suhodol glacierets, extrapolated from data from Musala peak for the period 2006–2021.
Atmosphere 13 00859 g005
Figure 6. Main variables for air temperature near Snezhnika glacieret derived from meteorological data collected at Musala peak [18].
Atmosphere 13 00859 g006
Figure 7. Monthly precipitation (mm) at Musala peak and Sandanski for 2006–2021 (data from [18]).
Atmosphere 13 00859 g007
Figure 8. Graphical representation of the relationship between the area of Snezhnika glacieret and the sum of daily temperatures for the days with average temperature above 0 °C (sum of positive daily temperatures) at 2450 m a.s.l. (a), and between the area of Banski suhodol glacieret and the sum of positive daily temperatures at 2650 m a.s.l. (b). Sums are derived by extrapolation from data from Musala peak for the years 1994–2021 (a) and 2009–2021 (b) [22].
Atmosphere 13 00859 g008
Table 1. Climatic data for the Musala peak weather station (data from [32]), summarized for glacieret hydrological years 2008/2009 to 2020/2021 (T—temperature, P—precipitation).
Hydrological YearT Annual
(Nov.–Oct.)
T Abl.
Season
(May–Oct.)
T Summer (Jun.–Aug.) P Annual
(Nov.–Oct.)
P (Dec.–Apr.)P (May–Oct.)Area Snezhnika (ha)Area Banski Suhodol (ha)
2008–2009−2.43.15.58895734050.691.19
2009–2010−1.93.36.29174394590.691.43
2010–2011−1.93.15.86022523290.551.33
2011–2012−1.55.07.77024492530.340.93
2012–2013−2.03.25.07994203700.651.42
2013–2014−1.22.85.38863135500.381.14
2014–2015−1.93.95.410205714090.531.09
2015–2016−1.13.16.06573053120.511.13
2016–2017−2.13.46.58554034280.330.97
2017–2018-1.33.55.38923464960.641.21
2018–2019−1.74.16.26513752310.360.92
2019–2020−1.03.95.79834594740.300.90
2020–2021−1.83.66.48644803660.541.07
Average−1.73.55.98334143910.501.13
Table 2. Climatic anomalies (subtraction for temperature and percentage for precipitation and glacier area) referred to the 2008/09–2020/21 average for Musala peak meteorological station (data from [32]), summarized for glacieret hydrological years.
Hydrological YearT Annual
(Nov.–Oct.)
T Abl. Season
(May–Oct.)
T Summer (Jun.–Aug.)P Annual
(Nov.–Oct.)
P (Dec.–Apr.)P (May–Oct.)Area Snezhnika (ha)Area Banski Suhodol (ha)
2008–2009−0.7−0.4−0.4120138104139105
2009–2010−0.2−0.2+0.2110106117139127
2010–2011−0.3−0.4−0.272618495117
2011–2012+0.2+1.4+1.884108656980
2012–2013−0.3−0.4−1.09610195131126
2013–2014+0.5−0.7−0.61067614177101
2014–2015−0.2+0.4−0.512213810510996
2015–2016+0.6−0.5+0.1797480103100
2016–2017−0.5−0.1+0.6103971096786
2017–2018+0.40.0−0.610784127129107
2018–20190.0+0.6+0.37891597381
2019–2020+0.6+0.3−0.21181111216180
2020–2021−0.1+0.1+0.51041169410995
Table 3. Pearson correlation coefficient, evaluating the relationships between the size of the Pirin glacierets and the temperature variables calculated on the basis of climatic data from Musala peak (after the respective temperature correction for 2450 m altitude for Snezhnika glacieret and 2650 m altitude for Banski suhodol glacieret).
GlacieretPeriod
(Hydrological Years)
Pearson Correlation Coefficient rxy between Glacieret Area and Climatic Variables:
Mean Annual
Temperature
Summer Temperature
(16 May–15 Sep.)
Sum of Positive Daily
Temperatures
Annual Number of Days with Positive Daily Mean temp.
Snezhnika1993/94–2020/21−0.65−0.57−0.75−0.63
2007/08–2020/21−0.57−0.57−0.76−0.75
2008/09–2020/21−0.61−0.58−0.76−0.76
Banski suhodol2008/09–2020/21−0.47−0.65−0.73−0.60
Table 4. Coefficient D illustrating the graphical deviation of points on Figure 7 and Figure 8 from the dependency trendlines, and differences in D between consecutive years.
Year of MeasurementSnezhnika GlacieretBanski Suhodol Glacieret
Coefficient DDifference in D between Consecutive YearsCoefficient DDifference in D between Consecutive Years
1998–2.0
1999–0.8+1.2
2000+2.0+2.8
2001+1.2–0.8
2002–1.9–3.1
2003–1.1+0.8
2004–2.3–1.2
2005+2.0+4.3
2006+1.7–0.3
2007+0.3–1.4
2008+1.0+0.7
2009+1.6+0.6–1.7
2010+3.1+1.5+2.0+3.7
2011–1.2–4.3–0.3–2.3
2012+5.0+6.5+5.0+5.3
2013–0.1–5.10.0–5.0
2014–0.2–0.10.00.0
2015+2.2+2.40.00.0
2016–1.9–4.1–3.2–3.2
2017+1.0+2.90.0+3.2
2018+3.1+2.1+0.3+0.3
2019–0.3–3.4–1.6–1.9
2020+0.7+1.00.0+1.6
2021+0.6–0.1–1.8–1.8
Colors represent the following: dark blue—sharp increase; light blue—moderate increase; green—slight change in position; light red—light drop; dark red—sharp drop.
Table 5. Actual duration of accumulation and ablation seasons according to the data of the ground temperature at Snezhnika glacieret.
YearAccumulation SeasonAblation Season
Dry ColdTotal Snow Cover
DatesDaysDatesDaysDaysDatesDays
2016–201728.10–8.11119.11–16.0622023117.06–8.10114
2017–20189.10–28.102029.10–12.0725727713.07–6.11117
2018–20197.11–24.111825.11–1.072192372.07–14.11136
2019–202015.11–20.11621.11–23.0621622524.06–7.11137
2020–20218.11–10.123311.12–7.072082418.07–7.1092
Table 6. Actual duration of accumulation and ablation seasons according to the data of the ground temperature at Banski suhodol glacieret.
YearAccumulation SeasonAblation Season
Dry ColdSnow CoverTotal
DatesDaysDatesDaysDaysDatesDays
2017–201820.10–10.112211.11–15.0827830016.08–6.1193
2018–20197.11–24.11 1825.11–31.072492671.08–14.11 106
Table 7. AMean monthly temperatures at Snezhnika glacieret.
YearMonth Ann.
XIXIIIIIIIIIVVVIVIIVIIIIXX
2015–2016 1.1-
2016–2017−0.10.1−0.2−0.4−0.4−0.1−0.12.49.49.45.30.32.1
2017–20180.10.20.20.10.0−0.1−0.1−0.12.97.45.11.41.4
2018–2019−1.1−0.5−0.6−0.7−0.8−0.5−0.1−0.15.79.46.22.11.6
2019–20200.30.10.10.00.0−0.1−0.10.77.18.27.21.82.1
2020–2021−2.4−1.4−0.4−0.3−0.3−0.4−0.1−0.15.410.24.9 (1.4)
Values in brackets are not for the whole period (the same is for the following tables).
Table 8. Mean monthly temperatures at Banski suhodol glacieret.
YearMonth Ann.
XIXIIIIIIIIIVVVIVIIVIIIIXX
2017–2018−0.8−0.5−0.4−0.5−0.6−0.8−0.10.00.02.32.3−0.10.0
2018–2019−2.0−1.0−1.2−1.5−1.6−1.6−0.60.00.16.23.9(1.9)0.2
Table 9. Sums of positive daily temperatures at Snezhnika glacieret.
YearMonth Ann.
XIXIIIIIIIIIVVVIVIIVIIIIXX
2015–2016 41-
2016–201744000007429229315912838
2017–2018385300009023115445539
2018–201911000000017729018667731
2019–2020134310002222025321760793
2020–202140000000167315148 (634)
Table 10. Sums of positive daily temperatures at Banski suhodol glacieret.
YearMonth Ann.
XIXIIIIIIIIIVVVIVIIVIIIIXX
2017–2018000000000737713163
2018–20191200000002193116(32)353
Publisher’s Note: MDPI stays neutral with regard to jurisdictional claims in published maps and institutional affiliations.

