Article

Optical and Microphysical Properties of the Aerosol Field over Sofia, Bulgaria, Based on AERONET Sun-Photometer Measurements

Institute of Electronics, Bulgarian Academy of Sciences, 72 Tsarigradsko Chaussee Blvd, 1784 Sofia, Bulgaria
*
Authors to whom correspondence should be addressed.
Atmosphere 2022, 13(6), 884; https://doi.org/10.3390/atmos13060884
Submission received: 20 April 2022 / Revised: 25 May 2022 / Accepted: 26 May 2022 / Published: 29 May 2022
(This article belongs to the Special Issue Atmospheric Composition and Regional Climate Studies in Bulgaria)

Abstract

:
An analysis of the optical and microphysical characteristics of aerosol passages over Sofia City, Bulgaria, was performed on the basis of data provided by the AErosol RObotic NETwork (AERONET). The data considered are the result of two nearly complete annual cycles of passive optical remote sensing of the atmosphere above the Sofia Site using a Cimel CE318-TS9 sun/sky/lunar photometer functioning since 5 May 2020. The values of the Aerosol Optical Depth (AOD) and the Ångström Exponent (AE) measured during each annual cycle and the overall two-year cycle exhibited similar statistics. The two-year mean AODs were 0.20 (±0.11) and 0.17 (±0.10) at the wavelengths of 440 nm (AOD440) and 500 nm, respectively. The two-year mean AEs at the wavelength pairs 440/870 nm (AE440/870) and 380/500 nm were 1.45 (±0.35) and 1.32 (±0.29). The AOD values obtained reach maxima in winter-to-spring and summer and were about two times smaller than those obtained 15 years ago using a hand-held Microtops II sun photometer. The AOD440 and AE440/870 frequency distributions outline two AOD and three AE modes, i.e., 3 × 2 groups of aerosol events identifiable using AOD–AE-based aerosol classifications, additional aerosol characteristics, and aerosol migration models. The aerosol load over the city was estimated to consist most frequently of urban (63.4%) aerosols. The relative occurrences of desert dust, biomass-burning aerosols, and mixed aerosols were, respectively, 8.0%, 9.1% and 19.5%.

1. Introduction

The Earth’s atmosphere contains an immense quantity of aerosol particles known also as atmospheric particulate matter. These particles, with their abilities to scatter and/or absorb the incoming solar radiation and to act as cloud condensation nuclei, are of primary importance for the Earth’s radiative budget, thus influencing significantly the climate and living conditions on Earth [1,2]. Because of their numerous impacts combined with high spatial and temporal variability due to their short lifetime, the aerosols are the object of comprehensive global and local monitoring and studies of their sources, type, transport, microphysical, and optical properties using a variety of experimental active (lidars) and passive (photometers, radiometers) ground-based, ship-borne, air-borne, and space-borne remote sensing facilities and networks [3,4,5,6,7,8,9,10,11]; weather information (e.g., [12]); and powerful data processing and interpretation program products and forecasting models [13,14,15,16,17,18,19,20,21]. The ultra-fine (submicron) fraction of the near-surface atmospheric aerosols, the so-called fine dust particles, may dangerously affect the ecosystems and human health, causing harmful mechanical, chemical, radiological, and microbiological impacts, e.g., on the human respiratory and cardiovascular systems [22,23]. Therefore, the remote active and passive and the in situ monitoring of the atmospheric aerosol load is of considerable not only scientific but also societal importance, allowing policymakers and local authorities to be timely informed to undertake measures [24,25] to reduce the negative effects of the air pollutions on the climate and human health and improve air quality.
The AErosol RObotic NETwork (AERONET) [6] is a worldwide network comprising numerous ground-based sun-photometer sites [26,27,28,29,30,31,32,33,34,35]. The photometric data obtained automatically following predefined scenarios of measuring the sun and moon irradiance and sky radiance in several spectral bands allow one to retrieve, through automatic AERONET data processing, a series of important columnar aerosol characteristics [6,36,37,38,39]. The values of the retrieved characteristics may correspond to three quality levels of data processing—without cloud screening (level 1.0), with cloud screening (level 1.5) [40], and with cloud screening and quality assurance (level 2.0) [41]. The knowledge of the aerosol characteristics would allow one to estimate the Earth’s radiative budget [25,36,42,43,44] and the air quality [45,46] and to validate the results about the aerosol optical depth (AOD) measured by satellite-borne apparatuses [47,48,49,50].
Regular lidar monitoring of the aerosol stratification over Sofia City, Bulgaria, is performed by the Sofia Station at the Institute of Electronics, Bulgarian Academy of Sciences (IE-BAS), which is involved in the activities of the European Aerosol Research LIdar NETwork (EARLINET) [5] and the Aerosol, Clouds and the Trace gasses Research Infrastructure (ACTRIS) [51]. In May 2020, the station’s equipment was completed with a Cimel CE318-TS9 sun/sky/lunar photometer [52,53] involved in AERONET that provides almost the whole set of column-integrated or averaged characteristics of the aerosol field over Sofia at different optical wavelengths [54]. As almost two annual cycles have already been completed since the beginning of the photometer operation, we deemed it appropriate to perform an initial analysis of the accumulated data.
Different aerosol classification methods have been developed to categorize the aerosol types when using AERONET observations. AOD and the Ångström exponent (AE) are typically used for aerosol type classification [27,29,31,32,33,55,56]. There are also methods that use other combinations of aerosol characteristics, such as AE and single scattering albedo (SSA) [50]; SSA and fine-mode fraction (FMF) [57]; or AE, SSA, and FMF [58,59]. Using also additional information for possible source regions or transport trajectories [17,18,21], a conclusion can be drawn about the predominant aerosol type.
The present work is aimed at: tracking the climatology of the aerosol optical depth [60,61] and Ångström exponent [62,63] over Sofia at some radiation wavelengths and comparing the results obtained with similar ones obtained at other AERONET sites; comparing the values of AOD being obtained now with those obtained 15 years ago and estimating the efficiency of the measures undertaken to improve the air quality; and estimating the typology of the aerosol events over Sofia on the basis of AOD, AE, other aerosol characteristics and additional sources of information, and their relative weight in the overall climatology picture.
The paper is organized as follows: in the next section, Section 2, we briefly describe the location of the Sofia Site (IE-BAS) and some peculiarities of its environment; the performance and capabilities of the Cimel CE318-TS9 sun/sky/lunar photometer; and the research approach, procedures and forecasting models. The results of the work concerning the climatology peculiarities and the typical aerosol events observed at the Sofia Site are described and discussed in Section 3. The main conclusions drawn from the results obtained are summarized in Section 4.

2. Site, Instrumentation and Research Approach

2.1. Sofia Site

The Cimel CE318-TS9 sun/sky/lunar photometer is installed on the roof of the IE-BAS building, 42.65 N, 23.38 E, 620 m above sea level (ASL), in the southeast part of Sofia City, which is situated in a heavily urbanized mountain valley. Sofia Valley (average 550 m ASL) is surrounded by mountains: Vitosha and Plana in the south, Lyulin in the west, the Balkan Mountains in the north, and Lozen in the east (Figure 1). The complex orography, the intricate air-flow pattern caused by the diurnal mountain winds, and high urbanization [64,65], as well as the temperature inversions, complicate the natural ventilation and trap the air pollutants [66,67]. Since the largest Bulgarian metalworking plant located at a distance of about 20 km northeast from the city center stopped functioning in 2009, the prevalent air pollutant sources have been mainly traffic, domestic heating, industries, thermal power stations, dusty roads, biomass burning, etc. [68,69]. Model analyses indicate the predominant contribution being of the local sources of pollutants except in the cases of long-range-transported secondary aerosols and desert dust [69]. Sofia has a continental climate with a mean annual temperature of 10 °C and a mean annual precipitation of 576 mm [70]. The air temperature normally reaches a minimum in January and a maximum in July. The wind rose in Sofia shows predominant western and eastern winds with a mean annual wind speed of 2.4 m/s [70,71].

2.2. Cimel CE318-TS9 Operation and AERONET Capabilities

The CE318-TS9 sun/sky/lunar photometer comprises optical channels at the wavelengths λ = 340, 380, 440, 500, 675, 870, 937, 1020, and 1640 nm with a field of view of 1.3° and performs automatically daytime measurements of sun irradiance and sky radiance and night-time measurements of moon irradiance according to predefined scenarios [52,53]. Direct sun measurements are carried out every 3 or 5 min at all the available wavelengths, while sky radiances in almucantar, principal plane, and hybrid scenarios are measured, in general, every hour at several wavelengths (380, 440, 500, 675, 870, 1020, and 1640 nm). The overall scan configuration and schedule are chosen in such a way as to provide a sufficient amount of accurate raw data ensuring the unambiguous and accurate retrieval of the characteristics of interest [6,28,36]. The corresponding automatic AERONET data processing allows one to retrieve a large set of atmospheric aerosol-characteristic parameters, such as AOD, AE, AOD of the fine (AODf500), and coarse (AODc500) aerosol fractions at λ = 500 nm, volume size distribution (VSD), complex refractive index (CRI, nr+inim), SSA, scattering phase function, precipitable water content, etc. [6,28,36,38,39,41,72]. AODf500 and AODc500 indicate the contribution of the fine and the coarse aerosol fractions to the aerosol optical characteristics. To provide an idea of the order of magnitude of the errors in measuring or retrieving some variables or aerosol characteristics, it is estimated, for instance [6,40], that the absolute error in determining the AOD is <0.01 for λ > 440 nm and <0.02 for λ < 440 nm; the relative uncertainty in measuring the sky radiance is < 5%, and that in determining the precipitable water may reach 12%.
According to the network requirements, after each full year of operation the photometer is calibrated following the AERONET protocols in the CNRS CARS Unit of the European AERONET Calibration Service Centre, Laboratoire d’Optique Atmosphérique, Université de Lille, France.

2.3. Research Approach and Procedures

The research approach in the work consists first in studying the AOD and AE climatology by tracking their variations during the days, months, seasons, and years and revealing the peculiarities of their evolution and statistics [29]. The frequency distributions were analyzed as well of AOD and AE for each annual cycle and the overall two-year cycle, along with important statistical characteristics of the time series, such as mean values, standard deviations characterizing the range of fluctuations (the variability) of the quantities, least and largest values, medians, and distribution skewness. The frequency distributions turned out to have a more complex multimode structure with modes indicating a possible grouping of the aerosol events (daily aerosol situations) according to the specific daily mean values of their AOD and AE. After distinguishing the different groups (zones) and outlining their boundaries on AOD–AE scatter plots, recognition is performed of the possibly specific aerosol events in each zone on the basis of appropriate sets of AERONET-provided aerosol characteristics that are usually known for key aerosol types. The characteristics we have chosen for this work are the particle VSD, CRI, and SSA as well as the particle sphericity factor (SF) and linear depolarization ratio (DR). After the aerosol types are identified and their AOD–AE boundaries outlined, the latter are compared with such boundaries (AOD–AE classification thresholds) obtained by other authors (e.g., [27,28,29,31,33,34,56,73,74,75,76,77]). The comparison shows near threshold positions.
The AERONET data employed in the paper are of Version 3.0 algorithm products and quality level 1.5 [41]. Note that sometimes the raw data from the photometer measurements are not regularly provided because of unfavorable (cloudy) weather, technical problems, and a time gap for calibrating the instrument.
The information about the backward trajectories was obtained through the National Oceanic and Atmospheric Administration (NOAA) Hybrid Single-Particle Lagrangian Integrated Trajectory model (HYSPLIT) [17,18] and that about the Saharan dust intrusions through the Barcelona Supercomputing Center Dust Regional Atmospheric Model (BSC-DREAM8b v2.0) [19,20]. The data about the fires in Bulgaria and adjacent regions used in the paper were provided by the NASA’s Fire Information for Resource Management System (FIRMS), part of NASA’s Earth Observing System Data and Information System (EOSDIS) [78] on the basis of the satellite observation from the Moderate Resolution Imaging Spectroradiometer (MODIS) aboard the Aqua and Terra satellites, and the Visible Infrared Imaging Radiometer Suite (VIIRS) aboard the Suomi NPP and NOAA 20 satellites. Information on the weather conditions [79] was also used as provided by the Bulgarian National Institute of Meteorology and Hydrology.

3. Results and Discussion

The total number of individual measurements performed by the Cimel CE318-TS9 sun/sky/lunar photometer at the Sofia (IE-BAS) Site from 5 May 2020 to 28 February 2022 and selected as representative is 25,609, of which 8196 were during 2020, 15,212 were during 2021, and 2201 were during 2022. The corresponding total number of active days of measurements is 374, including 144 days in 2020, 191 days in 2021, and 39 days in 2022. A time gap exists from 12 May 2021 to 15 July 2021, when the instrument had to be calibrated. Two more gaps, from 7 July to 17 August 2020 and from 11 November to 30 November 2021, are due to technical issues. In fact, the period of measurements under consideration here consists of two nearly complete annual cycles including partly or entirely the four seasons—spring (March, April, and May, MAM), summer (June, July, and August, JJA), autumn (September, October, and November, SON), and winter (December, January, and February, DJF). The first cycle lasts from 5 May 2020 to 28 February 2021 and the second one from 1 March 2021 to 28 February 2022. Then, the seasonal distribution of the number of measurements and active days is as follows: for the first cycle—650 measurements within 17 days in the spring (MAM), 2955 measurements within 44 days in the summer (JJA), 4285 measurements within 71 days in the autumn (SON), and 1788 measurements within 49 days in the winter (DJF); for the second cycle—2543 measurements within 43 days in the spring (MAM), 6737 measurements within 47 days in the summer (JJA), 4093 measurements within 50 days in the autumn (SON), and 2558 measurements within 53 days in the winter (DJF).

3.1. Climatology Features of AOD and AE

3.1.1. Temporal Behavior

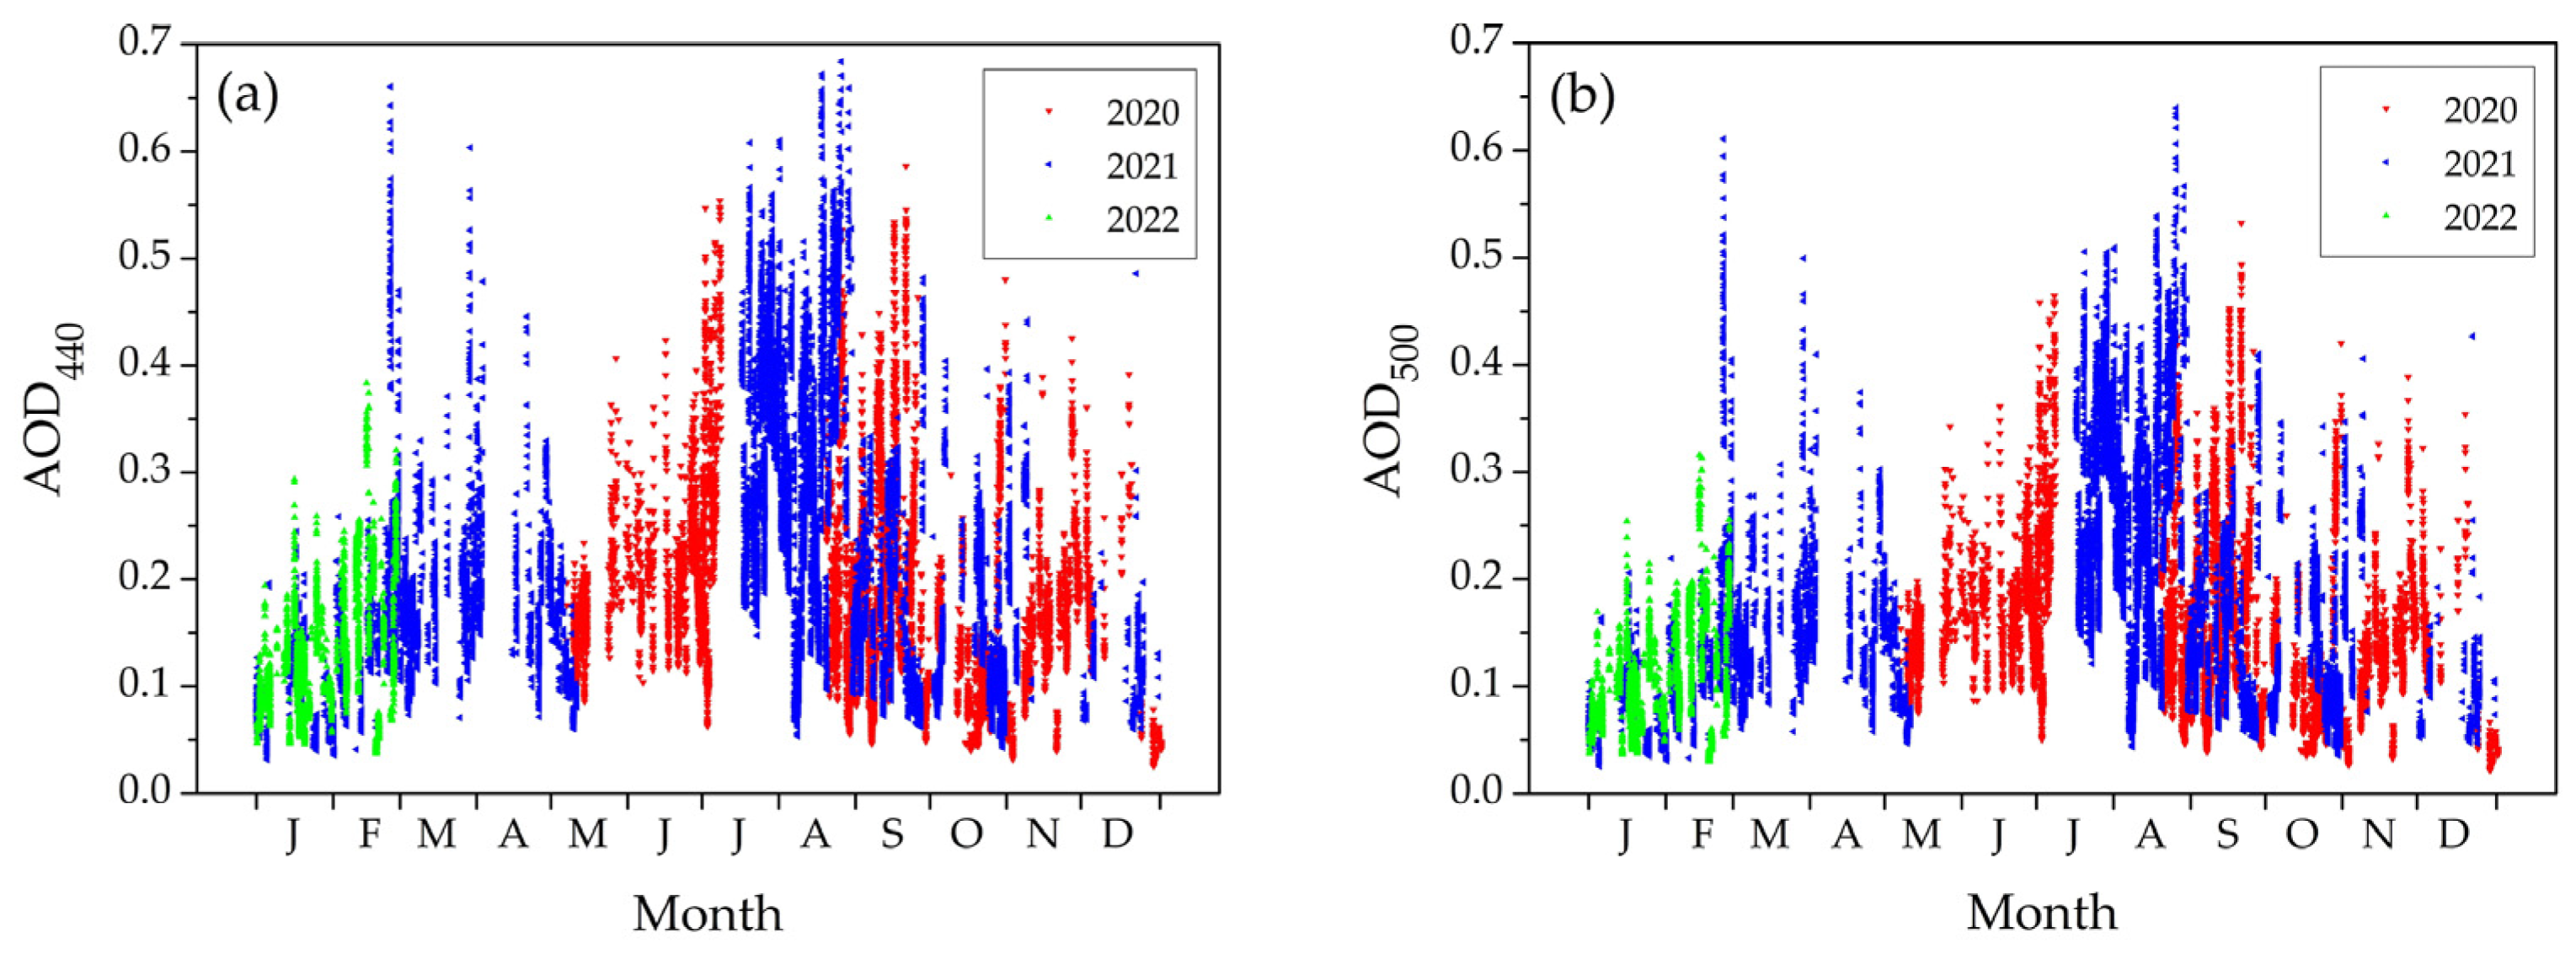
Figure 2 presents sequences of AOD values for years 2020, 2021, and 2022 (in different colors) at the wavelengths λ = 440 nm (AOD440) and λ = 500 nm (AOD500). Considering the three graphs there, one can notice that they have similar behavior and mutually complete the lacking sections. Additionally, it is seen in Figure 2 that the AOD is a strongly variable, non-stationary random function of the time, reaching maxima on average within the periods around March (February, March, and April) and August (June, July, August, and September). Similar behavior has also been observed at other Balkan and European AERONET sites and has been explained as due to intense Saharan dust (SD) intrusions [29,33]. Certainly, smoke from fires and dust from road pavement and the Vitosha Mountain (Figure 1) should also have contributed to the increase of the atmospheric turbidity in the summer. In late autumn and winter, the atmosphere should be clearer because of the frequent snow and rain precipitations that clean the air and moisten the ground. A seasonal pollutant in this case is the smoke from domestic heating [68].
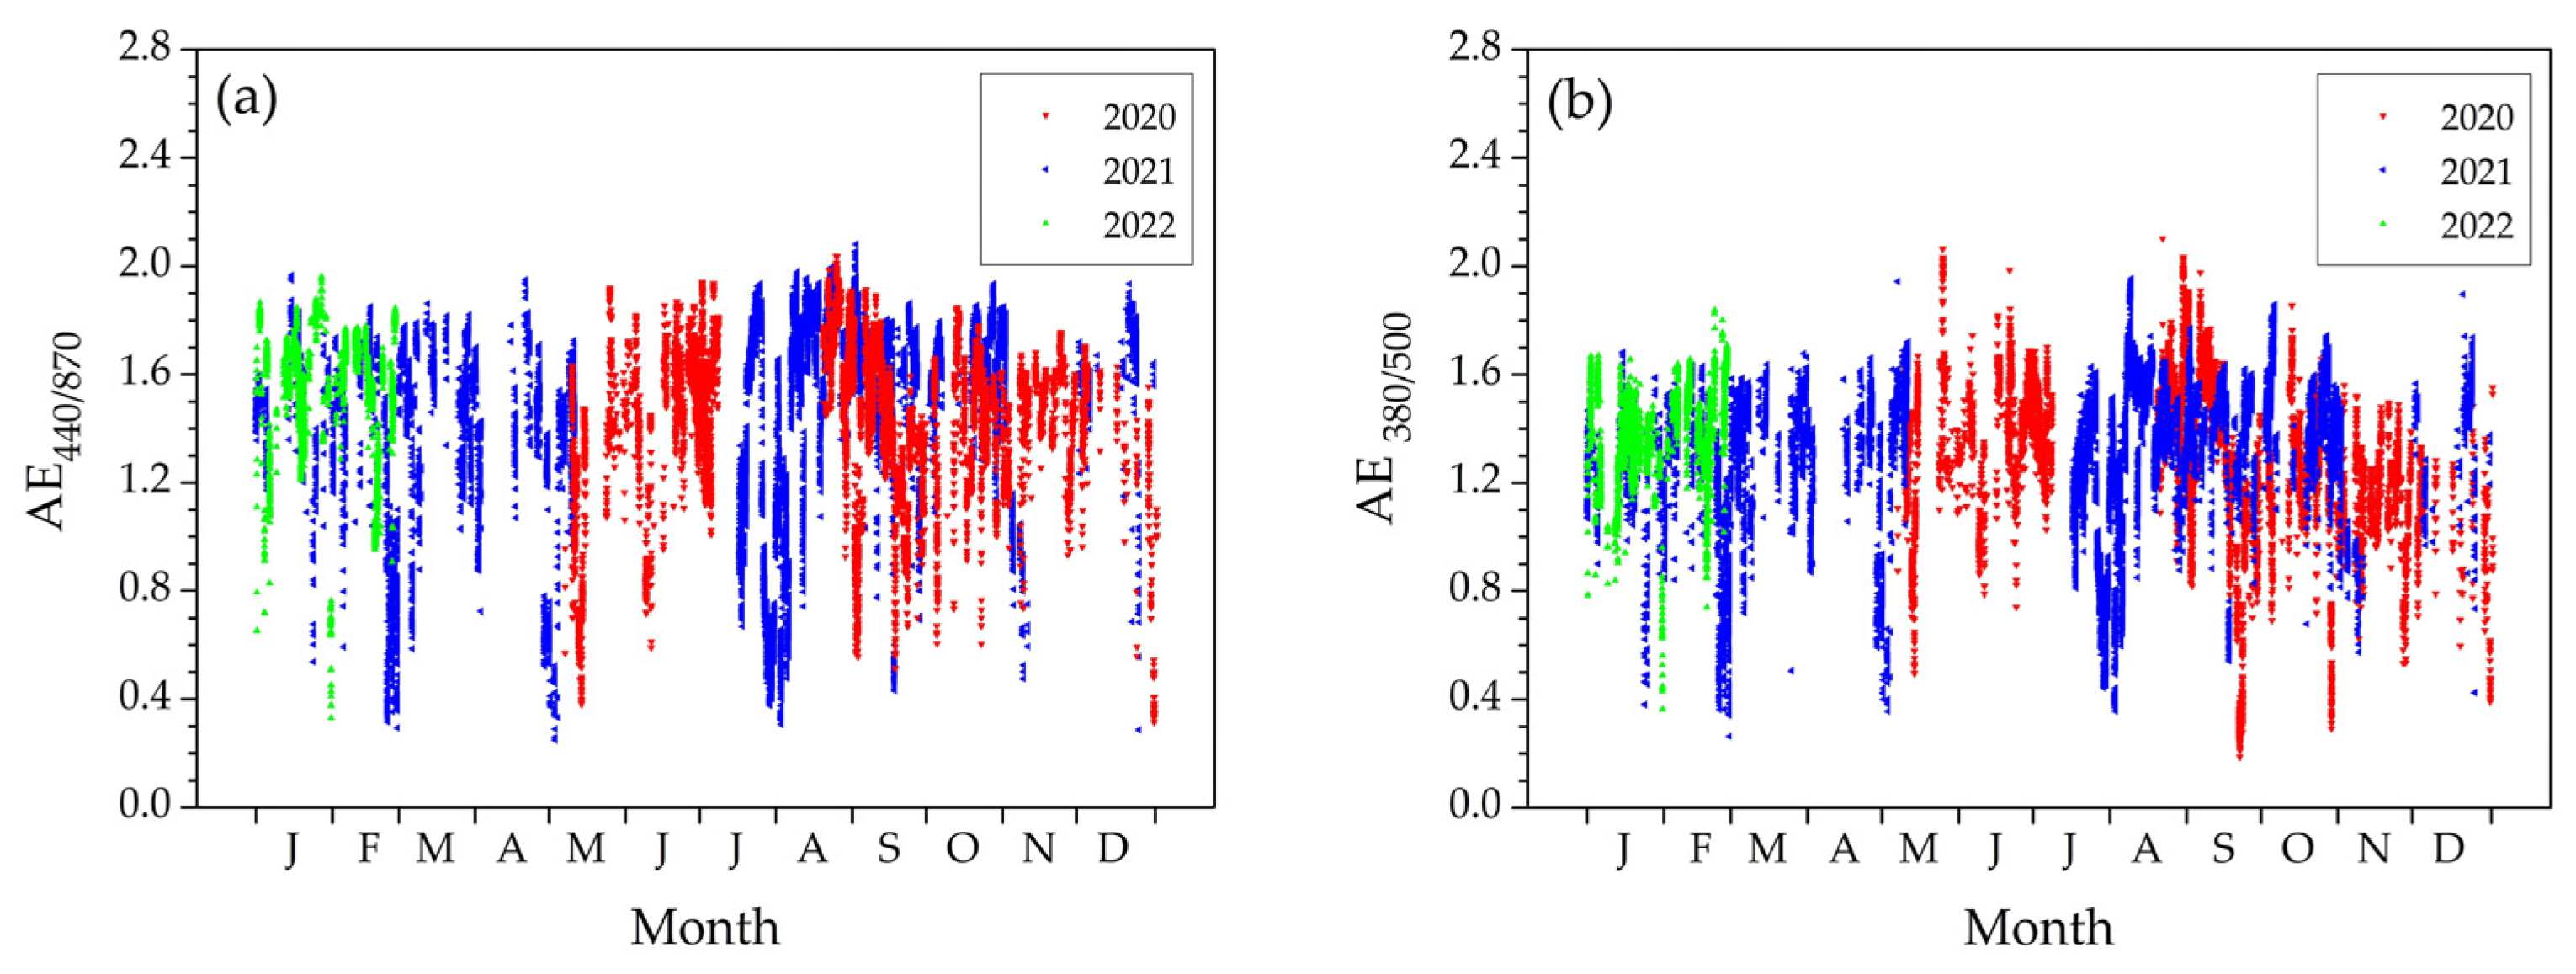
Sequences of AE values for years 2020, 2021, and 2022 (in different colors again) at the wavelengths pairs λ1/λ2 of 440/870 nm (AE440/870) and 380/500 nm (AE380/500) are presented graphically in Figure 3. It is seen that the three graphs of AE vs. time, separately and together, represent almost stationary, strongly variable random functions with approximately the same constant mean value and range of fluctuations, the only exception being a hard-to-notice increase in AE from June to October that is probably due to the increased fine particles fraction arising from biomass burning. Let us also note the periodical decreases of AE440/870 and AE380/500 to levels of the order of 0.3–0.4. Such decreases should be mainly due to Saharan dust intrusions during the different seasons [32,33,34,77]. Low values of AE440/870, well below unity, are known to be intrinsic to aerosol events with prevailing coarse fraction, such as SD intrusions and marine aerosols passages. This is seen as well from the AERONET data. The desert dust may also increase the AOD. The carbonaceous aerosols resulting from biomass burning or domestic heating are usually accepted to have a prevailing fine-particle fraction with an AE440/870 well above unity (e.g., AE440/870 > 1.4). In the process of ageing, however, they undergo various chemical, morphological, and microphysical changes including increasing the particle size and decreasing AE440/870 down to unity and below unity [80,81]. According to some experimental observations [81] and simulations [82], a probability exists that the AE440/870 of aerosol ensembles containing carbonaceous particles could be even as low as 0.2–0.3.
The monthly mean values of AOD440, AOD500, AE440/870, and AE380/500 during the years 2020, 2021, and 2022 are plotted in Figure 4. The diagrams of AOD at λ = 440 nm (Figure 4a) and λ = 500 nm (Figure 4b) are similar in shape and confirm, in general, the above-mentioned conclusions based on Figure 2; namely, the values of AOD are somewhat higher during February, March, and April and have a maximum around July (June, July, and August). The peak seen in November 2021 should be due to SD intrusions (see Section 3.2.2, Saharan Dust Intrusions) and warm weather [79] in the first decade of the month.
The passive remote sensing measurements of the aerosol optical and microphysical characteristics over Sofia began in IE-BAS more than 15 years ago using a spectroradiometer and a Microtops II hand-held sun photometer [83,84]. The Microtops II sun photometer has five optical channels at λ = 380, 500, 675, 936, and 1020 nm and a field of view of 2.5° [85]. We found it interesting to compare the results for the AOD obtained at λ = 500 nm with the Cimel CE318-TS9 sun/sky/lunar photometer with those obtained in Sofia in 2006 and 2007 [86,87] with the Microtops II sun photometer. Such a comparison is considered reasonable because of the fact that the relative difference between the results obtained simultaneously by the sun photometers Microtops II and Cimel CE318 (calibrated according to the AERONET protocols) during a joint experimental campaign carried out in 2007 at the Central Geophysical Observatory of the Polish Academy of Sciences in Belsk, Poland, was about 6% [88].
The comparison showed that the values measured 15 years ago are about twice as high (see Figure 4b) as the results obtained in years 2020, 2021, and 2022. This could be taken as evidence for the improvement of the city air quality due to the measures undertaken by the Bulgarian government [89] and Sofia Municipality [90,91,92] to implement the European air quality policy [93] and to the largest metalworking company in Bulgaria located near Sofia ceasing its functioning. The Moderate Resolution Imaging Spectroradiometer (MODIS) data also confirm the tendency of a decreasing AOD over Sofia from 2000 to 2019 [94,95].
The diagrams in Figure 4c,d of the monthly means of AE440/870 and AE380/500 show that they vary irregularly, in general. In 2021, they seem to oscillate around some average value, which corresponds to the behavior seen in Figure 3. The data series of 2020 and 2022, however, are too short to allow any concrete conclusions. Nevertheless, one may notice increased AE means from June to August 2020 and from August to October 2021, which also corresponds to the slight upward shift (Figure 3) of the AE in the summer-to-autumn season.
The seasonal means of AOD440, AOD500, AE440/870, and AE380/500 concerning the above-described two annual cycles and the overall two-year cycle are illustrated in Figure 4e–h, where it is seen that the dependencies AOD vs. season and AE vs. season have similar shapes at both wavelengths and wavelength pairs, respectively. Expectedly, for the three cycles, the seasonal means of AOD have maxima in the summer (JJA). The comparison performed with results of similar earlier investigations at different wavelengths [33,77] based on one to two decades of measurements across Europe shows that the behavior of AOD vs. the season obtained here is similar to those obtained for southeast Europe at AERONET sites in Bucharest, Thessaloniki, and Athens. Additionally, the AOD results in [33,77] exceed, to a certain extent, the ones obtained here.
The seasonal means of AE440/870 and AE380/500 during the period 5 May 2020–28 February 2022 (2020–2022) are practically constant (Figure 4g,h), which supports the supposition about AE as a stationary random function of time; also, they are close to those obtained in [33,77].

3.1.2. Statistics of AOD and AE

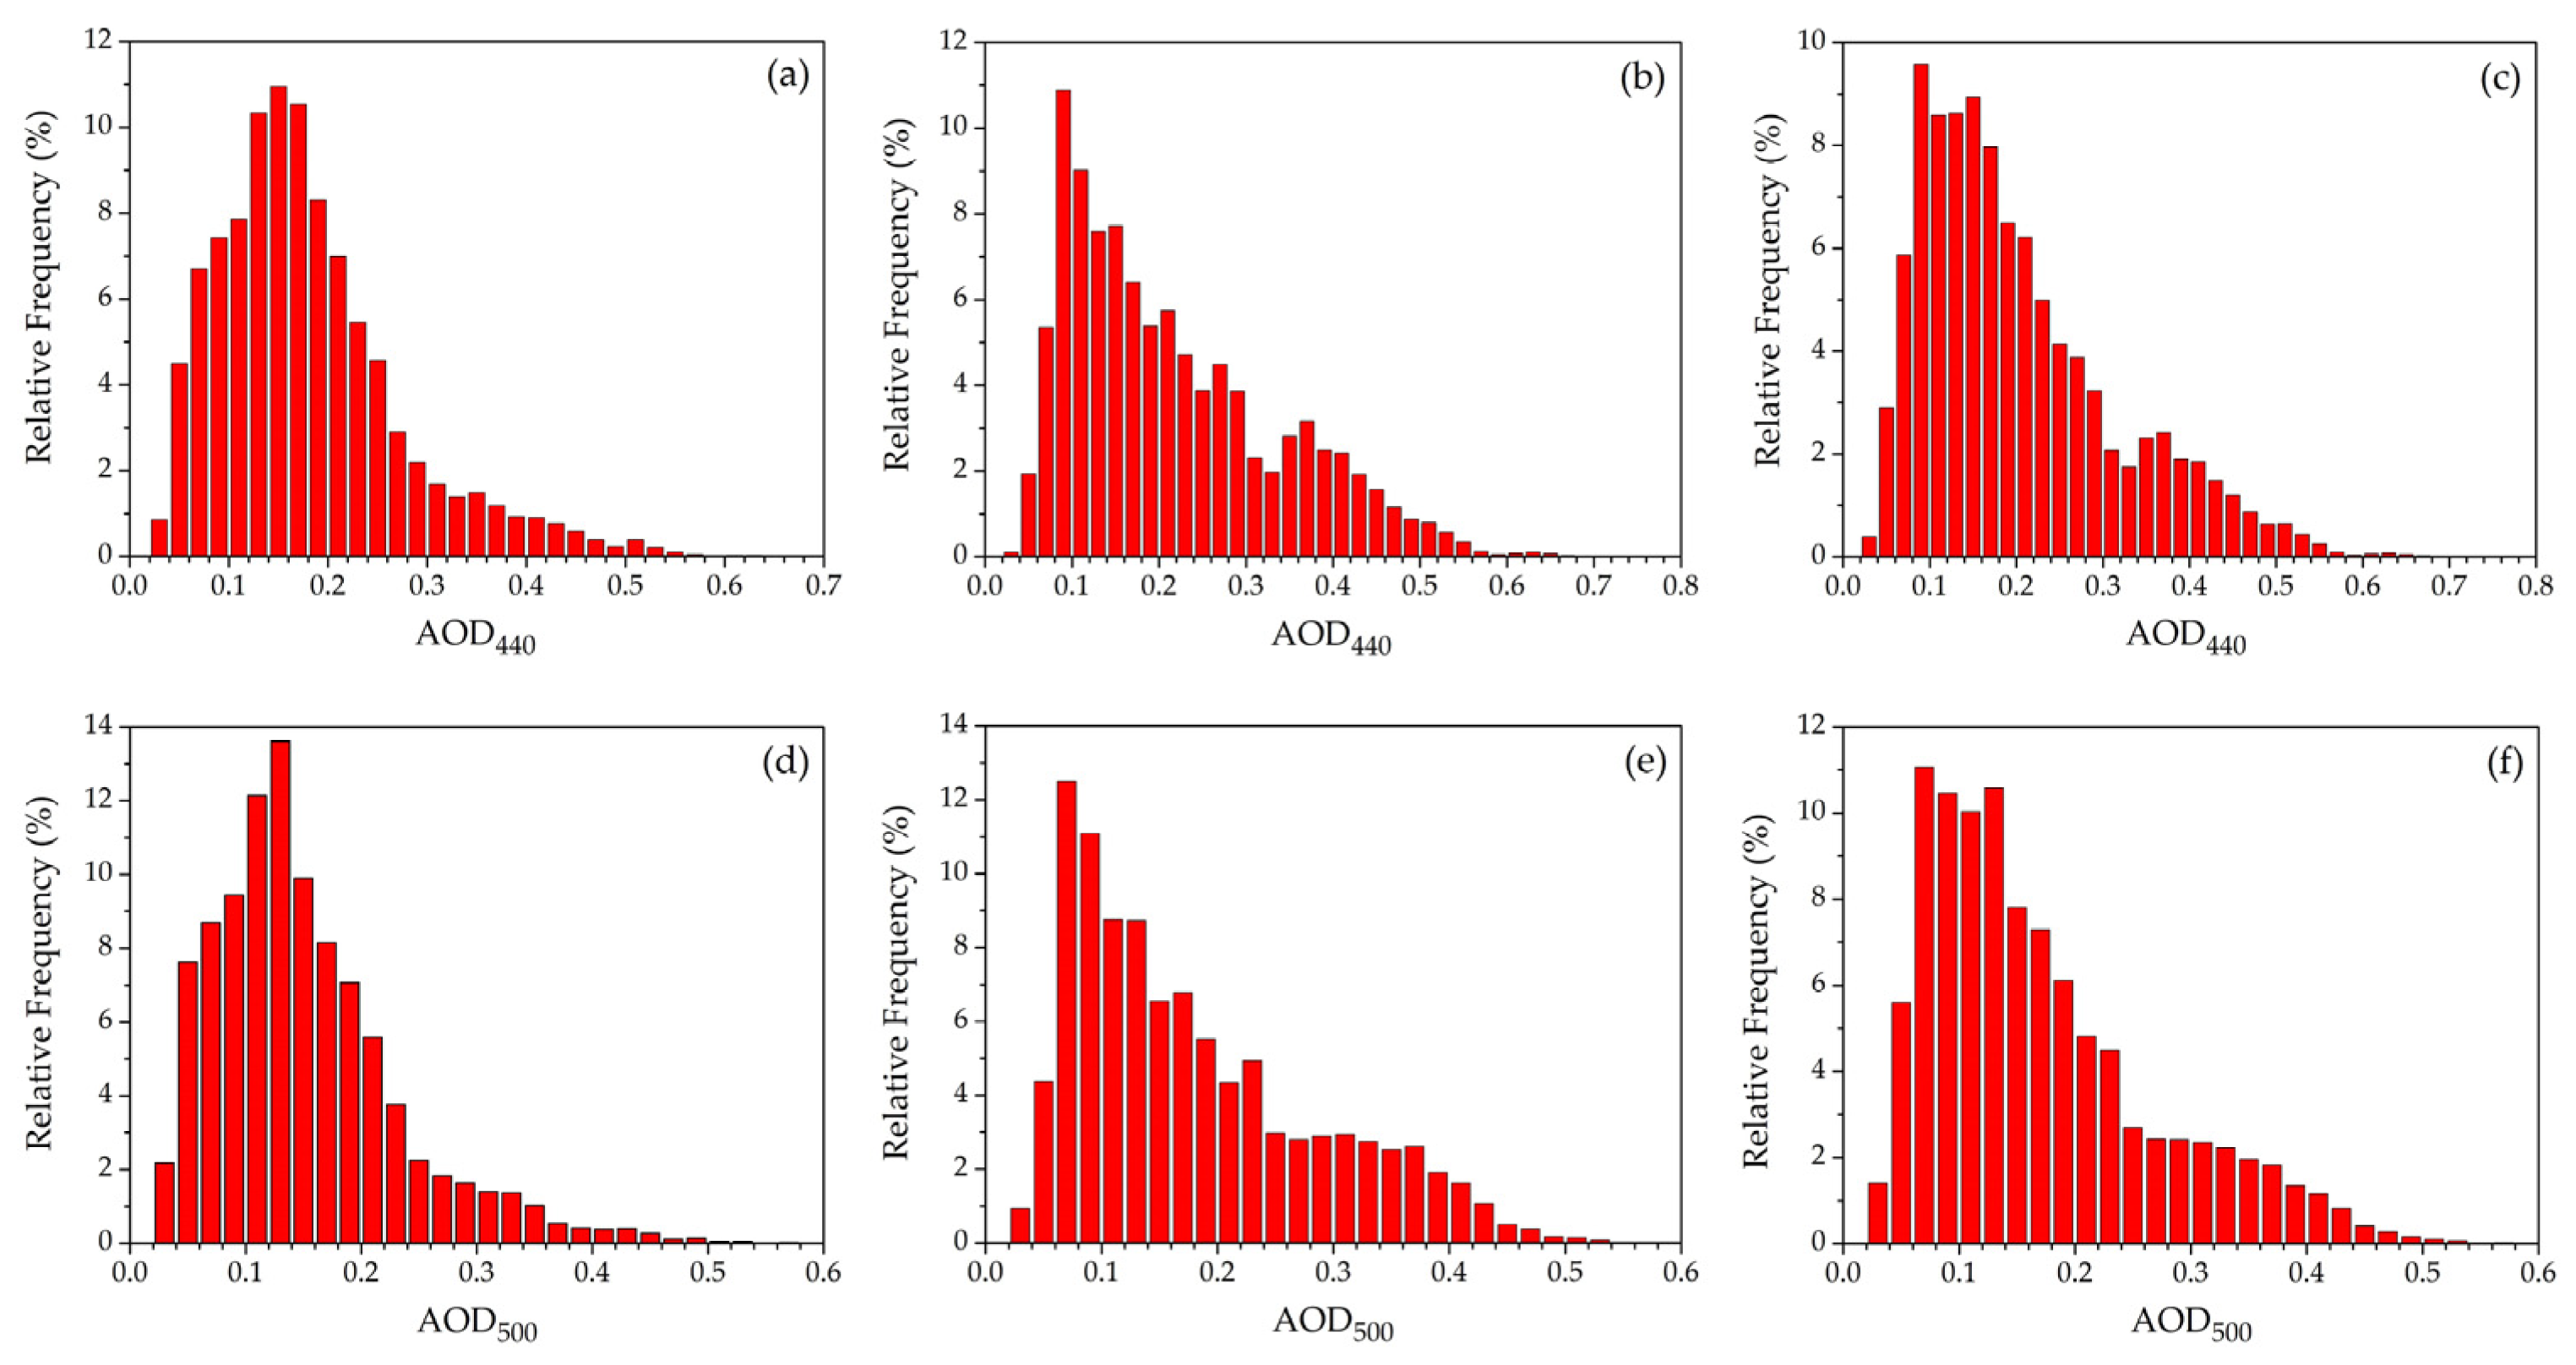
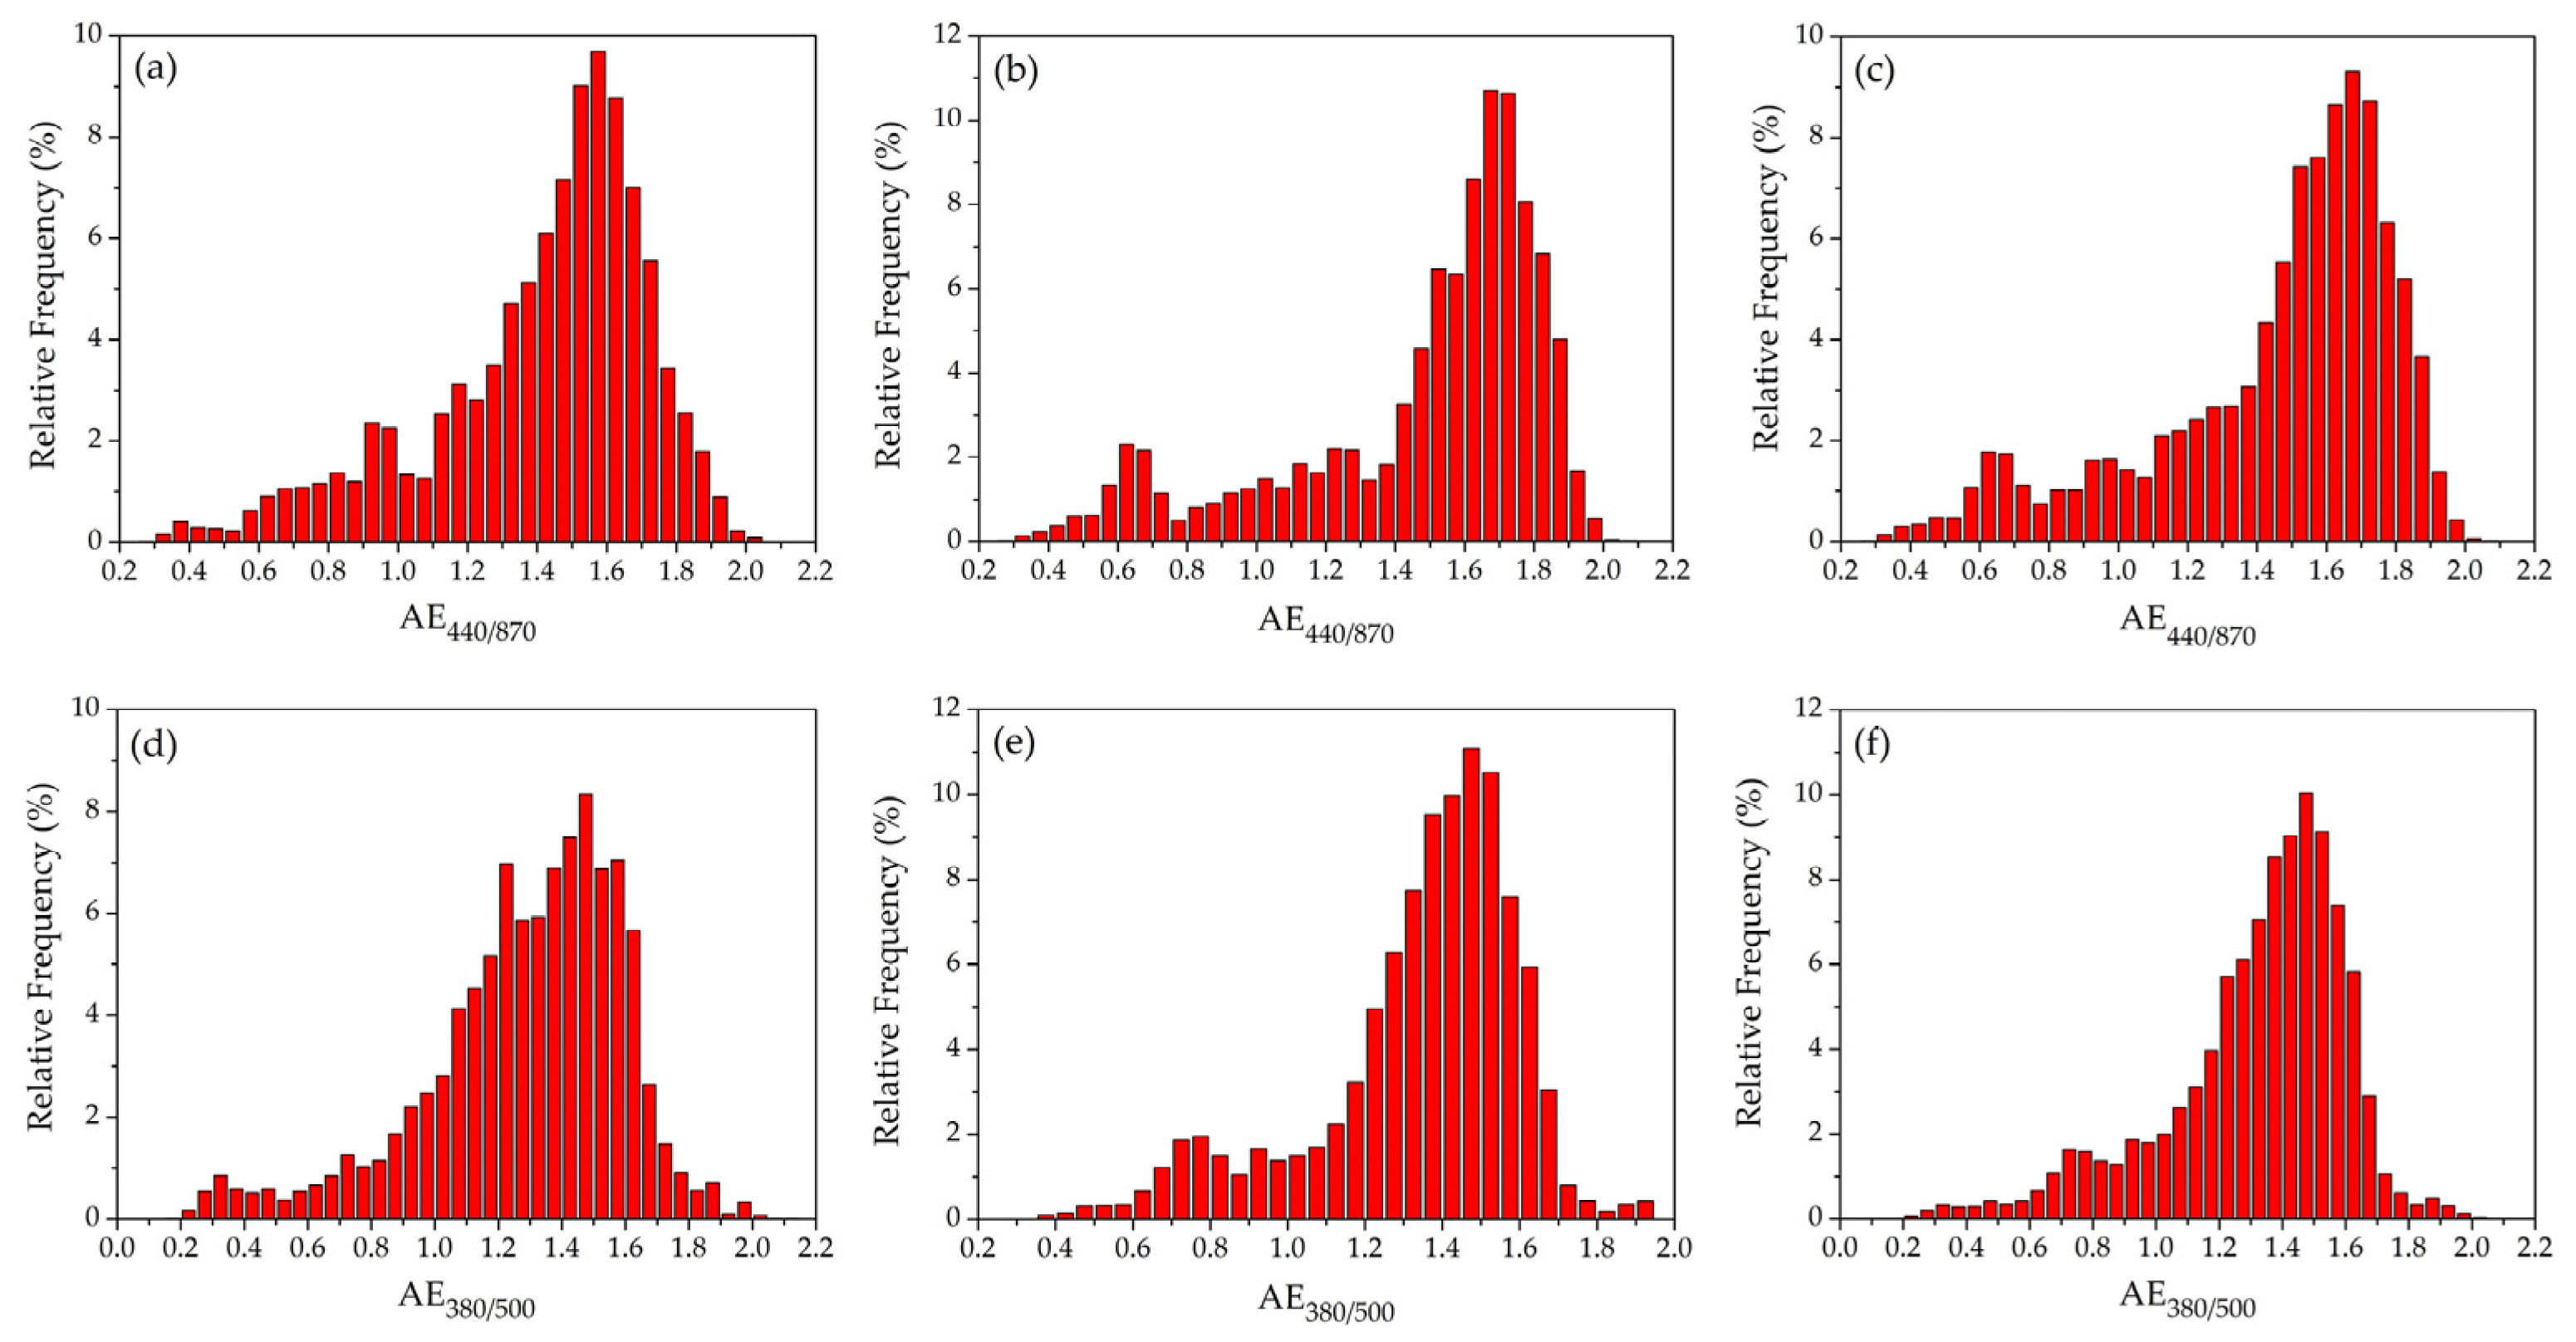
Figure 5 and Figure 6 present the frequency distributions of individual-measurement results (realizations) of AOD and AE obtained during the periods (measurement cycles) 2020–2021, 2021–2022, and 2020–2022, respectively, at the wavelengths λ = 440 nm and 500 nm.
The histograms in Figure 5 outline asymmetric AOD distributions with positive skewness. The distribution of data from the first annual cycle (2020–2021) seems unimodal as well, with no pronounced embryos of second minor modes. However, in the distributions of data from the second annual cycle (2021–2022) and from the two-year cycle (2020–2022), second weaker minor modes were already present and well distinguishable, especially at λ = 440 nm. The positions of their peaks were at AOD440 = 0.37 and AOD500 = 0.31. The major peaks for the periods (2020–2021), (2021–2022), and (2020–2022) were located, respectively, at AOD440 = 0.15, 0.09, and 0.12 and at AOD500 = 0.13, 0.07, and 0.10.
The histograms in Figure 6 exhibit asymmetric AE distributions having negative skewness. They seem to be bimodal at the wavelength pair of 380/500 nm, and three-modal at the wavelength pair of 440/870 nm. The peak positions of the major and minor modes for the pair 440/870 nm for the periods 2020–2021, 2021–2022, and 2020–2022 were, respectively, 1.58, 1.28, and 0.93; 1.68, 1,25, and 0.63; and 1.68, 0.95, and 0.65. The corresponding peak positions for the pair 380/500 nm were 1.48 and 0.73; 1.48 and 0.75; and 1.48 and 0.75. The multimode frequency distributions of AOD and AE suggest a possible aerosol event grouping in the AOD–AE space, each group corresponding possibly to some aerosol type having specific optical and microphysical properties. One may expect to distinguish six such groups on the AOD440–AE440/870 scatter plots and four such groups, on the AOD500–AE380/500 scatter plots. After the different groups are revealed and outlined, the corresponding aerosol events can be characterized and specified on the basis of some suitable set of their optical and microphysical characteristics provided by AERONET sun-photometer measurements. Such a procedure for the characterization and classifications of the aerosol events, or more precisely, daily aerosol situations, is further described in Section 3.2.
Other important statistical characteristics of the distributions and populations of AOD and AE are given in Table 1, which summarizes the total number of measurements; the minimum, maximum, and mean values and the standard deviations of AOD and AE; and the skewness and the median of the frequency distributions. The percentages of realizations with AOD < 0.05, 0.1, 0.2, and 0.3 and AE < 0.8 and 1.4 are shown in Table 2.
The mean values of AOD440 and AOD500 for the period 2020–2021 were 0.18 ± 0.09 and 0.15 ± 0.08, respectively, while the mean AE440/870 and AE380/500 were 1.41 ± 0.32 and 1.29 ± 0.31. The corresponding means for the period 2021–2022 were 0.22 ± 0.12 and 0.18 ± 0.11 along with 1.48 ± 0.37 and 1.34 ± 0.27. The means for the overall two-year period 2020–2022 were 0.20 ± 0.11 and 0.17 ± 0.10 along with 1.45 ± 0.35 and 1.32 ± 0.29, respectively.
It is interesting to note, for instance, that the AOD440 and AE440/870 mean values obtained over Sofia were near the average AERONET AOD440 = 0.22 ± 0.17 and AE440/870 = 1.42 ± 0.29 values obtained in the period 2002–2019 over Minsk (Belarus) [56].
The relative frequencies of events with AOD440 < 0.2 and AE440/870 > 1.4 were 50–70% and 60–70% (Table 2), respectively, which suggests that the prevalent aerosol situations over Sofia are characterized mainly by fine-fraction particles and relatively low atmospheric turbidity.
The lower mean value of AOD during 2020 compared to 2021 gives rise to questions about how the COVID-19 lockdown affected the atmospheric aerosol load and air quality. The COVID-19 lockdown in Bulgaria lasted from 13 March to 13 May 2020, ending about a week following the beginning of the AERONET activities at the Sofia Site. According to Copernicus Atmosphere Monitoring Service (CAMS) [96], a large dust intrusion in the period 26–29 March 2020 disturbed the effect of the lockdown emission reduction on the average mass concentration of particulate matter with an aerodynamic diameter of less than 10 µm (PM10) in Sofia. Moreover, intense Saharan dust intrusions took place in May 2020 [97]. Thus, there may have been some aftereffect of the lockdown, but it is difficult to estimate its duration. Judging by the seasonal and monthly averages of AOD (Figure 4), it can be assumed that the aftereffects, if any, lasted until autumn. On the other hand, in the summer of 2021, there were intense wildfire activity and SD intrusions, so it is difficult to unambiguously determine the cause of the lower AOD in the summer of 2020.

3.2. Aerosol Typology

The type of aerosol particles and situations can be estimated using passive (photometric) or active (lidar) optical remote sensing approaches providing information about some specific optical and microphysical aerosol characteristics (see Section 2.3). The estimation is based on empirically found correspondences between the aerosol types and their characteristic parameters [27,28,29,32,33,34,76]. Such correspondences have been established by long-term aerosol remote sensing at sites with different climates and geographies under known aerosol environments [27,28,32,34,73,74,75]. One may also conduct remote sensing and contact probing in parallel accompanied by laboratory investigations of the aerosol species [98,99,100]. The aerosol identification would be more reliable, in principle, when based on a wider set of parameters and prognostic models (Section 2.3). At the beginning of the process of recognition, however, it would be useful to use a minimum number of appropriate parameters ensuring a reasonable initial orientation in the analysis. AOD and AE are two such parameters, and we shall use them below in the process of deciphering the aerosol situations over Sofia.

3.2.1. AOD–AE Scatter Plots

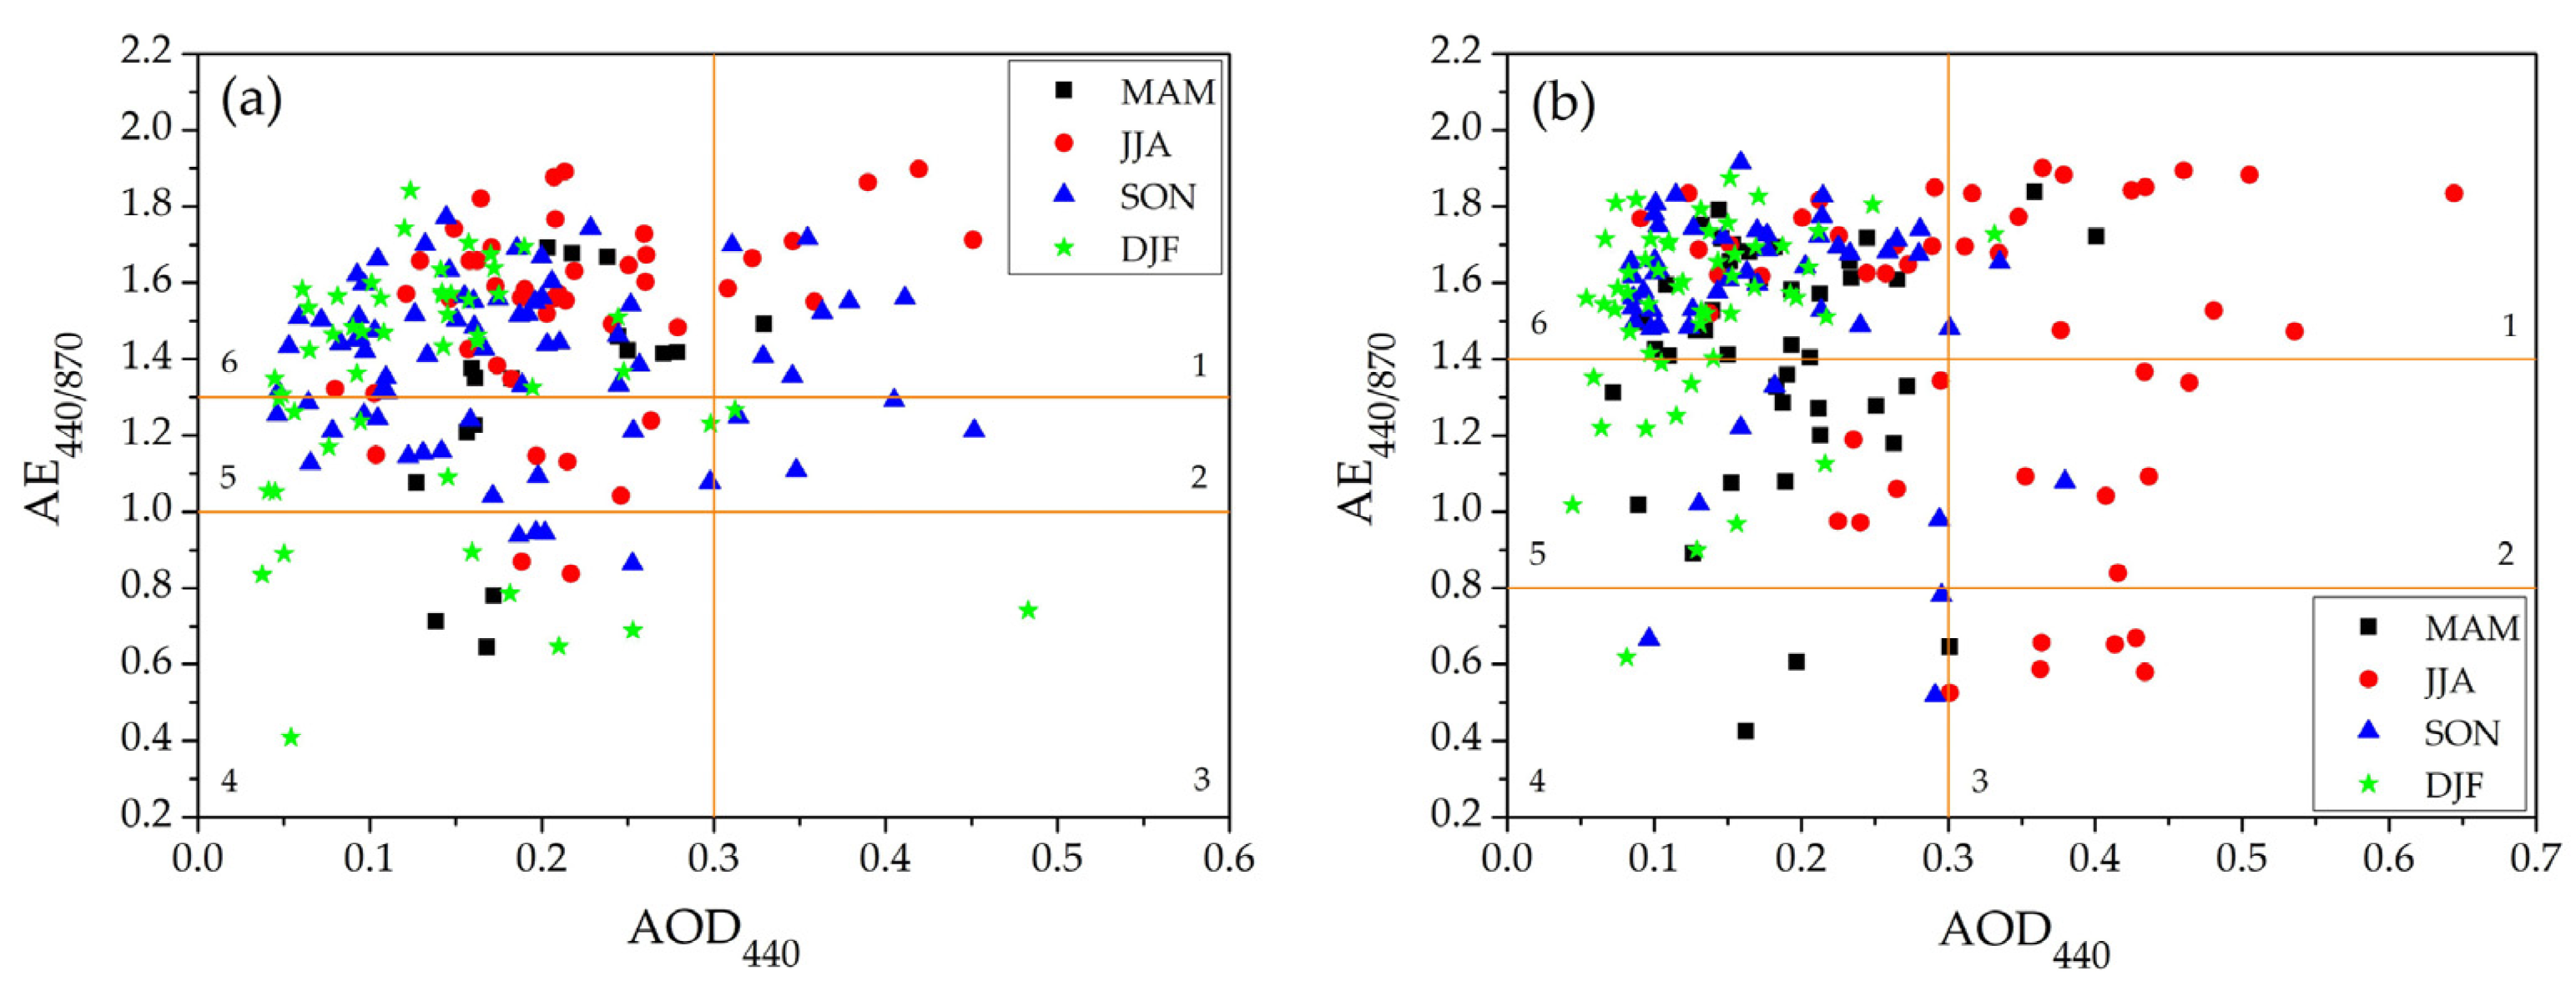
The daily averaged pairs of AOD440 and AE440/870 during the annual cycles 2020–2021 and 2021–2022 are presented as scatter plots in Figure 7a,b, respectively. The days belonging to different seasons are denoted by different signs and colors. One may distinguish on the scatter plots six characteristic areas (zones) separated naturally by boundary bands (not sharp borders) of no events or lower-density events. The different zones are outlined by horizontal and vertical orange lines and numbered clockwise from one to six, beginning from the upper right-hand corner of the plots. These characteristic zones are in fact a projection of the 3×2 modal structures of the AOD440/AE440/870 frequency distributions (Section 3.1.2). Their boundaries for the annual cycle 2020–2021 are: AOD440 > 0.3, AE440/870 > 1.3; AOD440 > 0.3, 1.0 < AE440/870 < 1.3; AOD440 > 0.3, AE440/870 < 1.0; AOD440 < 0.3, AE440/870 < 1.0; AOD440 < 0.3, 1.0 < AE440/870 < 1.3; and AOD440 < 0.3, AE440/870 > 1.3. For the annual cycle 2021–2022, the zone boundaries are: AOD440 > 0.3, AE440/870 > 1.4; AOD440 > 0.3, 0.8 < AE440/870 < 1.4; AOD440 > 0.3, AE440/870 < 0.8; AOD440 < 0.3, AE440/870 < 0.8; AOD440 < 0.3, 0.8 < AE440/870 < 1.4; and AOD440 < 0.3, AE440/870 > 1.4. The percentages of days (aerosol events) falling within the boundaries of each zone are, respectively, 8.3%, 2.8%, 0.6%, 8.8%, 16.0%, and 63.5%, during the cycle 2020–2021, and 9.9%, 3.6%, 3.6%, 3.1%, 16.6%, and 63.2% during the cycle 2021–2022. The corresponding percentages concerning the overall two-year cycle 2020–2022 are: 9.1%, 3.2%, 2.1%, 5.9%, 16.3%, and 63.4%.
The lines we traced indicate the approximate positions of the boundary bands and may serve as classification thresholds when they distinguish groups of events of different types. Such a grouping allows at least for a more consistent and clear analysis and characterization of the aerosol events based on comparing their optical and microphysical characteristics and behavior with known such characteristics and behavior, previously established experimentally under different aerosol conditions using active and passive remote sensing and contact (in situ) probing approaches (Section 3.2, introductory paragraph).
Studying the aerosol properties group by group revealed the specificity of the aerosol events within the different AOD440–AE440/870 groups (zones). Thus, we found one zone of biomass-burning aerosols (zone one), another zone of urban aerosols (zone six), two zones (three and four) of Saharan dust events, and possibly marine aerosols for AOD440 < 0.10–0.15 in zone four. The last two zones (two and five, with 0.8–1.0 < AE440/870 < 1.3–1.4) turned out to pertain to situations of mixed aerosols, where the AOD of the fine aerosol fraction exceeds that of the coarse fraction, but the major mode of the volume size distribution is that of the coarse fraction.
In general, the aerosol characterization procedure employed in the present work is similar to that used and briefly described in [31]. The locations of the different specific AOD440–AE440/870 aerosol zones in [31,56,77] are near the locations of the corresponding zones outlined in this work, with the exception of the marine aerosols that are practically missing over Sofia. There is also a correspondence between the location of similar events on the scatter plots in the present work and in [29].
A general view on the scatter plots shows that the cases with AOD440 > 0.3 or AE440/870 < 1.0 (Figure 7a) or 0.8 (Figure 7b) are sparsely populated. The occurrences of these cases in the first and the second annual cycles are about 11.7% and 17.1% for AOD440 > 0.3 and 9.4% and 6.7% for AE440/870 < 1.0 or 0.8, respectively. This means that biomass-burning aerosols (zone one), Saharan dust intrusions (zones three and four), and marine aerosols (zone four [29,31,56,77]) have not been frequent aerosol events over Sofia. The typical zone of marine aerosols with AOD440 < 0.15 and AE440/870 < 1.0 [29,31] is almost empty. The most densely populated zone six involves almost evenly all seasons. It should characterize continental and anthropogenic urban aerosols, including aerosol pollutants. It is seen as well that zone one is occupied mainly by events occurring in summer and autumn—the seasons of fire activity. Another interesting conclusion is that the cases of a clear atmosphere with AOD440 < 0.1 and 0.05 occur mostly in winter and autumn—the seasons of snowfalls and rainfalls. The meteorological parameters on the days considered in the work (Section 3.2.2 below) are presented in Table 3.

3.2.2. Aerosol Situations

Biomass-Burning Aerosols

Biomass-burning smoke in the air over the Balkan Peninsula is a seasonal phenomenon occurring mainly in the summer and early autumn, when the wildfire activity is most intensive. The main sources of smoke over Sofia are fires in Bulgaria and neighboring countries [78] producing smoke of a similar age and type of combustion material under similar weather conditions. The trans-boundary aerosols from distant regions would differ in combustion material, age, and density. In general, the microphysical and optical properties of the biomass-burning smoke depend on various factors, such as the geographic location of the fire, the combustion material and its moisture, the type of combustion (more or less intense flaming or smoldering), the ambient temperature and humidity, the smoke age, etc. [27,28,73,74]. The smoke particles increase the atmospheric turbidity and the fine aerosol fraction. Correspondingly, AOD440 and AE440/870 increase and are usually well above 0.3 and 1.4 [28], respectively, for fresh aerosols produced minutes to hours before. Thus, during the days with AOD440–AE440/870 pairs falling within the boundaries of zone one (Figure 7a,b), the air over Sofia City must have contained biomass-burning smoke particles. Some increase of the aerosol sizes may have taken place as a result of smoldering-type combustion or ageing accompanied by particle coagulation, condensation, etc. This could lower AE440/870 down to values of about 1.2–1.4 [28,74]. The presence is also possible of small amounts of larger-in-size desert dust particles with a lower AE440/870. The desert dust particles would also lead to lowering the particle sphericity factor [101,102,103], thus increasing the linear depolarization effect [104] of the aerosol ensembles. In the case of a strong prevalence of fine-mode smoke particles, the single-scattering aerosol albedo should diminish with the wavelength λ as a consequence of the rapidly decreasing light scattering as compared with absorption. The values of SSA are smaller for a higher elemental (black)-carbon content and the related absorption [98,99]. Note as well that the biomass-burning aerosol particles should have a spherical shape [28,33].
As is shown by using additional AERONET data and supported by HYSPLIT and BSC-DREAM8b models predictions, almost all daily mean aerosol situations falling within zone one (Figure 7a,b) exhibit similar (above-described) peculiarities of their characteristics that are intrinsic to biomass-burning aerosol ensembles. Such peculiarities, concerning 23 August 2021, are illustrated in Figure 8 and Table 4. Table 4 contains information on the daily mean aerosol optical depth and Ångström exponent, and on the range of the particle sphericity factor, linear depolarization ratio, and real part of the refractive index, during the specific days considered. It is seen there that AODf500 is 28 times larger than AODc500; i.e., the optical impact of the fine aerosol fraction is strongly prevailing, which is in accordance with the VSD shape plotted in Figure 8a. AOD440 = 0.36, and AE440/870 = 1.90 (Table 4). The real part of the refractive index at λ = 440 nm (nr440) varies from 1.40 to 1.57, and the SSA decreases with λ (Figure 8b) as that of biomass-burning aerosols, as described in [28]. The SF varies from 91.7% to 99.0%, being most frequently near 99.0%, and the DR at λ = 440 nm (DR440) varies from 0.002 to 0.005. The 120-h back trajectories revealed by the HYSPLIT model arriving over Sofia at 12:00 UTC at heights of 500 m, 1500 m, and 3000 m above ground level (AGL) are shown in Figure 8c. The air mass arriving at a height of 3000 m begins in the Atlantic Region and reaches Bulgaria after traveling over continental Europe. It should contain mainly continental and urban aerosols because most of the Atlantic marine particles would have sedimented during the long travel to Bulgaria. The BSC-DREAM8b model does not predict Saharan dust intrusions over Sofia at 12:00 UTC (Figure 8d). A three-day map of the fires within Bulgaria and adjacent regions obtained via NASA’s FIRMS [78] for the period 21–23 August 2021 is shown in Figure 9a. Strong fire activity is seen in northwestern Bulgaria and near Sofia.
The biomass-burning aerosols over Sofia with AE440/870~1.6–1.9 and above should be the result of wildfires within Bulgaria and the neighboring countries. The aerosol ensembles with AE440/870 < 1.6 may be aged (of trans-boundary origin) and due to smoldering combustion or containing desert dust or/and marine aerosols.
Such a situation occurred on 14 September 2020, when the mean AE440/870 = 1.52, AOD440 = 0.36, and the SSA decreased with λ; however, AODf500 is only four times larger than AODc500, the SF varies from low (0.6%) to moderate (67.2%) values, and the DR440 varies from 0.022 to 0.133 (Table 4). The BSC-DREAM8b model predicts the presence of an SD layer at an altitude of about 4500 m with a maximum concentration of 10 µg/m3. At the same time, according to the HYSPLIT back-trajectories model, the trans-boundary air masses that arrived over Sofia had mainly followed trajectories over Europe, Turkey, and Egypt. Intensive fire activity in northern and central Bulgaria and adjacent regions in the period 12–14 September 2020 was observed (Figure 9b). Thus, the aerosol load over Sofia on 14 September 2020 could have contained a mixture of biomass-burning, Saharan dust, and marine aerosols. Another interesting example is the situation on 25 August 2021, when active fires in the period 23–25 August 2021 concentrated mainly in the western part of the country were seen (Figure 9c), and all aerosol characteristics but one indicate the presence of biomass-burning smoke (Table 4). The exception is the SSA that was too high and slowly varying—from nearly 0.99 at λ = 440 nm to nearly 0.98 at λ = 1020 nm. This is, perhaps, a rare case of a low content (<2%) of elemental carbon in the smoke particles [99].
Insofar as most of the aerosol events with AOD440–AE440/870 pairs within zone one on the scatter plots in Figure 7a,b have features of biomass-burning aerosol situations, one may approximately assume that the relative occurrence of such situations is 9.1% (see Section 3.2.1).

Saharan Dust Intrusions

Desert dust masses in the atmosphere over the Balkan Peninsula and, in particular, Sofia may be coming from the Near East and, most likely, from Sahara.
Saharan dust intrusions over Sofia may take place in different seasons. The dust particles increase the atmospheric coarse aerosol fraction, which leads to a lowering of the values of AE440/870 below one (see in [105]). According to the AERONET data available, when the optical influence of the coarse fraction is at least twice as large as that of the fine fraction (2AODf500 < AODc500), the daily mean values of AE440/870 are below 0.6–0.7. The daily mean values of AOD440 may be different, from 0.10–0.15 to 0.50 and above, depending on the intensity of the dust intrusions (see in [28,29,105], and Figure 7a,b). Thus, the AOD440–AE440/870 pairs characterizing Saharan dust events should be falling within zones three and four in Figure 7, and the SSA should increase with λ [28] because of the faster decrease of the particle absorption compared to the scattering. Passing through a maximum is also possible as a result of the competition between absorption and scattering [59]. The particles SF should be low at a noticeable DR.
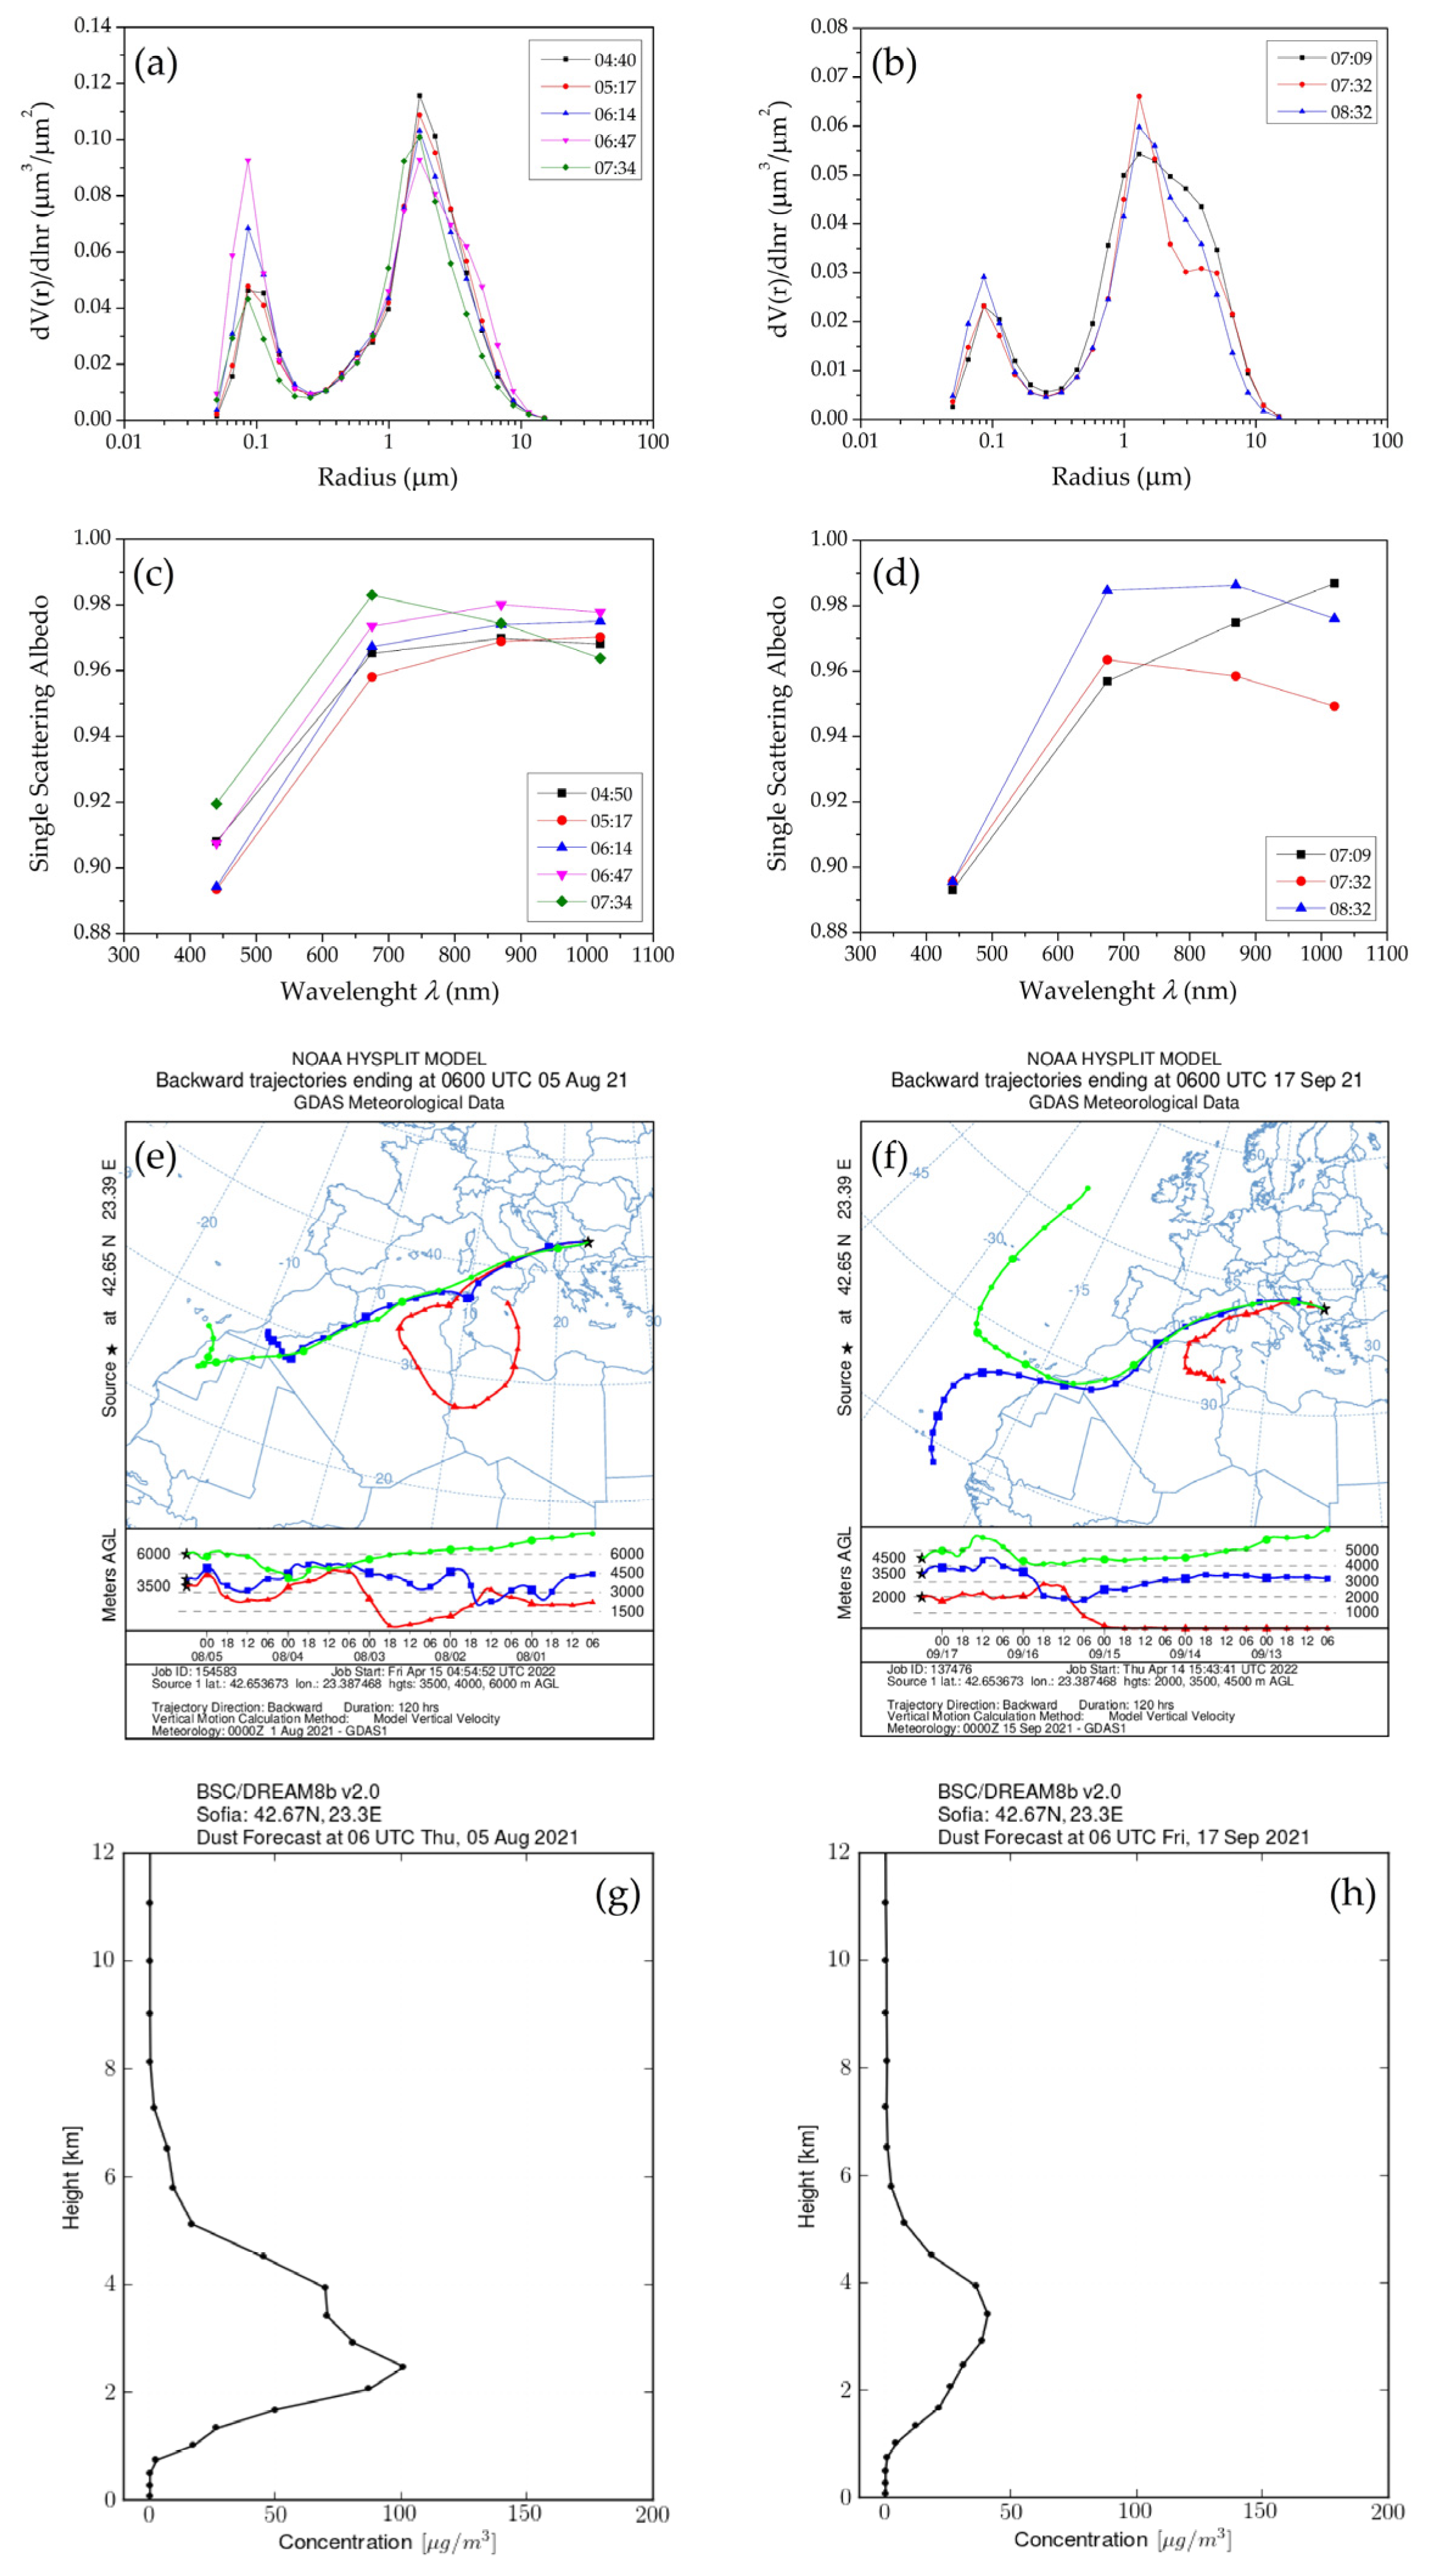
As examples, we will consider the SD situations occurring on 5 August 2021 and 17 September 2021. They are characterized, respectively, by daily mean values of AOD440 = 0.43 and 0.29, AE440/870 = 0.67 and 0.52, AODf500 = 0.17 and 0.10, and AODc500 = 0.22 and 0.17; the SFs vary, respectively, from 1.0% to 4.4% and from 0.4% to 21.7%, and DRs440 from 0.091 to 0.139 and from 0.107 to 0.141 (Table 4). It is seen in Figure 10a,b that the corresponding VSD shapes reflect the relations between AODf500 and AODc500. The SSAs increase with λ or pass through maxima during different daily periods (Figure 10c,d). The 120-h HYSPLIT back trajectories arriving over Sofia at 06:00 UTC at heights of 3500 m, 4000 m, and 6000 m AGL on 5 August 2021 (Figure 10e) and at 2000 m, 3500 m, and 4500 m AGL on 17 September 2021 (Figure 10f) indicated air masses coming from North Africa, and the BSC-DREAM8b model predicted Saharan dust intrusions over Sofia at 06:00 UTC on these dates at heights up to 7 km (Figure 10g,h).
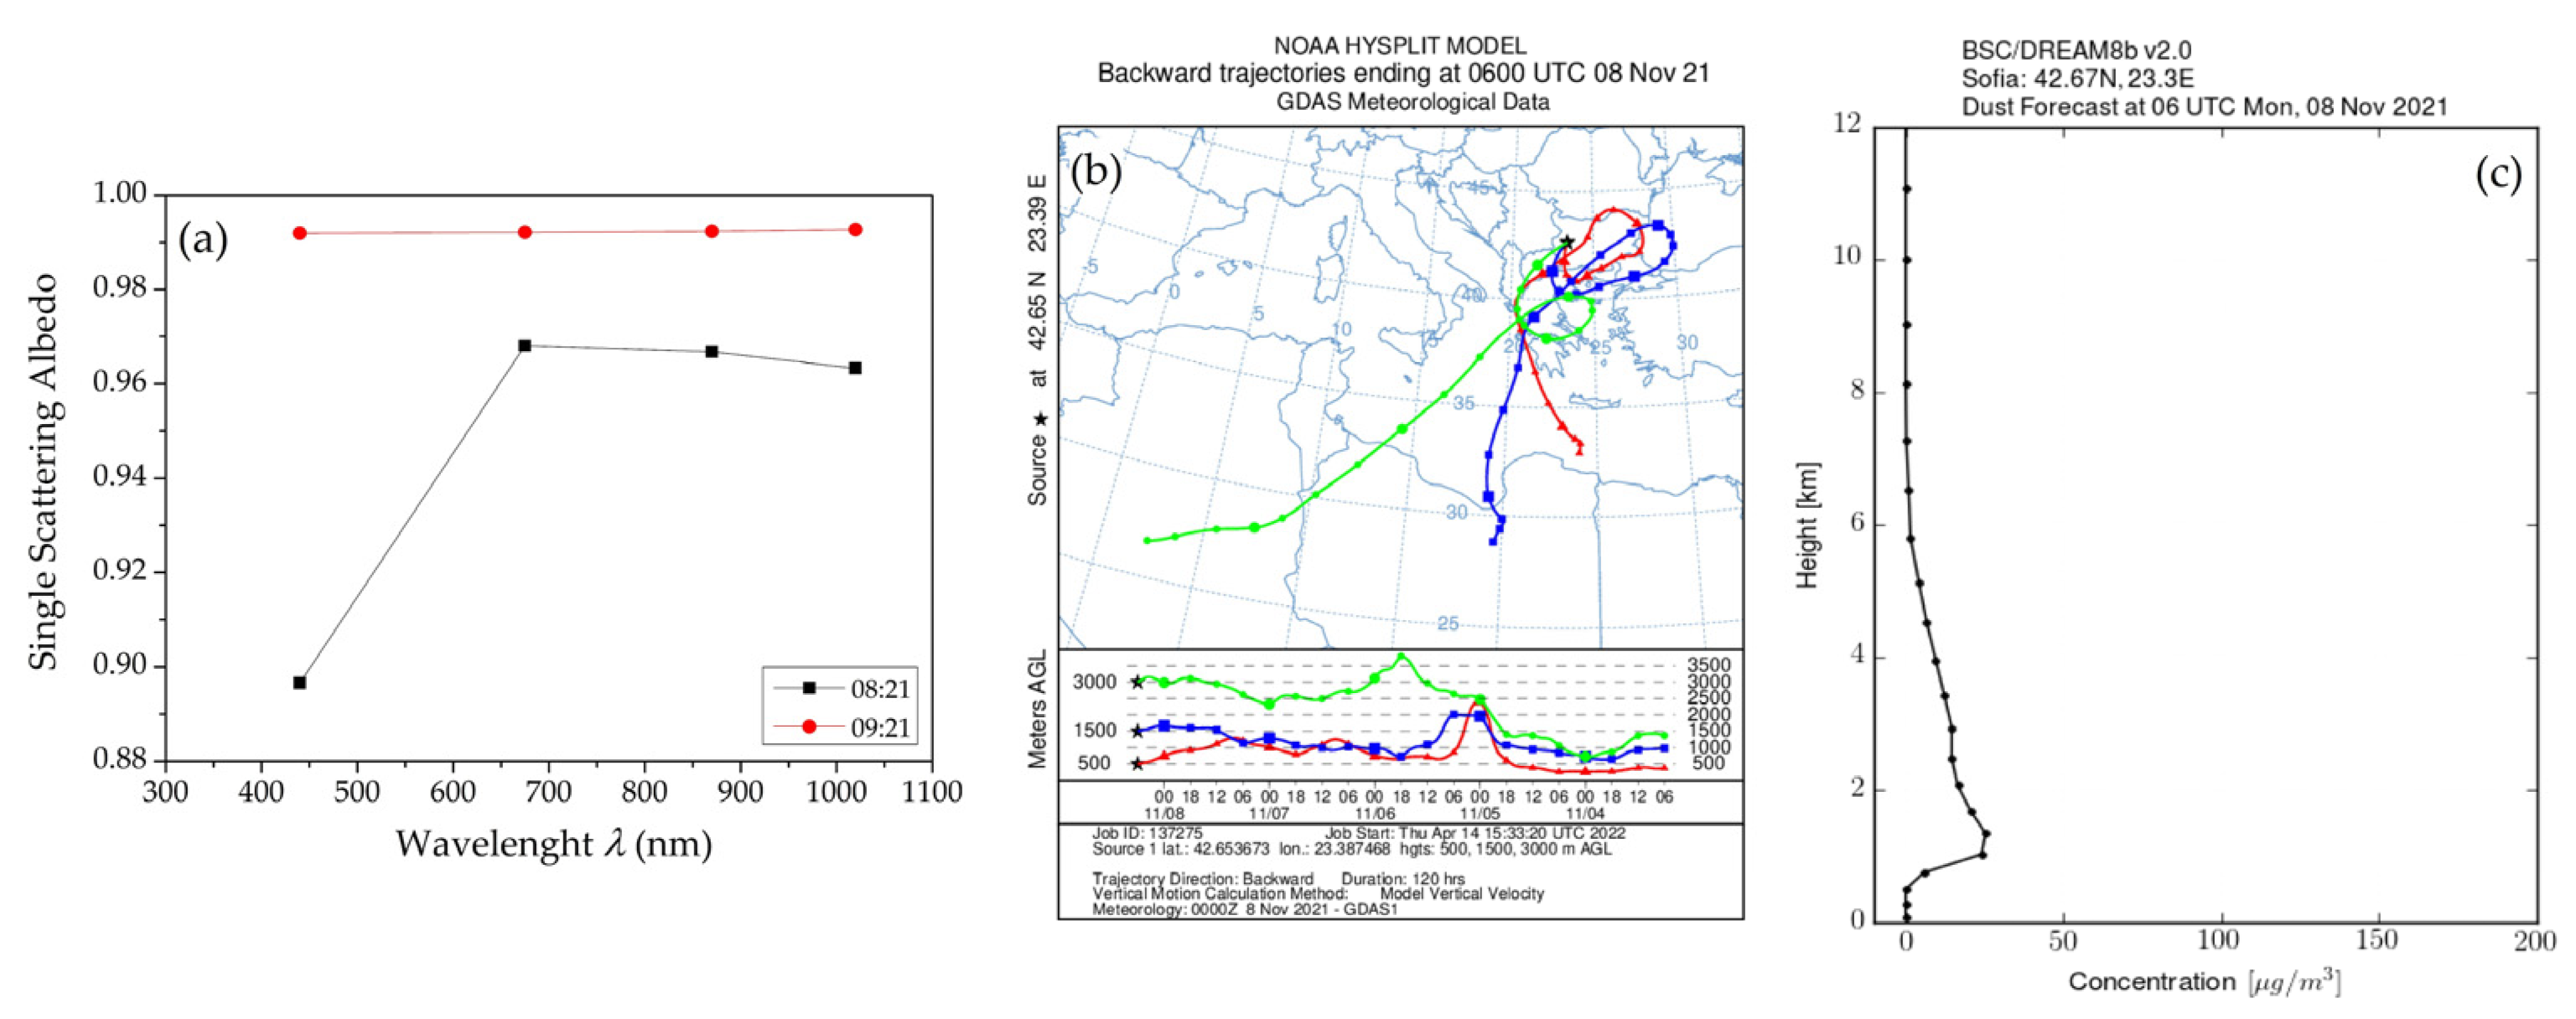
An interesting example is the situation on 8 November 2021, when one can notice alternating passages of Saharan dust and marine aerosols over the site. At 08:21 UTC, the SSA depended on λ as in the case of a Saharan dust passage (Figure 11a); in this case, SF = 5.9% and DR440 = 0.148. One hour later however, at 09:21 UTC, SSA was near unity and was constant, as in a case of marine aerosols passing over the site. However, SF = 99% and DR440 = 0.002. Other optical and microphysical characteristics are given in Table 4. The HYSPLIT and BSC-DREAM8b models predictions for Sofia at 06:00 UTC are presented in Figure 11b,c showing the transport of air masses from Algeria and Libya across the Mediterranean Sea and Saharan dust layers up to about 6 km, respectively. The routes of the 120-h HYSPLIT back trajectories at the same heights of 500 m, 1500 m, and 3000 m at 09:00 UTC (not shown here) do not differ significantly from that at 06:00 UTC, but the question remains about the high SF and low DR of the particles at 09:21 UTC.
As another confirmation of Saharan dust events occurring in Sofia on 5 August, 17 September, and 8 November 2021, one may consider the results on the PM10 mass concentration obtained during these days by one of the automated measuring stations (AMS) of the Bulgarian National Automated System for Environmental Monitoring [106], namely, Kopitoto AMS. The station is located on Vitosha Mountain, 1321 m ASL, and is classified as an elevated rural reference station for aerosol background measurements, since the data obtained are practically unaffected by local anthropogenic aerosols. For such rural stations, the excessive values measured of the PM10 mass concentration are most frequently an indication of desert dust intrusions [107,108]. The annual mean PM10 value registered by the Kopitoto AMS in 2021 is 14.62 μg/m3 [106]. The daily mean value obtained on 5 August 2021 is 66.61 μg/m3 with a maximum of 115 μg/m3 [106]. Thus, an essential excess was registered of the PM10 mass concentration over the mean annual norm and the daily limit of 50 μg/m3. Similar are the situations on 17 September and 8 November, when, respectively, the daily mean values obtained were 34.51 μg/m3 and 28.65 μg/m3 with maxima of 42.73 μg/m3 and 40.23 μg/m3 [106]. The ratio PM2.5/PM10 of the daily mean PM2.5 (PM with diameter < 2.5 µm) and PM10 mass concentrations should also be considered to characterize the dust contribution to the registered PM10 daily levels during the Saharan dust events [109,110]. When this ratio is well below its monthly mean value, the majority of particles will have diameter above 2.5 µm, characteristic to desert (Saharan) dust. In the Sofia air quality monitoring system [106], only the urban background station Hipodruma measures the PM2.5 concentration. Using data from Hipodruma AMS, we estimated values of the PM2.5/PM10 ratios for August 2021, September 2021, and November 2021, together with their monthly mean values. The corresponding monthly mean ratios obtained are 0.23, 0.26, and 0.30. Deep declines of PM2.5/PM10 ratio took place on 4–8 August 2021, 14–22 September 2021, and 4–10 November 2021 down to values of 0.16, 0.18, and 0.21, respectively. The days discussed here fall into the decline periods that could be taken as an additional confirmation for the presence of SD events.
Since most of the aerosol events of the AOD440–AE440/870 zones three and four on the scatter plots in Figure 7a,b exhibit features of Saharan dust intrusions, an estimate of the probability that such intrusions appear over Sofia City is 8.0% (Section 3.2.1).

Urban Aerosols

Local and trans-boundary natural and anthropogenic urban aerosols (UAs) are always present as a background over Sofia Valley. Their sources are the soil, the industries and urban traffic, the fossil-fuel heating, the dusty roads, etc. Once the operation was terminated of several polluting industrial sites in and near Sofia, the harmful aerosol concentration has dropped considerably, i.e., the air quality has improved. The injection of other aerosol types transported over large distances into the atmosphere over Sofia can lead to the formation of aerosol ensembles of various microphysical and optical properties. The urban aerosols, like the biomass-burning smoke, are characterized by the prevailing optical influence of the fine-aerosol fraction and, correspondingly, by relatively high values of AE440/870—well above 1.2, but smaller in general than in the case of smoke aerosols [28]; the values of AOD440 are also smaller on average. Certainly, the SSA should decrease with the radiation wavelength λ. As is seen in Figure 7, zone six on both scatter plots is the most populated of all zones (63.4%), with aerosol events of all seasons. Therefore, one could assume that it covers the most common and frequent urban-aerosol conditions intrinsic to Sofia Valley, with AOD440 < 0.3 and AE440/870 > 1.3–1.4. According to the AERONET data, the particle sphericity in the aerosol events of zone six is relatively high, but lower than that of biomass-burning smoke particles.
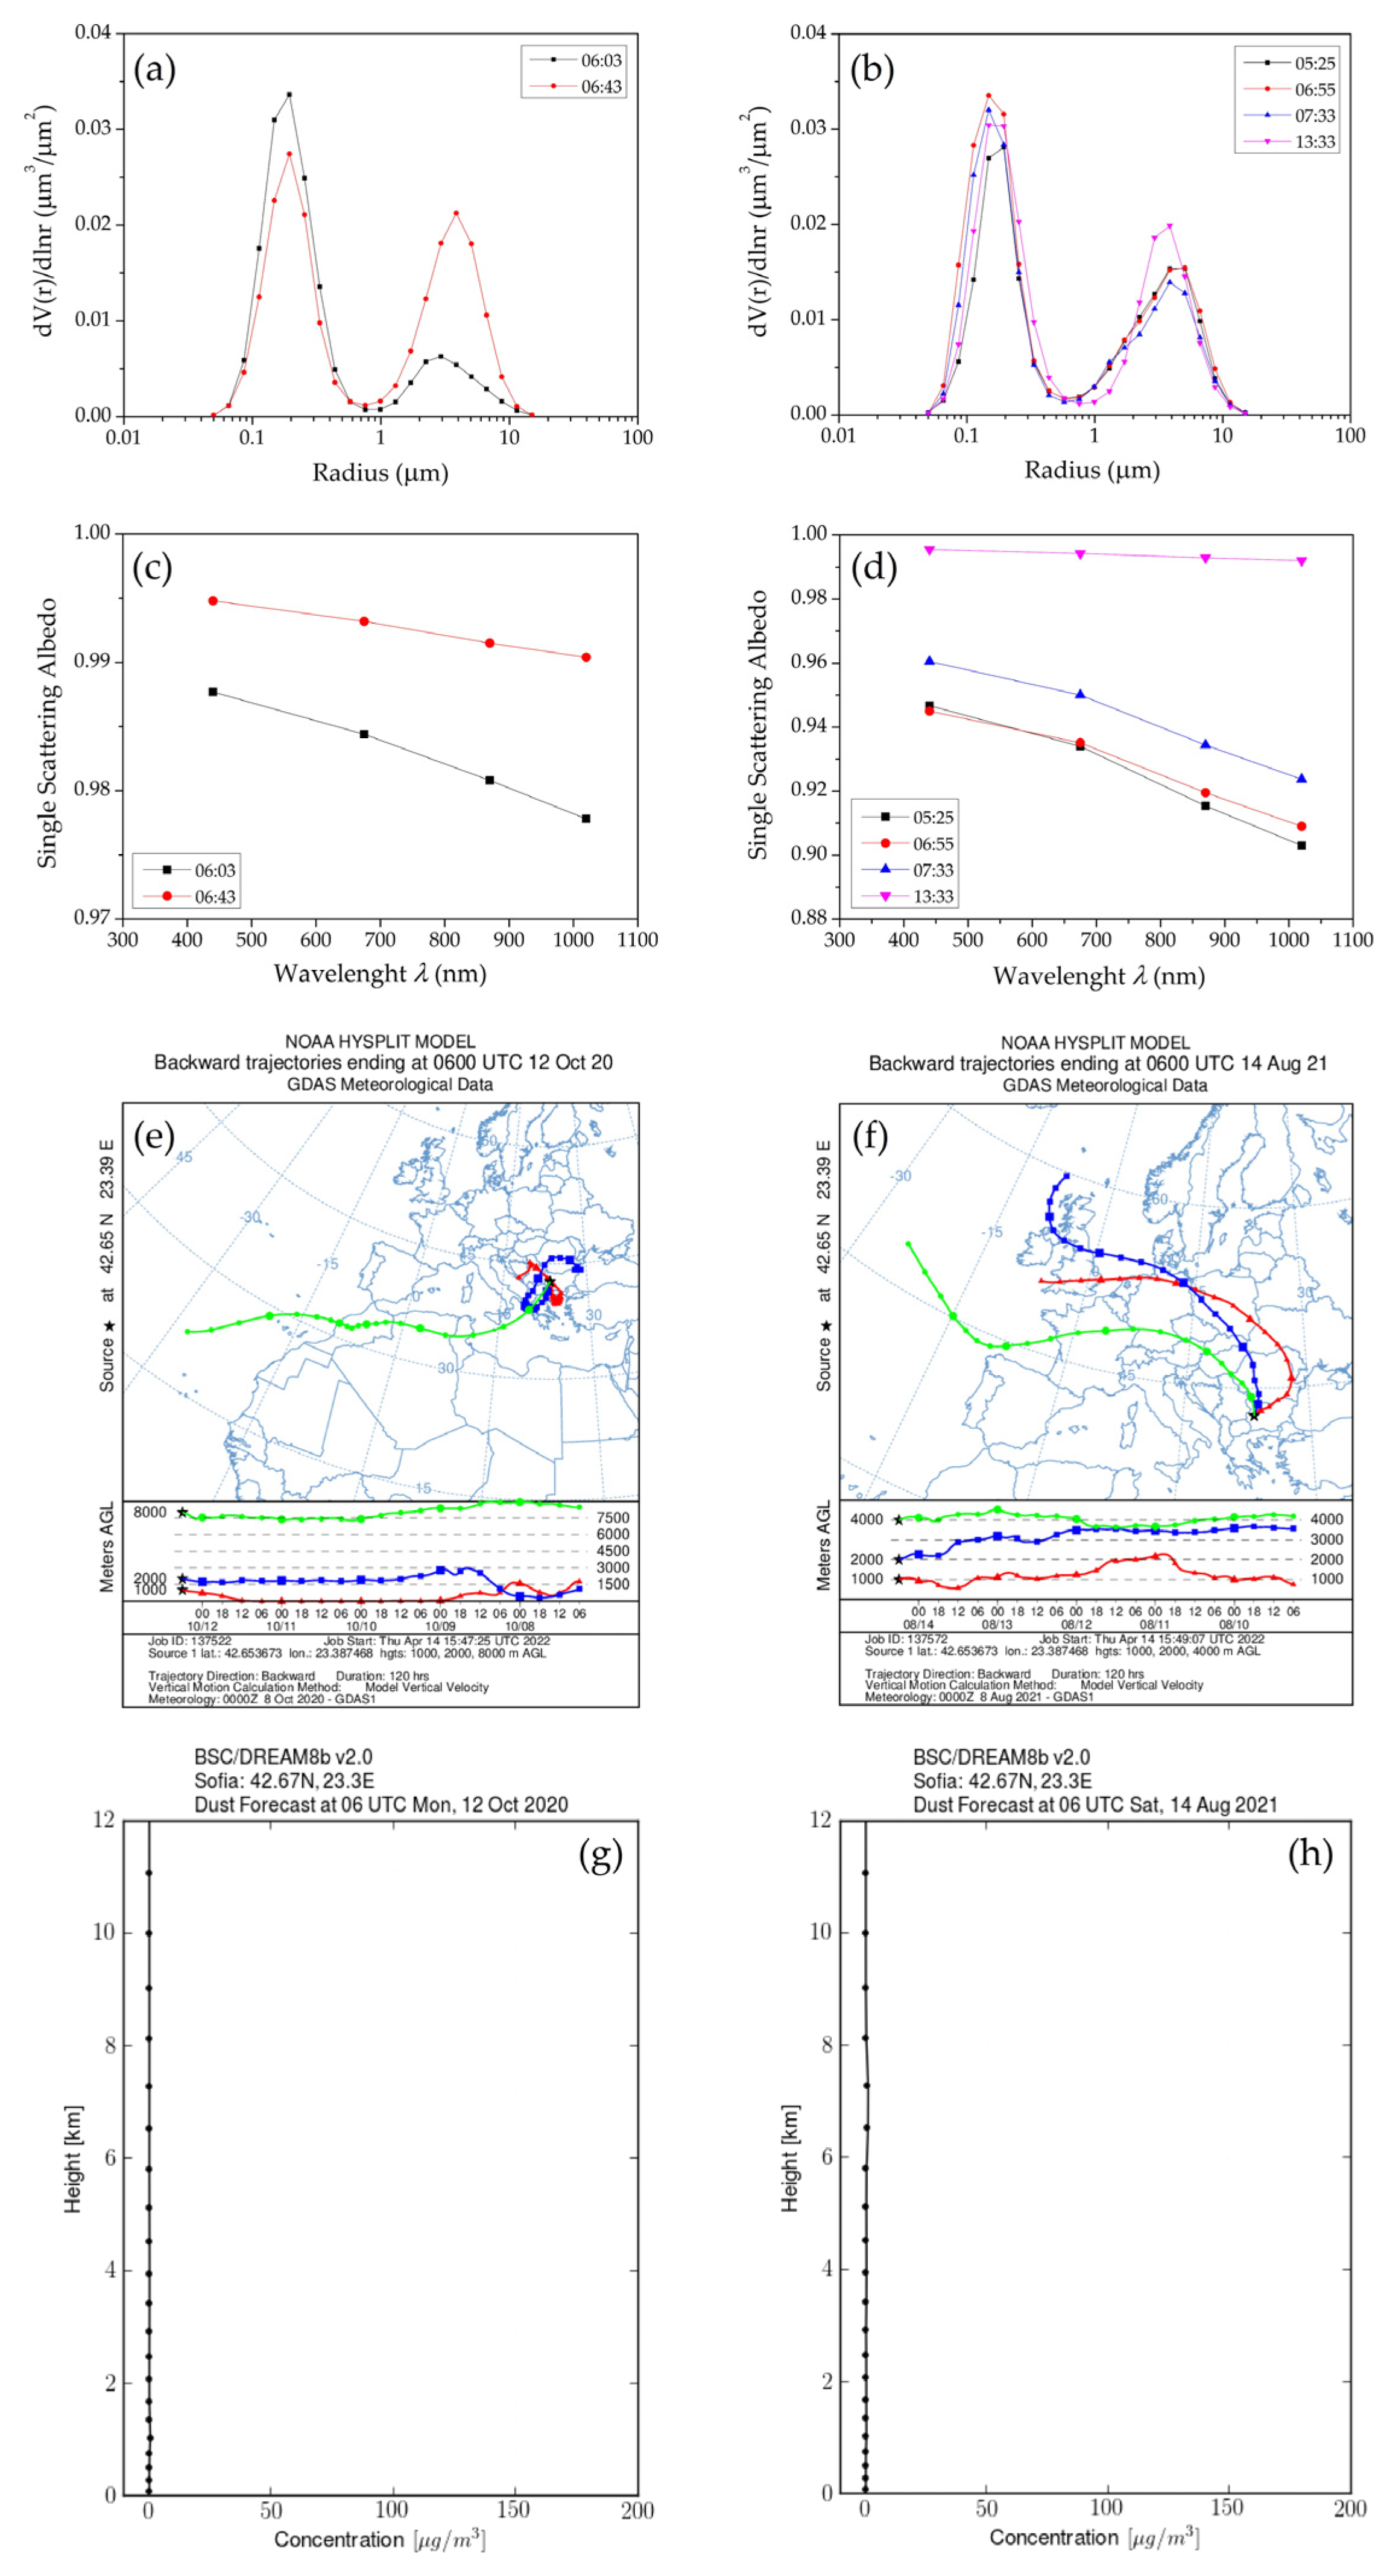
Figure 12 illustrates two UA situations taking place on 12 October 2020 and 14 August 2021. They are characterized, respectively, by daily mean values of AOD440 = 0.23 and 0.29, AE440/870 = 1.74 and 1.85, AODf500 = 0.17 and 0.22, and AODc500 = 0.01 and 0.01. The optical impact of the fine aerosol fractions exceeds essentially the impact of the coarse aerosol fractions (AODf500 >> AODc500). The SFs and DRs440 on 12 October 2020 were 98.6% and 0.002 at 06:03 UTC and 99.0% and 0.002 at 06:43 UTC. On 14 August 2021, they vary from 93.2% and 0.005 to 99.0% and 0.002 (Table 4). The VSD shapes (Figure 12a,b) reflect the relations between AODf500 and AODc500. The SSAs decrease with λ (Figure 12c,d). Some of the 120-h HYSPLIT back trajectories reaching Sofia at 06:00 UTC on 12 October 2020 at heights above 6000 m passed over North Africa at heights of 7000–8000 m (Figure 12e), but the BSC-DREAM8b model does not predict noticeable Saharan dust intrusions over Sofia at 06:00 UTC on this date (Figure 12g). On 14 August 2021, no trajectories are found arriving over Sofia at 06:00 UTC from North Africa (Figure 11f), and BSC-DREAM8b does not predict Saharan dust intrusions at the same time (Figure 12h).
The prevalence of urban aerosol features in the events within the AOD440–AE440/870 zone one in Figure 7a,b allows one to assume that the relative occurrence of urban aerosol situations is approximately 63.4% (Section 3.2.1).

Marine Aerosols

Marine aerosol passages in their pure form are difficult to observe over Sofia because of the remoteness of the city from seas and oceans. During their long travel to Sofia over land, their concentration diminishes, and they would be mixed with other natural and anthropogenic aerosols of higher concentrations. Nevertheless, cases cannot be sometimes excluded of separate bunches of marine aerosols reaching Sofia after surviving their long path to Bulgaria. They then would be directly detectable, but only under the conditions of a clean atmosphere after precipitation. Distinguishing features of them are: low AOD400 (<0.15 [28,29,75]), relatively large particles and AE440/870 < 1.40–1.55 [28], high SSA (>0.97 [28]) decreasing slowly with λ, and relatively low particle sphericity. The presence of marine aerosols in mixed aerosol ensembles would increase the coarse aerosol fraction and decrease the AE and would lower the effective particle sphericity and the light absorption. Especially sensitive in this case would be the mixes of biomass-burning and urban aerosols.

Mixed Aerosols

The aerosol events occupying zones two and five are characterized by medium AE440/870 (between 0.8–1.0 and 1.3–1.4) and comparable (of the same order of magnitude) optical impacts of their fine and coarse aerosol fractions. Therefore, they may be considered as mixes of known key aerosol types containing mainly fine or mainly coarse aerosol particles. Such events with AOD440 > 0.3 can be mixes of biomass-burning aerosols and Saharan dust. When AOD440 < 0.3, one may suppose that they are mixes of Saharan dust or/and marine aerosols and urban aerosols. The mixed aerosols may also be a result of the ageing and aggregation of the fine fraction of the biomass-burning and urban aerosols. The sphericity of the mixed aerosols should be low-to-moderate, while their SSA may have different behavior as a function of λ depending on the microphysical and optical properties of the particles ensembles that determine the competition between light absorption and scattering. An interesting feature of the mixed aerosol ensembles is that, most frequently, the optical impact of their fine fraction exceeds slightly the impact of the coarse fraction (AODf500 > AODc500), albeit the major VSD mode is that of the coarse fraction.
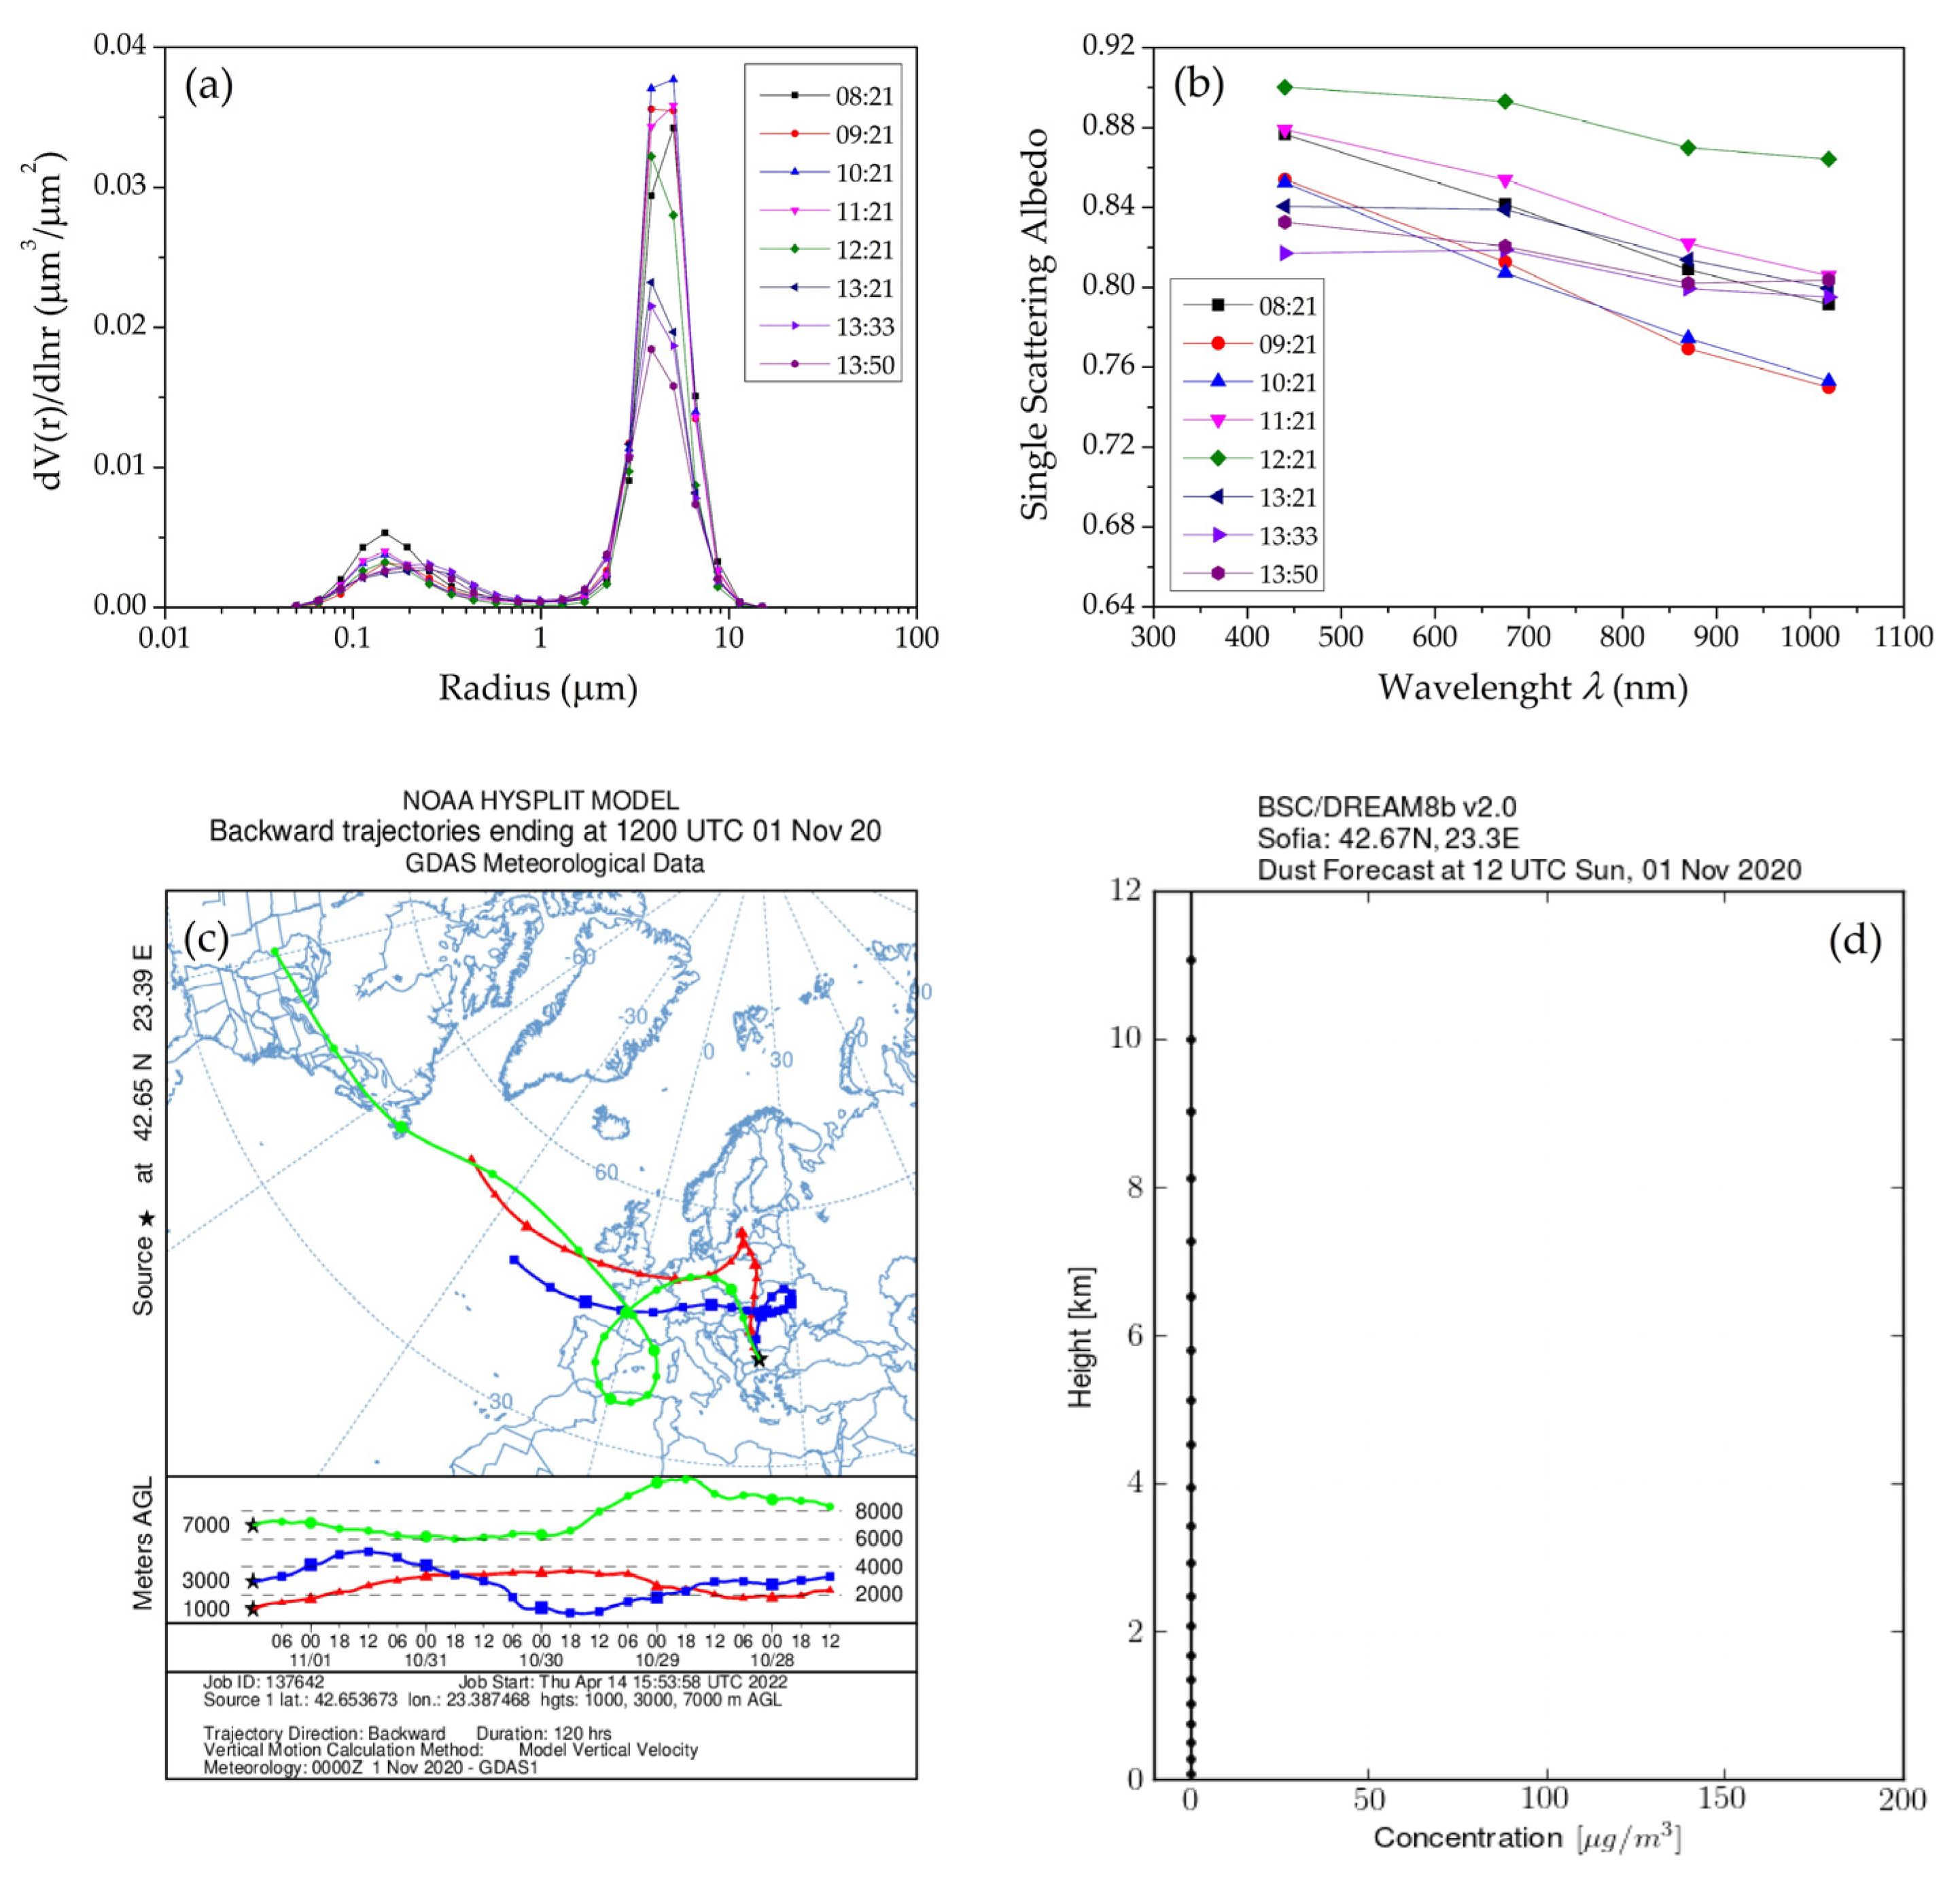
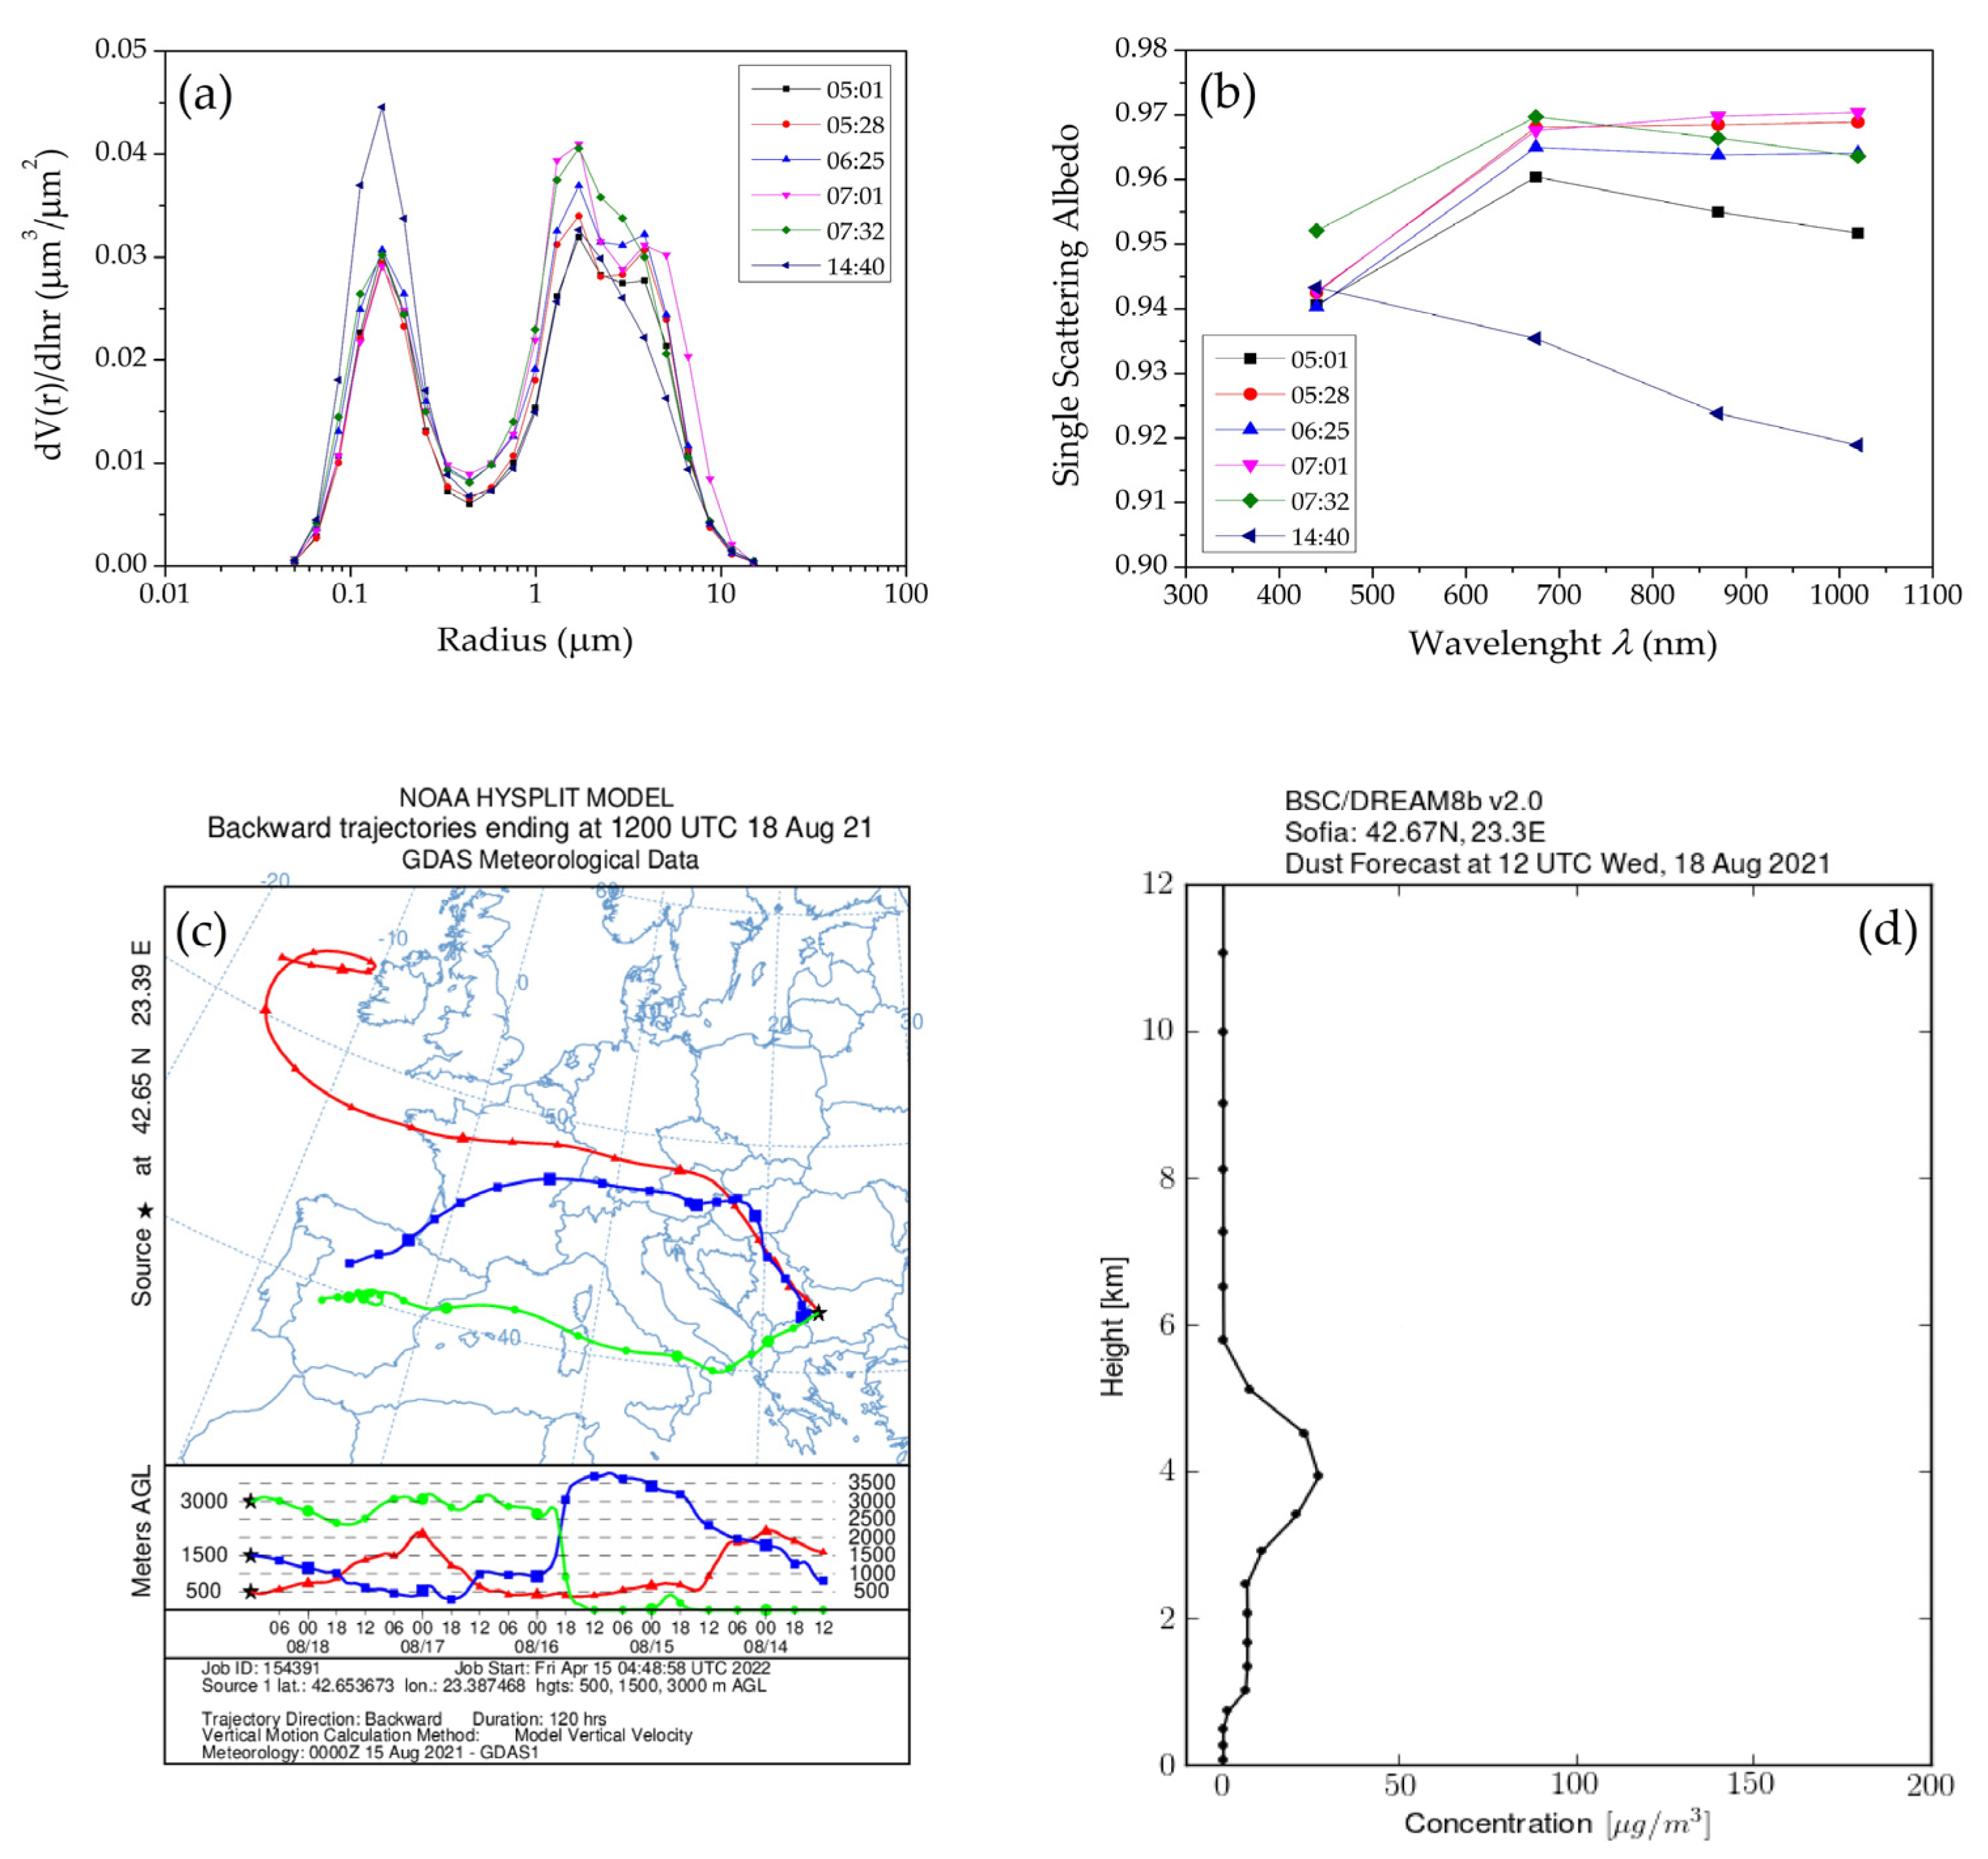
Let us consider, for example, the characteristics of the aerosol field on 1 November 2020 and 18 August 2021 (Table 4). They are, respectively, AOD440= 0.05 and 0.43, AE440/870 = 1.25 and 1.37, AODf500 = 0.03 and 0.27, AODc500 = 0.01 and 0.09, nr440 ~ 1.43–1.58 and 1.51–1.54, SF = 60.3–99.0% and 3.0–20.3%, and DR440 = 0.004–0.033 and 0.104–0.131. On 1 November 2020, although AODf500 > AODc500, the major VSD mode is that of large particles (Figure 13a). The relatively high sphericity of the aerosol ensemble allows one to suppose a prevalent role of the small particles in the interaction with light. Correspondingly, the SSA decreases with λ (Figure 13b). The SSA of the particles varies from 0.9 to below 0.8, which is an indication of the presence of pollutants with high absorptivity. The 120-h HYSPLIT back trajectories arriving over Sofia at 12:00 UTC do not indicate air masses passing near Africa at heights below 7000 m (Figure 13c), and the BSC-DREAM8b model does not predict SD intrusions over Sofia at the same time (Figure 13d). On 18 August 2021, the major VSD mode is again that of the coarse aerosol fraction, in general, while AODf500 > AODc500 (Figure 14a). The particle sphericity is low, and the SSA behaves vs. λ as in the case of an SD intrusion [28] reaching values of 0.97 (Figure 14b). The situation changes at 14:40 UTC, when the SSA starts behaving as in a case of biomass-burning aerosol (Figure 14a,b) [28]; however, the sphericity remains low. The 120-h HYSPLIT back trajectories at heights of 500 m, 1500 m, and 3000 m AGL arriving over Sofia at 12:00 UTC indicate air masses arriving over Europe from the Atlantic Ocean, from Europe, and from the Mediterranean Sea (Figure 14c). At the same time, the BSC-DREAM8b model predicts intensive SD intrusions over Sofia (Figure 14d).
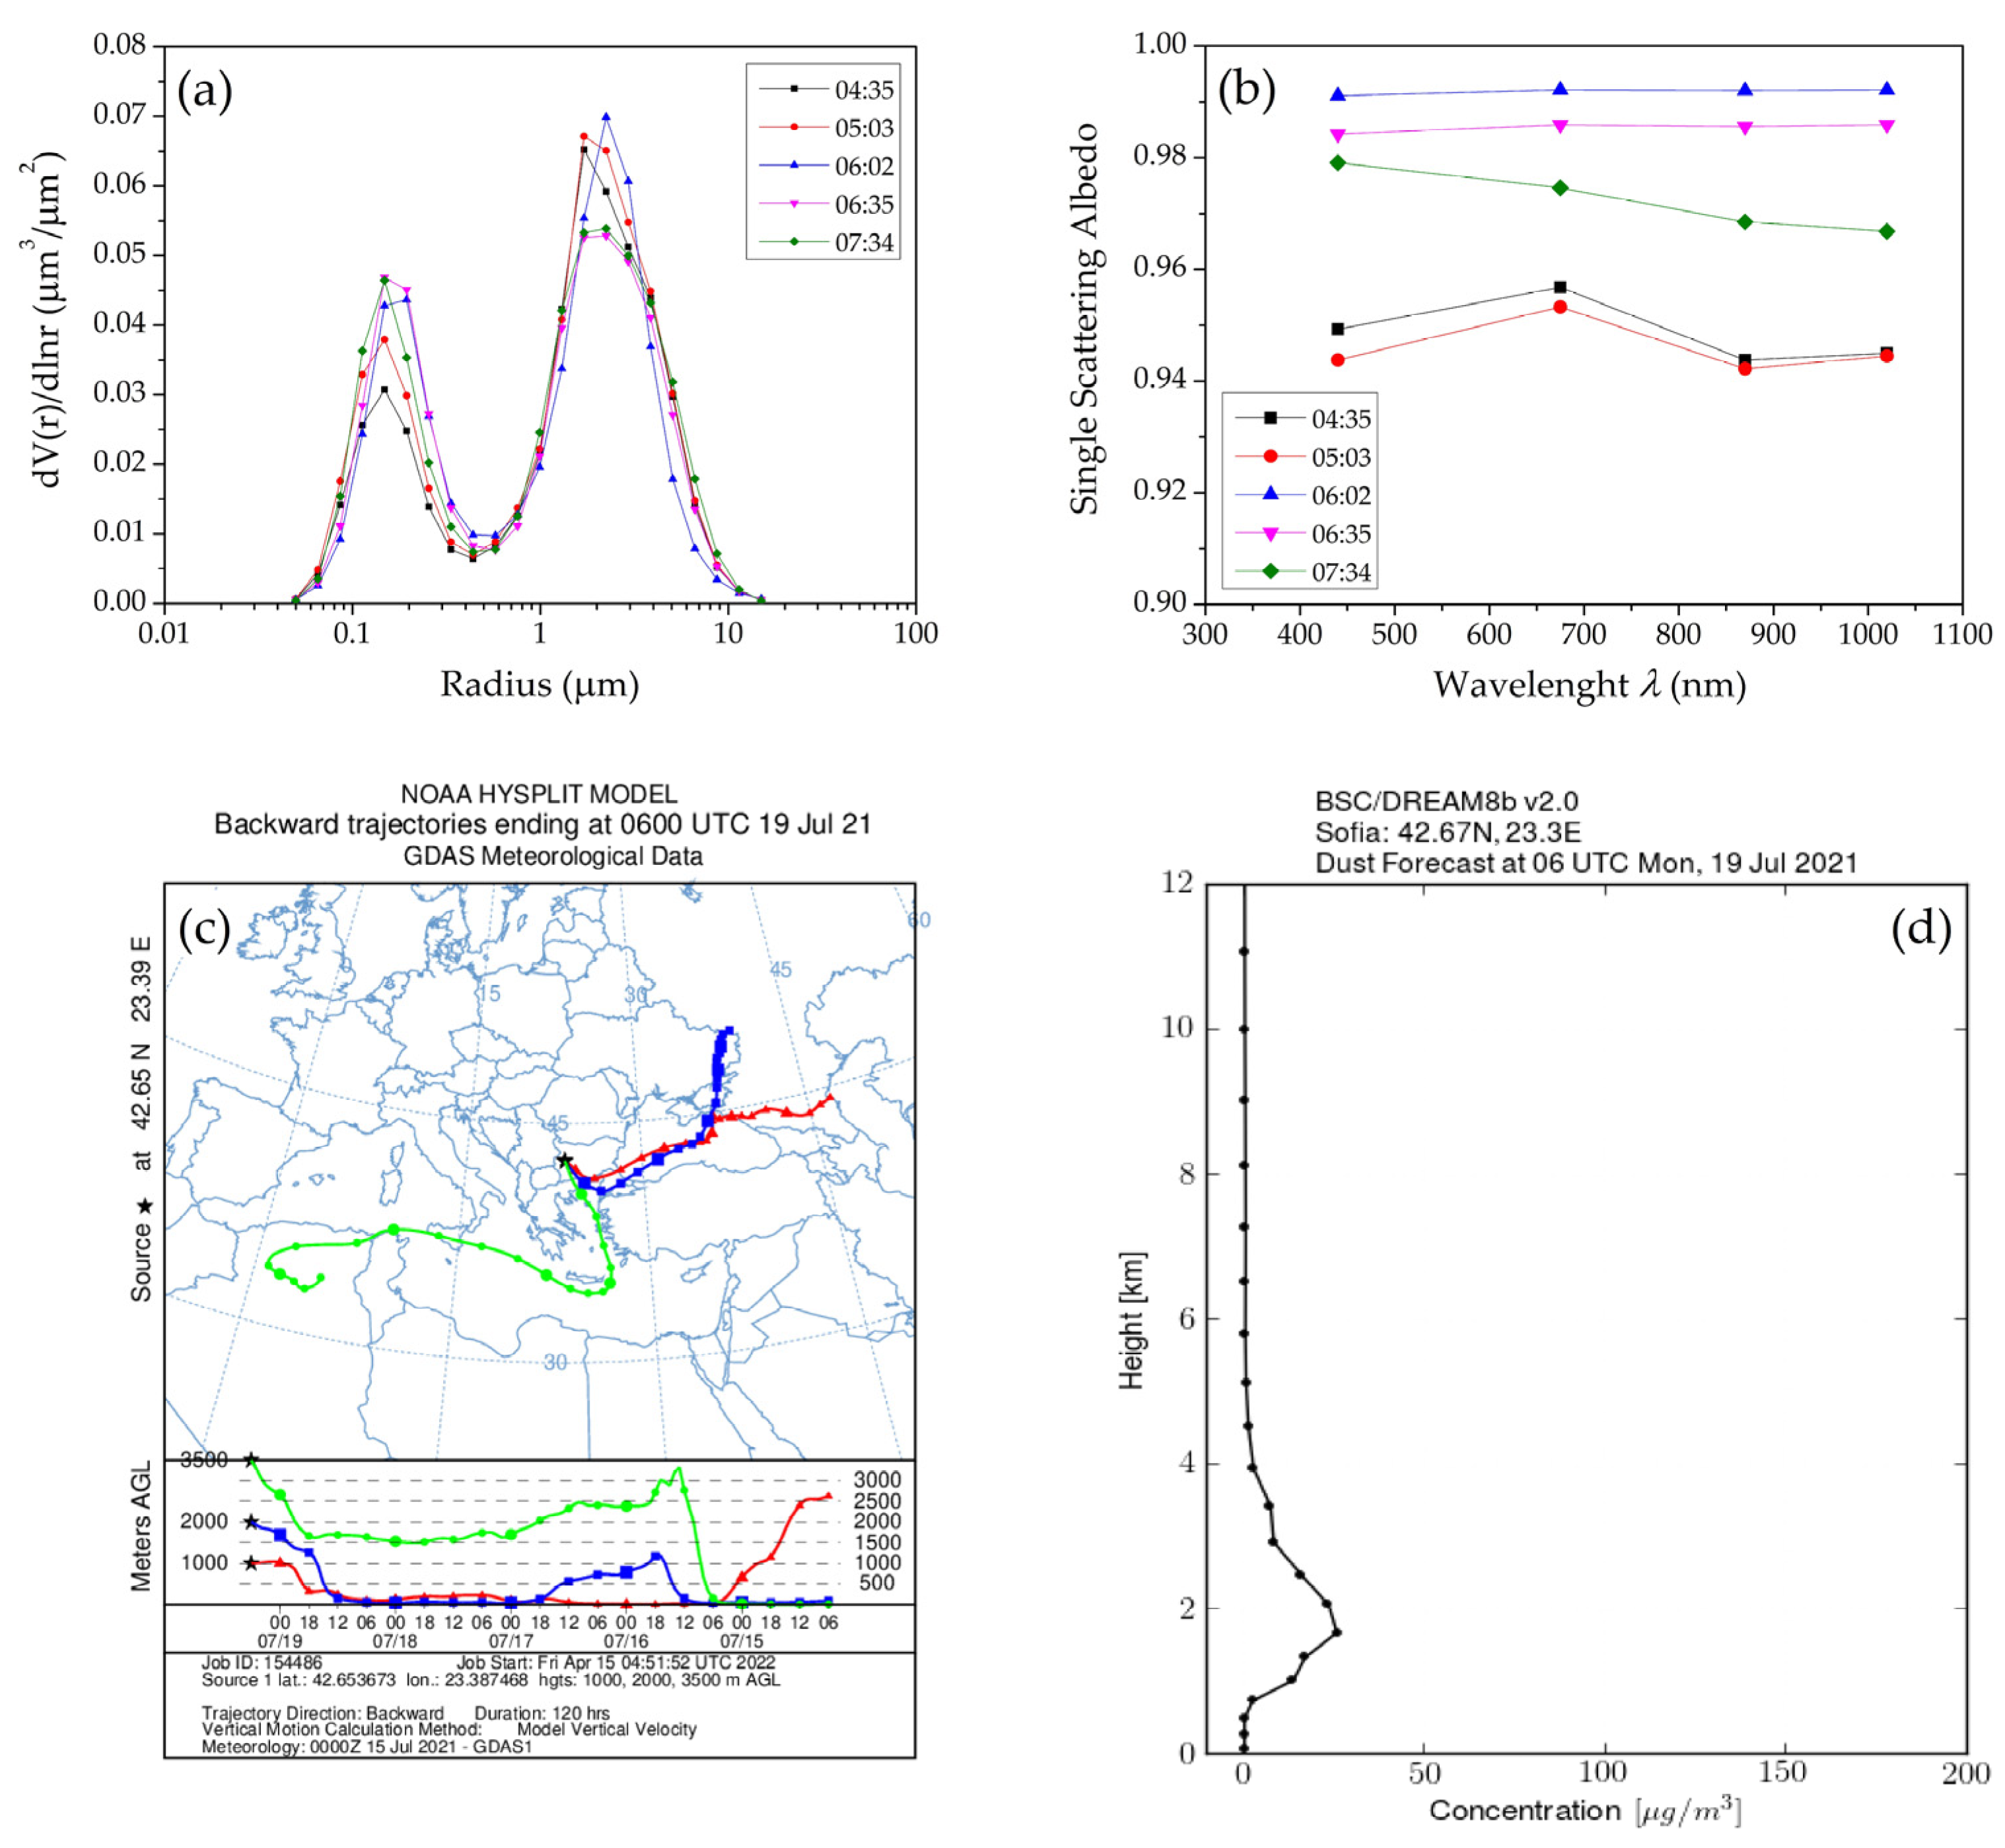
The situation on 19 July 2021 exhibits a complicated competition between scattering and absorption of light by aerosol particles. On this day, the characteristics of the aerosol ensemble are (Table 4): AOD440 = 0.46, AE440/870 = 1.34, AODf500 = 0.29, AODc500 = 0.10, nr440 ~ 1.46–1.51, SF = 3.7–28.9, and DR440 = 0.086–0.132. Here, again, AODf500 > AODc500, but the major VSD mode is that of the coarse particle fraction (Figure 15a). The shapes obtained of the dependency of SSA on λ at 06:02 UTC and 06:35 UTC are like those in the case of marine aerosols passing over the site [28]. At 07:34 UTC, the shape corresponds to a biomass-burning aerosol passage [28]; at 04:35 UTC and 05:03 UTC, its dependence on λ is complex and difficult to interpret (Figure 15b). The 120-h HYSPLIT trajectories indicate air masses arriving at heights of 1000 m, 2000 m, and 3500 m at 06:00 UTC over Sofia from many locations, including Africa, the Mediterranean Sea, and East Europe (Figure 15c) and, at some heights and during different periods, from West Europe. The BSC-DREAM8b model forecasts intensive dust intrusions over Sofia at 06:00 UTC (Figure 15d).
According to the estimates obtained in Section 3.2.1, the relative frequency of appearance of mixed aerosol situations (zones two and five on the scatter plots in Figure 7a,b) is about 19.5%.

4. Conclusions

The climatology picture revealed in this work of the aerosol optical depth and Ångström exponent of the aerosol field over Sofia Valley at the wavelengths λ = 440 nm and 500 nm shows that the AOD has a non-stationary cyclic annual behavior, while the behavior of AE is near-stationary. The time series of the AOD and AE values obtained by individual measurements are strongly varying random functions, such that the AOD increases on average from winter to summer and then decreases, while the mean value of AE remains approximately constant. Local AOD increases (maxima) during winter–spring (February, March, and April) and summer (JJA) are well outlined in the monthly AOD means. The summer maximum is still better outlined in the seasonal AOD means. A good agreement is seen when comparing the values and the behavior of the seasonal AOD means reported here with those obtained in earlier works concerning AERONET sites in Bucharest, Thessaloniki, Athens, and Minsk. The AOD maxima have usually been explained as due to SD intrusions, but the contribution of smoke from fires and dust from roads and mountains should not be neglected.
The seasonal AE means for the whole two-year measurement period (5 May 2020 to 28 February 2022) vary too slowly with the seasons, which practically confirms the assumption that AE is a stationary random function of the time. Some hard-to-notice AE increases in the autumn or summer are probably due to injection of smoke particles from wildfires.
An interesting issue in the work concerns a comparison between the monthly mean AOD values measured now by the Cimel CE318-TS9 sun/sky/moon photometer and 15 years ago by a Microtops II sun photometer. The results obtained now are about two times lower than the former ones, which is mainly due to the measures undertaken by the Bulgarian Government and Sofia Municipality to improve the air quality, including shutting down the largest metalworking company in Bulgaria located near Sofia.
The statistical analysis of the results of individual measurements shows that the mean values of AOD for the first (5 May 2020–28 February 2021), second (1 March 2021–28 February 2022), and overall (5 May 2020–28 February 2022) measurement periods at λ = 440 nm and 500 nm are, respectively, 0.18 ± 0.09 and 0.15 ± 0.08, 0.22 ± 0.12 and 0.18 ± 0.11, and 0.20 ± 0.11 and 0.17 ± 0.10. The corresponding AE characteristics at the wavelength pairs 440/870 nm and 380/500 nm are: 1.41 ± 0.32 and 1.29 ± 0.31, 1.48 ± 0.37 and 1.34 ± 0.27, and 1.45 ± 0.35 and 1.32 ± 0.29.
The frequency distributions of the results for AOD are bimodal with positive skewness, and those for AE are three-modal at 440/870 nm and bimodal at 380/500 nm, with negative skewness. Thus, the pair AOD440–AE440/870 gives rise to 3×2 = 6 specific groups of aerosol events, while the pair AOD500–AE380/500, 2×2 = 4 such groups. Correspondingly, six specific zones of daily mean aerosol situations are distinguishable on the daily mean AOD440 vs. AE440/870 scatter plots for the first (2020–2021) and second (2021–2022) annual measurement cycles. The analysis of the aerosol situations falling within the different zones using AERONET-provided aerosol characteristics (such as VSD, SSA, SF, DR, etc.), NASA’s FIRMS fire maps, and aerosol transport and forecasting models (HYSPLIT and BSC-DREAM8b) shows that zone one (AOD440 > 0.3, AE440/870 > 1.3–1.4) covers mainly summer situations with prevailing biomass-burning aerosols; the relative occurrence of such situations is 9.1%. Zones three and four (0 < AOD440 < 0.3 and AOD440 > 0.3, and AE440/870 < 0.8–1.0) are occupied mainly by cases of SD intrusions with relative occurrence of 8.0%. The place typical for marine aerosol situations (AOD440 < 0.15) is practically not populated. Short-term marine aerosol situations are seen to arise sometimes as parts of the daily aerosol dynamics. The most populated zone six (AOD440 < 0.3, AE440/870 > 1.3–1.4) with an occurrence of 63.4% covers the urban aerosol situations. These are the common, most frequent situations during all seasons. The cases with AOD440–AE440/870 pairs falling within the boundaries of zones two and five (0 < AOD440 < 0.3 and AOD440 > 0.3, and 0.8–1.0 < AE440/870 < 1.3–1.4) can be classified as cases of mixed aerosols. These may be a simultaneous mix or spread-in-time alternation of different aerosol species with a daily mean AE440/870 around unity and various or variable characteristics. A specific characteristic of them is that, although the AOD of their fine fraction usually exceeds somewhat that of their coarse fraction, their major VSD mode is that of the coarse fraction. The relative occurrence of mixed aerosol situations is 19.5%.

Author Contributions

Conceptualization, Ts.E., L.G. and T.D.; methodology, Ts.E. and L.G.; formal analysis, Ts.E. and L.G.; investigation, Ts.E., L.G. and T.D; data curation, Ts.E., L.G., E.T. and T.D.; writing—original draft preparation, Ts.E. and L.G.; writing—review and editing, Ts.E., L.G. and T.D.; visualization, Ts.E., E.T. and T.D.; project administration, T.D.; funding acquisition, T.D. All authors have read and agreed to the published version of the manuscript.

Funding

This research was funded by the Ministry of Education and Science of Bulgaria (support for ACTRIS BG, part of the Bulgarian National Roadmap for Research Infrastructure), by the European Commission under the Horizon 2020—Research and Innovation Framework Program, Grant Agreement No. 871115 (ACTRIS IMP), and by the Bulgarian National Science Fund (Grant No. KP-06-N28/10/2018).

Institutional Review Board Statement

Not applicable.

Informed Consent Statement

Not applicable.

Data Availability Statement

The data products of the CE318-TS9 sun-photometer observations at the Sofia_IEBAS Site are available via the AERONET portal https://aeronet.gsfc.nasa.gov/ (accessed on 30 March 2022).

Acknowledgments

The authors acknowledge AERONET Europe for providing the calibration service. AERONET Europe is part of an ACTRIS-IMP project that received funding from the European Union (H2020-INFRADEV-2018–2020) under Grant Agreement No 871115. The NOAA Air Resources Laboratory is acknowledged for the provision of the HYSPLIT transport and dispersion model and the READY website used in this publication. The authors also acknowledge the images from the BSC-DREAM8b model operated by the Barcelona Supercomputing Center (http://www.bsc.es/ess/bsc-dust-daily-forecast/, accessed on 15 February 2022) and from NASA′s Fire Information for Resource Management System (FIRMS) (https://earthdata.nasa.gov/firms, accessed on 15 May 2022), part of NASA′s Earth Observing System Data and Information System (EOSDIS).

Conflicts of Interest

The authors declare no conflict of interest.

References

  1. Seinfeld, J.H.; Pandis, S.N. Atmospheric Chemistry and Physics: From Air Pollution to Climate Change, 3rd ed.; Wiley: Hoboken, NJ, USA, 2016. [Google Scholar]
  2. Fuzzi, S.; Baltensperger, U.; Carslaw, K.; Decesari, S.; van der Gon, H.D.; Facchini, M.C.; Fowler, D.; Koren, I.; Langford, B.; Lohmann, U.; et al. Particulate matter, air quality and climate: Lessons learned and future needs. Atmos. Chem. Phys. 2015, 15, 8217–8299. [Google Scholar] [CrossRef] [Green Version]
  3. Schmid, B.; Redemann, J.; Russell, P.B.; Hobbs, P.V.; Hlavka, D.L.; McGill, M.J.; Holben, B.N.; Welton, E.J.; Campbell, J.R.; Torres, O.; et al. Coordinated airborne, spaceborne, and ground-based measurements of massive thick aerosol layers during the dry season in southern Africa. J. Geophys. Res. 2003, 108, 8496. [Google Scholar] [CrossRef] [Green Version]
  4. Yin, Z.; Ansmann, A.; Baars, H.; Seifert, P.; Engelmann, R.; Radenz, M.; Jimenez, C.; Herzog, A.; Ohneiser, K.; Hanbuch, K.; et al. Aerosol measurements with a shipborne Sun–sky–lunar photometer and collocated multiwavelength Raman polarization lidar over the Atlantic Ocean. Atmos. Meas. Tech. 2019, 12, 5685–5698. [Google Scholar] [CrossRef] [Green Version]
  5. Pappalardo, G.; Amodeo, A.; Apituley, A.; Comeron, A.; Freudenthaler, V.; Linné, H.; Ansmann, A.; Bösenberg, J.; D’Amico, G.; Mattis, I.; et al. EARLINET: Towards an advanced sustainable European aerosol lidar network. Atmos. Meas. Tech. 2014, 7, 2389–2409. [Google Scholar] [CrossRef] [Green Version]
  6. Holben, B.N.; Eck, T.F.; Slutsker, I.; Tanre, D.; Buis, J.P.; Setzer, A.; Vermote, E.; Reagan, J.A.; Kaufman, Y.J.; Nakajima, T.; et al. AERONET—A federated instrument network and data archive for aerosol characterization. Rem. Sens. Environ. 1998, 66, 1–16. [Google Scholar] [CrossRef]
  7. Sugimoto, N.; Shimizu, A.; Nishizawa, T.; Jin, Y. Recent developments with the Asian dust and aerosol lidar observation network (AD-NET). EPJ Web of Conf. 2018, 176, 09001. [Google Scholar] [CrossRef] [Green Version]
  8. Vaughan, M.A.; Powell, K.A.; Winker, D.M.; Hostetler, C.A.; Kuehn, R.E.; Hunt, W.H.; Getzewich, B.J.; Young, S.A.; Liu, Z.; McGill, M.J. Fully automated detection of cloud and aerosol layers in the CALIPSO lidar measurements. J. Atmos. Ocean. Technol. 2009, 26, 2034–2050. [Google Scholar] [CrossRef]
  9. MODIS (Moderate Resolution Imaging Spectroradiometer). Available online: https://modis.gsfc.nasa.gov/ (accessed on 25 March 2022).
  10. Papayannis, A.; Amiridis, V.; Mona, L.; Tsaknakis, G.; Balis, D.; Bösenberg, J.; Chaikovski, A.; De Tomasi, F.; Grigorov, I.; Mattis, I.; et al. Systematic lidar observations of Saharan dust over Europe in the frame of EARLINET (2000–2002). J. Geophys. Res. 2008, 113, D10204. [Google Scholar] [CrossRef] [Green Version]
  11. Dreischuh, T.; Grigorov, I.; Peshev, Z.; Deleva, A.; Kolarov, G.; Stoyanov, D. Lidar mapping of near-surface aerosol fields. In Aerosols—Science and Case Studies; Volkov, K., Ed.; InTech: Rijeka, Croatia, 2016; pp. 85–107. [Google Scholar]
  12. University of Wyoming, Upperair Air Data. Available online: http://weather.uwyo.edu/upperair/sounding.html (accessed on 25 March 2022).
  13. Remer, L.A.; Kaufman, Y.J.; Tanré, D.; Mattoo, S.; Chu, D.A.; Martins, J.V.; Li, R.-R.; Ichoku, C.; Levy, R.C.; Kleidman, R.G.; et al. The MODIS aerosol algorithm, products, and validation. J. Atmos. Sci. 2005, 62, 947–973. [Google Scholar] [CrossRef] [Green Version]
  14. Levy, R.C.; Remer, L.A.; Mattoo, S.; Vermote, E.F.; Kaufman, Y.J. Second-generation operational algorithm: Retrieval of aerosol properties over land from inversion of moderate resolution imaging spectroradiometer spectral reflectance. J. Geophys. Res.-Atmos. 2007, 112, D13221. [Google Scholar] [CrossRef] [Green Version]
  15. Chaikovsky, A.; Dubovik, O.; Holben, B.; Bril, A.; Goloub, P.; Tanré, D.; Pappalardo, G.; Wandinger, U.; Chaikovskaya, L.; Denisov, S.; et al. Lidar-Radiometer Inversion Code (LIRIC) for the retrieval of vertical aerosol properties from combined lidar/radiometer data: Development and distribution in EARLINET. Atmos. Meas. Tech. 2016, 9, 1181–1205. [Google Scholar] [CrossRef] [Green Version]
  16. Dubovik, O.; Fuertes, D.; Litvinov, P.; Lopatin, A.; Lapyonok, T.; Doubovik, I.; Xu, F.; Ducos, F.; Chen, C.; Torres, B.; et al. A comprehensive description of multi-term LSM for applying multiple a priori constraints in problems of atmospheric remote sensing: GRASP algorithm, concept, and applications. Front. Remote Sens. 2021, 2, 706851. [Google Scholar] [CrossRef]
  17. Stein, A.F.; Draxler, R.R.; Rolph, G.D.; Stunder, B.J.B.; Cohen, M.D.; Ngan, F. NOAA’s HYSPLIT atmospheric transport and dispersion modeling system. Bull. Am. Meteorol. Soc. 2015, 96, 2059–2077. [Google Scholar] [CrossRef]
  18. Rolph, G.; Stein, A.; and Stunder, B. Real-time environmental applications and display system: READY. Environ. Modell. Softw. 2017, 95, 210–228. [Google Scholar] [CrossRef]
  19. Pérez, C.; Nickovic, S.; Baldasano, J.M.; Sicard, M.; Rocadenbosch, F.; Cachorro, V.E. A long Saharan dust event over the western Mediterranean: Lidar, Sun photometer observations, and regional dust modeling. J. Geophys. Res. 2006, 111, D15214. [Google Scholar] [CrossRef]
  20. Basart, S.; Pérez, C.; Nickovic, S.; Cuevas, E.; Baldasano, J. Development and evaluation of the BSC-DREAM8b dust regional model over Northern Africa, the Mediterranean and the Middle East. Tellus B 2012, 64, 18539. [Google Scholar] [CrossRef] [Green Version]
  21. Haustein, K.; Pérez, C.; Baldasano, J.M.; Jorba, O.; Basart, S.; Miller, R.L.; Janjic, Z.; Black, T.; Nickovic, S.; Todd, M.C.; et al. Atmospheric dust modeling from MESO to global scales with the online NMMB/BSC-dust model—Part 2: Experimental campaigns in Northern Africa. Atmos. Chem. Phys. 2012, 12, 2933–2958. [Google Scholar] [CrossRef] [Green Version]
  22. World Health Organization (WHO). Review of Evidence on Health Aspects of Air Pollution—REVIHAAP Project: Technical Report; WHO Regional Office for Europe: Copenhagen, Denmark, 2013. [Google Scholar]
  23. Anderson, J.O.; Thundiyil, J.G.; Stolbach, A. Clearing the air: A review of the effects of particulate matter air pollution on human health. J. Med. Toxicol. 2012, 8, 166–175. [Google Scholar] [CrossRef] [Green Version]
  24. Gulia, S.; Nagendra, S.M.S.; Khare, M.; Khanna, I. Urban air quality management—A review. Atmos. Pollut. Res. 2015, 6, 286–304. [Google Scholar] [CrossRef] [Green Version]
  25. IPCC. Climate Change 2013—The Physical Science Basis. Working Group I Contribution to the Fifth Assessment Report of the Intergovernmental Panel on Climate Change; Stocker, T.F., Qin, D., Plattner, G.-K., Tignor, M., Allen, S.K., Boschung, J., Nauels, A., Xia, Y., Bex, V., Midgley, P.M., Eds.; Cambridge University Press: Cambridge, UK; New York, NY, USA, 2013; p. 1535. [Google Scholar]
  26. Goloub, P.; Li, Z.; Dubovik, O.; Blarela, L.; Podvin, T.; Jankowiak, I.; Lecoq, R.; Deroo, C.; Chatenet, B.; Morel, J.P.; et al. PHOTONS/AERONET sunphotometer network overview. Description—Activities—Results. Proc. SPIE 2008, 6936, 69360V. [Google Scholar]
  27. Holben, B.N.; Tanre, D.; Smirnov, A.; Eck, T.F.; Slutsker, I. An emerging ground-based aerosol climatology: Aerosol optical depth from AERONET. J. Geophys. Res. 2001, 106, 12067–12097. [Google Scholar] [CrossRef]
  28. Dubovik, O.; Holben, B.N.; Eck, T.F.; Smirnov, A.; Kaufman, Y.J.; King, M.D.; Tanre, D.; Slutsker, I. Variability of absorption and optical properties of key aerosol types observed in worldwide locations. J. Atmos. Sci. 2002, 59, 590–608. [Google Scholar] [CrossRef]
  29. Toledano, C.; Cachorro, V.E.; Berjon, A.; de Frutos, A.M.; Sorribas, M.; de la Morena, B.A.; Goloub, P. Aerosol optical depth and Angstrom exponent climatology at El Arenosillo AERONET site (Huelva, Spain). Q. J. R. Meteorol. Soc. 2007, 133, 795–807. [Google Scholar] [CrossRef]
  30. Nemuc, A.; Belegante, L.; Radulescu, R. One year of sunphotometer measurements in Romania. Rom. J. Phys. 2011, 56, 550–562. [Google Scholar]
  31. Raptis, I.-P.; Kazadzis, S.; Amiridis, V.; Gkikas, E.G.; Mihalopoulos, N. A decade of aerosol optical properties measurements over Athens, Greece. Atmosphere 2020, 11, 154. [Google Scholar] [CrossRef] [Green Version]
  32. Kambezidis, H.D.; Kaskaoutis, D.G. Aerosol climatology over four AERONET sites: An overview. Atmos. Environ. 2008, 42, 1892–1906. [Google Scholar] [CrossRef]
  33. Nicolae, V.; Talianu, C.; Andrei, S.; Antonescu, B.; Ene, D.; Nicolae, D.; Dandocsi, A.; Toader, V.-E.; Stefan, S.; Savu, T.; et al. Multiyear typology of long-range transported aerosols over Europe. Atmosphere 2019, 10, 482. [Google Scholar] [CrossRef] [Green Version]
  34. Logothetis, S.-A.; Salamalikis, V.; Kazantzidis, A. Aerosol classification in Europe, Middle East, North Africa and Arabian Peninsula based on AERONET Version 3. Atmos. Res. 2020, 239, 104893. [Google Scholar] [CrossRef]
  35. Evgenieva, T.; Gurdev, L.; Toncheva, E.; Dreischuh, T. Aerosol types identification during different aerosol events over Sofia, Bulgaria, using sun-photometer and satellite data on the aerosol optical depth and Ångström exponent. J. Phys. Conf. Ser. 2022, 2240, 012027. [Google Scholar] [CrossRef]
  36. Dubovik, O.; King, M.D. A flexible inversion algorithm for retrieval of aerosol optical properties from Sun and sky radiance measurements. J. Geophys. Res. 2000, 105, 20673–20696. [Google Scholar] [CrossRef] [Green Version]
  37. Dubovik, O.; Smirnov, A.; Holben, B.N.; King, M.D.; Kaufman, Y.J.; Eck, T.F.; Slutsker, I. Accuracy assessments of aerosol optical properties retrieved from AERONET sun and sky-radiometric measurements. J. Geophys. Res. 2000, 105, 9791–9806. [Google Scholar] [CrossRef] [Green Version]
  38. Dubovik, O.; Sinyuk, A.; Lapyonok, T.; Holben, B.N.; Mishchenko, M.; Yang, P.; Eck, T.F.; Volten, H.; Muñoz, O.; Veihelmann, B.; et al. Application of spheroid models to account for aerosol particle nonsphericity in remote sensing of desert dust. J. Geophys. Res. 2006, 111, D11208. [Google Scholar] [CrossRef] [Green Version]
  39. O’Neill, N.T.; Eck, T.F.; Smirnov, A.; Holben, B.N.; Thulasiraman, S. Spectral discrimination of coarse and fine mode optical depth. J. Geophys. Res. 2003, 108, 4559–4573. [Google Scholar] [CrossRef]
  40. Smirnov, A.; Holben, B.N.; Eck, T.F.; Dubovik, O.; Slutsker, I. Cloud screening and quality control algorithms for the AERONET data base. Remote Sens. Environ. 2000, 73, 337–349. [Google Scholar] [CrossRef]
  41. Giles, D.M.; Sinyuk, A.; Sorokin, M.G.; Schafer, J.S.; Smirnov, A.; Slutsker, I.; Eck, T.F.; Holben, B.N.; Lewis, J.R.; Campbell, J.R.; et al. Advancements in the Aerosol Robotic Network (AERONET) Version 3 database—automated near-real-time quality control algorithm with improved cloud screening for Sun photometer aerosol optical depth (AOD) measurements. Atmos. Meas. Tech. 2019, 12, 169–209. [Google Scholar] [CrossRef] [Green Version]
  42. Chand, D.; Wood, R.; Anderson, T.L.; Satheesh, S.K.; Charlson, R.J. Satellite derived direct radiative effect of aerosols dependent on cloud cover. Nat. Geosci. 2009, 2, 181–184. [Google Scholar] [CrossRef]
  43. Patel, P.N.; Dumka, U.C.; Kaskaoutis, D.G.; Babu, K.N.; Mathur, A.K. Optical and radiative properties of aerosols over Desalpar, a remote site in western India: Source identification, modification processes and aerosol type discrimination. Sci. Total Environ. 2017, 575, 612–627. [Google Scholar] [CrossRef] [Green Version]
  44. Boiyo, R.; Kumar, K.R.; Zhao, T.; Guo, J. A 10-year record of aerosol optical properties and radiative forcing over three environmentally distinct AERONET sites in Kenya, East Africa. J. Geophys. Res. Atmos. 2019, 124, 1596–1617. [Google Scholar] [CrossRef]
  45. El-Nadry, M.; Li, W.; El-Askary, H.; Awad, M.A.; Mostafa, A.R. Urban health related air quality indicators over the Middle East and North Africa countries using multiple satellites and AERONET data. Remote Sens. 2019, 11, 2096. [Google Scholar] [CrossRef] [Green Version]
  46. Miller, D.J.; Sun, K.; Zondlo, M.A.; Kanter, D.; Dubovik, O.; Welton, E.J.; Winker, D.M.; Ginoux, P. Assessing boreal forest fire smoke aerosol impacts on U.S. air quality: A case study using multiple data sets. J. Geophys. Res. 2011, 116, D22209. [Google Scholar] [CrossRef] [Green Version]
  47. Marrero, J.C.A.; Revilla, V.C.; Parrado, F.G.; Baraja, A.F.; Vega, A.R.; Mateos, D.; Arredondo, R.E.; Toledano, C. Comparison of aerosol optical depth from satellite (MODIS), sun photometer and broadband pyrheliometer ground-based observations in Cuba. Atmos. Meas. Tech. 2018, 11, 2279–22938. [Google Scholar] [CrossRef] [Green Version]
  48. Tripathi, S.N.; Dey, S.; Chandel, A.; Srivastava, S.; Singh, R.P.; Holben, B.N. Comparison of MODIS and AERONET derived aerosol optical depth over the Ganga Basin, India. Ann. Geophys. 2005, 23, 1093–1101. [Google Scholar] [CrossRef] [Green Version]
  49. Levy, R.C.; Remer, L.A.; Martins, J.; Kaufman, Y.J.; Plana-Fattori, A.; Redemann, J.; Wenny, B. Evaluation of MODIS aerosol retrievals over Ocean and Land during CLAMS. J. Atmos. Sci. 2005, 62, 974–992. [Google Scholar] [CrossRef]
  50. Mielonen, T.; Arola, A.; Komppula, M.; Kukkonen, J.; Koskinen, J.; de Leeuw, G.; Lehtinen, K.E.J. Comparison of CALIOP level 2 aerosol subtypes to aerosol types derived from AERONET inversion data. Geophys. Res. Lett. 2009, 36, L18804. [Google Scholar] [CrossRef]
  51. Aerosol, Clouds and Trace Gases (ACTRIS) Research Infrastructure. Available online: https://www.actris.eu (accessed on 30 March 2022).
  52. Barreto, Á.; Cuevas, E.; Granados-Muñoz, M.-J.; Alados-Arboledas, L.; Romero, P.M.; Gröbner, J.; Kouremeti, N.; Almansa, A.F.; Stone, T.; Toledano, C.; et al. The new sun-sky-lunar Cimel CE318-T multiband photometer—A comprehensive performance evaluation. Atmos. Meas. Tech. 2016, 9, 631–654. [Google Scholar] [CrossRef] [Green Version]
  53. Cimel. Multiband Photometer CE318–T, User’s Manual (Revision V4.10 October 2021). Available online: https://www.cimel.fr/wp-content/uploads/2022/01/CE318_T_Photometer_UserManual_V4.10.pdf (accessed on 1 April 2022).
  54. AERONET Aerosol Optical Depth Data Display Interface, Sofia_IEBAS Site. Available online: https://aeronet.gsfc.nasa.gov/cgi-bin/data_display_aod_v3?site=Sofia_IEBAS&nachal=0&year=2022&month=2&day=2&aero_water=0&level=2&if_day=0&if_err=0&place_code=10&year_or_month=0 (accessed on 6 April 2022).
  55. Toledano, C.; Wiegner, M.; Groß, S.; Freudenthaler, V.; Gasteiger, J.; Müller, D.; Müller, D.; Schladitz, A.; Weinzierl, B.; Torres, B.; et al. Optical properties of aerosol mixtures derived from sun-sky radiometry during SAMUM-2. Tellus B Chem. Phys. Meteorol. 2011, 63, 635–648. [Google Scholar] [CrossRef] [Green Version]
  56. Filonchyk, M.; Peterson, M.; Yan, H.; Yang, S.; Chaikovsky, A. Columnar optical characteristics and radiative properties of aerosols of the AERONET site in Minsk, Belarus. Atmos. Environ. 2021, 249, 118237. [Google Scholar] [CrossRef]
  57. Lee, J.; Kim, J.; Song, C.H.; Kim, S.B.; Chun, Y.; Sohn, B.J.; Holben, B.N. Characteristics of aerosol types from AERONET sunphotometer measurements. Atmos. Environ. 2010, 44, 3110–3117. [Google Scholar] [CrossRef]
  58. Giles, D.M.; Holben, B.N.; Eck, T.F.; Sinyuk, A.; Smirnov, A.; Slutsker, I.; Dickerson, R.; Thompson, A.; Schafer, J. An analysis of AERONET aerosol absorption properties and classifications representative of aerosol source regions. J. Geophys. Res. Atmos. 2012, 117, D17203. [Google Scholar] [CrossRef] [Green Version]
  59. Eck, T.F.; Holben, B.N.; Sinyuk, A.; Pinker, R.T.; Goloub, P.; Chen, H.; Chatenet, B.; Li, Z.; Singh, R.P.; Tripathi, S.N.; et al. Climatological aspects of the optical properties of fine/coarse mode aerosol mixtures. J. Geophys. Res. 2010, 115, D19205. [Google Scholar] [CrossRef] [Green Version]
  60. Zuev, V.E.; Kabanov, M.V. Modern Problems of Atmospheric Optics, Vol.4: Optics of Atmospheric Aerosol; Gidrometeoizdat: Leningrad, Russia, 1987. (In Russian) [Google Scholar]
  61. Cracknell, A.P. Remote Sensing in Meteorology, Oceanography and Hydrology; Ellis Horwood Limited: Chichester, UK; John Wiley & Sons: Chichester, UK, 1981. [Google Scholar]
  62. Ångström, A. On the atmospheric transmission of Sun radiation and on dust in the air. Geogr. Ann. 1929, 11, 156–166. [Google Scholar]
  63. Schuster, G.L.; Dubovik, O.; Holben, B.N. Angstrom exponent and bimodal aerosol size distributions. J. Geophys. Res. 2006, 111, D07207. [Google Scholar] [CrossRef] [Green Version]
  64. Kirova, H.; Batchvarova, E. Mesoscale simulation of meteorological profiles during the Sofia Experiment 2003. Int. J. Environ. Pollut. 2017, 61, 134–147. [Google Scholar] [CrossRef]
  65. Egova, E.; Dimitrova, R.; Danchovski, V. Numerical study of meso-scale circulation specifics in the Sofia region under different large-scale conditions. Bulg. J. Meteo. Hydr. 2017, 22, 54–72. [Google Scholar]
  66. Kolev, I.; Savov, P.; Kaprielov, B.; Parvanov, O.; Simeonov, V. Lidar observation of the nocturnal boundary layer formation over Sofia, Bulgaria. Atmos. Environ. 2000, 34, 3223–3235. [Google Scholar] [CrossRef]
  67. Hristova, E.; Veleva, B. Variation of air particulate concentration in Sofia, 2005–2012. Bulg. J. Meteo. Hydr. 2013, 18, 47–56. [Google Scholar]
  68. Dimitrova, R.; Velizarova, M. Assessment of the contribution of different particulate matter sources on pollution in Sofia city. Atmosphere 2021, 12, 423. [Google Scholar] [CrossRef]
  69. Perrone, M.G.; Vratolis, S.; Georgieva, E.; Török, S.; Šega, K.; Veleva, B.; Osánd, J.; Bešliće, I.; Kertészf, Z.; Pernigottig, D.; et al. Sources and geographic origin of particulate matter in urban areas of the Danube macro-region: The cases of Zagreb (Croatia), Budapest (Hungary) and Sofia (Bulgaria). Sci. Total Environ. 2018, 619, 1515–1529. [Google Scholar] [CrossRef]
  70. National Oceanic and Atmospheric Administration, National Centers for Environmental Information, The World Meteorological Organization (WMO) Climate Normals. Available online: https://www.ncei.noaa.gov/products/wmo-climate-normals (accessed on 1 April 2022).
  71. Ivanov, V.; Evtimov, S. Wind rose or correspondence analysis biplot. Annu. Sofia Univ. St. Kliment Ohridski-Fac. Phys. 2015, 108, 15–24. (In Bulgarian) [Google Scholar]
  72. Kokhanovsky, A.A. Atmospheric Optics: Light Absorption and Scattering by Particles in the Atmosphere; Springer Science & Business Media: Berlin/Heidelberg, Germany, 2008. [Google Scholar]
  73. Eck, T.F.; Holben, B.N.; Reid, J.S.; Dubovik, O.; Smirnov, A.; O’Neill, N.T.; Slutsker, I.; Kinne, S. Wavelength dependence of the optical depth of biomass burning, urban and desert dust aerosols. J. Geophys. Res. 1999, 104, 31333–31350. [Google Scholar] [CrossRef]
  74. Eck, T.F.; Holben, B.N.; Reid, J.S.; O’Neill, N.T.; Schafer, J.S.; Dubovik, O.; Smirnov, A.; Yamasoe, M.A.; Artaxo, P. High aerosol optical depth biomass burning events: A comparison of optical properties for different source regions. Geophys. Res. Lett. 2003, 30, 2035. [Google Scholar] [CrossRef] [Green Version]
  75. Smirnov, A.; Holben, B.N.; Kaufman, Y.J.; Dubovik, O.; Eck, T.F.; Slutsker, I.; Pietras, C.; Halthore, R. Optical properties of atmospheric aerosol in maritime environments. J. Atmos. Sci. 2002, 59, 501–523. [Google Scholar] [CrossRef] [Green Version]
  76. Toledano, C.; Cachorro, V.E.; De Frutos, A.M.; Torres, B.; Berjon, A.; Sorribas, M.; Stone, R.S. Airmass classification and analysis of aerosol types at El Arenosillo (Spain). J. Appl. Meteorol. Climatol. 2009, 48, 962–981. [Google Scholar] [CrossRef]
  77. Ozdemir, E.; Tuygun, G.T.; Elbir, T. Application of aerosol classification methods based on AERONET version 3 product over eastern Mediterranean and Black Sea. Atmos. Pollut. Res. 2020, 11, 2226–2243. [Google Scholar] [CrossRef]
  78. NASA’s Fire Information for Resource Management System (FIRMS) Part of NASA’s Earth Observing System Data and Information System (EOSDIS). Available online: https://earthdata.nasa.gov/firms (accessed on 17 March 2022).
  79. Archived Weather Data for Sofia, Bulgaria, Provided by the Bulgarian National Institute of Meteorology and Hydrology. Available online: https://www.stringmeteo.com/synop/bg_stday.php (accessed on 21 March 2022).
  80. Eck, T.F.; Holben, B.N.; Ward, D.E.; Mukelabai, M.M.; Dubovik, O.; Smirnov, A.; Schafer, J.S.; Hsu, N.C.; Piketh, S.J.; Queface, A.; et al. Variability of biomass burning aerosol optical characteristics in southern Africa during the SAFARI 2000 dry season campaign and a comparison of single scattering albedo estimates from radiometric measurements. J. Geophys. Res.-Atmos. 2003, 108, D13. [Google Scholar] [CrossRef]
  81. Cao, X.; Liang, J.; Tian, P.; Zhang, L.; Quan, X.; Liu, W. The mass concentration and optical properties of black carbon aerosols over a semi–arid region in the northwest of China. Atmos. Pollut. Res. 2014, 5, 601–609. [Google Scholar] [CrossRef] [Green Version]
  82. Luo, J.; Zhang, Y.; Zhang, Q. The Ångström Exponent and Single-Scattering Albedo of Black Carbon: Effects of Different Coating Materials. Atmosphere 2020, 11, 1103. [Google Scholar] [CrossRef]
  83. Kolev, N.; Grigorov, I.; Kolev, I.; Devara, P.C.S.; Raj, P.E.; Dani, K.K. Lidar and Sun photometer observations of atmospheric boundary-layer characteristics over an urban area in a mountain valley. Bound.-Layer Meteorol. 2007, 124, 99–115. [Google Scholar] [CrossRef]
  84. Evgenieva, T.T.; Wiman, B.L.B.; Kolev, N.I.; Savov, P.B.; Donev, E.H.; Ivanov, D.I.; Danchovski, V.; Kaprielov, B.K.; Grigorieva, V.N.; Iliev, T.I.; et al. Three-point observation in the troposphere over Sofia-Plana Mountain, Bulgaria. Int. J. Remote Sens. 2011, 32, 9343–9363. [Google Scholar] [CrossRef]
  85. Ichoku, C.; Levy, R.; Kaufman, Y.J.; Remer, L.A.; Li, R.-R.; Martins, V.J.; Holben, B.N.; Abuhassan, N.; Slutsker, I.; Eck, T.F.; et al. Analysis of the performance characteristics of the five-channel Microtops II Sun photometer for measuring aerosol optical thickness and precipitable water vapor. J. Geophys. Res. 2002, 107, AAC 5-1–AAC 5-17. [Google Scholar] [CrossRef]
  86. Evgenieva, T.T.; Kolev, N.I.; Iliev, I.T.; Savov, P.B.; Kaprielov, B.K.; Devara, P.C.S.; Kolev, I.N. Lidar and spectroradiometer measurements of atmospheric aerosol optical characteristics over an urban area in Sofia, Bulgaria. Int. J. Remote Sens. 2009, 30, 6381–6401. [Google Scholar] [CrossRef]
  87. Evgenieva, Ts.; Kolev, N.; Petkov, D. Ångström coefficients calculated from aerosol optical depth data obtained over Sofia, Bulgaria. Proc. SPIE 2015, 9447, 94470P. [Google Scholar]
  88. Evgenieva, Ts.; Iliev, I.; Kolev, N.; Sobolewski, P.; Pieterczuk, A.; Holben, B.; Kolev, I. Optical characteristics of aerosol determined by Cimel, Prede and Microtops II sun photometers over Belsk (Poland). Proc. SPIE 2008, 7027, 70270V. [Google Scholar]
  89. Ministry of Environment and Water of the Republic of Bulgaria. National Program for Improvement of Atmospheric Air Quality for the Period 2018–2024, Adopted by Decision №334/07.06.2019 of the Council of Ministers. Available online: https://www.moew.government.bg/static/media/ups/tiny/Air_new/Natzionalna_programa_podobriavane_KAV_2018-2024.pdf (accessed on 6 April 2022). (In Bulgarian)
  90. Sofia Municipality. Programme for Reduction of Emissions and Attainment of the Established Standards for Fine Particulate Matter PM10 and Nitrogen Dioxide and Atmospheric Air Quality Management of Sofia Municipality for the Period 2011–2014. Available online: https://www.sofia.bg/documents/20182/298121/KAV_new.pdf (accessed on 6 April 2022). (In Bulgarian).
  91. Sofia Municipality. Programme for Atmospheric Air Quality Management of Sofia Municipality for the Period 2015–2020—Reduction of Emissions and Attainment of the Established Standards for Fine Particulate Matter PM10. Available online: https://www.sofia.bg/documents/20182/298121/Project_Program_KAV_Sofia_2015-2020.pdf/23a572ba-77ac-45a4-b627-c77ea0e225c7 (accessed on 6 April 2022). (In Bulgarian).
  92. Sofia Municipality. Complex Program for Improving the Atmospheric Air Quality on the Territory of the Sofia Municipality for the Period 2021–2026. Available online: https://www.sofia.bg/documents/20182/12266186/2021-05-05-%D0%9F%D1%80%D0%B8%D0%BB.1.pdf/2835466e-f861-49c0-94f8-a5b9d61755a5 (accessed on 6 April 2022). (In Bulgarian).
  93. Directive (EU) 2016/2284 of the European Parliament and of the Council of 14 December 2016 on the Reduction of National Emissions of Certain Atmospheric Pollutants, Amending Directive 2003/35/EC and Repealing Directive 2001/81/EC. Available online: http://data.europa.eu/eli/dir/2016/2284/oj (accessed on 9 April 2022).
  94. Filonchyk, M.; Hurynovich, V.; Yan, H.; Zhou, L.; Gusev, A. Climatology of aerosol optical depth over Eastern Europe based on 19 years (2000–2018) MODIS TERRA data. Int. J. Clim. 2020, 40, 3531–3549. [Google Scholar] [CrossRef]
  95. Filonchyk, M.; Hurynovich, V.; Yan, H. Trends in aerosol optical properties over Eastern Europe based on MODIS-Aqua. Geosci. Front. 2020, 11, 2169–2181. [Google Scholar] [CrossRef]
  96. Copernicus Atmosphere Monitoring Service (CAMS). COVID Impact on Air Quality in Europe. A Preliminary Regional Model Analysis. Reading, UK. 2020. Available online: https://policy.atmosphere.copernicus.eu/reports/CAMS71_COVID_20200626_v1.3.pdf (accessed on 15 May 2022).
  97. Garofalide, S.; Postolachi, C.; Cocean, A.; Cocean, G.; Motrescu, I.; Cocean, I.; Munteanu, B.S.; Prelipceanu, M.; Gurlui, S.; Leontie, L. Saharan Dust Storm Aerosol Characterization of the Event (9–13 May 2020) over European AERONET Sites. Atmosphere 2022, 13, 493. [Google Scholar] [CrossRef]
  98. Schkolnik, G.; Chand, D.; Hoffer, A.; Andreae, M.O.; Erlick, C.; Swietlicki, E.; Rudich, Y. Constraining the density and complex refractive index of elemental and organic carbon in biomass burning aerosol using optical and chemical measurements. Atmos. Environ. 2007, 41, 1107–1118. [Google Scholar] [CrossRef]
  99. Konovalov, I.B.; Lvova, D.A.; Beekmann, M. Estimation of the elemental to organic carbon ratio in biomass burning aerosol using AERONET retrievals. Atmosphere 2017, 8, 122. [Google Scholar] [CrossRef] [Green Version]
  100. Nicolae, D.; Nemuc, A.; Mueler, A.; Talianu, C.; Vasilescu, J.; Belegante, L.; Kolgotin, A. Characterization of fresh and aging biomass burning events using multiwavelength Raman lidar and mass spectrometry. J. Geophys. Res. 2013, 118, 2956–2965. [Google Scholar] [CrossRef]
  101. Light Scattering from Nonspherical Particles: Theory, Measurements, and Applications; Mishchenko, M.I.; Hovenier, J.W.; Trvis, L.D. (Eds.) Elsevier: San Diego, CA, USA; Academic Press: San Diego, CA, USA, 2000. [Google Scholar]
  102. Dubovik, O.; Holben, B.N.; Lapyonok, T.; Sinyuk, A.; Mishchenko, M.I.; Yang, P.; Slutsker, I. Non-spherical aerosol retrieval method employing light scattering by spheroids. Geophys. Res. Lett. 2002, 29, 54-1–54-4. [Google Scholar] [CrossRef] [Green Version]
  103. Roger, J.C.; Vermote, E.; Skakun, S.; Murphy, E.; Dubovik, O.; Kalecinski, N.; Korgo, B.; Holben, B. Aerosol models from the AERONET database: Application to surface reflectance validation. Atmos. Meas. Tech. 2022, 15, 1123–1144. [Google Scholar] [CrossRef]
  104. Noh, Y.; Müller, D.; Lee, K.; Kim, K.; Lee, K.; Shimizu, A.; Sano, I.; Park, C.B. Depolarization ratios retrieved by AERONET sun–sky radiometer data and comparison to depolarization ratios measured with lidar. Atmos. Chem. Phys. 2017, 17, 6271–6290. [Google Scholar] [CrossRef] [Green Version]
  105. Toledano, C.; Weigner, M.; Garhammer, M.; Seefeldner, M.; Gasteiger, J.; Muler, D.; Koepke, P. Spectral aerosol optical depth characterization of desert dust during SAMUM 2006. Tellus B Chem. Phys. Meteorol. 2009, 61, 216–228. [Google Scholar] [CrossRef]
  106. Executive Environment Agency (ExEA), Ministry of Environment and Water—Bulgaria, National System for Environmental Monitoring. Available online: http://www.eea.government.bg/kav/ (accessed on 31 March 2022).
  107. Salvador, P.; Artíñano, B.; Molero, F.; Viana, M.; Pey, J.; Alastuey, A.; Querol, X. African dust contribution to ambient aerosol levels across central Spain: Characterization of long-range transport episodes of desert dust. Atmos. Res. 2013, 127, 117–129. [Google Scholar] [CrossRef]
  108. Salvador, P.; Pey, J.; Pérez, N.; Querol, X.; Artíñano, B. Increasing atmospheric dust transport towards the western Mediterranean over 1948–2020. Npj Clim. Atmos. Sci. 2022, 5, 34. [Google Scholar] [CrossRef]
  109. Kaskaoutis, D.G.; Dumka, U.C.; Rashki, A.; Psiloglou, B.E.; Gavriil, A.; Mofidi, A.; Petrinolia, K.; Karagiannis, D.; Kambezidis, H.D. Analysis of intense dust storms over the eastern Mediterranean in March 2018: Impact on radiative forcing and Athens air quality. Atmos. Environ. 2019, 209, 23–39. [Google Scholar] [CrossRef]
  110. Yang, L.; Hu, Z.; Huang, Z.; Wang, L.; Han, W.; Yang, Y.; Tao, H.; Wang, J. Detection of a dust storm in 2020 by a multi-observation platform over the Northwest China. Remote Sens. 2021, 13, 1056. [Google Scholar] [CrossRef]
Figure 1. Map of Sofia Valley (Google Maps image) with IE-BAS location marked by red asterisk (a) and photo of the sun photometer at Sofia Station (b).
Atmosphere 13 00884 g001
Figure 2. Variations of AOD440 (a) and AOD500 (b) obtained in 2020, 2021, and 2022.
Atmosphere 13 00884 g002
Figure 3. Variation of AE440/870 (a) and AE380/500 (b) obtained in 2020, 2021, and 2022.
Atmosphere 13 00884 g003
Figure 4. Monthly mean values of AOD440 (a), AOD500 (b), AE440/870 (c), and AE380/500 (d) for different years. The values for 2006 and 2007 were obtained by the Microtops II sun photometer. Seasonal mean values of AOD440 (e), AOD500 (f), AE440/870 (g), and AE380/500 (h) for the periods 2020–2021, 2021–2022, and 2020–2022.
Atmosphere 13 00884 g004
Figure 5. Frequency distributions of AOD440 and AOD500 for the periods 5 May 2020 to 28 February 2021 (a,d), 1 March 2021 to 28 February 2022 (b,e), and 5 May 2020 to 28 February 2022 (c,f).
Atmosphere 13 00884 g005
Figure 6. Frequency distributions of AE440/870 and AE380/500 for the periods 5 May 2020 to 28 February 2021 (a,d), 1 March 2021 to 28 February 2022 (b,e), and 5 May 2020 to 28 February 2022 (c,f).
Atmosphere 13 00884 g006
Figure 7. Scatter plots of AOD440 vs. AE440/870 for the periods 5 May 2020 to 28 February 2021 (a) and 1 March 2021 to 28 February 2022 (b).
Atmosphere 13 00884 g007
Figure 8. Volume size distributions (a) and single-scattering albedos (b) of the aerosol particles; HYSPLIT model 120-h back trajectories of the air masses arriving over Sofia at 12:00 UTC at heights of 500 m, 1500 m, and 3000 m AGL (c) and BSC-DREAM8b forecast Saharan dust profiles over Sofia at 12:00 UTC (d) on 23 August 2021.
Atmosphere 13 00884 g008
Figure 9. NASA’s FIRMS fire maps for Bulgaria and adjacent regions for the periods 21–23 August 2021 (a), 12–14 September 2020 (b), and 23–25 August 2021 (c) (https://firms.modaps.eosdis.nasa.gov/, accessed on 15 May 2022).
Atmosphere 13 00884 g009
Figure 10. Volume size distributions (a,b) and single-scattering albedos (c,d) of the aerosol particles; HYSPLIT model 120-h back trajectories of the air masses arriving over Sofia at 06:00 UTC at heights of 3500 m, 4000 m, and 6000 m AGL on 5 August 2021 (e) and at 2000 m, 3500 m, and 4500 m AGL on 17 September 2021 (f) along with BSC-DREAM8b forecast Saharan dust profiles over Sofia at 06:00 UTC (g,h) on 5 August 2021 and 17 September 2021, respectively.
Atmosphere 13 00884 g010
Figure 11. Single-scattering albedos (a), HYSPLIT model 120-h back trajectories of the air masses arriving over Sofia at 06:00 UTC at heights of 500 m, 1500 m, and 3000 m AGL (b), and BSC-DREAM8b forecast Saharan dust profiles over Sofia at 06:00 UTC (c) on 8 November 2021.
Atmosphere 13 00884 g011
Figure 12. Volume size distributions (a,b) and single-scattering albedos (c,d) of the aerosol particles; HYSPLIT model 120-h back trajectories of the air masses arriving over Sofia at 06:00 UTC at heights of 1000 m, 2000 m and 8000 m AGL on 12 October 2020 (e) and at 1000 m, 2000 m, and 4000 m AGL on 14 August 2021 (f) and BSC-DREAM8b forecast Saharan dust profiles over Sofia at 06:00 UTC (g,h) on 12 October 2020 and 14 August 2021, respectively.
Atmosphere 13 00884 g012
Figure 13. Volume size distributions (a) and single-scattering albedos (b) of the aerosol particles; HYSPLIT model 120-h back trajectories of the air masses arriving over Sofia at 12:00 UTC at heights of 1000 m, 3000 m and 7000 m AGL (c) and BSC-DREAM8b forecast Saharan dust profiles over Sofia at 12:00 UTC (d) on 1 November 2020.
Atmosphere 13 00884 g013
Figure 14. Volume size distributions (a) and single-scattering albedos (b) of the aerosol particles; HYSPLIT model 120-h back trajectories of the air masses arriving over Sofia at 12:00 UTC at heights of 500 m, 1500 m, and 3000 m AGL (c) and BSC-DREAM8b forecast Saharan dust profile over Sofia at 12:00 UTC (d) on 18 August 2021.
Atmosphere 13 00884 g014
Figure 15. Volume size distributions (a) and single-scattering albedos (b) of the aerosol particles; HYSPLIT model 120-h back trajectories of the air masses arriving over Sofia at 06:00 UTC at heights of 1000 m, 2000 m, and 3500 m AGL (c) and BSC-DREAM8b forecast Saharan dust profile over Sofia at 06:00 UTC (d) on 19 July 2021.
Atmosphere 13 00884 g015
Table 1. Statistical characteristics of the aerosol optical depths AOD440 and AOD500 and the Ångström exponents AE440/870 and AE380/500.
PeriodParameterTotal NumberMeanStandard DeviationMinMedianMaxSkewness
5 May 2020–28 February 2021AOD44096780.180.090.030.160.661.20
AE440/87096781.410.320.291.492.04−1.01
AOD500
AE380/500
9678
9678
0.15
1.29
0.08
0.31
0.02
0.19
0.13
1.34
0.61
2.10
1.27
−0.95
1 March 2021–28 February 2022AOD440159310.220.120.040.180.770.87
AE440/870
AOD500
AE380/500
15931
15931
15931
1.48
0.18
1.34
0.37
0.11
0.27
0.25
0.03
0.36
1.61
0.15
1.40
2.08
0.64
1.95
−1.24
0.88
−1.09
5 May 2020–28 February 2022AOD440256090.200.110.030.170.771.03
AE440/870256091.450.350.251.562.08−1.13
AOD500256090.170.100.020.140.641.05
AE380/500256091.320.290.191.382.10−1.07
Table 2. Percentage of realizations with AOD < 0.05, 0.1, 0.2, or 0.3 or AE < 0.8 or 1.4.
PeriodParameterAOD < 0.05
(%)
AOD < 0.1
(%)
AOD < 0.2
(%)
AOD < 0.3
(%)
ParameterAE < 0.8
(%)
AE < 1.4
(%)
5 May 2020–28 February 2021AOD4402.7219.4967.4889.59AE440/8706.1937.74
AOD5005.5627.9378.7993.83AE380/500857.76
1 March 2021–28 February 2022AOD4400.9818.2854.477.07AE440/8709.4627.46
AOD5002.4128.8965.2383.18AE380/5006.9249.68
5 May 2020–28 February 2022AOD4401.6418.7459.3481.8AE440/8708.2231.34
AOD5003.628.5370.3587.21AE380/5007.3352.73
Table 3. Meteorological parameters.
DateTemperature (°C)Dew Point
(°C)
Wind Speed
(m/s)
Visibility
(km)
Precipitation 24 h (l/m2)
14 September 202021.2111.118–250
12 October 202015.311.2112–200
1 November 20208.12.70.88–252.7
19 July 202122.517.21.612–200
5 August 202127.713.51.510–200
14 August 202123.513.41.620–250
18 August 202120.912.9415–251.5
23 August 202123.311.11.920–250
25 August 202119.314.61.39–250
17 September 202120.814.21.116–280
8 November 202112.88.71.312–250
Table 4. AERONET daily mean values of the aerosol optical depths AOD440, AOD500, AODf500, and AODc500, and of the Ångström exponents AE440/870 and AE380/500. Range of the retrieved values of the particle sphericity factor (SF), linear depolarization ratio (DR), and refractive index real part nr440.
DateAOD440AOD500AODf500AODc500AE440/870AE380/500SF (%)DR440nr440
14 September 20200.36 ± 0.090.30 ± 0.080.24 ± 0.070.06 ± 0.011.52 ± 0.041.40 ± 0.080.6–67.20.022–0.1331.35–1.56
12 October 20200.23 ± 0.010.19 ± 0.010.17 ± 0.010.01 ± 0.011.74 ± 0.121.37 ± 0.0498.6–99.00.0021.36–1.43
1 November 20200.05 ± 0.010.04 ± 0.010.03 ± 0.010.01 ± 0.0021.25 ± 0.111.12 ± 0.1460.3–99.00.004–0.0331.43–1.58
19 July 20210.46 ± 0.070.39 ± 0.050.29 ± 0.070.10 ± 0.021.34 ± 0.191.29 ± 0.093.7–28.90.086–0.1321.46–1.51
5 August 20210.43 ± 0.020.39 ± 0.020.17 ± 0.020.22 ± 0.010.67 ± 0.100.79 ± 0.121.0–4.40.091–0.1391.40–1.49
14 August 20210.29 ± 0.040.24 ± 0.030.22 ± 0.030.01 ± 0.0021.85 ± 0.021.51 ± 0.0393.2–99.00.002–0.0051.44–1.50
18 August 20210.43 ± 0.070.37 ± 0.050.27 ± 0.050.09 ± 0.011.37 ± 0.101.29 ± 0.073.0–20.30.104–0.1311.51–1.54
23 August 20210.36 ± 0.020.30 ± 0.020.28 ± 0.020.01 ± 0.0021.90 ± 0.031.47 ± 0.0491.7–99.00.002–0.0051.40–1.57
25 August 20210.64 ± 0.090.53 ± 0.070.51 ± 0.080.02 ± 0.0041.83 ± 0.031.37 ± 0.0799.00.0021.53
17 September 20210.29 ± 0.020.27 ± 0.020.10 ± 0.0040.17 ± 0.020.52 ± 0.040.65 ± 0.050.4–20.70.107–0.1411.49–1.51
8 November 20210.30 ± 0.050.26 ± 0.050.13 ± 0.020.13 ± 0.040.78 ± 0.130.77 ± 0.095.9–99.00.002–0.1481.47–1.51
Publisher’s Note: MDPI stays neutral with regard to jurisdictional claims in published maps and institutional affiliations.