Abstract
Satellite remote sensing for air quality assessment provides information over a large spatial coverage and time period that shows the trends and effects of anthropogenic activities. Using data collected from the Moderate Resolution Imaging Spectroradiometer (MODIS) Terra satellite from the years 2010 to 2020, the spatiotemporal variations to aerosol optical depth (AOD) in Koronadal City and Quezon City were studied. Validation showed a strong relationship between the MODIS AOD values and the Aerosol Robotic Network (AERONET) AOD values (R2 = 0.83) and a low root mean square error (RMSE) of 0.26. Annual variation in the AOD of the two study areas showed a peak AOD value in 2015 due to an immense biomass burning in Indonesia and a low AOD value in 2020 due to the COVID-19 lockdown. Koronadal City experienced a high AOD value during the fall season due to aerosols from biomass burning in Indonesia that were carried by the southwest monsoon. Quezon City experienced a high AOD value during spring from increased local sources, as well as long-range transport pollutants from East Asia that were carried by northeasterly winds. Overall, this study provides an understanding of the spatiotemporal variations in aerosols in the Philippines, which could be used in environmental management, air quality regulations, and health assessment studies. This shows the urgency of monitoring and mitigating poor air quality in the Philippines.
1. Introduction
Air pollution, including atmospheric aerosols, is the effect of not only local emissions but also foreign emissions from surrounding areas. The amount of air pollution transported depends on the country’s topography and weather. Because of its growing industry, the anthropogenic emissions in Asia are greater than those in Europe and America. Residents of Asia are nine times more exposed to air pollution than their European and American counterparts. The primary source of these pollutants is emissions from the fuel combustion of motor vehicles [1]. Air pollution is currently considered as the largest environmental risk factor [2].
Atmospheric aerosols refer to suspended particles with a diameter of less than 10 µm. Aerosols can be in the form of natural sources, such as dust, sea salts, and volcanic ash, or can be from anthropogenic sources, such as the combustion of fossil fuels and biomass burning. Aerosol particles can affect the estimation of global and regional climate change as well as cloud formation [3,4,5] through their interaction with incoming solar radiation [6]. Some aerosols may pose risks to health and increase the likelihood of developing certain diseases, including pulmonary diseases, neonatal diseases, diabetes, and cerebrovascular diseases [7,8]. It is important to study the characteristics of atmospheric aerosols, as well as their spatial and temporal variations, so as to evaluate their roles in atmospheric dynamics and as health risks.
Aerosols can be evaluated using different parameters: the aerosol optical depth (AOD), single scatter albedo (SSA), Ångström exponent (AE), and the complex refractive index. The AOD value represents the geographical distribution of aerosols or the column-integrated mass distribution. The AE is an optical property of an aerosol that measures the wavelength dependence in aerosol absorption, as well as a qualitative indicator of the size distribution of the aerosol [5,9]. There are several networks providing ground-based measurements of aerosol properties, such as the Aerosol Robotic Network (AERONET) [10], SKYNET [11], and Sun-Sky Radiometer Observation Network (SONET) [12]. However, there are still regions and areas with few studies and little to no monitoring [13,14]. Furthermore, the data measured at each site can only account for a small area. Therefore, the high demand for information about aerosol properties on a wide scale cannot be met at present.
In the last few years, the process of remote aerosol retrieval from satellite sensors has progressed. One of these advancements is the derivation of aerosol products from the Moderate Resolution Imaging Spectroradiometer (MODIS) onboard NASA’s (National Aeronautics and Space Administration) Terra and Aqua satellites. Studies of and improvements to MODIS show that retrievals fall within the acceptable accuracy values [15]. There have been studies about aerosol trends in the Philippines [16,17,18,19,20,21]. Studies by [19,22] show that the Philippines, a maritime country, has the highest AOD concentration during October. This is due to the strong land and sea breeze created by warmer land surface temperatures. Long-range transport of anthropogenic emissions from East Asia and Indonesia also contributes to the elevated concentrations of aerosols [23,24,25].
This study aims to examine the annual and seasonal spatiotemporal variations in AOD values in the Philippines from 2010 to 2020, based on MODIS data at a spatial resolution of 10-by-10 array of 1 km pixels, and the V6.1 algorithm developed by NASA. The MODIS AOD values were validated with the ground monitoring network AERONET AOD using the CIMEL CE-318 photometer at the Manila Observatory and Notre Dame of Marbel University.
2. Related Literature
The Moderate Resolution Imaging Spectrometer (MODIS) is an instrument onboard NASA’s Earth Observing System (EOS) satellites Terra, launched in December 1999, and Aqua, launched in May 2002. The Terra and Aqua satellites detect a wide spectral range of electromagnetic energy. The MODIS can acquire high radiometric-sensitive images (12 bit) in 36 spectral bands between 0.62 and 14.385 μm with a scanning width of 2330 km. The spatial resolutions of the sensor are 250 m, 500 m, and 1 km in several bands and can sweep the entire Earth surface every 1 to 2 days [26]. While Terra has a morning orbit, with an equator crossing time of 10:30 a.m., Aqua’s is in the afternoon, with an equator crossing time of 1:30 p.m. [27]. MODIS can evaluate the AOD values over land and ocean using the Dark Target (DT) and Deep Blue (DB) algorithms. The DT algorithm measures the AOD in dark vegetative surfaces [15,28,29,30,31] and over the ocean [15,32,33], while the DB algorithm measures the AOD in desert and vegetated surfaces [34,35]. Recent developments to the DB algorithm allow it to include other land areas [36,37,38].
As for ground monitoring networks, the Aerosol Robotic Network (AERONET) is a network of ground-based sun photometers that measure atmospheric aerosol properties. The AERONET employs a CIMEL Electronique 318A spectral radiometer that measures the sun and sky radiances obtained at a number of fixed wavelengths within the visible and near-infrared (VNIR) spectrum [10]. AERONET datasets are available in three quality levels: Level 1.0 (unscreened), Level 1.5 (cloud screened and quality controlled), and Level 2.0 (quality assured) [39]. The AERONET AOD uncertainty is 0.01 for larger wavelengths and 0.02 for shorter wavelengths [9]. Currently, there are approximately 400 stations in 50 countries, with 3 in the Philippines, namely, Manila Observatory in Quezon City, El Nido Airport in El Nido, and Notre Dame of Marbel University in Koronadal City. However, El Nido Airport stopped reporting ground measurements after 2013.
3. Materials and Methods
3.1. Study Area
The study area included two locations in the Philippines: Quezon City (latitude: 14.6° N; longitude 121.1° E; elevation: 63.0 m) and Koronadal City (latitude: 6.5° N; longitude: 124.8° E; elevation: 70.0 m). El Nido was not included because the ground station’s limited data are not sufficient for the decade-long study. Figure 1 shows the location of the study areas, along with the corresponding AERONET ground monitoring stations.
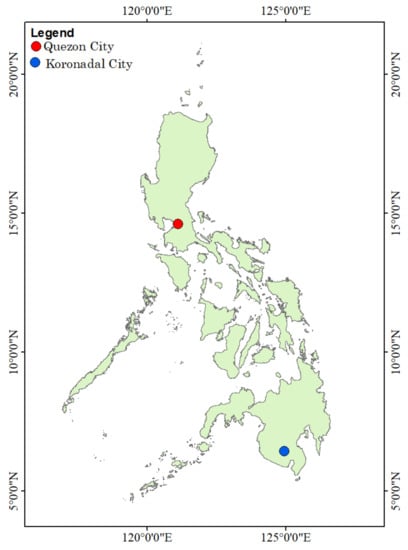
Figure 1.
Satellite overpass points for MODIS data: Quezon City and Koronadal City.
The Philippines is a tropical country and belongs to the Western North Pacific (WNP) boreal summer monsoon region. The wet season is experienced from May to October, while the dry season is experienced the rest of the year. Quezon City (QC) is located in the northeast part of Metropolitan Manila, on Luzon Island. It has a total area of 151.06 km2 [40] and a population of 2,960,048 [41]. The city is situated on the Guadalupe Plateau and is largely rolling, with alternating ridges and lowlands. The lower part of the city has low-grade terrain, while the northern half is undulating and culminates at the Novaliches Reservoir [42]. Koronadal City (KC), on the other hand, is located on Mindanao Island and has a total land area of 277.0 km2. KC is surrounded by the mountain ranges of Roxas and Quezon. In general, the city has gently sloping terrain and 50% of the total land area is predominantly flat [43]. The latest Philippine Statistics Authority (PSA) census puts the total population of the city at 195,398 [41]. QC has an urbanization level of 100%, while KC has an urbanization level of 75.8% [44].
3.2. Dataset
The MODIS AOD data that were downloaded from the Terra satellite are reported in Level 2 (L2) granule-based and Level 3 (L3) global-gridded products. Daily MODIS AOD Level 2 products (MOD04_L2) at 10 km swaths from 2010 to 2020 were used for the analysis of AOD trends. In this study, the Deep Blue algorithm was utilized. The DB algorithm retrieves AOD data at 550 nm over global land in cloud-free and snow/ice-free scenes. Quality flags are also produced with each retrieval to ensure quality of retrieved AOD product.
To validate MODIS AOD data, this study used AERONET AOD data at Level 2.0, which are quality assured, meaning that they are cloud-screened and quality-controlled [10]. The study used the data from the two AERONET stations in the Philippines. These are located within the study areas, namely, Manila Observatory in QC and Notre Dame of Marbel University in KC.
3.3. Pre-Processing
The MODIS Terra reports AOD values at 550 nm; therefore, the following sub-dataset was extracted and then projected into 10 km grids:
Deep_Blue_Aerosol_Optical_Depth_550_Land.
The collected AERONET AOD data included the following: the acquisition time, AOD value at 500 nm, and Ångström exponent at 440 nm to 670 nm. Since the MODIS and AERONET AOD values are reported in different wavelengths, interpolation for AERONET at 550 nm was calculated using Equation (1):
where and are the wavelengths of the MODIS and AERONET, respectively; is the calculated AOD value for AERONET at 550 nm; is the collected AERONET AOD value at 500 nm; and α is the Ångström exponent for 440 nm to 670 nm from AERONET [9]. AERONET AOD measurements within ± 30 min of MODIS overpass time were considered.
3.4. Statistical Analysis
To extract the MODIS AOD values, a 3-by-3 pixel array centered at the study area ground site was set up. A condition requiring a minimum of 6 valid pixels was imposed on the extracted MODIS AOD data to minimize possible gaps. The mean of the pixel values was then compared with the corresponding AERONET AOD.
The data were analyzed using the following criteria: the arithmetic mean (), standard deviation (), coefficient of determination (R2), and root mean square error (RMSE).
where and are the arithmetic means of the MODIS and AERONET AOD, and and are the AOD values at time , with number of samples.
An error of estimation was also presented using the following equation [45]:
3.5. Air Mass Back-Trajectory
Analysis of the wind back-trajectories was undertaken using the Hybrid Single-Particle Lagrangian Integrated Trajectory (HYSPLIT) model [46]. Meteorological conditions were determined using the NCEP/NCAR Reanalysis meteorological datasets [47]. Trajectories were calculated based on three altitude endpoints: 100 m, 500 m, and 1000 m. One trajectory was simulated every 6 h. Backward trajectory times for 72 h windows were plotted. Each measured airmass was associated with its corresponding 72 h end observation location.
4. Results and Discussion
4.1. Satellite Data Validation
Validation of MODIS data was undertaken by comparing the MODIS AOD values to the AERONET AOD values. There were a total of 213 MODIS AOD datapoints with corresponding AERONET AOD values. For QC, there were no available data for the years 2016, 2017, 2019, and 2020, while for KC there were no available data for 2018. This is because either their acquisition time were not within the ± 30 min AERONET measurement time, their locations are not within the 3-by-3 pixel array, or they had fewer than six valid pixels. Table 1 shows the summary of the number of annual data from the MODIS AOD matched with the AERONET data used for the analysis for each study area. High cloud cover and particularly optically thin cirrus pose challenges in AOD retrieval and quality for both ground-based and satellite data measurements [48,49]. Coverage limitations due to the contamination of clouds and site limitations are the primary cause of low data volumes in Southeast Asia, including the Philippines.

Table 1.
Number of yearly MODIS AOD data with corresponding AERONET AOD data used in the analysis in each study area.
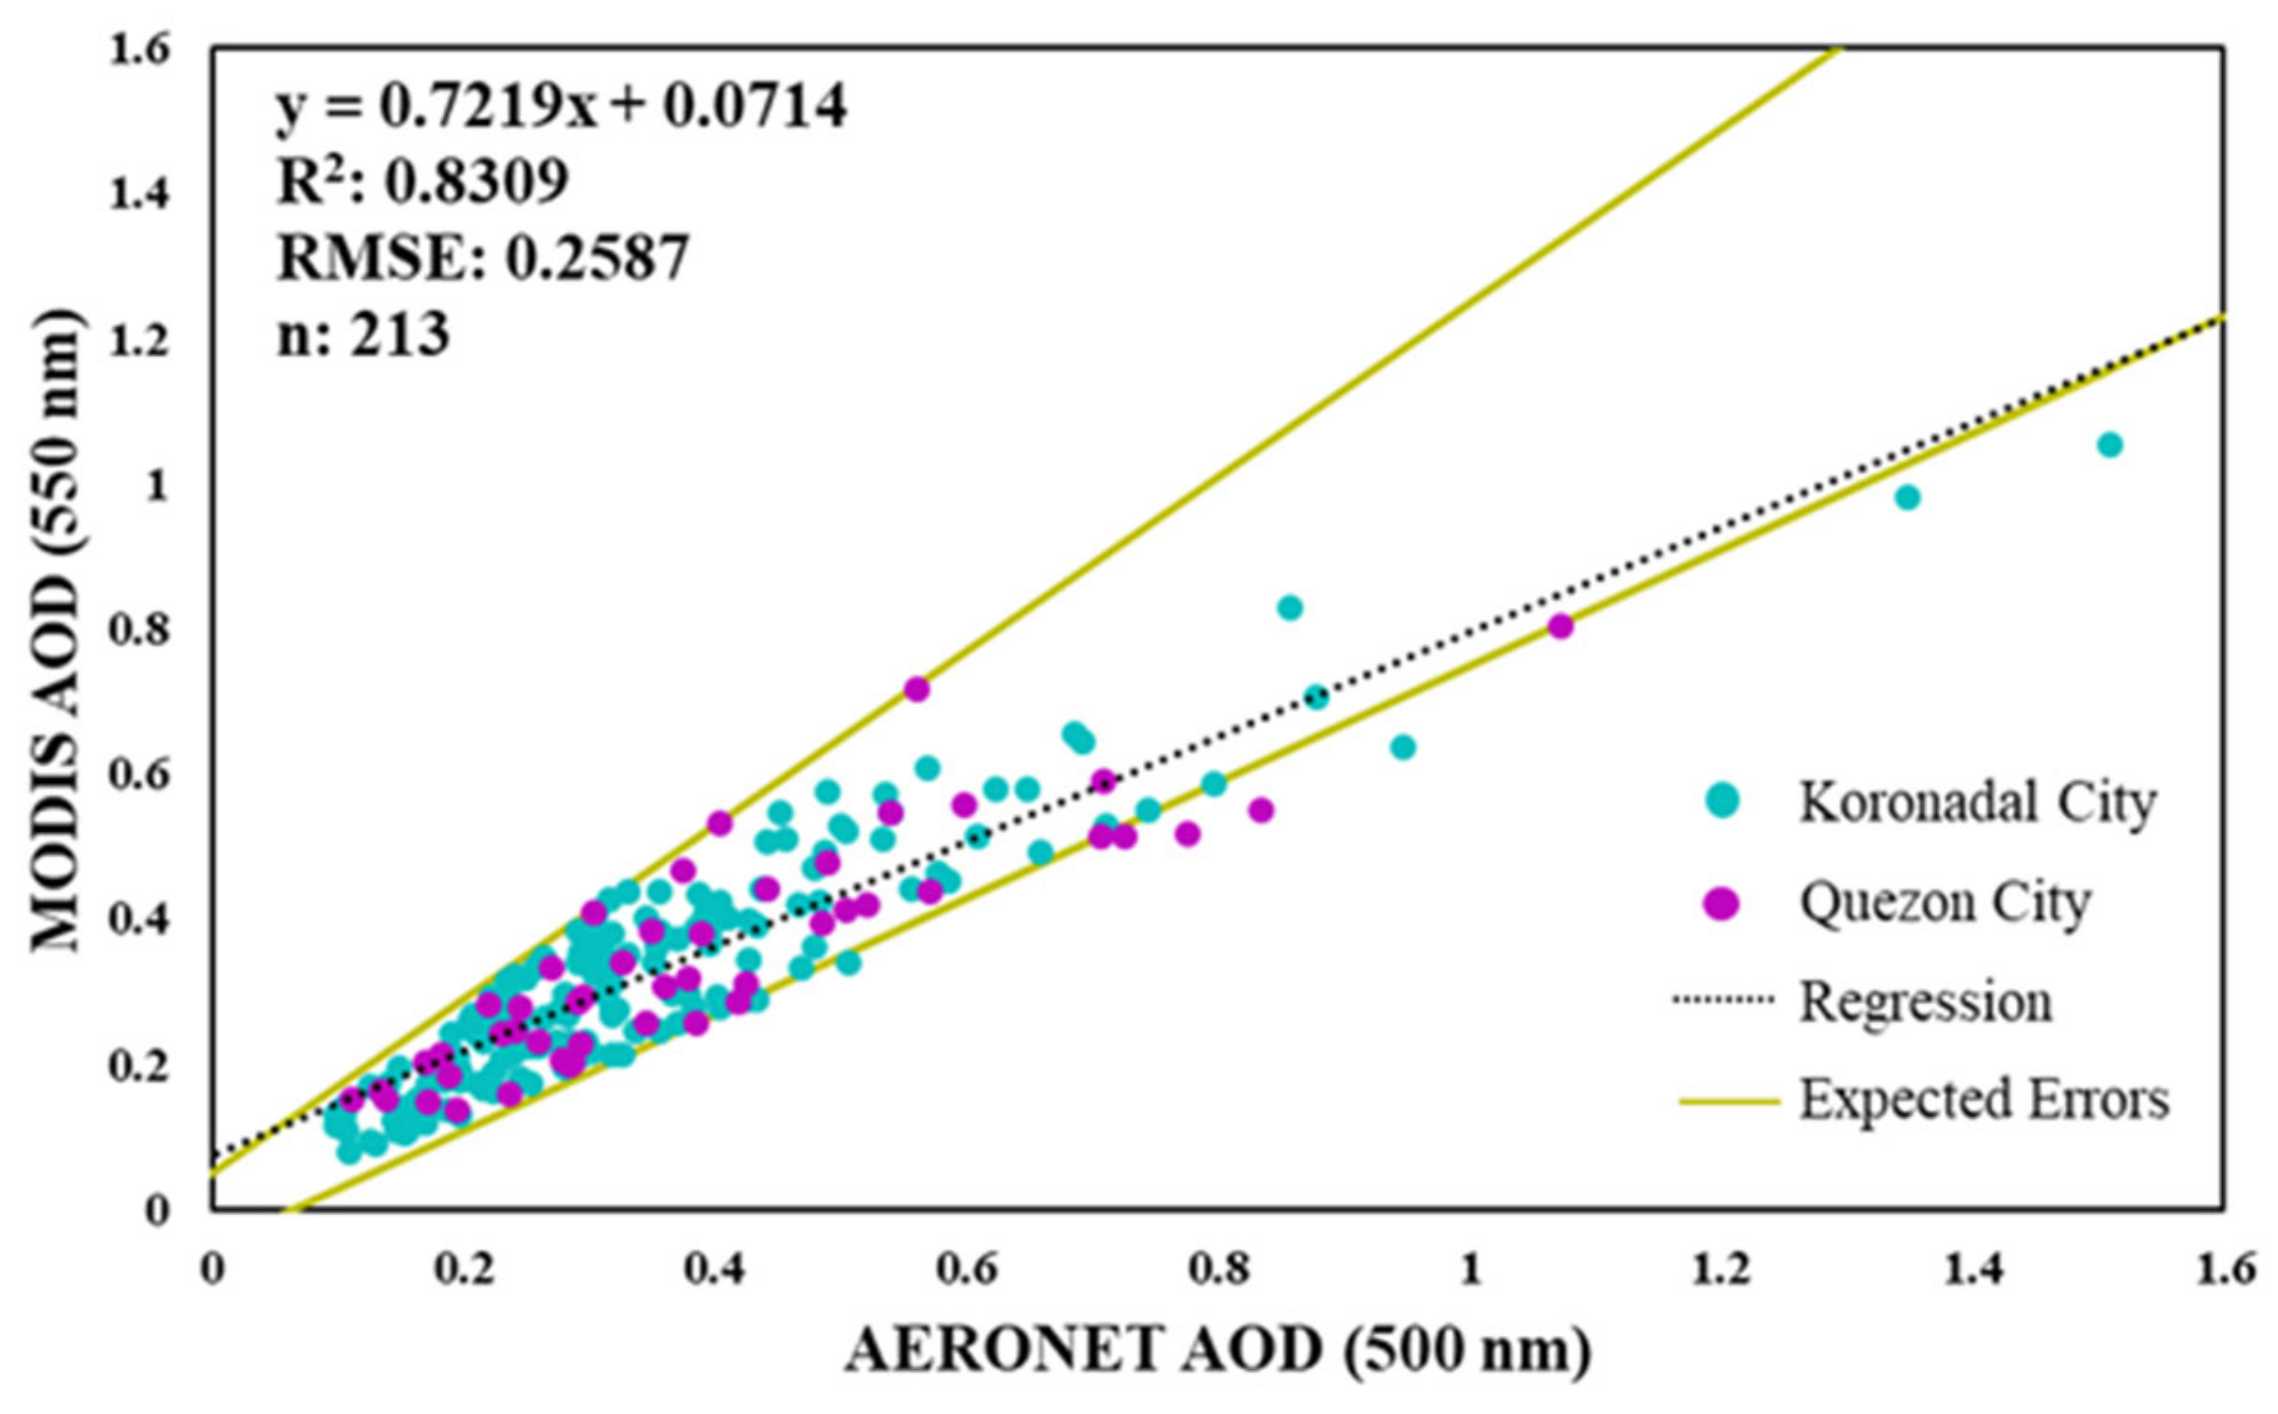
The scatterplot shown in Figure 2 depicts the correlation of MODIS AOD data and AERONET AOD data from 2010 to 2020. The results show that the R2 value for the data was relatively high (0.83). Based on the equation of the scatterplot, the coefficient is less than 1 (0.73). This means that the MODIS AOD values were less than the AERONET AOD values. This is in contrast to previous studies showing that the MODIS AOD overestimates AERONET AOD values [50,51,52]. This could be due to the standard deviation of the MODIS AOD values (0.16). The results also show that the satellite data had an arithmetic mean of 0.33 and a low RMSE (0.26).

Figure 2.
Scatterplot of MODIS AOD versus AERONET AOD from 2010 to 2020. A total of 213 samples were used in the analysis. Computed R2 is 0.83 and RMSE is 0.26.
4.2. Annual Variation
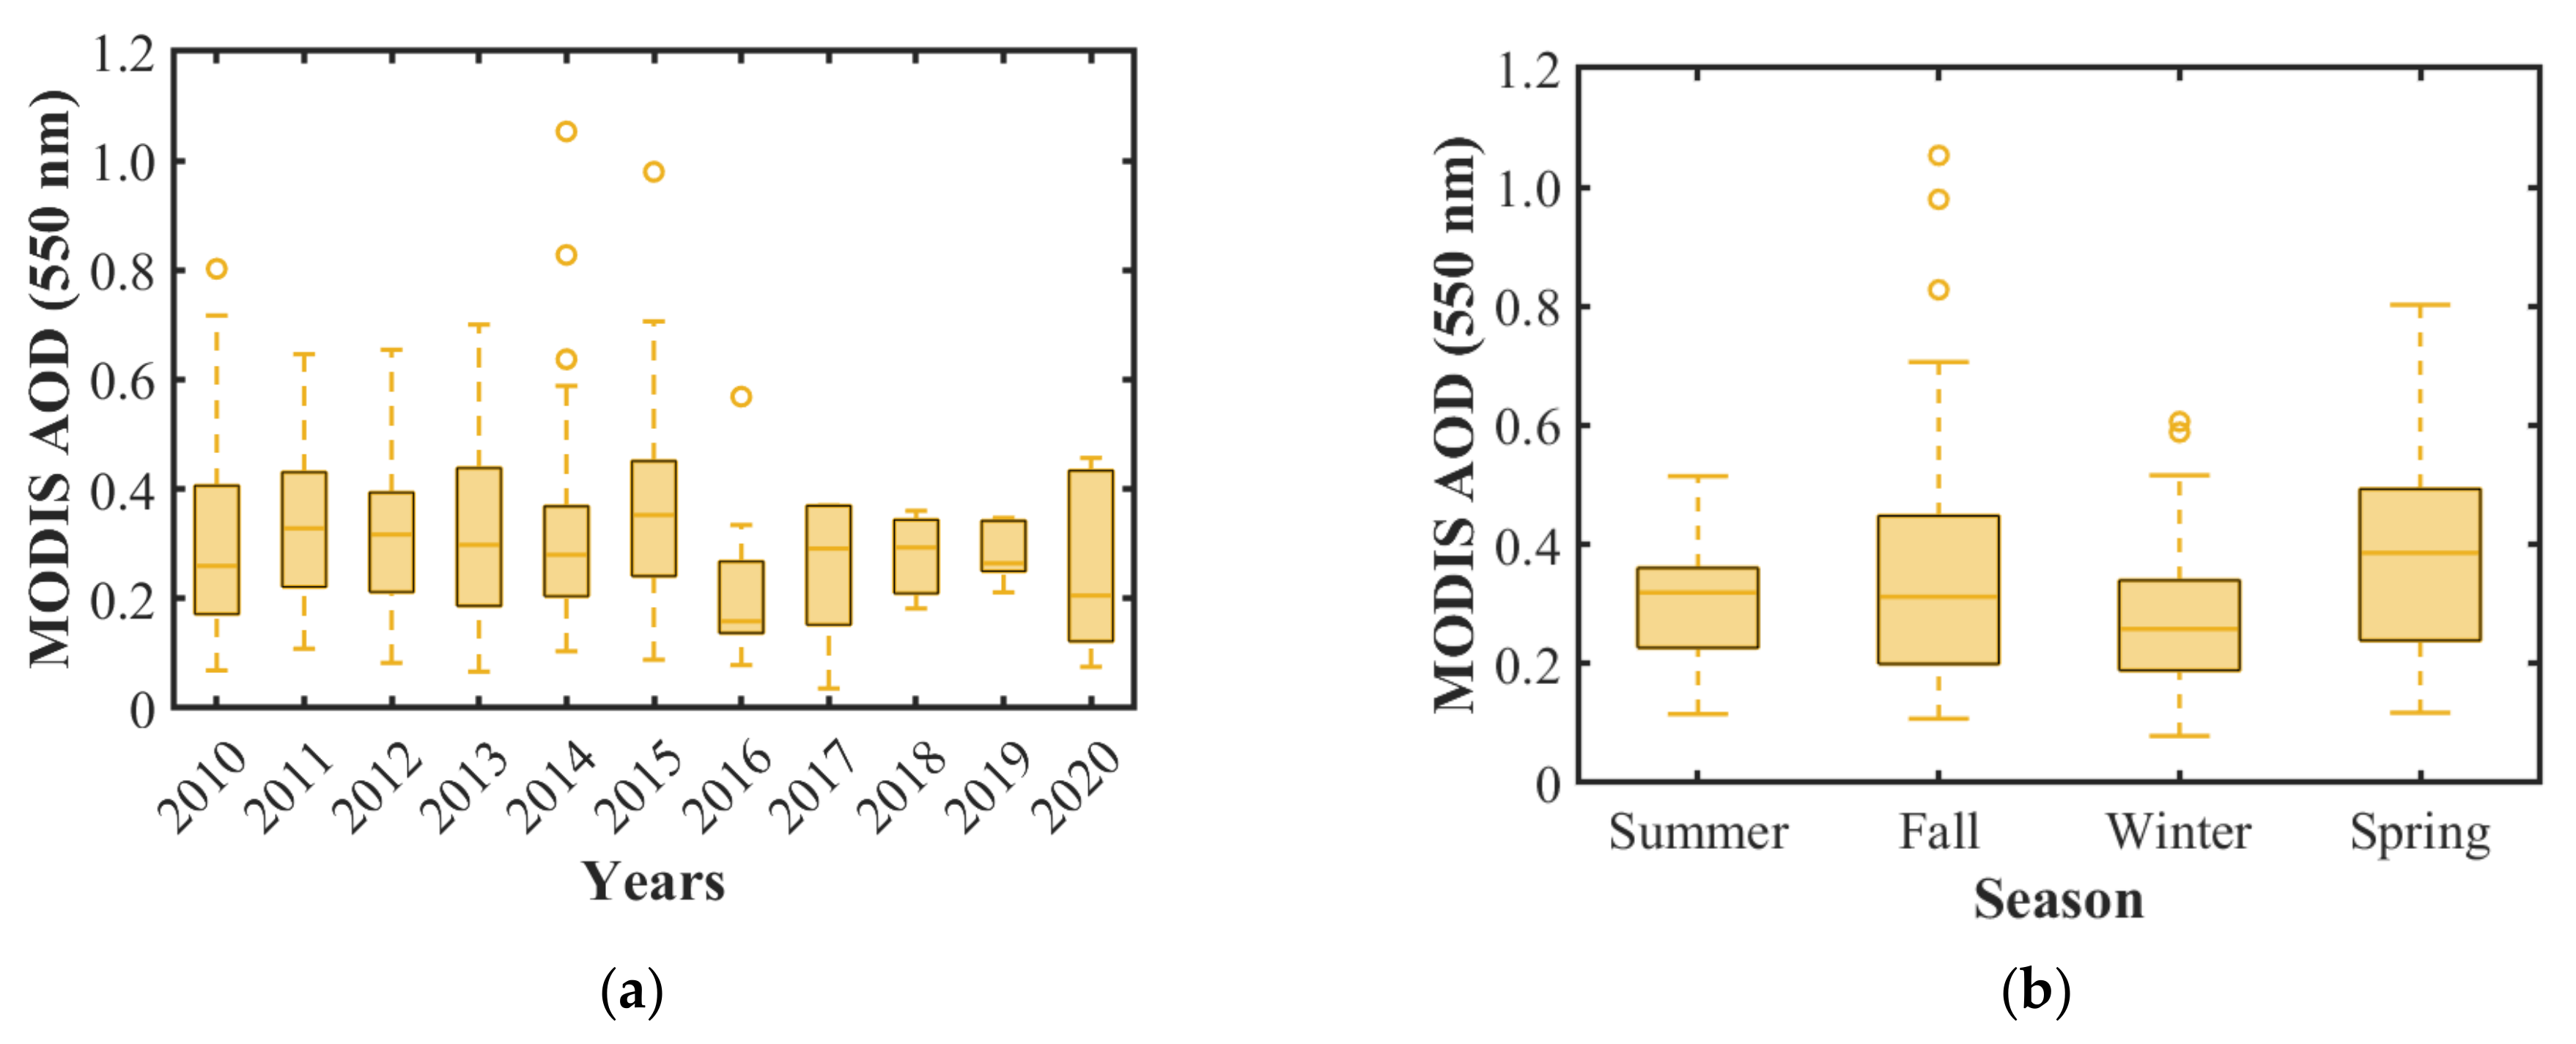
Figure 3a,b show the boxplots for the combined annual and seasonal trends in satellite AOD data. The hollow circles in the graph represent outliers in the data. For the Philippines, the months June, July, and August (JJA); September, October, and November (SON); December, January, and February (DJF); and March, April, and May (MAM) are referred to as summer, fall, winter, and spring, respectively. As shown in Figure 3a, the year 2014 recorded the highest satellite AOD value, as evidenced by an outlier; however, overall, 2015 had the highest mean for the AOD values. There was a general upward trend of AOD values from 2010 to 2015, but it suddenly declined in 2016.
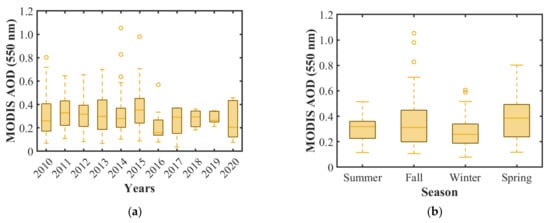
Figure 3.
Boxplots of combined mean MODIS AOD values in the two study areas, Koronadal City and Quezon City: (a) annual and (b) seasonal.
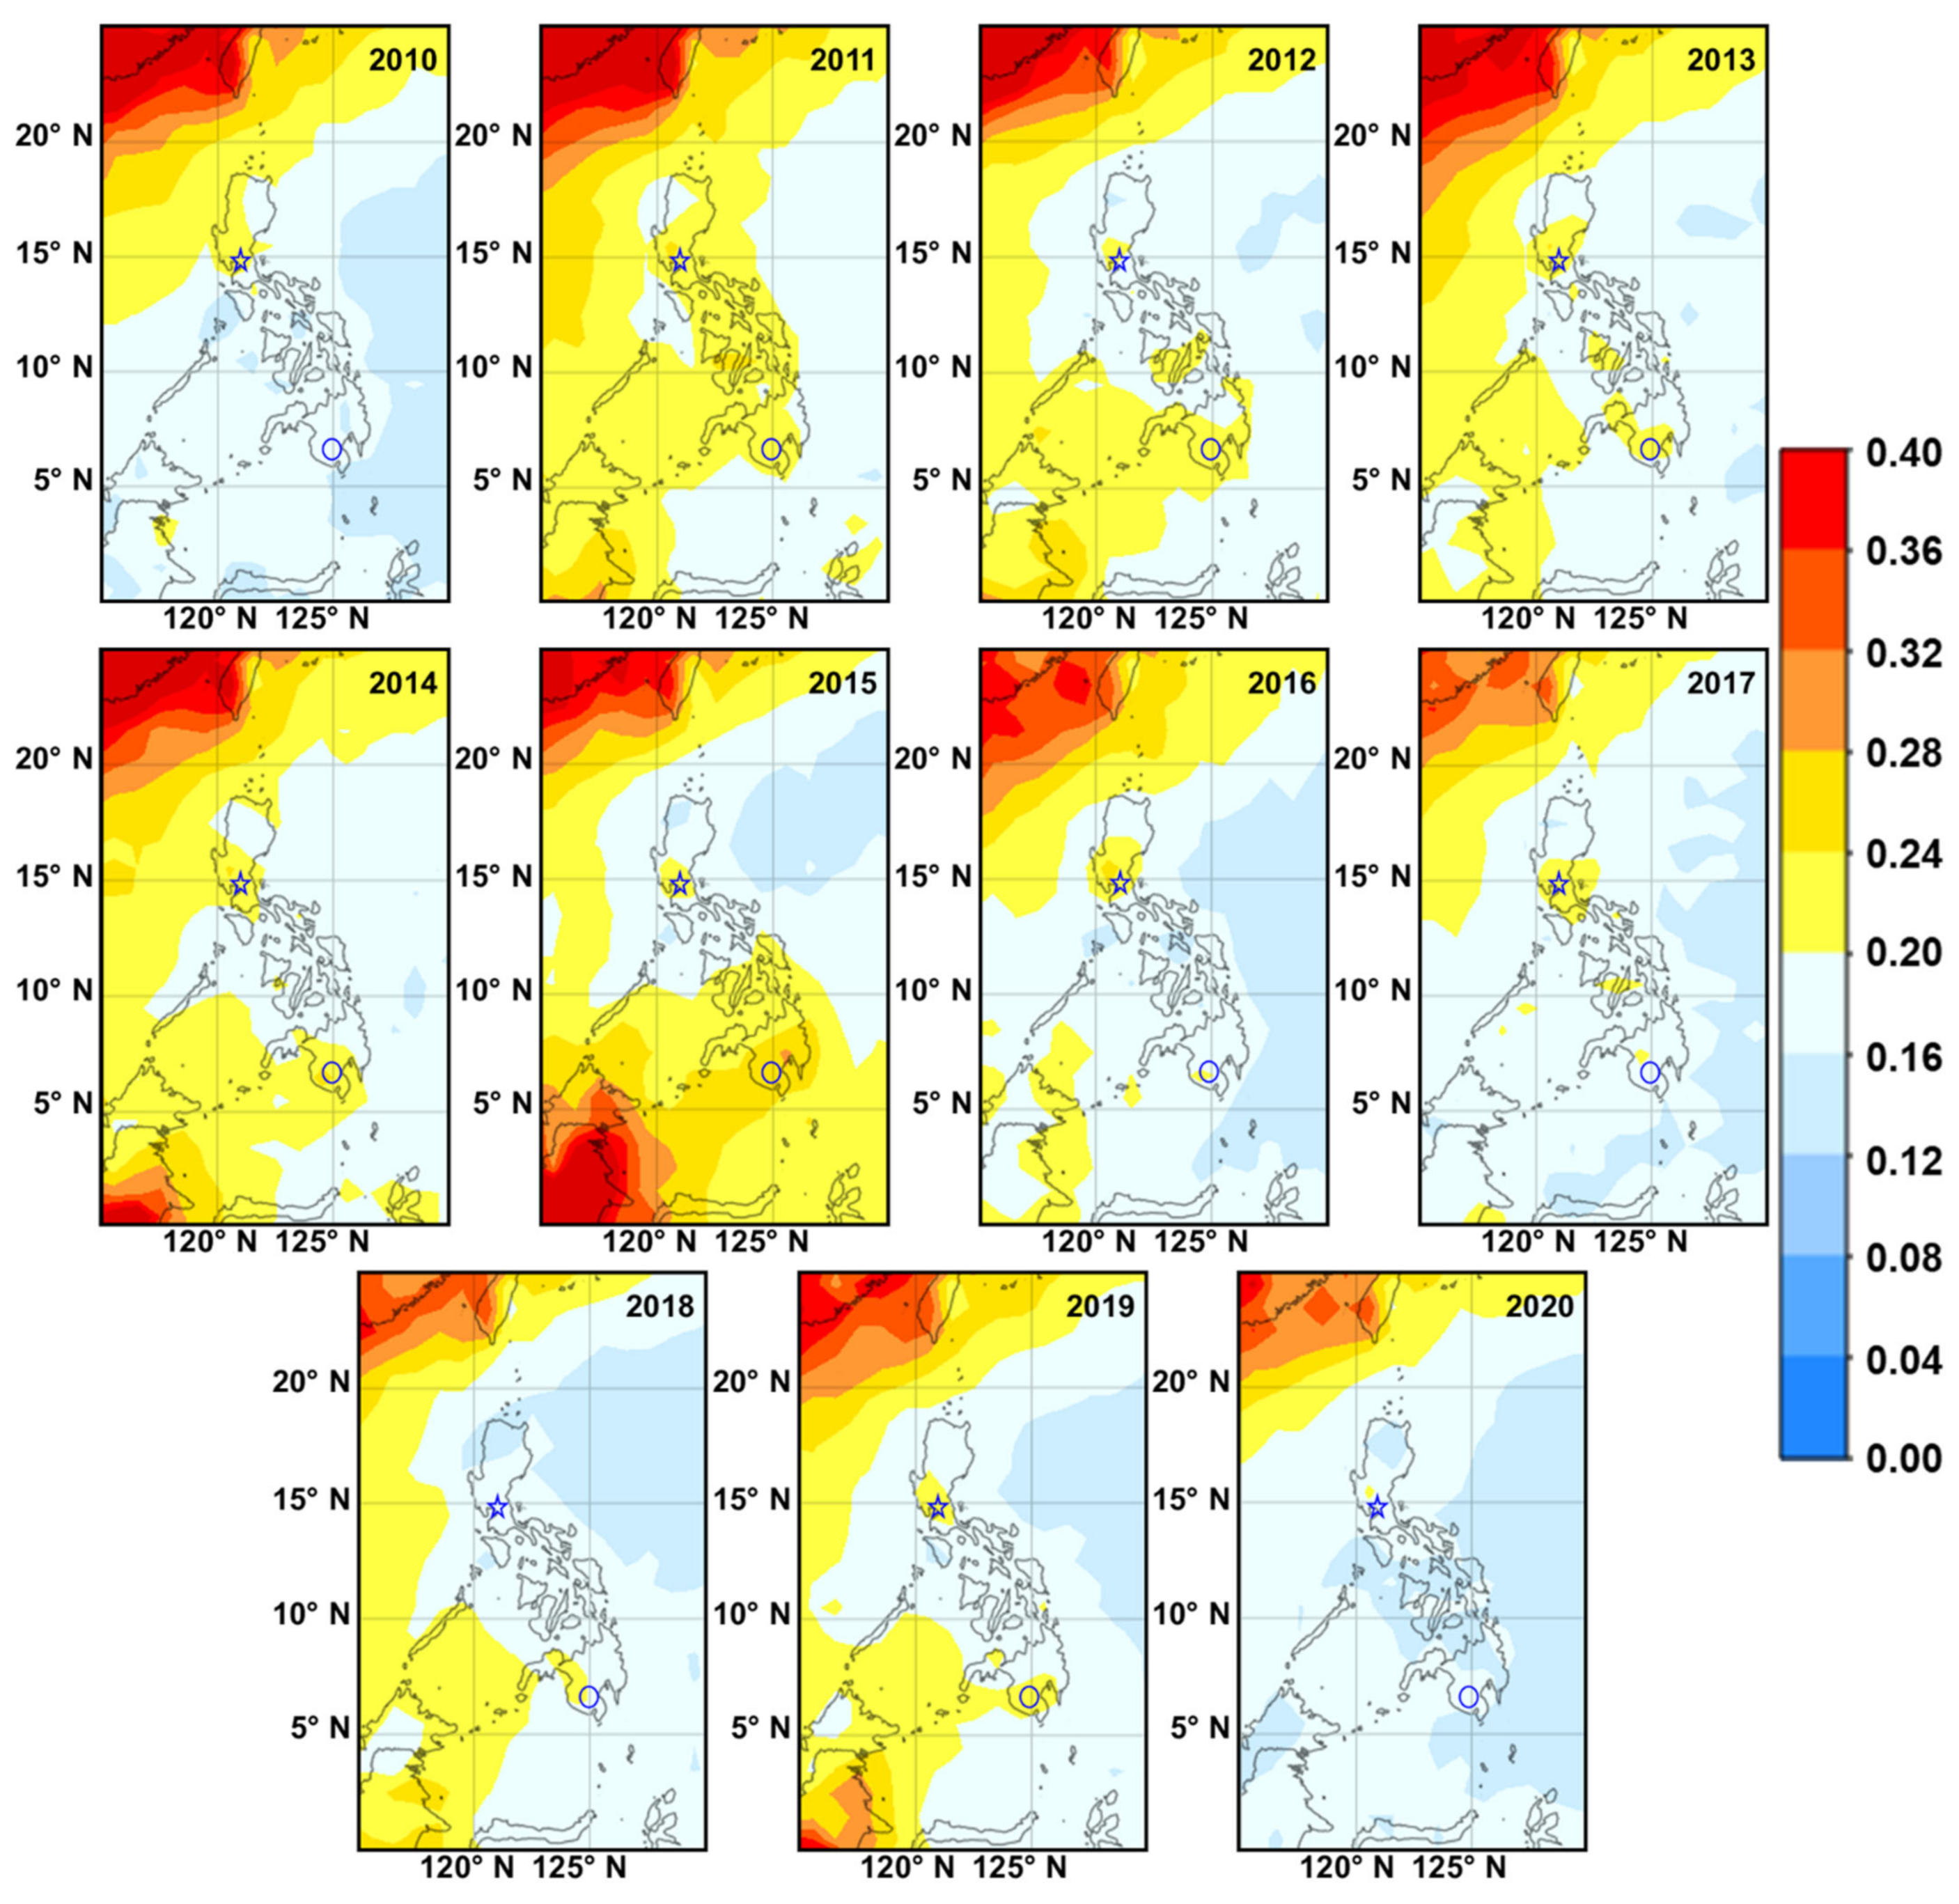
Figure 4 shows the spatial distribution of the mean annual AOD value for the Philippines. The figure suggests a high AOD concentration in the East Asian and Indonesian areas, whereas the Pacific has relatively low AOD values. Eastern China showed continuously high AOD readings within the study years. High mean AOD values in China were due to continuous economic growth and energy consumption [53,54]. Meanwhile, the high AOD values for Indonesia were due to biomass burning. In 2015, Indonesia experienced extensive biomass burning due to El Niño-induced droughts [55,56]. Another major biomass burning event occurred in 2019, resulting in high AOD levels in Indonesia and nearby countries [57,58]. These haze events occur typically from July to October, during the country’s dry season [57,59]. These high AOD levels also affect the Philippines. Low AOD values were recorded for 2020 due to the effects of the COVID-19 pandemic and lockdown. This is because strict lockdown protocols in the Philippines restricted the economic production, consumption activities, and transportation of the primary sources of atmospheric aerosols [60,61,62].

Figure 4.
Spatial distribution of mean annual MODIS AOD values from 2010 to 2020 in the Philippines. Note that “☆” corresponds to Quezon City and “◯” corresponds to Koronadal City.
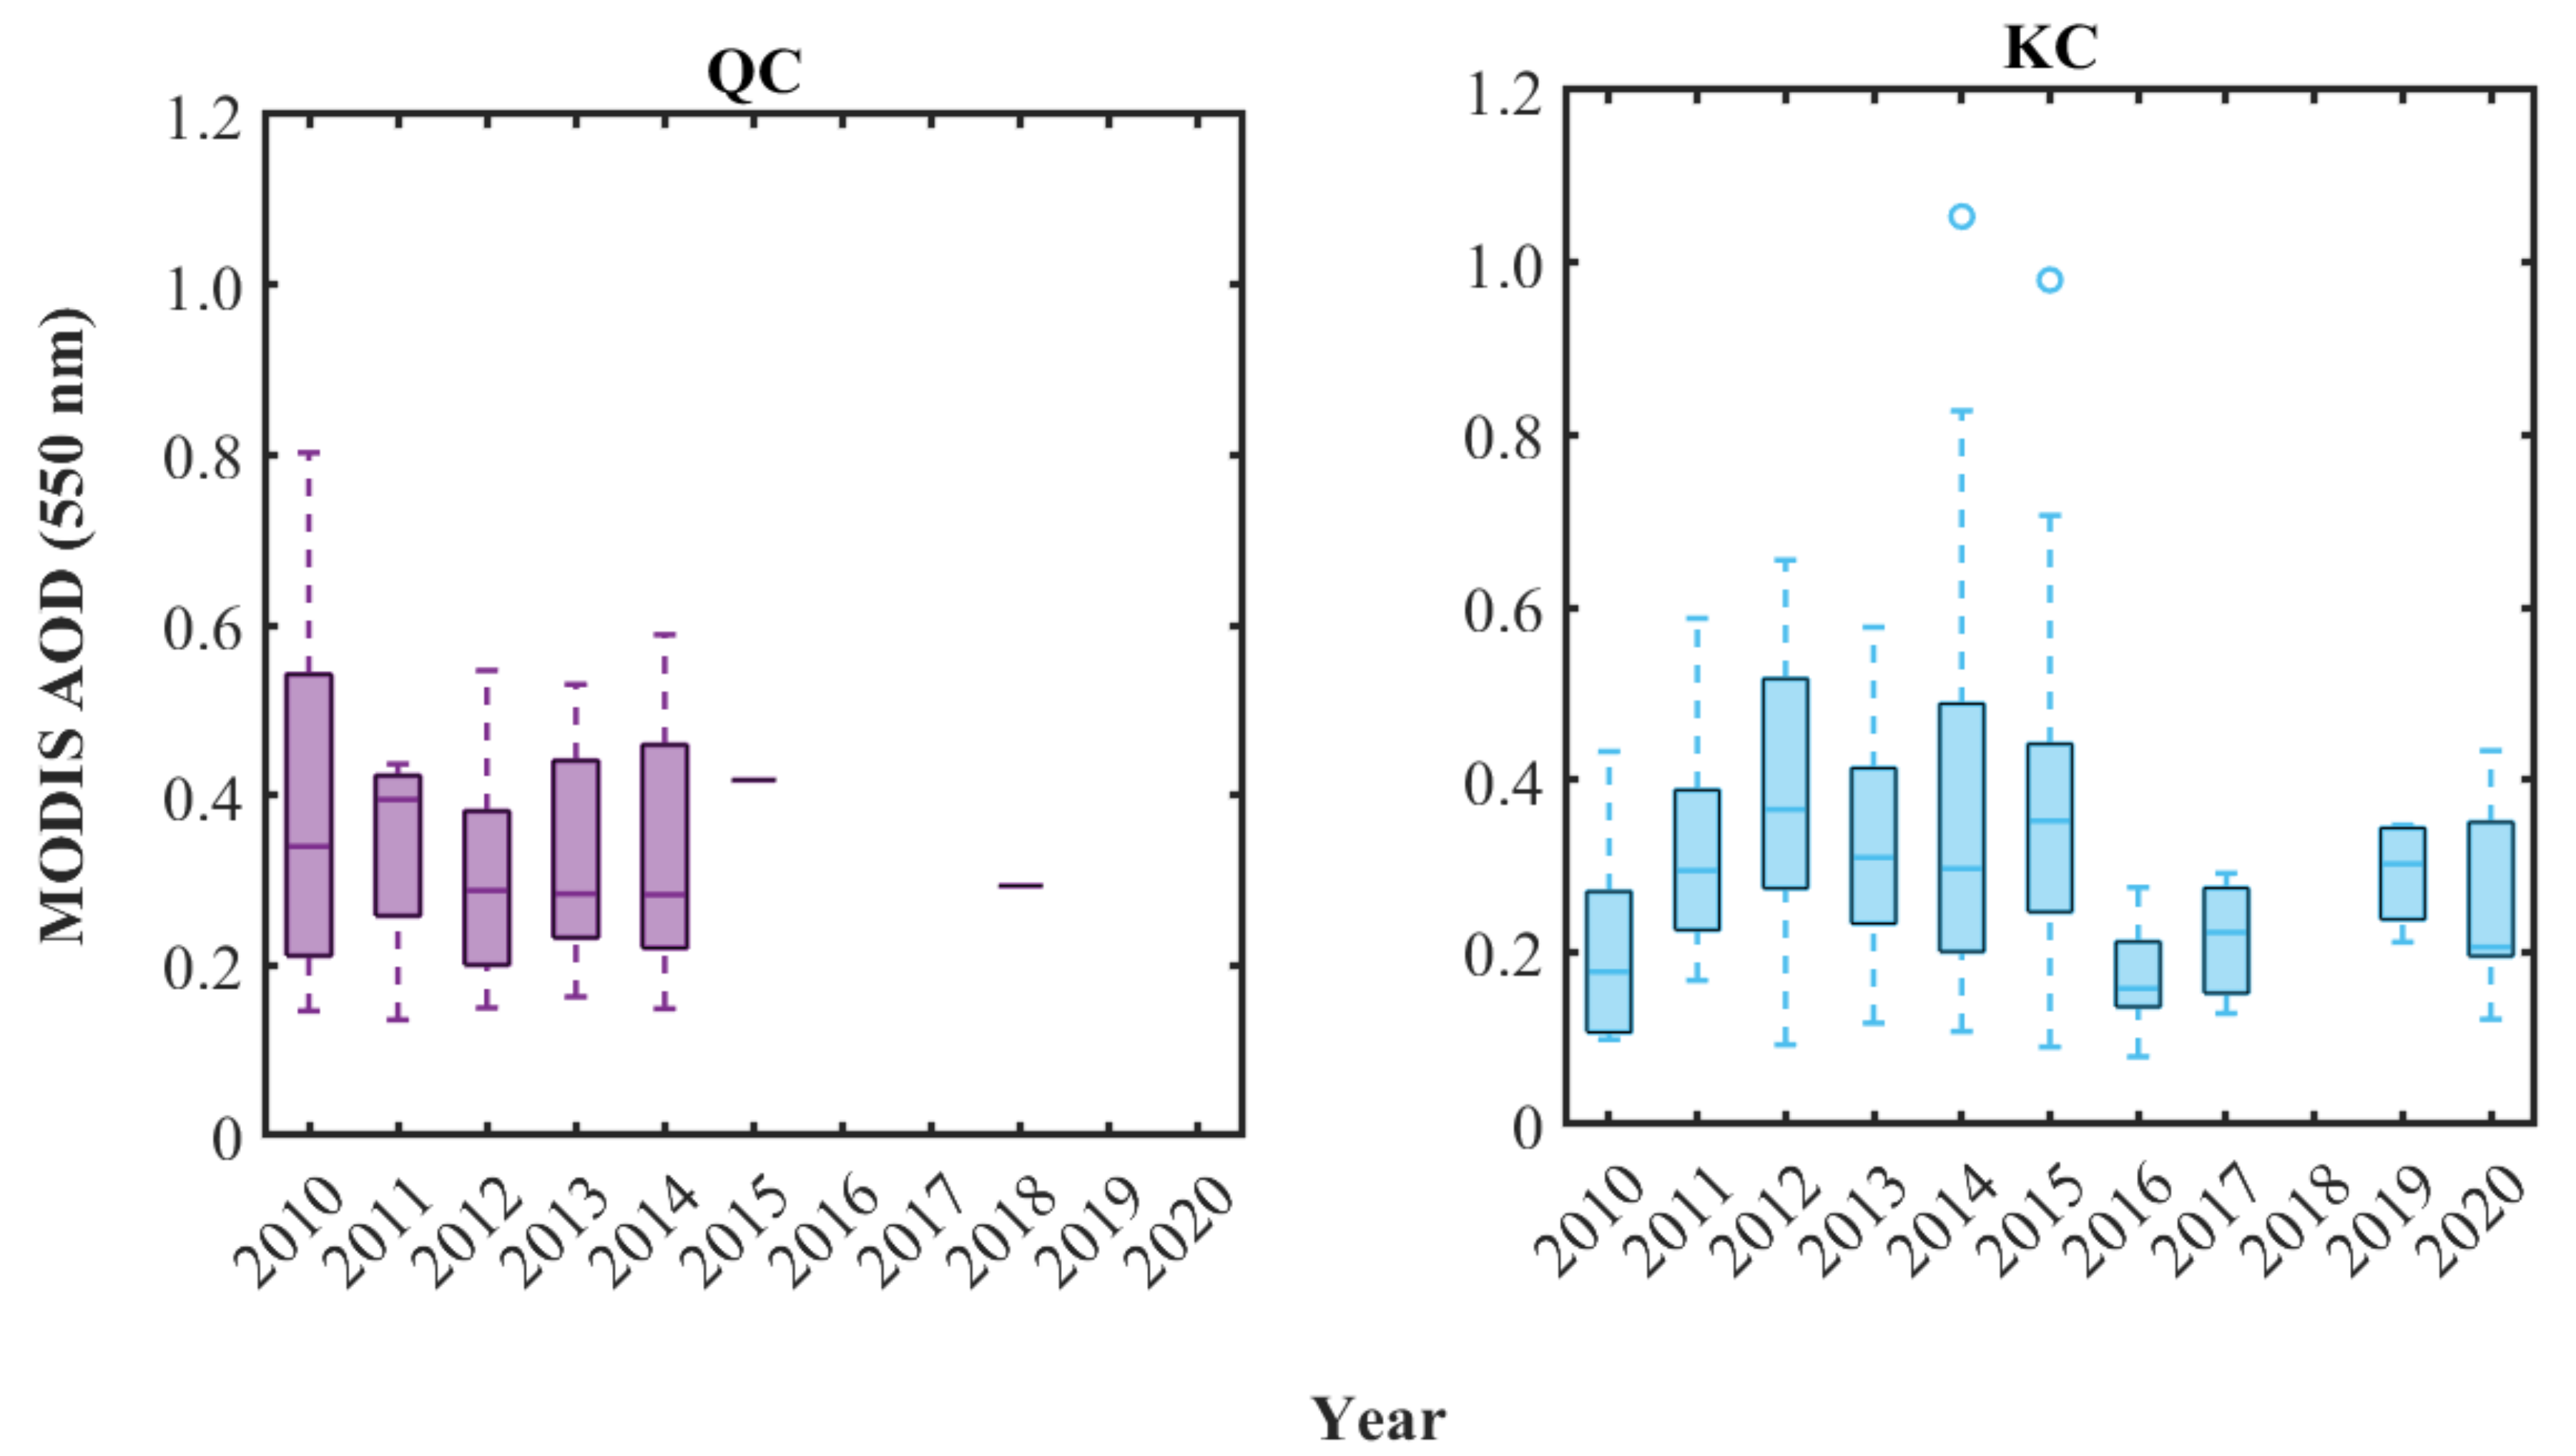
Figure 5 shows the boxplot for the annual concentrations for 11 years at the two sites. The mean and standard deviation are presented in Table 2. KC had the highest AOD concentration in 2014 ( = 0.39, = 0.28), while QC had the highest concentration in 2010 ( = 0.39). Overall, QC showed the highest concentration within the study period, with a total of 0.35, compared to KC value of = 0.32. To test the significance of the difference in concentration values from the two sites, hypothesis testing was performed using an independent t-test. The calculated p-value was 0.38 (p-value ≤ 0.05 means significant). This means that the variation in concentration values between the two sites is not significant, which could be attributed to the sources and quantities of aerosols received by the two study areas. QC is a highly urbanized city, where pollution is primarily caused by anthropogenic activities, but it is also affected by long-range aerosols from East Asia [23]. KC, on the other hand, is a city with a large percentage of its total land area covered by vegetation. Agriculture occupies 55% of the total area, open grasslands occupy 3%, and forest occupies 28% of total land area [63]. While KC also experiences biomass burning from local sources, the bulk of air pollution originates from maritime continent countries in Southeast Asia [19,22,64]. The amount of data could also affect the calculated average AOD values of both sites, since some years are missing data values.
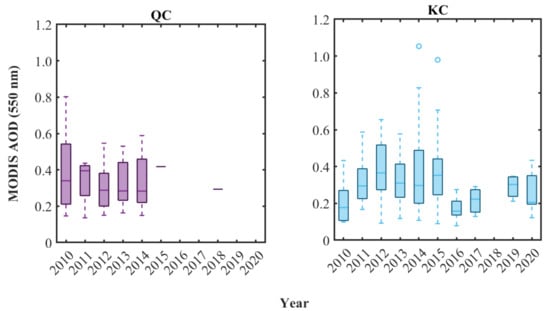
Figure 5.
Boxplots of annual concentrations of evaluated MODIS AOD data from 2010 to 2020 in Quezon City and Koronadal City; median is shown by the middle line of the box, inter-quantile range is shown by the box, and whiskers represent the ± 2.7 + inter-quantile range.
Table 2.
Statistics of monthly MODIS AOD values at the two study areas from 2010 to 2020. Note that “−“ signifies unavailability of data.
4.3. Seasonal Variation
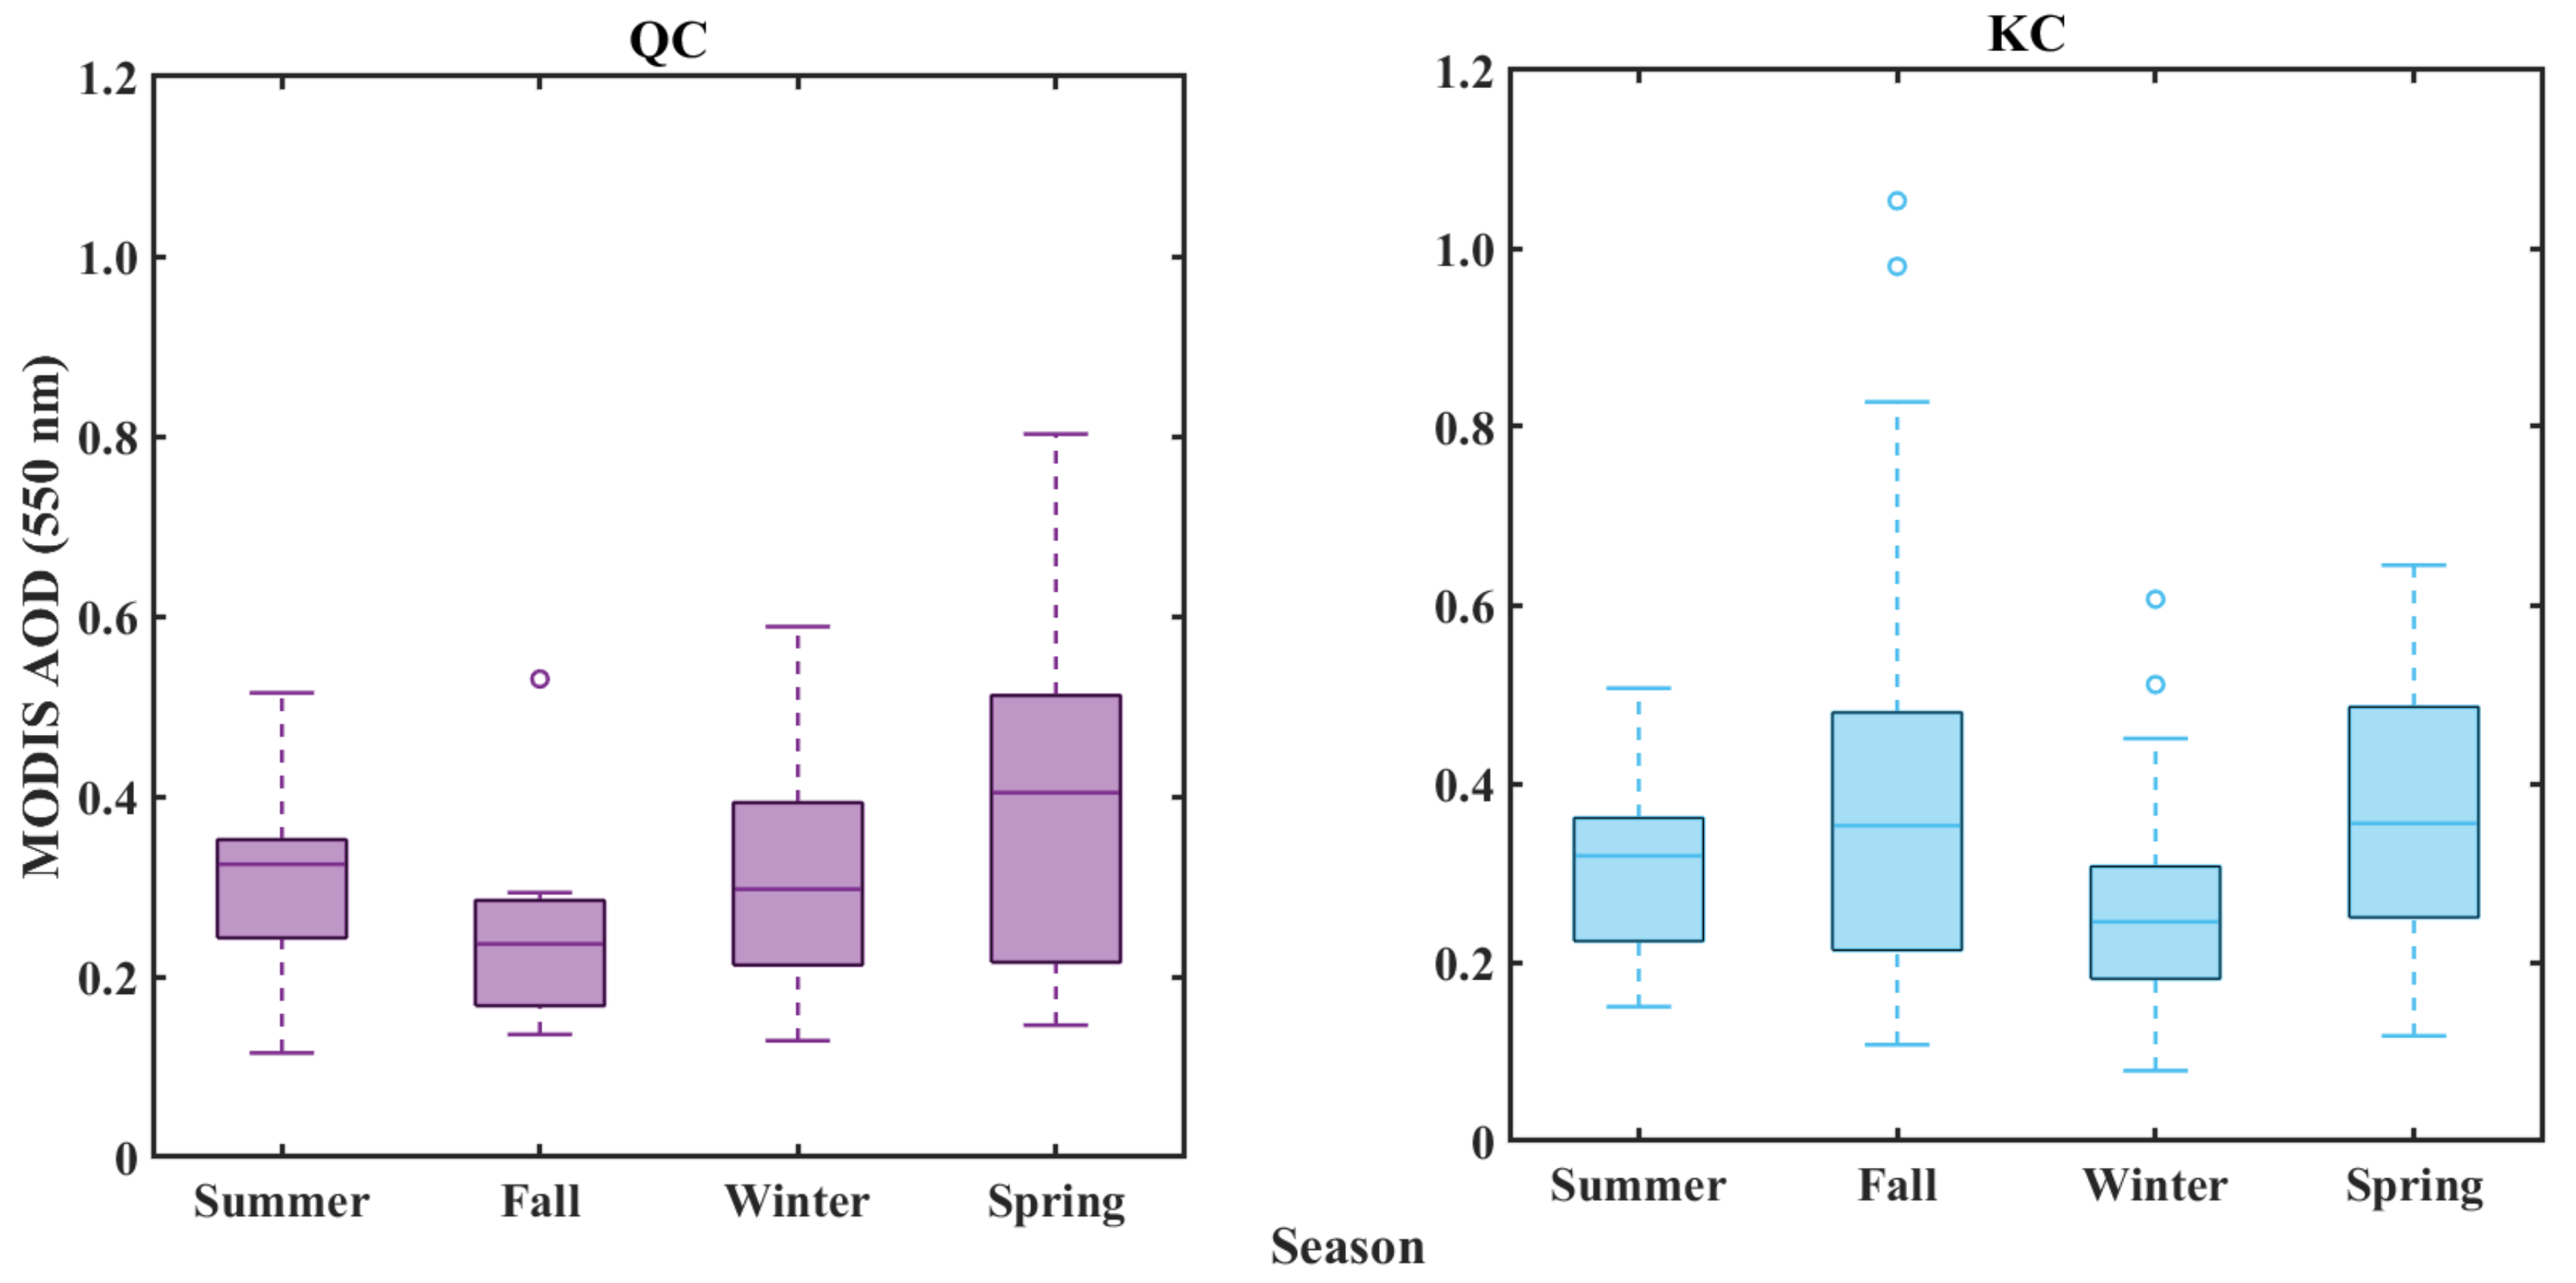
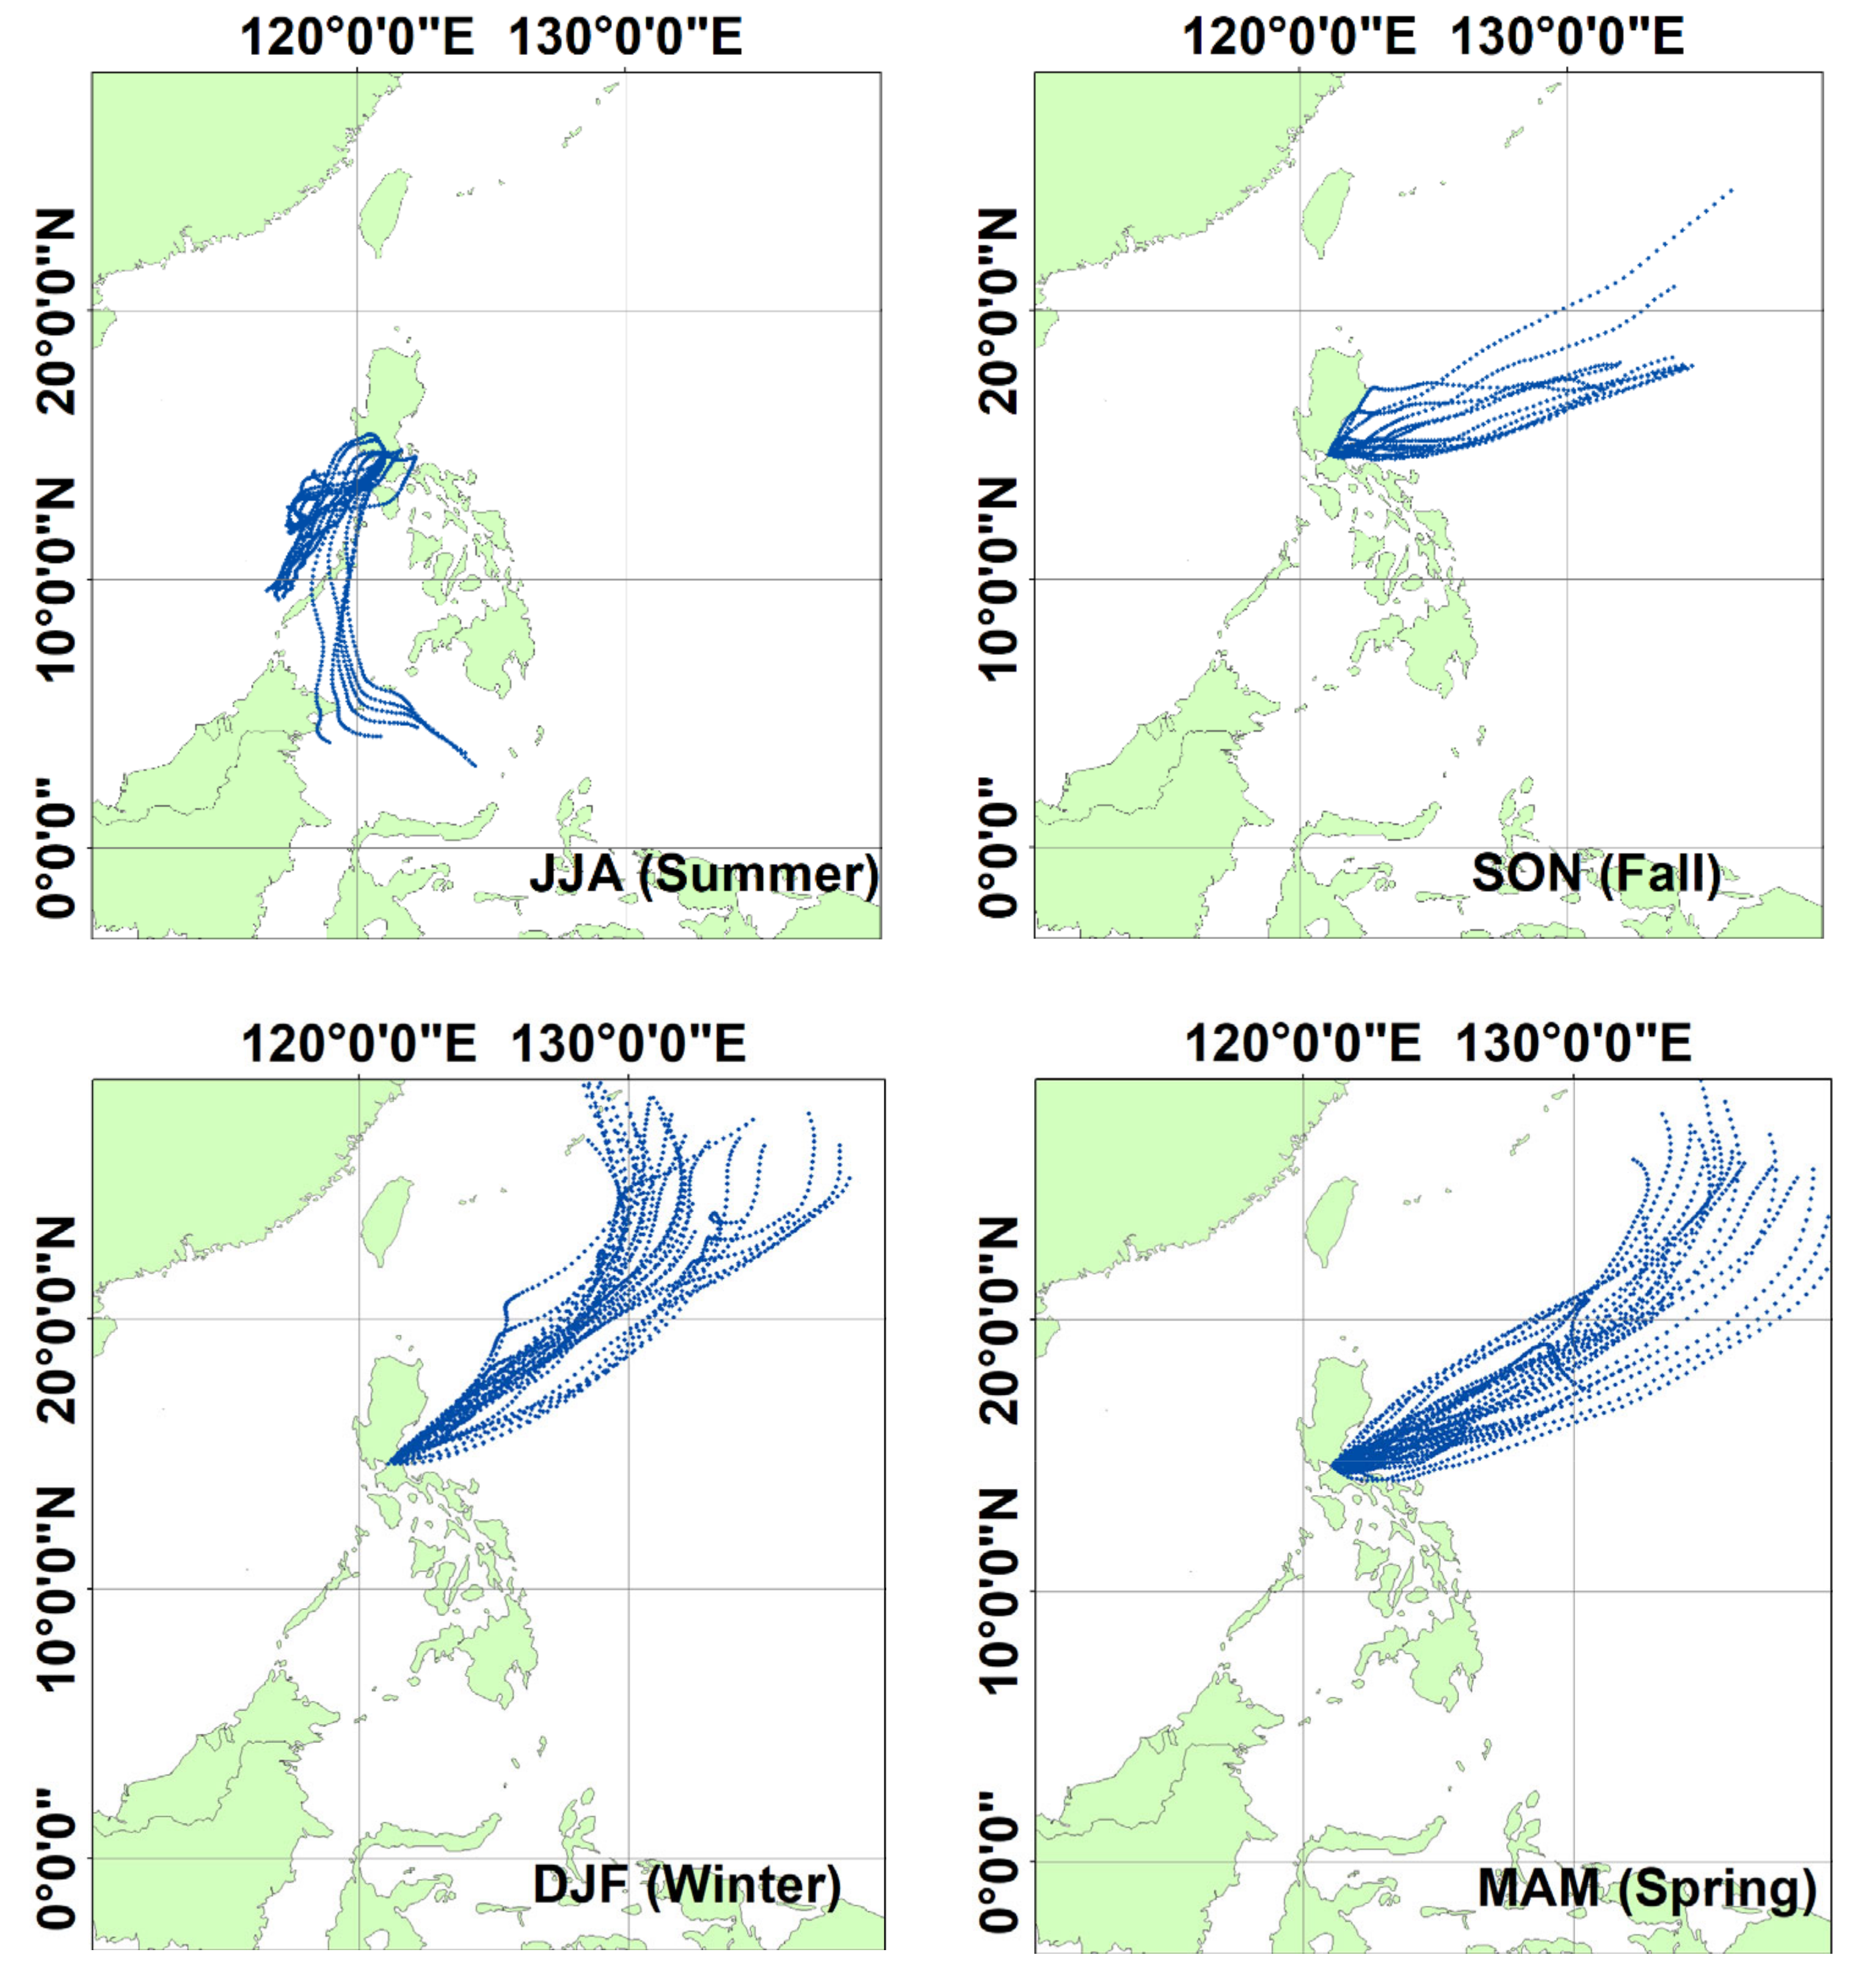
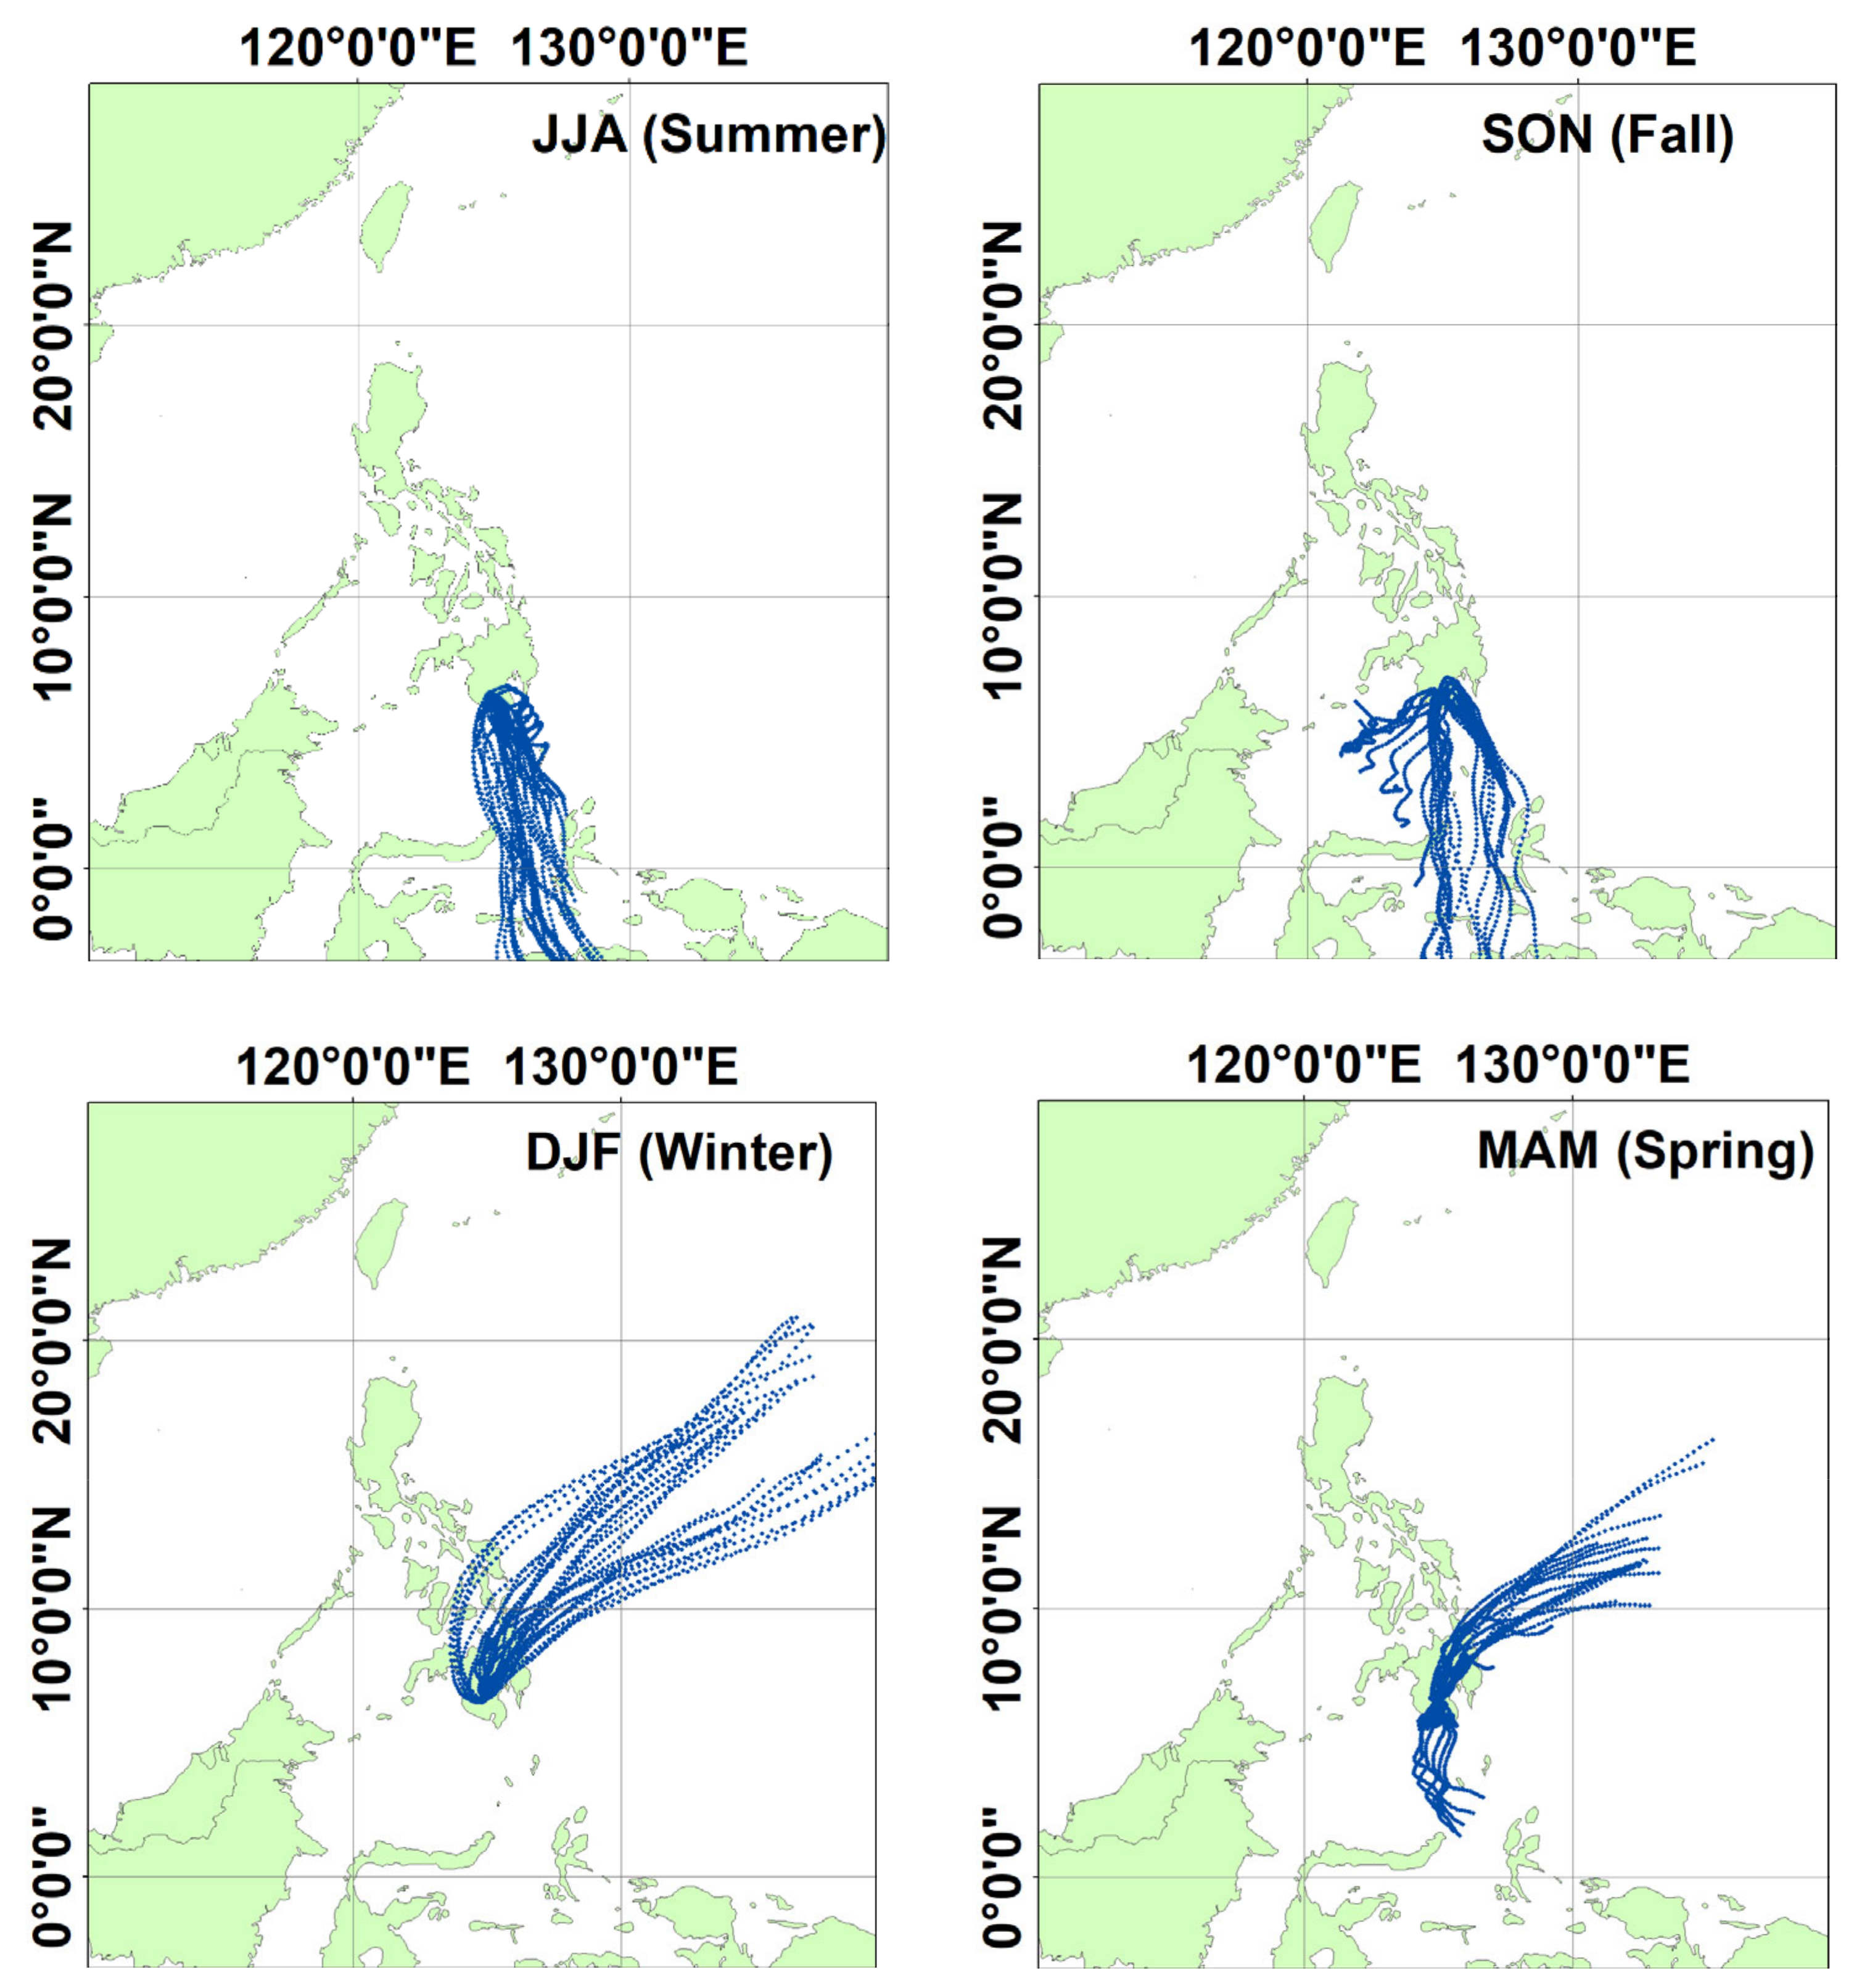
The boxplot of the seasonal variation between the two sites is shown in Figure 6, and the seasonal spatial distribution of AOD values is shown in Figure 7. For the seasonal variation in Figure 6, QC recorded the lowest mean AOD value (0.27) in fall, when the monsoon transition occurs, and the highest (0.40) in spring, as seen in Table 3. A wind back-trajectory analysis (Figure 8) of the northern part of the Philippines during this season showed that air volume comes from the Pacific Ocean by easterly winds, where no known large pollutant emitters are present. During spring, large concentrations of local sources, such as biomass burning and long-range transport pollutants from East Asia, are carried by strong daytime monsoon winds [22]. For KC, the highest AOD values occurred during fall. A wind back-trajectory analysis (Figure 9) during this season showed that the movement of air came from southwest and west of the site. During this time, Indonesia experiences a dry season that encourages biomass burning events that are made severe by high temperatures [64]. This increase in AOD values during fall in KC was a result of forest fires from Indonesia and Indochina [19,65].

Figure 6.
Boxplots of seasonal concentrations of evaluated MODIS AOD values from 2010 to 2020 in Quezon City and Koronadal City; median is shown by the middle line of the box, inter-quantile range is shown by the box, and whiskers represent the ± 2.7 + inter-quantile range.
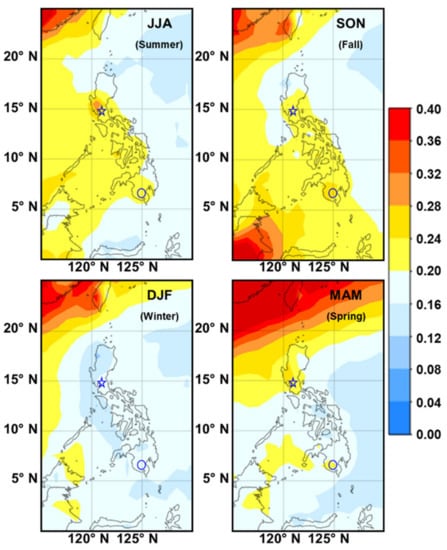
Figure 7.
Spatial distribution of mean seasonal MODIS AOD values from 2010 to 2020 in the Philippines. Note that “☆” corresponds to Quezon City and “◯” corresponds to Koronadal City.
Table 3.
Statistics of seasonal MODIS AOD values at the two study areas from 2010 to 2020.
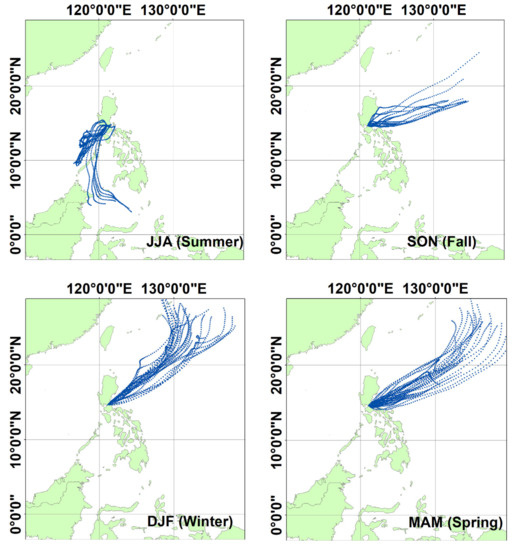
Figure 8.
Cluster analysis of 72 h HYSPLIT-NCEP/NCAR wind back-trajectories arriving every 6 h for each season in Quezon City.
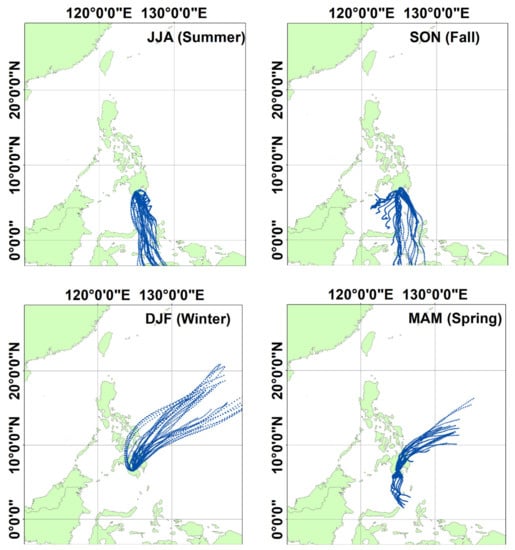
Figure 9.
Cluster analysis of 72 h HYSPLIT-NCEP/NCAR wind back-trajectories arriving every 6 h for each season in Koronadal City.
5. Conclusions
This study examined the MODIS AOD trends over Koronadal City and Quezon City from 2010 to 2020. For a decade-long study, the number of data studied is a limitation. This is associated with the limited amount of quality assured and cloud-free data available from the ground-based network and satellite. Nevertheless, the results still show a trend in annual and seasonal AOD values congruent with previous studies.
The results show that the and R2 are 0.33 and 0.83, respectively, for the whole study period. The MODIS generally underestimates AERONET AOD values in the Philippines but has a low RMSE value of 0.26. Annual variation in AOD values in the Philippines showed an increase from 2010 to 2015. The mean AOD value in 2015 was recorded as the highest due to extensive biomass burning in Indonesia. Spatial analysis showed that, due to COVID-19 lockdown, the mean AOD value in the Philippines remained relatively low in 2020. Seasonally, KC had a higher AOD concentration during the fall season due to long-range transport pollutants from Indonesia caused by biomass burnings. A wind back-trajectory showed that the high AOD concentration during fall is because aerosols were carried by the southwest monsoon from Indonesia. QC, on the other hand, experienced higher AOD concentrations during spring from increased local anthropogenic activities, as well as long-range transport pollutants from East Asia carried by daytime monsoon winds. These results suggest that subtropical and monsoon climates, as well as the long-range transportation of aerosols, have significant effects on the air quality in the Philippines.
The findings of this study describe and evaluate the atmospheric aerosol trends in the Philippines for the past decade. For an archipelagic country, where some places are remote and inaccessible, using satellite data is highly advantageous because it provides extensive spatial coverage as well as real-time sets of data. This makes it easier to study air quality trends and their effects on health, the environment, and the climate. The authors suggest using other retrieval MODIS AOD algorithms to assess which is the most appropriate for use in different areas within the Philippines. Future studies should also use other satellite sources, such as the Modern-Era Retrospective analysis for Research and Applications (MERRA-2), Visible Infrared Imaging Radiometer Suite (VIIRS), and Himawari-8 satellite, to assess variations in the AOD in different regions in the Philippines, especially in highly urbanized regions. More in-depth studies could be used by the government to enact and initiate interventions in proper urban planning and agricultural practices, as well as health risk assessments to improve air quality in the Philippines.
Author Contributions
Conceptualization, N.G.C. and E.V.; methodology, N.G.C. and E.V.; formal analysis, N.G.C., O.R. and E.V.; investigation, N.G.C.; resources, N.G.C. and E.V.; data curation, N.G.C. and E.V.; writing—original draft preparation, N.G.C.; writing—review and editing, N.G.C., P.M.O., O.R., M.C.G. and E.V.; visualization, N.G.C. and E.V.; supervision, E.V. All authors have read and agreed to the published version of the manuscript.
Funding
This research received no external funding.
Institutional Review Board Statement
Not applicable.
Informed Consent Statement
Not applicable.
Data Availability Statement
The MODIS (https://ladsweb.modaps.eosdis.nasa.gov/search/ accessed on 2 April 2022) and AERONET (https://aeronet.gsfc.nasa.gov/ accessed on 5 January 2022) data used in this study are freely available from National Aeronautics and Space Administration (NASA).
Acknowledgments
The authors would like to acknowledge the use of Terra/MODIS Deep Blue Aerosol Optical Depth Daily Level 2 datasets, acquired from Level 1 data and the Atmosphere Archive & Distribution System’s (LAADS) Distributed Active Archive Center (DAAC), located in the Goddard Space Flight Center in Greenbelt, Maryland. The authors would also like to thank the AERONET Principal Investigators and Co-Investigators Brent N. Holben, James Bernard B. Simpas, and Susana V. Dorado for their effort in making the data available and for maintaining the AERONET sites at the Manila Observatory and the Notre Dame of Marbel University. The authors gratefully acknowledge the NOAA Air Resources Laboratory (ARL) for the provision of the HYSPLIT transport and dispersion model and/or READY website (https://www.ready.noaa.gov accessed on 23 May 2022) used in this publication. The APC was provided by the De La Salle University Science Foundation, Inc.
Conflicts of Interest
The authors declare no conflict of interest.
References
- Kumar, P.; Patton, A.P.; Durant, J.L.; Frey, H.C. A review of factors impacting exposure to PM2. 5, ultrafine particles and black carbon in Asian transport microenvironments. Atmos. Env. 2018, 187, 301–316. [Google Scholar] [CrossRef]
- World Health Organization. Ambient Air Pollution: A Global Assessment of Exposure and Burden of Disease; WHO: Geneva, Switzerland, 2016. [Google Scholar]
- He, Q.; Gu, Y.; Zhang, M. Spatiotemporal patterns of aerosol optical depth throughout China from 2003 to 2016. Sci. Tot. Env. 2019, 653, 23–35. [Google Scholar] [CrossRef]
- Subba, T.; Gogoi, M.M.; Moorthy, K.K.; Bhuyan, P.K.; Pathak, B.; Guha, A.; Srivastava, M.K.; Vyas, B.M.; Singh, K.; Krishnan, J.; et al. New estimates of aerosol radiative effects over India from surface and satellite observations. Atmos. Res. 2022, 276, 106254. [Google Scholar] [CrossRef]
- Tan, Y.; Wang, Q.; Zhang, Z. Assessing spatiotemporal variations of AOD in Japan based on Himawari-8 L3 V31 aerosol products: Validations and applications. Atmos. Poll. Res. 2022, 11, 101439. [Google Scholar] [CrossRef]
- Chand, K.; Kuniyal, J.C.; Kanga, S.; Guleria, R.P.; Meraj, G.; Kumar, P.; Farooq, M.; Singh, S.K.; Nathawat, M.S.; Sahu, N.; et al. Aerosol Characteristics and Their Impact on the Himalayan Energy Budget. Sustainability 2021, 14, 179. [Google Scholar] [CrossRef]
- Murray, C.J.; Aravkin, A.Y.; Zheng, P.; Abbafati, C.; Abbas, K.M.; Abbasi-Kangevari, M.; Borzouei, S. Global burden of 87 risk factors in 204 countries and territories, 1990–2019: A systematic analysis for the Global Burden of Disease Study 2019. Lancet 2020, 396, 1223–1249. [Google Scholar] [CrossRef]
- Rabha, S.; Saikia, B.K. Advanced micro-and nanoscale characterization techniques for carbonaceous aerosols. In Handbook of Nanomaterials in Analytical Chemistry; Hussain, C.M., Ed.; Elsevier: Amsterdam, The Netherlands, 2020; pp. 449–472. [Google Scholar]
- Eck, T.; Holben, B.N.; Reid, J.S.; Dubovik, O.; Smirnov, A.; O’neill, N.T.; Slutsker, I.; Kinne, S. Wavelength dependence of the optical depth of biomass burning, urban and desert dust aerosols. J. Geophys. Res. Atmos. 1999, 104, 31333–31349. [Google Scholar] [CrossRef]
- Holben, B.N.; Eck, T.F.; Slutsker, I.A.; Tanre, D.; Buis, J.P.; Setzer, A.; Vermote, E.; Reagan, J.A.; Kaufman, Y.J.; Nakajima, T.; et al. AERONET—A Federated Instrument Network and Data Archive for Aerosol Characterization. Rem. Sen. Env. 1998, 66, 1–16. [Google Scholar] [CrossRef]
- Takamura, T.; Takenaka, H.; Cui, Y.; Nakajima, T.Y.; Higurashi, A.; Fukada, S.; Kikuchi, N.; Nakajima, T.; Sano, I.; Pinker, R.T. Aerosol and Cloud Validation System Based on SKYNET Observations: Estimation of Shortwave Radiation Budget Using ADEOS-II/GLI Data. J. Rem. Sens. Soc. Japan 2009, 29, 40–53. [Google Scholar]
- Li, Z.; Xu, H.; Li, K.; Li, D.; Xie, Y.; Li, L.; Zhang, Y.; Gu, X.F.; Zhao, W.; Tian, Q.J.; et al. Comprehensive study of optical, physical, chemical, and radiative properties of total columnar atmospheric aerosols over China: An overview of Sun–Sky Radiometer Observation Network (SONET) measurements. Bull. Am. Met. Soc. 2018, 99, 739–755. [Google Scholar] [CrossRef]
- Holben, B.; Tanr’e, D.; Smirnov, A.; Eck, T.; Slutsker, I.; Abuhassan, N.; Newcomb, W.W.; Schafer, J.S.; Chatenet, B.; Lavenu, F.; et al. An emerging ground-based aerosol climatology: Aerosol optical depth from AERONET. J. Geophys. Res. Atmos. 2001, 106, 12067–12097. [Google Scholar] [CrossRef]
- Taschilin, M.; Yakovleva, I.; Sakerin, S.; Zorkaltseva, O.; Tatarnikov, A.; Scheglova, E. Spatiotemporal Variations of Aerosol Optical Depth in the Atmosphere over Baikal Region Based on MODIS Data. Atmosphere 2021, 12, 1706. [Google Scholar] [CrossRef]
- Remer, L.A.; Kaufman, Y.J.; Tanré, D.; Mattoo, S.; Chu, D.A.; Martins, J.V.; Li, R.R.; Ichoku, C.; Levy, R.C.; Kleidman, R.G.; et al. The MODIS aerosol algorithm, products, and validation. J. Atmos. Sci. 2005, 62, 947–973. [Google Scholar] [CrossRef] [Green Version]
- Acharya, P.; Barik, G.; Gayen, B.K.; Bar, S.; Maiti, A.; Sarkar, A.; Ghosh, S.; De, S.K.; Sreekesh, S. Revisiting the levels of Aerosol Optical Depth in south-southeast Asia, Europe and USA amid the COVID-19 pandemic using satellite observations. Env. Res. 2021, 193, 110514. [Google Scholar] [CrossRef]
- Braun, R.A.; Aghdam, M.A.; Bañaga, P.A.; Betito, G.; Cambaliza, M.O.; Cruz, M.T.; Lorenzo, G.R.; MacDonald, A.B.; Simpas, J.B.; Stahl, C.; et al. Long-range aerosol transport and impacts on size-resolved aerosol composition in Metro Manila, Philippines. Atmos. Chem. Phys. 2020, 20, 2387–2405. [Google Scholar] [CrossRef] [Green Version]
- Ge, C.; Wang, J.; Reid, J.S.; Posselt, D.J.; Xian, P.; Hyer, E. Mesoscale modeling of smoke transport from equatorial Southeast Asian Maritime Continent to the Philippines: First comparison of ensemble analysis with in situ observations. J. Geophys. Res. Atmos. 2017, 122, 5380–5398. [Google Scholar] [CrossRef]
- Nguyen, T.T.; Pham, H.V.; Lasko, K.; Bui, M.T.; Laffly, D.; Jourdan, A.; Bui, H.Q. Spatiotemporal analysis of ground and satellite-based aerosol for air quality assessment in the Southeast Asia region. Env. Poll. 2019, 255, 113106. [Google Scholar] [CrossRef]
- Reid, J.S.; Xian, P.; Holben, B.N.; Hyer, E.J.; Reid, E.A.; Salinas, S.V.; Zhang, J.; Campbell, J.R.; Chew, B.N.; Holz, R.E.; et al. Aerosol meteorology of the Maritime Continent for the 2012 7SEAS southwest monsoon intensive study–Part 1: Regional-scale phenomena. Atmos. Chem. Phys. 2016, 16, 14041–14056. [Google Scholar] [CrossRef] [Green Version]
- Reid, J.S.; Lagrosas, N.D.; Jonsson, H.H.; Reid, E.A.; Atwood, S.A.; Boyd, T.J.; Ghate, V.P.; Xian, P.; Posselt, D.J.; Simpas, J.B.; et al. Aerosol meteorology of Maritime Continent for the 2012 7SEAS southwest monsoon intensive study–Part 2: Philippine receptor observations of fine-scale aerosol behavior. Atmos. Chem. Phys. 2016, 16, 14057–14078. [Google Scholar] [CrossRef] [Green Version]
- Bagtasa, G.; Cayetano, M.G.; Yuan, C.S. Seasonal variation and chemical characterization of PM 2.5 in northwestern Philippines. Atmos. Chem. Phys. 2018, 18, 4965–4980. [Google Scholar] [CrossRef] [Green Version]
- Bagtasa, G.; Cayetano, M.G.; Yuan, C.S.; Uchino, O.; Sakai, T.; Izumi, T.; Morino, I.; Nagai, T.; Macatangay, R.; Velazco, V.A. Long-range transport of aerosols from East and Southeast Asia to northern Philippines and its direct radiative forcing effect. Atmos. Env. 2019, 218, 117007. [Google Scholar] [CrossRef]
- Oanh, N.T.; Permadi, D.A.; Hopke, P.K.; Smith, K.R.; Dong, N.P.; Dang, A.N. Annual emissions of air toxics emitted from crop residue open burning in Southeast Asia over the period of 2010–2015. Atmos. Env. 2018, 187, 163–173. [Google Scholar] [CrossRef]
- Song, J.; Zhao, Y.; Zhang, Y.; Fu, P.; Zheng, L.; Yuan, Q.; Wang, S.; Huang, X.; Xu, W.; Cao, Z.; et al. Influence of biomass burning on atmospheric aerosols over the western South China Sea: Insights from ions, carbonaceous fractions and stable carbon isotope ratios. Env. Poll. 2018, 242, 1800–1809. [Google Scholar] [CrossRef] [PubMed]
- Donlon, C.; Ma, K. IR Radiometers. In Encyclopedia of Ocean Sciences, 3rd ed.; Cochran, J.K., Bokuniewicz, H.J., Yager, P.L., Eds.; Academic Press: Cambridge, MA, USA, 2019; Volume 5, pp. 120–132. [Google Scholar]
- Chang, T.; Xiong, X.; Angal, A. Terra and Aqua MODIS inter-comparison using LEO-GEO double difference method. Sens. Sys. Next-Gen. Sat. XXII 2018, 10785, 107851G. [Google Scholar]
- Kaufman, Y.J.; Tanré, D.; Remer, L.A.; Vermote, E.F.; Chu, A. Operational remote sensing of tropospheric aerosol over land from EOS moderate resolution imaging spectroradiometer. J. Geophys. Res. Atmos. 1997, 102, 17051–17067. [Google Scholar] [CrossRef]
- Levy, R.C.; Remer, L.A.; Dubovik, O. Global aerosol optical properties and application to Moderate Resolution Imaging Spectroradiometer aerosol retrieval over land. J. Geophys. Res. Atmos. 2007, 112, D13. [Google Scholar] [CrossRef] [Green Version]
- Levy, R.C.; Remer, L.A.; Mattoo, S.; Vermote, E.F.; Kaufman, Y.J. Second-generation operational algorithm: Retrieval of aerosol properties over land from inversion of Moderate Resolution Imaging Spectroradiometer spectral reflectance. J. Geophys. Res. Atmos. 2007, 112, D13. [Google Scholar] [CrossRef] [Green Version]
- Levy, R.C.; Remer, L.A.; Kleidman, R.G.; Mattoo, S.; Ichoku, C.; Kahn, R.; Eck, T.F. Global evaluation of the Collection 5 MODIS dark-target aerosol products over land. Atmos. Chem. Phys. 2010, 10, 10399–10420. [Google Scholar] [CrossRef] [Green Version]
- Levy, R.C.; Remer, L.A.; Tanré, D.; Kaufman, Y.J.; Ichoku, C.; Holben, B.N.; Livingston, J.M.; Russell, P.B.; Maring, H. Evaluation of the Moderate-Resolution Imaging Spectroradiometer (MODIS) retrievals of dust aerosol over the ocean during PRIDE. J. Geophys. Res. Atmos. 2003, 108, D19. [Google Scholar] [CrossRef]
- Tanré, D.; Kaufman, Y.J.; Herman, M.; Mattoo, S. Remote sensing of aerosol properties over oceans using the MODIS/EOS spectral radiances. J. Geophys. Res. Atmos. 1997, 102, 16971–16988. [Google Scholar] [CrossRef]
- Hsu, N.C.; Tsay, S.C.; King, M.D.; Herman, J.R. Aerosol properties over bright-reflecting source regions. IEEE Trans. Geosci. Rem. Sens. 2004, 42, 557–569. [Google Scholar] [CrossRef]
- Hsu, N.C.; Tsay, S.C.; King, M.D.; Herman, J.R. Deep blue retrievals of Asian aerosol properties during ACE-Asia. IEEE Trans. Geosci. Rem. Sens. 2006, 44, 3180–3195. [Google Scholar] [CrossRef]
- Hsu, N.C.; Jeong, M.J.; Bettenhausen, C.; Sayer, A.M.; Hansell, R.; Seftor, C.S.; Huang, J.; Tsay, S.-C. Enhanced Deep Blue aerosol retrieval algorithm: The second generation. J. Geophys. Res. Atmos. 2013, 118, 9296–9315. [Google Scholar] [CrossRef]
- Sayer, A.M.; Hsu, N.C.; Bettenhausen, C.; Jeong, M.J. Validation and uncertainty estimates for MODIS Collection 6 “Deep Blue” aerosol data. J. Geophys. Res. Atmos 2013, 118, 7864–7872. [Google Scholar] [CrossRef] [Green Version]
- Sayer, A.M.; Munchak, L.A.; Hsu, N.C.; Levy, R.C.; Bettenhausen, C.; Jeong, M.J. MODIS Collection 6 aerosol products: Comparison between Aqua’s e-Deep Blue, Dark Target, and “merged” data sets, and usage recommendations. J. Geophys. Res. Atmos. 2014, 119, 13–965. [Google Scholar] [CrossRef]
- Wolters, E.; Toté, C.; Sterckx, S.; Adriaensen, S.; Henocq, C.; Bruniquel, J.; Scifoni, S.; Dransfeld, S. iCOR Atmospheric Correction on Sentinel-3/OLCI over Land: Intercomparison with AERONET, RadCalNet, and SYN Level-2. Rem. Sens. 2021, 13, 654. [Google Scholar] [CrossRef]
- Republic of the Philippines. Republic Act No. 1575. Available online: https://lawphil.net/statutes/repacts/ra1956/ra_1575_1956.html (accessed on 10 March 2022).
- Philippine Statistics Authority. 2020 Census of Population and Housing (2020 CPH) Population Counts Declared Official by the President. Available online: https://psa.gov.ph/content/2020-census-population-and-housing-2020-cph-population-counts-declared-official-president (accessed on 10 March 2022).
- Quezon City Government. History. Quezon City Government. Available online: https://quezoncity.gov.ph/about-the-city-government/history/ (accessed on 10 March 2022).
- City Government of Koronadal. Geography. Available online: https://koronadal.gov.ph/geography/ (accessed on 11 March 2022).
- Philippine Statistics Authority. Urban Barangays in the Philippines (Based on 2010 CPH). Available online: https://psa.gov.ph/content/urban-barangays-philippines-based-2010-cph (accessed on 27 April 2022).
- Sayer, A.M.; Hsu, N.C.; Lee, J.; Kim, W.V.; Dutcher, S.T. Validation, stability, and consistency of MODIS Collection 6.1 and VIIRS Version 1 Deep Blue aerosol data over land. J. Geophys. Res. Atmos. 2019, 124, 4658–4688. [Google Scholar] [CrossRef]
- Draxler, R.R.; Hess, G.D. An overview of the HYSPLIT_4 modelling system for trajectories. Aust. Met. Mag. 1998, 47, 295–308. [Google Scholar]
- Kalnay, E.; Kanamitsu, M.; Kistler, R.; Collins, W.; Deaven, D.; Gandin, L.; Iredell, M.; Saha, S.; White, G.; Woollen, J.; et al. The NCEP/NCAR 40-year reanalysis project. Bull. Am. Met. Soc. 1996, 77, 437–472. [Google Scholar] [CrossRef] [Green Version]
- Chew, B.N.; Campbell, J.R.; Reid, J.S.; Giles, D.M.; Welton, E.J.; Salinas, S.V.; Liew, S.C. Tropical cirrus cloud contamination in sun photometer data. Atmos. Env. 2011, 45, 6724–6731. [Google Scholar] [CrossRef]
- Huang, J.; Hsu, N.C.; Tsay, S.C.; Jeong, M.J.; Holben, B.N.; Berkoff, T.A.; Welton, E.J. Susceptibility of aerosol optical thickness retrievals to thin cirrus contamination during the BASE-ASIA campaign. J. Geophys. Res. Atmos. 2011, 116, D8. [Google Scholar] [CrossRef]
- Aldabash, M.; Bektas Balcik, F.; Glantz, P. Validation of MODIS C6. 1 and MERRA-2 AOD using AERONET observations: A comparative study over Turkey. Atmosphere 2020, 11, 905. [Google Scholar] [CrossRef]
- Chu, D.A.; Kaufman, Y.J.; Ichoku, C.; Remer, L.A.; Tanré, D.; Holben, B.N. Validation of MODIS aerosol optical depth retrieval over land. Geophys. Res. Lett. 2002, 29, MOD2-1–MOD2-4. [Google Scholar] [CrossRef] [Green Version]
- Tian, X.; Gao, Z. Validation and accuracy assessment of MODIS C6. 1 aerosol products over the heavy aerosol loading area. Atmosphere 2019, 10, 548. [Google Scholar] [CrossRef] [Green Version]
- Hsieh, C.C.; Chen, H.Y.; Ho, T.Y. The effect of aerosol size on Fe solubility and deposition flux: A case study in the East China Sea. Mar. Chem. 2022, 241, 104106. [Google Scholar] [CrossRef]
- Li, J.; Han, Z.; Wu, J.; Tao, J.; Li, J.; Sun, Y.; Liang, L.; Liang, M.; Wang, Q. Secondary organic aerosol formation and source contributions over east China in summertime. Env. Poll. 2022, 306, 119383. [Google Scholar] [CrossRef]
- Eck, T.F.; Holben, B.N.; Giles, D.M.; Slutsker, I.; Sinyuk, A.; Schafer, J.S.; Smirnov, A.; Sorokin, M.; Reid, J.S.; Sayer, A.M.; et al. AERONET remotely sensed measurements and retrievals of biomass burning aerosol optical properties during the 2015 Indonesian burning season. J. Geophys. Res. Atmos. 2019, 124, 4722–4740. [Google Scholar] [CrossRef]
- Shi, Y.; Zang, S.; Matsunaga, T.; Yamaguchi, Y. A multi-year and high-resolution inventory of biomass burning emissions in tropical continents from 2001–2017 based on satellite observations. J. Clean. Prod. 2020, 270, 122511. [Google Scholar] [CrossRef]
- Adam, M.G.; Tran, P.T.; Bolan, N.; Balasubramanian, R. Biomass burning-derived airborne particulate matter in Southeast Asia: A critical review. J. Haz. Mat. 2021, 407, 124760. [Google Scholar] [CrossRef]
- Salinas, S.V.; Li, T.; Madala, S.; Chin, L.S. Characterization of Biomass Burning Aerosols during the 2019 Fire Event: Singapore and Kuching Cities. In Proceedings of the IGARSS 2020—2020 IEEE International Geoscience and Remote Sensing Symposium, Waikoloa, HI, USA, 26 September–2 October 2020; pp. 5533–5536. [Google Scholar]
- Fernandes, K.; Verchot, L.; Baethgen, W.; Gutierrez-Velez, V.P.-V.M.; Martius, C. Heightened fire probability in Indonesia in non-drought conditions: The effect of increasing temperatures. Env. Res. Lett. 2017, 12, 054002. [Google Scholar] [CrossRef]
- Pasia, J.S.; Torrentira, E.M.C., Jr.; Navarra, H.C.; Makilan, M. Air Quality Trends amid Covid-19 Lockdown in Metro Manila, Philippines: A Preliminary Case Review. J. Hum. Soc. Sci. Stud. 2020, 2, 145–150. [Google Scholar]
- Roy, S.; Saha, M.; Dhar, B.; Pandit, S.; Nasrin, R. Geospatial analysis of COVID-19 lockdown effects on air quality in the South and Southeast Asian region. Sci. Tot. Env. 2021, 756, 144009. [Google Scholar] [CrossRef] [PubMed]
- Madueño, L.; Kecorius, S.; Birmili, W.; Müller, T.; Simpas, J.; Vallar, E.; Galvez, M.C.; Cayetano, M.; Wiedensohler, A. Aerosol particle and black carbon emission factors of vehicular fleet in Manila, Philippines. Atmosphere 2019, 10, 603. [Google Scholar] [CrossRef] [Green Version]
- Asian Development Bank. Volume 7: Subproject Appraisal Report: City of Koronadal. Available online: https://www.adb.org/sites/default/files/project-document/63747/41665-012-phi-tacr-07.pdf (accessed on 10 March 2022).
- Kadir, E.A.; Rosa, S.L.; Syukur, A.; Othman, M.; Daud, H. Forest fire spreading and carbon concentration identification in tropical region Indonesia. Alex. Eng. J. 2022, 61, 1551–1561. [Google Scholar] [CrossRef]
- Kumar, M.; Ojha, N.; Singh, N. Atmospheric aerosols from open burning in South and Southeast Asia. In Asian Atmospheric Pollution; Singh, R., Ed.; Elsevier: Amsterdam, The Netherlands, 2022; pp. 75–96. [Google Scholar]


Publisher’s Note: MDPI stays neutral with regard to jurisdictional claims in published maps and institutional affiliations. |
© 2022 by the authors. Licensee MDPI, Basel, Switzerland. This article is an open access article distributed under the terms and conditions of the Creative Commons Attribution (CC BY) license (https://creativecommons.org/licenses/by/4.0/).