Abstract
Interdecadal change in the relationship between the winter Siberian high (SH) and tropical cyclone genesis frequency (TCGF) is investigated using observational and reanalysis data. Focus is on the Western North Pacific (WNP) where environmental background associated with TCGF is closely related to the winter SH. It is demonstrated that the relationship presents clear interdecadal change during 1980–2020. A significant negative correlation dominates in the last two decades of the 20th century (P1), but it clearly weakens from the early 2000s onward (P2). Observational evidence shows that such interdecadal change is related dominantly to variations in the air–sea responses associated with the winter SH over the North Pacific. During P1, when the SH is anomalously strengthened, an Aleutian Low (AL) response occurs over the downstream North Pacific, which gradually develops into a meridional dipole distribution pattern consistent with the negative North Pacific Oscillation (NPO) mode during the following spring. The northeasterly wind anomaly over the subtropical North Pacific maintains and further delivers into the tropical Pacific. It favors easterly wind anomaly enhancement over the tropical Pacific around summer and grows into an anticyclonic circulation response in the WNP, which restrains the genesis of TCs. During P2, the eastward shift of the SH anomaly favors a weak AL over the Northeast Pacific followed by a northeastward-shifted anticyclone over the subtropical central-eastern Pacific, which confines the relatively weak northeasterly wind anomalies far away from the tropical Pacific. This was concurrent with a weakening relationship between the SH and WNP TCGF, indicating weaker downstream impacts of the winter SH.
1. Introduction
The Western North Pacific (WNP), as one of the warmest seas in the world, is the most active area of tropical cyclones (TC). Storms, floods, and other disasters brought about by TCs often cause huge damages to the coastal areas [1,2,3]. In order to improve the prediction of TC activities, characteristics of TCs and the corresponding environmental backgrounds have always been a research focus.
The TC activity is modulated by changes in environmental background [4,5,6,7,8,9]. Gray [4] summarized the key TC environment over the WNP and pointed out that the TC genesis frequency (TCGF) is positively contributed by positive anomalies of relative vorticity and relative humidity in the lower layer, as well as convergence in the lower layer and divergence in the upper layer, and weakened vertical wind shear between the upper and lower layers. In addition, tropical sea surface temperature (SST) anomalies can regulate the environmental factors related to the TCGF by affecting the large-scale atmospheric circulations, mainly including the El Niño–Southern Oscillation (ENSO) [5,6,7,9,10], eastern tropical Indian Ocean SST anomaly [8], and tropical North Atlantic SST anomaly [11,12].
However, extratropical forcing from the North Pacific is also extremely important for the modulation of the TCGF. Numerous studies have shown that the North Pacific Oscillation (NPO) in spring can affect the following summer TC activities in the WNP. Wang et al. [13] revealed that a decreased amplitude of vertical wind shear and an increased SST anomaly of positive NPO is conducive to the genesis and development of TCs in the WNP. Recently, Chen et al. [14] found that there is a significant positive correlation between spring NPO and summer TCGF in the WNP during 1968 to 2010. In spring, the positive NPO can induce an anomalous SST tripole pattern in the North Pacific and persists until summer [15,16,17]. The negative SST anomaly in the WNP leads to the weakening of Walker circulation, resulting in the westerly anomaly in the low level. It weakens the East Asian summer monsoon and induces the Western Pacific subtropical high weak and eastward retreat, finally leads to the cyclonic vorticity over the WNP, and thus conduces the generation of TCs. The primary mode of SST anomaly associated with the NPO is the so-called Victoria mode (VM). Ding et al. [18,19] proposed that the VM can serve as a bridge linking the extratropical atmospheric variability of the North Pacific to the tropical variability such as the ENSO and the WNP TCGF. The spring VM can affect the SST anomaly in the tropical North Pacific through wind-evaporation-SST feedback until summer. The SST anomaly associated with the VM causes low-level atmospheric convergence, strengthens the WNP monsoon trough, weakens the Western Pacific subtropical high, and finally induces the WNP TCGF.
These results indicate that air–sea interaction in the North Pacific plays an important role in WNP TCGF. Prior research was more inclined to analyze the plausible TC environmental factors in oceans. Note that the NPO presents a North–South seesaw in which the Aleutian low (AL) near 60° N and the Hawaiian high near 30° N are synchronously strengthened and weakened [17,20]. Meanwhile, as a primary circulation feature in East Asia, the linkage between Siberian high (SH) and AL has significant impacts on EAWM and East Asian climate [21,22]. Less attention has been paid to the impact on WNP TCGF from atmospheric circulation systems located at mid-high latitudes over Eurasia. The SH is the most crucial high-pressure system confined to the low-level troposphere over Eurasia during boreal winter. It dominates the atmospheric circulation and the associated climate anomalies of almost the entire continental Asia [22,23,24], and can also regulate the downstream circulations over the North Pacific and even farther afield [21,25]. For example, Fu et al. [26] demonstrated that an enhanced SH in a previous winter intends to trigger an SST anomaly pattern connected with the La Niña in the equatorial central and Eastern Pacific in the following winter. Considering that the tropical air–sea interaction has been revealed strongly related to variations in the extratropical Pacific [15], it can be reasonably presumed that this continental high can also make a remote impact on WNP environmental circulations, and thus on TCGF.
Many studies have proposed the interdecadal change in the relationship between WNP TCs and SST [27,28,29], summer monsoon [30,31], North Atlantic Oscillation (NAO) [32], and et al. These indicate that the impacts of climatic factors on TCs are elastic during different periods. The intention of this study is to reveal the plausible impact of the boreal winter SH on the following summer WNP TCGF. In order to prevent this possible impact from being submerged in the long-time series, interdecadal change in the relationship between the winter SH and summer WNP TCGF will be investigated, and possible mechanisms for such interdecadal change will be proposed. The remainder of this paper is organized as follows. Data and Methodology are introduced in Section 2. In Section 3, a relationship between the winter SH and WNP TCGF in the following summer is detected. The interdecadal change and possible causes of this relationship will be examined in this section. The summary and discussion are presented in Section 4.
2. Data and Methods
In this study, the WNP TC database created by the China Meteorological Administration [33,34] is employed. The monthly European Center for Medium-Range Weather Forecasts (ECMWF) reanalysis generation 5 (ERA5) dataset [35] with a horizontal resolution of 2.5° × 2.5° is used in this study, and variables include sea level pressure (SLP), surface winds, pressure-level winds, vertical velocity, and specific humidity. SST data are provided by the Hadley Centre Sea Ice and Sea Surface Temperature dataset (HadISST) [36], with a horizontal resolution of 1.0° × 1.0°. Monthly mean precipitation rate data are from the Global Precipitation Climatology Project (GPCP) version 2.3 combined precipitation dataset [37], with a horizontal resolution of 2.5° × 2.5°. All analyses are carried out during the period of 1980–2020. The anomaly is achieved as the departure from the climatological mean of 1981–2010, where the long-term linear trend is also removed.
Numbers of TCs in June, July, and August (JJA) with maximum wind speed greater than 17.2 m/s are added up as the summer TCGF index. The SH index proposed by Gong and Ho [22] as the mean SLP anomalies over the main activity region of the SH (40° N–60° N, 70° E–120° E) is utilized to represent the intensity of SH, and the variation of SH during late winter (January-February-March, JFM) is focused on in this study. The Niño3.4 index, defined as the averaged SST anomalies over (5° S–5° N, 170° W–120° W), is employed to represent the ENSO variability. The NPO index is defined as the second principal component time series (PC2) corresponding to the Empirical Orthogonal Function of SLP anomalies over (120° E–80° W, 20° N–60° N) [17]. The AL index is calculated by area-averaged SLP anomalies over (30° N–65° N, 160° E–140° W) [38]. The EAWM index is defined as the land-sea SLP difference between (20° N–60° N, 110° E) and (20° N–60° N, 160° E) [39]. The statistical significances of regression and correlation analyses are assessed using the two-tailed Student’s t-test.
3. Relationship between the Winter SH and WNP TCGF in the Following Summer
3.1. Interdecadal Change
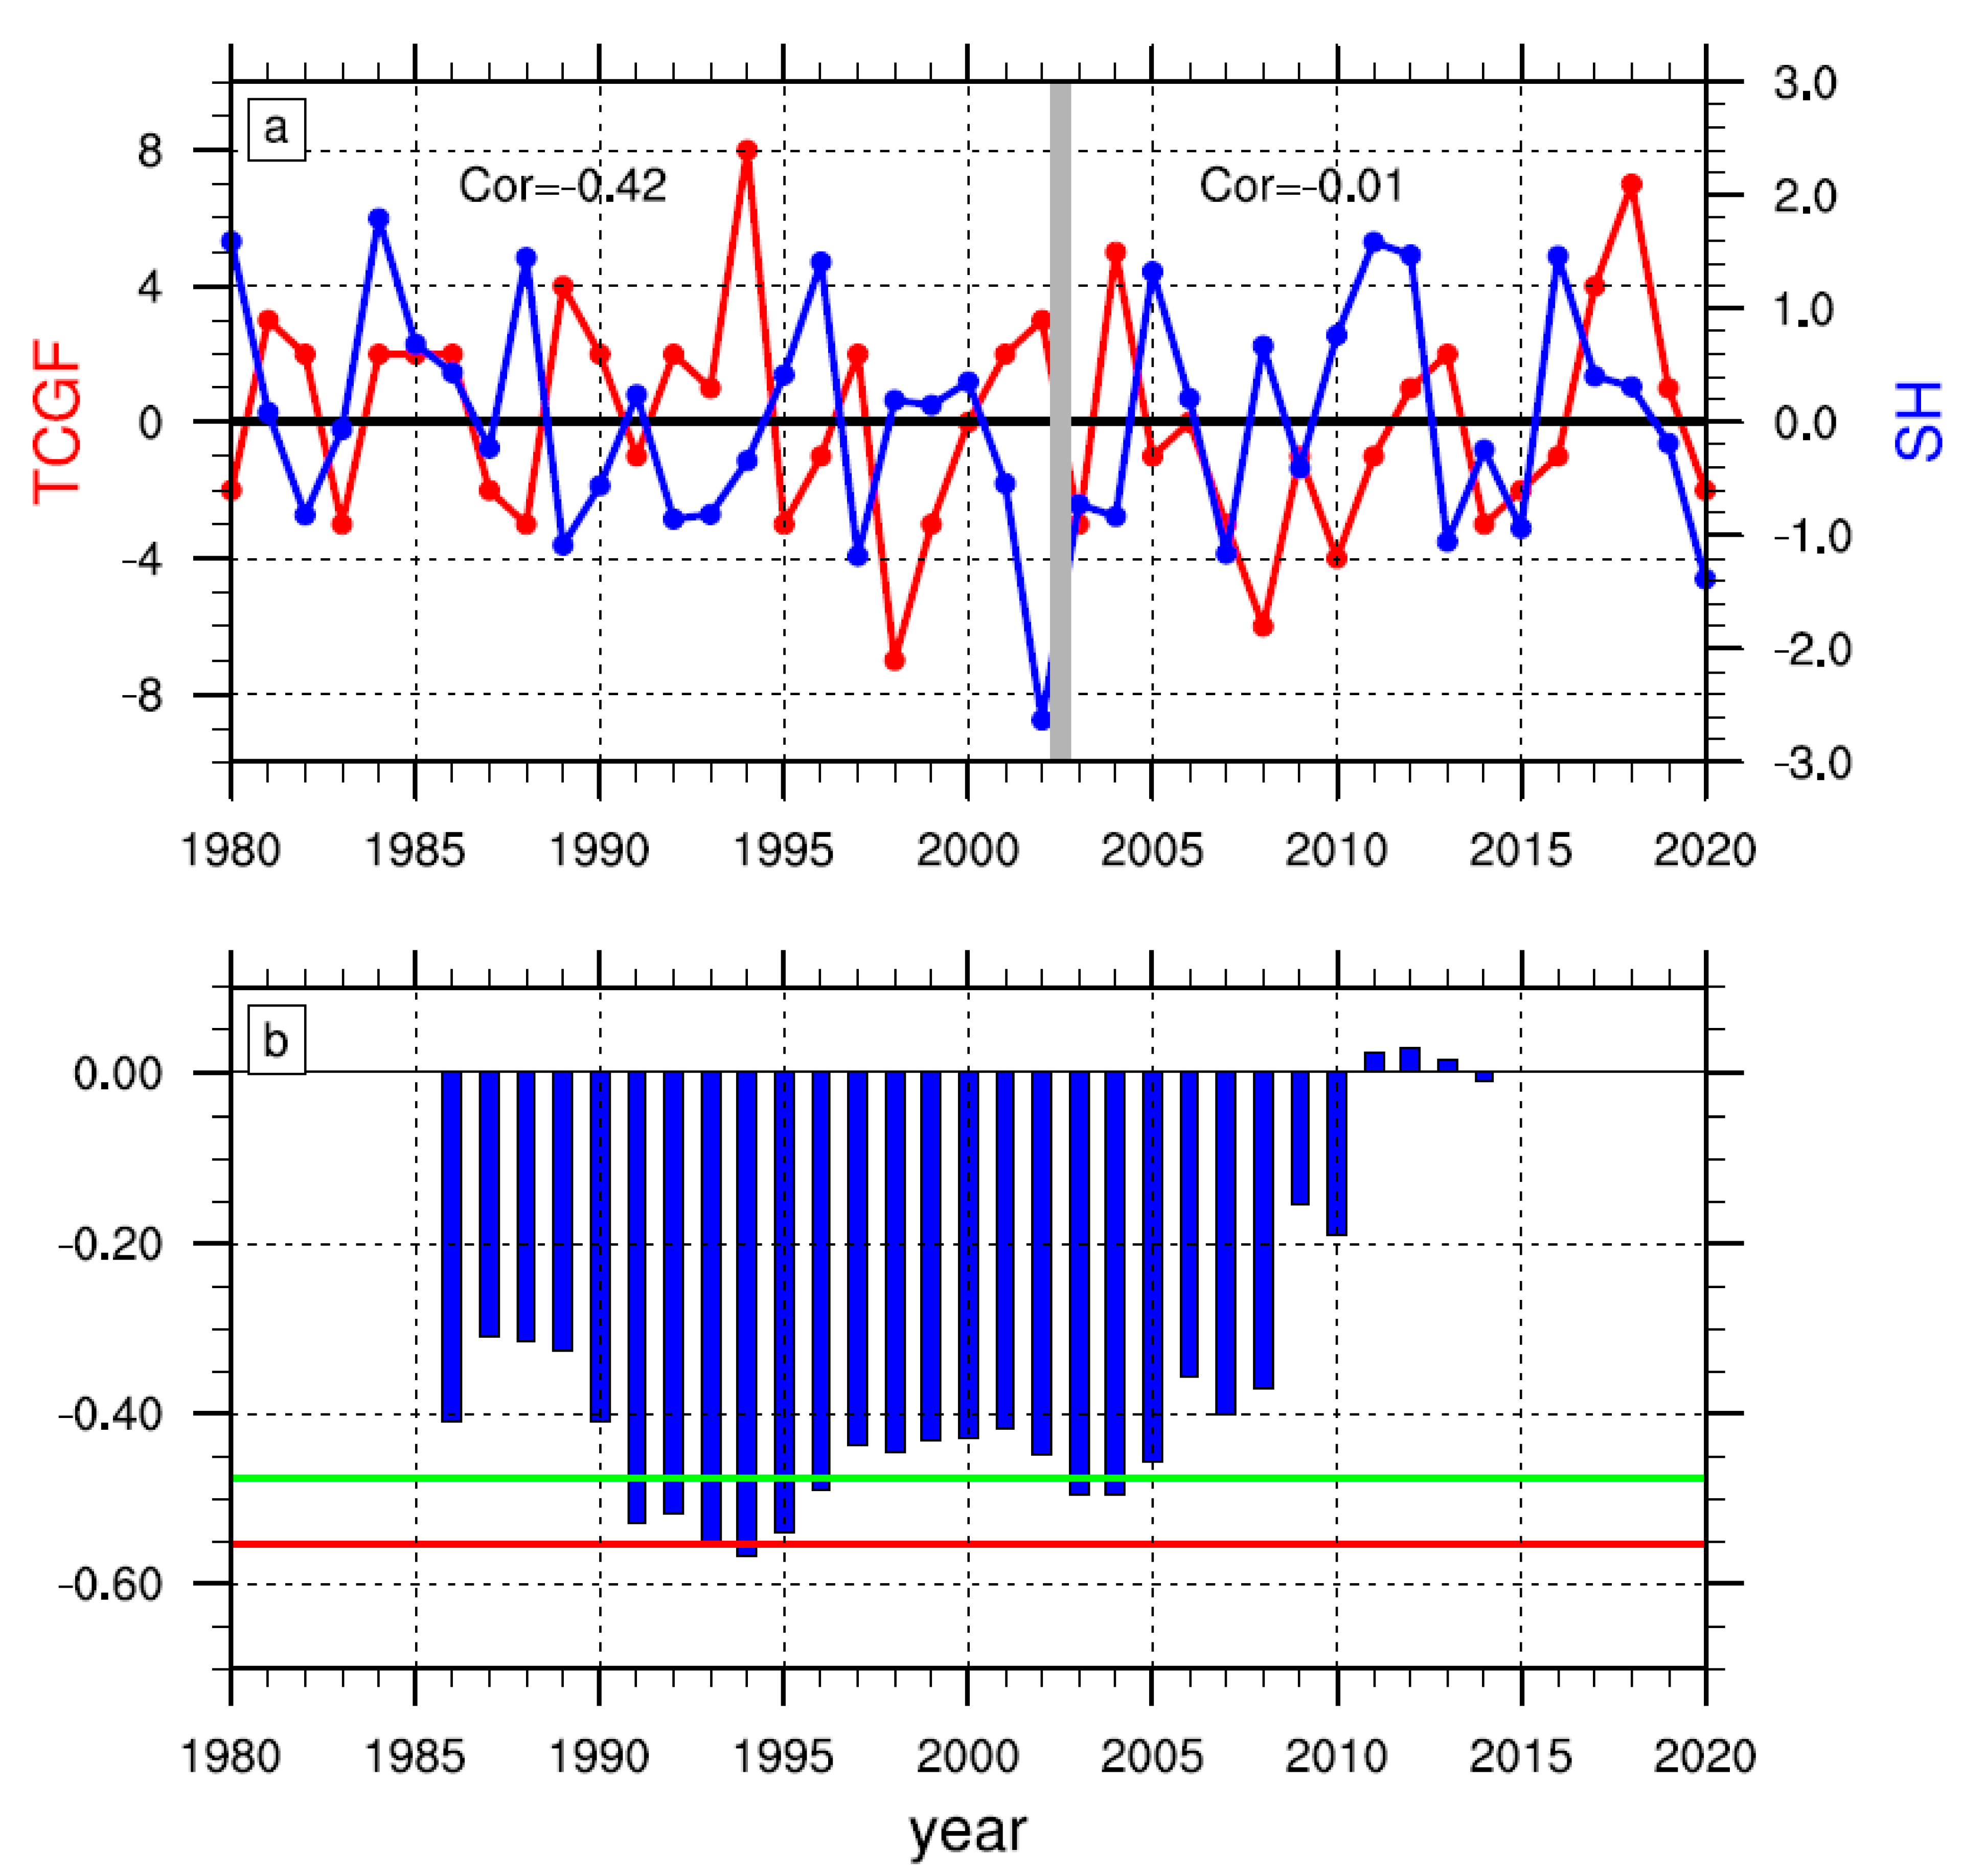
As clearly shown in Figure 1a, the winter SH and summer WNP TCGF exhibit pronounced annual variation. The correlation coefficient of these two indices during the whole data period is −0.24, where the significant correlation coefficient at 90% confidence level is about −0.264. Figure 1b shows sliding correlations between these two indices, with a 13-year moving window during 1980–2020. The SH–TCGF correlation is significantly negative in the last two decades of the 20th century, and reaches a minimum around the early 1990s. Additionally, the SH–TCGF relationship weakens obviously from the 2000s onward. These results indicate evident interdecadal change in the relationship between the winter SH and summer TCGF over the WNP in recent decades.
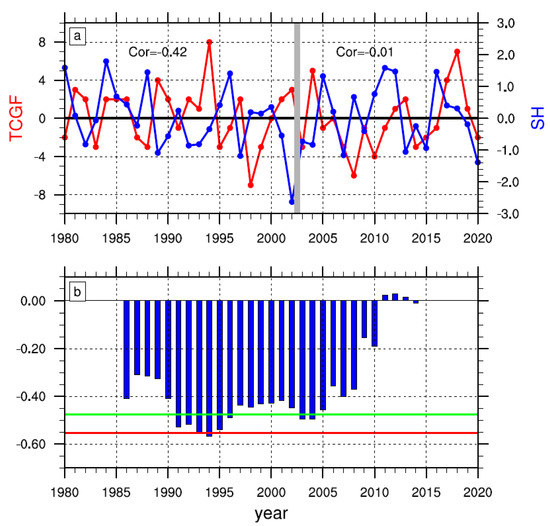
Figure 1.
(a) Time series of the (blue) JFM SH index and (red) JJA TCGF index during 1980–2020. The correlation coefficients shown in the upper left and right are correlations during 1980–2002 and 2003–2020, respectively. (b) The 13-year sliding correlation coefficients between JFM SH index and JJA TCGF index during 1980–2020. The solid green (red) line indicates statistical significance at 90% (95%) confidence level based on the two-sided Student’s t-test.
Note that the interdecadal change in the SH–TCGF correlation is dominantly characterized by a striking contrast between 1980–2002 (referred to as P1) and 2003–2020 (referred to as P2). The correlation coefficient is about −0.42 in P1 but −0.01 in P2, whereas the one in P1 approaches the threshold of −0.41 for the 95% confidence level. The difference in correlation coefficients between the two periods is also significant at the 95% confidence level based on the Fisher z transformation [40], confirming a striking contrast in SH–TCGF correlations between P1 and P2.
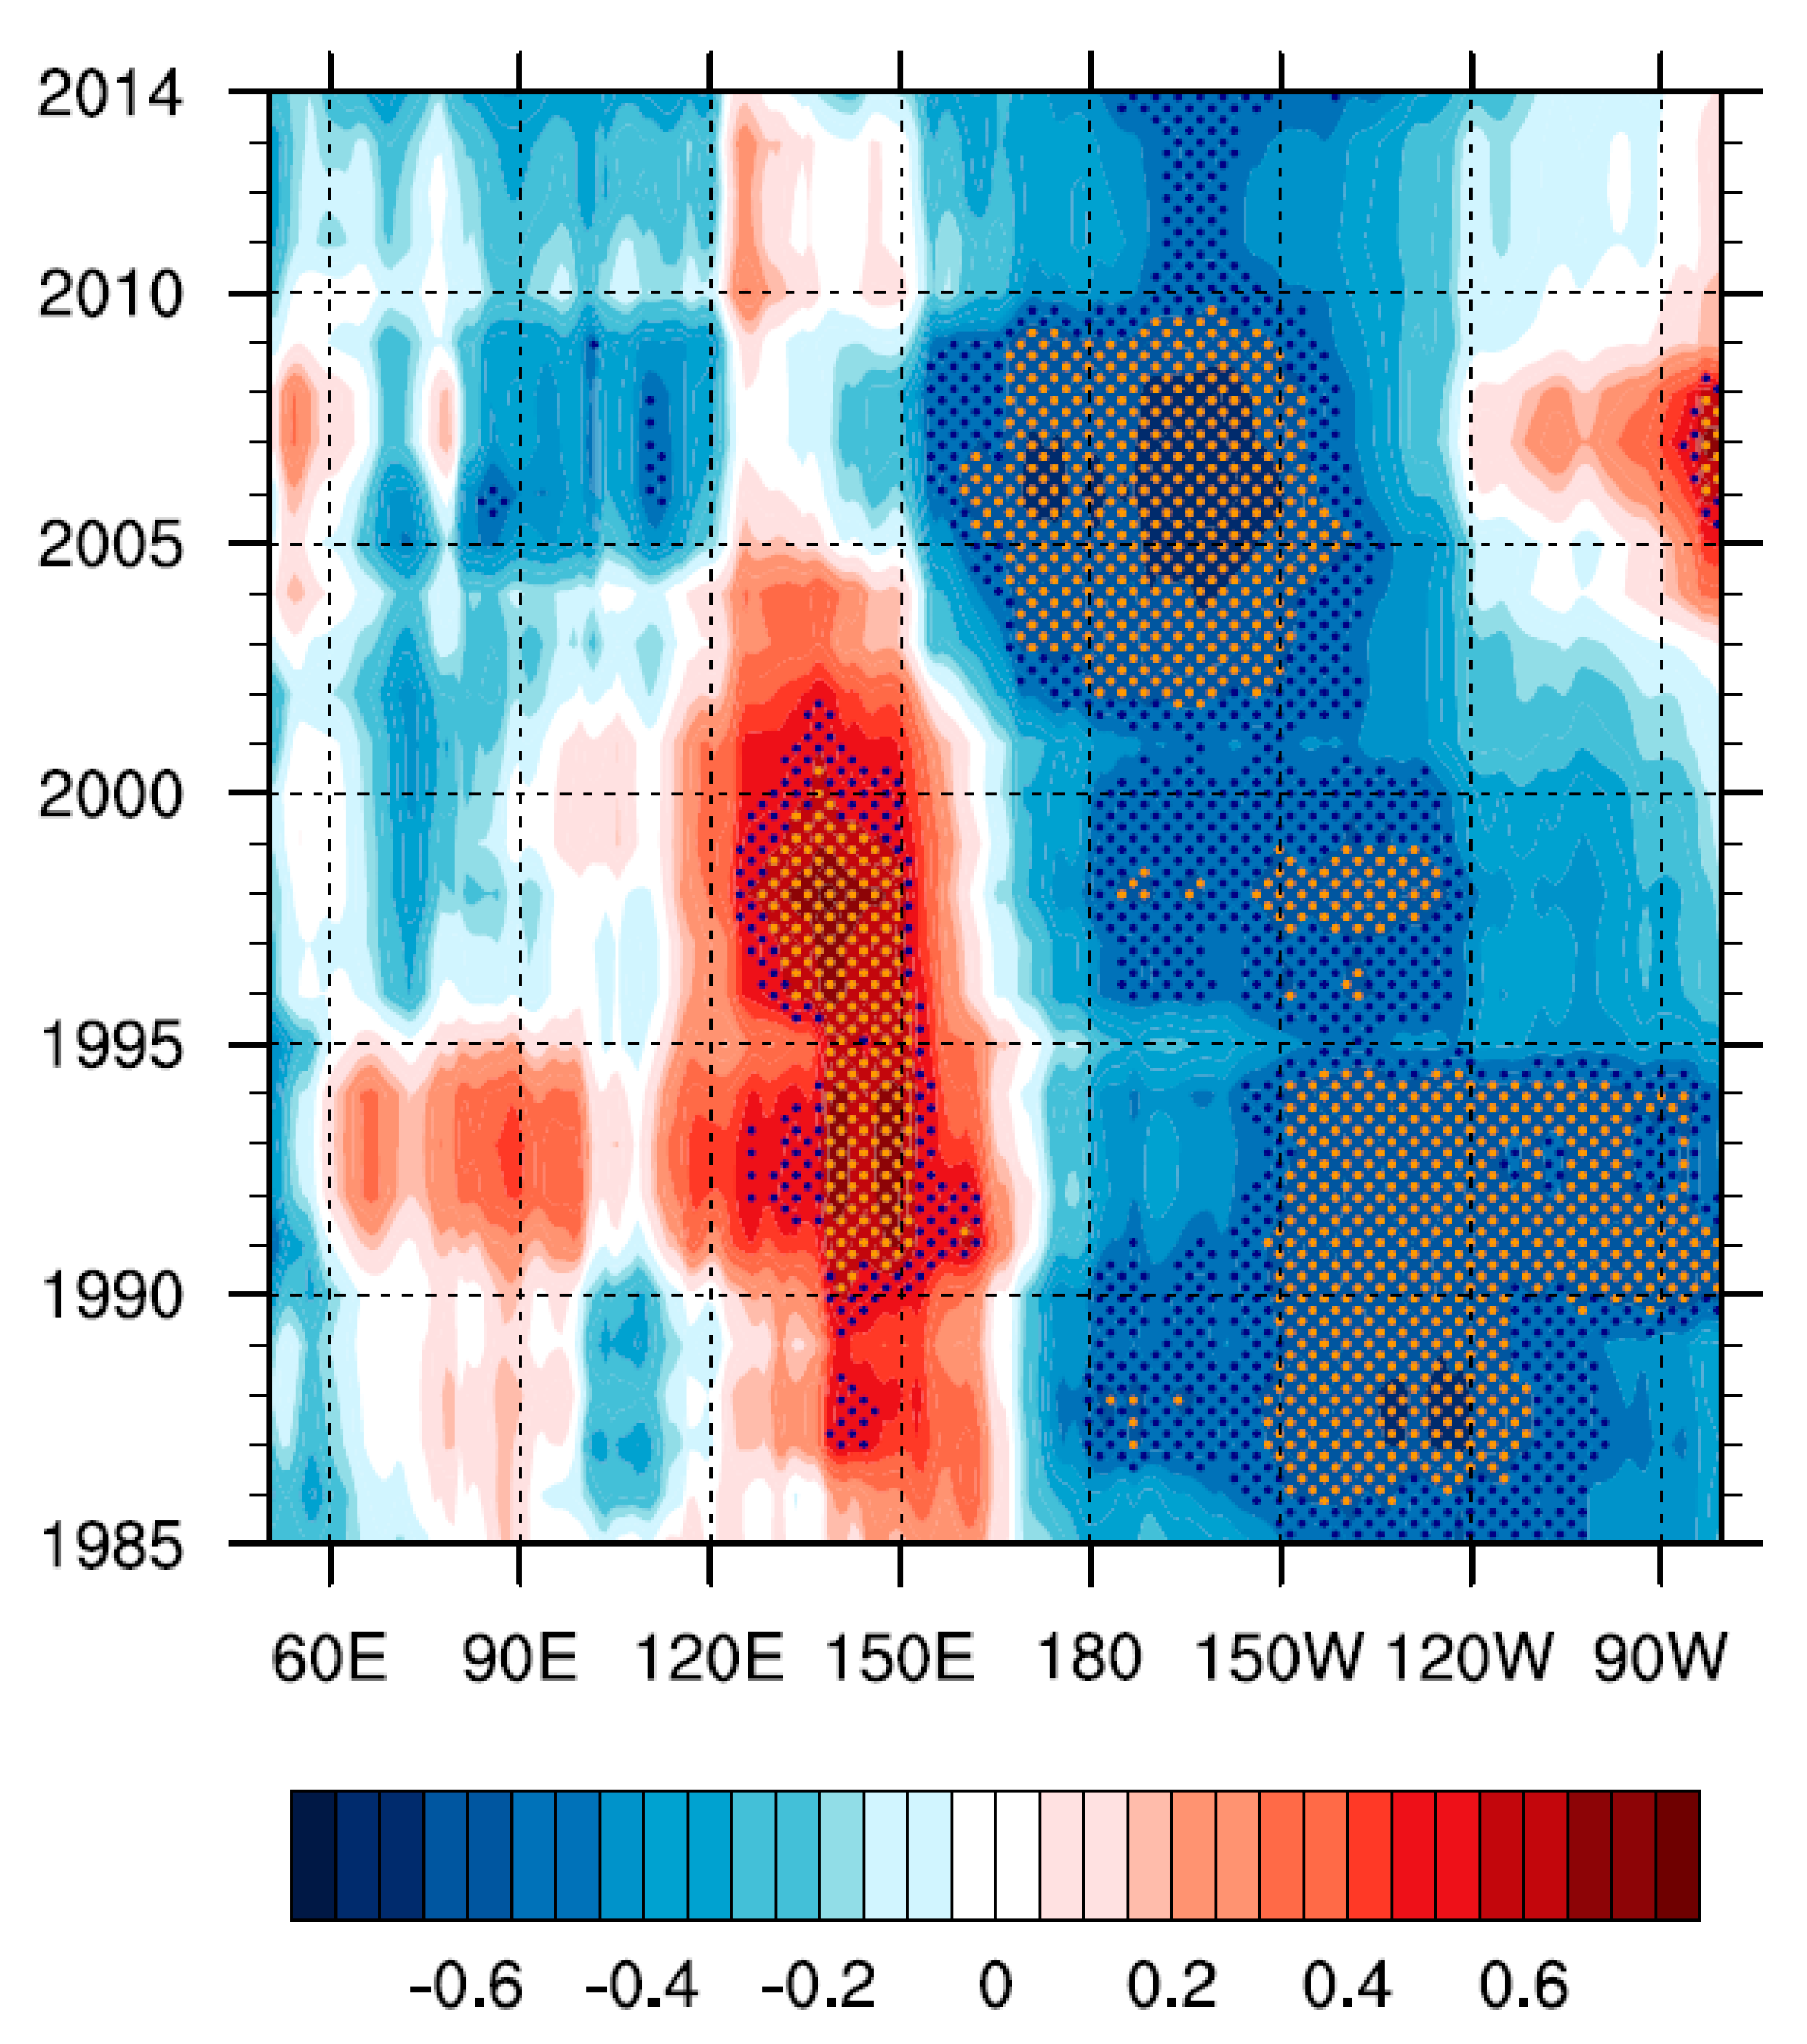
Figure 2 shows a clear contrast in spatial correlations between the winter SH and summer tropical SST anomalies during P1 and P2. Significant positive and negative correlation coefficients are displayed in the WNP and eastern tropical Pacific during P1, respectively, showing the typical La Niña pattern. Entering P2, the correlations become negative and stronger in the central tropical Pacific, validating the changed relationship between the winter SH and possible summer tropical SST response between P1 and P2.
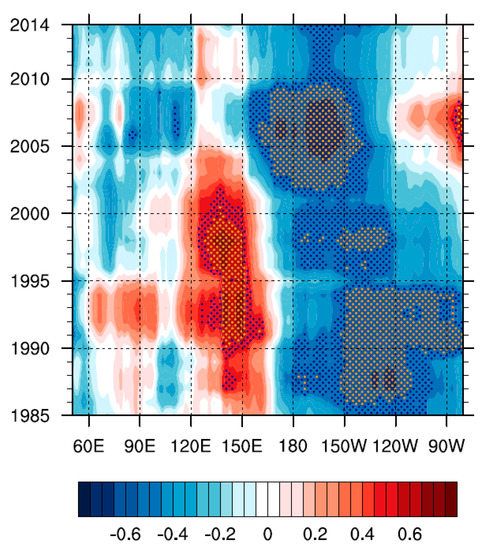
Figure 2.
Evolution of tropical (5° S–15° N-averaged) JJA SST anomalies obtained by a 13-year sliding correlation on the JFM SHI index. Black (yellow) dots indicate significant correlation coefficients above the 90% (95%) confidence level based on the two-sided Student’s t-test.
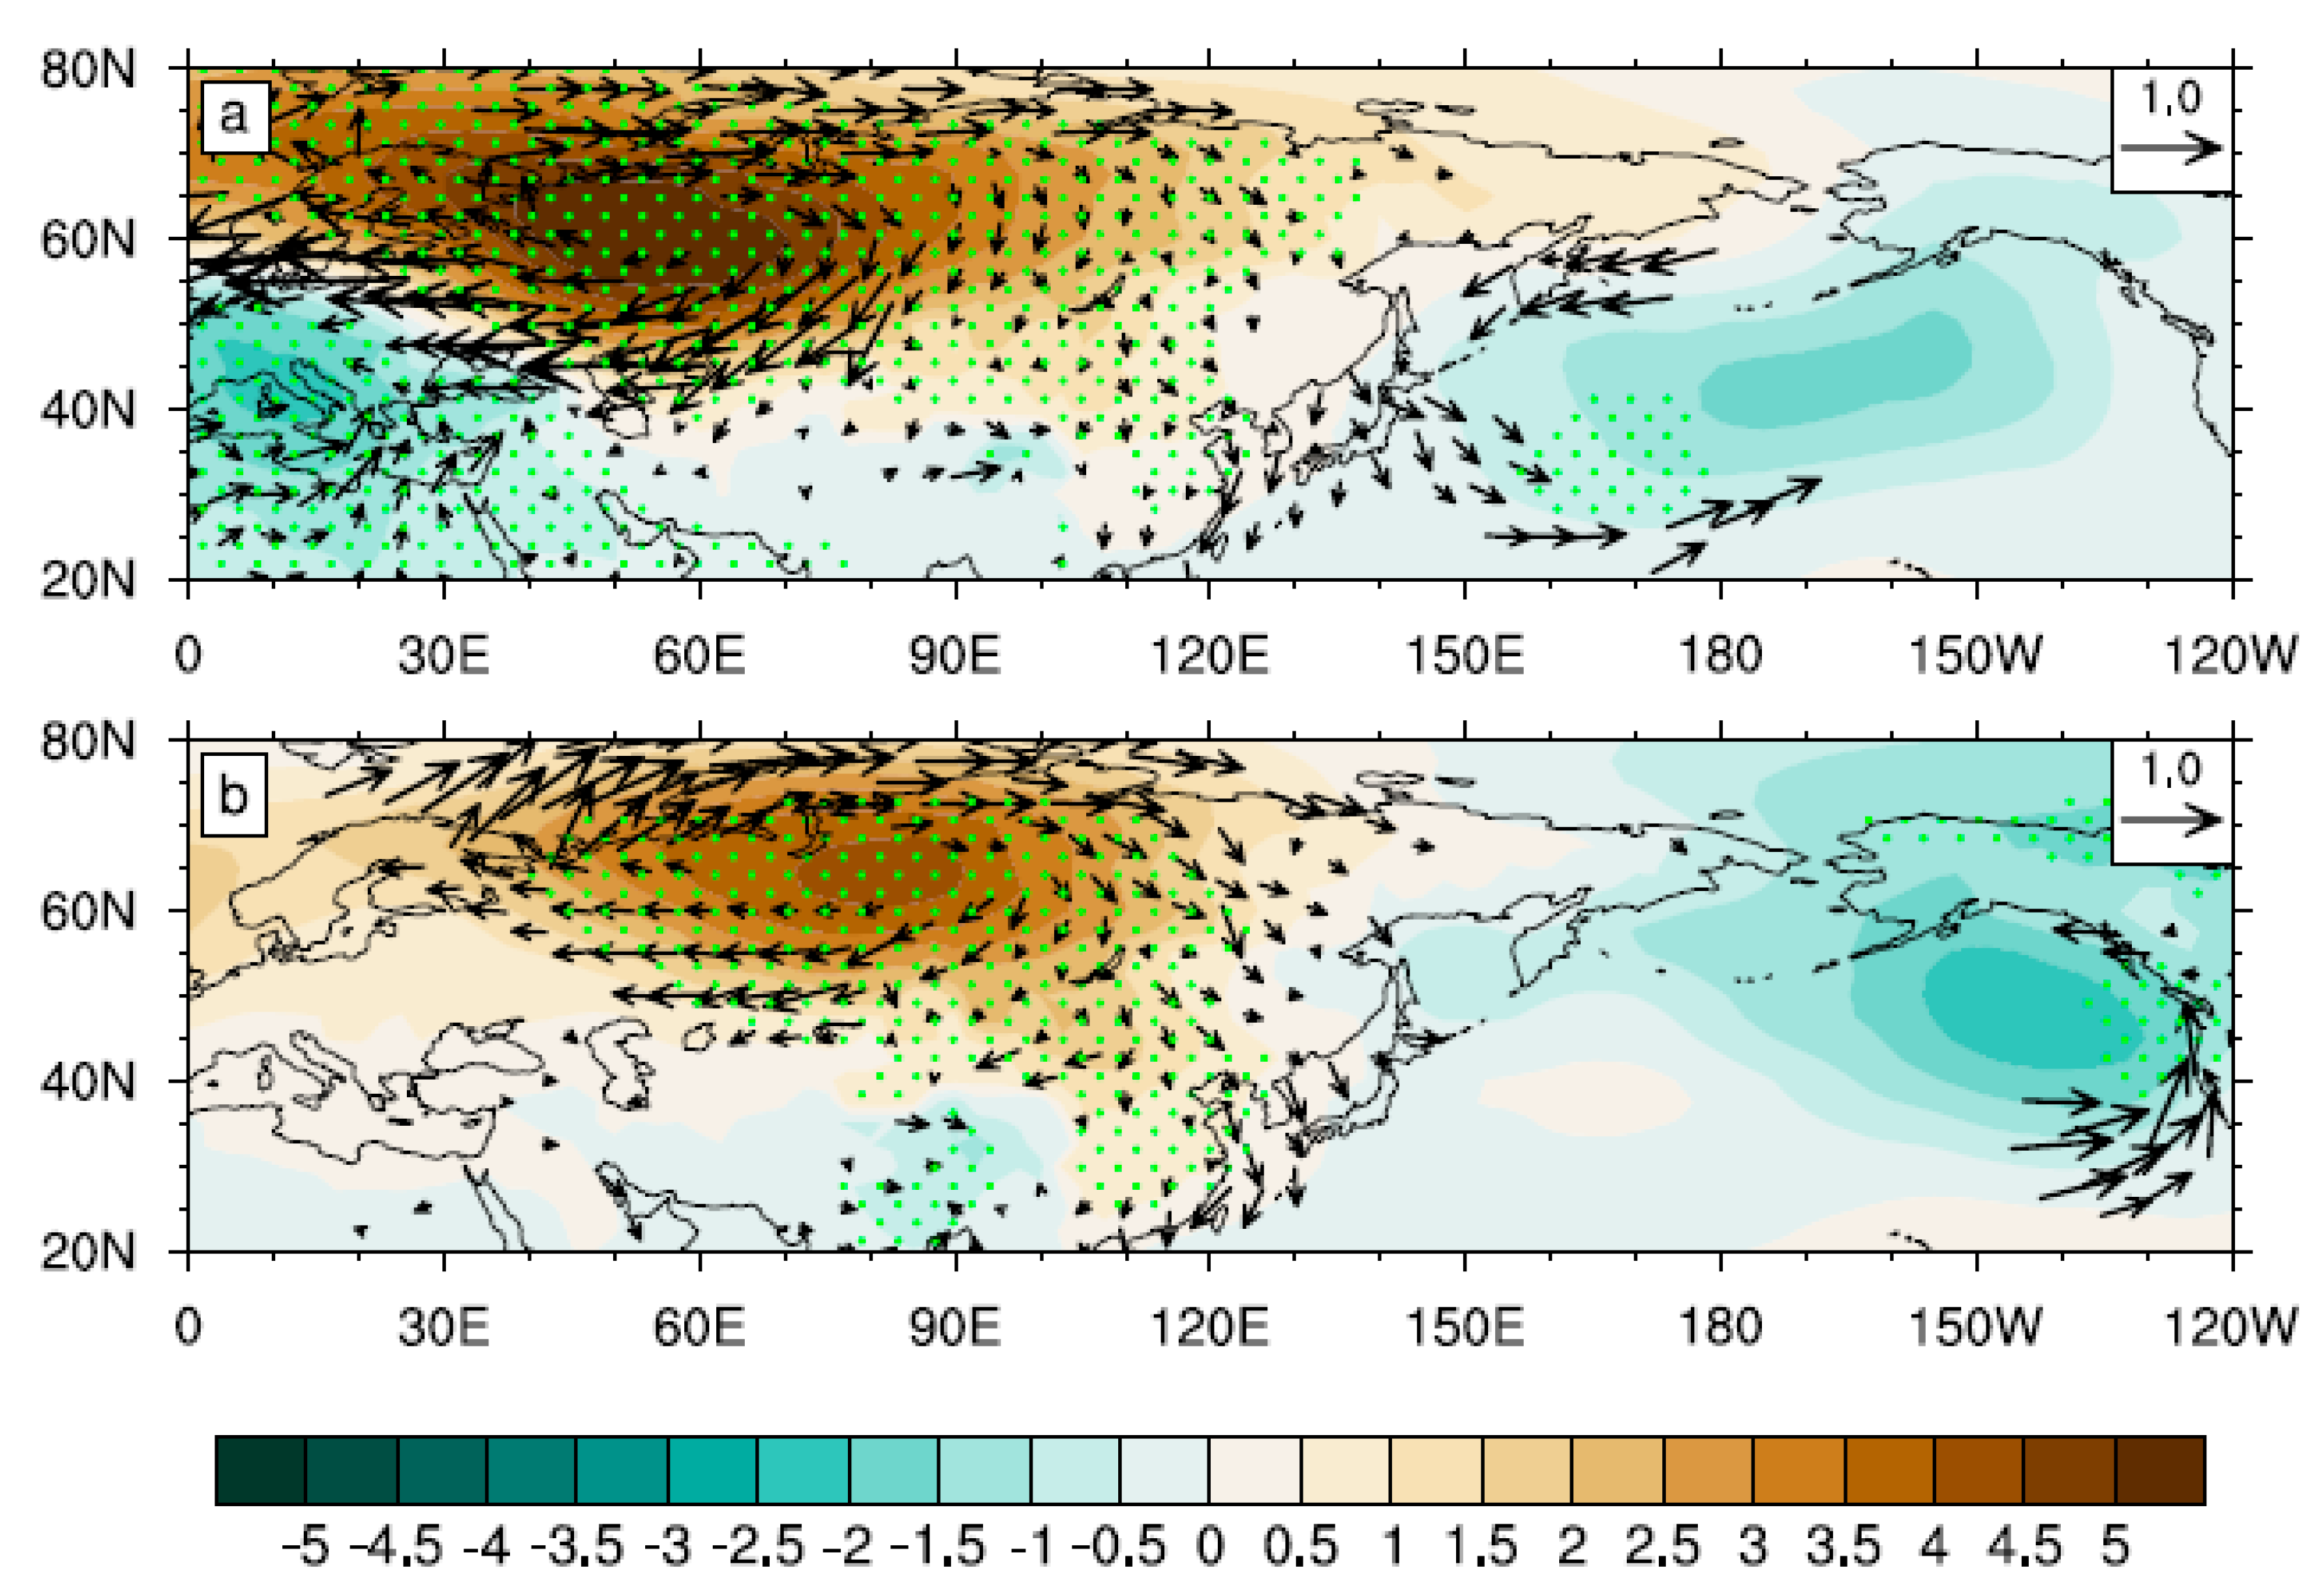
Since the SST response is obviously different between P1 and P2, does this arise from the climatic characteristics of SH having changed between the two different periods? As shown in Figure 3, although the SLP anomalies regressed against the SH index are generally characterized by a positive anomaly over the middle-to-high latitude Eurasia for the two periods, the center positions and amplitude of the SH, and the downstream EAWM and AL, are quite different during P1 and P2. This indicates that the changing relationship between the winter SH and summer WNP TCGF is likely related to interdecadal changes in the patterns of SH-associated circulation anomalies and air–sea responses.
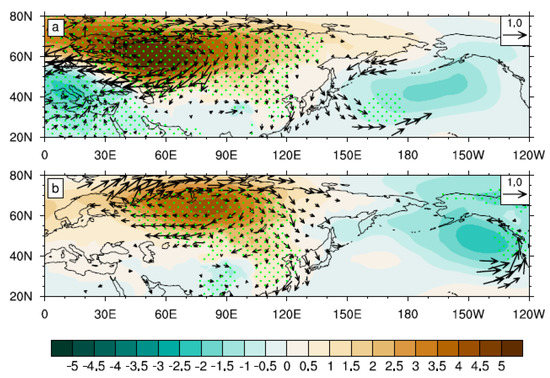
Figure 3.
Regression of 10 m winds (vectors, exceeding the 95% significance level based on the two-sided Student’s t-test, unit: m/s) and SLP (shading, hPa) anomalies in JFM onto the normalized JFM SH index during (a) 1980–2002 and (b) 2003–2020. The green dots denote the significant SLP anomalies above the 95% confidence level based on the two-sided Student’s t-test.
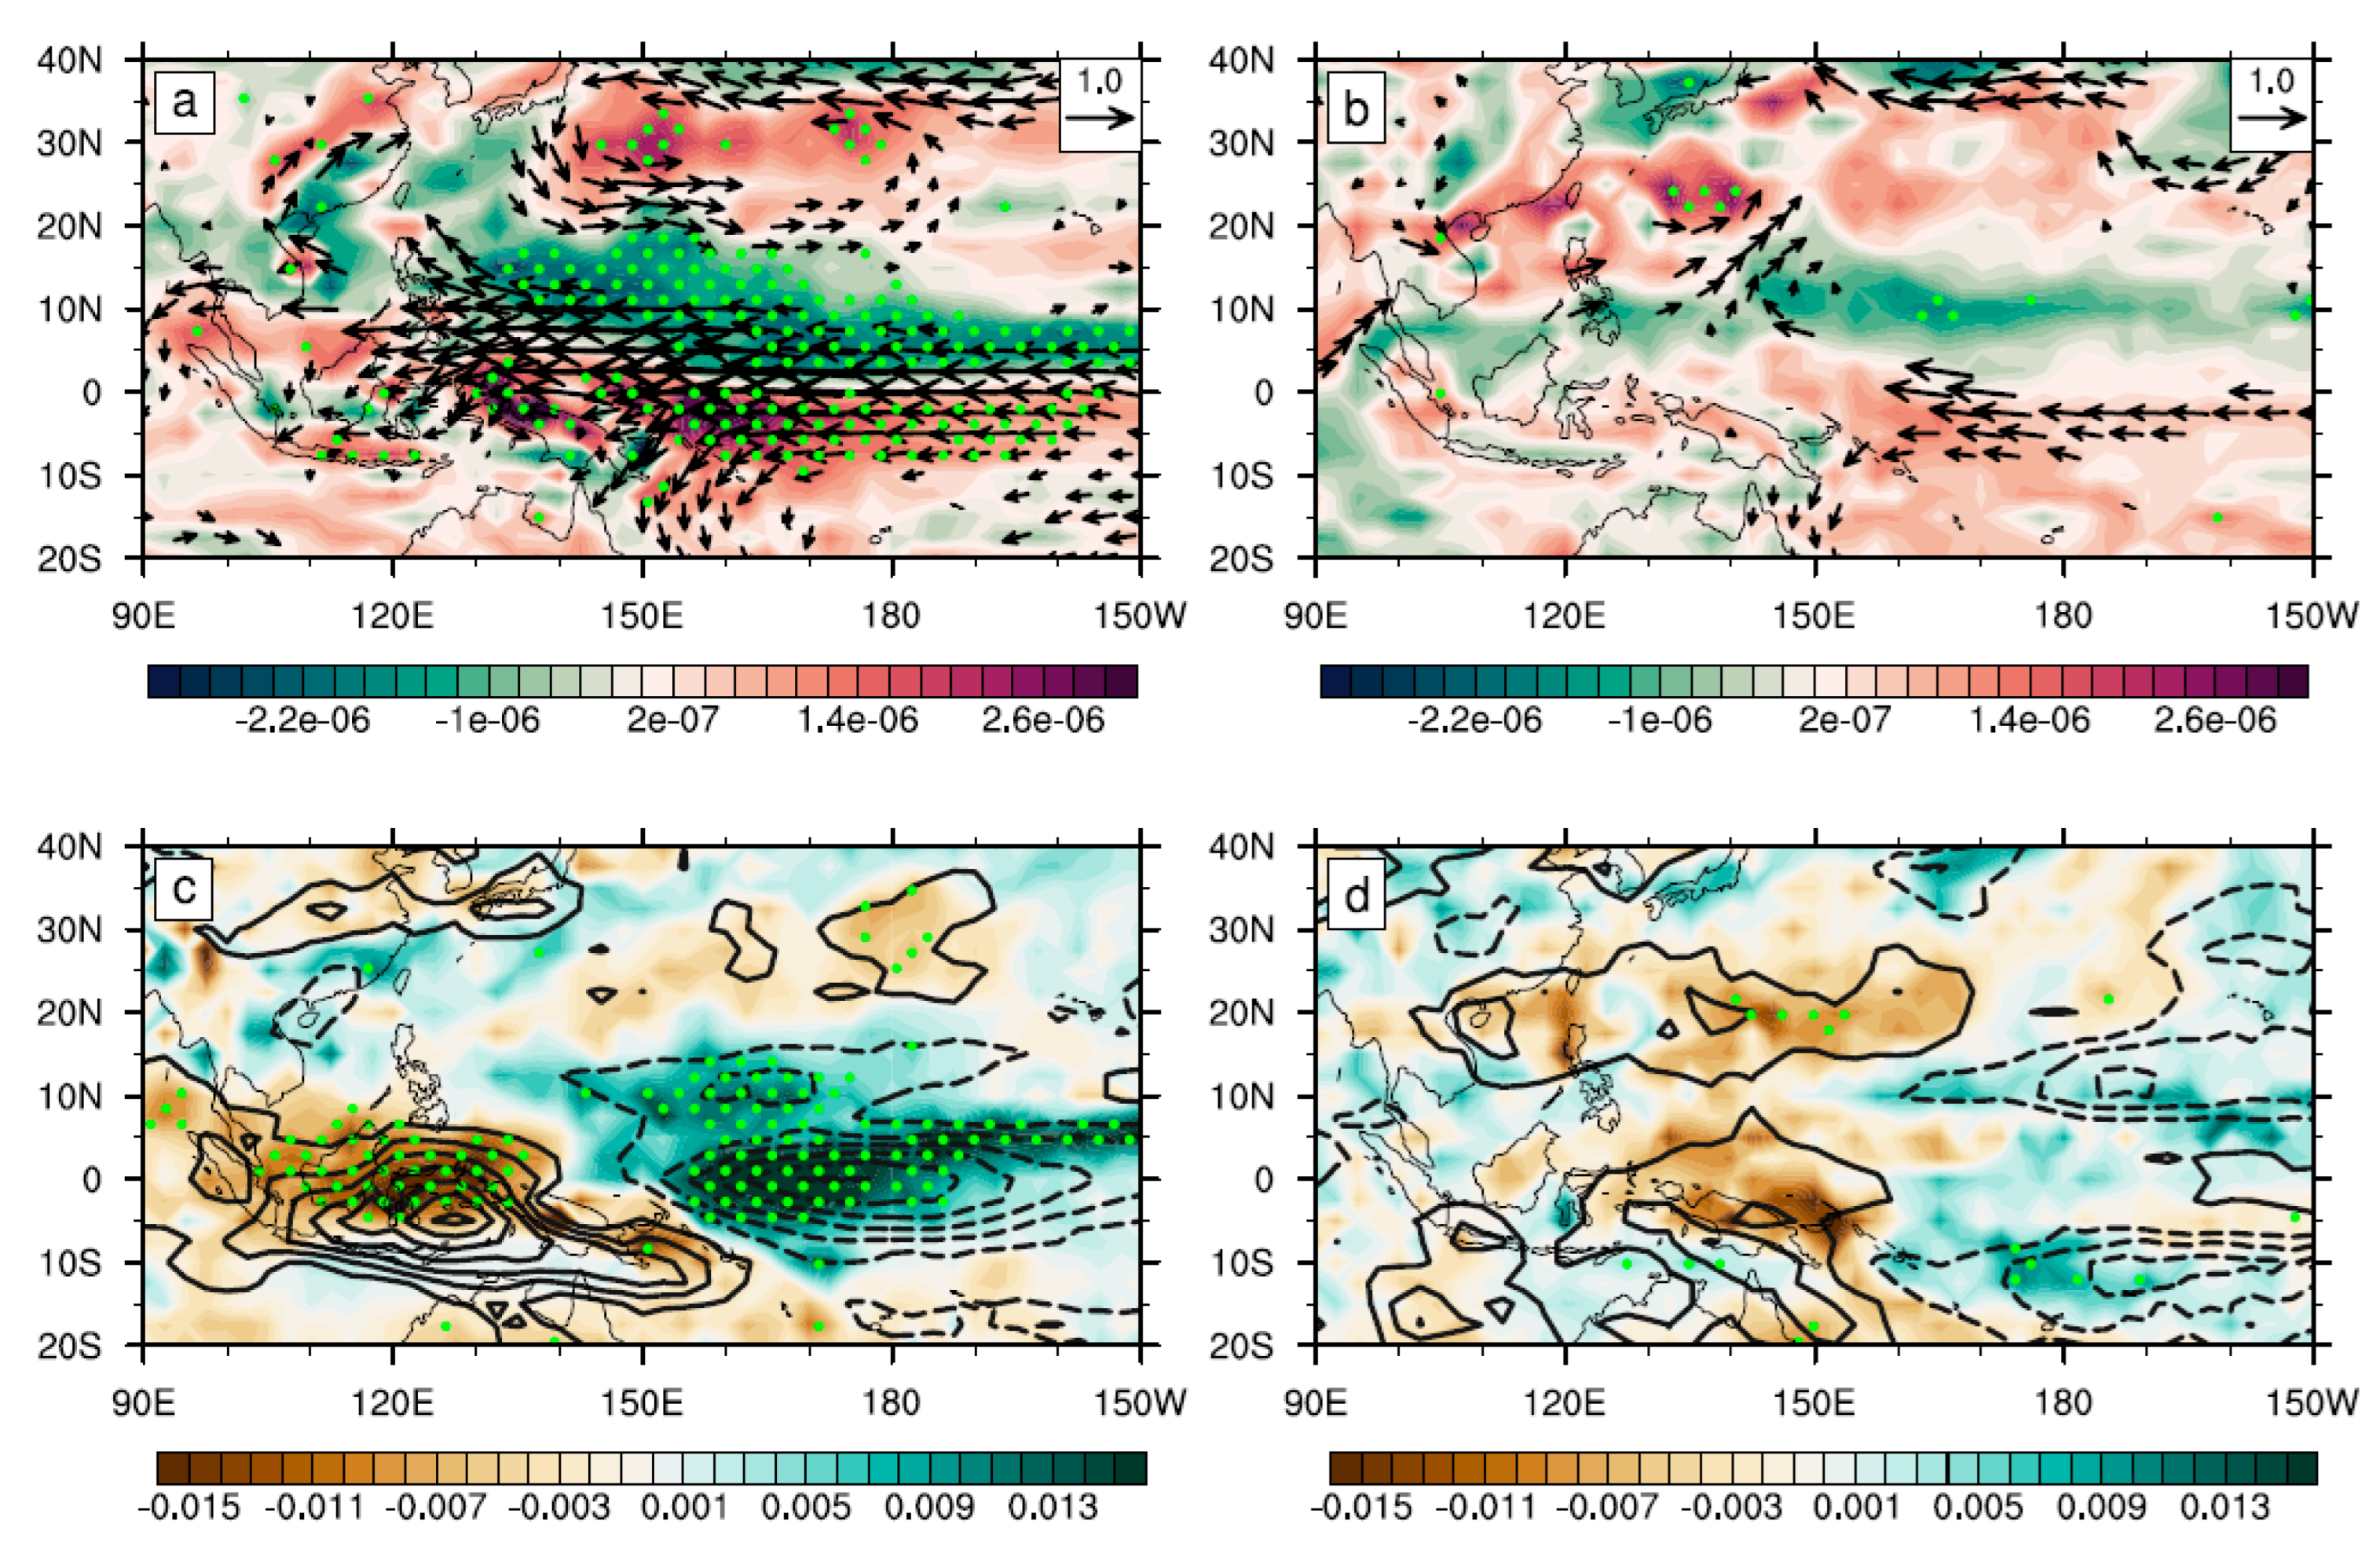
Considering that the large-scale background circulation anomaly can greatly influence a TCGF anomaly by modulating environmental factors, Figure 4 and Figure 5 illustrate contrasts in summer atmospheric circulation anomalies and the relevant environmental factors associated with the previous winter SH between P1 and P2. It is evident that WNP features significant anticyclonic circulation and negative vorticity anomalies during P1. Significant descending motion extends from the tropical western Pacific to the coastal waters of China, coupled with negative relative humidity. This environmental background anticyclonic circulation with dry sinking air makes a negative contribution to the genesis of TCs. During P2, there is no significant environmental responses in the WNP, which corresponds to the weakened relationship between the SH and WNP TCGF.
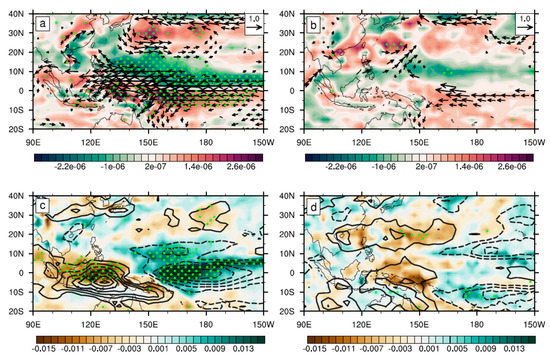
Figure 4.
Regression of (a,b) 850 hPa winds (vectors, exceeding the 95% significance level based on the two-sided Student’s t-test, unit: m/s) and relative vorticity (shading; s−1) anomalies, (c,d) 500 hPa vertical velocity (shading, Pa/s) and 700 hPa specific humidity (contours, interval of 0.1 g/kg; zero contours are omitted) anomalies in JJA onto the normalized JFM SH index during (a,c) 1980–2002 and (b,d) 2003–2020. The green dots in (a–d) denote the significant relative vorticity and vertical velocity anomalies above the 95% confidence level based on the two-sided Student’s t-test, respectively.
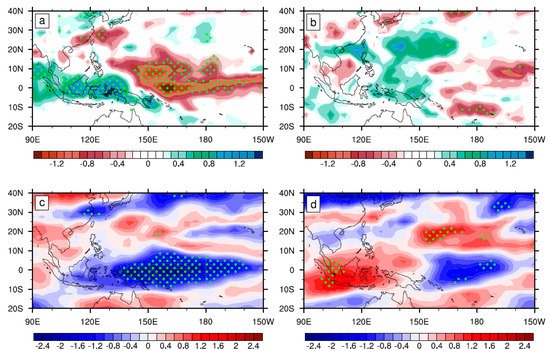
Figure 5.
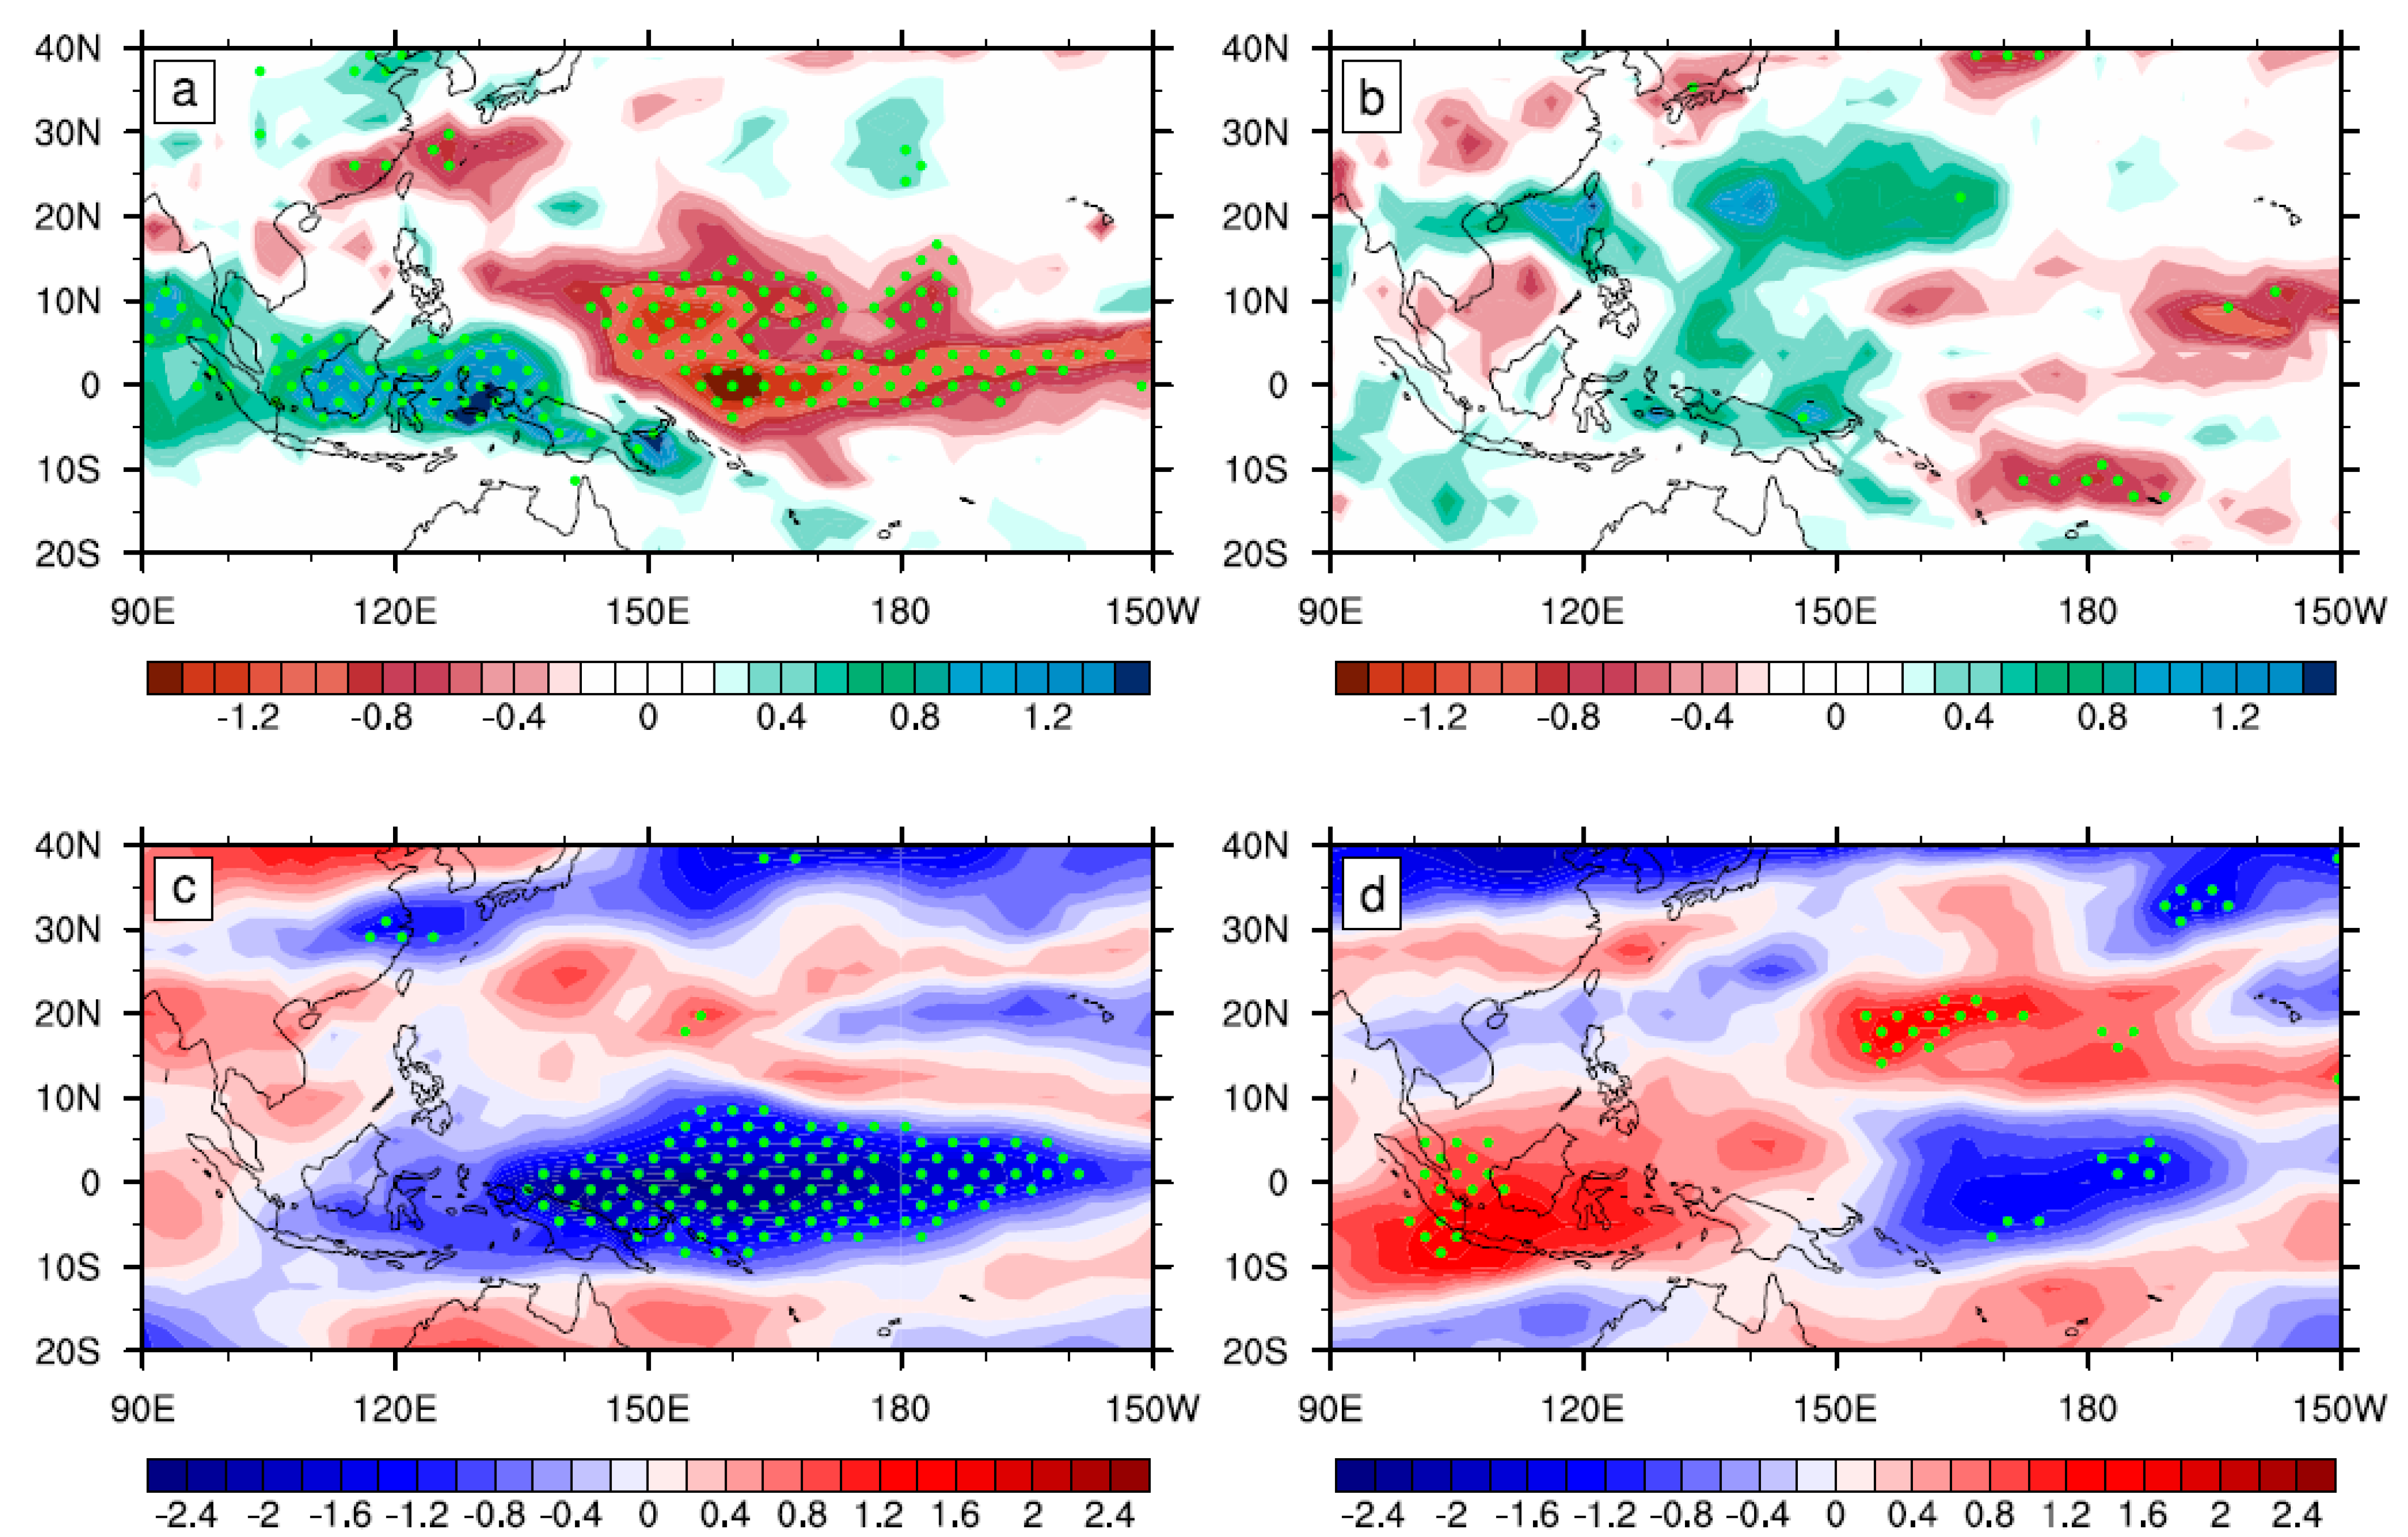
Regression of (a,b) surface precipitation rate (shading, mm/day) and (c,d) vertical wind shear (shading, m/s; 200 hPa minus 850 hPa) anomalies in JJA onto the normalized JFM SH index during (a,c) 1980–2002 and (b,d) 2003–2020. The green dots in (a–d) denote the significant surface precipitation rate and vertical wind shear anomalies above the 95% confidence level based on the two-sided Student’s t-test, respectively.
In addition, WNP heating as represented by the precipitation rate features a significant cooling anomaly during P1. Weakened vertical wind shear between the upper and lower layers significantly occurs over the tropical western Pacific, but its anomalies show relatively strong but insignificant vertical wind shear over the subtropical western Pacific. During P2, WNP heating still has no significant response, although vertical wind shear anomalies show significantly positive over the subtropical central-western Pacific.
3.2. Possible Causes of the Changed Relationship
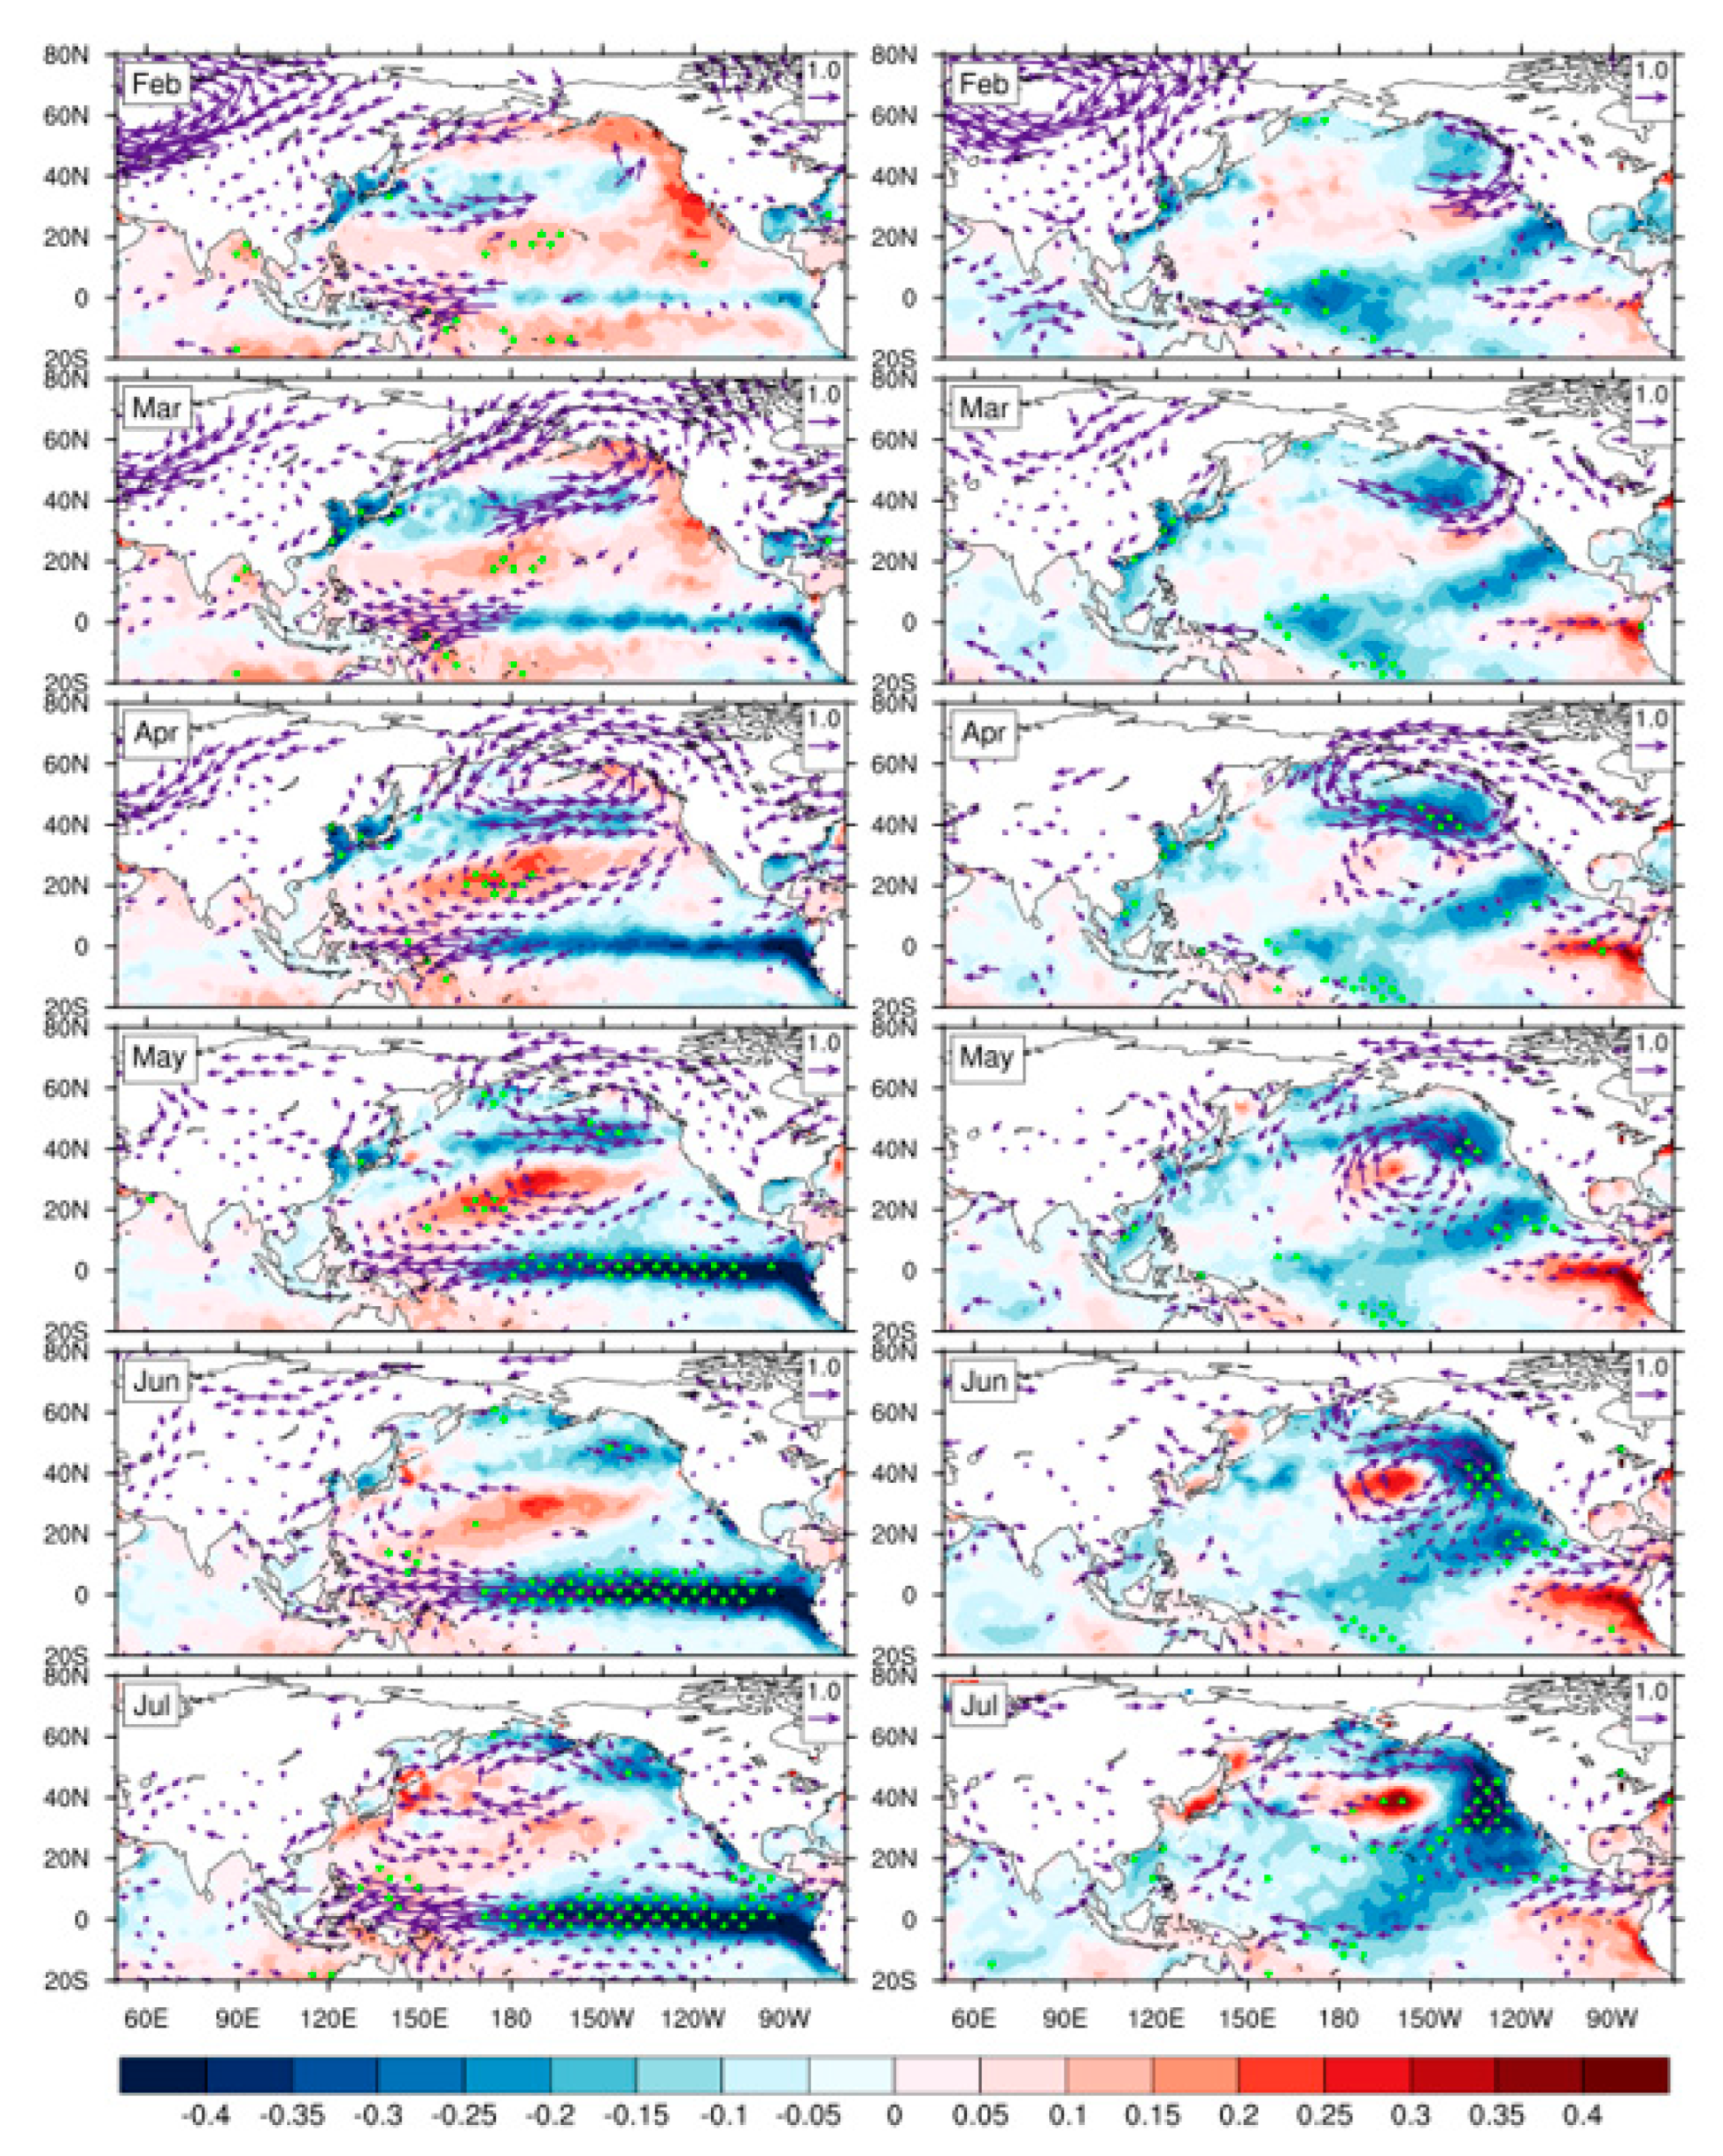
For purpose of exploring the distinct features of air–sea responses from previous winter SHs, the regressed atmospheric circulations in terms of 850 hPa wind and SST anomalies during P1 and P2 are conducted, as displayed in Figure 6. It is clear that during P1, when the SH is anomalously strengthened in winter, there is no significant synchronous SST response in the entire Pacific, but some significant easterly wind anomalies occur over the western tropical Pacific. In the North Pacific, significant low-level westerly wind anomalies occur over around middle latitude and easterly wind anomalies occur over around high latitude, acting as a strong cyclonic atmospheric circulation, namely the AL. Coming to spring, a subtropical anticyclone gradually intensifies. The anomalous AL response in the mid-latitude North Pacific gradually evolves into a meridional dipole distribution pattern with centers around the 60° N and 30° N, respectively, which is illustrated as the NPO mode [20]. Connected with the NPO mode, the SST response in the North Pacific features a remarkable northeast-southwest dipole pattern similar to the negative phase of the VM. The positive SST anomalies in the central subtropical North Pacific are enhanced. Northeasterly wind anomalies in the subtropical Pacific further strengthens and extends the warm pool easterly wind to the tropical central-eastern Pacific. Negative SST anomalies in the equatorial Pacific are enhanced. Entering summer, the easterly wind anomalies develop and cover almost the whole tropical Pacific. Strengthened easterly wind anomalies in the tropical western Pacific deflect northward to the WNP, lead to an anomalous environmental background anticyclonic circulation, and thus restrain the genesis of TCs. The equatorial negative SST anomalies strengthen and extend to the tropical central Pacific and eastern Pacific, presenting typical La Niña development. It can be attributed to the so-called Bjerknes feedback, which positively contributes to the zonal wind and SST gradient [41,42,43,44] and is also consistent with the findings of Fu et al. [26]. These features suggest that the North Pacific is an essential passway of the SH remote influence, where the anomalous air–sea signals will be maintained and developed until the Bjerknes feedback is established.
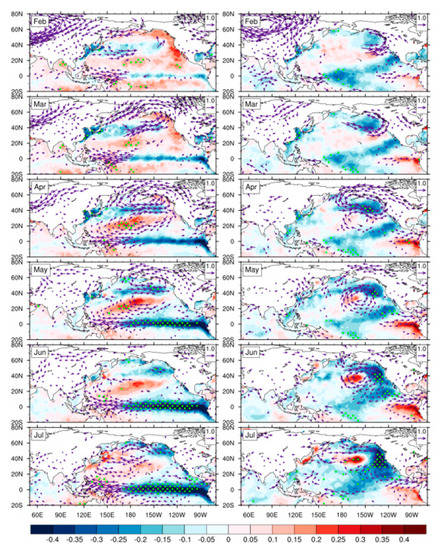
Figure 6.
Monthly evolving spatial patterns of the JFM-SH-index-regressed 850 winds (vectors, exceeding the 95% significance level based on the two-sided Student’s t-test, unit: m/s) and SST (shading, °C) anomalies from February to July during (left panel) 1980–2002 and (left panel) 2003–2020. The green dots denote the significant SST anomalies above the 95% confidence level based on the two-sided Student’s t-test.
Note that the anomalous continental anticyclone during P1 locates west of Eurasia and leads to a weak EAWM, which may be responsible for the significant easterly wind anomalies over the tropical western Pacific in winter. In contrast, the anomalous continental anticyclone during P2 locates eastward and the EAWM presents much stronger. Relatively weak AL occurs over the Northeast Pacific. No significant synchronous SST and low-level wind responses occur in the WNP. Coming to spring, AL gradually develops and induces the subtropical anticyclone intensifying over the subtropical central-eastern Pacific. This subtropical anticyclone locates northeastward to its position during P1, confines the northeasterly wind anomalies in its southeast side, and makes them far away from the tropical Pacific. Entering summer, the subtropical anticyclone decays. There are no more significant atmospheric and oceanic responses remaining over the tropical and subtropical western Pacific.
It is demonstrated that during P1, the winter SH, as a precursor, influences the environmental background of TCGF. Atmospheric circulation anomalies synchronized with winter SH illustrate an enhanced AL response over the North Pacific [45], which reflects the connectivity among atmospheric action centers. North Pacific is the crucial passway linking SH with tropics. Coming to spring, the NPO develops. Prior research has demonstrated that such variation is likely to be derived from the feedback between synoptic eddies and mean flow. At the southern flank of the enhanced AL, westerly wind anomalies are coexisted with an incremental synoptic eddy activity, which contributes to exciting an anticyclonic circulation anomaly over the subtropical North Pacific [38,46]. Easterly wind anomalies are confined and intensified over the tropical Pacific, enhancing the negative SST anomalies in the central-eastern Pacific and inducing an anomalous anticyclonic circulation over the WNP.
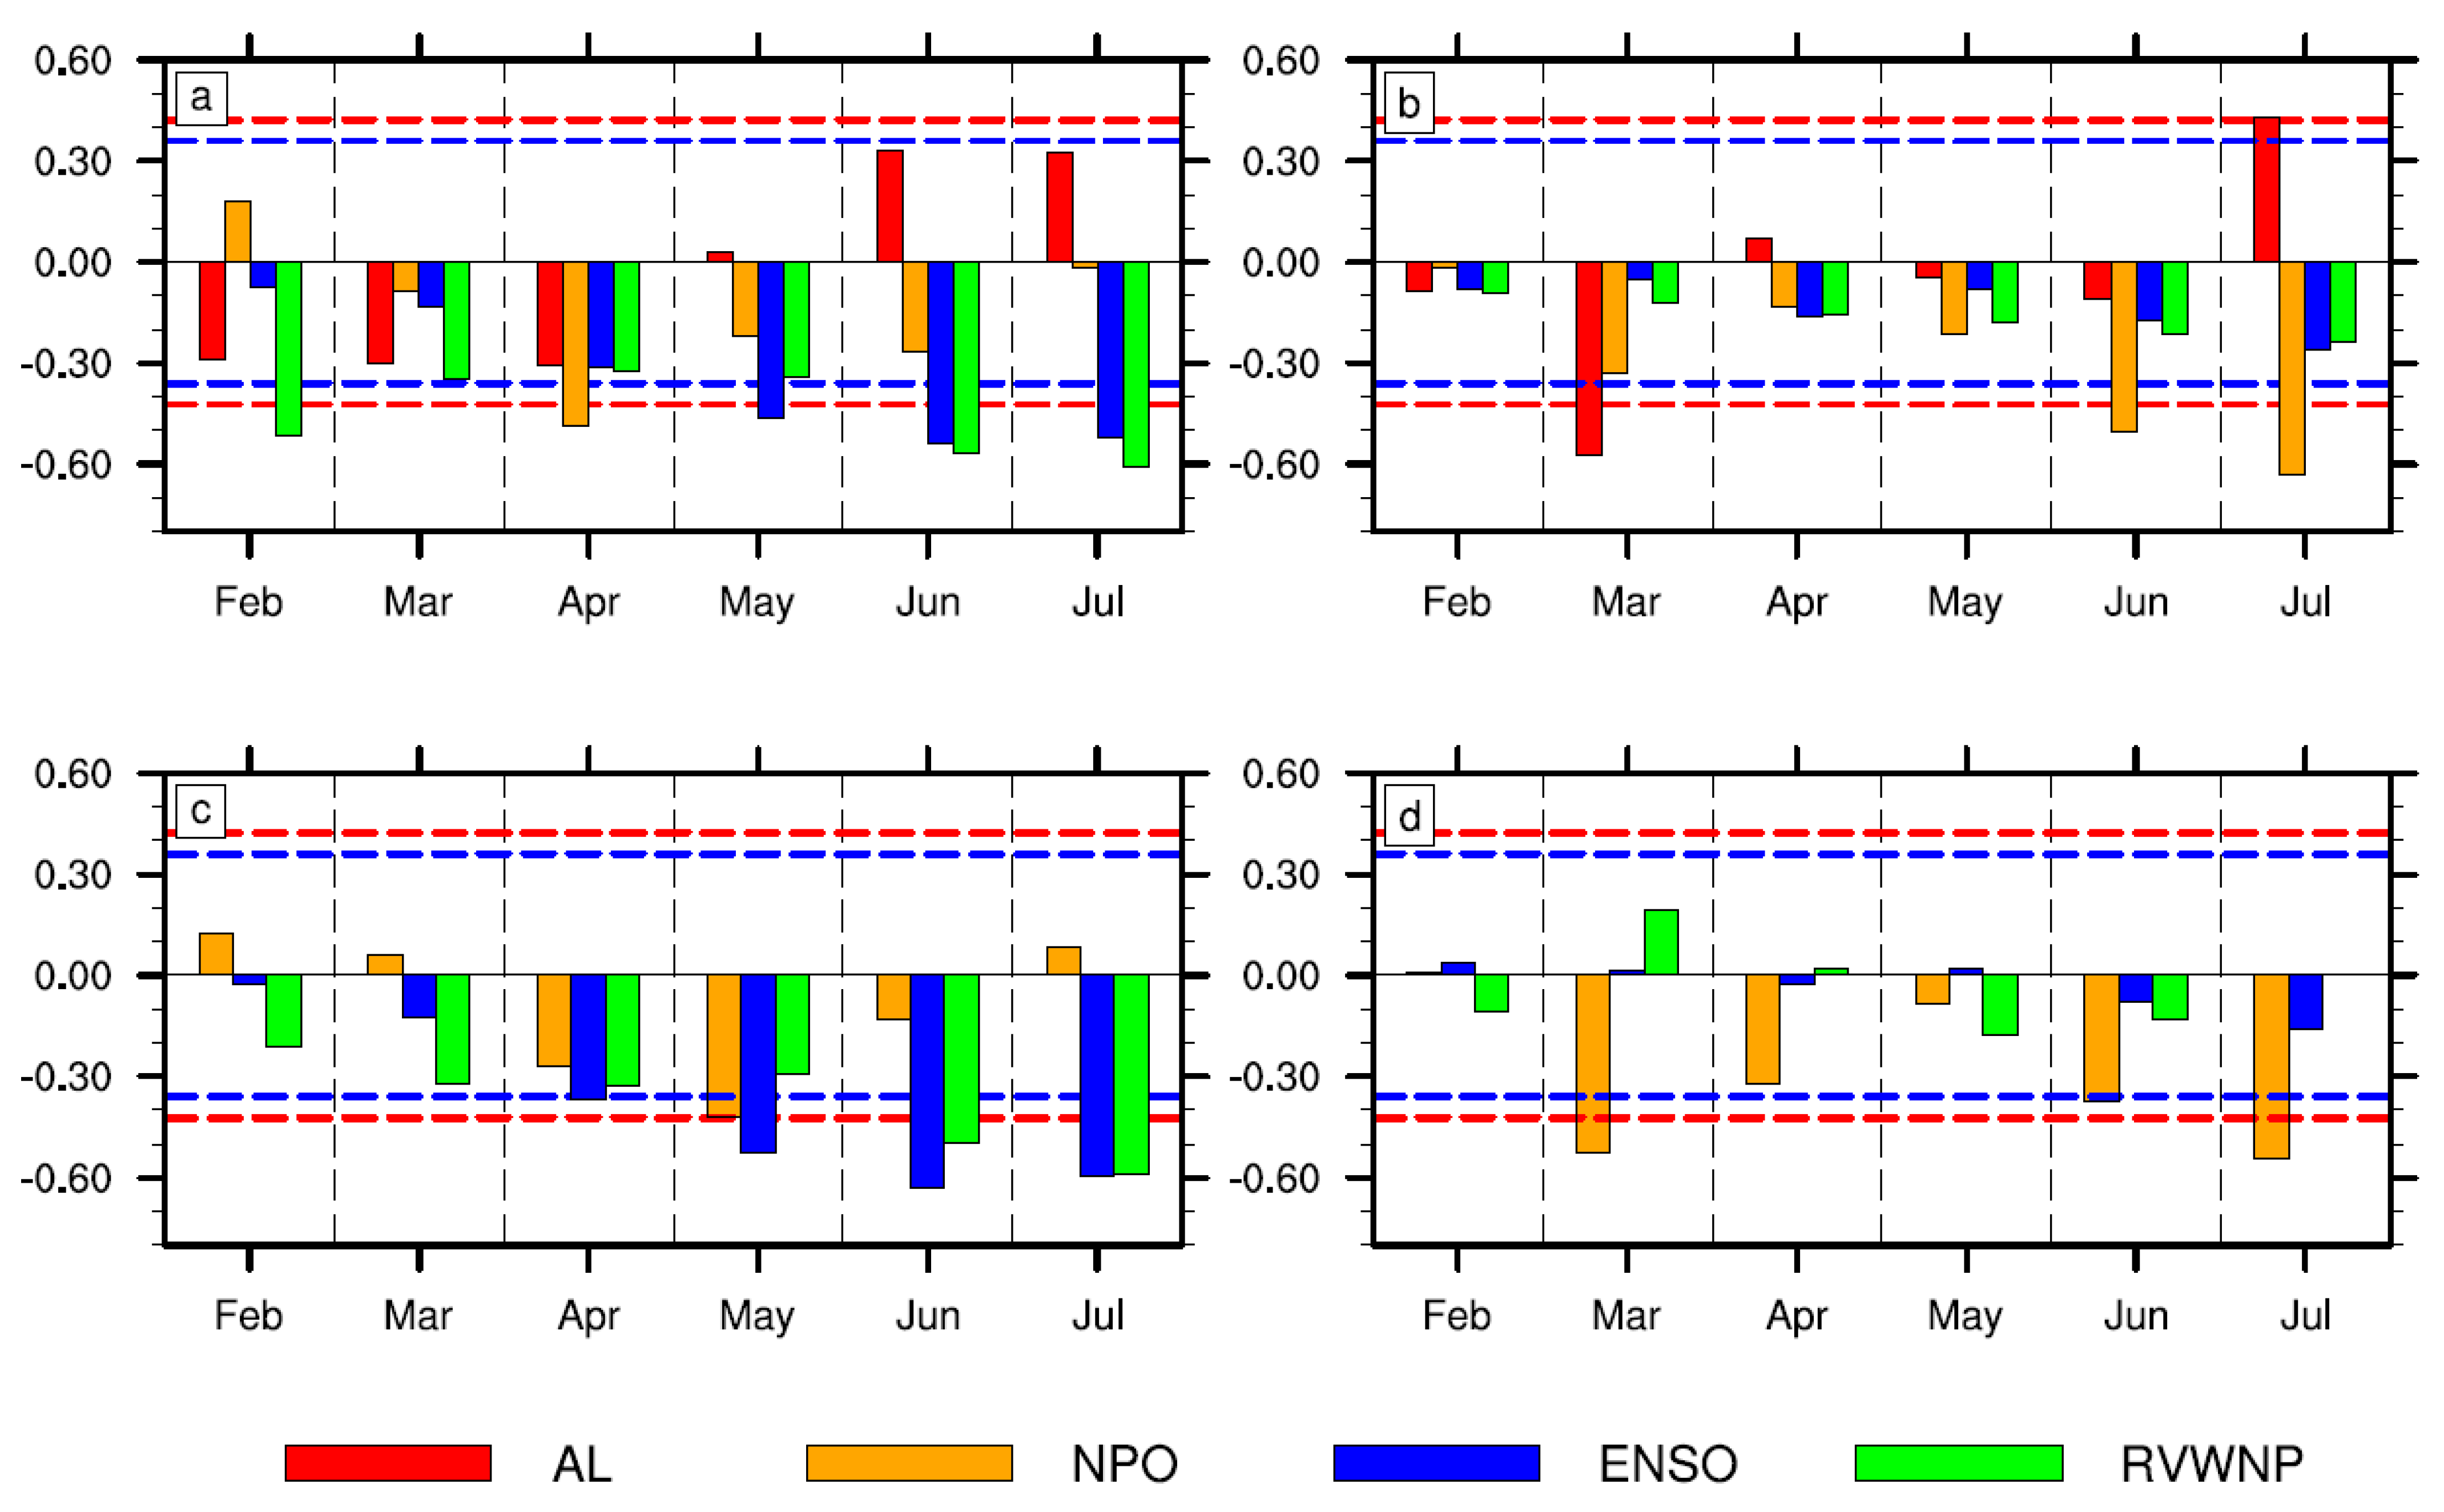
During P2, the SH significantly changes, resulting in a quite different impact of SH on the North Pacific. To reflect the associated air–sea response change in the North Pacific mentioned above, the evolved correlation coefficients of indices between the winter SH and subsequent North Pacific air–sea responses are displayed in Figure 7a,b where RVWNP denotes area-averaged relative vorticity over the WNP (5° N–20° N, 130° E–180°) at 850 hPa. During P1, the JMF SH index highly correlates with the AL in winter, indicating the synchronous variation between SH and AL. When in spring, the correlation coefficient between winter SH and NPO indices turns to be significant, validating the NPO response over the North Pacific. The negative correlations between JFM SH and Niño3.4 and between JFM SH and RVWNP increase and synchronously become significant in summer. During P2, the correlation evolution acts as a quite different air–sea response in the North Pacific. The negative correlation between the JFM SH and the NPO becomes significant later than during P1. Neither tropical SST nor WNP relative vorticity have evident responses on winter SH.
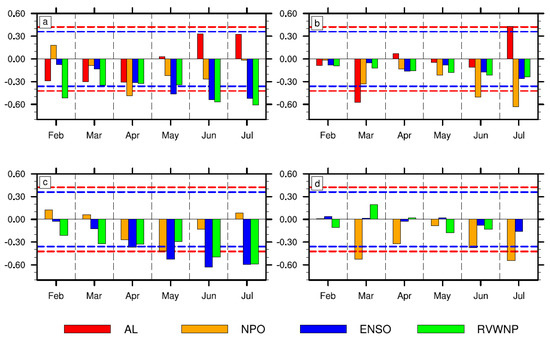
Figure 7.
(a,b) Lag correlation coefficients between the JFM SH index and the AL (red), NPO (orange), Nino3.4 (blue), RVWNP (green) indices and (c,d) partial correlations coefficients after linearly removing the influence of EAWM during (a,c) 1980–2002 and (b,d) 2003–2020. The RVWNP index is defined as the regional mean 850 hPa relative vorticity anomaly in the West North Pacific (5° N–20° N, 130° E–180°). The horizontal axis represents the target month of used indices. The blue (red) dashed lines indicate the correlation coefficient significant at 90% (95%) confidence level based on the two-sided Student’s t-test.
Note that although summer relative vorticity over the WNP can be significantly influenced by previous winter SH through the North Pacific passway (i.e., via AL and NPO) during P1, it is additionally significant in previous winter. As mentioned, EAWM is much weaker during P1 than during P2, which can induce relatively stronger easterly wind anomalies over the tropical western Pacific in winter. In order to avoid the interference of EAWM to the impact of winter SH on the WNP circulation anomaly, partial correlation analysis is utilized, as shown in Figure 7c,d. During P1, after linearly removing the influence of EASM, RVWNP response becomes much smaller in the preceding winter. NPO response is still significant in spring. Negative correlations between JFM SH and Niño3.4 and between JFM SH and RVWNP gradually increase until summer, confirming the North Pacific passway linking winter SH to summer circulation anomalies over the WNP. During P2, the air–sea responses change little after removing EAWM. Moreover, it is noteworthy that the maximum correlation of SH-NPO shifts one month backward after linearly removing the influence of EAWM during P1 (Figure 7a,c). As demonstrated in Figure 6, during P1, EAWM can induce relatively stronger easterly wind anomaly over the tropical western Pacific in winter. This easterly wind anomaly is consistent with the southern flank of the subtropical anticyclonic circulation of negative NPO, which is supposedly conductive to induce direct contribution to the formation of negative NPO. When the influence of EAWM is removed, the North Pacific becomes the only passway indirectly connecting SH to NPO, which needs more time to complete the SH-AL-NPO evolution. This hypothesis may be a reasonable explanation of why the maximum NPO response in Figure 7c is one month later than in Figure 7a, but the detailed mechanism behind it is still worth investigating further.
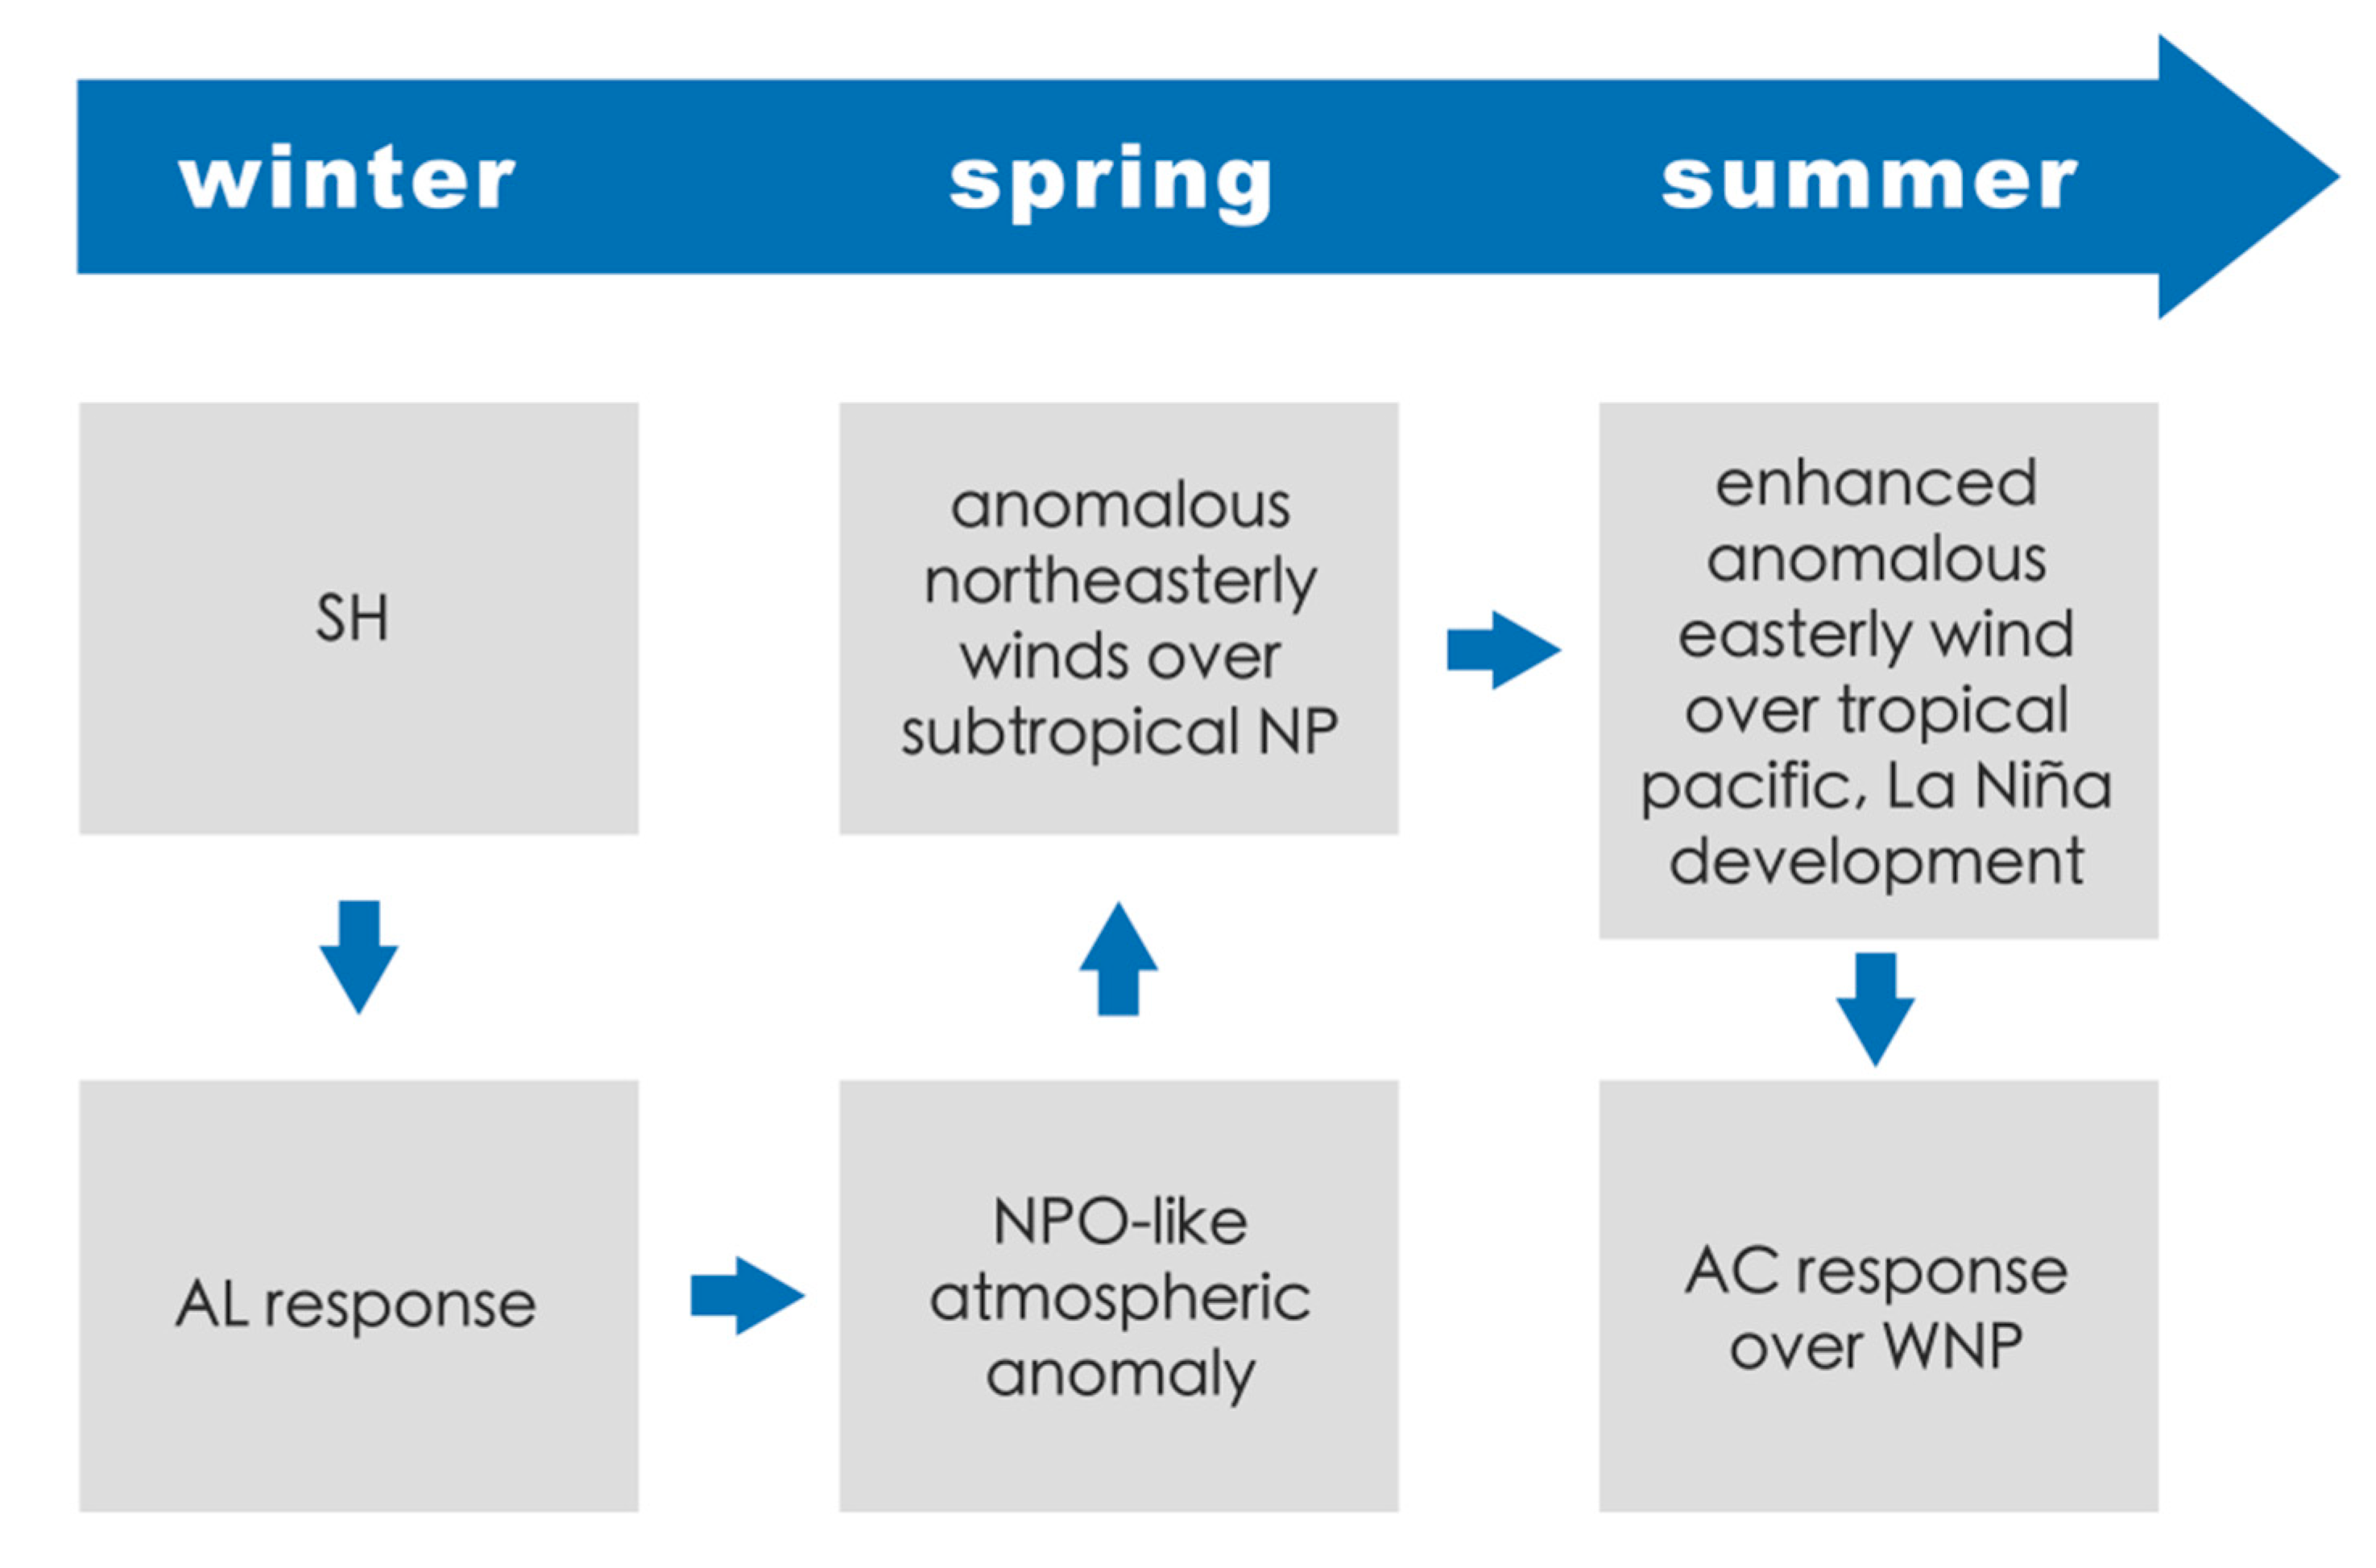
Through examining the air–sea responses over the extratropical Pacific and tropical Pacific, we proposed a plausible schematic summarization of how the SH remotely impacts the environmental background atmospheric circulation anomaly associated with WNP TCGF, which is dominant during P1, as shown in Figure 8. As a response to the strengthened winter SH, there will be an enhanced AL response occurring over the downstream North Pacific. Coming to spring, the anomalous AL response gradually evolves into an NPO-like atmospheric circulation anomaly, which enhances the northeasterly wind anomalies in the subtropical North Pacific. That contributes to the equatorial easterly wind anomalies in summer and then develops a La Niña event through Bjerknes feedback. The equatorial easterlies deflect northward to the WNP, causing an anomalous anticyclonic response and, thus, restrain the genesis of TCs.
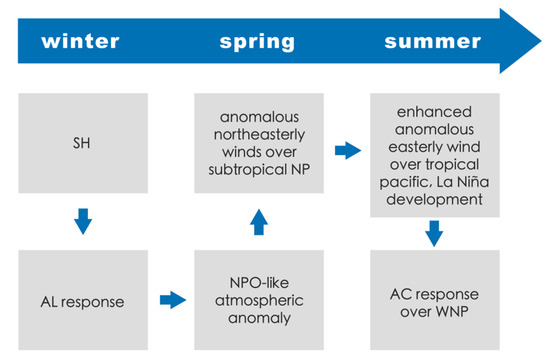
Figure 8.
Mechanism diagram showing the processes linking the winter SH to the summer environmental background atmospheric circulation anomaly associated with WNP TCGF during P1.
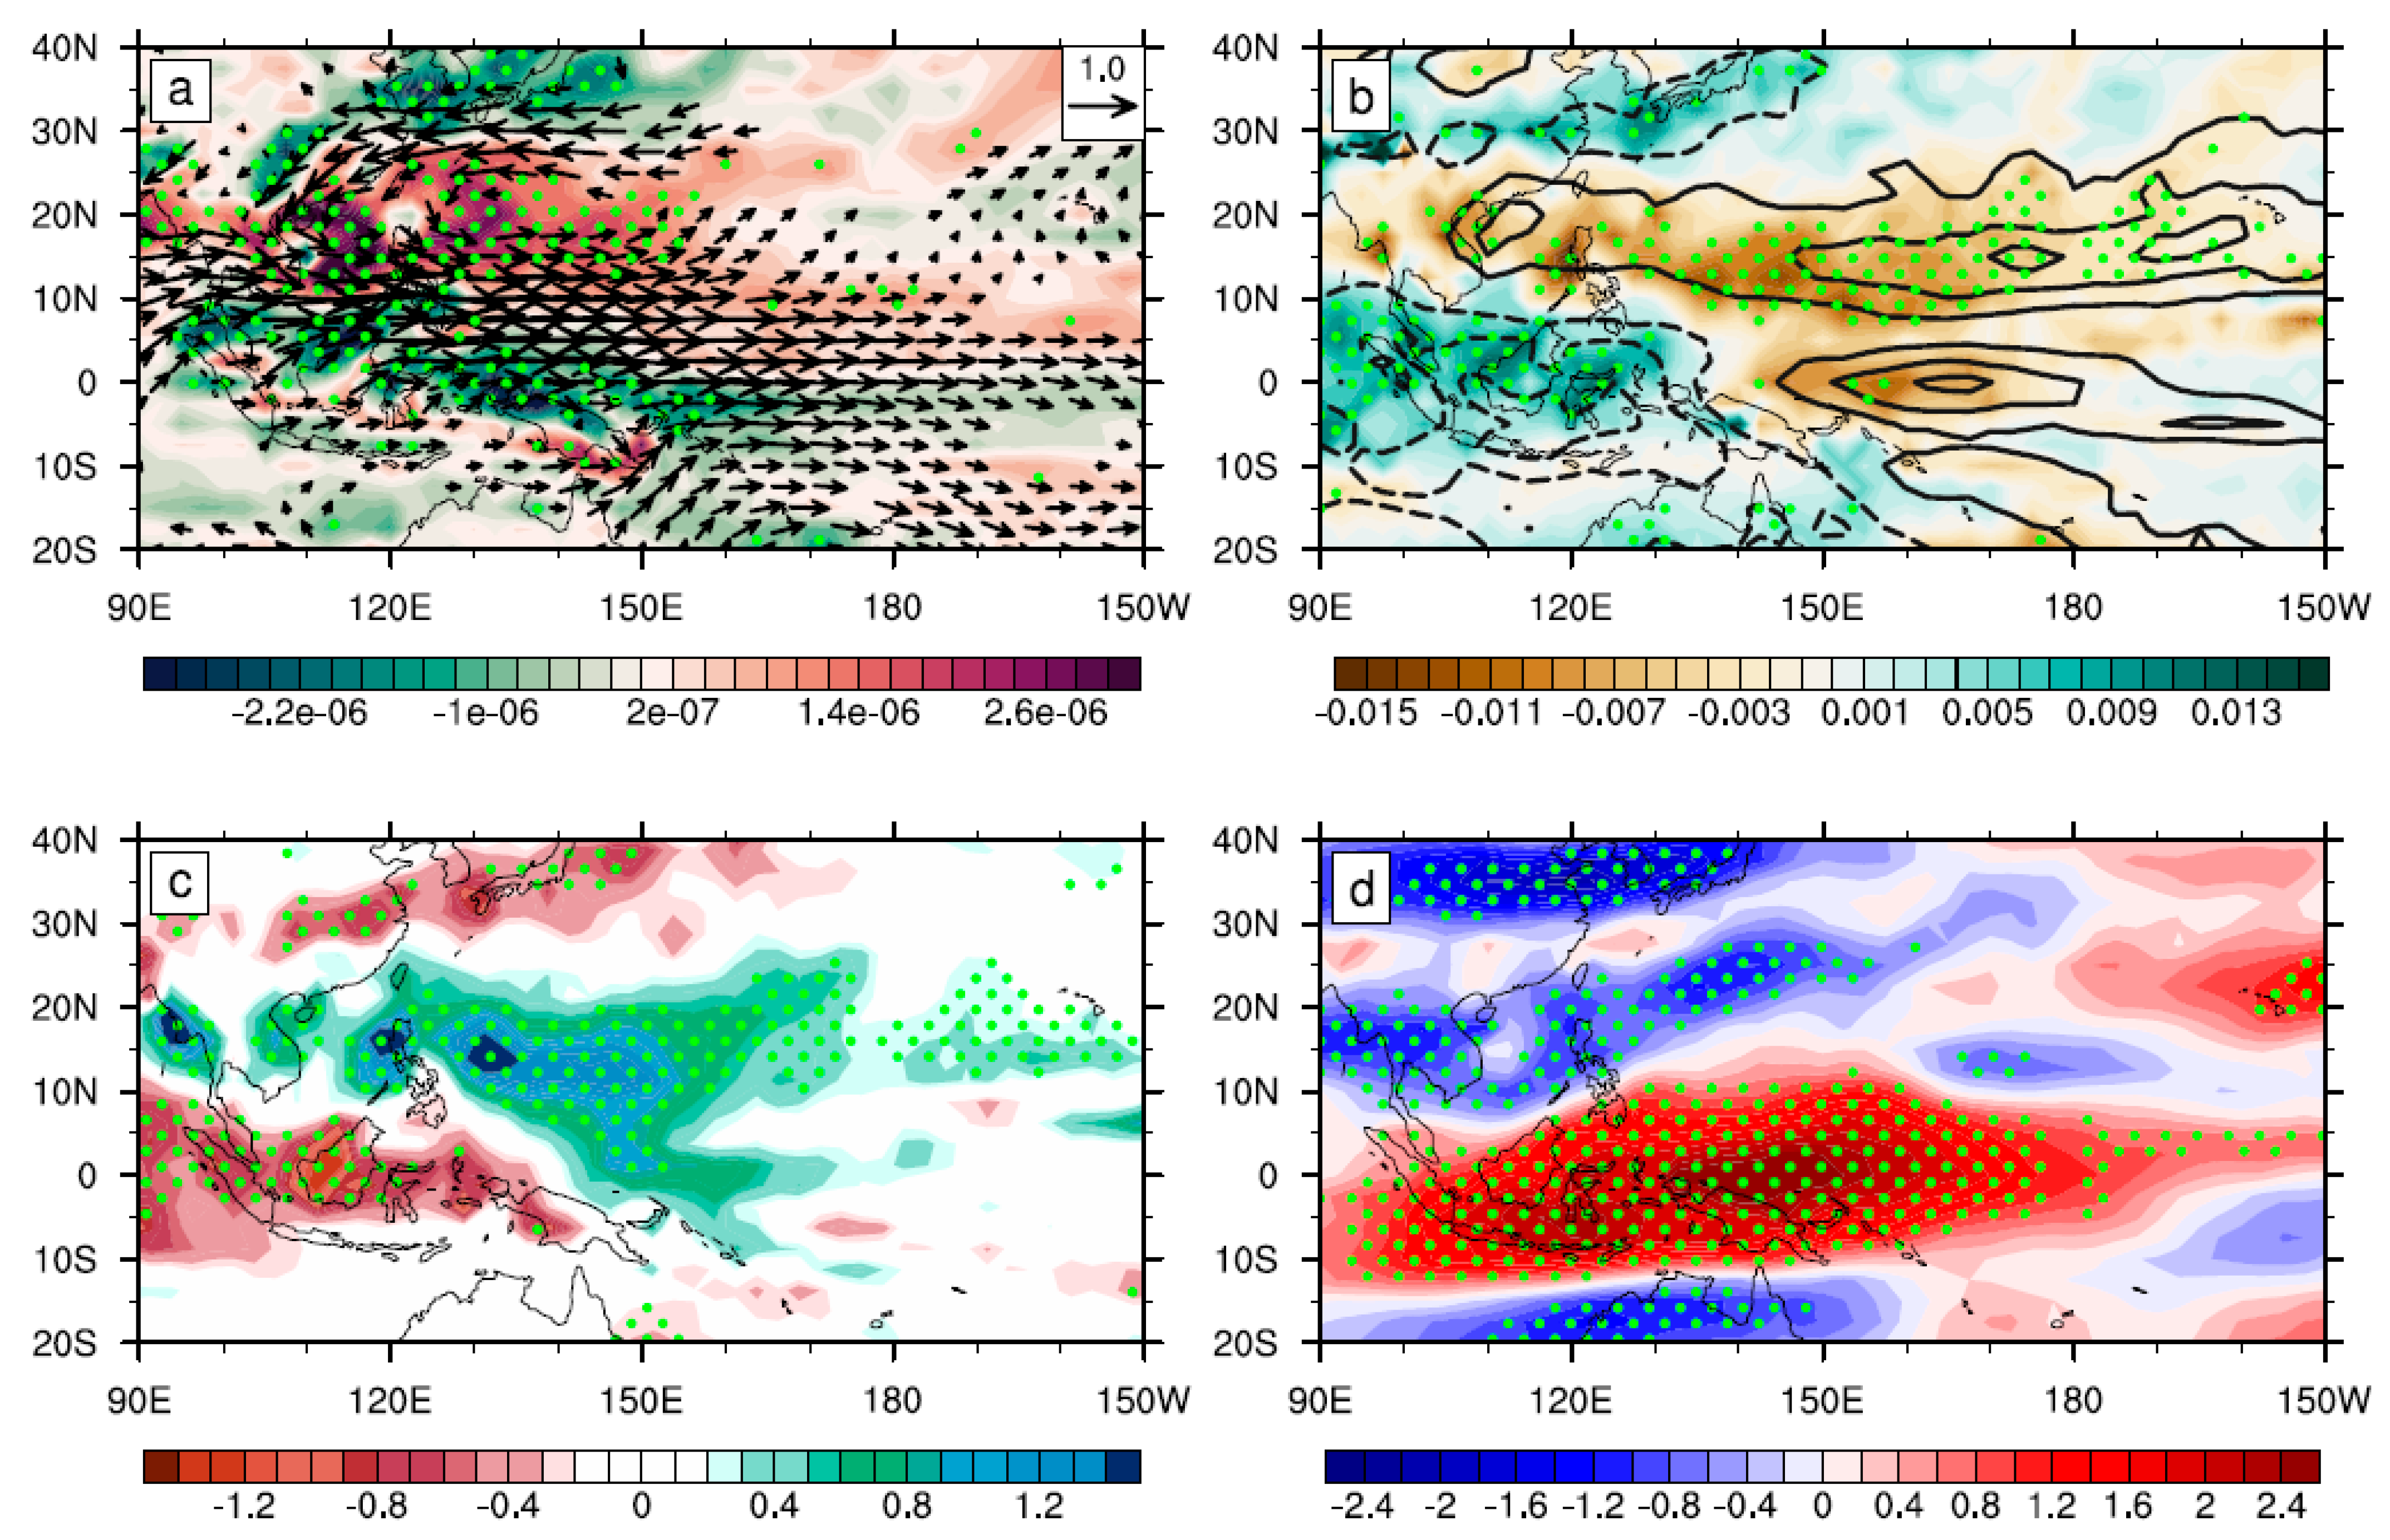
To verify the environmental background circulation conducive to TC generation, we regress summer atmospheric circulation anomalies and the relevant environmental factors against the TCGF index, as shown in Figure 9. Evidently, the environmental background conducive to TCGF features a significant cyclonic circulation anomaly with positive relative vorticity in low-level troposphere over the WNP. The heated wet ascending air with relatively small vertical wind shear background over the subtropical central-western Pacific positively induces the genesis of TCs, which is completely opposite to the SH-related environmental background during P1.
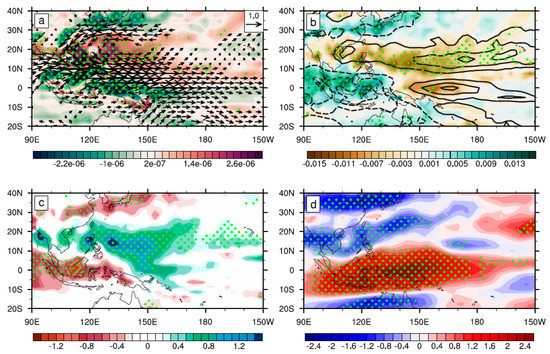
Figure 9.
Regression of (a) 850 hPa winds (vectors, exceeding the 95% significance level based on the two-sided Student’s t-test, unit: m/s) and relative vorticity (shading; s−1) anomalies, (b) 500 hPa vertical velocity (shading, Pa/s) and 700 hPa specific humidity (contours, interval of 0.1 g/kg; zero contours are omitted) anomalies, (c) surface precipitation rate (shading, mm/day) anomalies, and (d) vertical wind shear (shading, m/s; 200 hPa minus 850 hPa) anomalies in JJA onto the normalized JJA TCGF index during 1980–2020. The green dots indicate the significant relative vorticity, vertical velocity anomalies, surface precipitation rate anomalies, and vertical wind shear anomalies above the 95% confidence level based on the two-sided Student’s t-test, respectively.
4. Summary and Discussion
The SH, as the dominant continental high-pressure anticyclone in the lower troposphere over Eurasia during boreal winter, profoundly influences climate over surrounding and downstream regions. The SH also has a close relationship with tropical climate variations in the following seasons. However, the present study reveals that the relationship between the winter SH and WNP TCGF features a clear interdecadal change during 1980–2020. There is a significant negative relationship before the early 2000s but extremely weakened relationship afterward. A particularly sharp contrast in the relationship has been found between the time periods 1980–2002 (P1) and 2003–2020 (P2).
Observational evidence suggests that the changed relationship between the SH and WNP TCGF is primarily attributed to variations in the SH-associated air–sea response over the North Pacific. The center of SH-associated SLP anomaly shifts farther eastward from P1 to P2, leading to distinctly different North Pacific passways. During P1, the downstream AL response over the North Pacific can gradually develop into a meridional dipole distribution pattern in the following spring, which is consistent with the negative NPO mode. The northeasterly wind anomaly over the subtropical North Pacific is maintained and further delivered into the tropical Pacific. It favors easterly wind anomaly enhancement over the tropical Pacific around summer and grows into an anticyclone response in the WNP, which restrains the genesis of TCs. During P2, the eastward shift of the SH anomaly favored a weak AL over the Northeast Pacific followed by a northeastward-shifted anticyclone over the subtropical central-eastern Pacific, which confines the relatively weak northeasterly wind anomalies far away from the tropical Pacific and indicates a weakening relationship between the SH and WNP TCGF.
This study links the preceding SH variation and following environmental background circulation associated with WNP TCGF through air–sea interactions over the North Pacific. This process is also accompanied by the development of La Niña. However, note that the North Pacific air–sea response is sensitive to the interdecadal change, some interdecadal variabilities, such as the Pacific Decadal Oscillation (PDO), can significantly impact the connection between the extratropical Pacific and the tropical Pacific [47,48,49]. Interdecadal change has also been found in ENSO properties emerging around the year 2000 [50], which is suggested evidently consistent with the change in the ENSO variability between low-frequency and quasi-biennial [51]. What roles of such interdecadal modulation factors play in the SH–TCGF relationship change are worthy of being further investigated. Besides, interdecadal changes have been found in the relationship between TCGF and local, tropical Indian ocean and North Atlantic ocean SSTs [29]. Associated with forcings from outside oceans, there may be some other plausible ways of the winter SH remote impact on the following TCGF. Further validation needs to be carried out to reveal these hypotheses and detailed mechanisms in the future study.
Author Contributions
Conceptualization, F.Z. and C.W.; methodology, F.Z. and J.S.; software, Y.-F.G.; validation, Y.-F.G. and F.Z.; formal analysis, Y.-F.G. and F.Z.; data curation, J.S.; writing—original draft preparation, Y.-F.G.; writing—review and editing, F.Z., C.W. and J.S.; visualization, Y.-F.G. and F.Z. All authors have read and agreed to the published version of the manuscript.
Funding
This work was jointly supported by the National Natural Science Foundation of China (Nos. 42088101, 41905062, and 42105046), and The Startup Foundation for Introducing Talent of NUIST.
Institutional Review Board Statement
Not applicable.
Informed Consent Statement
Not applicable.
Data Availability Statement
The data presented in this study are openly available as cited in the reference. TC database created by the CMA can be found at [https://tcdata.typhoon.org.cn/zjljsjj_zlhq.html (accessed on 20 July 2022)]. ERA5 data can be found at [https://cds.climate.copernicus.eu/cdsapp#!/search?type=dataset&text=era5 (accessed on 20 July 2022)]. HadISST data can be found at [https://www.metoffice.gov.uk/hadobs/hadisst/ (accessed on 20 July 2022)]. GPCP v2.3 precipitation data can be found at [https://www.psl.noaa.gov/data/gridded/data.gpcp.html (accessed on 20 July 2022)].
Conflicts of Interest
The authors declare no conflict of interest.
References
- Huang, R.H.; Huangfu, J.L.; Liu, Y.; Feng, T.; Wu, L.; Chen, J.L.; Wang, L. Progress in Recent Research on the Processes and Physical Mechanisms Involved in the Influence of the Western Pacific Warm Pool on the Monsoon Trough and Tropical Cyclone Activity over the Western North Pacific. Chin. J. Atmos. Sci. 2016, 40, 877–896. (In Chinese) [Google Scholar]
- Chan, J.C.L. Interannual and interdecadal variations of tropical cyclone activity over the western North Pacific. Meteorol. Atmos. Phys. 2005, 89, 143–152. [Google Scholar] [CrossRef]
- Walsh, K.J.; McBride, J.L.; Klotzbach, P.J.; Balachandran, S.; Camargo, S.J.; Holland, G.; Knutson, T.R.; Kossin, J.P.; Lee, T.C.; Sobel, A.; et al. Tropical cyclones and climate change. Clim. Change 2016, 7, 65–89. [Google Scholar] [CrossRef]
- Gray, W.M. Hurricanes: Their Formation, Structure and Likely Role in the Tropical Circulation; Royal Meteorological Society: Reading, UK, 1979; pp. 155–218. [Google Scholar]
- Wand, B.; Chan, J.C.L. How strong ENSO events affect tropical storm activity over the western North Pacific. J. Clim. 2002, 15, 1643–1658. [Google Scholar]
- Wang, C.; Li, C.; Mu, M.; Duan, W. Seasonal modulations of different impacts of two types of ENSO events on tropical cyclone activity in the western North Pacific. Clim. Dyn. 2013, 40, 2887–2902. [Google Scholar] [CrossRef]
- Du, X.G.; Yu, J.H. Contribution of environmental factors to the change of tropical cyclone frequency in the summer of ENSO developing and decaying years. J. Trop. Meteorol. 2020, 36, 244–253. (In Chinese) [Google Scholar]
- Zhan, R.; Wang, Y.; Wu, C. Impact of SSTA in the east Indian Ocean on the frequency of Northwest Pacific tropical cyclones: A regional atmospheric model study. J. Clim. 2011, 24, 6227–6242. [Google Scholar] [CrossRef]
- Zhang, H.J.; Wu, L.; Huang, R.H. Possible impact of two types of El Niño events on the western North Pacific monsoon trough and tropical cyclogenesis. Clim. Environ. Res. 2018, 23, 150–160. (In Chinese) [Google Scholar]
- Wang, C.; Wu, L. Interannual shift of the tropical upper-tropospheric trough and its influence on tropical cyclone formation over the western North Pacific. J. Clim. 2016, 29, 4203–4211. [Google Scholar] [CrossRef]
- Yu, J.; Li, T.; Tan, Z.; Zhu, Z. Effects of tropical North Atlantic SST on tropical cyclone genesis in the western North Pacific. Clim. Dyn. 2016, 46, 865–877. [Google Scholar] [CrossRef]
- Huo, L.; Guo, P.; Hameed, S.N.; Jin, D. The role of tropical Atlantic SST anomalies in modulating western North Pacific tropical cyclone genesis. Geophys. Res. Lett. 2015, 42, 2378–2384. [Google Scholar] [CrossRef]
- Wang, H.J.; Sun, J.Q.; Fan, K. Relationships between the North Pacific Oscillation and the typhoon/hurricane frequencies. Sci. China Ser. D-Earth Sci. 2007, 37, 966–973. (In Chinese) [Google Scholar] [CrossRef]
- Chen, D.; Wang, H.J.; Liu, J.P.; Li, G.P. Why the spring North Pacific Oscillation is a predictor of typhoon activity over the Western North Pacific. Int. J. Climatol. 2015, 35, 3353–3361. [Google Scholar] [CrossRef]
- Bond, N.; Overland, J.; Spillane, M.; Stabeno, P. Recent shifts in the state of the North Pacific. Geophys. Res. Lett. 2003, 30, 2183. [Google Scholar] [CrossRef] [Green Version]
- Alexander, M.A.; Vimont, D.J.; Chang, P.; Scott, J.D. The impact of extratropical atmospheric vatiability on ENSO: Testing the seasonal footprinting mechanism using coupled model experiments. J. Clim. 2010, 23, 2885–2901. [Google Scholar] [CrossRef] [Green Version]
- Yu, J.Y.; Kim, S.T. Relationships between extratropical sea level pressure variations and the central Pacific and eastern Pacific types of ENSO. J. Clim. 2011, 24, 708–720. [Google Scholar] [CrossRef]
- Ding, R.Q.; Li, J.P.; Tseng, Y.H.; Sun, C.; Guo, Y.P. The victoria mode in the North Pacific linking extratropical sea level pressure variations to ENSO. J. Geophys. Res. Atmos. 2015, 20, 27–45. [Google Scholar] [CrossRef]
- Ding, R.Q.; Li, J.P.; Tseng, Y.H.; Ruan, C.Q. Influence of the North Pacific Victoria mode on the Pacific ITCZ summer precipitation. J. Geophys. Res. Atmos. 2015, 120, 964–979. [Google Scholar] [CrossRef]
- Wallace, J.M.; Gutzler, D.S. Teleconnections in the Geopotential Height Field during the Northern Hemisphere winter. Mon. Wea. Rev. 1981, 109, 7842–8812. [Google Scholar] [CrossRef]
- Cohen, J.; Sait, K.; Entekhabi, D. The role of the Siberian high in northern hemisphere climate variability. Geophys. Res. Lett. 2001, 28, 299–302. [Google Scholar] [CrossRef] [Green Version]
- Gong, D.Y.; Ho, C.H. Siberian High and climate change over middle to high latitude Asia. Theor. Appl. Climatol. 2002, 72, 1–9. [Google Scholar] [CrossRef]
- Ding, Y.H. Build-Up, Air Mass Transformation and Propagation of Siberian High and its Relations to Cold Surge in East Asia. Meteorl. Atmos. Phys. 1990, 44, 281–292. [Google Scholar]
- Miyazaki, S.; Yasunari, T.; Adyasuren, T. Abrupt Seasonal Changes of Surface Climate Observed in Northern Mongolia by an Automatic Weather Station. J. Meteorol. Soc. Jpn. 1999, 77, 583–593. [Google Scholar] [CrossRef] [Green Version]
- Wu, B.; Wang, J. Winter Arctic Oscillation, Siberian High and East Asian winter Monsoon. Geophys. Res. Lett. 2002, 29, 3-1–3-4. [Google Scholar] [CrossRef]
- Fu, J.Y.; Liu, M.H.; Wang, R.; Wang, Y.W.; Zhao, S. Possible Impact of Boreal Winter Siberian High on ENSO Development in the Following Year. Front. Earth Sci. 2022, 10, 885846. [Google Scholar] [CrossRef]
- Yang, L.; Du, Y.; Xie, S.P.; Wang, D.X. An interdecadal change of tropical cyclone activity in the South China Sea in the early 1990s. Chin. J. Oceanol. Limnol. 2012, 30, 953–959. [Google Scholar] [CrossRef] [Green Version]
- Wu, R.; Cao, X.; Yang, Y. Interdecadal change in the relationship of the western North Pacific tropical cyclogenesis frequency to tropical Indian and North Atlantic Ocean SST in early 1990s. J. Geophys. Res. Atmos. 2020, 125, e2019JD031493. [Google Scholar] [CrossRef]
- Wang, L.; Huang, R.H.; Wu, R.G. Interdecadal variability in tropical cyclone frequency over the South China Sea and its association with the Indian Ocean sea surface temperature. Geophys. Res. Lett. 2013, 40, 768–771. [Google Scholar] [CrossRef]
- Chen, G. Interdecadal variation of tropical cyclone activity in association with summer monsoon, sea surface temperature over the western North Pacific. Chin. Sci. Bull. 2009, 54, 1417–1421. [Google Scholar] [CrossRef] [Green Version]
- Huangfu, J.L.; Huang, R.H.; Chen, W.; Feng, T.; Wu, L. Interdecadal variation of tropical cyclone genesis and its relationship to the monsoon trough over the western North Pacific. Int. J. Climatol. 2017, 37, 3587–3596. [Google Scholar] [CrossRef]
- Zhou, B.T.; Cui, X. Interdecadal change of the linkage between the North Atlantic Oscillation and the tropical cyclone frequency over the western North Pacific. Sci. China Earth Sci. 2014, 57, 2148–2155. [Google Scholar] [CrossRef]
- Ying, M.; Zhang, W.; Yu, H.; Lu, X.; Feng, J.; Fan, Y.; Zhu, Y.; Chen, D. An overview of the China Meteorological Administration tropical cyclone database. J. Atmos. Oceanic Technol. 2014, 31, 287–301. [Google Scholar] [CrossRef] [Green Version]
- Lu, X.Q.; Yu, H.; Ying, M.; Zhao, B.K.; Zhang, S.; Lin, L.M.; Bai, L.N.; Wan, R.J. Western North Pacific tropical cyclone database created by the China Meteorological Administration. Adv. Atmos. Sci. 2021, 38, 690–699. [Google Scholar] [CrossRef]
- Hersbach, H.; Bell, B.; Berrisford, P.; Hirahara, S.; Horanyi, A.; Muñoz-Sabater, J.; Nicolas, J.; Peubey, C.; Radu, R.; Schepers, D.; et al. The ERA5 global reanalysis. Q. J. R. Meteorol. Soc. 2020, 146, 1999–2049. [Google Scholar] [CrossRef]
- Rayner, N.A.; Parker, D.E.; Horton, E.B.; Folland, C.K.; Alexander, L.V.; Rowell, D.P.; Kent, E.C.; Kaplan, A. Global analyses of sea surface temperature, sea ice, and night marine air temperature since the late nineteenth century. J. Geophys. Res. 2003, 108, 4407. [Google Scholar] [CrossRef]
- Adler, R.F.; Gu, G.; Huffman, G. Estimating climatological bias errors for the Global Precipitation Climatology Project (GPCP). J. Appl. Meteorol. Climatol. 2012, 51, 84–99. [Google Scholar] [CrossRef]
- Chen, S.; Chen, W.; Wu, R.; Yu, B.; Graf, H.F. Potential impact of preceding Aleutian Low variation on El Niño-Southern Oscillation during the following winter. J. Clim. 2020, 33, 3061–3077. [Google Scholar] [CrossRef]
- Shi, N.; Lu, J.J.; Zhu, Q.G. East Asian winter/summer monsoon intensity indices with their climatic change in 1873–1989. J. Nanjing Inst. Meteorol. 1996, 19, 168–177. (In Chinese) [Google Scholar]
- Fisher, R.A. Frequency distribution of the values of the correlation coefficient in samples of an indefinitely large population. Biometrika 1915, 10, 507–521. [Google Scholar] [CrossRef]
- Bjerknes, J. Atmospheric teleconnections from the equatorial Pacific1. Mon. Wea. Rev. 1969, 97, 163–172. [Google Scholar] [CrossRef]
- Neelin, J.D.; Battisti, D.S.; Hirst, A.C.; Jin, F.F.; Wakata, Y.; Yamagata, T. ENSO theory. J. Geophys. Res. 1998, 103, 14261–14290. [Google Scholar] [CrossRef]
- Wang, C. A review of ENSO theories. Natl. Sci. Rev. 2018, 5, 813–825. [Google Scholar] [CrossRef]
- Ren, H.-L.; Zheng, F.; Luo, J.-J.; Wang, R.; Liu, M.; Zhang, W.; Zhou, T.; Zhou, G. A review of research on tropical air-sea interaction, ENSO dynamics, and ENSO prediction in China. J. Meteorol. Res. 2020, 34, 43–62. [Google Scholar] [CrossRef]
- Overland, J.E.; Adams, J.M.; Bond, N.A. Decadal variability of the Aleutian Low and its relation to high-latitude circulation. J. Clim. 1999, 12, 15422–21548. [Google Scholar] [CrossRef]
- Chen, S.F.; Yu, B.; Chen, W. An analysis on the physical process of the influence of AO on ENSO. Clim. Dyn. 2014, 42, 973–989. [Google Scholar] [CrossRef]
- Vimont, D.J.; Battisti, D.S.; Hirst, A.C. Footprinting: A Seasonal Connection between the Tropics and Mid-latitudes. Geophys. Res. Lett. 2001, 28, 3923–3926. [Google Scholar] [CrossRef]
- Vimont, D.J.; Wallace, J.M.; Battisti, D.S. The Seasonal Footprinting Mechanism in the Pacific: Implications for ENSO. J. Clim. 2003, 16, 26682–32675. [Google Scholar] [CrossRef] [Green Version]
- Krishnamurthy, L.; Krishnamurthy, V. Influence of PDO on South Asian Summer Monsoon and Monsoon-ENSO Relation. Clim. Dyn. 2014, 42, 2397–2410. [Google Scholar] [CrossRef]
- McPhaden, M.J. A 21st Century Shift in the Relationship between ENSO SST and Warm Water Volume Anomalies. Geophys. Res. Lett. 2012, 39, L09706. [Google Scholar] [CrossRef]
- Wang, R.; Ren, H.L. The Linkage Between Two ENSO Types/Modes and the Interdecadal Changes of ENSO around the Year 2000. Atmos. Ocean. Sci. Lett. 2017, 10, 168–174. [Google Scholar] [CrossRef] [Green Version]
Publisher’s Note: MDPI stays neutral with regard to jurisdictional claims in published maps and institutional affiliations. |
© 2022 by the authors. Licensee MDPI, Basel, Switzerland. This article is an open access article distributed under the terms and conditions of the Creative Commons Attribution (CC BY) license (https://creativecommons.org/licenses/by/4.0/).

