Article

Seasonality of Biophysical Parameters in Extreme Years of Precipitation in Pernambuco: Relations, Regionalities, and Variability

by
Alan Cézar Bezerra
1,*,
Jhon Lennon Bezerra da Silva
2,
Douglas Alberto de Oliveira Silva
3,
Cristina Rodrigues Nascimento
4,
Eberson Pessoa Ribeiro
5,
Josiclêda Domiciano Galvincio
6,
Marcos Vinícius da Silva
3,7,
Henrique Fonseca Elias de Oliveira
2,
Márcio Mesquita
2,8,
José Francisco de Oliveira-Júnior
9,
Alexsandro Claudio dos Santos Almeida
7,10,
Pabrício Marcos Oliveira Lopes
4 and
Geber Barbosa de Albuquerque Moura
4
1
Academic Unit of Serra Talhada (UAST), Federal Rural University of Pernambuco (UFRPE), Av. Gregório Ferraz Nogueira, s/n, Serra Talhada 56909-535, Pernambuco, Brazil
2
Cerrado Irrigation Graduate Program, Goiano Federal Institute, Campus Ceres, GO-154, km 218—Zona Rural, Ceres 76300-000, Goiás, Brazil
3
Post-Graduation Program in Agricultural Engineering, Federal Rural University of Pernambuco (UFRPE), Rua Dom Manuel de Medeiros, s/n—Dois Irmãos, Recife 52171-900, Pernambuco, Brazil
4
Department of Agronomy, Federal Rural University of Pernambuco (UFRPE), Rua Dom Manuel de Medeiros, s/n—Dois Irmãos, Recife 52171-900, Pernambuco, Brazil
5
Federal Institute of Pernambuco, Campus Vitória de Santo Antão, Propriedade Terra Preta Zona Rural, s/n, Vitória de Santo Antão 55600-000, Pernambuco, Brazil
6
Department of Geographical Sciences, Federal University of Pernambuco (UFPE), Av. Prof. Moraes Rego, 1235—Cidade Universitária, Recife 50670-901, Pernambuco, Brazil
7
Department of Plant Production, Federal University of Alagoas (UFAL), Agricultural Sciences Center (CECA), Rio Largo 57100-000, Alagoas, Brazil
8
Department of Agronomy, Federal University of Goiás (UFG), Nova Veneza, Km 0. Campus Samambaia—UFG, Goiânia 74690-900, Goiás, Brazil
9
Institute of Atmospheric Sciences (ICAT), Federal University of Alagoas (UFAL), Maceió 57072-260, Alagoas, Brazil
10
Agricultural Sciences Center (CECA), Federal University of Alagoas (UFAL), Rio Largo 57100-000, Alagoas, Brazil
*
Author to whom correspondence should be addressed.
Atmosphere 2023, 14(12), 1712; https://doi.org/10.3390/atmos14121712
Submission received: 27 September 2023 / Revised: 31 October 2023 / Accepted: 18 November 2023 / Published: 21 November 2023
(This article belongs to the Special Issue Agrometeorology and Remote Sensing of Land–Atmosphere)

Abstract

:
This study analyzed the seasonality of biophysical parameters in the extreme years of precipitation and the relationship with the monthly precipitation of the state of Pernambuco at the regional level (Pernambuco) and homogeneous precipitation zones: zone 1—semiarid, zone 2—transition and zone 3—coastal. For this, the biophysical parameters at the monthly level in the extreme years, 2004 (wet) and 2012 (dry) were related to precipitation data of 45 rainfall stations. Using the Google Earth Engine platform, we calculate the biophysical parameters with MODIS products: Albedo, Normalized Difference Vegetation Index (NDVI), Enhanced Vegetation Index (EVI), Soil Adjusted Vegetation Index (SAVI), Normalized Difference Water Index (NDWI) and surface temperature (ST). Considering the most critical period, between September and December, of a wet year (2004) with a dry year (2012), there is an average reduction of 14% of vegetation indices (NDVI, EVI and SAVI), a 60% reduction in NDWI, an increase of 4% in albedo and 3% in surface temperature. For monitoring the water conditions of the state of Pernambuco, the most appropriate biophysical parameter is the NDWI index and surface temperature. In addition to NDWI, it is recommended to use EVI for semiarid areas (zone 1) and ST for coastal areas (Zones 2 and 3).

1. Introduction

The Northeast region of Brazil (NEB) frequently faces the intensification and duration of climate extremes and high climate variability, accentuating phenomena such as drought, desertification and water deficit [1,2,3,4,5,6,7]. More specifically, the Brazilian Semiarid region stands out in light of these characteristics due to its high rainfall variability in space and time, in addition to poorly distributed rainfall, alternating intensities and short durations [8,9,10,11].
Studies highlight that the decade from 2011 to 2020 was one of the most severe periods of drought in the last 100 years for most regions of the NEB, with the predominance of severe drought and even more frequent and longer periods of drought, affecting regions more strongly in the Brazilian Semiarid [1,12,13,14,15,16,17,18].
Therefore, climatic conditions, especially precipitation, affect vegetation dynamics because the plant community’s germination, growth and death depend on these factors [19]. Therefore, changes in climate aspects, enhanced by climate change, and anthropic actions to change the forms of land use and occupation should impact the growth of vegetation that will cause changes in biogeochemical cycles [20,21].
In Brazil, studies have focused on the Amazon region, and other regions, such as the Brazilian northeast, have not received the same attention. The NEB has a particular highlight since it possesses areas with different climatic characteristics, especially semiarid and coastal (rainy) areas. The projections of climate change indicate an increase in global temperature by 1.5 °C, extreme events of precipitation and probability of drought and precipitation deficits [22], an increase in its aridity, and areas susceptible to desertification in arid and semiarid areas and damage to drainage infrastructure in urban centers [10,23]. Understanding the oscillations of environmental changes resulting from climate fluctuations and the response of vegetation or ecosystems will be fundamental for studies of climate change and its effects.
In this sense, it is necessary to monitor soil cover conditions, mainly vegetation continuously, to understand the changes that have occurred [24]. Traditional monitoring considers field data of soil and meteorological conditions and has a punctual scope, but this type of methodology presents a limitation regarding the spatialization of the data and a high cost. Thus, remote sensing assists in spatial monitoring on a regional scale with lower economic and labor costs and at more minor time scales [25].
Among the studies that have evaluated seasonality in this region, the following stand out: Costa et al. [26], have analyzed seasonality in the Caatinga, highlighting its dependence on water, but have been limited to specific areas; similarly, Medeiros et al. [27] and Silva et al. [28] focused on specific points, not addressing the spatial variability, as we intend to analyze.
On the other hand, different studies [29,30,31,32] have been developed to understand better precipitation dynamics’ seasonality and the response of the land surface through different biophysical parameters for the NEB. These studies have not evaluated the behavior in years of extreme precipitation because they considered years according to the availability of quality images in the region of interest. Our analysis included a detailed monthly assessment using the Google Earth Engine cloud platform to process the images [33] on the extreme years detected by Bezerra et al. [34]. Using a composition of images enables us to minimize common problems such as cloud contamination, especially in the coastal region.
Another aspect of the previous studies is that they do not evaluate by homogeneous precipitation zones and consider only the parameters of the Normalized Difference Vegetation Index (NDVI), Enhanced Vegetation Index (EVI) and Surface Temperature (ST).
Thus, we seek to fill this gap and start with the following questions: Can other biophysical parameters respond better to precipitation conditions? How do biophysical parameters behave in extreme rainy and dry years? Can some biophysical parameters perform better in drier or wetter areas, such as semiarid regions and coastal zones?
Aiming to meet demands such as the lack of climate and environmental data at a local and regional level, this modeling aims to expand the monitoring and evaluation of changing conditions in the Brazilian Northeast region through the determination of biophysical parameters, highlighting spatial–temporal patterns and dynamics, incorporating the high applicability of geotechnologies with geospatial data from satellites and geographic information systems. Thus, this study aimed to analyze the seasonality of biophysical parameters in the extreme years of precipitation and the relationship with the monthly precipitation of Pernambuco on two spatial scales: regional (Pernambuco) and homogeneous precipitation zones. In addition, we verified the spatial–temporal variability of biophysical parameters during the years considered.

2. Materials and Methods
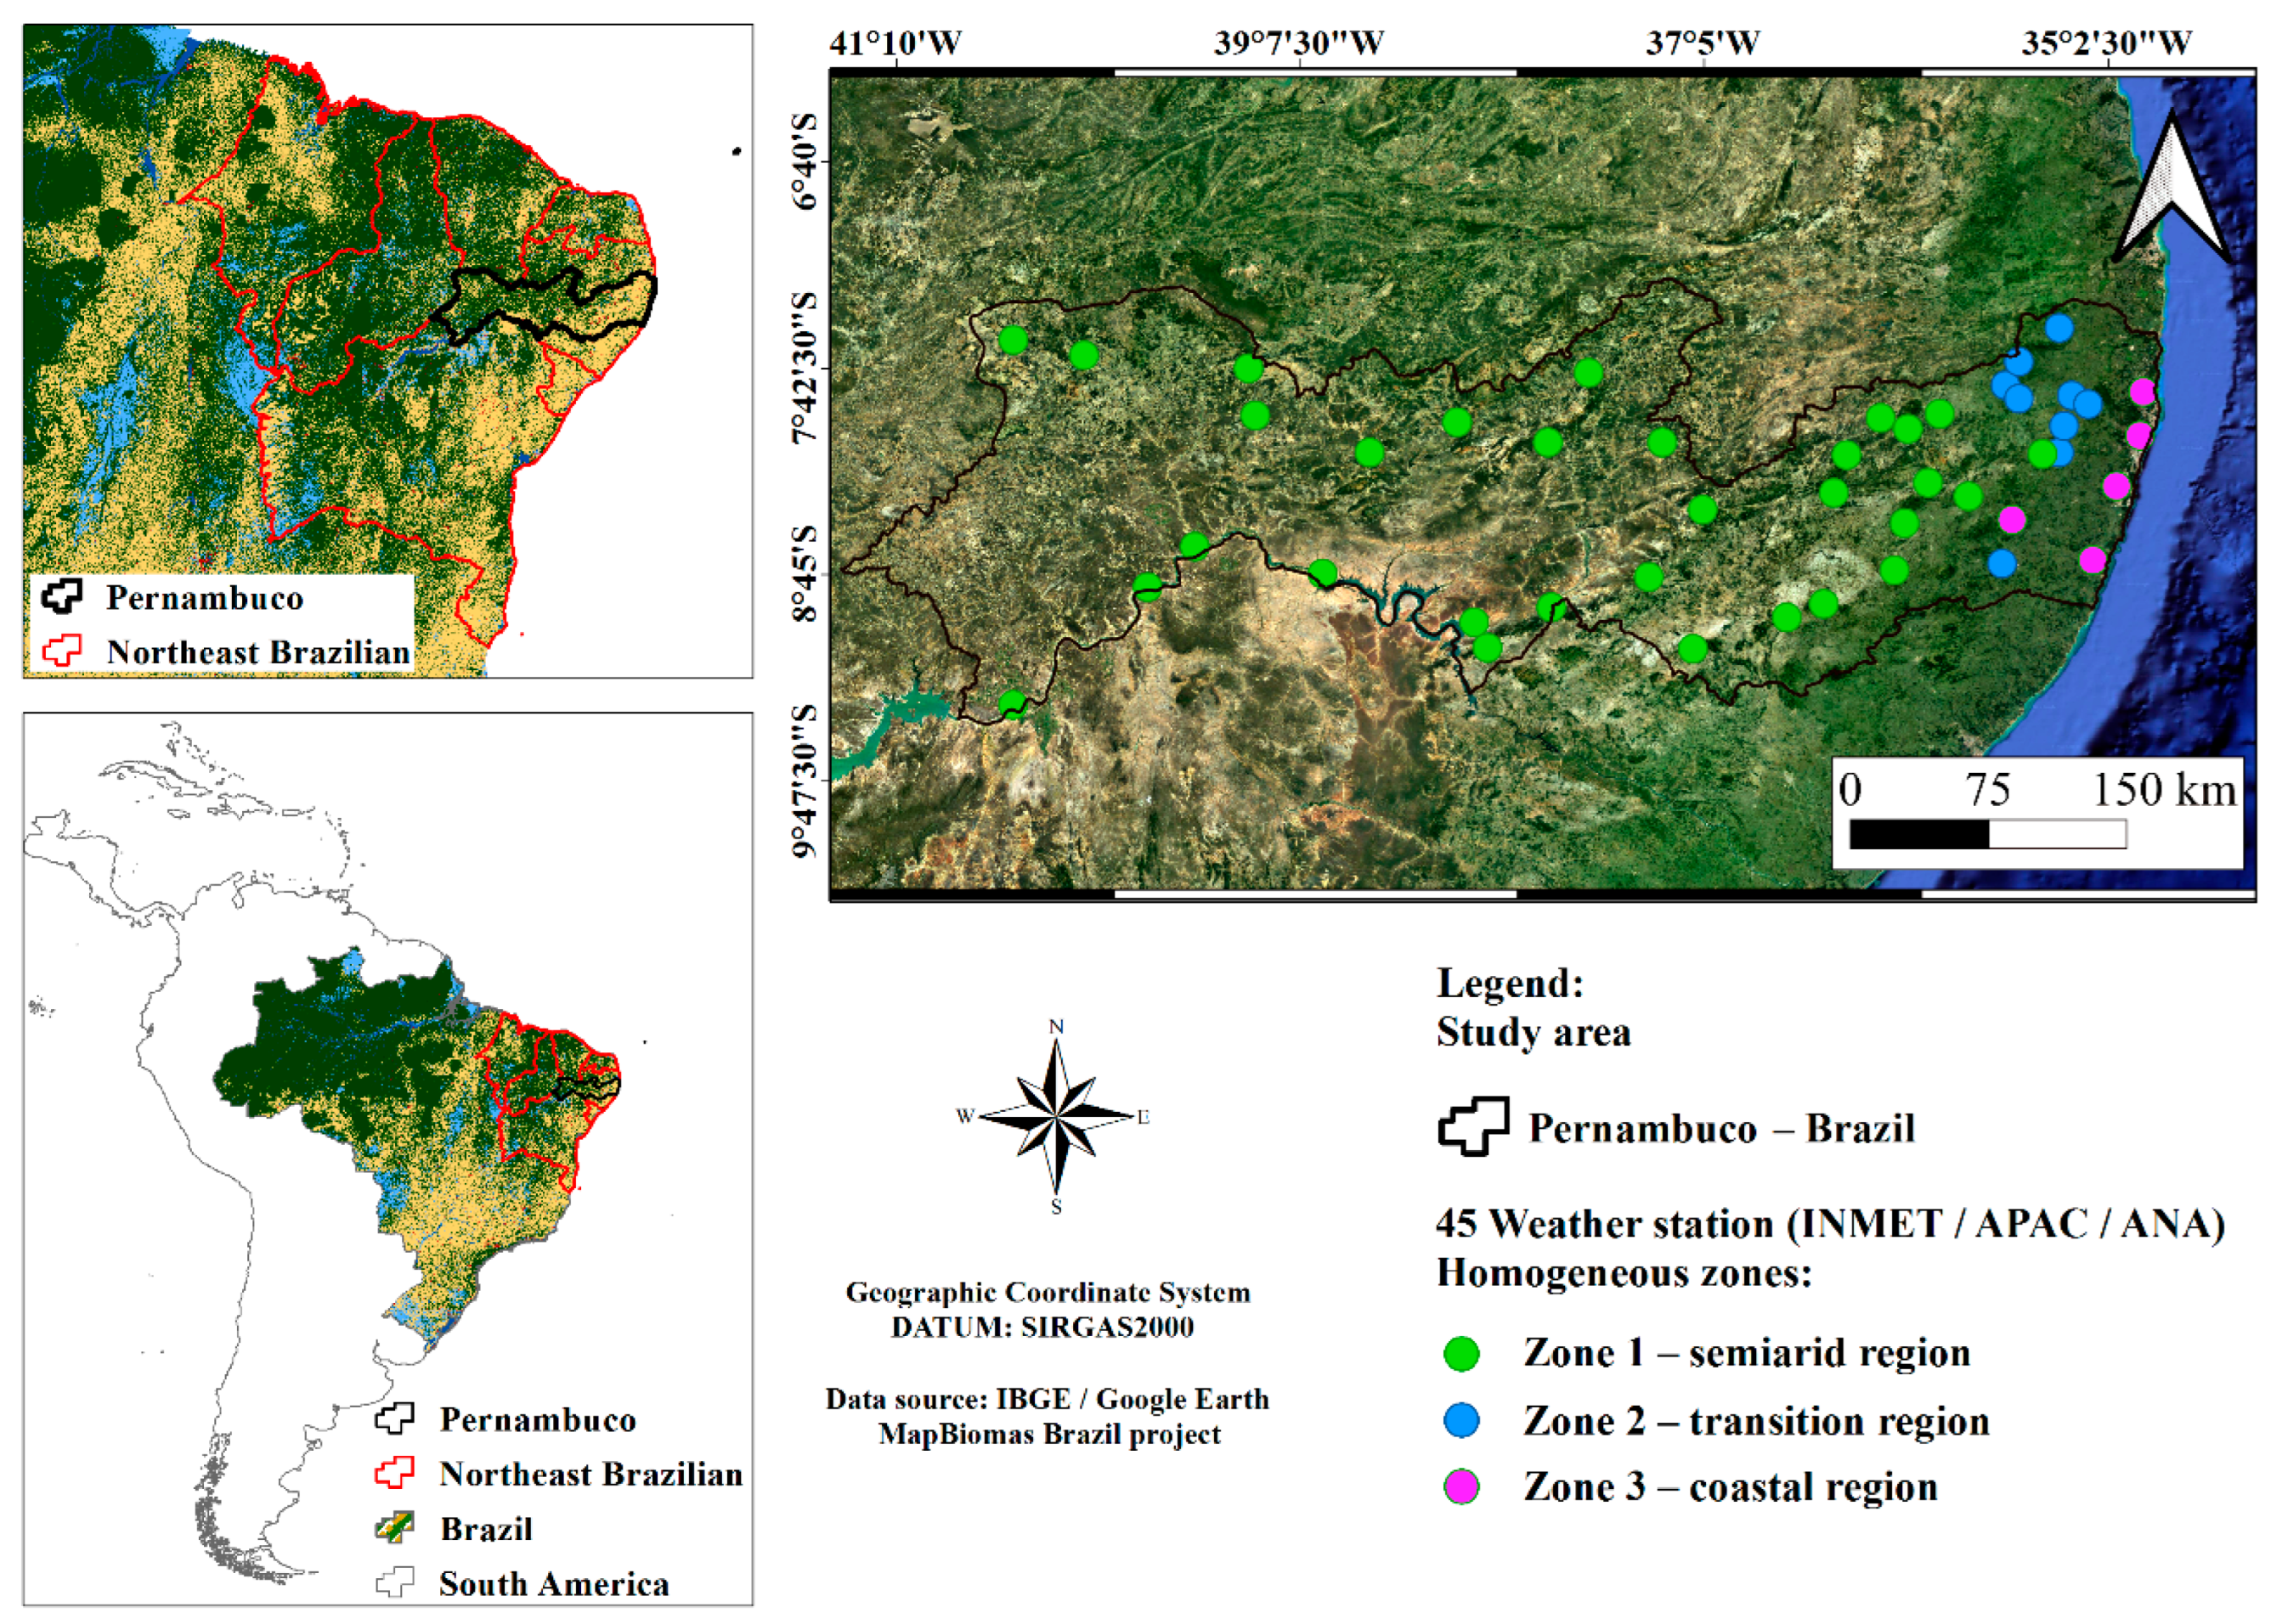
2.1. Area of Study

This research considered the state of Pernambuco (Figure 1), located in the northeast region of Brazil, in which the service, industrial and agriculture sectors represent 70, 20 and 4% of gross domestic product (GDP), respectively [35]. The region can be divided into two distinct areas: coastal (bordering the Atlantic Ocean) and the semiarid (continental region).
The coastal region has deep soils and a tropical zone climate (As and Am), and it is the predominant biome of the Atlantic Forest, with an accumulated annual precipitation ranging from 800 to 2400 m, with the rainy season concentrated from May to July. In comparison, the semiarid region has shallow soils, a semiarid climate (BSh), a Caatinga biome, and accumulated annual precipitation between 400 and 800 m, with the rainy season from January to April [36,37].

2.2. Database

2.2.1. Precipitation in the State of Pernambuco

We used data from 45 stations belonging to the networks of the National Institute of Meteorology (INMET), Pernambuco Water and Climate Agency (APAC) and The National Water Agency (ANA) from 1987 to 2019. The data provided show the monthly accumulation of each season, from which we calculated the monthly average during the evaluation period and in the years considered as extreme: very dry and very rainy.
The homogeneous zones followed the study’s suggestion by Bezerra et al. [34], who classified weather stations based on the accumulated annual rainfall, Euclidean distance, and Ward’s criterion. The authors also applied the Rainfall Anomaly Index (RAI) to classify the annual rainfall in the respective zones from 1987 to 2019. The authors noted that 2004 recorded the highest rainfall, while 2012 was identified as the driest, based on data from 1987 to 2019. We considered these years for the analysis, and we separated the weather stations into three homogeneous zones (Figure 1): 1—semiarid, 2—transition, 3—coastal region; the years of extremes considered were: 2004—as very wet—and 2012—as very dry.
Figure 2 shows the precipitation conditions in the extreme years compared to the average of the monthly accumulation in the period from 1987 to 2019, in the average for the entire state region (Figure 2a) and each homogeneous zone (Figure 2b–d), in which it highlights the difference in precipitation behavior in the years considered.

2.2.2. Remote Sensing Products

MODIS products allowed us to estimate biophysical parameters, Normalized Difference Vegetation Index (NDVI), Enhanced Vegetation Index (EVI), Soil-Adjusted Vegetation Index (SAVI), Normalized Difference Water Index (NDWI), Surface Albedo and Surface Temperature, 2000 to 2019. The Google Earth Engine platform (https://earthengine.google.com/—accessed on 11 July 2020) allowed the average monthly composition of biophysical parameters to be calculated in the years considered in this study, 2004 and 2012, from mod11A1 and MOD09A1 products.
We determined Surface Albedo, NDVI, EVI, SAVI and NDWI from the reflectance product, MOD09, with 500 m of spatial resolution. We initially corrected using factors (multiplicative and additional) referring to each layer and then calculated each parameter according to the methodology presented in Table 1.
Table 1 presents surface biophysical parameters equations: RbR is the reflectance of Band 1 (red: 620–670 nm); RbIR shows the reflectance of Band 2 (NIR: 841–875 nm); RbB is Band 3 Reflectance (blue: 459–479 nm); RbG is Band 4 Reflectance (green: 545–565 nm); RbV is Band 5 Reflectance (SWIR1: 1230–1250 nm); RbVI is Band 6 Reflectance (SWIR: 1628–1652 nm); RbVII is Band 7 Reflectance (SWIR2: 2105–2155 nm); L1 corresponds to canopy bottom setting, the value of 1; G referring to the index that corresponds to 2.5; C1 corresponds to 6; C2 is a constant with a value of 7.5; L2 is a soil adjustment factor and was assumed to be 0.5.
We determine the surface temperature (ST) based on the product MOD11A1. This product provides the surface temperature in Kelvin when applied with a multiplicative factor of 0.02. Next, we apply a temperature conversion from Kelvin to degrees Celsius (°C).
To develop the statistical analyses of the relationship between precipitation and biophysical parameters, we extracted the pixel values corresponding to rainfall stations in the monthly composition image of biophysical parameters in the years 2004 and 2012.

2.3. Statistical Analysis

Initially, we considered the monthly average of the parameters and precipitation at the state level; then, we developed in each homogeneous precipitation zone (Zones 1, 2 and 3—Figure 1). From the average of the weather stations, both values were extracted from the pixels and precipitation. We applied a correlation analysis between precipitation and biophysical parameters to verify the degree of agreement between the variables. Due to the difference in the scale of the parameters, we applied a Min-Max normalization type data transformation to make all variables in the same order of magnitude (0 to 1).
We used the Shapiro–Wilk Test to verify the variables’ normality, then a correlation analysis was performed and tested for significance at the 5% level. In situations where the parameters presented a normal distribution, Pearson’s correlation was applied, which quantifies the linear association force between two variables [43].
For situations where the variable had a non-normal distribution, we used the Kendall correlation coefficient, known as Kendall’s τ (tau). This coefficient has the advantage of being generalized to a partial coefficient, and the variance or outliers do not influence the result [44]. For all correlations, we tested the significance with the T-Student test at a level of 5% [32].

2.4. Spatial–Temporal Seasonality of Biophysical Parameters

To understand the variability of biophysical parameters in the years considered extreme, we generated a reduced image for each quarter of 2004 and 2012: 1st Quarter—January to March; 2nd Quarter—April to June; 3rd Quarter—July to September; 4th Quarter—October to December. We chose to represent variability at the quarterly level because studies concentrate on rainfall in quarters or four-month periods [45,46,47,48]. In this sense, we can be more synthetic without losing information.

3. Results and Discussion

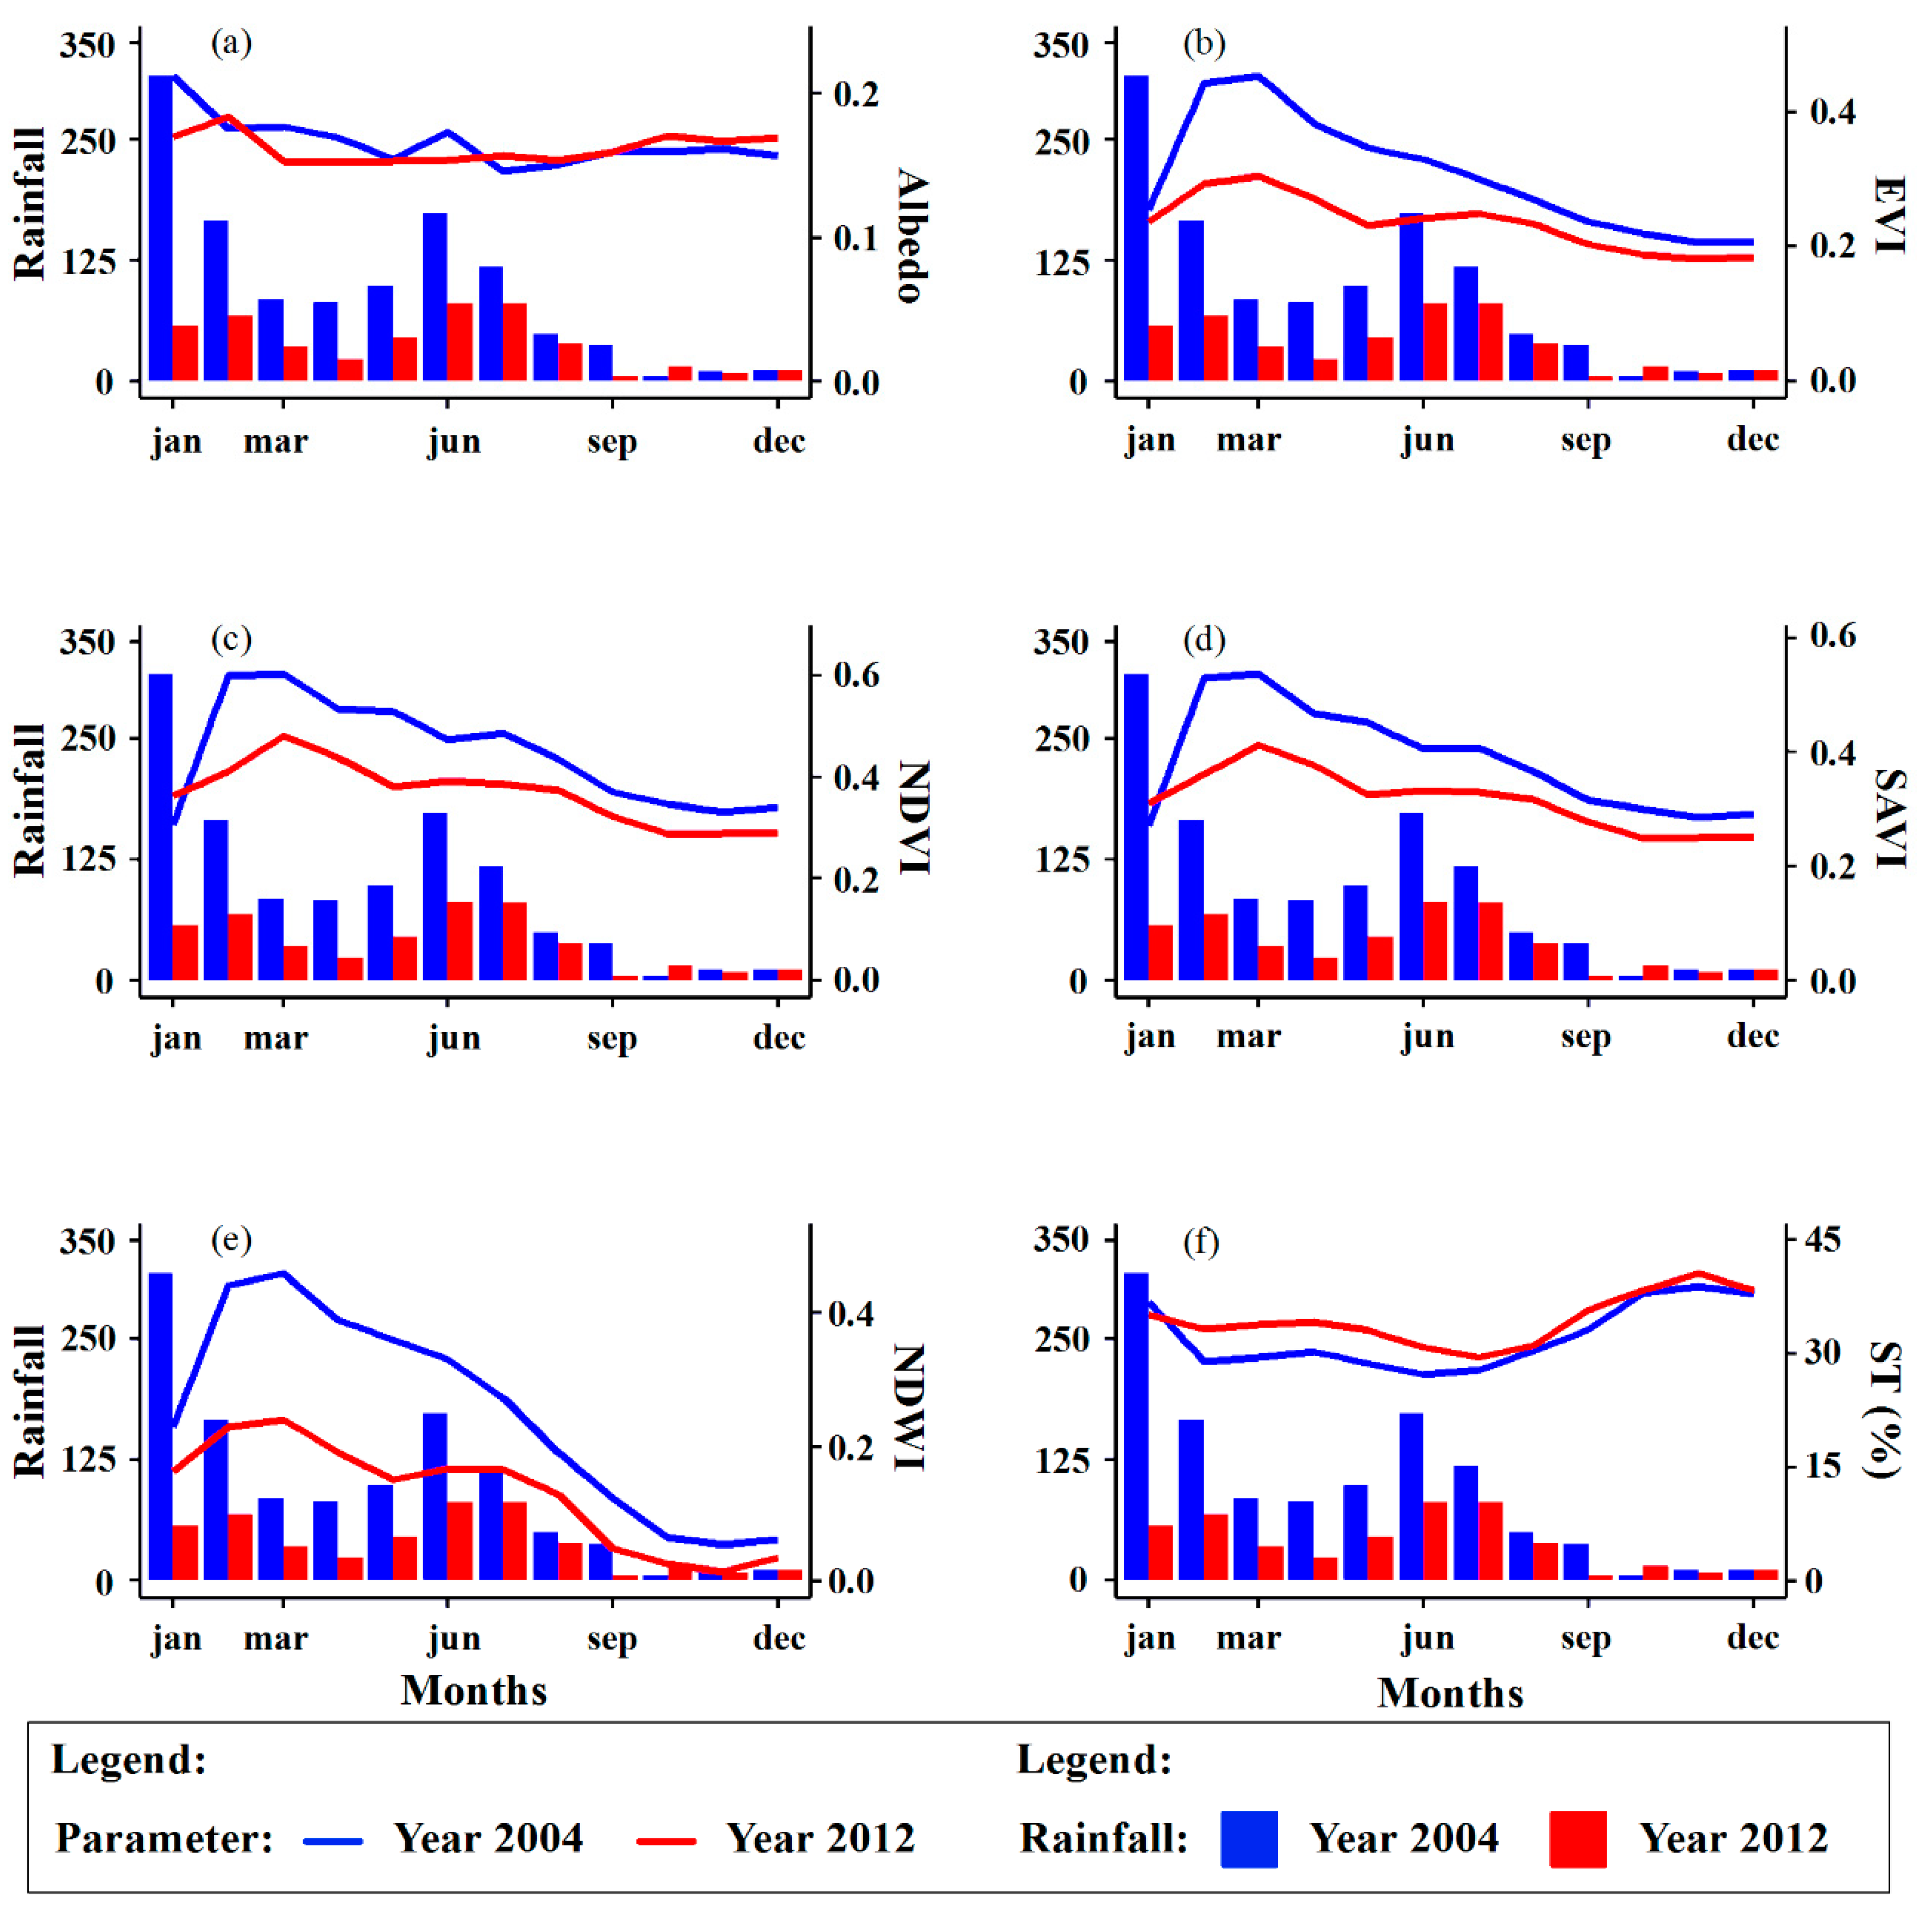
3.1. Seasonality of Biophysical Parameters in Extreme Years—Pernambuco (State Level)

Figure 3 shows the behavior of the biophysical parameters considered in the years 2004 (wet) and 2012 (dry), including albedo (Figure 3a), EVI (Figure 3b), NDVI (Figure 3c), SAVI (Figure 3d), NDWI (Figure 3e) and surface temperature (Figure 3f). The critical period in the study area was observed during the last quarter (September to December), coinciding with the lowest rainfall indices.
Regarding behavior in extreme years, 2004 presented higher values than in 2012 of vegetation indices (NDVI, EVI and SAVI) and water index (NDWI), highlighting the importance of precipitation for vegetation dynamics. In the most critical period between September and December, a comparison of 2012 with 2004, there was an average reduction of 14% in the vegetation indices (NDVI, EVI and SAVI) and an average reduction of 60% in the NDWI. The albedo increased by 4% and the surface temperature by 3%
Albedo presents a constant behavior during the year and between the years evaluated (2004 and 2012), but with the first months with higher values that decrease until September before gradually increasing again. Alves et al. [49] report that the variation of this variable depends on the season of the year since these changes coincide with the changes in the rainy and dry seasons. In addition, the first semester focuses on the rainy season in the state, with the court from February to May in the interior region (zone 1) and March until July in the coastal region (zone 2 and 3). Thus, albedo (Figure 3a) tends to present cloud contamination in the first semester, justifying higher values in this period, especially during the wet year (2004) [30].
The ratio of vegetation indices (EVI, NDVI, SAVI) and water index (NDWI) and precipitation (Figure 3b–e) present lower values in the driest period, between September and December. The results coincide with Souza et al. [32], who found the lowest NDVI values in October and November in the state of Paraíba.
The evaluated years have similar behavior in ST (Figure 3f), with the lowest values coinciding with the rainy season and the highest with drought. This behavior is because the lower precipitation rates decrease the attenuation capacity of the surface temperature, either by lower vegetation cover or by lower soil moisture [31,50].
In turn, Table 2 presents the correlations of the monthly means of biophysical parameters with the average of the monthly accumulated precipitation in Pernambuco, and the results indicate a higher correlation for the dry year (2012). NDWI and surface temperature in 2012 showed a significant correlation among the parameters considered.
The results reveal an increased sensitivity of the region during drought, evidenced by the higher correlation values observed in 2012, the driest year on record. As highlighted by Medeiros et al. [27], there is a complex relationship between rainfall patterns, environmental factors, and vegetation response, especially in the seasonally dry forest known as Caatinga, a biome widely present in our study area. In contexts of reduced rainfall, ecosystems face significant water deficits, resulting in decreased leaf cover and, consequently, lower vegetation index values.
The NDVI, the main parameter used in studies of this nature, did not present results corresponding to those found in other studies [29,30,31,32]. However, it is essential to emphasize that some methodological differences may cause this difference, which applies to both NDVI and other biophysical parameters. One fundamental distinction pertains to the spatial scale considered. Previous studies focused on specific pixel values, whereas our research adopted a statewide average approach for both biophysical parameters and precipitation. The distinction in rainfall patterns, as highlighted in [16], as well as differences in spectral responses of vegetation indices further contribute to these differences, stemming from variations in the seasonally dry forest biome and the coastal area.
Additionally, the response time of vegetation plays a pivotal role, given the potential for extended delays in vegetation responses to precipitation events, thereby leading to diminished correlations [1]. It is important to note that, in our study, we did not carry out analyses at varying time intervals to investigate this dynamic in the vegetation of Pernambuco.
Furthermore, our study’s limitations extend to the products utilized; we employed data with a spatial resolution of 500 m, affecting the assessment of parameters and their correlation with precipitation. Hence, exploring alternative products with higher spatial resolution becomes imperative to gain a more nuanced understanding of the effects of precipitation at a regional level. [19]. We emphasize that we did not analyze different time intervals to verify the response time of the vegetation of Pernambuco.
Thus, the biophysical parameters may help monitor the water conditions of vegetation and surface [51,52]. However, since the relationship was most significant in the driest year (2012), these parameters are suitable for monitoring drought events. As drought is a complex phenomenon, and is the result of climatic variations and human activities, it occurs under extreme conditions of water scarcity and represents a danger to ecosystems [53]; only one parameter is not sufficient for the proper representation of the phenomenon [54], the most usual being to associate NDWI and NDVI.
Our results suggest that using NDWI and ST can help understand vegetation response to precipitation at a regional level. Different studies have used NDWI in drought monitoring, such as Dobri et al. [54], who applied it to arable land in Romania; Wesson and Britz [55] applied it on the southern coast of the Eastern Cape, South Africa; and Marusig et al. [56] in a forest on the Karst plateau, a border between Slovenia and Italy.

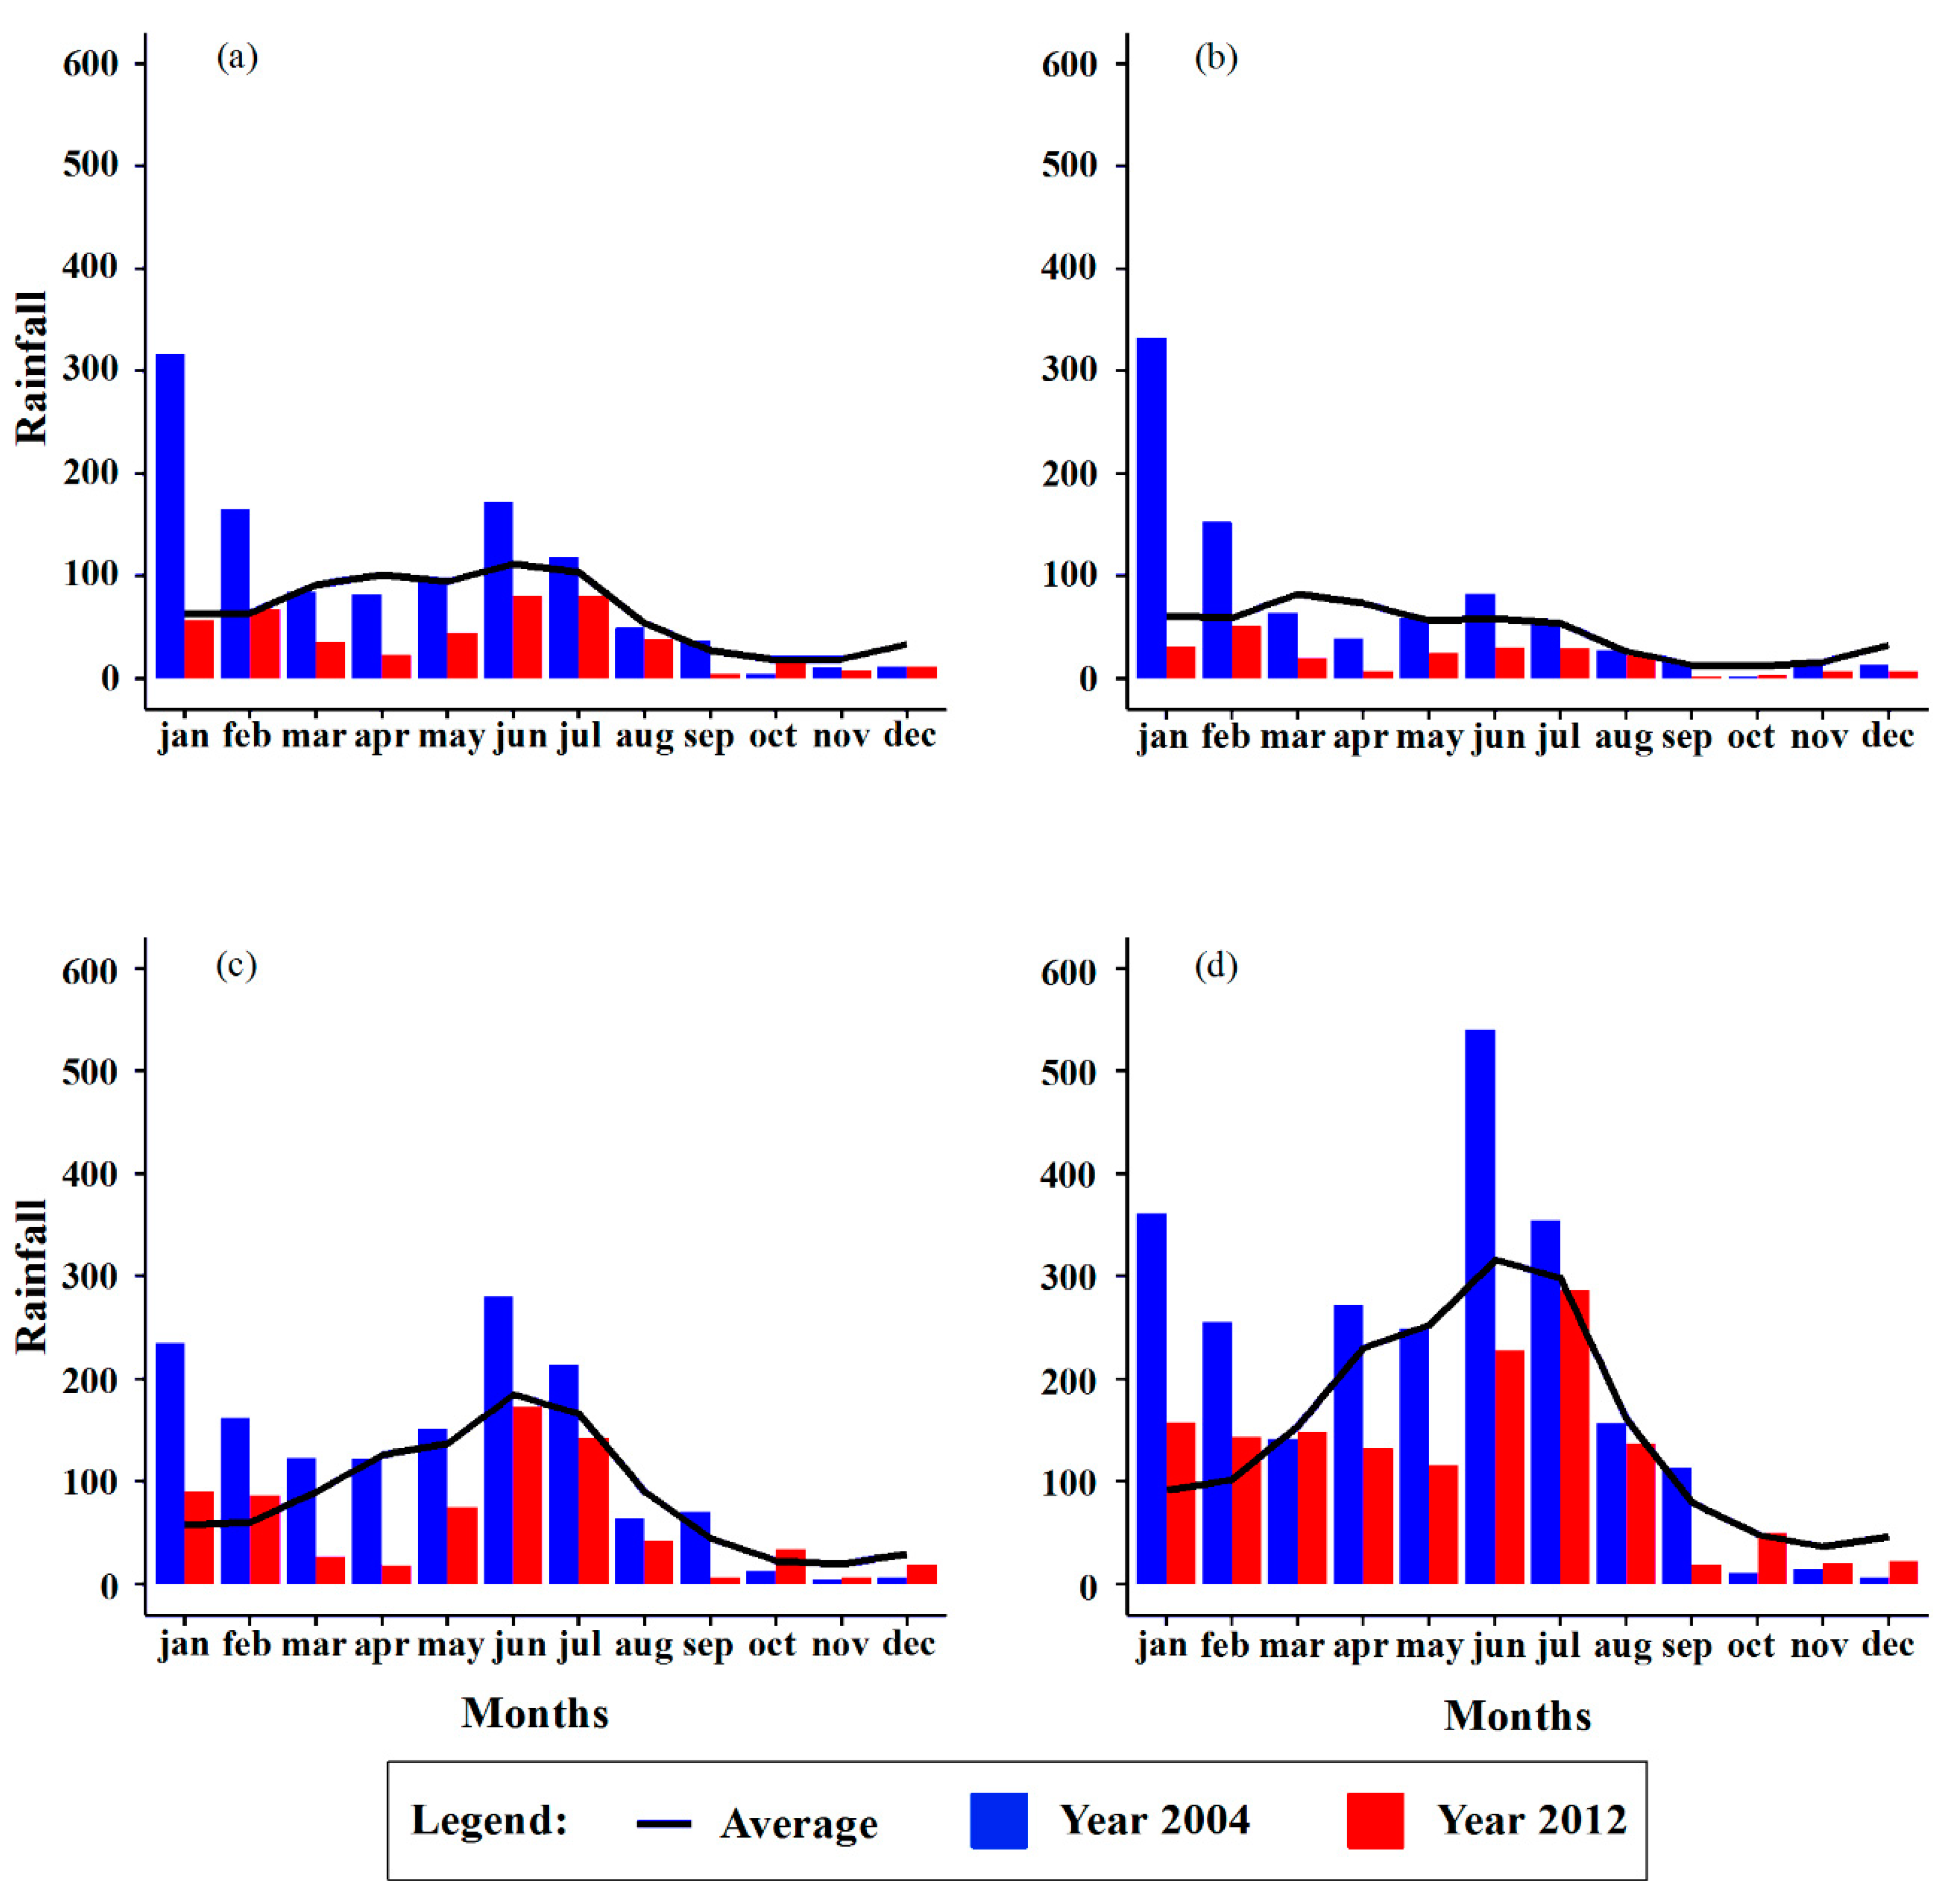
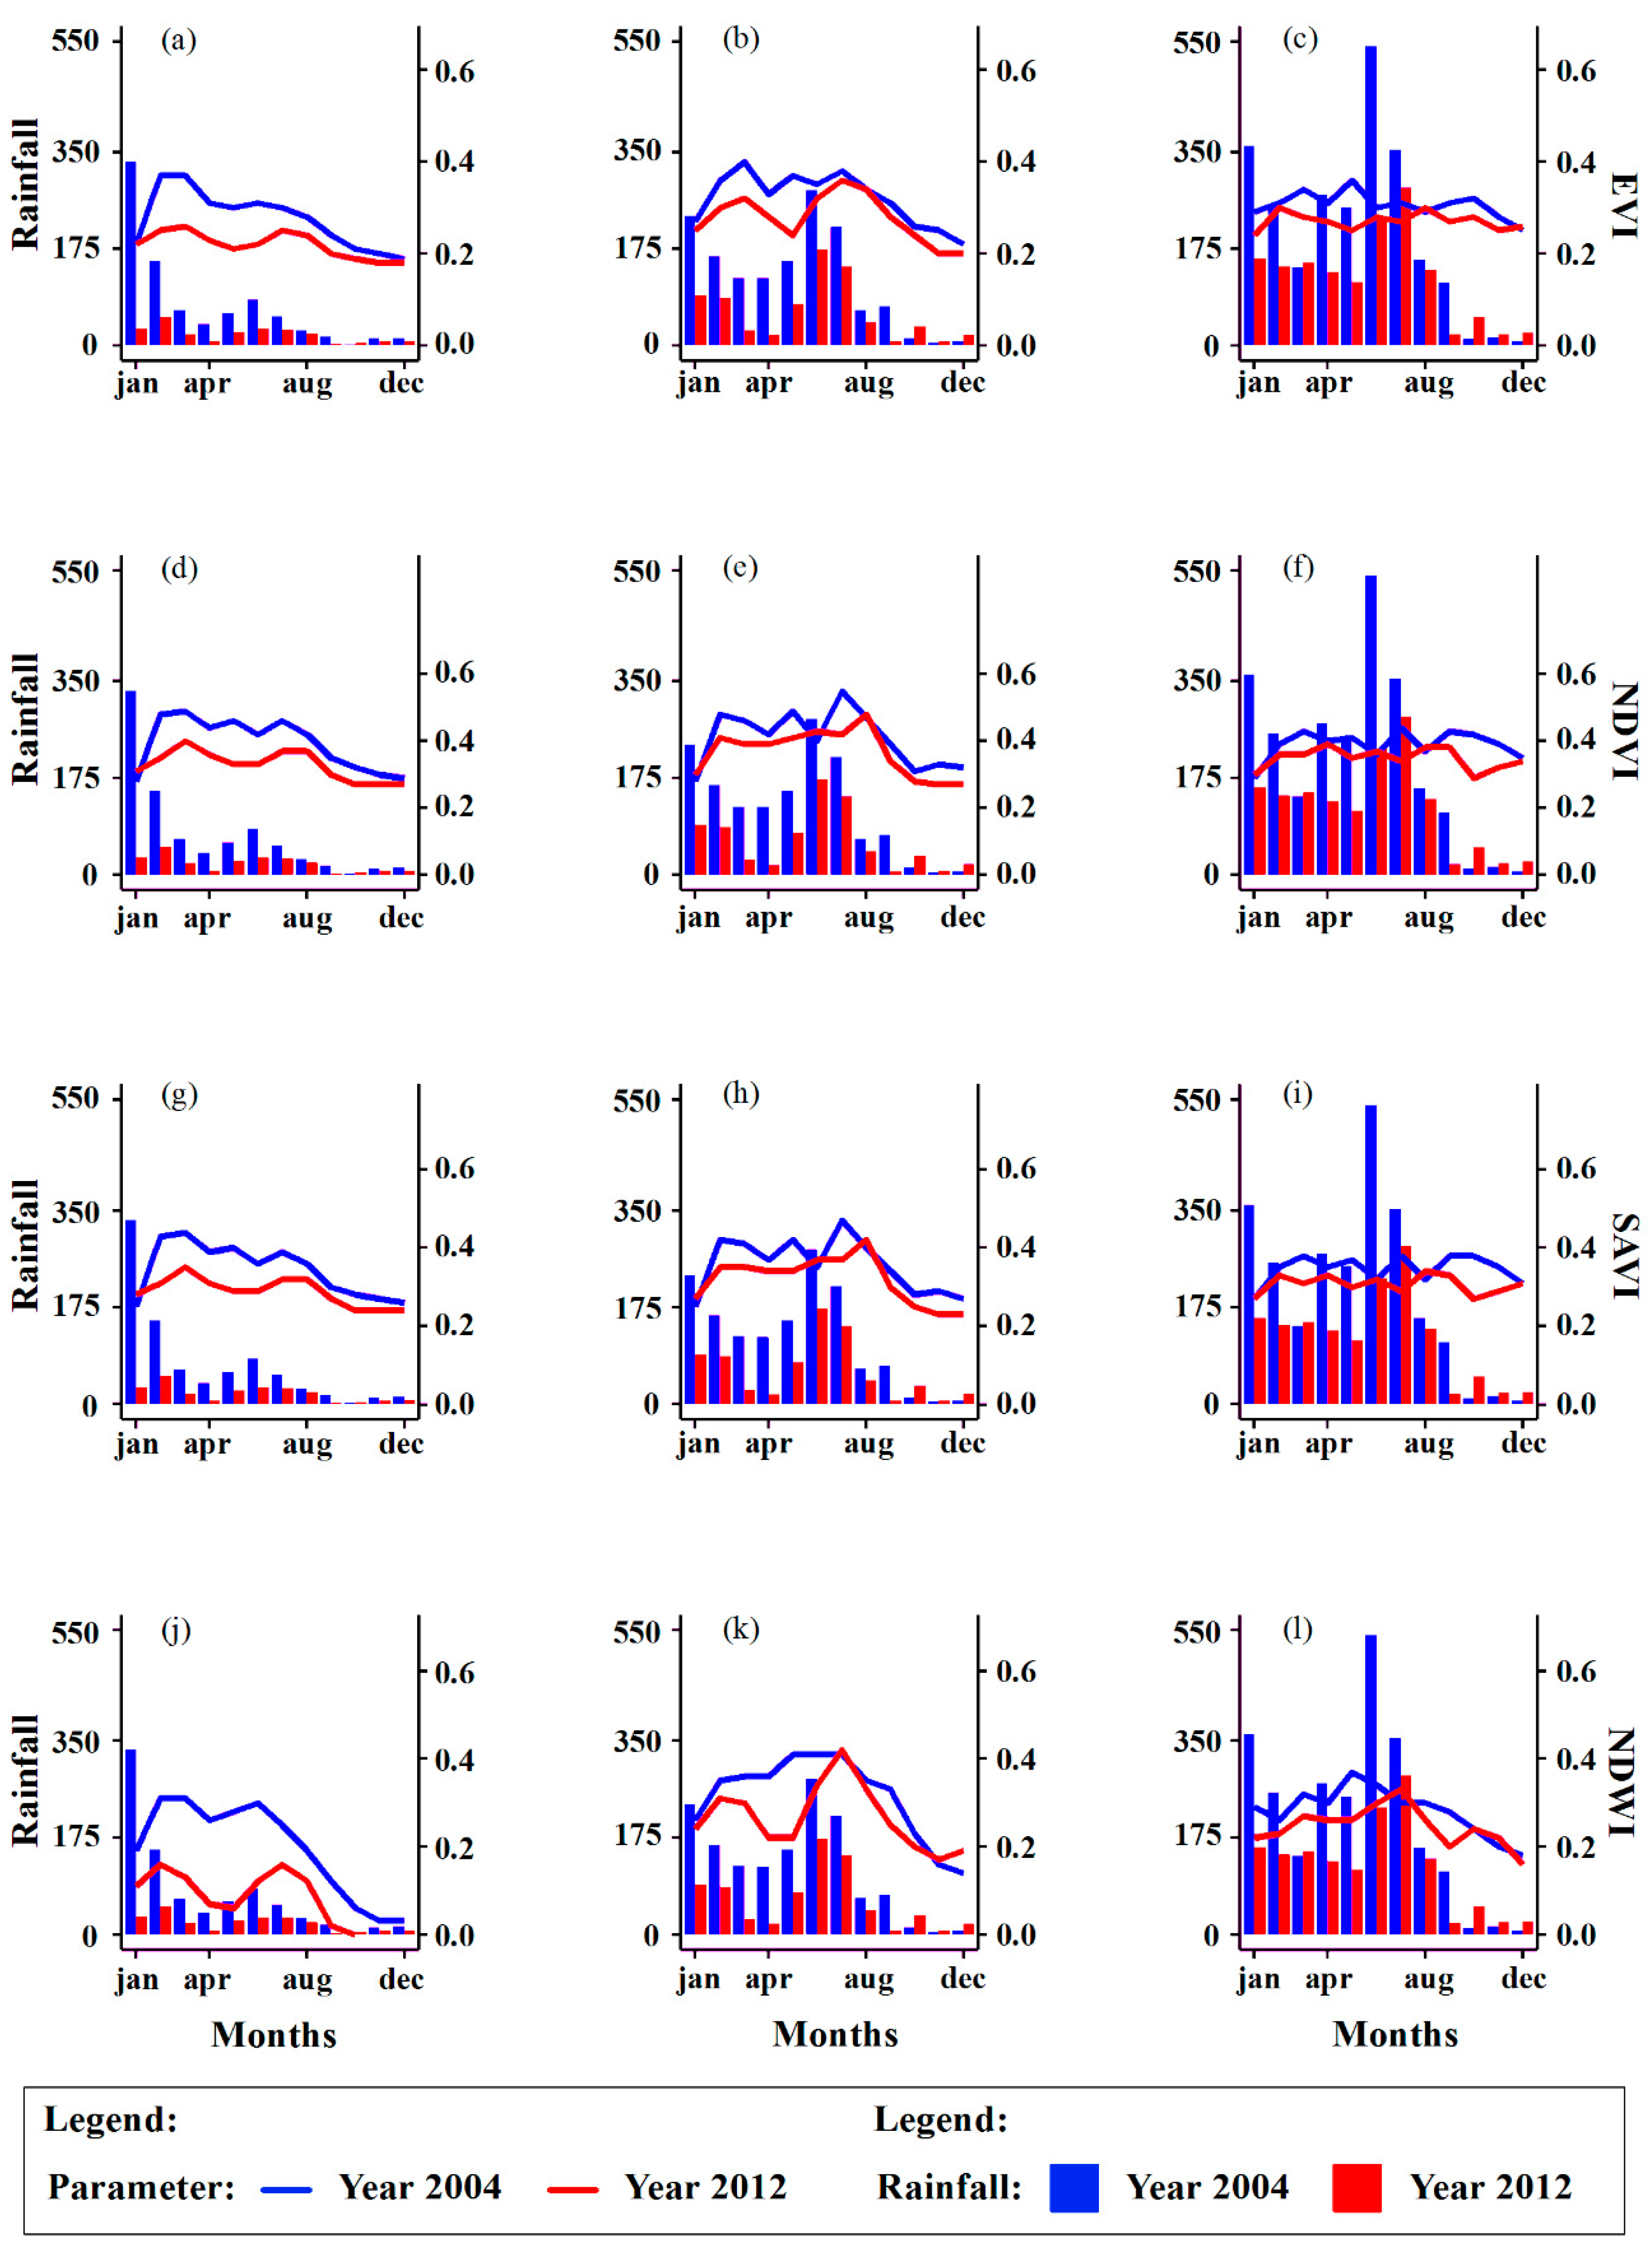
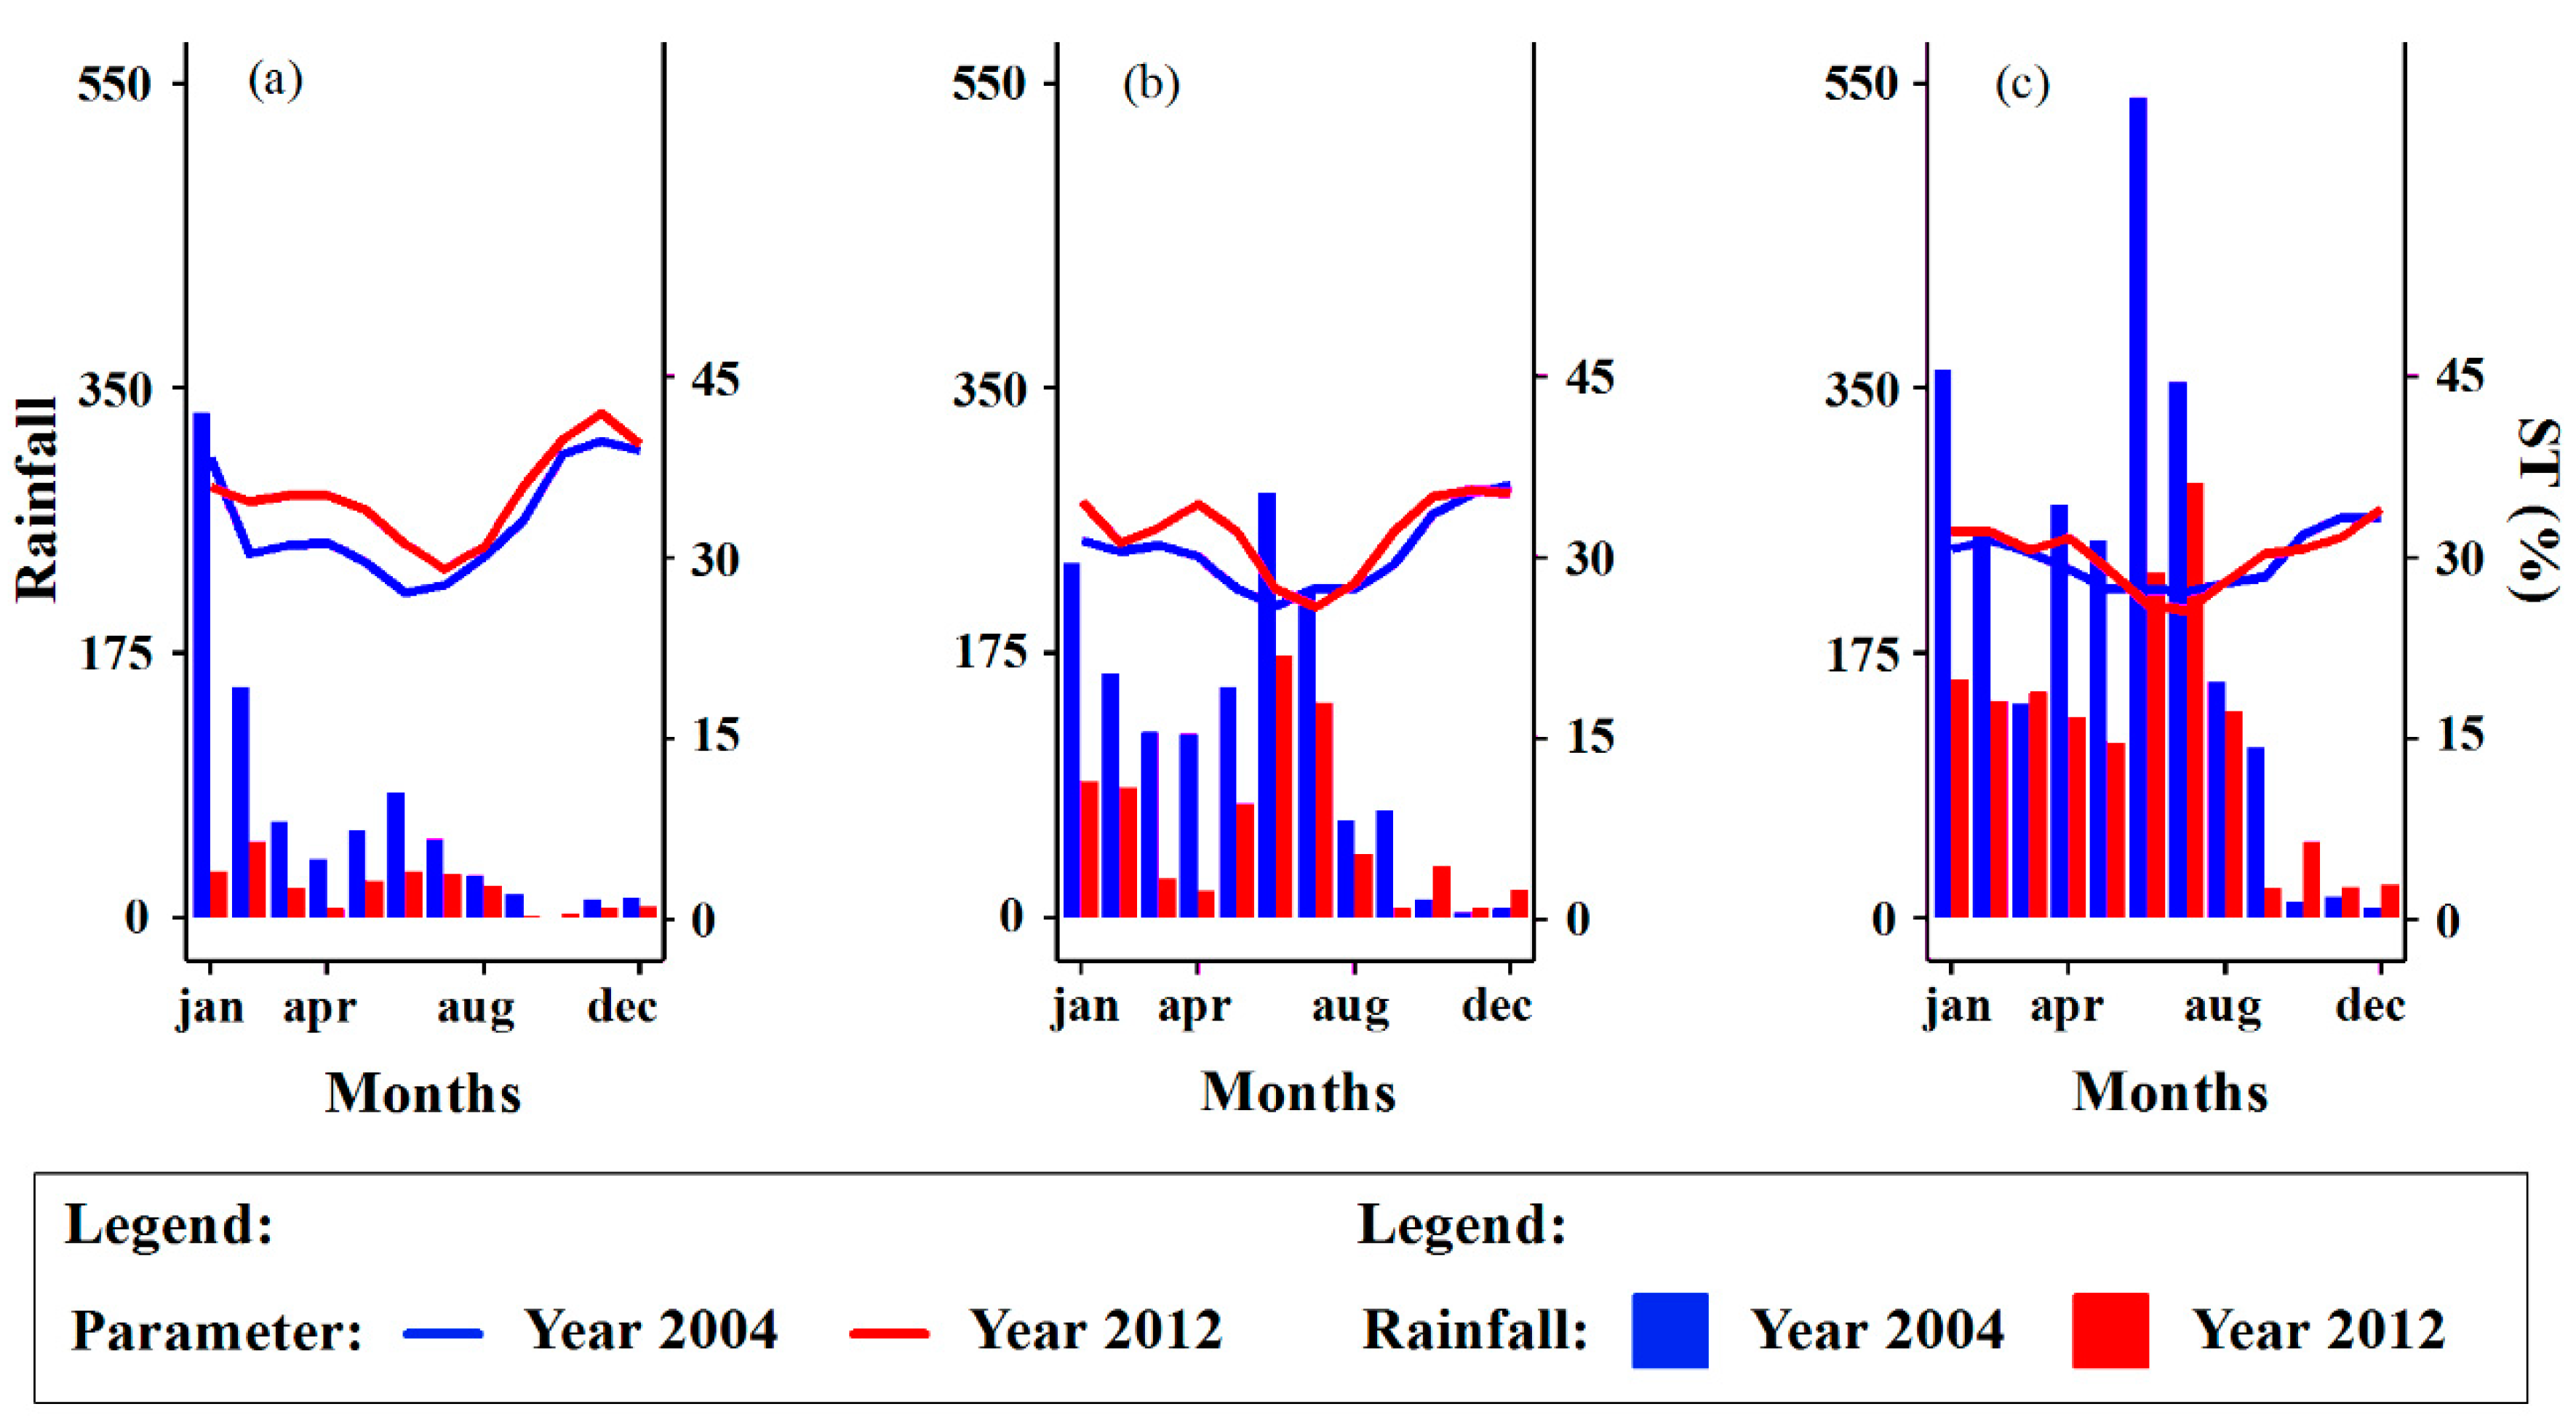
3.2. Seasonality of Biophysical Parameters in Extreme Years—Homogeneous Precipitation Zones of Pernambuco

In our investigation of biophysical parameters’ seasonality in different precipitation zones, we assessed the relationship between monthly averages of parameters (Albedo, NDVI, EVI, SAVI, NDWI, and ST) and precipitation in each homogeneous zone. Figure 4 illustrates albedo variations across zones, revealing minor fluctuations in zone 1 (semiarid) and more significant variability in zones 2 and 3 throughout the year.
The results presented in Figure 4 highlight the effects of cloudiness on remote sensing products, especially in the coastal region, since the tropic zones present conditions that limit monitoring through optical sensors [57]. We use MODIS (MOD09) products, which consider a material composition based on the choice of the pixel with the highest reflectance, including cloud-free pixel and optimal zenith angle [58]; we do not apply a filter to minimize the effects of cloudiness.
Figure 5 presents the behavior of vegetation indices (EVI, NDVI, and SAVI) and NDWI in relation to precipitation throughout the year. Zone 1 (5a, 5d, 5g, and 5j) exhibits a substantial annual amplitude. At the same time, zones 2 (5b, 5e, 5h, and 5k) and 3 (5c, 5f, 5i, and 5l) demonstrate consistent patterns, regardless of the annual rainfall regime due to their high annual precipitation (1800 mm), indicating lower dependence on rainfall events.
The results found in the semiarid region (zone 1) corroborate the results found by Rodrigues et al. [30] in the Trussu River basin (Brazilian semiarid region). The results for zone 3 corroborate those found by Souza et al. [32], and they are attributed to the region’s vegetation composed of large trees, allowing it to maintain vigor for most of the year.
A possible limitation of NDVI for coastal areas in the rainy season is highlighted by reducing this parameter in June and July in zones 2 (5e) and 3 (5f), which is probably related to the increase in water bodies and saturated soil layers due to higher precipitation rates. Antico [59] reports that it is unusual to use NDVI in humid areas because the seasonal cycle is interrupted by negative NDVI values due to excess water. The water has high absorption in the visible spectrum and most of the infrared energy [60], causing the reduction of indices.
The surface temperature (ST) analysis in extreme years (Figure 6) reveals an inverse relationship with vegetation indices. The year 2012 exhibits prolonged periods of high temperatures, with lower temperatures aligning with the winter months (June to August), in contrast to the wetter year, 2004. This trend is consistent across all precipitation zones in the first semester (January to July).
Table 3 shows the correlation of the parameters with precipitation, and the results confirm the expected behaviors, such as a positive correlation of precipitation with vegetation indices and water index and an inverse correlation with temperature. In turn, there is a positive relationship between albedo and precipitation, probably due to the increase in cloud cover during periods of higher precipitation. This result highlights cloud dynamics’ impact on surface reflectance under variable precipitation conditions.
Among the variables considered (Table 3), NDWI has a higher significant correlation with rainfall in any region of the Pernambuco state. The results highlight the importance of exploring parameters other than NDVI at the state level. In addition to NDWI, zone 1 also shows correspondence with EVI, while zones 2 and 3 significantly correlate with ST. Therefore, our results indicate that monitoring can be more efficient for water conditions if using these biophysical parameters for the respective regions of interest in the state: NDWI and EVI for zone 1 and NDWI and ST for zones 2 and 3.

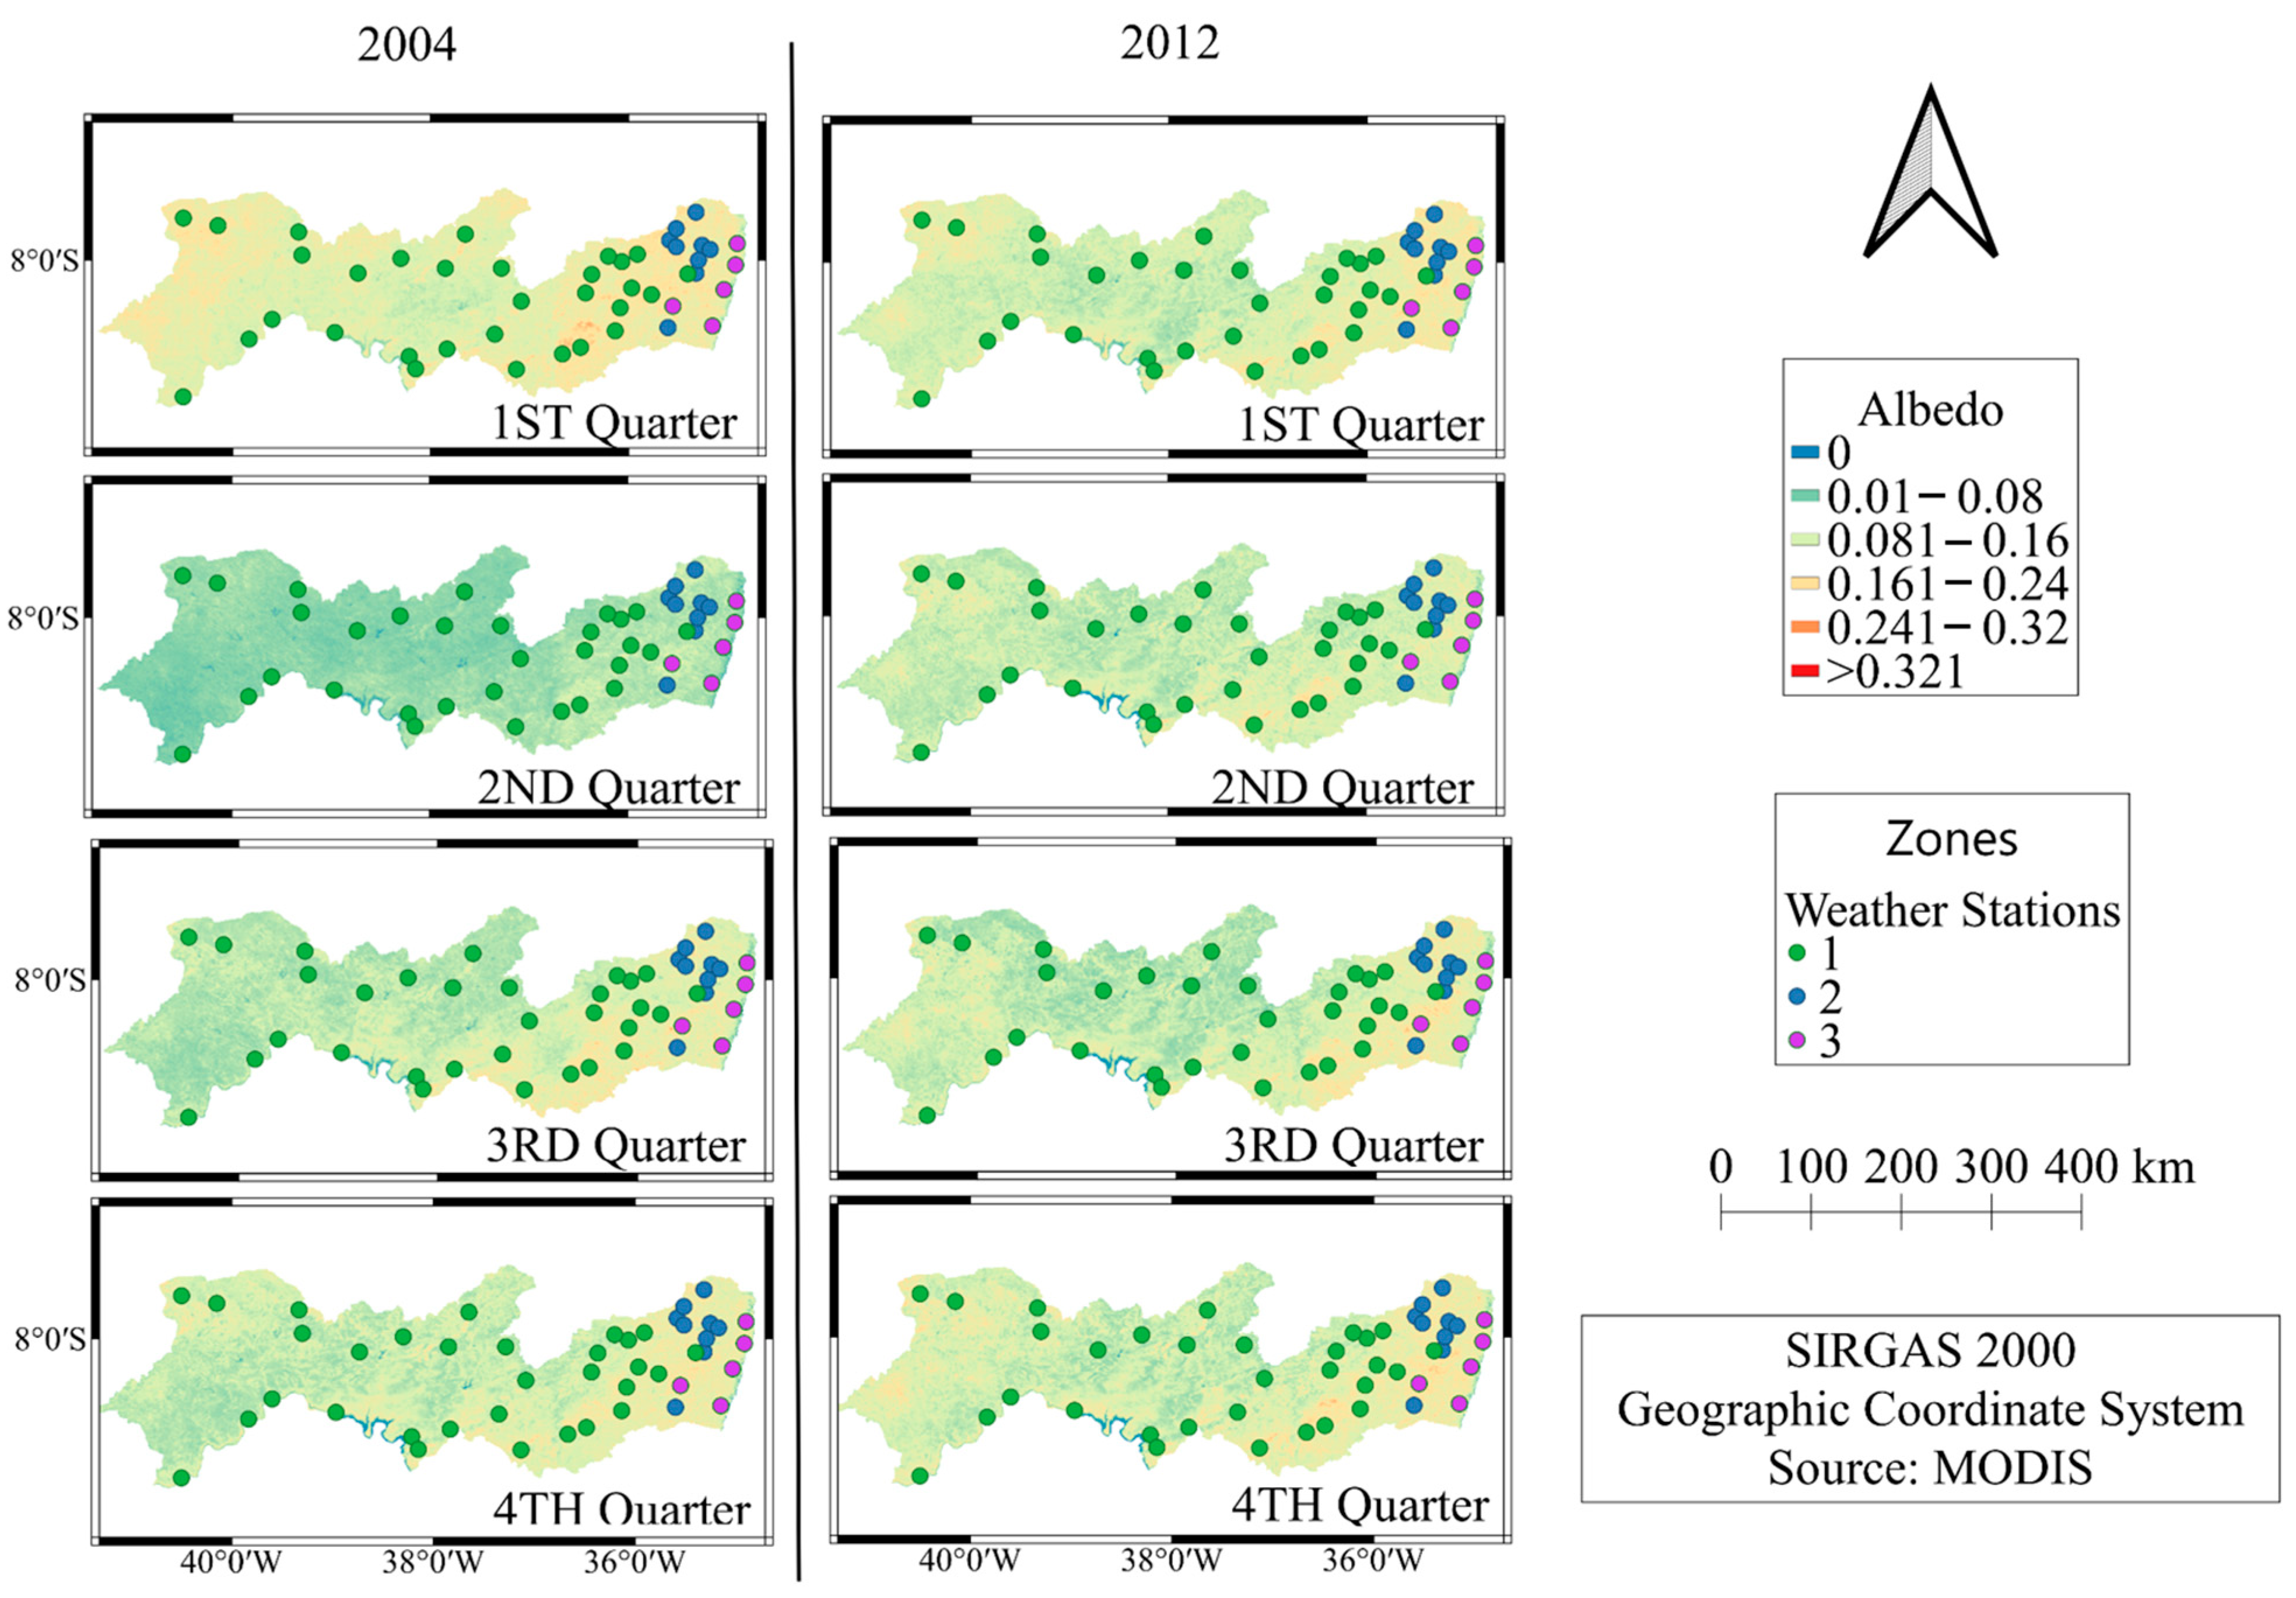
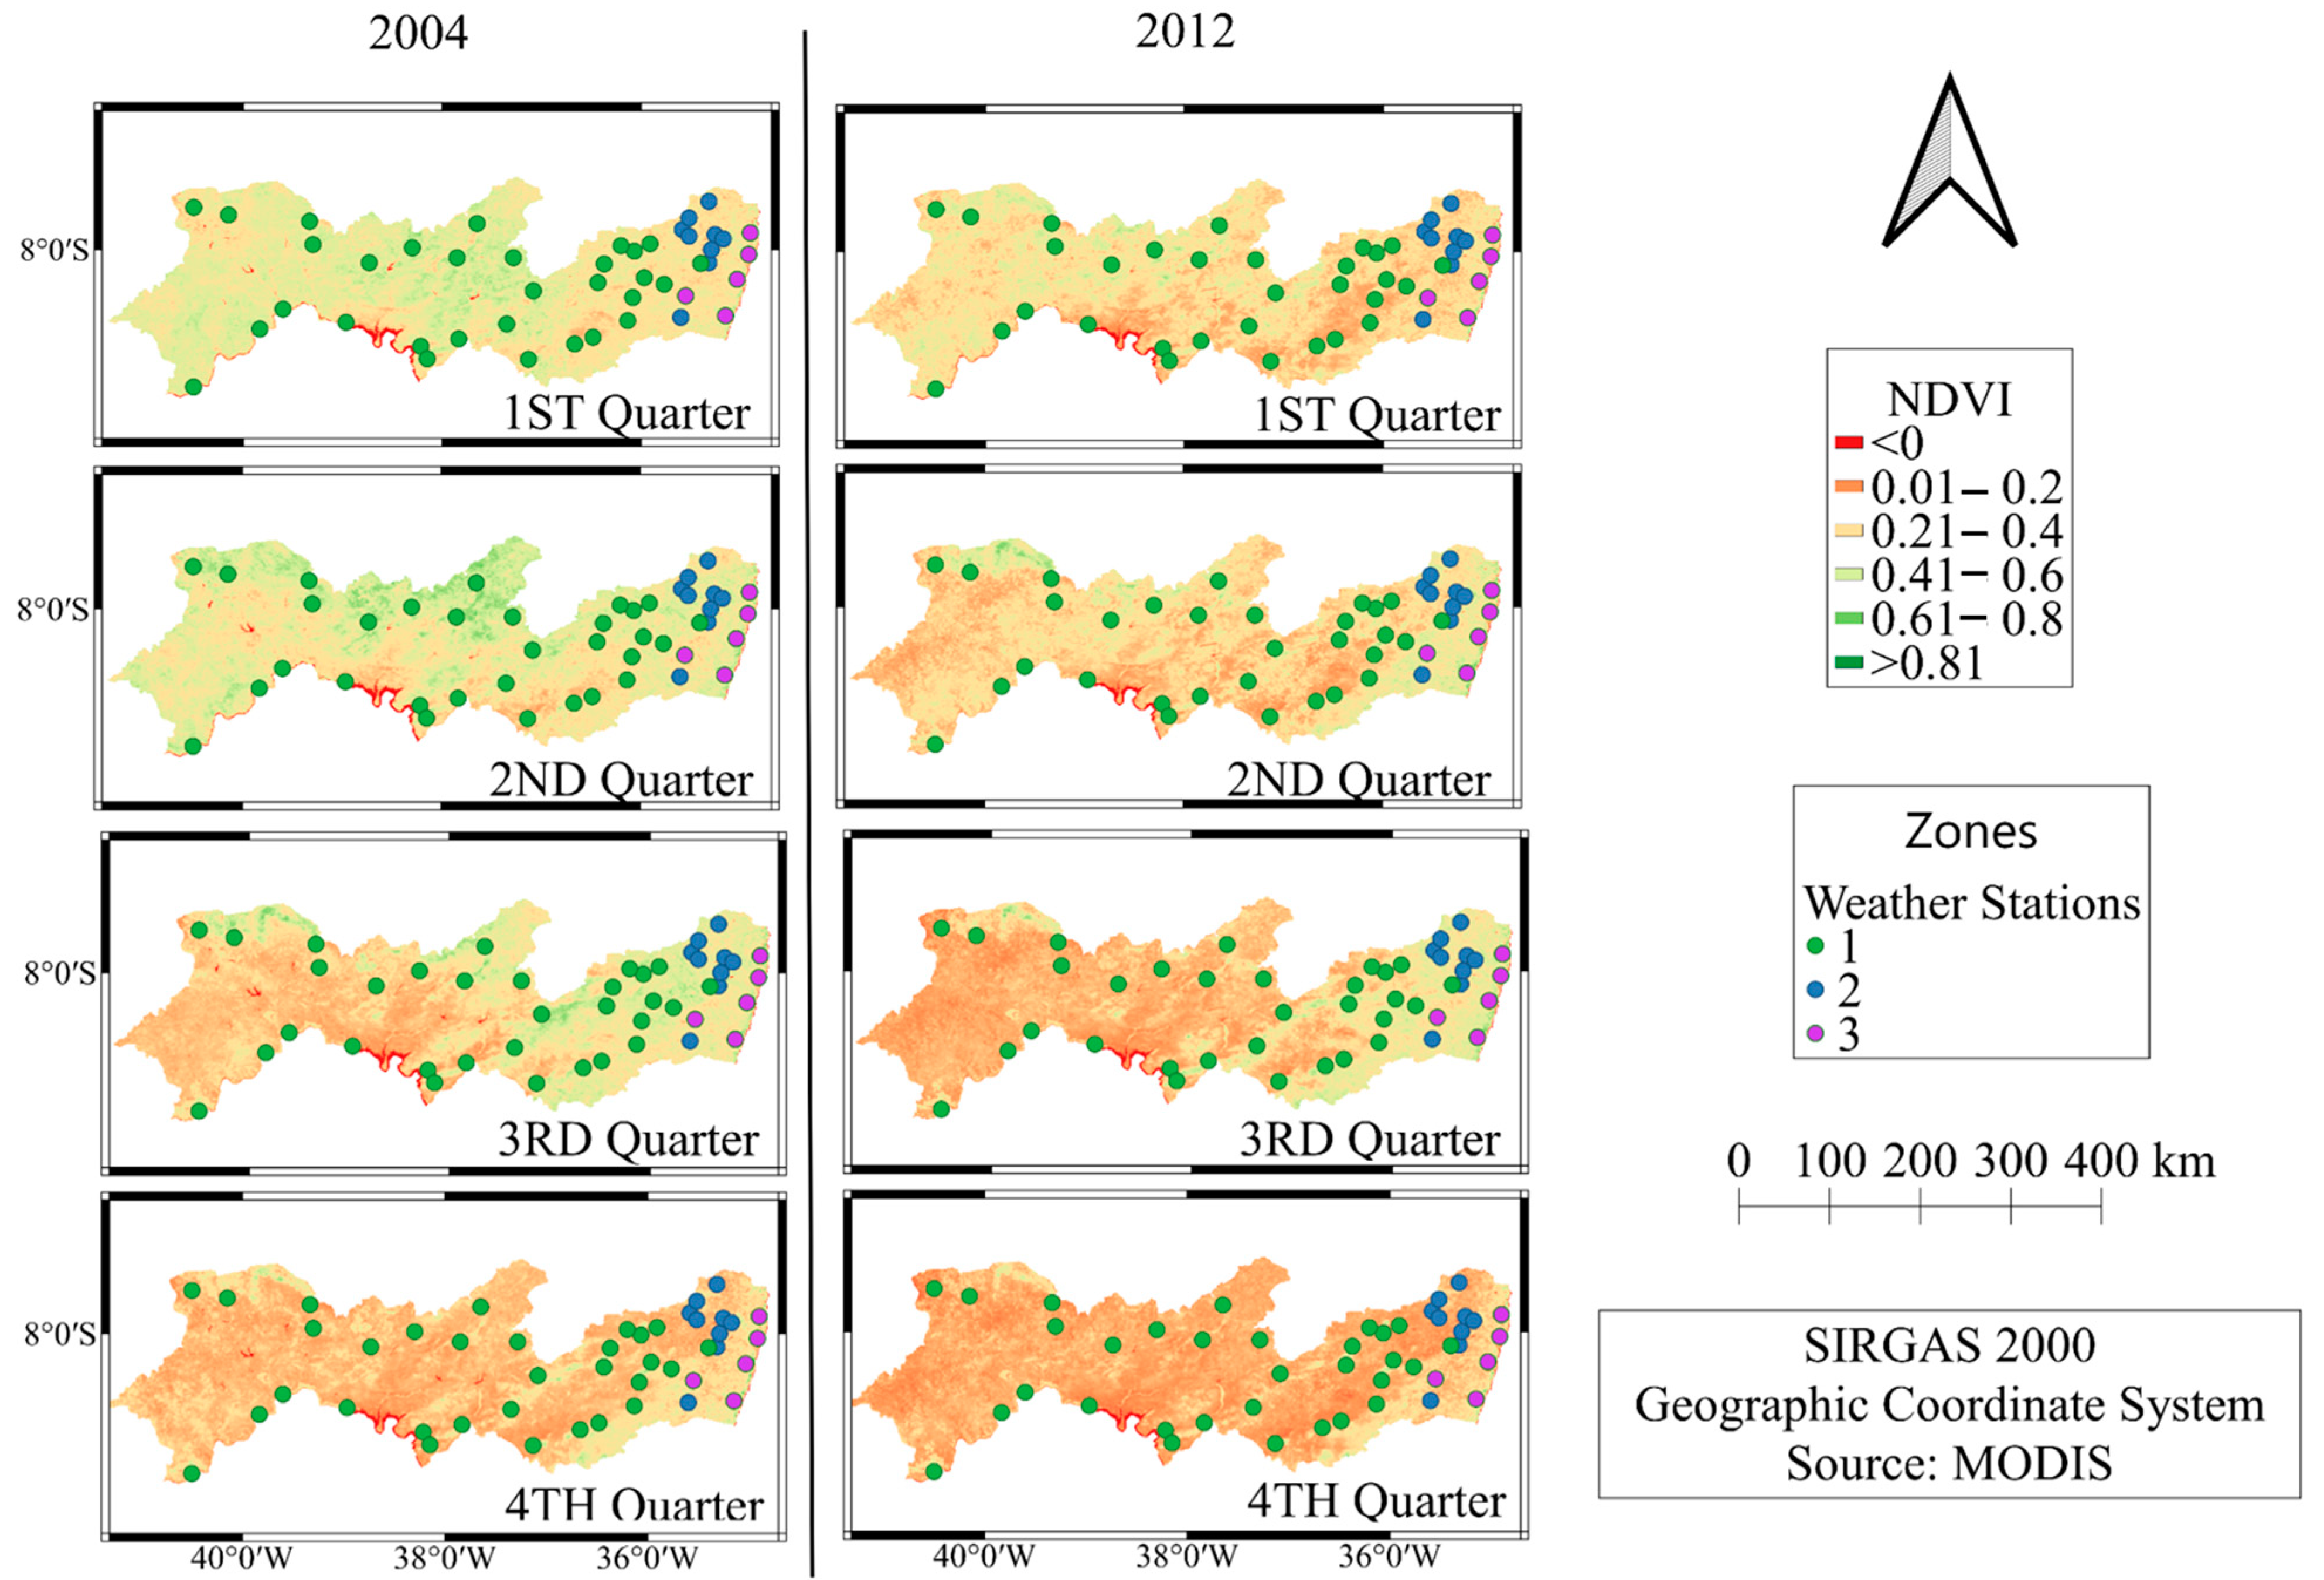
3.3. Spatial Variability of Biophysical Parameters in Pernambuco

The results indicate the relationship of precipitation with biophysical parameters and rainfall, especially in the drier period. The vegetation indices (EVI, SAVI and NDVI) and water (NDWI) showed similar behaviors. Therefore, NDVI, which is widely used in the literature, was chosen as the representative parameter. To elucidate monthly variations in biophysical parameters, Figure 7, Figure 8 and Figure 9 depict thematic maps for albedo, NDVI and surface temperature (ST) respectively.
The results show how the semiarid region (zone 1) presents a greater fragility, with the lowest vegetation index values and higher temperatures. The most critical period is concentrated in the last quarter of the year due to the low precipitation rates in this period. In turn, the coastal region (zone 2 and 3) presents higher albedo values due to the higher incidence of clouds, and ecosystem conditions are uniform during the year due to the amount of precipitation and better distribution during the months [16].
In conclusion, our study has its limitations. Firstly, these limitations stem from our specific spatial focus, concentrating on a specific area of the northeastern territory, characterized by unique rainfall patterns that are not representative of other regions. In addition, the scarcity of weather stations with historical series represents a challenge, restricting our ability to evaluate and compare the results comprehensively.
Moreover, it is essential to note that our correlations considered regional averages at the state level and within homogeneous rainfall zones. Consequently, these correlations tend to yield lower values, owing to the disparities in precipitation seasonality across different zones [16]. The distinct spectral responses of vegetation indices further contribute to these differences, stemming from variations in the seasonally dry forest biome and the coastal area.
Furthermore, our study’s limitations extend to the products utilized; we employed data with a spatial resolution of 500 m, affecting the assessment of parameters and their correlation with precipitation. Hence, exploring alternative products with higher spatial resolution becomes imperative to gain a more nuanced understanding of the effects of precipitation at a regional level.
Future studies could also use climate modeling techniques to project the possible impacts of climate change under various scenarios. Such efforts would support further research and inform the development of vital public policies in this context.

4. Conclusions

This study analyzed the seasonality of biophysical parameters in the extreme years of precipitation, which were either considered very dry or very wet, and the relationship with the monthly precipitation of the state of Pernambuco in different homogeneous precipitation zones. Our findings unveiled distinct responses in biophysical parameters, emphasizing the profound impact of precipitation dynamics on vegetation and surface conditions.
Significant variations were observed from September to December, which aligns with the region’s lowest precipitation indices. In 2004, which was characterized by ample precipitation during a wet year, higher values in vegetation indices (NDVI, EVI and SAVI) and the water index (NDWI) were noted, highlighting the role of precipitation in driving vegetation dynamics. Conversely, during the dry year of 2012, there was an average reduction of 14% in vegetation indices and a 60% decrease in NDWI, alongside a 4% increase in albedo and a 3% rise in surface temperature (ST). This trend highlighted the heightened sensitivity of biophysical parameters during drought periods, providing crucial insights into drought conditions.
Our study also identified specific nuances in albedo behavior, indicating cloud contamination during the initial months, especially in wet years. This observation, which is consistent with prior research, underscores the need to consider seasonal variations when interpreting albedo values. Furthermore, our analysis emphasized the significance of NDWI and ST as essential parameters for monitoring water conditions, particularly during drought events. Correlation analyses affirmed the suitability of NDWI and ST, particularly in the driest year, showcasing their robust performance in capturing hydrological dynamics.
Additionally, our research highlighted the importance of accounting for spatial variability within Pernambuco. Zone 1 (Semiarid) exhibited heightened vulnerability, marked by lower vegetation indices and higher temperatures, especially in the last quarter of the year, coinciding with minimal precipitation. In contrast, coastal Zones 2 and 3 displayed more uniform ecosystem conditions due to higher and evenly distributed precipitation throughout the year, evident from consistent albedo values.
Our study elucidates the intricate relationship between precipitation patterns and biophysical parameters, offering valuable insights for regional water resource management and environmental resilience. We advocate for incorporating NDWI and ST in drought monitoring initiatives, considering the distinct responses observed in different zones. This research significantly contributes to the scientific understanding of ecological dynamics under extreme precipitation scenarios, informing targeted strategies for sustainable environmental stewardship in Pernambuco.

Author Contributions

Conceptualization, A.C.B., G.B.d.A.M., C.R.N., P.M.O.L., E.P.R. and J.D.G.; methodology, A.C.B., J.L.B.d.S., M.V.d.S. and G.B.d.A.M.; software, A.C.B., J.L.B.d.S. and M.V.d.S.; validation, A.C.B. and G.B.d.A.M.; formal analysis, A.C.B., D.A.d.O.S., H.F.E.d.O., M.M., J.F.d.O.-J. and A.C.d.S.A.; investigation, A.C.B., G.B.d.A.M., C.R.N., P.M.O.L., E.P.R. and J.D.G.; resources, A.C.B., J.L.B.d.S., M.V.d.S. and G.B.d.A.M.; data curation, A.C.B., J.L.B.d.S. and M.V.d.S.; writing—original draft preparation, A.C.B., J.L.B.d.S., M.V.d.S. and G.B.d.A.M.; writing—review and editing, A.C.B., D.A.d.O.S., J.L.B.d.S., M.V.d.S., C.R.N., G.B.d.A.M., P.M.O.L., E.P.R., J.D.G., H.F.E.d.O., M.M., J.F.d.O.-J. and A.C.d.S.A.; visualization, A.C.B., J.L.B.d.S., M.V.d.S., H.F.E.d.O., M.M., D.A.d.O.S., C.R.N., P.M.O.L., J.F.d.O.-J., A.C.d.S.A., E.P.R., J.D.G. and G.B.d.A.M.; supervision, G.B.d.A.M., P.M.O.L., E.P.R., J.D.G. and C.R.N.; project administration, A.C.B. and G.B.d.A.M.; funding acquisition, A.C.B. and G.B.d.A.M. All authors have read and agreed to the published version of the manuscript.

Funding

This research received no external funding.

Institutional Review Board Statement

Not applicable.

Informed Consent Statement

Not applicable.

Data Availability Statement

Data available in a publicly accessible repository that does not issue DOIs Publicly available datasets were analyzed in this study. This data can be found here: [Brazilian National Institute of Meteorology (INMET—Instituto Nacional de Meteorologia: <https://portal.inmet.gov.br/>); the Pernambuco Water and Climate Agency (APAC—Agência Pernambucana de Águas e Climas: <https://www.apac.pe.gov.br/>) and the National Agency for Water and Basic Sanitation of Brazil (ANA—Agência Nacional de Águas e Saneamento Básico: <https://www.gov.br/ana/pt-br>) accessed on 4 September 2020].

Acknowledgments

The authors thank the Rural Federal University of Pernambuco and the Post-Graduation Program in Agricultural Engineering for their invaluable support in facilitating this research endeavor. To the Goiano Federal Institute, Campus Ceres and the Federal University of Alagoas for their partnership in the research. Furthermore, the authors would like to express their sincere appreciation to the Brazilian National Institute of Meteorology (INMET—Instituto Nacional de Meteorologia), the Pernambuco Water and Climate Agency (APAC—Agência Pernambucana de Águas e Climas) and the National Agency for Water and Basic Sanitation of Brazil (ANA—Agência Nacional de Águas e Saneamento Básico) for generously providing the essential data that served as the foundation for this study. The National Aeronautics and Space Administration/Moderate Resolution Imaging Spectroradiometer for providing free MODIS Data Products.

Conflicts of Interest

The authors declare no conflict of interest.

References

  1. Marengo, J.A.; Cunha, A.P.M.A.; Nobre, C.A.; Ribeiro Neto, G.G.; Magalhaes, A.R.; Torres, R.R.; Sampaio, G.; Alexandre, F.; Alves, L.M.; Cuartas, L.A.; et al. Assessing Drought in the Drylands of Northeast Brazil under Regional Warming Exceeding 4 °C. Nat. Hazards 2020, 103, 2589–2611. [Google Scholar] [CrossRef]
  2. Costa, R.L.; Macedo de Mello Baptista, G.; Gomes, H.B.; Daniel dos Santos Silva, F.; Lins da Rocha Júnior, R.; de Araújo Salvador, M.; Herdies, D.L. Analysis of Climate Extremes Indices over Northeast Brazil from 1961 to 2014. Weather Clim. Extrem. 2020, 28, 100254. [Google Scholar] [CrossRef]
  3. Mariano, D.A.; dos Santos, C.A.C.; Wardlow, B.D.; Anderson, M.C.; Schiltmeyer, A.V.; Tadesse, T.; Svoboda, M.D. Use of Remote Sensing Indicators to Assess Effects of Drought and Human-Induced Land Degradation on Ecosystem Health in Northeastern Brazil. Remote Sens. Environ. 2018, 213, 129–143. [Google Scholar] [CrossRef]
  4. Cunha, A.P.M.A.; Tomasella, J.; Ribeiro-Neto, G.G.; Brown, M.; Garcia, S.R.; Brito, S.B.; Carvalho, M.A. Changes in the Spatial–Temporal Patterns of Droughts in the Brazilian Northeast. Atmos. Sci. Lett. 2018, 19, e855. [Google Scholar] [CrossRef]
  5. Oliveira, P.T.; Santos e Silva, C.M.; Lima, K.C. Climatology and Trend Analysis of Extreme Precipitation in Subregions of Northeast Brazil. Theor. Appl. Climatol. 2017, 130, 77–90. [Google Scholar] [CrossRef]
  6. Engle, N.L. The Role of Drought Preparedness in Building and Mobilizing Adaptive Capacity in States and Their Community Water Systems. Clim. Change 2013, 118, 291–306. [Google Scholar] [CrossRef]
  7. Hastenrath, S. Exploring the Climate Problems of Brazil’s Nordeste: A Review. Clim. Chang. 2012, 112, 243–251. [Google Scholar] [CrossRef]
  8. Marengo Orsini, J.A.; Alves, L.M.; Alvala, R.C.S.; Cunha, A.P.; Brito, S.; Moraes, O.L.L. Climatic Characteristics of the 2010–2016 Drought in the Semiarid Northeast Brazil Region. An. Acad. Bras. Cienc. 2017, 90, 1973–1985. [Google Scholar] [CrossRef]
  9. Neto, R.M.B.; Santos, C.A.G.; do Nascimento, T.V.M.; da Silva, R.M.; dos Santos, C.A.C. Evaluation of the TRMM Product for Monitoring Drought over Paraíba State, Northeastern Brazil: A Statistical Analysis. Remote Sens. 2020, 12, 2184. [Google Scholar] [CrossRef]
  10. Brito, S.S.B.; Cunha, A.P.M.A.; Cunningham, C.C.; Alvalá, R.C.; Marengo, J.A.; Carvalho, M.A. Frequency, Duration and Severity of Drought in the Semiarid Northeast Brazil Region. Int. J. Climatol. 2018, 38, 517–529. [Google Scholar] [CrossRef]
  11. Cunha, A.P.M.; Alvalá, R.C.; Nobre, C.A.; Carvalho, M.A. Monitoring Vegetative Drought Dynamics in the Brazilian Semiarid Region. Agric. For. Meteorol. 2015, 214–215, 494–505. [Google Scholar] [CrossRef]
  12. Gutiérrez, A.P.A.; Engle, N.L.; De Nys, E.; Molejón, C.; Martins, E.S. Drought Preparedness in Brazil. Weather Clim. Extrem. 2014, 3, 95–106. [Google Scholar] [CrossRef]
  13. Barbosa, H.A.; Lakshmi Kumar, T.V.; Paredes, F.; Elliott, S.; Ayuga, J.G. Assessment of Caatinga Response to Drought Using Meteosat-SEVIRI Normalized Difference Vegetation Index (2008–2016). ISPRS J. Photogramm. Remote Sens. 2019, 148, 235–252. [Google Scholar] [CrossRef]
  14. Cunha, A.P.M.A.; Zeri, M.; Leal, K.D.; Costa, L.; Cuartas, L.A.; Marengo, J.A.; Tomasella, J.; Vieira, R.M.; Barbosa, A.A.; Cunningham, C.; et al. Extreme Drought Events over Brazil from 2011 to 2019. Atmosphere 2019, 10, 642. [Google Scholar] [CrossRef]
  15. Da Rocha Júnior, R.L.; Dos Santos Silva, F.D.; Costa, R.L.; Gomes, H.B.; Pinto, D.D.C.; Herdies, D.L. Bivariate Assessment of Drought Return Periods and Frequency in Brazilian Northeast Using Joint Distribution by Copula Method. Geosciences 2020, 10, 135. [Google Scholar] [CrossRef]
  16. Bezerra, A.C.; da Silva, J.L.B.; da Silva, J.L.B.; Lopes, P.M.O.; Nascimento, C.R.; Ribeiro, E.P.; Galvíncio, J.D.; da Silva, M.V. Dynamics of Land Cover and Land Use in Pernambuco (Brazil): Spatio-Temporal Variability and Temporal Trends of Biophysical Parameters. Remote Sens. Appl. 2022, 25, 100677. [Google Scholar] [CrossRef]
  17. Refati, D.C.; da Silva, J.L.B.; Macedo, R.S.; Lima, R.D.C.C.; da Silva, M.V.; Pandorfi, H.; Silva, P.C.; de Oliveira-Júnior, J.F. Influence of Drought and Anthropogenic Pressures on Land Use and Land Cover Change in the Brazilian Semiarid Region. J. S. Am. Earth Sci. 2023, 126, 104362. [Google Scholar] [CrossRef]
  18. da Silva, J.L.B.; de Albuquerque Moura, G.B.; da Silva, M.V.; de Oliveira-Júnior, J.F.; da Rosa Ferraz, A.M.; Refati, D.C.; da Cunha Correia, L.R.; de Carvalho, A.A.; Ferreira, M.B.; de Brito, J.I.B.; et al. Environmental Degradation of Vegetation Cover and Water Bodies in the Semiarid Region of the Brazilian Northeast via Cloud Geoprocessing Techniques Applied to Orbital Data. J. S. Am. Earth Sci. 2023, 121, 104164. [Google Scholar] [CrossRef]
  19. Ayanlade, A.; Jeje, O.D.; Nwaezeigwe, J.O.; Orimoogunje, O.O.I.; Olokeogun, O.S. Rainfall Seasonality Effects on Vegetation Greenness in Different Ecological Zones. Environ. Chall. 2021, 4, 100144. [Google Scholar] [CrossRef]
  20. Houspanossian, J.; Giménez, R.; Jobbágy, E.; Nosetto, M. Surface Albedo Raise in the South American Chaco: Combined Effects of Deforestation and Agricultural Changes. Agric. For. Meteorol. 2017, 232, 118–127. [Google Scholar] [CrossRef]
  21. Liu, Q.; Liu, Q.; Meng, X.; Zhang, J.; Yao, F.; Zhang, H. The Impact of Seasonality and Response Period on Qualifying the Relationship between Ecosystem Productivity and Climatic Factors over the Eurasian Steppe. Remote Sens. 2021, 13, 3159. [Google Scholar] [CrossRef]
  22. IPCC Special Report: Global Warming of 1.5 °C; Summary for Policymakers; Intergovernmental Panel on Climate Change: Geneva, Switzerland, 2018; pp. 1–24. [CrossRef]
  23. da Silva, R.O.B.; Montenegro, S.M.G.L.; de Souza, W.M. Tendências de Mudanças Climáticas Na Precipitação Pluviométrica Nas Bacias Hidrográficas Do Estado de Pernambuco. Eng. Sanit. Ambient. 2017, 22, 579–589. [Google Scholar] [CrossRef]
  24. Nanzad, L.; Zhang, J.; Tuvdendorj, B.; Nabil, M.; Zhang, S.; Bai, Y. NDVI Anomaly for Drought Monitoring and Its Correlation with Climate Factors over Mongolia from 2000 to 2016. J. Arid Environ. 2019, 164, 69–77. [Google Scholar] [CrossRef]
  25. Zhang, J.; Okin, G.S.; Zhou, B. Assimilating Optical Satellite Remote Sensing Images and Field Data to Predict Surface Indicators in the Western U.S.: Assessing Error in Satellite Predictions Based on Large Geographical Datasets with the Use of Machine Learning. Remote Sens. Environ. 2019, 233, 111382. [Google Scholar] [CrossRef]
  26. Costa, G.B.; Mendes, K.R.; Viana, L.B.; Almeida, G.V.; Mutti, P.R.; e Silva, C.M.S.; Bezerra, B.G.; Marques, T.V.; Ferreira, R.R.; Oliveira, C.P.; et al. Seasonal Ecosystem Productivity in a Seasonally Dry Tropical Forest (Caatinga) Using Flux Tower Measurements and Remote Sensing Data. Remote Sens. 2022, 14, 3955. [Google Scholar] [CrossRef]
  27. Medeiros, R.; Andrade, J.; Ramos, D.; Moura, M.; Pérez-Marin, A.M.; dos Santos, C.A.C.; da Silva, B.B.; Cunha, J. Remote Sensing Phenology of the Brazilian Caatinga and Its Environmental Drivers. Remote Sens. 2022, 14, 2637. [Google Scholar] [CrossRef]
  28. Silva, P.F.; Lima, J.R.S.; Antonino, A.C.D.; Souza, R.; de Souza, E.S.; Silva, J.R.I.; Alves, E.M. Seasonal patterns of carbon dioxide, water and energy fluxes over the Caatinga and grassland in the semi-arid region of Brazil. J. Arid Environ. 2017, 147, 71–82. [Google Scholar] [CrossRef]
  29. Barbosa, H.A.; Lakshmi Kumar, T.V. Influence of Rainfall Variability on the Vegetation Dynamics over Northeastern Brazil. J. Arid Environ. 2016, 124, 377–387. [Google Scholar] [CrossRef]
  30. Rodrigues, J.O.; de Andrade, E.M.; Teixeira, A.D.S.; da Silva, B.B. Sazonalidade de Variáveis Biofísicas Em Regiões Semiáridas Pelo Emprego Do Sensoriamento Remoto. Eng. Agríc. 2009, 29, 452–465. [Google Scholar] [CrossRef]
  31. dos Santos, F.S.; Gomes, H.B.; de Barros, G.V.P.; Alves, L.E.R.; da Silva, D.F.; Costa, R.L.; dos Santos Silva, F.D.; de Oliveira Júnior, J.F. Análise Sazonal Dos Parâmetros Biofísicos Utilizando o Sensor MODIS Para o Estado de Alagoas. Rev. Bras. Meteorol. 2020, 35, 955–968. [Google Scholar] [CrossRef]
  32. Souza, L.F.; Braga, C.C.; Santos, E.G.; Ribeiro, R.E.; Ávila, P.R. Sazonalidade Da Vegetação Em Função Do Regime Pluviométrico No Estado Da Paraíba (Sazonality of the Vegetation as a Function of the Rainfall Regime in the Paraíba State). Rev. Bras. Geogr. Fís. 2014, 7, 905. [Google Scholar] [CrossRef]
  33. Gorelick, N.; Hancher, M.; Dixon, M.; Ilyushchenko, S.; Thau, D.; Moore, R. Google Earth Engine: Planetary-Scale Geospatial Analysis for Everyone. Remote Sens. Environ. 2017, 202, 18–27. [Google Scholar] [CrossRef]
  34. Bezerra, A.C.; da Costa, S.A.T.; da Silva, J.L.B.; Araújo, A.M.Q.; de Albuquerque Moura, G.B.; Lopes, P.M.O.; Nascimento, C.R. Annual Rainfall in Pernambuco, Brazil: Regionalities, Regimes, and Time Trends. Rev. Bras. Meteorol. 2021, 36, 403–414. [Google Scholar] [CrossRef]
  35. Base de Dados do Estado—BDE Composição Do Valor Adicionado Bruto, Por Atividade Econômica de Pernambuco. Available online: http://www.bde.pe.gov.br/visualizacao/Visualizacao_formato2.aspx?codFormatacao=1569&CodInformacao=1300&Cod=3 (accessed on 20 August 2023).
  36. Alvares, C.A.; Stape, J.L.; Sentelhas, P.C.; De Moraes Gonçalves, J.L.; Sparovek, G. Köppen’s Climate Classification Map for Brazil. Meteorol. Z. 2013, 22, 711–728. [Google Scholar] [CrossRef]
  37. Souza, A.G.S.S.; Ribeiro Neto, A.; de Souza, L.L. Soil Moisture-Based Index for Agricultural Drought Assessment: SMADI Application in Pernambuco State-Brazil. Remote Sens. Environ. 2021, 252, 112124. [Google Scholar] [CrossRef]
  38. Tasumi, M.; Allen, R.G.; Trezza, R. At-Surface Reflectance and Albedo from Satellite for Operational Calculation of Land Surface Energy Balance. J. Hydrol. Eng. 2008, 13, 51–63. [Google Scholar] [CrossRef]
  39. Rouse, J.W.; Haas, R.H.; Schell, J.A.; Deering, D.W. Monitoring Vegetation Systems in the Great Plains with ERTS. In Earth Resources Technology Satellite-1 Symposium; NASA: Washington, DC, USA, 1973; Volume 1, pp. 309–317. [Google Scholar]
  40. Justice, C.O.; Vermote, E.; Townshend, J.R.G.; Defries, R.; Roy, D.P.; Hall, D.K.; Salomonson, V.V.; Privette, J.L.; Riggs, G.; Strahler, A.; et al. The Moderate Resolution Imaging Spectroradiometer (MODIS): Land Remote Sensing for Global Change Research. IEEE Trans. Geosci. Remote Sens. 1998, 36, 1228–1249. [Google Scholar] [CrossRef]
  41. Huete, A.R. A Soil-Adjusted Vegetation Index (SAVI). Remote Sens. Environ. 1988, 25, 295–309. [Google Scholar] [CrossRef]
  42. Gao, B.C. NDWI—A Normalized Difference Water Index for Remote Sensing of Vegetation Liquid Water from Space. Remote Sens. Environ. 1996, 58, 257–266. [Google Scholar] [CrossRef]
  43. Nunes Santos, E.F.; De Souza, I.F.; de Siqueira Pinto, J.E.S.; Duarte Neto, P.J. Validade Da Estatística Na Compreensão Do Clima Para Diagnóstico e Previsão (Validity of Statistics in Understanding the Climate for Diagnosis and Forecasting). Rev. Bras. Geogr. Fís. 2017, 10, 1346. [Google Scholar] [CrossRef]
  44. Salvador, M.A.; de Brito, J.I.B. Trend of Annual Temperature and Frequency of Extreme Events in the MATOPIBA Region of Brazil. Theor. Appl. Climatol. 2018, 133, 253–261. [Google Scholar] [CrossRef]
  45. Amorim, A.C.B.; Lucio, P.S.; Silva, C.M.S.E.; Rodrigues, D.T.; de Brito Neto, F.A. Regionalização e Análise Da Tendência Da Precipitação Do Rio Grande Do Norte Associados a Padrões de TSM. Rev. Bras. Meteorol. 2020, 35, 269–280. [Google Scholar] [CrossRef]
  46. da Costa, S.A.T.; Bezerra, A.C.; Araujo, A.M.Q.; da Silva, M.F.; da Cruz Neto, J.F.; Alves, R.M.; de Souza, L.S.B. Dinâmica Espaço-Temporal Das Anomalias de Precipitação Em Uma Região Semiárida, Nordeste Do Brasil. Rev. Gest. Água Am. Lat. 2021, 18, 14. [Google Scholar] [CrossRef]
  47. Marengo, J.A.; Alves, L.M.; Beserra, E.A.; Lacerda, F.F. Recursos Hídricos Em Regiões Áridas e Semiáridas. In Recursos Hídricos em Regiões Áridas e Semiáridas; Medeiros, S.D.S., Gueyi, H.R., Galvão, C.O., Paz, V.P.S., Eds.; Instituto Nacional do Semiárido: Campina Grande, Brazil, 2011; pp. 383–422. [Google Scholar]
  48. Silva, E.R.A.C.; Galvincio, J.D.; Nascimento, K.R.P.; De Santana, S.H.C.; De Souza, W.M.; de Oliveira Costa, V.S. Análise da tendência temporal da precipitação pluviométrica interanual e intra-anual no semiárido pernambucano. Rev. Bras. Climatol. 2018, 22, 76–98. [Google Scholar] [CrossRef]
  49. Alves, T.L.; Azevedo, P.V.; Santos, C.; Santos, F.A.C. Comportamento sazonal do albedo e dos índices de vegetação na bacia hidrográfica do alto curso do rio paraíba (Albedo Seasonal Behavior and Vegetation Indices in the Upper Basin Paraíba River). Rev. Bras. Geogr. Fís. 2015, 7, 1015. [Google Scholar] [CrossRef]
  50. Bezerra, J.M.; Moura, G.B.D.A.; Silva, B.B.D.; Lopes, P.M.; Silva, Ê.F.D.F. Parâmetros Biofísicos Obtidos Por Sensoriamento Remoto Em Região Semiárida Do Estado Do Rio Grande Do Norte, Brasil. Rev. Bras. Eng. Agríc. Ambient. 2014, 18, 73–84. [Google Scholar] [CrossRef]
  51. Ribeiro, E.P.; Nóbrega, R.S.; de Oliveira Mota Filho, F.; Moreira, E.B.M. Parâmetros Biofísicos Na Detecção de Mudanças Ambientais Na Bacia Hidrográfica Do Rio Pajeú. Rev. Geogr. (UFPE) 2015, 32, 1–26. [Google Scholar]
  52. Albuquerque, E.D.; Andrade, S.D.P.; Morais, H.D.; Diniz, J.M.T.; Santos, C.D. Análise Do Comportamento Do NDVI e NDWI Sob Diferentes Intensidades Pluviométricas No Município de Sousa-PB. Rev. Estud. Geoambientais 2014. Available online: https://periodicos.ufpb.br/index.php/geo/article/view/17986 (accessed on 23 August 2023).
  53. Benzougagh, B.; Meshram, S.G.; El Fellah, B.; Mastere, M.; Dridri, A.; Sadkaoui, D.; Mimich, K.; Khedher, K.M. Combined Use of Sentinel-2 and Landsat-8 to Monitor Water Surface Area and Evaluated Drought Risk Severity Using Google Earth Engine. Earth Sci. Inform. 2022, 15, 929–940. [Google Scholar] [CrossRef]
  54. Dobri, R.V.; Sfîcă, L.; Amihăesei, V.A.; Apostol, L.; Țîmpu, S. Drought Extent and Severity on Arable Lands in Romania Derived from Normalized Difference Drought Index (2001–2020). Remote Sens. 2021, 13, 1478. [Google Scholar] [CrossRef]
  55. Wesson, C.; Britz, W. Using Remote Sensing to Assess Plant Health and Drought Response in Game Reserves and Adjacent Farmland Overtime in the Eastern Cape, South Africa. S. Afr. J. Geomat. 2021, 10, 223–237. [Google Scholar] [CrossRef]
  56. Marusig, D.; Petruzzellis, F.; Tomasella, M.; Napolitano, R.; Altobelli, A.; Nardini, A. Correlation of Field-Measured and Remotely Sensed Plant Water Status as a Tool to Monitor the Risk of Drought-Induced Forest Decline. Forests 2020, 11, 77. [Google Scholar] [CrossRef]
  57. Polidori, L. Sensoriamento Remoto de Alta Resolução Temporal Para Uma Observação Dinâmica Dos Ambientes Tropicais. Ciênc. Tróp. 2020, 44. [Google Scholar] [CrossRef]
  58. Vermote, E.; Roger, J.C.; Ray, J.P. MOD09A1 and MYD09A1 MODIS Surface Reflectance 8-Day L3 Global 500m SIN Grid V006. MODIS Surface Reflectance User’s Guide. NASA EOSDIS Land Processes DAAC (For Collection 6). Available online: https://lpdaac.usgs.gov/products/mod09a1v006/ (accessed on 23 August 2023).
  59. Antico, A. Independent Component Analysis of MODIS-NDVI Data in a Large South American Wetland. Remote Sens. Lett. 2011, 3, 383–392. [Google Scholar] [CrossRef]
  60. Zoffoli, M.L.; Kandus, P.; Madanes, N.; Calvo, D.H. Seasonal and Interannual Analysis of Wetlands in South America Using NOAA-AVHRR NDVI Time Series: The Case of the Parana Delta Region. Landsc. Ecol. 2008, 23, 833–848. [Google Scholar] [CrossRef]
Figure 1. The state of Pernambuco with climatic stations grouped in homogeneous precipitation zones.
Atmosphere 14 01712 g001
Figure 2. Precipitation in the year’s extremes, 2004—wet (blue), 2012—dry (red), and the historical average of 1987–2019 (Black Line): (a) Pernambuco; (b) Zone 1; (c) Zone 2; (d) Zone 3.
Atmosphere 14 01712 g002
Figure 3. Monthly average of biophysical parameters (Lines) and the average of the monthly accumulated precipitation (Columns) of Pernambuco for 2004 (Blue) and 2012 (Red): (a) Albedo; (b) EVI; (c) NDVI; (d) SAVI; (e) NDWI; (f) ST (°C).
Atmosphere 14 01712 g003
Figure 4. Average monthly albedo and precipitation in homogeneous zones in extreme years, 2004 (wet) and 2012 (dry): (a) zone 1; (b) zone 2; (c) zone 3.
Atmosphere 14 01712 g004
Figure 5. Average monthly measurements of vegetation and water indices compared to precipitation in homogeneous areas in the extreme years, 2004 (wet) and 2012 (dry): (a) EVI—zone 1; (b) EVI—zone 2; (c) EVI—zone 3; (d) NDVI—zone 1; (e) NDVI—zone 2; (f) NDVI—zone 3; (g) SAVI—zone 1; (h) SAVI—zone 2; (i) SAVI—zone 3; (j) NDWI—zone 1; (k) NDWI—zone 2; (l) NDWI—zone 3.
Atmosphere 14 01712 g005
Figure 6. Monthly average of surface temperature and precipitation in homogeneous groups in extreme years, 2004 (wet) and 2012 (dry): (a) zone 1; (b) zone 2; (c) zone 3.
Atmosphere 14 01712 g006
Figure 7. Seasonality of the surface albedo for Pernambuco in 2004 and 2012.
Atmosphere 14 01712 g007
Figure 8. NDVI seasonality for Pernambuco in 2004 and 2012.
Atmosphere 14 01712 g008
Figure 9. Seasonality of surface temperature (°C) for Pernambuco in 2004 and 2012.
Atmosphere 14 01712 g009
Table 1. Surface biophysical parameters calculated with MODIS sensor image products.
Biophysical ParametersInitialsEquationsAuthor
Surface albedoα α = 0.215 × RbR + 0.215 × RbIR + 0.242 × RbB + 0.129 × RbG + 0.101 × RbV + 0.062 × RbVI 0.036 × RbVII [38]
Normalized Difference Vegetation IndexNDVI NDVI = RbIR     RbR RbIR   +   RbR [39]
Enhanced Vegetation IndexEVI EVI = G   ×   RbIR     RbR RbIR   +   C 1   ×   RbR     C 2   ×   RbB   +   L 1 [40]
Soil-Adjusted Vegetation IndexSAVI SAVI = 1   +   L 2   ×   ( RbIR     RbR ) ( L 2   +   RbIR   +   RbR ) [41]
Normalized Difference Water IndexNDWI NDWI = RbIR     RbVII RbIR   +   RbVII [42]
Table 2. Correlation coefficients and method for the years 2004 and 2012 between biophysical parameters and precipitation.
Biophysical ParameterCorrelation20042012
Albedor0.27 ns0.16 ns
MethodKendallPearson
EVIr0.32 ns0.54 ns
MethodPearsonPearson
NDVIr0.12 ns0.43 ns
MethodPearsonPearson
SAVIr0.14 ns0.41 ns
MethodPearsonPearson
NDWIr0.48 ns0.69 *
MethodPearsonPearson
STR−0.28 ns−0.75 **
MethodPearsonPearson
Significance Codes: ** At the level of 1%; * At the level of 5%; ns: Not significant.
Table 3. Correlation coefficients and method for the years 2004 and 2012 between biophysical parameters and precipitation in homogeneous precipitation groups.
Biophysical ParameterStatistics20042012
Zone 1Zone 2Zone 3Zone 1Zone 2Zone 3
AlbedoR0.242 ns0.032 ns0.478 ns0.224 ns−0.062 ns0.061 ns
MethodKendallPearsonPearsonPearsonPearsonPearson
EVIR0.515 *0.569 ns0.236 ns0.675*0.511 ns0.245 ns
MethodKendallPearsonPearsonPearsonPearsonPearson
NDVIR0.412 ns0.355 ns−0.239 ns0.512 ns0.468 ns0.129 ns
MethodKendallPearsonPearsonPearsonPearsonPearson
SAVIR0.424 ns0.373 ns−0.255 ns0.515 ns0.461 ns0.084 ns
MethodKendallPearsonPearsonPearsonPearsonPearson
NDWIR0.636 **0.699 *0.710 **0.829 **0.688 *0.842 **
MethodKendallPearsonPearsonPearsonPearsonPearson
STR−0.424 ns−0.701 *−0.662 *−0.567 ns−0.708 **−0.705 *
MethodKendallPearsonPearsonPearsonPearsonPearson
Significance Codes: ** At the level of 1%; * At the level of 5%; ns: Not significant.
Disclaimer/Publisher’s Note: The statements, opinions and data contained in all publications are solely those of the individual author(s) and contributor(s) and not of MDPI and/or the editor(s). MDPI and/or the editor(s) disclaim responsibility for any injury to people or property resulting from any ideas, methods, instructions or products referred to in the content.

