Article

Analysis of Diurnal Sea Surface Temperature Variability in the Tropical Indian Ocean

Key Laboratory of Marine Hazards Forecasting, National Marine Environmental Forecasting Center, Ministry of Natural Resources, Beijing 100081, China
*
Author to whom correspondence should be addressed.
Atmosphere 2023, 14(12), 1754; https://doi.org/10.3390/atmos14121754
Submission received: 31 October 2023 / Revised: 22 November 2023 / Accepted: 23 November 2023 / Published: 29 November 2023
(This article belongs to the Section Biosphere/Hydrosphere/Land–Atmosphere Interactions)

Abstract

:
Based on the 30-year global hourly sea surface temperature (SST) dataset (MLSST) produced by the National Marine Environmental Forecasting Center, Ministry of Natural Resources of China, we analyzed the variability of diurnal sea surface temperature amplitude (DSST) of the tropical Indian Ocean at multiple time scales, as well as its influencing factors. The results show that the DSST in the Arabian Sea, Bay of Bengal, and equatorial Indian Ocean exhibits a bimodal seasonal variation with a semi-annual cycle, while the DSST in the southern Indian Ocean shows an annual cycle. The seasonal variation of DSST is mainly influenced by factors such as sea surface wind speed, shortwave solar radiation, and precipitation. The DSST in the equatorial Indian Ocean is generally higher during El Niño years compared to La Niña years. At the intraseasonal scale, the large standard deviation of DSST in boreal winter is mainly distributed in the southern hemisphere, while the large standard deviation of DSST in boreal summer shifts northward. The intraseasonal variation amplitude of DSST in boreal winter of the tropical Indian Ocean is greater than that in boreal summer. The DSST in the tropical Indian Ocean exhibits significant variation characteristics at multi-time scales. This study provides reference for numerical simulation of air-sea interaction patterns in the tropical Indian Ocean, as well as improvement of short-term climate prediction.

1. Introduction

Recently, the importance of variability of diurnal sea surface temperature amplitude (DSST) has gained widespread attention among researchers [1,2]. Studies have shown that in tropical regions with abundant sunshine and low wind speeds, DSST can reach up to 3 °C [3,4,5,6] and, in special cases, it can exceed 6 °C [7]. DSST is the main cause of diurnal variability in air-sea surface fluxes [8]. DSST affects the propagation characteristics of the Madden-Julian Oscillation (MJO). Numerical models that include the process influencing the DSST can effectively improve the modeling capability of MJO and El Niño-Southern Oscillation (ENSO) [9,10]. Additionally, DSST also has a significant impact on carbon dioxide fluxes in the central Atlantic [11].
Research on DSST is based on in-situ observations e.g., [12,13], satellite remote sensing e.g., [14,15], and numerical simulations e.g., [16,17,18]. Kennedy et al. [19] created a global dataset of hourly SST, spanning 15 years from 1990 to 2004, using in-situ drifting buoy data. They analyzed the climatological characteristics of global DSST using this dataset. However, high spatiotemporal resolution in-situ observations of SST are limited. With the development and application of satellite remote sensing technology, the spatial coverage of satellite-observed SST has significantly improved. Stuart-menteth et al. [14], for the first time, used 6 years of Advanced Very High Resolution Radiometer (AVHRR) satellite data to study the characteristics of DSST. Tu et al. [20] analyzed the DSST in the China seas and northwest Pacific Oceans using 4 years of Multi-functional Transport Satellite (MTSAT) satellite remote sensing data. Marullo et al. [15] created a 2-year dataset of SST using geostationary satellite data, and analyzed the DSST in the tropical Atlantic. However, satellite remote sensing mainly measures the sea surface skin temperature, which is the temperature closest to the air-sea interface; the diurnal amplitude of the sea surface skin temperature is typically higher compared to the in-situ observed SST [2,21]. In addition to in-situ observations and satellite remote sensing studies of DSST, long-term, high-coverage, and high-frequency SST reanalysis/analysis data can be utilized to study the characteristics and mechanisms of DSST, thereby partially addressing the aforementioned issues.
The study area chosen in this article is the tropical Indian Ocean. The Indian Ocean is one of the regions with the strongest monsoon activity in the world. The SST in the Indian Ocean not only has a significant impact on the climate of neighboring countries like India [22], but also exhibits a notable correlation with precipitation in China and the Western Pacific Subtropical High [23,24]. It plays an essential role in the global and regional climate [25,26,27]. Unlike the Atlantic and Pacific Oceans, the northern part of the Indian Ocean is surrounded by the Asian continent, preventing heat from being transported northward, and the monsoon leads to seasonal variations in ocean currents [28,29]. Therefore, while the seasonal variations of DSST in the tropical Atlantic and Pacific are mainly influenced by shortwave radiation from the sun, the characteristics of DSST in the tropical Indian Ocean are more unique, with the monsoon being an important influencing factor [2,30]. Currently, domestic and foreign scholars have mainly conducted research on the characteristics and influencing factors of DSST in small areas of the Indian Ocean and over short time spans. Guo et al. [31] analyzed the seasonal variations of DSST in the Bay of Bengal using 9-year reanalysis data. Yang et al. [30] studied the seasonal variations and mechanisms of DSST in the tropical eastern Indian Ocean using buoy data and a one-dimensional ocean mixed layer model. Shenoi et al. [21] analyzed the DSST in the northern Indian Ocean using buoy data and an empirical model.
Based on the significance of DSST in the tropical Indian Ocean [1,2], and the relatively limited research on the comprehensive long-term scale of DSST in the tropical Indian Ocean, this article used the 30-year global hourly SST dataset produced by the National Marine Environmental Forecasting Center, Ministry of Natural Resources of China (NMEFC) [32] to analyze the multi-timescale characteristics of DSST in the tropical Indian Ocean, and explore its influencing factors. This aims to improve our understanding of DSST in the tropical Indian Ocean, and provide reference for numerical modeling of air-sea interaction, as well as short-term climate forecasting in the tropical Indian Ocean region.

2. Data and Methods

2.1. Data

The 30-year global hourly SST dataset (MLSST) [32] used in this study was produced by the NMEFC. To achieve the MLSST, Ling et al. [33] developed a one-dimensional upper ocean mixed layer model, and extended the one-dimensional model to two-dimensional applications through a framework program [32]. The dataset has a temporal resolution of one hour, a horizontal resolution of 0.3° × 0.3°, and covers the time period from 1990 to 2019. A comparison of the dataset with buoy observation data from the National Data Buoy Center (NDBC) and the Tropical Atmosphere Ocean (TAO) shows that, at a global scale, the dataset has an average bias of 0.07 °C, a root mean square error of 0.37 °C, and a correlation coefficient of 0.98, indicating good consistency with the observed data [32]. This dataset is used to analyze the spatiotemporal characteristics of DSST in the tropical Indian Ocean.
RAMA (Research Moored Array for African-Asian-Australian Monsoon Analysis and Prediction) [34] is a research-moored buoy array deployed in the Indian Ocean as part of the global ocean observing system. This study utilized data from 16 SST buoys in the tropical Indian Ocean. The data has a temporal resolution of hourly and 10-min intervals, and the locations of the buoys can be found in Figure 1. The RAMA observational data was used to assess the reliability of the MLSST dataset.
ERA5 (The fifth generation ECMWF Reanalysis) [35] is a global atmospheric reanalysis dataset released by the European Centre for Medium-Range Weather Forecasting in 2016. Compared to previous reanalysis datasets, ERA5 has higher temporal and spatial resolution. In this study, solar shortwave radiation, 10-m wind speed, and precipitation data from ERA5 were used. The dataset has monthly and hourly temporal resolution, and covers the time period from 1990 to 2019. This data was utilized to analyze the main factors influencing the DSST.

2.2. The Calculation of DSST

According to the definition of DSST, it is the difference between the maximum and minimum temperatures of SST within a day [1,12]. This equation represents the diurnal amplitude of SST. The formula is DSST = SSTmax − SSTmin.

2.3. Trend Analysis Method

The Sen’s slope method [36] was used to calculate the trend in DSST, which can effectively reduce the impact of noise on data quality compared to linear regression. In addition, the non-parametric Mann-Kendall statistical test method [37] was used to test the significance of the annual variation trend

3. Validation of the MLSST

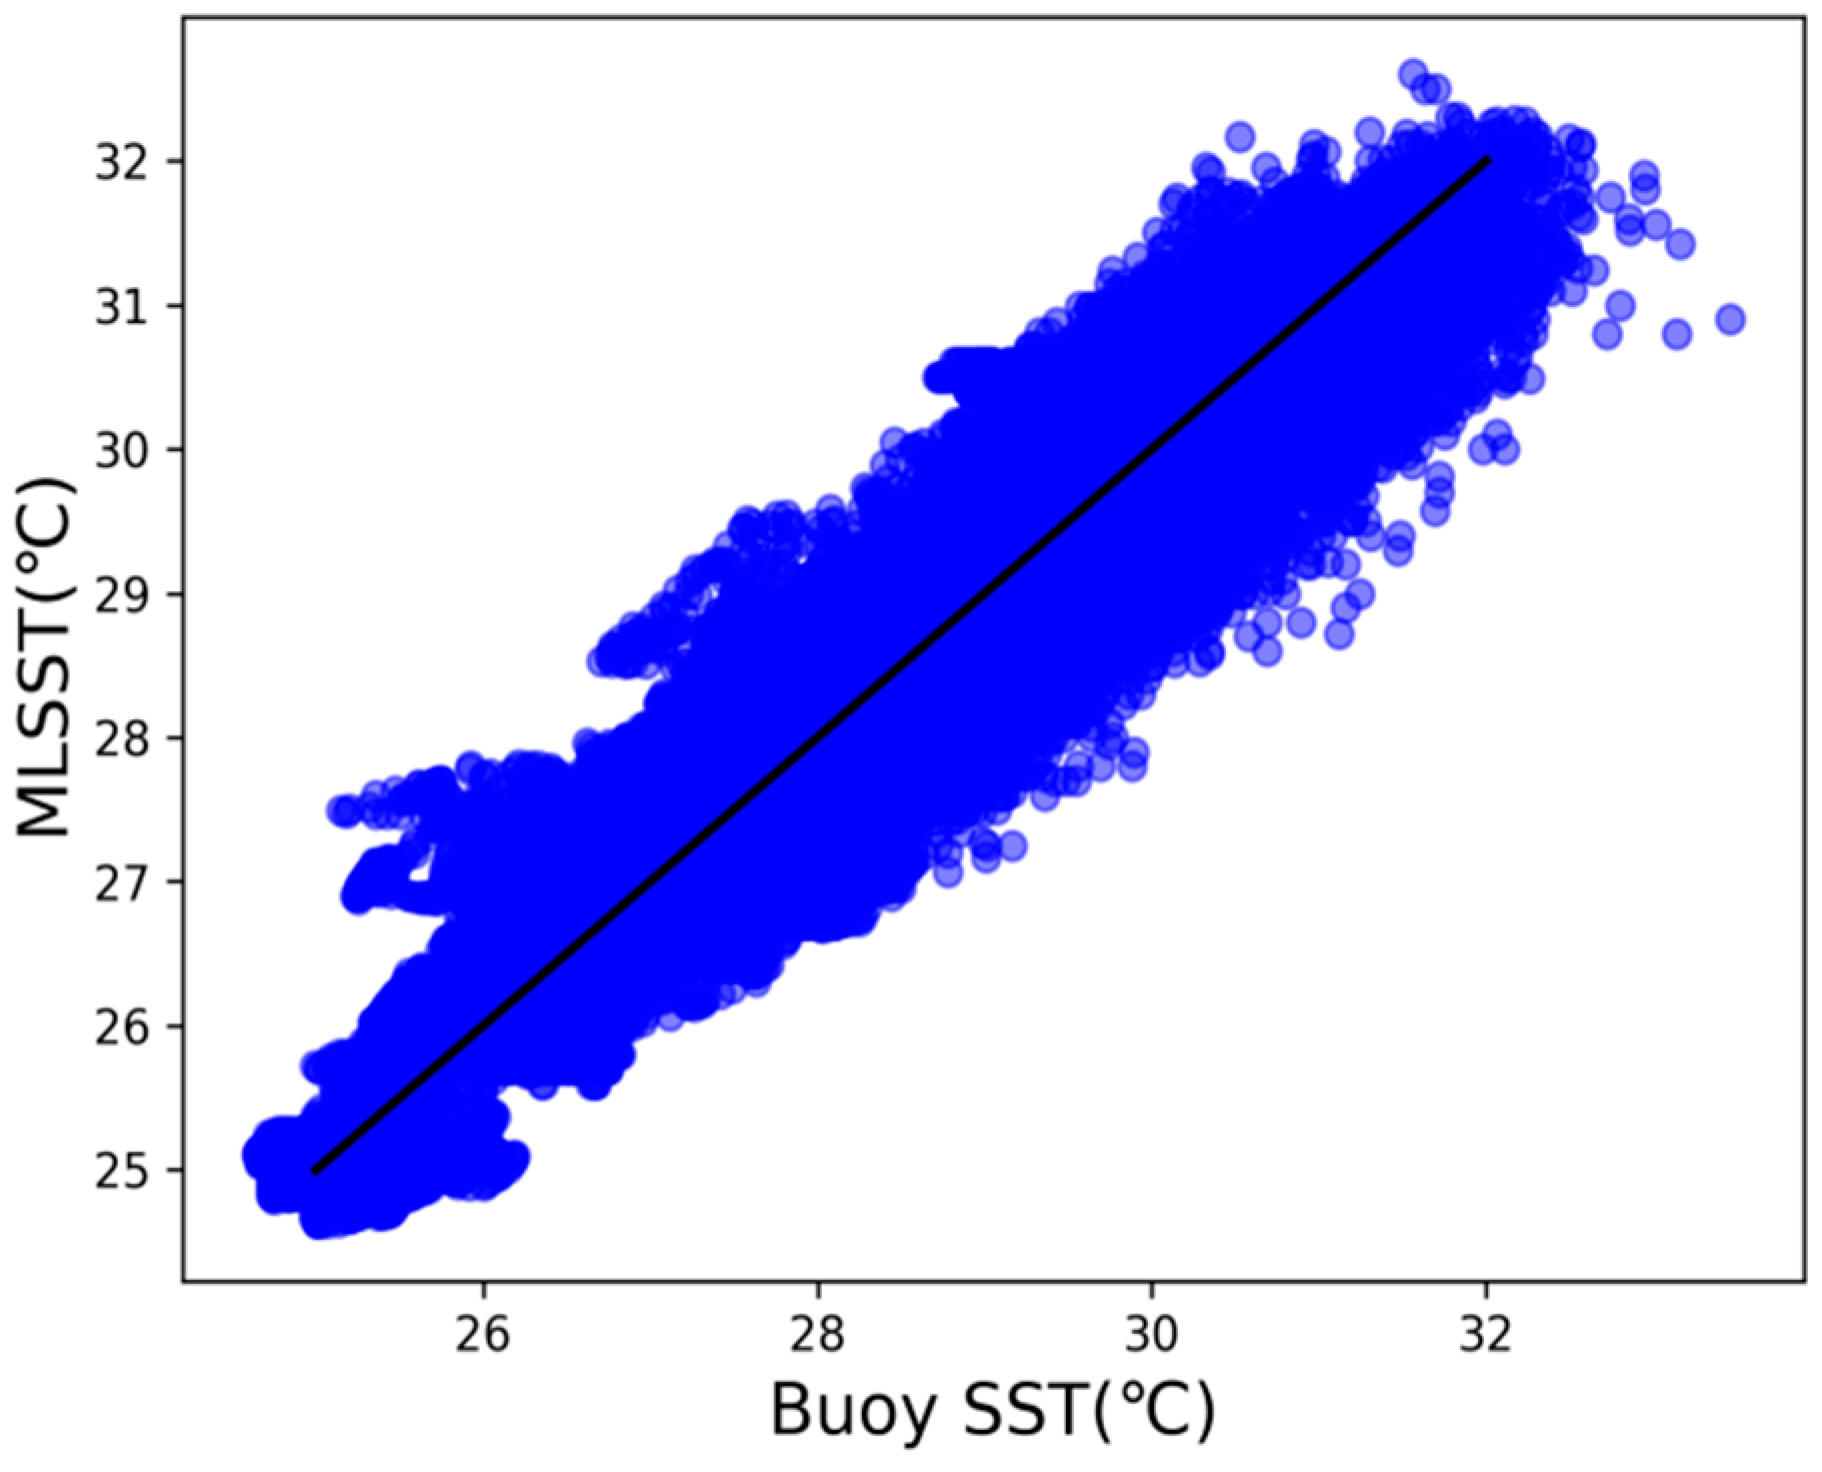
To conduct a study on the characteristics of DSST in the tropical Indian Ocean, High-frequency SST data from 16 RAMA buoys with relatively good continuity were selected in the tropical Indian Ocean to test the reliability of the MLSST in this region. A dataset was extracted that matched the time and location of the MLSST with the RAMA buoy data. The comparison was conducted for the period from 2008 to 2019, with a total hourly sample of 200280. Figure 2 shows a scatterplot between the hourly SST measured via the MLSST simulation and the RAMA buoys. The RMSE is 0.38 °C, the bias is −0.03 °C, and the correlation coefficient reaches 0.95. As shown in Figure 3, although the amplitude of monthly mean diurnal SST simulated by MLSST is greater than that observed, the seasonal variability is generally consistent.
Due to the limited number of RAMA buoys with long term continuous high-frequency SST data, four buoys (Table 1) with relatively good continuity located in the Arabian Sea, Bay of Bengal, equatorial Indian Ocean, and south Indian Ocean were selected to show the time series for the year of 2019. Figure 4 compares the DSST time series between the MLSST simulation and RAMA buoys for the year of 2019. Compared to buoy data, the DSST from the MLSST simulation is slightly overestimated, and some extreme values are not simulated very well. Overall, the MLSST is consistent with the buoy data.
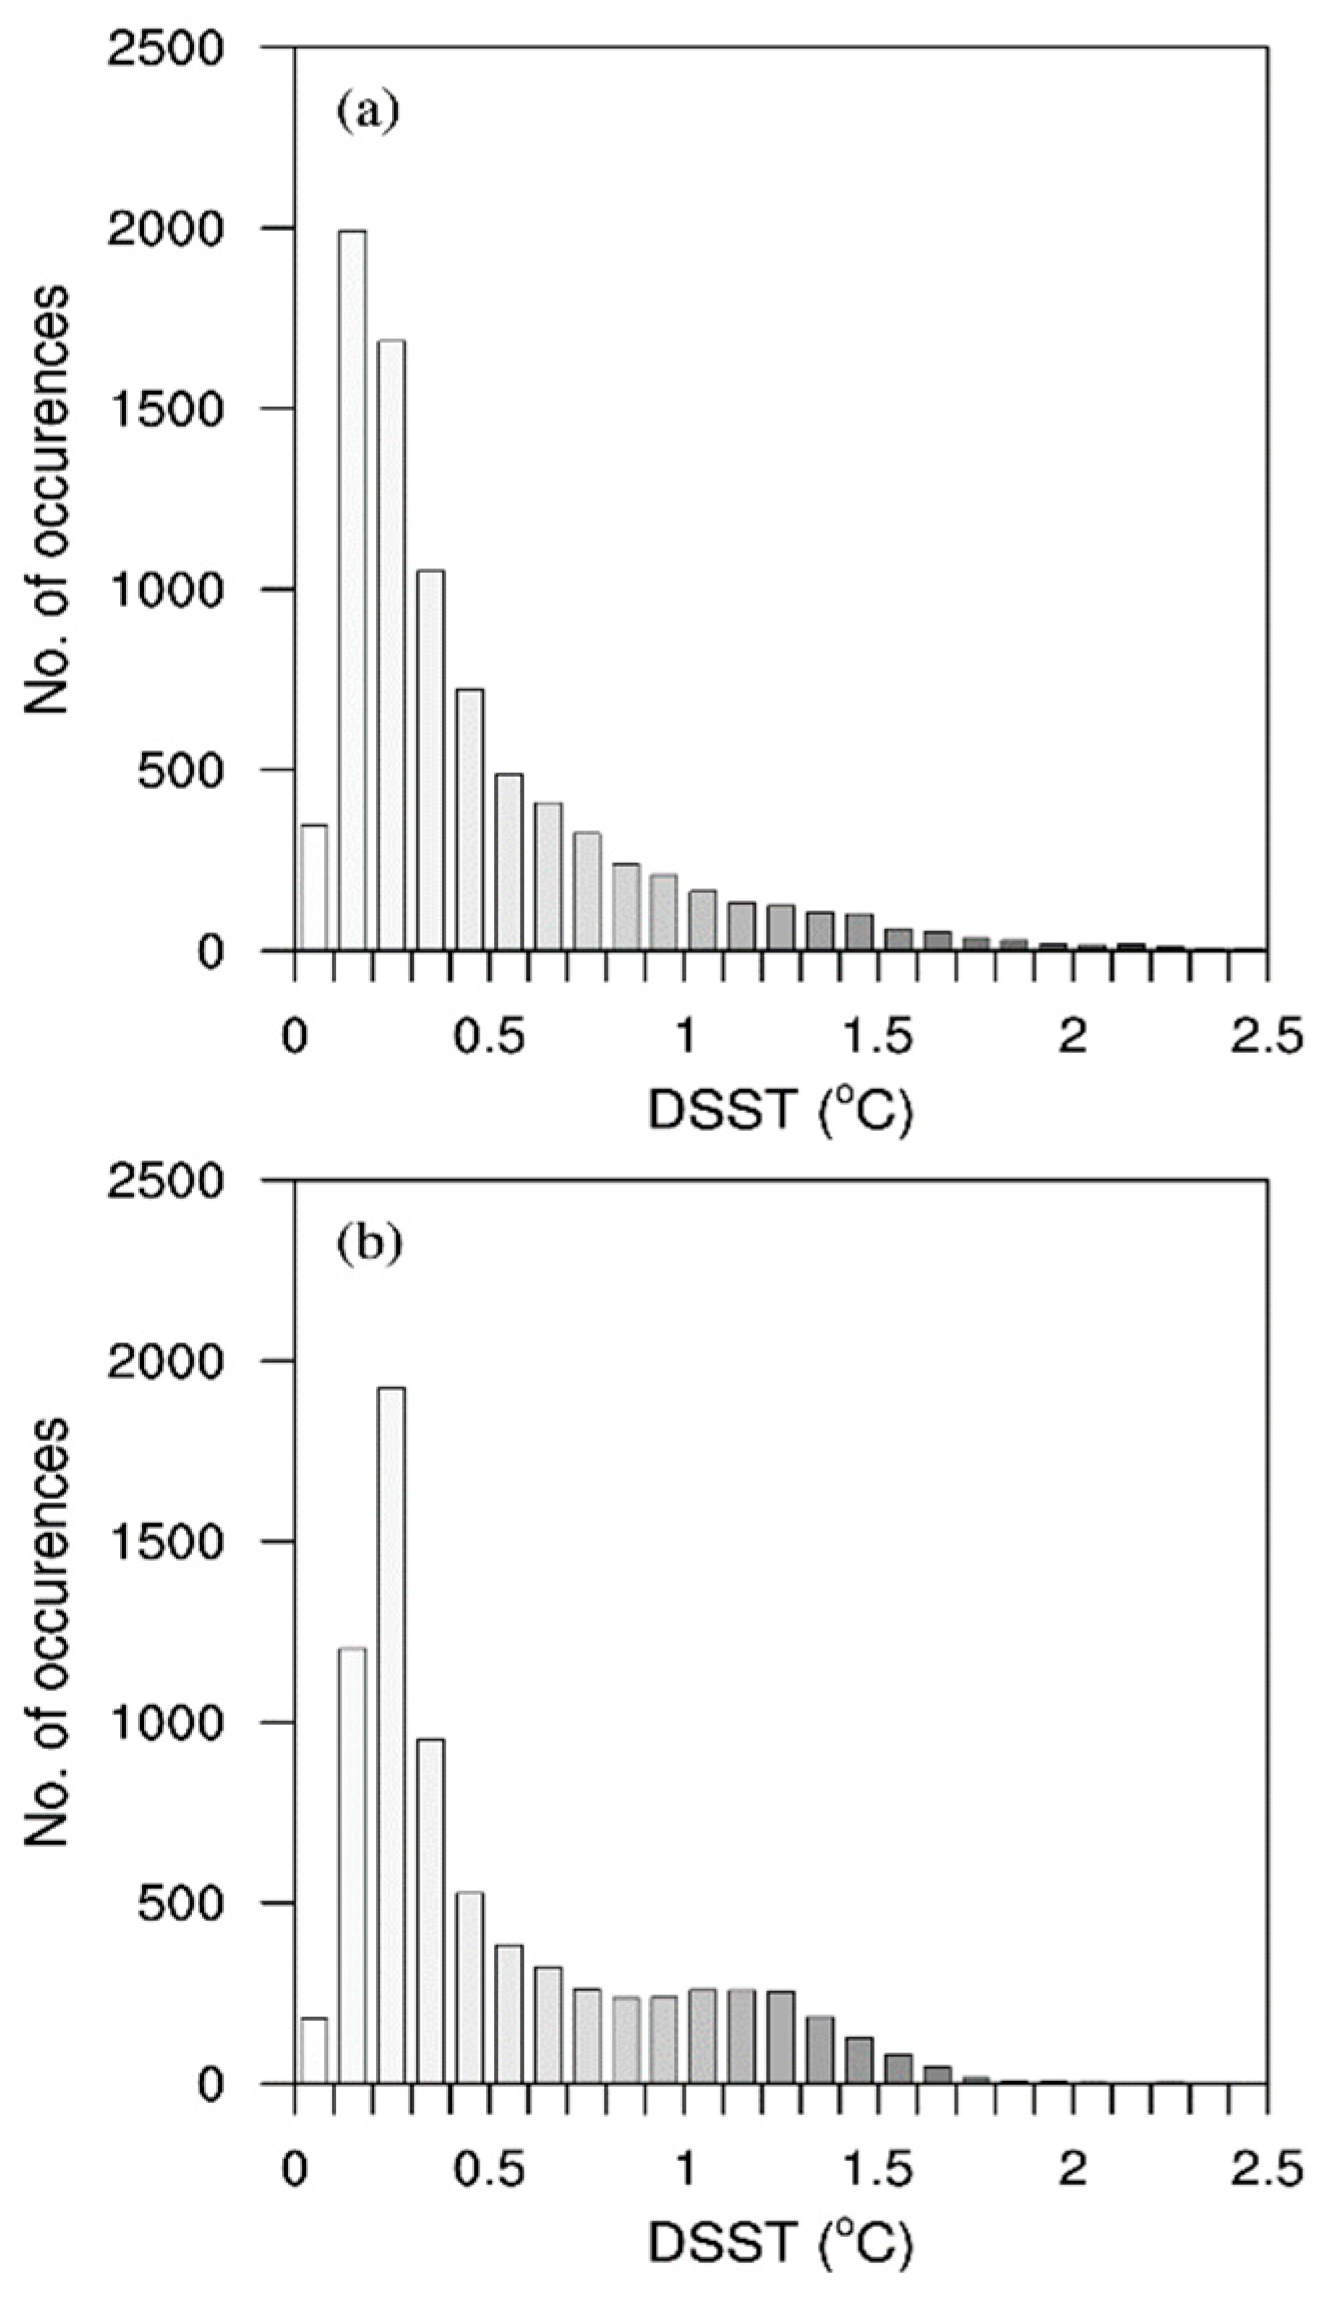
The 16 RAMA buoys provide 8345 DSST values comparison with the MLSST values. Table 2 shows the validation results of DSST for each year. All the DSST statistics resulting from the comparison between the MLSST and buoys show a RMSE of 0.27 °C, a bias of 0.07 °C, and the correlation coefficient of 0.78. Figure 5 shows the histogram of all the DSST provided by the 16 RAMA buoys. The DSST from the MLSST simulation and the RAMA buoys are both mainly distributed within a range of less than 1 °C, with very few values exceeding 2 °C. Both the MLSST and the RAMA buoy data have the similar mean values of DSST (around 0.5 °C and 0.44 °C), and the median DSST values are both around 0.31 °C. These results fit well with Clayson and Weitlich [2].
Due to the external forcing fields, and the model itself in the mixed-layer model [32], the DSST from the MLSST simulation was overestimated compared to the buoy data in the tropical Indian Ocean. This study focuses on analyzing the variability of DSST at multiple time scales, and the absolute amplitudes of diurnal sea surface temperature have some uncertainty.

4. Results

4.1. Climatology

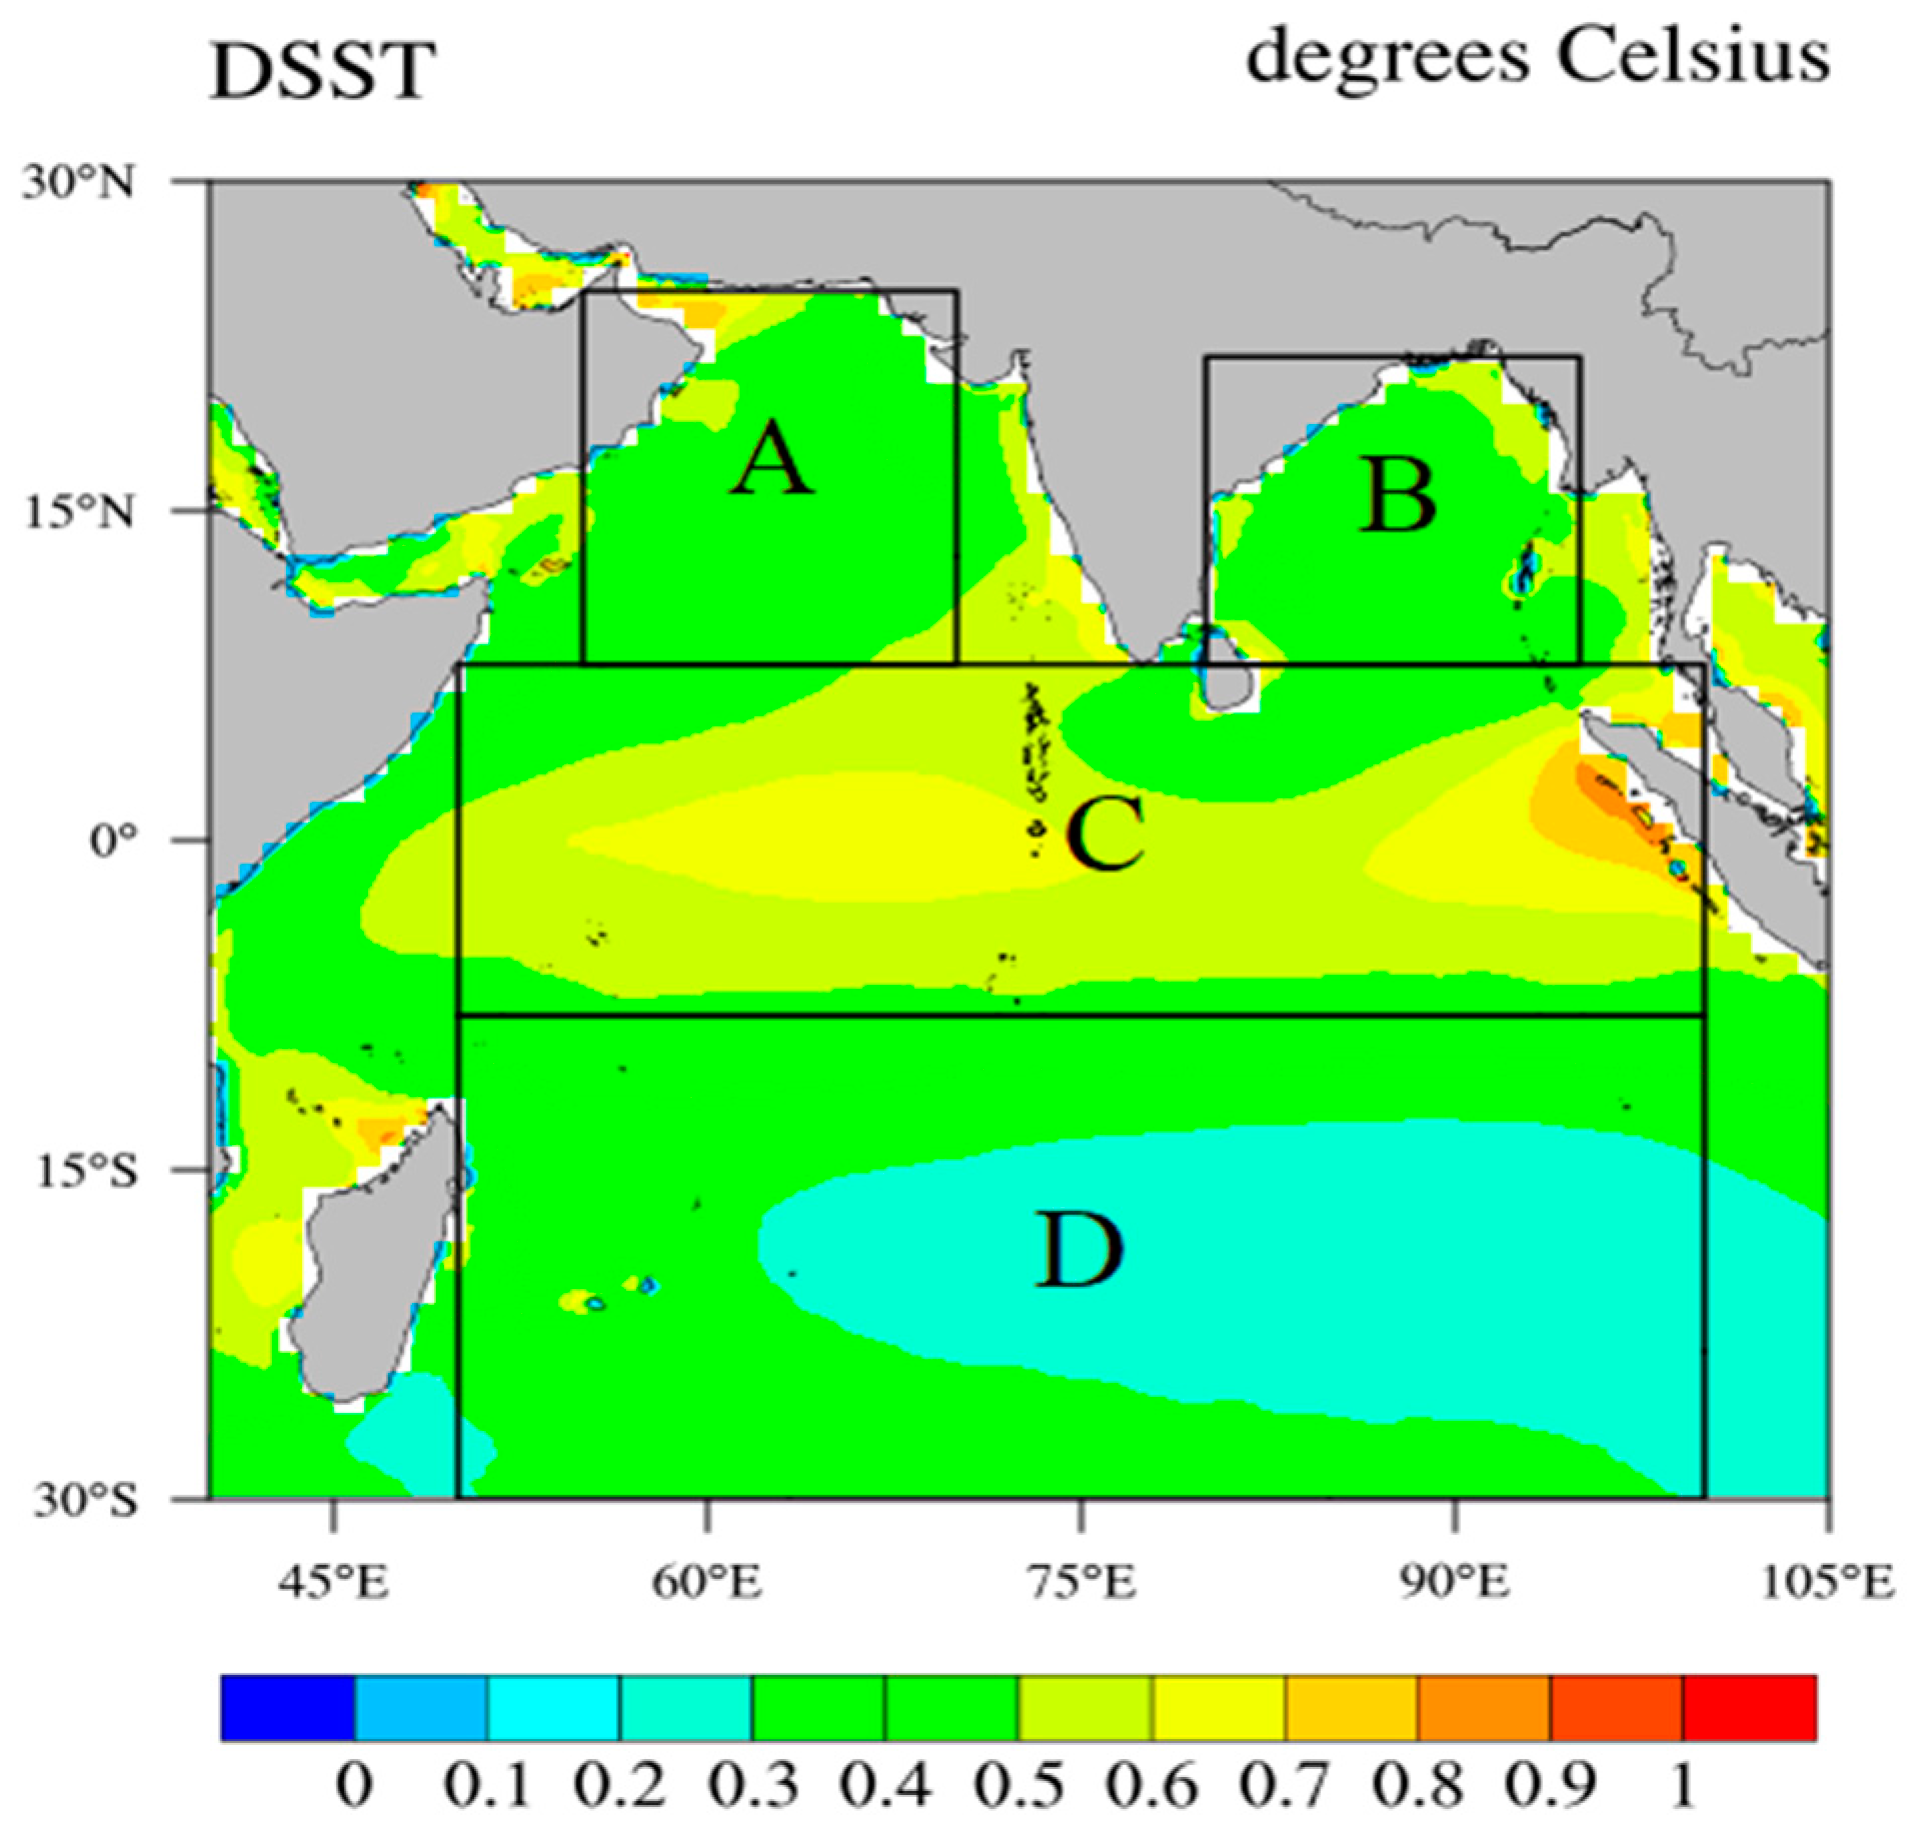
Figure 6 shows the climatological mean of DSST in the tropical Indian Ocean from 1990 to 2019. From Figure 6, the high values are mainly distributed in the equatorial Indian Ocean region with annual average ranging from 0.5 °C to 0.9 °C. The maximum value is found near the island of Sumatra. The DSST in the southern Indian Ocean is significantly lower than that of the northern Indian Ocean, and in some areas of the southeastern Indian Ocean, the average DSST is less than 0.3 °C. Based on the overall distribution of DSST in the tropical Indian Ocean, four regions were selected for comparative analysis: Region A: Arabian Sea (8° N–25° N; 55° E–70° E), Region B: Bay of Bengal (8° N–22° N; 80° E–95° E), Region C: equatorial Indian Ocean (8° S–8° N; 50° E–100° E), and Region D: southern Indian Ocean (30° S–8° S; 50° E–100° E).

4.2. Seasonal Variability

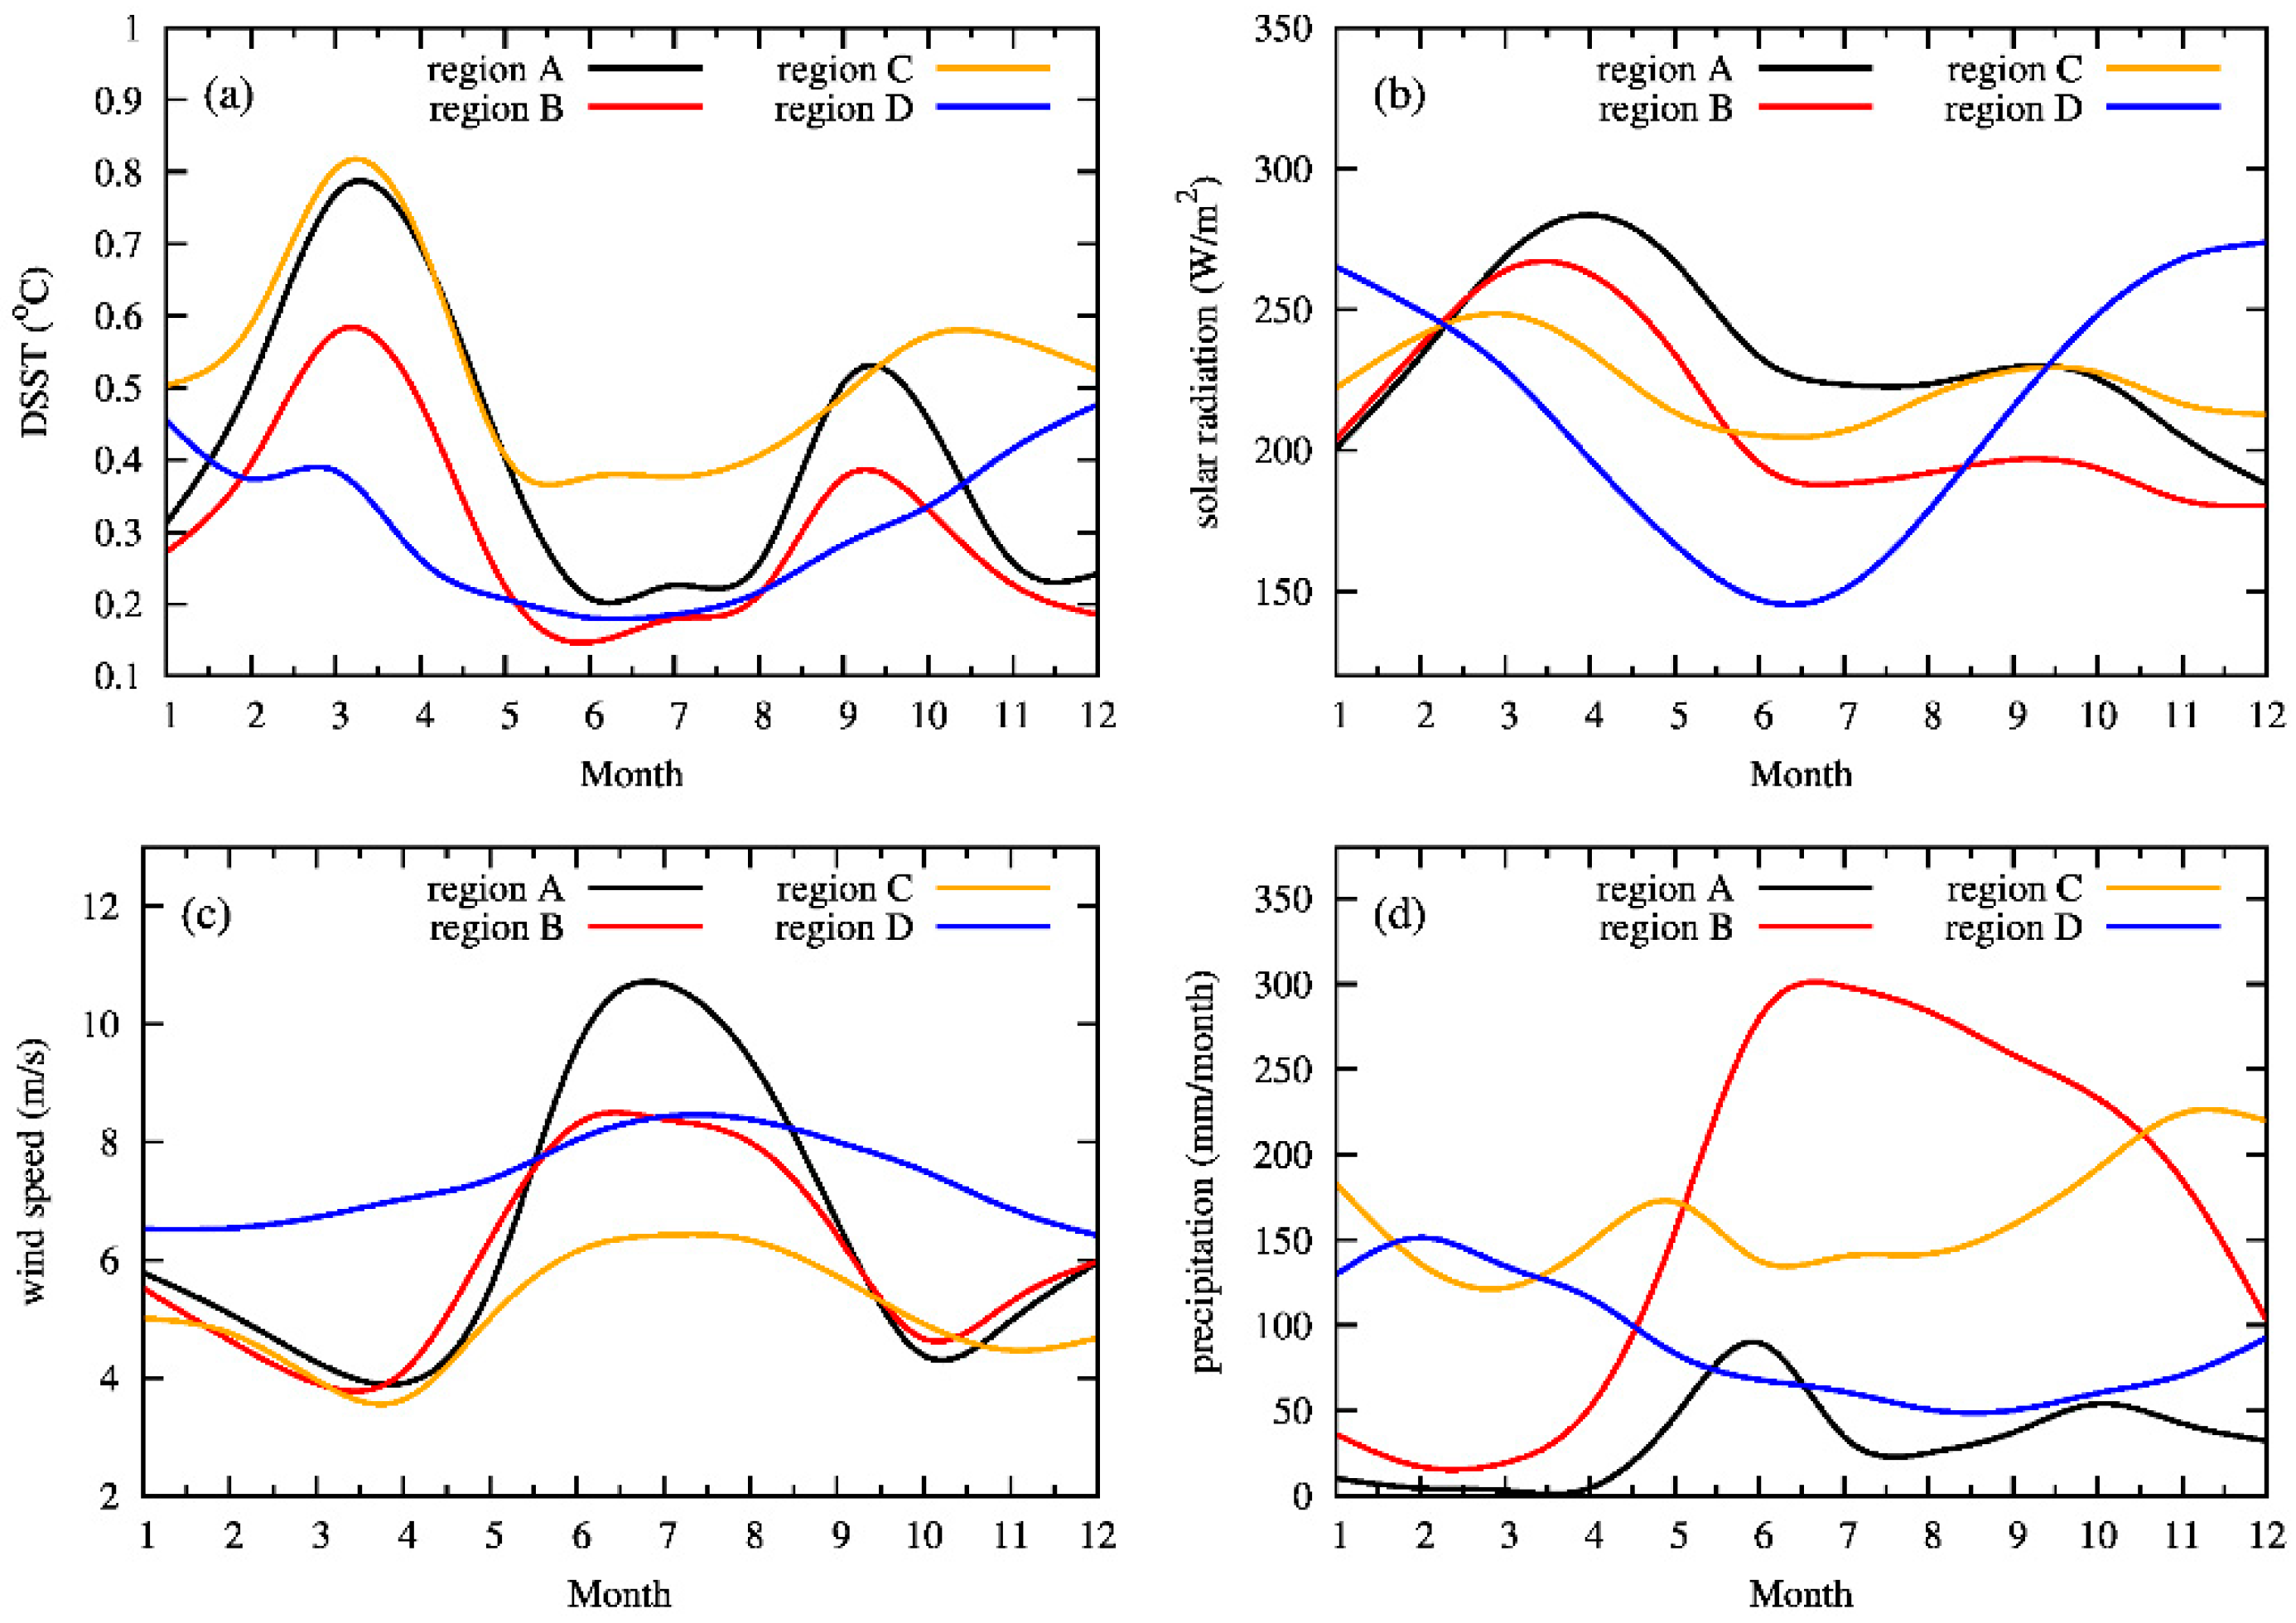
As shown in Figure 7a, DSST in the tropical Indian Ocean exhibits distinct seasonal variations. The Arabian Sea, Bay of Bengal, and equatorial Indian Ocean regions show a bimodal structure, with higher DSST value in spring, reaching the maximum in March, followed by autumn. Summer and winter have lower DSST value, resulting in a semi-annual cycle. This is consistent with previous research findings that indicate extreme DSST value generally occurring during the Indian Ocean monsoon transition period [38]. In the equatorial region, the seasonal difference in DSST is relatively small, with the maximum DSST occurring in March and an average amplitude of up to 0.8 °C. The secondary maximum occurs in October, which is later compared with that of the Arabian Sea and Bay of Bengal regions. However, the southern Indian Ocean region exhibits a completely different seasonal pattern, with maximum DSST during the southern hemisphere summer, and minimum DSST during the southern hemisphere winter, showing a significant annual cycle.
Previous studies indicate that the seasonal variation of DSST is influenced by factors such as solar radiation, wind speed, and precipitation [2,30,39,40,41]. Therefore, this study analyzed the seasonal variations of solar radiation, sea surface wind speed, and precipitation in the tropical Indian Ocean. As shown in Figure 7, the Arabian Sea, Bay of Bengal, and equatorial Indian Ocean regions also exhibit a bimodal structure in solar radiation. During the Indian Ocean summer monsoon, prevailing southwest wind occur, while during the winter, northeast wind dominates. In these three regions, sea surface wind speed increases during the monsoon period, causing strong vertical mixing in the surface ocean, and deepening of the mixed layer. Additionally, during the monsoon period, increased precipitation leads to higher water vapor and cloud cover, resulting in a reduction of shortwave solar radiation, gradually lowering the DSST. During the monsoon transition periods, solar radiation is higher with lower wind speed, leading to an increase in DSST. The reason for the larger DSST extreme value and delayed occurrence of the secondary maximum in the equatorial Indian Ocean region is weaker monsoons and corresponding lower sea surface wind speed in the equatorial region.
The SST in the southern Indian Ocean reaches its maximum value in December and its minimum value in June, which is in line with the seasonal variation of solar radiation in the southern hemisphere. And it is opposite to the seasonal variation of wind speed. Additionally, December experiences less precipitation in the southern hemisphere. Yang et al. [30] pointed out that the primary factor controlling the seasonal variation of DSST in the southern Indian Ocean is the sea surface wind stress, and the process of precipitation regulating shortwave solar radiation differs from that in the northern hemisphere

4.3. Interannual Variability and Long-Term Trend

ENSO events are important signals of interannual climate variability. To study the DSST in the equatorial Indian Ocean during ENSO periods, the Niño 3.4 index was used to represent ENSO events. According to the definition of National Weather Service Climate Prediction Center, El Niño (La Niña) events were defined as five consecutive months or more with a three-month sliding average of the Niño 3.4 index ≥ 0.5 °C (≤−0.5 °C). The years of El Niño and La Niña events were selected accordingly (Table 3). Figure 8 shows the diurnal cycle of SST anomalies in the equatorial Indian Ocean during El Niño and La Niña years. From the figure, it can be seen that the minimum and maximum SST anomalies within a day occur at similar times in El Niño and La Niña years, but there is a difference in the magnitude of the extremes, with DSST being slightly higher in El Niño years compared to La Niña years. This result passed the significance test at a 95% confidence level using the Student’s t-test. Chen et al. [40] used RAMA buoy data to analyze the impact of different ENSO phases on DSST in the equatorial eastern Indian Ocean, and also noted that DSST is slightly larger during El Niño years compared to La Niña years. Kawai et al. [42] pointed out that there are differences in DSST in the same region under different ENSO phases.
During El Niño events, convective activity over the Indian Ocean is suppressed, resulting in more shortwave solar radiation being received by the sea surface [43]. In El Niño years, when the subtropical southwest Indian Ocean is warmer, there is an anomalous easterly wind in the northern Indian Ocean. After the onset of the Indian monsoon, this easterly wind anomaly weakens the climatological wind field [44]. Additionally, the tropical Indian Ocean often warms gradually during El Niño events, and reaches its peak one quarter after the El Niño event [27]. These factors may contribute to the variations of DSST in the equatorial Indian Ocean during ENSO periods.
To understand the long-term variation in DSST in the tropical Indian Ocean, the annual DSST data from the Arabian Sea, Bay of Bengal, equatorial Indian Ocean, and southern Indian Ocean were analyzed. The trend analysis results showed an increasing trend of DSST in four regions of the tropical Indian Ocean from 1990 to 2019. Among them, the upward trend in the four regions from 2004 to 2019 was most significant, with all passing the 95% significance test. (Figure 9). The growth rates for DSST in the four regions from 2004 to 2019 were 0.005 °C·yr−1, 0.003 °C·yr−1, 0.008 °C·yr−1, and 0.005 °C·yr−1, respectively.
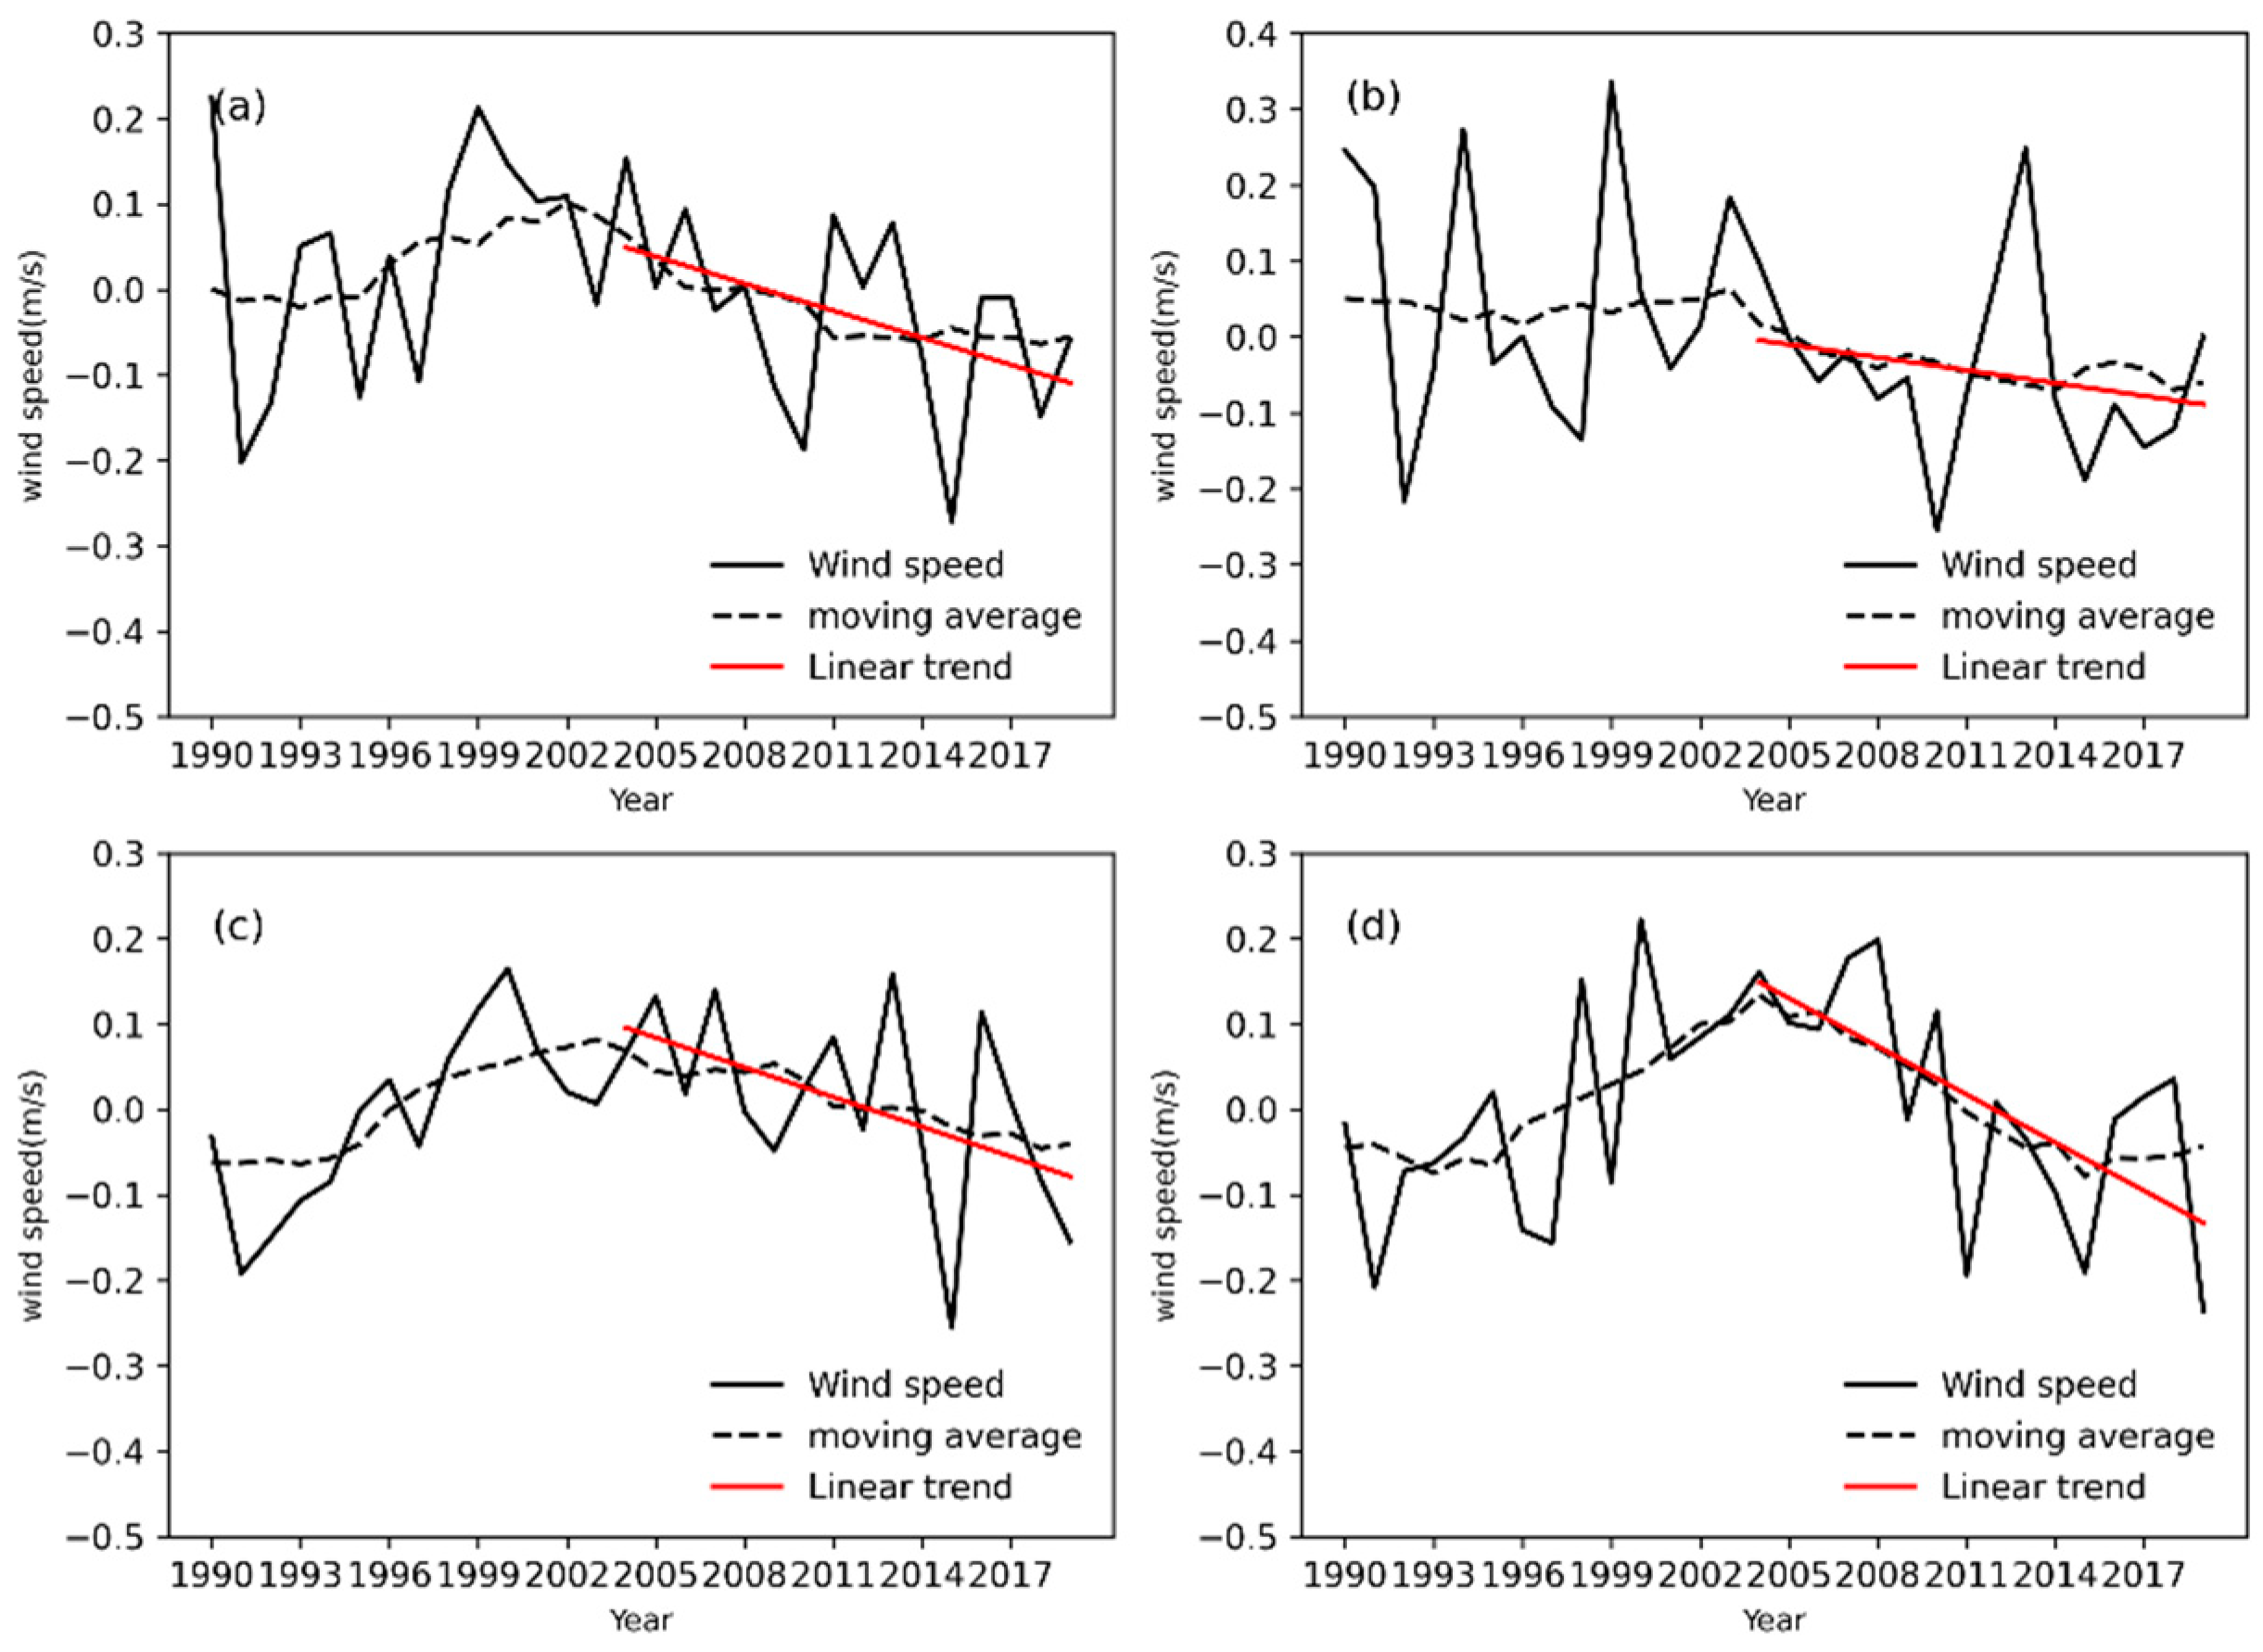
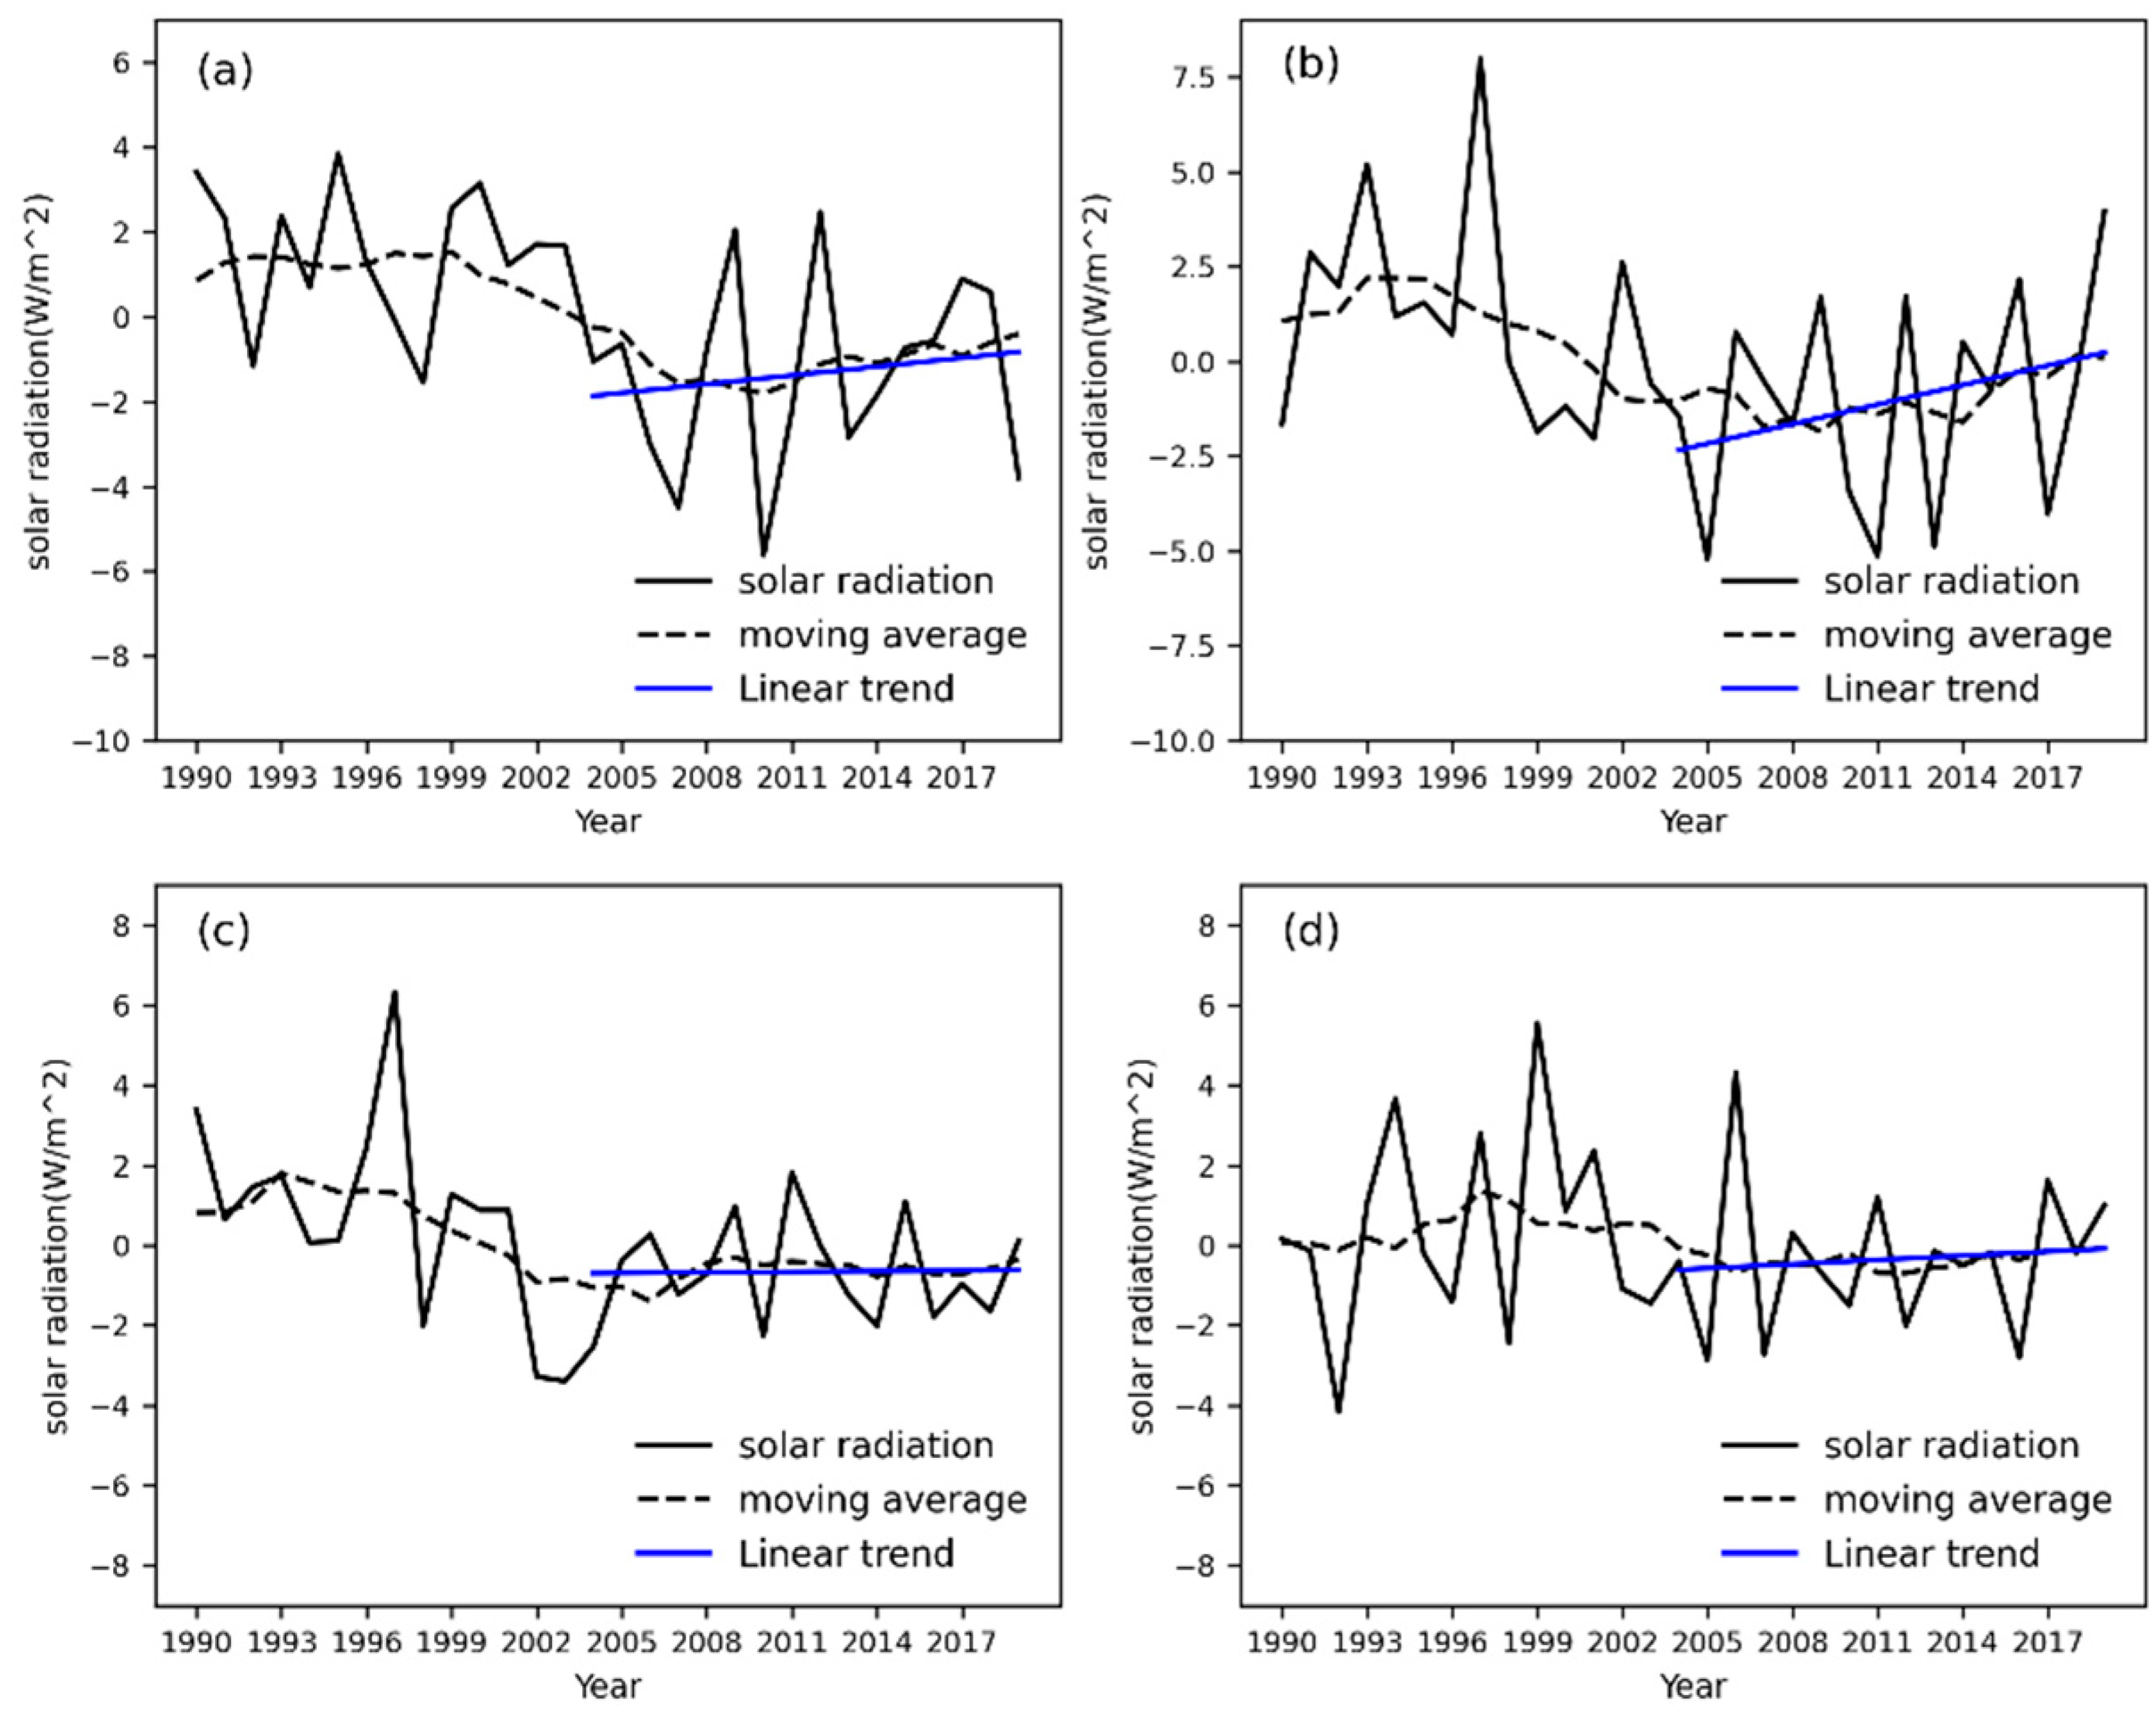
To explore the factors influencing the long-term variation in DSST, the long-term variation of sea surface wind speed, solar radiation, and precipitation in the tropical Indian Ocean were analyzed. Sea surface wind speed in the Arabian Sea, Bay of Bengal, equatorial Indian Ocean, and southern Indian Ocean showed a negative correlation with DSST from 1990 to 2019. The correlation coefficients between sea surface wind speed and DSST in the four regions from 2004 to 2019 were −0.55, −0.48, −0.56, and −0.87, passing the significance test at 95%. From Figure 10, it can be observed that the sea surface wind speed in the four regions showed a significant weakening trend from 2004 to 2019, passing the significance test at 95%. Figure 11 shows the trends in solar radiation in the tropical Indian Ocean, indicating a non-significant increasing trend from 2004 to 2019 in the four regions. Additionally, the trend of precipitation was not significant. These results suggest that the sea surface wind speed plays an important role in the annual trend in the DSST in the tropical Indian Ocean. More continuous observational data is required for further validation and research in order to investigate the long-term trend in DSST in the tropical Indian Ocean.

4.4. Intraseasonal Variability

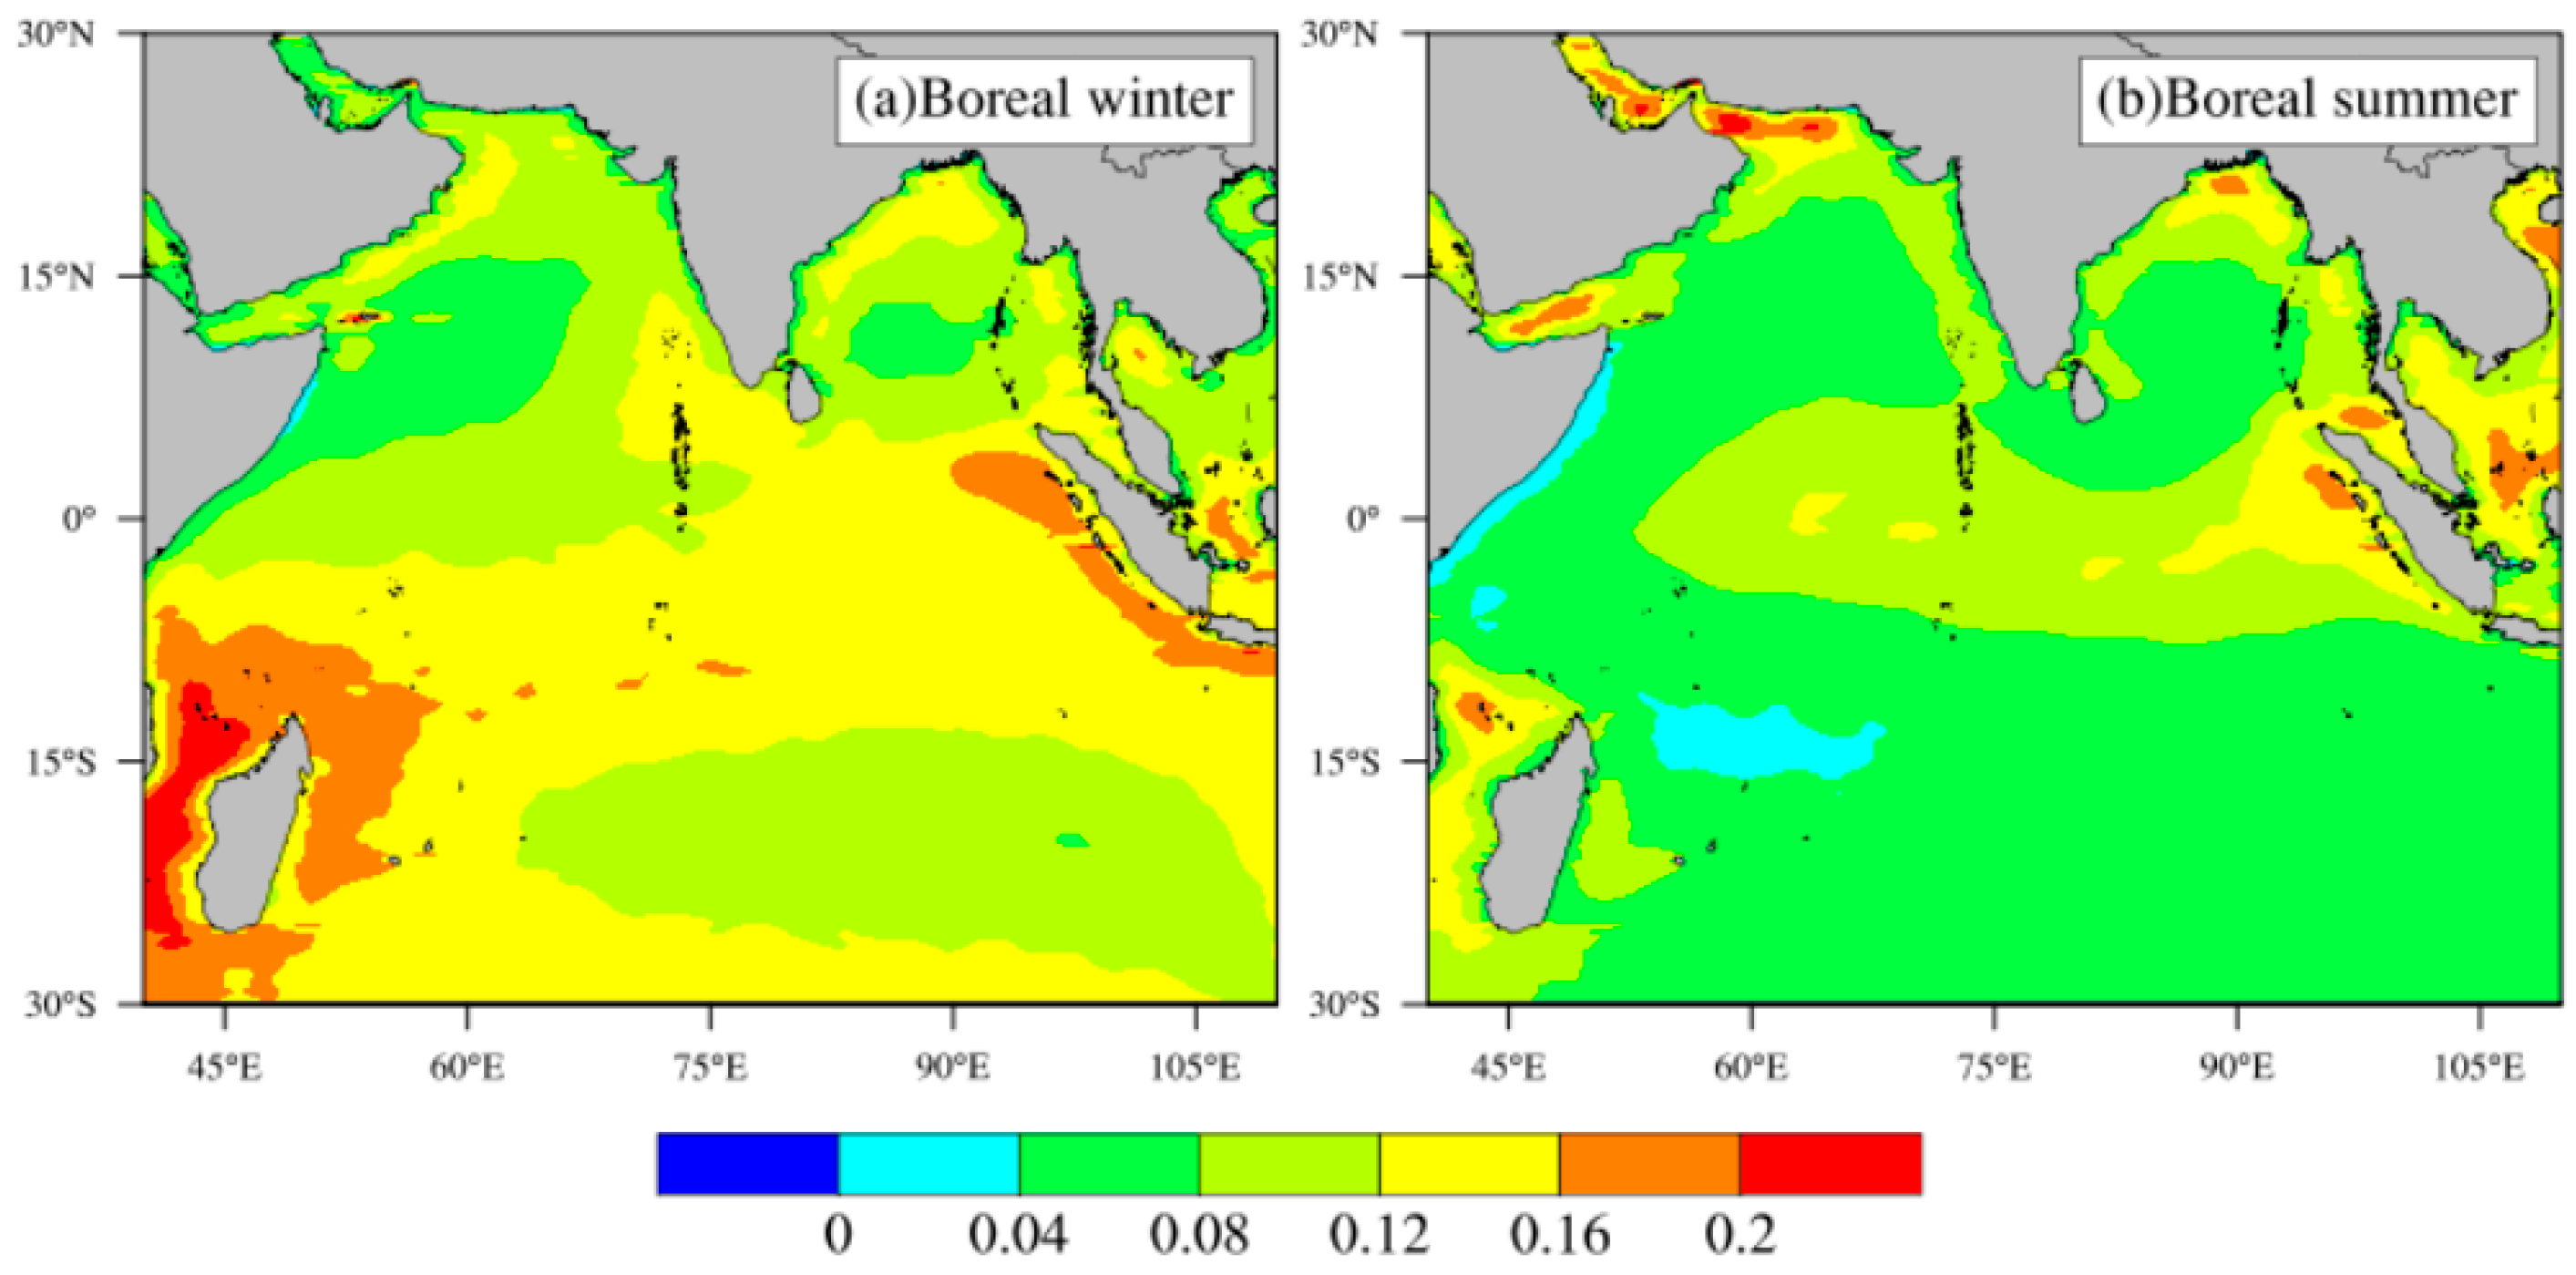
MJO is an atmospheric disturbance phenomenon in tropical regions that is closely related to global-scale weather and climate anomalies. According to Harrison et al. [45], the SST variation in the tropical Indian Ocean can reach up to 3 °C under the modulation of MJO. In order to study the intraseasonal variation characteristics of DSST, the boreal winter (December–February) and boreal summer (June–September) were selected as the time with the most active MJO in the Indian Ocean [46]. The Lanczos filtering method was used to perform a 20–90-day bandpass filtering on DSST and solar radiation for both boreal winter and boreal summer to obtain the intraseasonal variability. As shown in Figure 12, the spatial distribution of DSST standard deviation indicates that larger value represents greater intraseasonal variations in DSST. The areas with larger standard deviation of DSST in boreal winter are mainly located in the Southern Hemisphere, particularly near Madagascar and Sumatra. In boreal summer, the areas with larger standard deviation of DSST move northward and are mainly distributed in the equatorial region, near Madagascar and Sumatra. The intraseasonal variation amplitude of DSST in boreal winter is larger than that in boreal summer, which is consistent with the findings of Yan et al. [47].
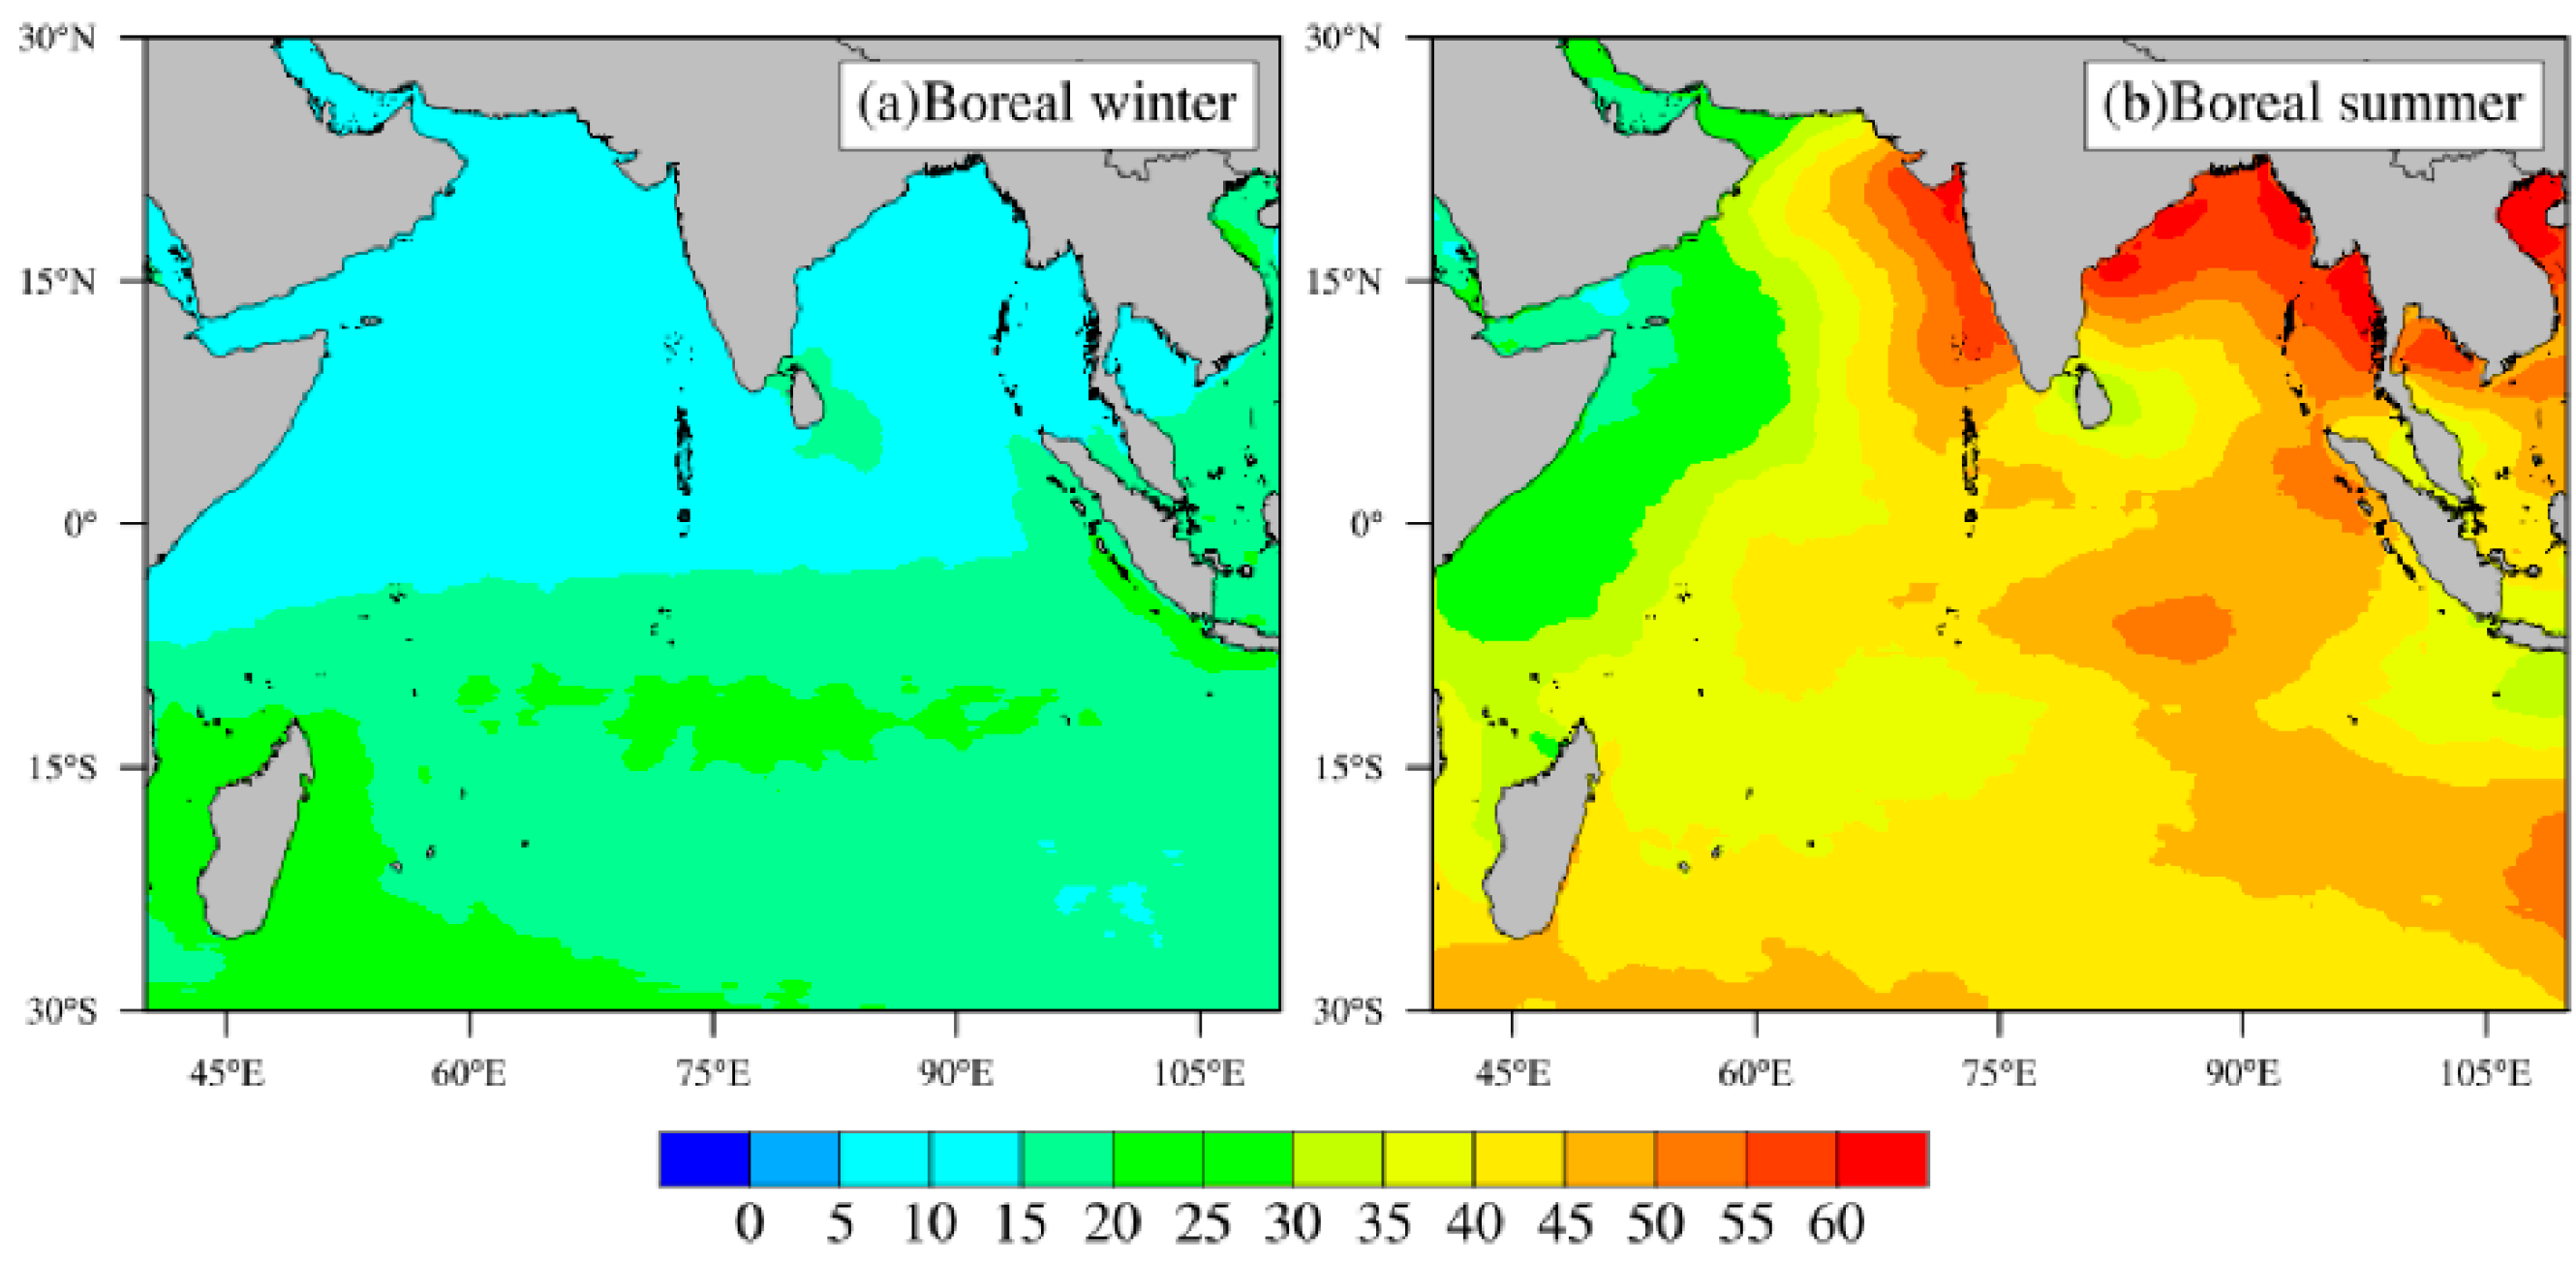
Figure 13 shows the intraseasonal variation of solar radiation. In boreal winter, the areas with larger standard deviation of solar radiation are mainly located in the Southern Hemisphere. In boreal summer, the standard deviation of solar radiation increases significantly in the equatorial region and the Northern Hemisphere, consistent with the movement of intraseasonal DSST. Yang et al. [48] pointed out that the differences of DSST in the tropical Indian Ocean under different phases of MJO are mainly caused by the intraseasonal variation of solar radiation, followed by the influence of factors such as wind stress. Further research is needed to investigate the influencing factors and mechanisms of intraseasonal variation in DSST.

5. Discussion and Conclusions

In this study, the 30-year global hourly SST dataset produced by the NMEFC was used. Based on the evaluation of the dataset’s reliability in the tropical Indian Ocean region using RAMA buoy observation data, the spatiotemporal characteristics of the DSST in the tropical Indian Ocean were analyzed. The main conclusions are as follows:
The DSST in the tropical Indian Ocean exhibits significant seasonal variations. The DSST in the Arabian Sea, Bay of Bengl, and equatorial Indian Ocean regions shows a bimodal structure, with the highest value in spring and the second highest value in autumn, demonstrating a semi-annual cycle. The DSST in the southern Indian Ocean region exhibits an annual cycle. The seasonal variations of DSST are mainly influenced by sea surface wind speed, solar radiation, and precipitation.
The DSST in the equatorial Indian Ocean is higher during El Niño years compared to La Niña years.
At the intraseasonal scale, the areas with larger standard deviation of DSST in boreal winter are mainly located in the Southern Hemisphere, particularly near Madagascar and Sumatra. In boreal summer, the areas with larger standard deviation of DSST move northward and are mainly distributed in the equatorial region, near Madagascar and Sumatra. The intraseasonal variation amplitude of DSST in boreal winter is larger than that in boreal summer.
DSST in the tropical Indian Ocean exhibits significant variations across multiple timescales, and has a notable impact on air-sea interactions. The Indian Ocean is one of the regions with the strongest monsoon activity globally, and future research will focus on investigating the influence of DSST on monsoon onset. Additionally, there will also be data revisions for the MLSST dataset to enhance the accuracy of simulating DSST.

Author Contributions

Conceptualization, J.W., X.L. and X.H.; methodology, Y.Z. and X.H.; software, X.L. and Y.Z.; validation, J.W. and X.L.; formal analysis, J.W.; data curation, X.C. and J.T.; writing—original draft, J.W.; writing—review and editing, J.W., X.L., X.H. and Y.Z.; supervision, X.L. and X.H.; All authors have read and agreed to the published version of the manuscript.

Funding

This study was funded by National Key Research and Development Program of China (2021YFB3900405), National Natural Science Foundation of China (42205064).

Institutional Review Board Statement

Not applicable.

Informed Consent Statement

Not applicable.

Data Availability Statement

The RAMA buoy observation data can be accessed on the website (https://www.pmel.noaa.gov/tao/drupal/flux/index.html).The ERA5 reanalysis data can be accessed on the website (https://cds.climate.copernicus.eu/cdsapp#!/search?type=dataset&text=era5).

Acknowledgments

We wish to express our appreciation to Lin Liu of the First Institute of Oceanography, Ministry of Natural Resources, China. We appreciate the comments of the anonymous reviewers, which helped to improve the quality of this paper.

Conflicts of Interest

The authors declare no conflict of interest.

References

  1. Kawai, Y.; Wada, A. Diurnal Sea surface temperature variation and its impact on the atmosphere and ocean: A review. J. Oceanogr. 2007, 63, 721–744. [Google Scholar] [CrossRef]
  2. Clayson, C.A.; Weitlich, D. Variability of tropical diurnal sea surface temperature. J. Clim. 2007, 20, 334–352. [Google Scholar] [CrossRef]
  3. Fairall, C.W.; Bradley, E.F.; Godfrey, J.S.; Wick, G.A.; Edson, J.B.; Young, G.S. Cool-skin and warm-layer effects on sea surface temperature. J. Geophys. Res. 1996, 101, 1295–1308. [Google Scholar] [CrossRef]
  4. Weller, R.A.; Anderson, S.P. Surface meteorology and air-sea fluxes in the western equatorial Pacific warm pool during the TOGA coupled ocean-atmosphere response experiment. J. Clim. 1996, 9, 1959–1990. [Google Scholar] [CrossRef]
  5. Bellenger, H.; Duvel, J.-P. An analysis of tropical ocean diurnal warm layers. J. Clim. 2009, 22, 3629–3646. [Google Scholar] [CrossRef]
  6. Le Borgne, P.; Legendre, G.; Péré, S. Comparison of MSG/SEVIRI and drifting buoy derived diurnal warming estimates. Rem. Sens. Environ. 2012, 124, 622–626. [Google Scholar] [CrossRef]
  7. Flament, P.; Firing, J.A.; Sawyer, M.; Trefois, C. Amplitude and horizontal structure of a large diurnal sea surface warming event during the coastal ocean dynamics experiment. J. Phys. Oceanogr. 1994, 24, 124–139. [Google Scholar]
  8. Zhou, Z.; Carton, J.A. Latent heat flux and interannual variability of the coupled atomosphere-ocean system. J. Atmos. Sci. 1998, 55, 494–501. [Google Scholar] [CrossRef]
  9. Slingo, J.; Inness, P.; Neale, R.; Woolnough, S.; Yang, G.-Y. Scale interactions on diurnalto seasonal timescales and their relevance to model systematic errors. Ann. Geophys. 2003, 46, 139–155. [Google Scholar] [CrossRef]
  10. Clayson, C.A.; Weitlich, D. Diurnal warming in the tropical Pacific and its interannual variability. Geophys. Res. Lett. 2005, 32, L21604. [Google Scholar] [CrossRef]
  11. Kettle, H.; Merchant, C.J.; Jeffery, C.D.; Filipiak, M.J.; Gentemann, C.L. The impact of diurnal variability in sea surface temperature on the central Atlantic air-sea CO2 flux. Atmos. Chem. Phys. 2009, 9, 529–541. [Google Scholar] [CrossRef]
  12. Price, J.F.; Weller, R.A.; Pinkel, R. Diurnal cycling: Observations and models of the upper ocean response to diurnal heating, cooling, and wind mixing. J. Geophys. Res. Ocean. 1986, 91, 8411–8427. [Google Scholar] [CrossRef]
  13. Soloviev, A.; Lukas, R. Observation of large diurnal warming events in the near-surface layer of the western equatorial Pacific warm pool. Deep. Sea Res. Part I Oceanogr. Res. Pap. 1997, 44, 1055–1076. [Google Scholar] [CrossRef]
  14. Stuart-Menteth, A.C.; Robinson, I.S.; Challenor, P.G. A global study of diurnal warming using infrared satellite-derived sea surface temperature. J. Geophys. Res. Ocean. 2003, 108, 3116–3155. [Google Scholar] [CrossRef]
  15. Marullo, S.; Santoleri, R.; Banzon, V.; Evans, R.H.; Guarracino, M. A diurnal-cycle resolving sea surface temperature product for the tropical Atlantic. Geophys. Res. Lett. 2010, 115, C05011. [Google Scholar] [CrossRef]
  16. Yang, X.; Song, Z.; Tseng, Y.H.; Qiao, F.; Shu, Q. Evaluation of three temperature profiles of a sublayer scheme to simulate SST diurnal cycle in a global ocean general circulation model. J. Adv. Model. Earth Syst. 2017, 9, 1994–2006. [Google Scholar] [CrossRef]
  17. Lin, P.; Liu, H.; Zhang, L. The Simulation study of the features of diurnal variation of sea surface temperature in the eastern Pacific cold tongue. Chin. J. Atmos. Sci. 2012, 36, 259–270. [Google Scholar]
  18. Yan, Y.; Wang, G.; Chen, C.; Ling, Z. Annual and Semiannual Cycles of Diurnal Warming of Sea Surface Temperature in the South China Sea. J. Geophys. Res. Ocean. 2018, 123, 5797–5807. [Google Scholar] [CrossRef]
  19. Kennedy, J.J.; Brohan, P.; Tett, S. A global climatology of the diurnal variations in sea-surface temperature and implications for MSU temperature trends. Geophys. Res. Lett. 2007, 34, 1–5. [Google Scholar] [CrossRef]
  20. Tu, Q.; Pan, D.; Hao, Z.; Yan, Y. SST diurnal warming in the China seas and northwestern Pacific Ocean using MTSAT satellite observations. Acta Oceanol. Sin. 2016, 35, 12–18. [Google Scholar] [CrossRef]
  21. Shenoi, S.S.C.; Nasnodkar, N.; Rajesh, G.; Jossia Joseph, K.; Suresh, I.; Almeida, A.M. On the diurnal ranges of Sea Surface Temperature (SST) in the north Indian Ocean. J. Earth Syst. Sci. 2009, 118, 483–495. [Google Scholar]
  22. Webster, P.J.; Magana, V.O.; Palmer, T.N.; Shukla, J.; Tomas, R.A.; Yanai, M.U.; Yasunari, T. Monsoons: Processes, predictability, and the prospects for prediction. J. Geophys. Res. Ocean. 1998, 103, 14451–14510. [Google Scholar] [CrossRef]
  23. Wu, G.; Li, J.; Zhou, T.; Lu, R.; Yu, Y.; Zhu, J.; Mu, M. The key region affecting the short-term climate variations in China: The joining area of Asia and Indian-Pacific Ocean. Adv. Earth Sci. 2006, 1109–1118. [Google Scholar]
  24. Yang, M.; Ding, Y. Diagnostic study of the variation of Indian Ocean sea surface temperature and its impact on Indian summer monsoon rainfalls. Acta Oceanol. Sin. 2006, 28, 9–15. [Google Scholar] [CrossRef]
  25. Li, K.; Yu, W.; Li, T.; Murty, V.S.N.; Khokiattiwong, S.; Adi, T.R.; Budi, S. Structures and mechanisms of the first-branch northward-propagating intraseasonal oscillation over the tropical Indian Ocean. Clim. Dyn. 2013, 40, 1707–1720. [Google Scholar] [CrossRef]
  26. Du, Y.; Yang, L.; Xie, S.P. Tropical Indian Ocean Influence on Northwest Pacific Tropical Cyclones in Summer Following Strong El Nino. J. Clim. 2011, 24, 315–322. [Google Scholar] [CrossRef]
  27. Huang, G.; Hu, K.M.; Qu, X.; Tao, W.C.; Yao, S.L.; Zhao, G.J.; Jiang, W.P. A Review about Indian Ocean Basin Mode and Its Impacts on East Asian Summer Climate. Chin. J. Atmos. Sci. 2016, 40, 121–130. [Google Scholar]
  28. Schott, F.A.; Xie, S.P.; McCreary, J.P., Jr. Indian Ocean circulation and climate variability. Rev. Geophys. 2009, 47, RG1002. [Google Scholar] [CrossRef]
  29. Saji, N.H.; Goswami, B.N.; Vinayachandran, P.N.; Yamagata, T. A dipole mode in the tropical Indian Ocean. Nature 1999, 401, 360–363. [Google Scholar] [CrossRef]
  30. Yang, Y.; Li, T.; Li, K.; Yu, W. What Controls Seasonal Variations of the Diurnal Cycle of Sea Surface Temperature in the Eastern Tropical Indian Ocean? J. Clim. 2015, 28, 8466–8485. [Google Scholar] [CrossRef]
  31. Guo, W.; Qiu, Y. Seasonal variability and mechanism of sea surface temperature diurnal warming in the Bay of Bengal and its adjacent area. J. Appl. Oceanogr. 2021, 698–706. [Google Scholar]
  32. Li, X.; Ling, T.; Zhang, Y.; Zhou, Q. A 31-year Global Diurnal Sea Surface Temperature Dataset Created by an Ocean Mixed-Layer Model. Adv. Atmos. Sci. 2018, 35, 1443–1454. [Google Scholar] [CrossRef]
  33. Ling, T.; Xu, M.; Liang, X.Z.; Wang, J.X.; Noh, Y. A multilevel ocean mixed layer model resolving the diurnal cycle: Development and validation. J. Adv. Model. Earth Syst. 2015, 7, 1680–1692. [Google Scholar] [CrossRef]
  34. Mcphaden, M.J.; Meyers, G.; Ando, K.; Masumoto, Y.; Murty, V.S.N.; Ravichandran, M.; Syamsudin, F.; Vialard, J.; Yu, L.; Yu, W. Supplement to RAMA: The Research Moored Array for African--Asian--Australian Monsoon Analysis and Prediction. Bull. Am. Meteorol. Soc. 2009, 90, ES5–ES8. [Google Scholar] [CrossRef]
  35. Hersbach, H.; Dee, D. ERA5 reanalysis is in production. ECMWF Newsl. 2016, 147, 5. [Google Scholar]
  36. Sen, K.P. Estimates of the Regression Coefficient Based on Kendall’s Tau. Publ. Am. Stat. Assoc. 1968, 63, 1379–1389. [Google Scholar] [CrossRef]
  37. Kendall, M.G. Rank Correlation Methods. Br. J. Psychol. 1990, 25, 86–91. [Google Scholar] [CrossRef]
  38. Wei-Dong, Y.; Jian-Wei, S.; Lin, L.; Kui-Ping, L.; Yan-Liang, L.; Hui-Wu, W. The onset of the monsoon over the Bay of Bengal: The observed common features for 2008–2011. Atmos. Ocean. Sci. Lett. 2012, 5, 314–318. [Google Scholar] [CrossRef]
  39. Webster, P.J.; Clayson, C.A.; Curry, J.A. Clouds, radiation, and the diurnal cycle of sea surface temperature in the tropical western Pacific. J. Clim. 1996, 9, 1712–1730. [Google Scholar] [CrossRef]
  40. Chen, B.; Li, L.; Ge, X.; Jiang, Y.; Chen, M. Analysis of multi-time-scale variability characteristics of sea water temperature in tropical oceans. J. Meteorol. Sci. 2020, 40, 475–484. [Google Scholar]
  41. Karagali, I.; Høyer, J.; Hasager, C. SST diurnal variability in the North Sea and the Baltic Sea. Remote Sens. Environ. 2012, 121, 159–170. [Google Scholar] [CrossRef]
  42. Kawai, Y.; Kawamura, H. Spatial and temporal variations of model-derived diurnal amplitude of sea surface temperature in the western Pacific Ocean. J. Geophys. Res. 2005, 110, C08012. [Google Scholar] [CrossRef]
  43. Klein, S.A.; Soden, B.J.; Lau, N.-C. Remote Sea surface temperature variations during ENSO: Evidence for a tropical atmospheric bridge. J. Clim. 1999, 12, 917–932. [Google Scholar] [CrossRef]
  44. Du, Y.; Xie, S.P.; Huang, G.; Hu, K. Role of air–sea interaction in the long persistence of El Niño-induced North Indian Ocean warming. J. Clim. 2009, 22, 2023–2038. [Google Scholar] [CrossRef]
  45. Harrison, D.E.; Vecchi, G.A. January 1999 Indian Ocean Cooling Event. Geophys. Res. Lett. 2001, 28, 3717–3720. [Google Scholar] [CrossRef]
  46. Wang, B.; Rui, H. Synoptic climatology of transient tropical intraseasonal convection anomalies: 1975–1985. Meteorol. Atmos. Phys. 1990, 44, 43–61. [Google Scholar] [CrossRef]
  47. Yan, Y.; Ling, Z.; Chen, C. Opposite responses of the diurnal amplitude of sea surface temperature to the Madden-Julian Oscillation. Deep. Sea Res. Part I Oceanogr. Res. Pap. 2017, 130, 30–35. [Google Scholar] [CrossRef]
  48. Yang, Y.; Yu, W.; Sun, J.; Li, K.; Liu, Y.; Gao, L. Impact of Madden-Julian Oscillation on Diurnal Variation of Sea Surface Temperature in the Tropical Indian Ocean. Adv. Mar. Sci. 2013, 31, 9. [Google Scholar]
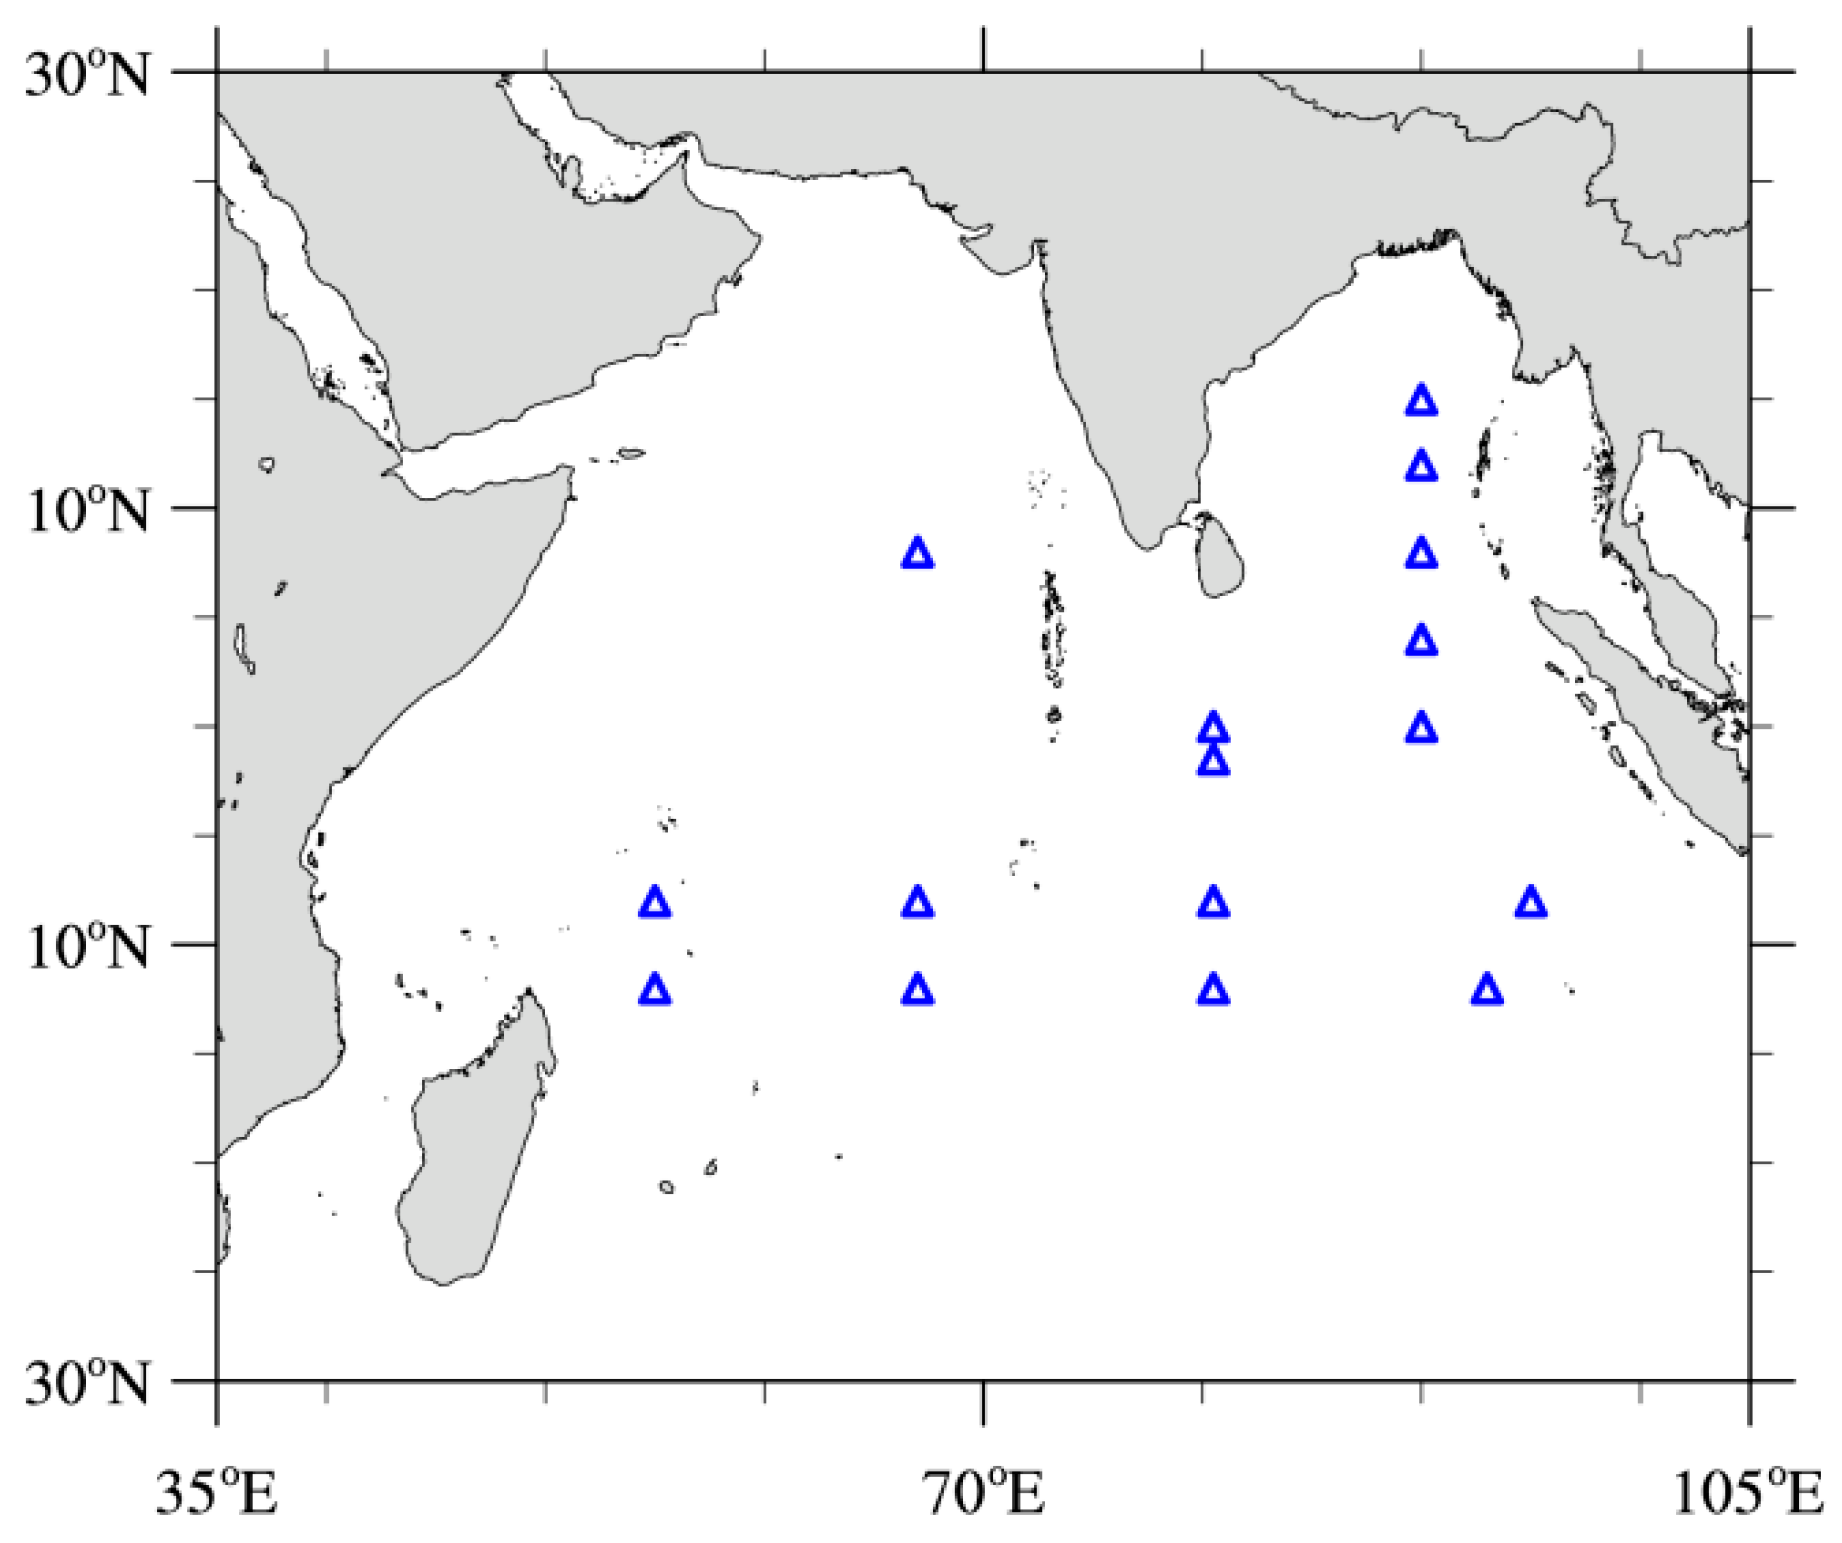
Figure 1. Locations of the RAMA stations used in this study.
Atmosphere 14 01754 g001
Figure 2. Scatterplot between the hourly SST measured via the MLSST simulation and the RAMA buoys (the total sample: 200280).
Atmosphere 14 01754 g002
Figure 3. Comparison of monthly mean diurnal SST variability between the MLSST simulation and RAMA buoy data from 2008 to 2019 over all the RAMA buoys.
Atmosphere 14 01754 g003
Figure 4. Comparison of DSST time series between the MLSST simulation and RAMA buoys for the year of 2019 at selected RAMA buoy: (a) T8N67E (8° N, 67° E), (b) T12N90E (12° N, 90° E), (c) T0N80.5E (0° N, 80.5° E), (d) T12S80.5E (12° S, 80.5° E).
Atmosphere 14 01754 g004
Figure 5. Histogram of DSST from (a) RAMA buoys, (b) MLSST simulation (the total sample: 8345).
Atmosphere 14 01754 g005
Figure 6. The climatological mean DSST in tropical Indian Ocean from 1990 to 2019. Four regions are selected for comparative analysis: Region A: Arabian Sea (8° N–25° N; 55° E–70° E), Region B: Bay of Bengal (8° N–22° N; 80° E–95° E), Region C: equatorial Indian Ocean (8° S–8° N; 50° E–100° E), Region D: southern Indian Ocean (30° S–8° S; 50° E–100° E).
Atmosphere 14 01754 g006
Figure 7. Monthly variations of (a) DSST, (b) solar radiation, (c) wind speed, (d) precipitation. Region A: Arabian Sea, Region B: Bay of Bengal, Region C: equatorial Indian Ocean, Region. D: southern Indian Ocean.
Atmosphere 14 01754 g007
Figure 8. Diurnal cycle of SST anomaly of the Equatorial Indian Ocean (8° S–8° N; 50° E–100° E) in El Niño years (black line) and La Niña years (blue line). The Niño 3.4 index was used to represent ENSO events. The years of El Niño and La Niña events were selected from 1990 to 2019.
Atmosphere 14 01754 g008
Figure 9. Long-term trend of DSST. (a) Arabian Sea, (b) Bay of Bengal, (c) equatorial Indian Ocean, (d) southern Indian Ocean.
Atmosphere 14 01754 g009
Figure 10. Long-term trend of wind speed. (a) Arabian Sea, (b) Bay of Bengal, (c) equatorial Indian Ocean, (d) southern Indian Ocean.
Atmosphere 14 01754 g010
Figure 11. Long-term trend of solar radiation. (a) Arabian Sea, (b) Bay of Bengal, (c) equatorial Indian Ocean, (d) southern Indian Ocean.
Atmosphere 14 01754 g011
Figure 12. Standard deviation of the filtered (20–90-day filter) DSST in the tropical Indian Ocean. (a) boreal winter, (b) boreal summer.
Atmosphere 14 01754 g012
Figure 13. Standard deviation of the filtered (20–90-day filter) solar radiation in the tropical Indian Ocean. (a) boreal winter, (b) boreal summer.
Atmosphere 14 01754 g013
Table 1. The location and temporal record of four selected RAMA buoys.
Buoy Station Lat, Lon (Degrees)PeriodResolution
T8N67E8° N, 67° E1 January 2019 to 3 November 201910 min
T12N90E12° N, 90° E1 January 2019 to 13 July 20191 h
T0N80.5E0° N, 80.5° E1 January 2019 to 14 August 201910 min
T12S80.5E12° S, 80.5° E20 February 2019 to 31 December 20191 h
Table 2. Comparison of DSST between the MLSST simulation and RAMA buoys from 2008 to 2019.
Parameters200820092010201120122013201420152016201720182019
RMSE/°C0.270.250.270.400.220.310.270.250.270.260.300.27
Bias/°C0.070.060.040.130.020.120.080.070.040.030.090.09
R0.750.780.720.710.770.780.820.810.770.800.780.79
Table 3. The start and end dates of ENSO events from 1990 to 2019.
El Niño EventsLa Niña Events
TimeMay 1991 to June 1992TimeAugust 1995 to March 1996
September 1994 to March 1995July 1998 to February 2001
May 1997 to May 1998November 2005 to March 2006
June 2002 to February 2003July 2007 to June 2008
July 2004 to February 2005November 2008 to March 2009
September 2006 to January 2007June 2010 to May 2011
November 2014 to May 2016July 2011 to March 2012
Disclaimer/Publisher’s Note: The statements, opinions and data contained in all publications are solely those of the individual author(s) and contributor(s) and not of MDPI and/or the editor(s). MDPI and/or the editor(s) disclaim responsibility for any injury to people or property resulting from any ideas, methods, instructions or products referred to in the content.