Abstract
Due to high altitudes, Central Asian alpine lakes can serve as indicators of localized climate change. This article monitored the water volume time series trends of the ungauged alpine Lake Karakul, which is typical because of the abundance of glaciers in the basin, from 1990 to 2020 via multiple source remote sensing data. The “Global-Local” multi-scale lake extraction method is used to delineate the boundary of Lake Karakul. Consistency analysis was performed on the altimetry data of CryoSat-2, ICESat-1 and ICESat-2, assuming that the lake surface was flat; a threshold value was set to remove gross error, and then 3σ was used to remove the surface elevation anomaly. Based on the pyramid volume model, the lake area and surface elevation information were used to reconstruct the water volume time series of Lake Karakul. The influencing factors of water volume temporal variation were discussed. The results show that Lake Karakul has been on an expansionary trend in recent years: The lake area increased from 394.9 km2 in 1988 to 411.4 km2 in 2020; the rate of increase is 0.74 m/year. The surface elevation increased from 3886.6 m in 2003 to 3888.6 m in 2020; the rate of increase is 0.11 km2/year. The lake water volume accumulated was 0.817 km3 in 2003–2020, with an accumulation rate of 0.059 km3/year. The Lake Karakul basin is developing towards dry heat, with a cumulative temperature variation rate of +0.38 °C/year; the average rate of variation in annual cumulative precipitation is −3.37 mm/year; the average evapotranspiration in the watershed is on a fluctuating increasing trend, with a rate of variation of +0.43 mm/year; glaciers in the lake basin have a retreating trend, with an average annual rate of variation of −0.22 km2/year from 1992 to 2020. Lake Karakul is more sensitive to temperature variations, and the runoff from retreating glaciers in the basin is an important contribution to the expansion of Lake Karakul.
1. Introduction
Alpine lakes play a crucial role in the terrestrial water cycle by participating in the natural water cycle, maintaining the ecological balance of a watershed, and responding to surrounding climate fluctuations [1,2,3]. In the arid and semi-arid regions of Central Asia, lake water resources are particularly important, and the presence of lakes, in general, is important to the local ecosystem and human society. Therefore, monitoring of lakes in Central Asia is of significant value [4,5,6]. The Alpine region of Central Asia, centrally located within the Asian continent, encompasses one of the highest mountain ranges in the world and is highly sensitive to climate change. Due to the steep terrain and harsh climate in the region, conducting a long time series of field monitoring of lakes poses significant challenges [7,8]. There are some alpine lakes in Central Asia that lack sufficient monitoring data, necessitating further research on these specific lakes [9].
Remote sensing data have been widely used in the monitoring and research of alpine lakes. The long time series of lake area information can be obtained from remote sensing images easily and quickly, and altimetry satellites provide the surface elevation information of lakes within the period of the satellite operation; therefore, these sources can provide important data support for the study of the water balance of lakes [10,11,12,13,14]. Wang et al. used multiple source altimetry satellite data and Landsat series satellite imagery data to monitor the variation in water storage in Qinghai Lake in recent years, and found that the increase in water storage in Qinghai Lake over the past 8 years was significantly greater than the increase observed 10 years ago [15]. In regions where there is a lack of hydrologic stations to monitor the lake, remote sensing data have become the main source of data for lake research efforts. Wu et al. used multiple source remote sensing data to monitor the area and water level variations in lakes in the south-central Tibetan plateau [16]. Zhang et al. used the Landsat series of images to study trends in lake area at different elevations within the Tianshan range of Central Asia: a trend of shrinking lakes at lower elevations was found, and the high-altitude lake area showed an expanding trend with increasing temperature [17]. Hence, the method of utilizing remote sensing data serves as an effective approach for supplementary monitoring and research, addressing the existing data scarcity in Central Asian alpine lakes.
Located in the eastern part of the Pamir Plateau in Central Asia, Lake Karakul, with its high altitude and minimal human influence, is an ideal area to study the variation and climate response of alpine lakes in Central Asia. The Karakul station within the basin of the lake ceased operation in 1993, resumed work in 2013, and then ceased work again in 2020. Utilizing remote sensing images and satellite altimetry data, researchers can effectively reconstruct the curves of variations in the area and surface elevation in recent years. The integration of remote sensing and satellite altimetry data enables the estimation of the water volume of lake variations and provides valuable support for subsequent studies on the lake.
In this paper, we use multiple source remote sensing data to extract a number of lake monitoring indicators of Lake Karakul in recent years, and analyze the trend of this lake. Remotely sensed meteorological data and glacier information in the watershed were also used to explore the response of the lake to regional climate change. The main research purposes are as follows: (1) Determine the trends in the area, surface elevation and water storage of Lake Karakul in recent years. (2) Identify meteorological trends within the Lake Karakul basin. (3) Discuss the major trends of variation in the Lake Karakul basin, in the context of meteorological variations and glacial information about the lake. This study contributes to improved remote sensing monitoring of alpine lakes in Central Asia, and provides new insights into alpine lake response to climate change.
2. Materials and Methods
2.1. Study Area
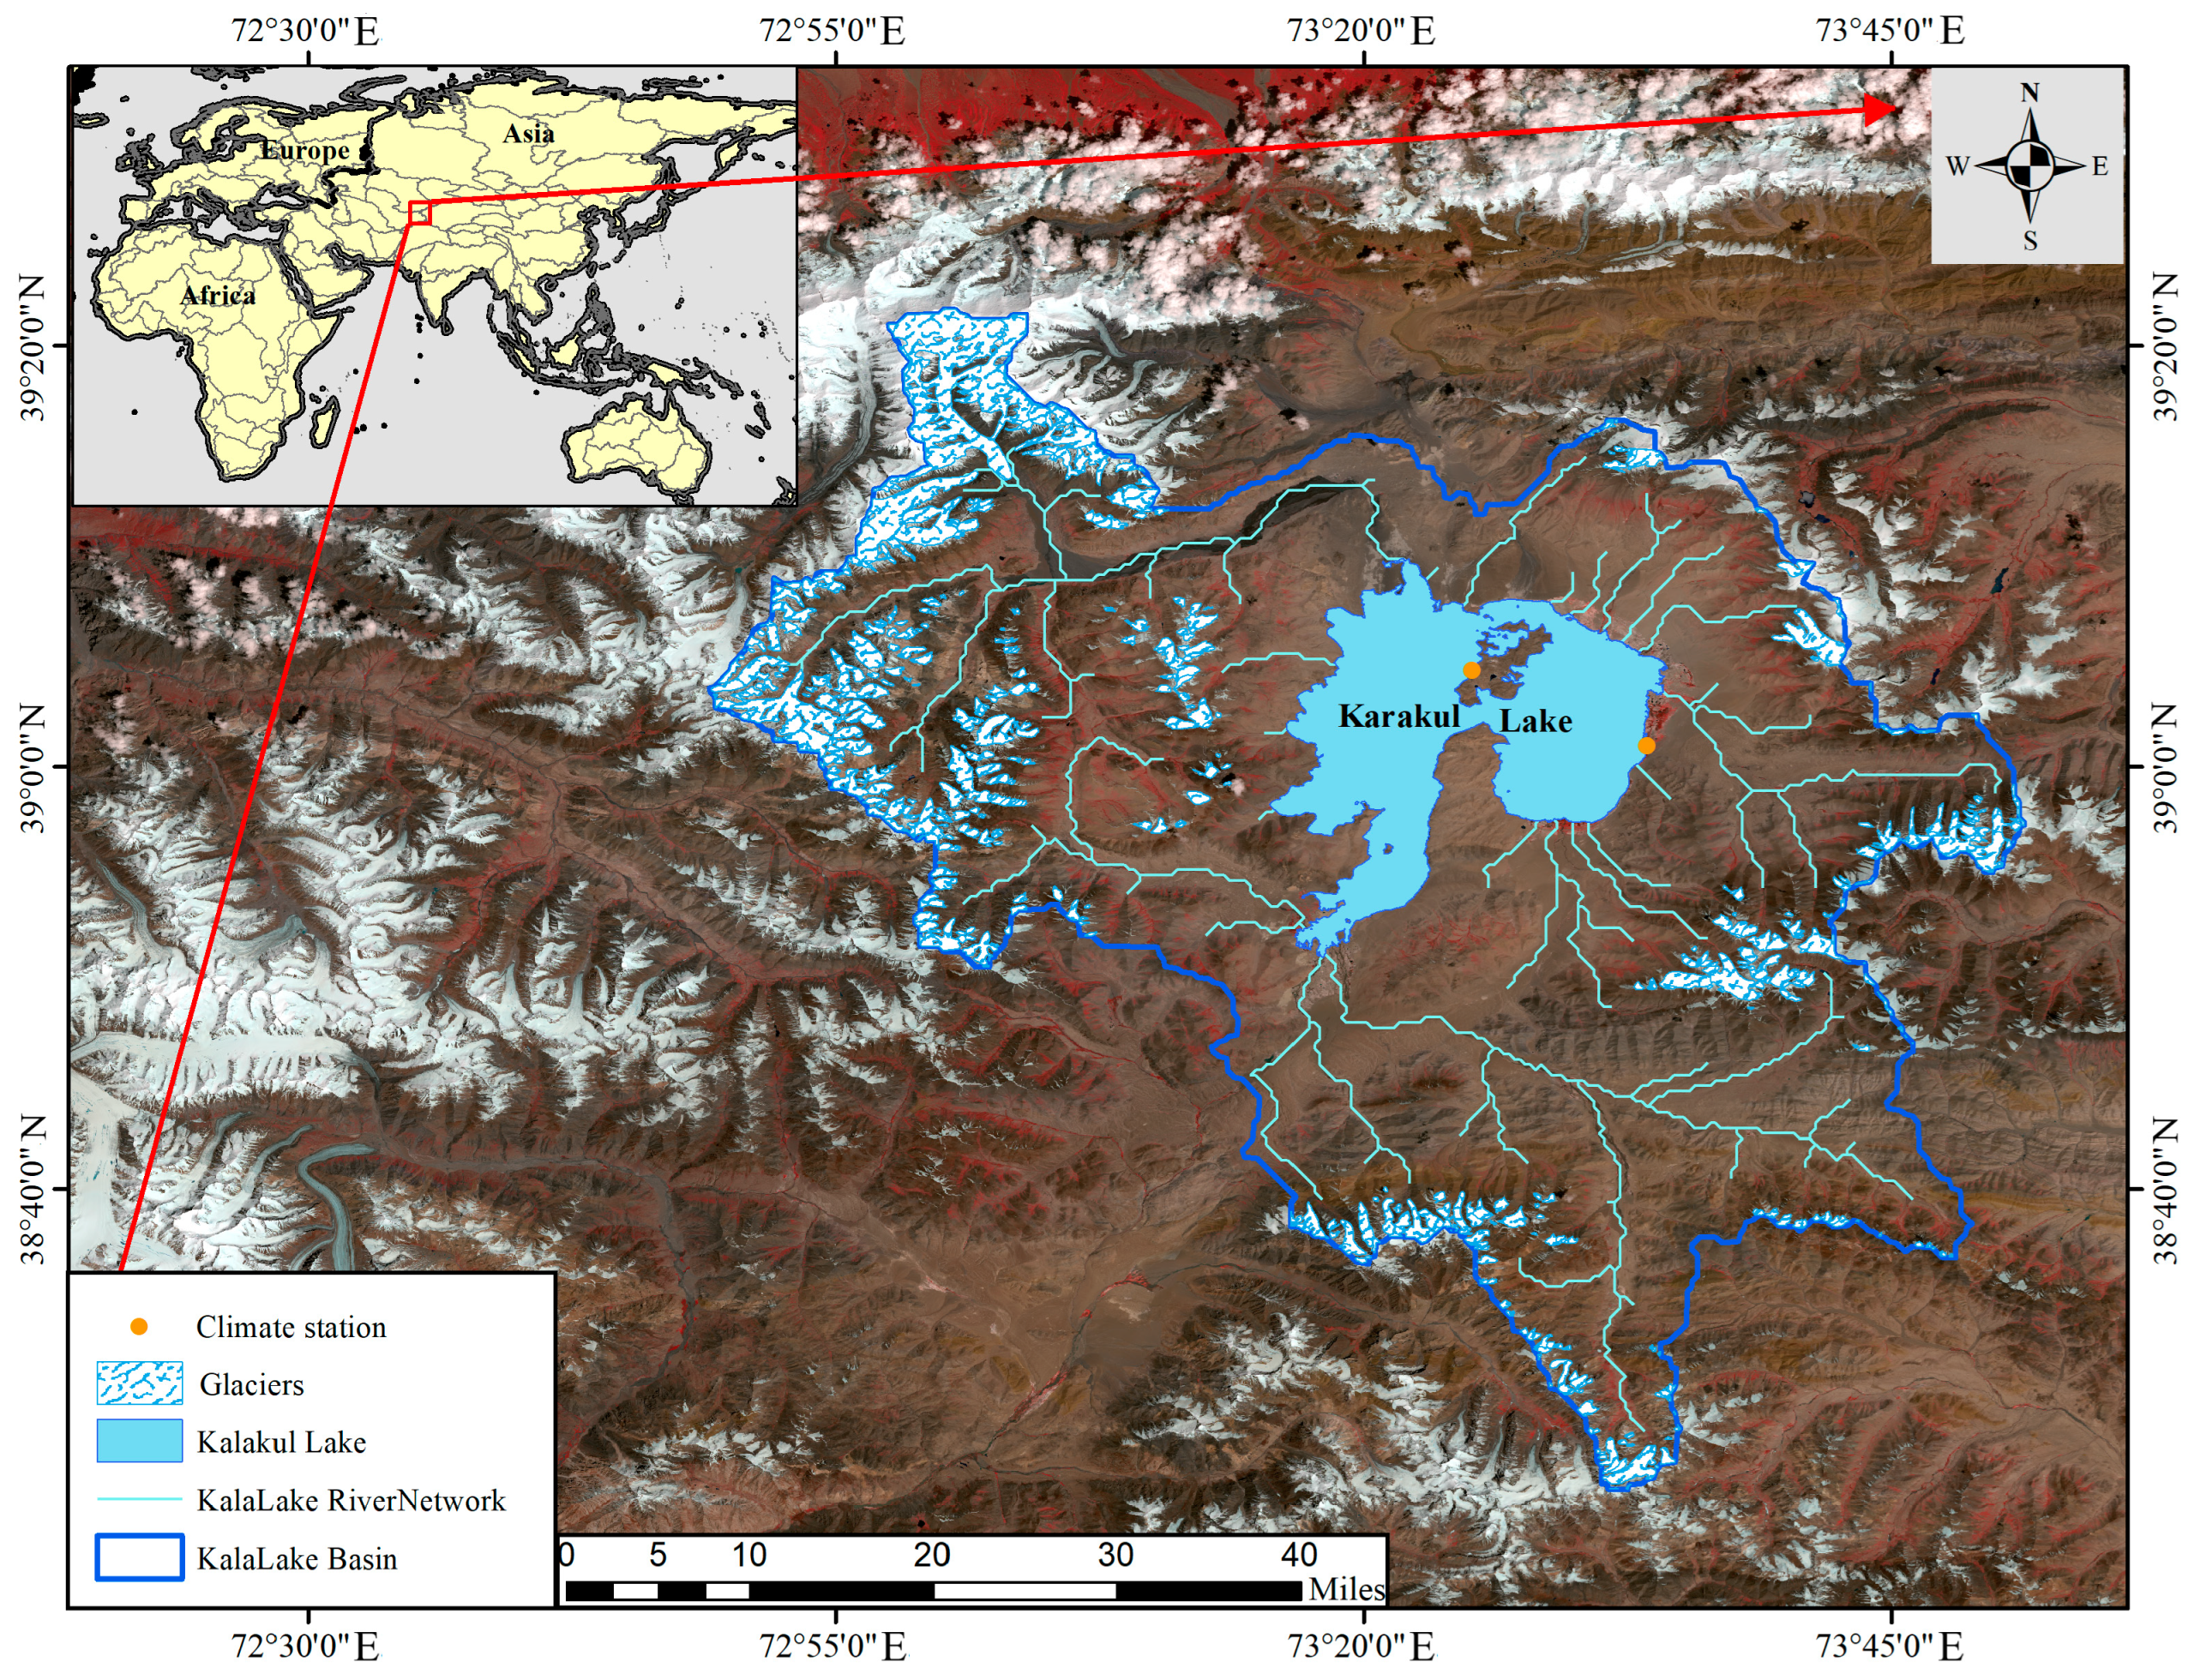
As shown in Figure 1, the Pamir Plateau (36°–40° N, 73°–76° E) is located in southeastern Central Asia, spanning the three countries of China, Tajikistan, and Afghanistan, with altitudes ranging from 4000 to 7000 m above sea level, and with Chogori Peak being the highest peak in the region. The Eastern Pamir Plateau is a relatively flat and open terrain. It is home to a significant number of alpine glaciers, with more than 10,000 glaciers covering an expansive area of over 10,000 square kilometers [18,19]. The center of Lake Karakul is located at 39° N, 73.41° E. It is situated in the eastern range of the Pamir Plateau of Tajikistan, between the Gonger, Jugal Nyubet and Moustagh peaks, at an altitude of about 3890 m. Lake Karakul is about 19 km long from east to west and 27 km wide from north to south, with a lake area of about 400 square kilometers and an average water depth of about 15 m. During the winter season, characterized by low temperatures, the lake is covered with ice, reaching thicknesses of up to 1 m, from November to May annually. The region receives an average annual precipitation of approximately 82 mm. Lake Karakul is a closed basin lake in the alpines of Central Asia, with a large number of glaciers covering an area of about 384 square kilometers [20,21,22].

Figure 1.
Lake Karakul basin.
2.2. Data Source
2.2.1. Remote Sensing Image Data
Landsat is a remote sensing satellite program jointly conducted by the National Aeronautics and Space Administration (NASA) and the U.S. Geological Survey (USGS). The objective of the program is to acquire high-resolution remote sensing images of the global land surface, including the four categories of MSS, TM, ETM+, and OLI imagery. Since the first launch in 1972, nine satellites have been launched. In this study, 202 periods of Landsat series satellite data for the period 1988–2020 were used for the time series reconstruction work of the lake area of Lake Karakul, and images for the years 1992, 1997, 2000, 2007, 2016 and 2020 were selected for the study of glacier area within the basin of Lake Karakul.
2.2.2. Elevation Data
ICESat-1 altimetry satellite data and CryoSat-2 satellite altimetry data were mainly used in this study. ICESat-1 with GLAS on board produces data products in three main classes (Lecel 0, Lecel 1, and Lecel 2), provided by NASA’s National Snow and Ice Data Center [23,24]. GLAS data products mainly consist of 15 standard data products and some ancillary data. In this study, we use the GLA14 dataset, which is processed L2 level data, and the main content is the global land surface altimetry data, including latitude, longitude, elevation, and waveform information [11].
CryoSat-2 altimetry satellite was launched in 2010. Its observation footpoint has a cross-orbit distance of 1.5 km, a spatial resolution of 300 m along the orbit, an elevation monitoring accuracy of 1–3 cm, and an operational cycle of 369 days, consisting of 30 days of sub-cycle repetitive operations [25,26]. The CryoSat-2 dataset is produced by the European Space Agency(ESA), and the data products mainly consist of Level 0 data (contain time and telemetry quality data), FBR (full bit rate), Level 1b data (contain echo waveform data), and Level 2 data (contain feature surface elevation data). This study uses the CryoSat-2 L2 Baseline-D product, which provides better results for lake elevation monitoring compared to the previously released Baseline-C product [27]. CryoSat ICE Baseline-D Processor generates Level 1B and Level 2 Products from Level 0 LRM, SAR and SARIn Products [28]. Among the CryoSat-2 data products, the L2 product is generally accepted as the most convenient to use [29]. The raw data for the L2 product are global altimetry footpoints with a monthly cycle. In this study, relevant CryoSat-2 satellite footpoint data from July 2010 to June 2021 were extracted using Matlab.
2.2.3. Meteorological Data
This paper uses ERA5 global climate reanalysis data to investigate meteorological variability within the study lake basin. ERA5 is the fifth generation of global climate reanalysis data, which is published by the European Centre for Medium-Range Weather Forecasts (ECMWF). It provides data, at a resolution of 11,132 m, on the evolution of land variables over decades, including temperature, wind, and precipitation [30,31]. The ERA5 dataset has been recorded since 1981 and provides a picture of past climate change that can be used to study the relationship between lake variation and climate.
2.3. Research Methods
2.3.1. Extraction of Lake Area and Glacier Area
In this study, the NDMBWI water body index is utilized for lake water body extraction work, which can better highlight the spectral reflectance characteristics of the water body, and then distinguish the lake water body from the surrounding soil, vegetation, and other feature types. The NDMBWI is calculated as
NDMBWI = (3CHGreen − CHBlue + 2CHRed − 5CHNir)/(3CHGreen+ CHBlue + 2CHRed + 5CHNir)
CHGreen is the green light band; CHBlue is the blue light band; CHRed is the red light band; and CHNir is the near infrared band. The index can better discriminate water bodies from clouds, shadows, ice and snow in remote sensing images, and has unique advantages for lake boundary extraction in alpine areas. This study is based on the idea of “ Global-Local” water body delineation, combined with visual interpretation and correction work, to realize the accurate extraction of lake water body boundaries [32].
In this study, the Normalized Difference Snow Index (NDSI) was used to carry out the glacier cover survey work in the study area. This index highlights the glacier area in the image by normalizing the visible strong reflective band and the mid-infrared low reflective band of the glacier to distinguish it from the background features [33,34]. The calculation formula is
where CHn is the visible band, CHm is the mid-infrared band, and the NDSI value domain is [−1, 1]. Due to the different types of glaciers in different regions, the segmentation thresholds selected for glacier boundary extraction are also different when using the NDSI index for glacier boundary extraction. In order to ensure the extraction accuracy of the glacier boundary, this study corrected the automated extracted glacier boundary line with visual interpretation, and further modified the boundary line by combining the glacier cataloging data, and then obtained the glacier boundary within the lake basin.
NDSI = (CHn − CHm)/(CHn + CHm)
2.3.2. Extraction of Lake Surface Elevations
In this study, CryoSat-2 and ICESat-1 satellite altimetry data were used for monitoring the surface elevation of the lake, and the main monitoring principles are as follows:
where E is the distance from the lake surface to the WGS-84 reference ellipsoid, i.e., the lake surface elevation; alt is the distance from the satellite to the WGS-84 reference ellipsoid; the range is the distance from the satellite to the lake surface; and c is corrections, including geophysical corrections (solid Earth tides, ocean loaded tides, and geocentric polar tides) and atmospheric corrections (ionospheric, wet tropospheric, and dry tropospheric). Obtaining lake surface elevations from satellite altimetry data requires extracting accurate lake-wide satellite footpoints locations and corresponding elevation values.
E = alt − range + c
This study utilizes satellite altimetry data to reconstruct the lake surface elevation time series with the following main processes:
- (1)
- Data format conversions: ICESat altimetry satellite GLA14 data were downloaded from NSIDC in HDF5 format; Cryosat-2 satellite L2 level product data were downloaded from ESA in NC file format. In this study, Matlab software was used to read the HDF5 and NC format files and save them to an EXCEL table; the main readout parameters included geodetic longitude, geodetic latitude, altitude with respect to the reference ellipsoid, and geoid disparity. Data were converted to Shapefile point data format using ArcGIS software.
- (2)
- Coordinate system transformation: The ICESat-1 altimetry satellite has a different reference system for altimetry data than the CryoSat-2 satellite. ICESat-1 uses the TOPEX/Poseidon, EGM2008 reference system; Cryosat-2 uses the WGS84, EGM96 reference system, which requires the conversion of the altimetry data from the two satellites into the same reference system for processing [35].
- (3)
- Lake footpoint extraction: In this study, the boundary of the lake water body at different time periods was pushed inward by 200 m as the range of elevation footing extraction. Elevation footings were screened using ArcGIS software to eliminate elevation footing data that were not within the lake, and elevation footings within the lake were organized into timestamps.
- (4)
- Abnormal footpoint handling: In the process of monitoring the surface elevation of lakes using altimetry satellites, abnormal footings can occur due to various factors (cloud cover, rainfall, lake reflections, satellite footing size, etc.). In this study, the abnormal footpoints in the collection of elevation points are eliminated based on the principle of threshold extraction and the “Pauta” criterion. Firstly, the median elevation of the collection of elevation footings is calculated, followed by the selection of a threshold range to initially exclude outliers. Then, the standard deviation of the elevation of the collection of elevation footpoints is calculated. The elevation values at each footpoint is evaluated to determine whether it falls within the range of 3 times the standard deviation. The elevation footpoints within the range are retained, while outliers are excluded. Finally, the median elevation of the remaining collection of elevation footpoints is calculated.
- (5)
- Time series rebuild of lake surface elevations: The satellite footpoints processed with steps (3) and (4) were counted according to timestamps, and the mean value was taken as the current timestamped lake surface elevation. The time series of lake surface elevation of Karakul Lake is obtained after collation.
2.3.3. Calculation of Lake Water Volume
For lakes with uncertain underwater topography, it is more difficult to calculate the absolute volume of water in the lake by modeling the volume of water. By approximating the lake as a prismatic cone, the variation in relative water volume of the lake can be calculated using the prismatic volume variations formula, which is calculated as follows:
∆V = 1/3 × ∆H × [S1 + S2 + √(S1 × S2)]
S1 is the lake area on the start date of monitoring; S2 is the lake area on the end date of monitoring; ∆H the amount of variations in the surface elevation of the lake during the monitoring period; and the ∆V variation in the relative volume of water in the lake during the monitoring time period. This formulation calculates the variations in the relative volume of water in a lake over a certain period [36].
3. Results
3.1. Variations in the Size of Lake Karakul
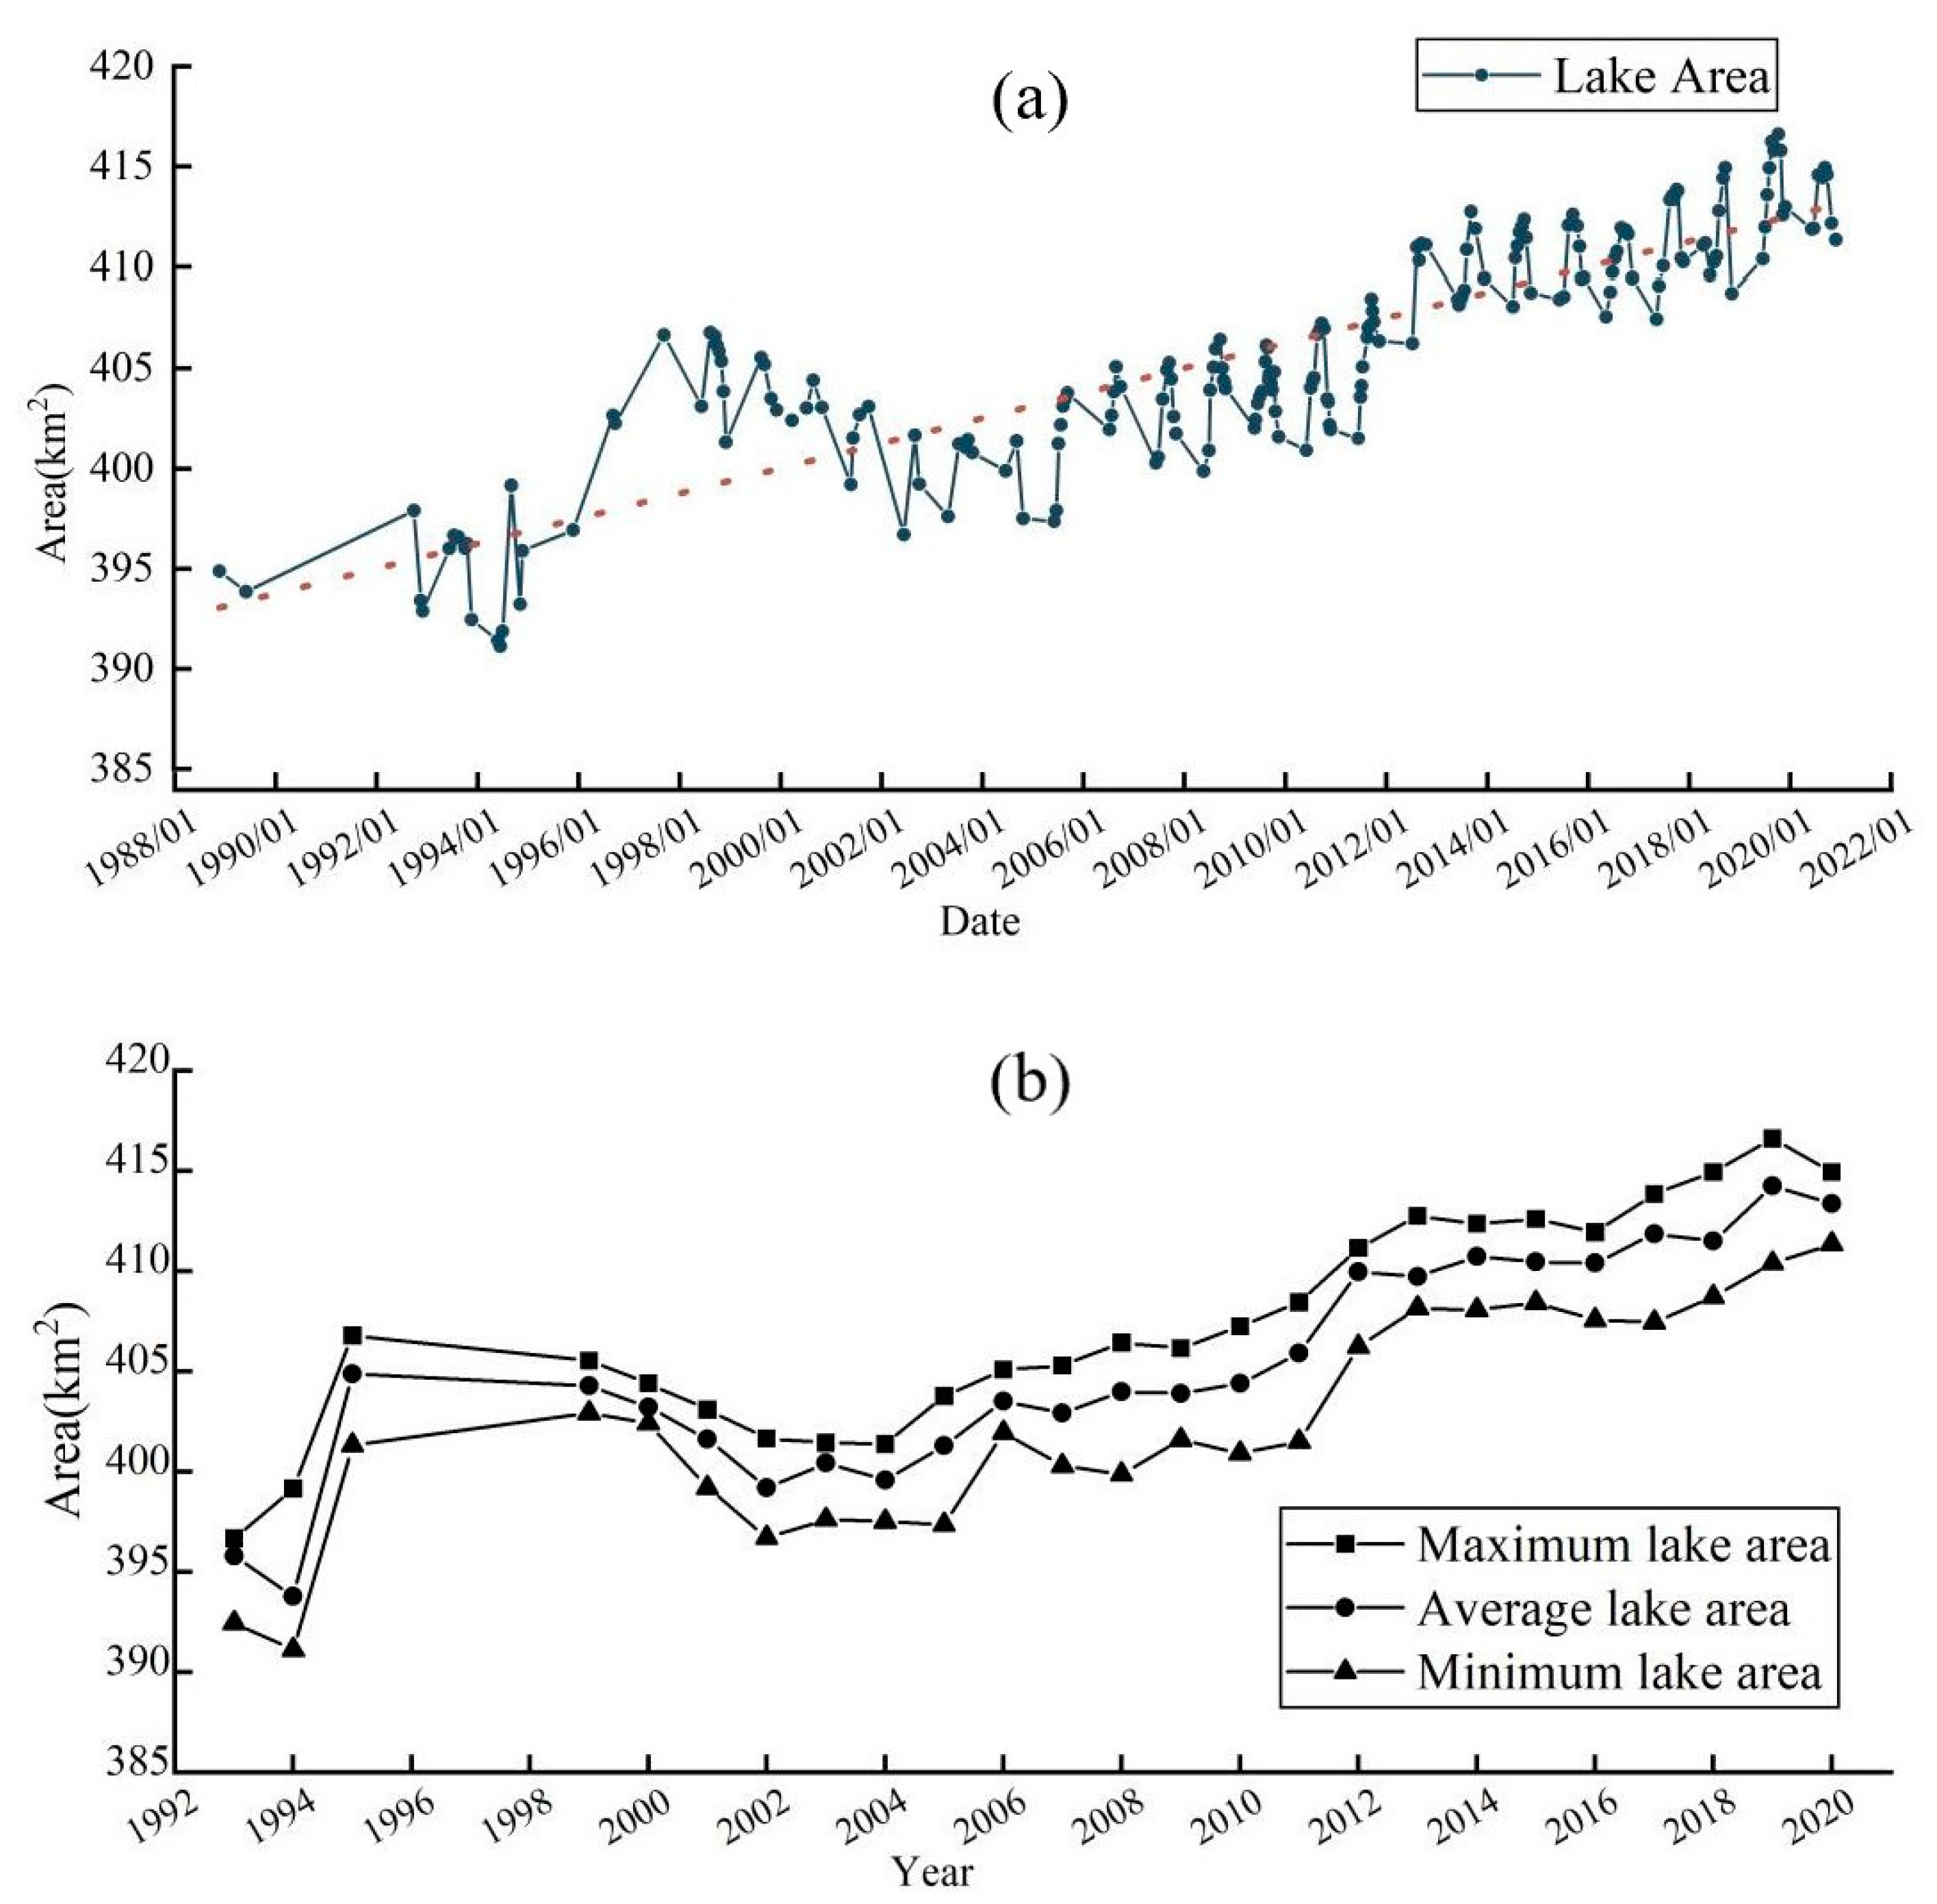
Based on the lake area extraction method in Section 2.3.1 of this paper, this study built a time series of lake area from 1988 to 2020 in Lake Karakul. As shown in Figure 2, the area of Karakul Lake exhibited an increasing trend, from 394.88 km2 in 1988 to 411.35 km2 in 2020, with an increasing rate of 0.74 km2/year. The process of variations in the lake area is divided into three main stages: in 1999–2004, the lake area slowly receded from 404.29 km2 to 401.29 km2, and the average annual rate of variation was −0.5 km2/year; in 2005–2019, the lake expanded from 401.29 km2 to 414.25 km2, and the average annual rate of variation was +0.92 km2/year; in 2019–2020, the lake area reduced by 0.88 km2 to reach a final area of 413.37 km2. Seasonal area variations of the lake are less variable, with annual variations in the lake area not exceeding 0.7% of the total lake area.
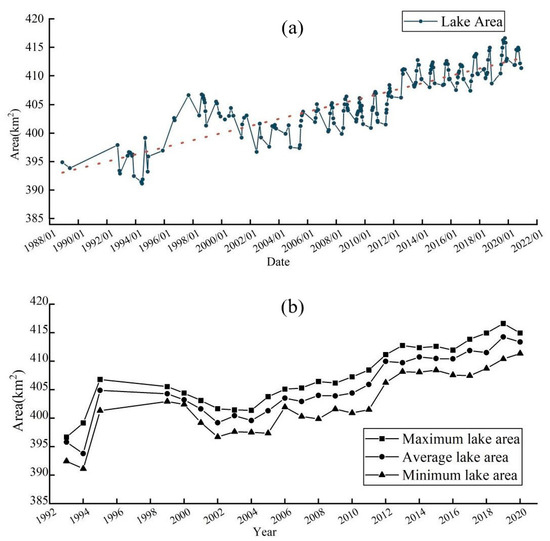
Figure 2.
(a) Change curve of the area of Lake Karakul, (b) annual statistical change curves of the area of Lake Karakul.
3.2. Variation in Surface Elevation of Lake Karakul
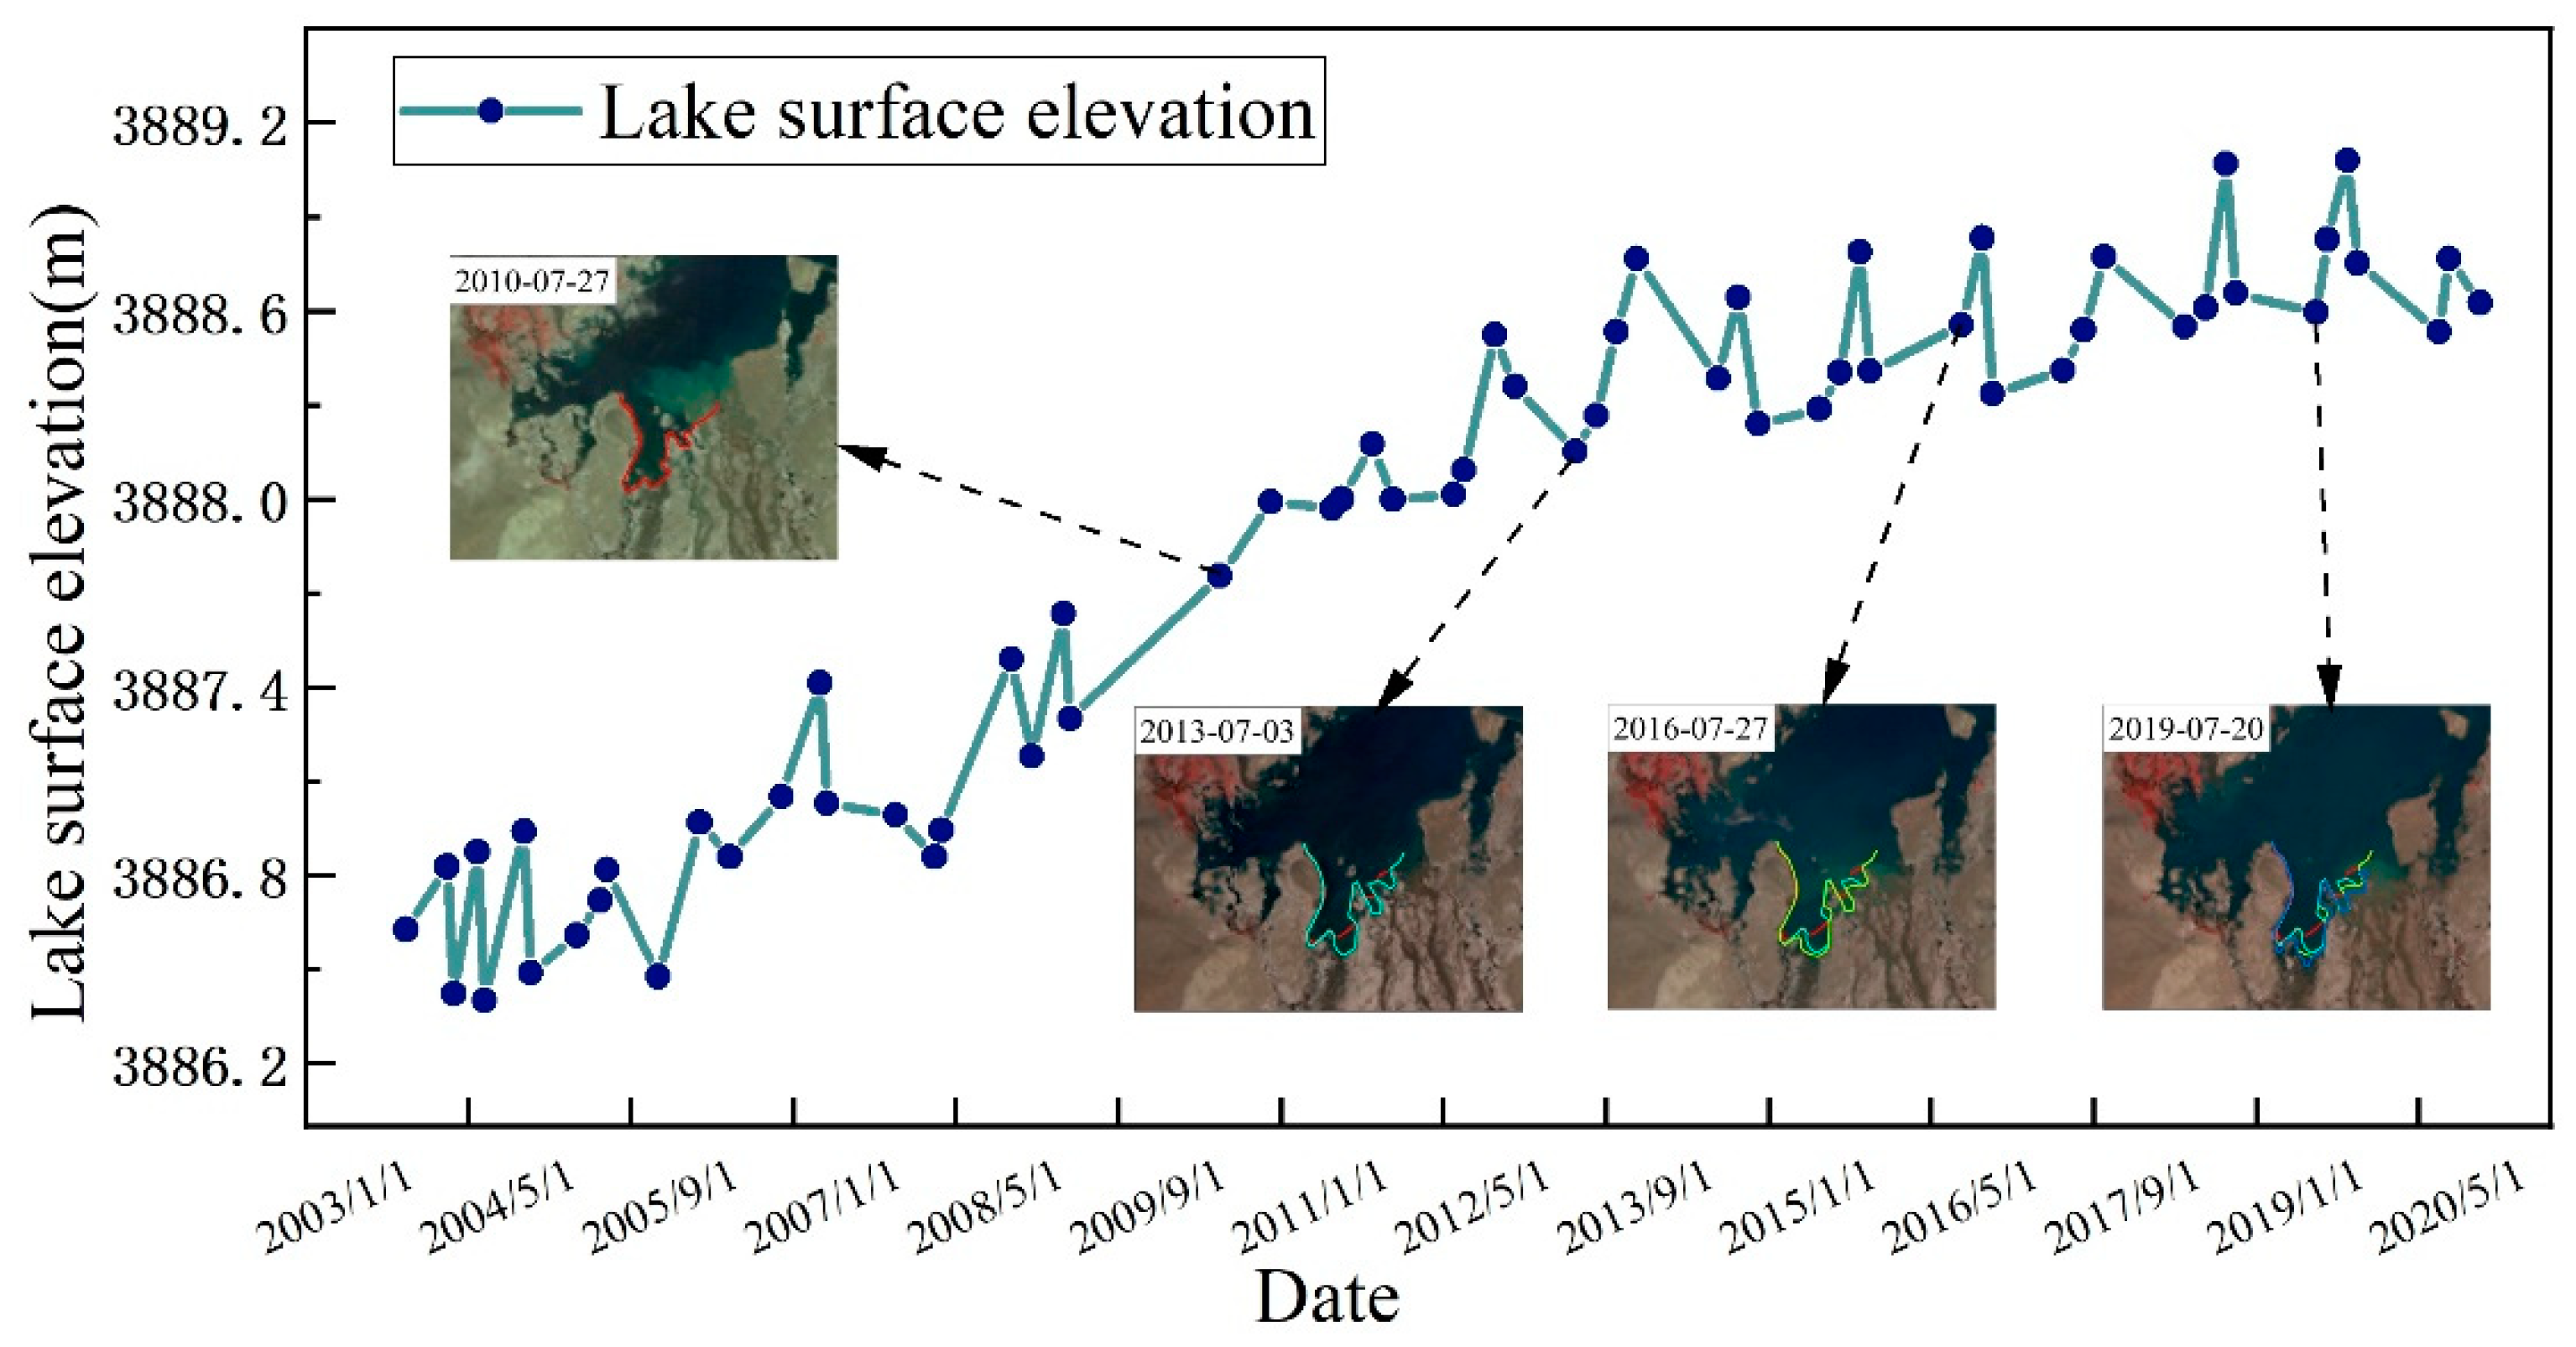
In this paper, a time series of lake surface elevation of Lake Karakul from 2003 to 2021 was built based on satellite altimetry data. As shown in Figure 3, the surface elevation of Lake Karakul generally had an increasing trend, from 3886.627 m in 2003 to 3888.627 m in 2020; the rate of variation was about 0.11 m/year. Color remote sensing imagery in the figure plotted the lake boundaries of Lake Karakul for the same seasons on 27 July 2010 (red curve), 23 July 2013 (cyan curve), 27 July 2016 (green curve), and 20 July 2019 (blue curve), demonstrating the fact that the boundaries of Lake Karakul were expanded outwards and the lake increased in size. The surface elevation of the lake had a decreasing trend in 2004, 2014, 2017, and 2020; the rate of decrease was 0.47 m, 0.12 m, 0.06, and 0.32 m, respectively. In summary, the surface elevation of Lake Karakul fluctuates with an increasing trend from 2003 to 2020.
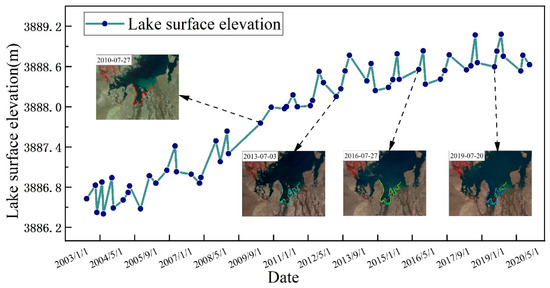
Figure 3.
Curve of surface elevation variation of Lake Karakul, 2003–2020.
3.3. Variation in the Volume of Water in Lake Karakul
In this study, the variation in relative volume in Karakul Lake between 2003 and 2020 was estimated based on the relative volume formula. As shown in Figure 4, the volume of water in Lake Karakul accumulated was 0.817 km3 from 2003 to 2020; the average annual rate of accumulation was 0.059 km3/year. The lake was mainly accumulated during the study period, and water deficits occurred only in four time periods: 2004–2005, 2007–2008, 2013–2014, and 2019–2020; the deficit was −0.003 km3, −0.011 km3, −0.002 km3 and −0.041 km3, respectively. Additionally, the largest volume loss was in 2019–2020. The stage of significant increase in the accumulated water volume of the lake was 2009–2010, with a variation of 0.164 km3.
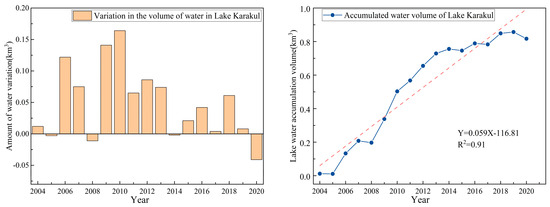
Figure 4.
Changes in the volume of water in Lake Karakul, 2003–2020.
3.4. Characteristics of Intra-Annual Variability in Lake Karakul
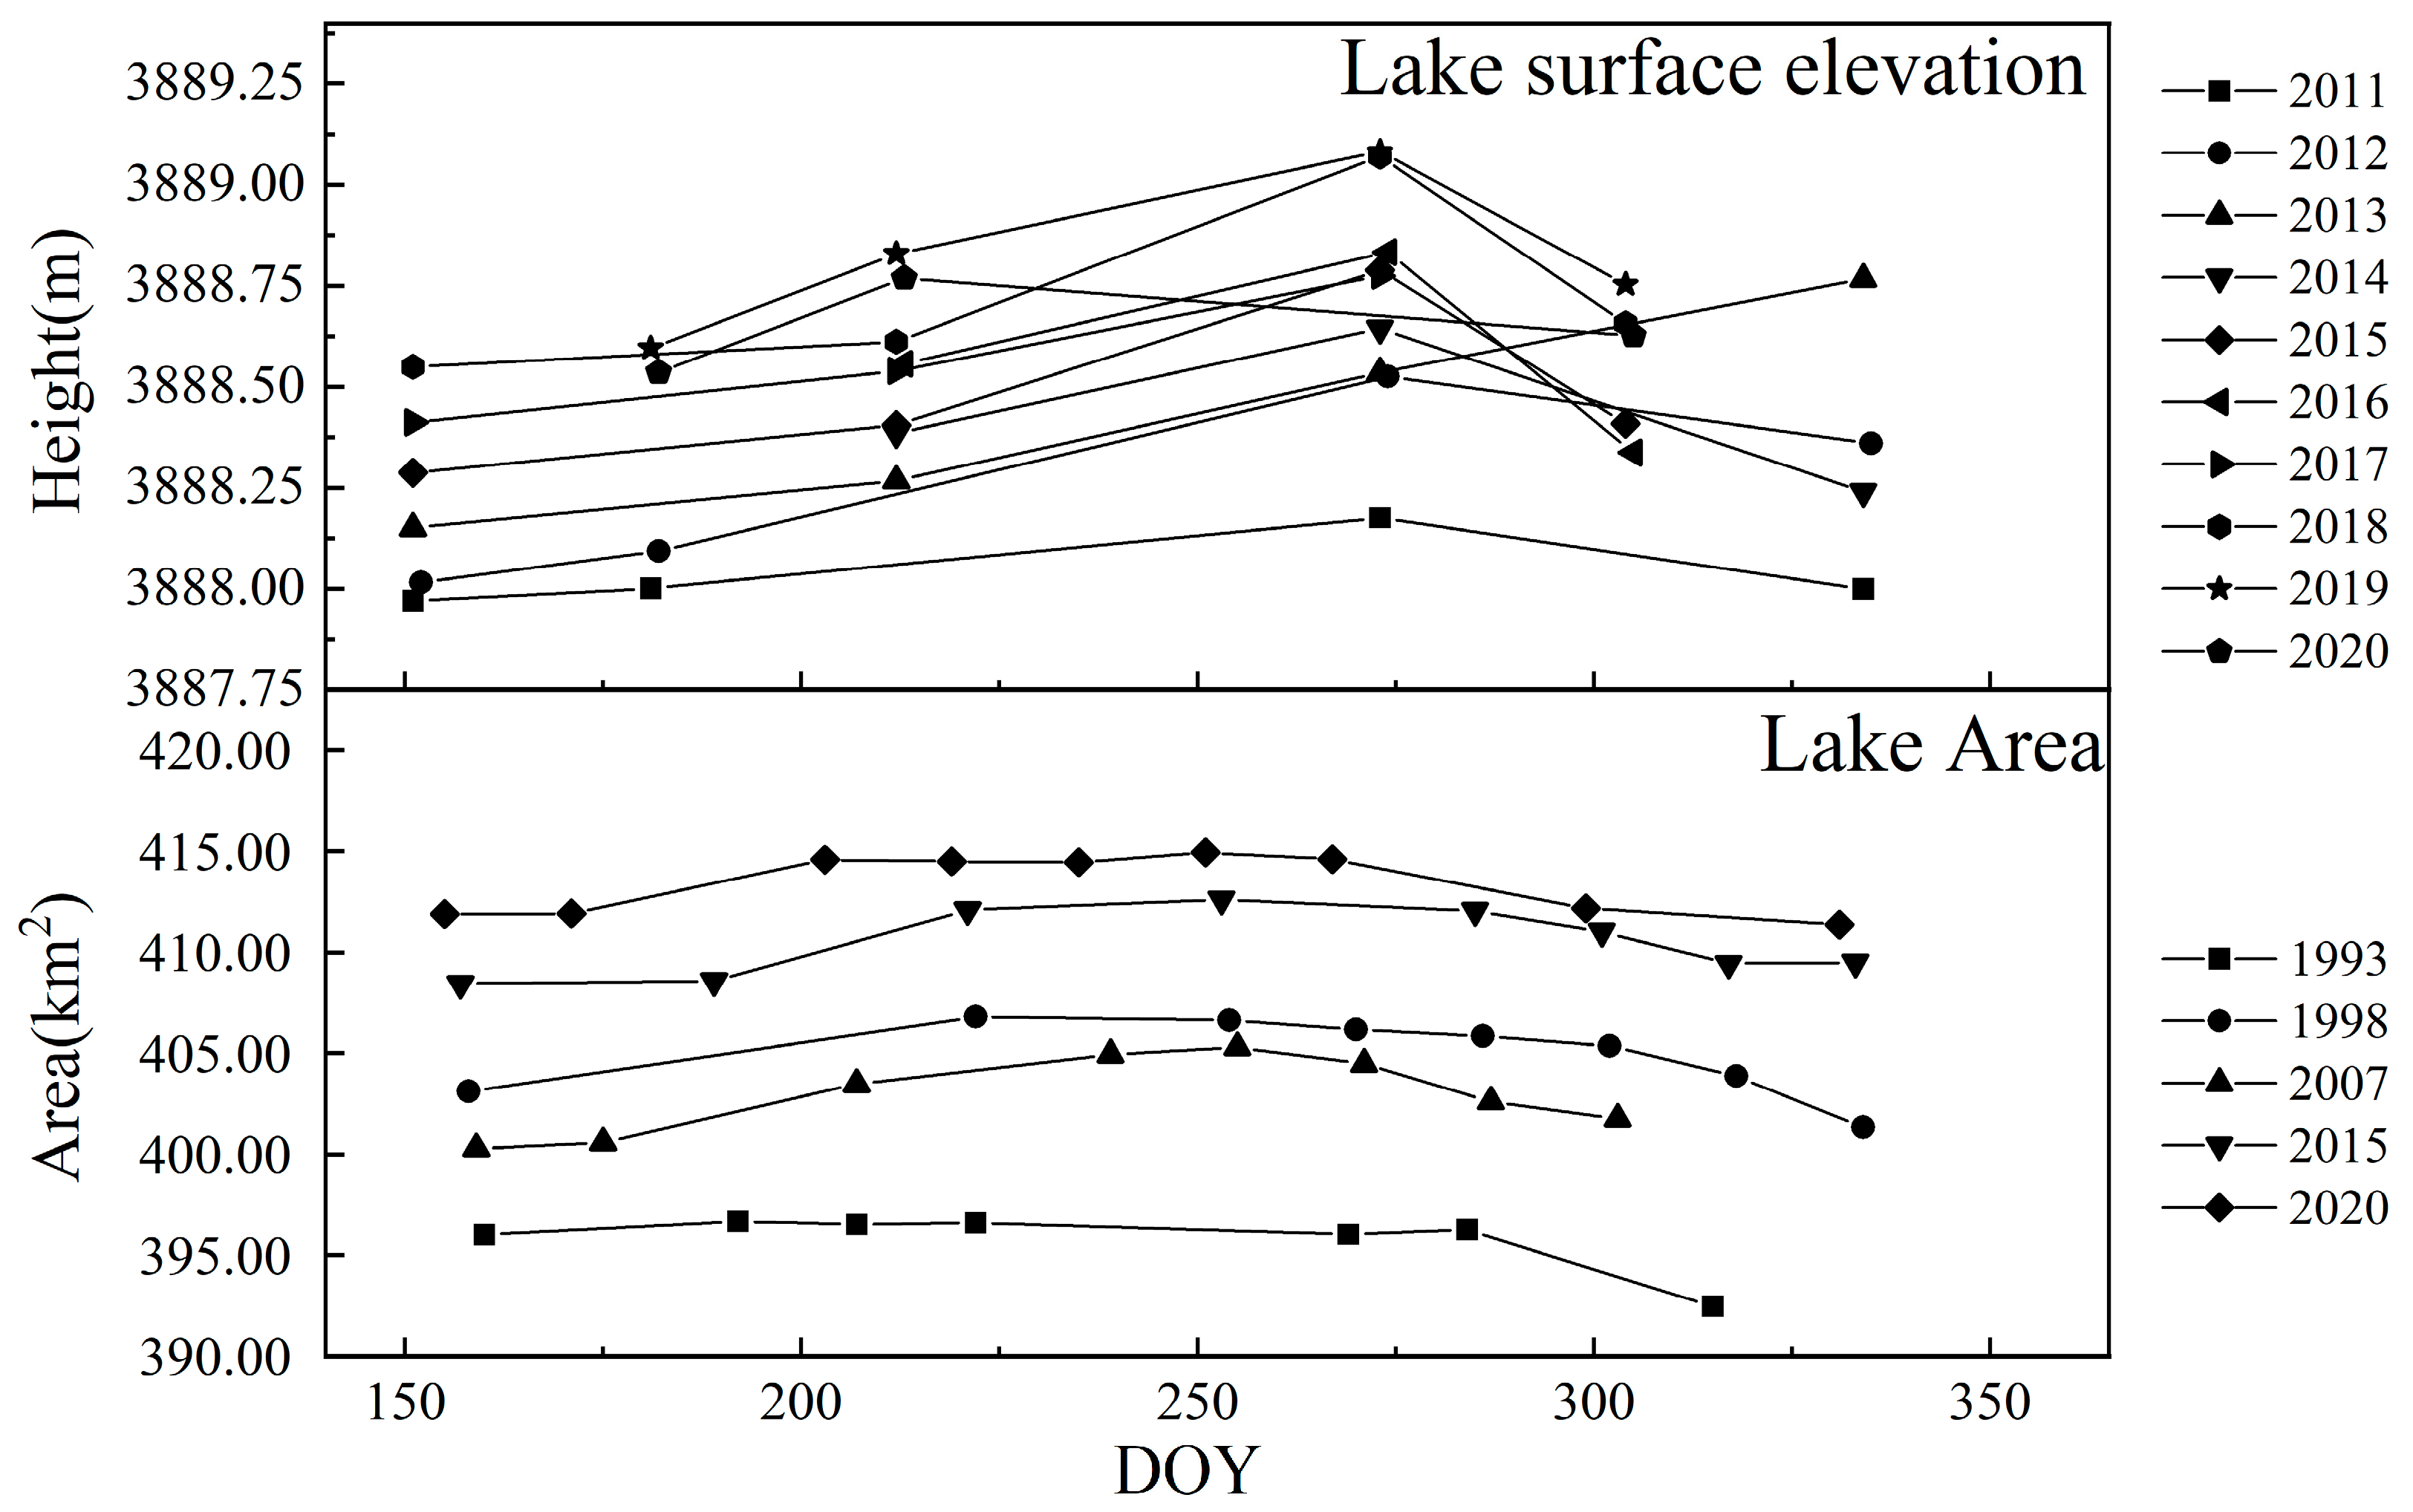
The overall expansion trend of Lake Karakul was observed during 1990 to 2020. In order to further analyze the intra-annual variation pattern of Lake Karakul, the icing status of the lake and selected the lake area data for 1993, 1998, 2007, 2015, 2020 and the lake surface elevation data for 2011–2020 were investigated in this study.
As shown in Figure 5 and Figure 6 the seasonal differences in the lake were not very pronounced, and the lake area and elevation variation curves were relatively flat. Lake Karakul remains in a frozen state from January to May every year, and the surface of the lake is covered by snow and lake ice; from May to October, the lake undergoes water storage, resulting in a rise in both the lake area and water level; from October to December, the lake area and water level are in a decreased state. The seasonal variation of the lake is minor; none of the variations in the lake area exceeds 3 km2, which is less than 0.7% of the total lake area, and none of the variations in lake surface elevation exceeds 1 m.
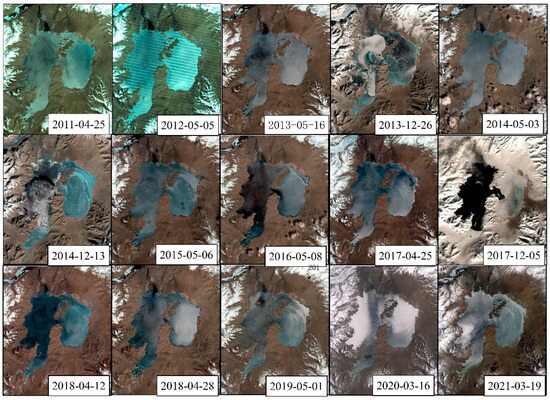
Figure 5.
Diagram of the icing conditions of Lake Karakul.
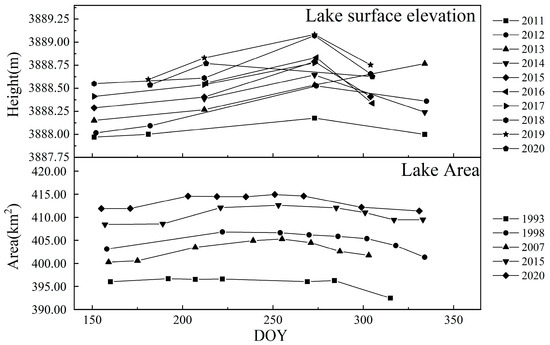
Figure 6.
Curves of lake area and surface elevation variation in Lake Karakul over the years.
3.5. Climate Variability in the Lake Karakul Basin
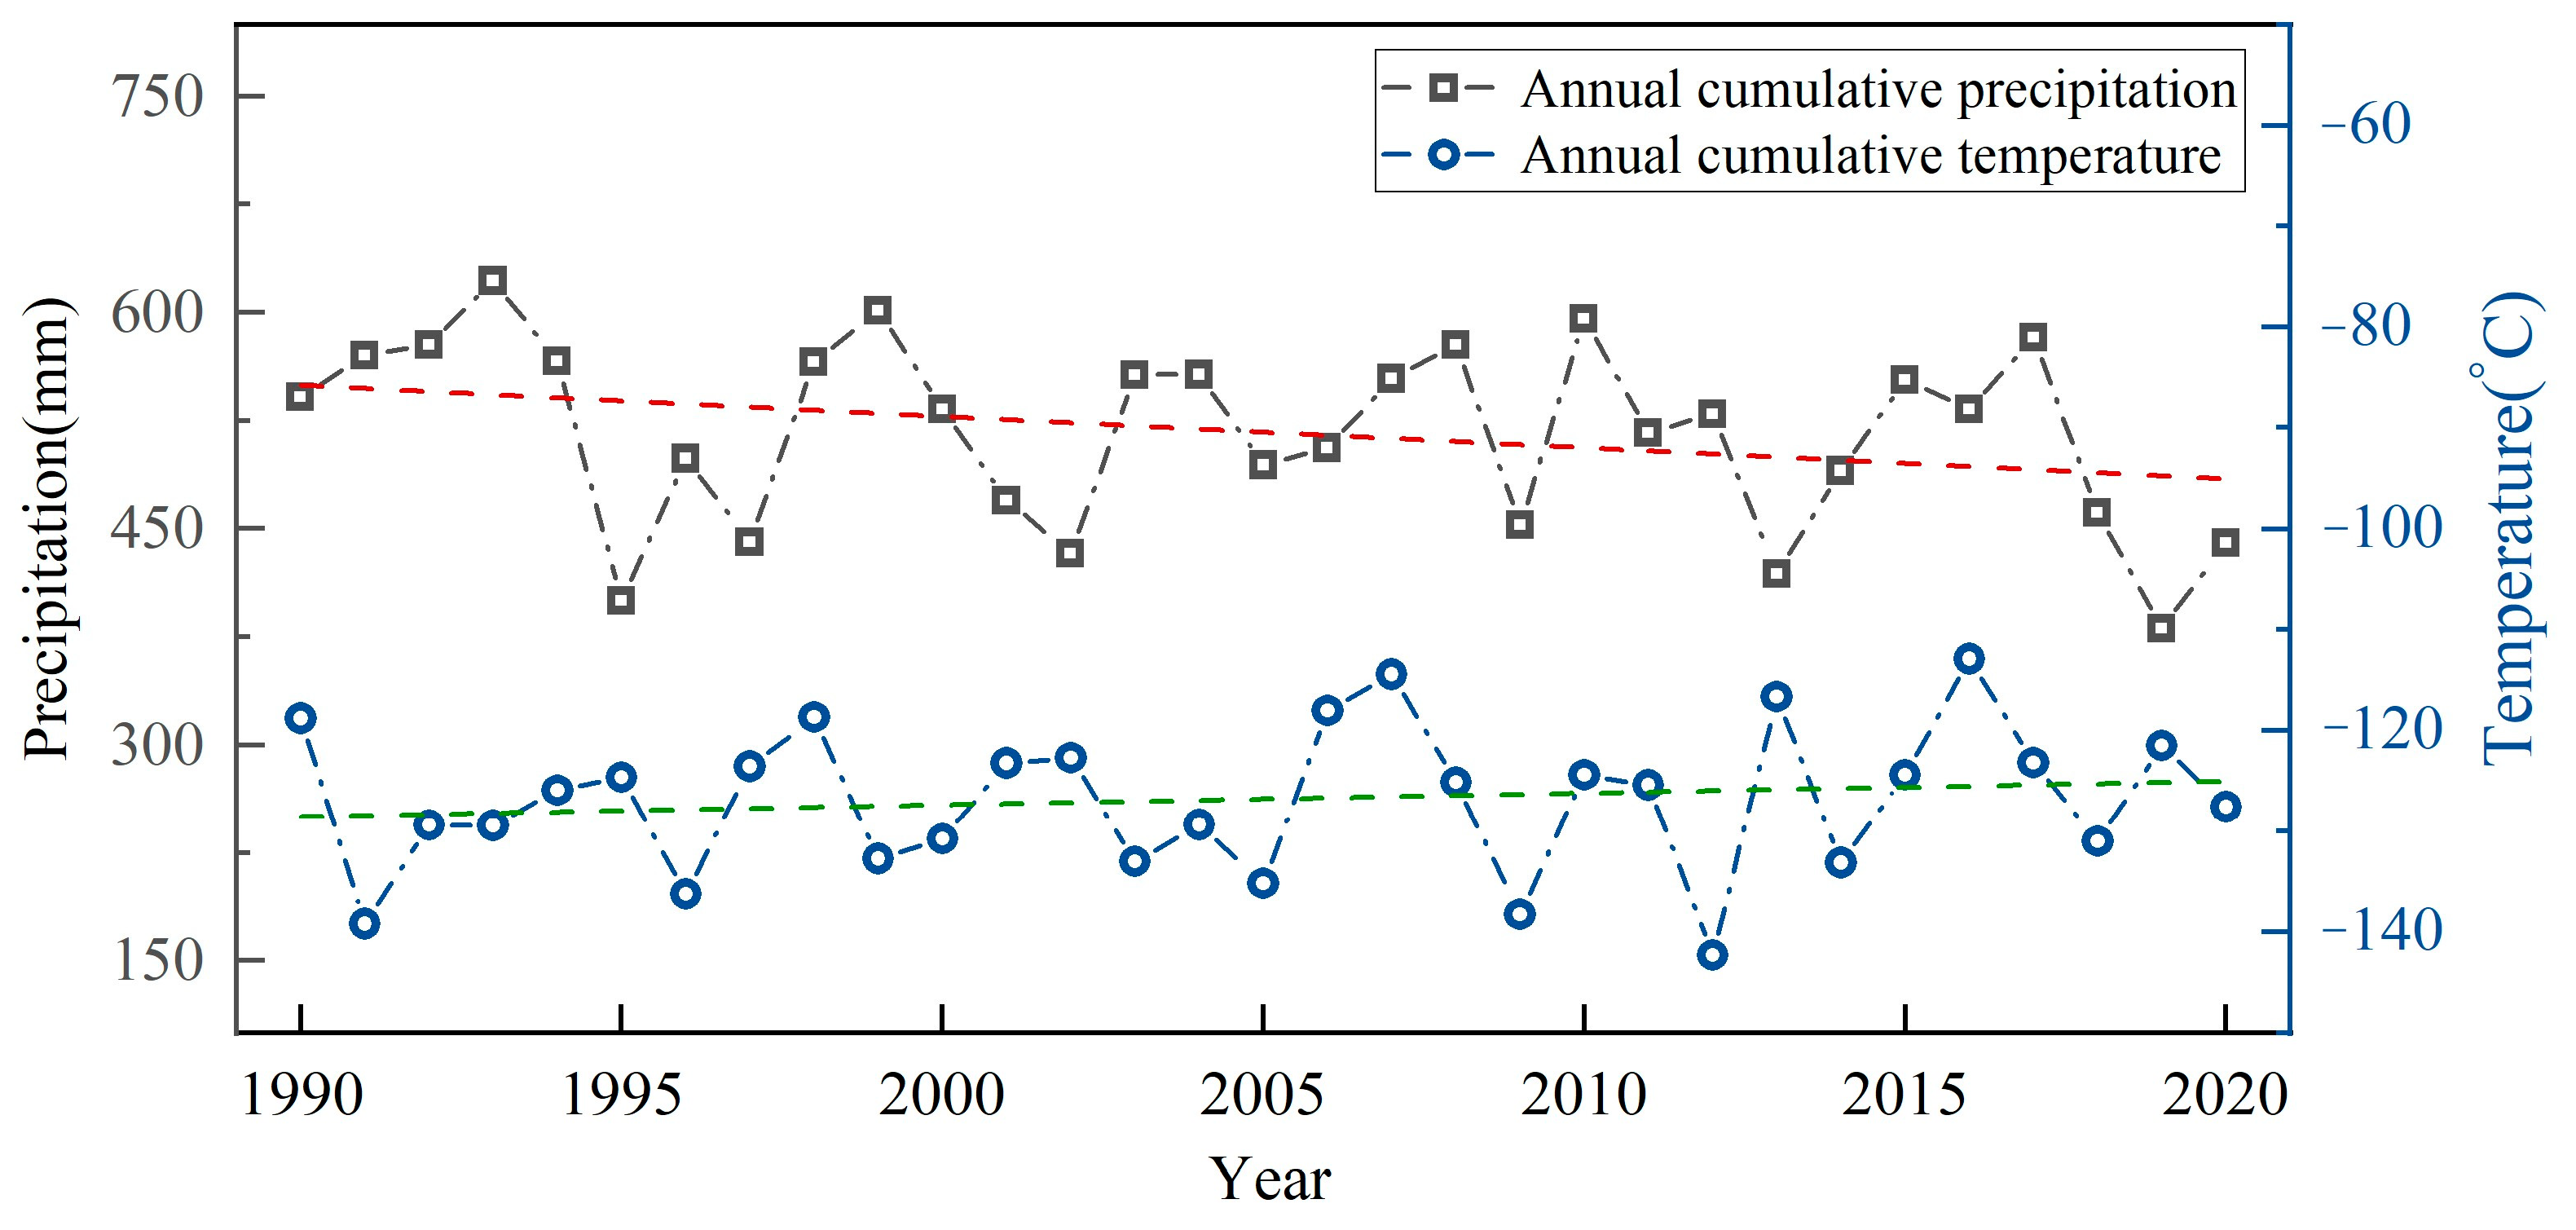
In this study, ERA5 climate data were used to monitor temperature, precipitation and evapotranspiration variations within the Lake Karakul watershed. As shown in Figure 5, the annual cumulative precipitation in the basin where the lake is located showed a decreasing trend from 541.23 mm in 1990 to 440.27 mm in 2020; the average annual rate of variation was −3.37 mm/year. The year with the highest cumulative precipitation was 1993, which amounted to 622.04 mm; the year with the least cumulative precipitation was 2019 at 380.94 mm. The temperature of the Karakul Lake basin was in a state of slow fluctuation and increased from 1990 to 2020. The annual cumulative temperature of the basin increased from −139.18 °C in 1990 to −127.58 °C in 2020; the average annual rate of variation was 0.38 °C/year. One of the highest annual cumulative temperatures was in 2016, reaching −112.86 °C; one of the lowest annual cumulative temperatures was in 2012, when the cumulative temperature reached −142.32 °C.
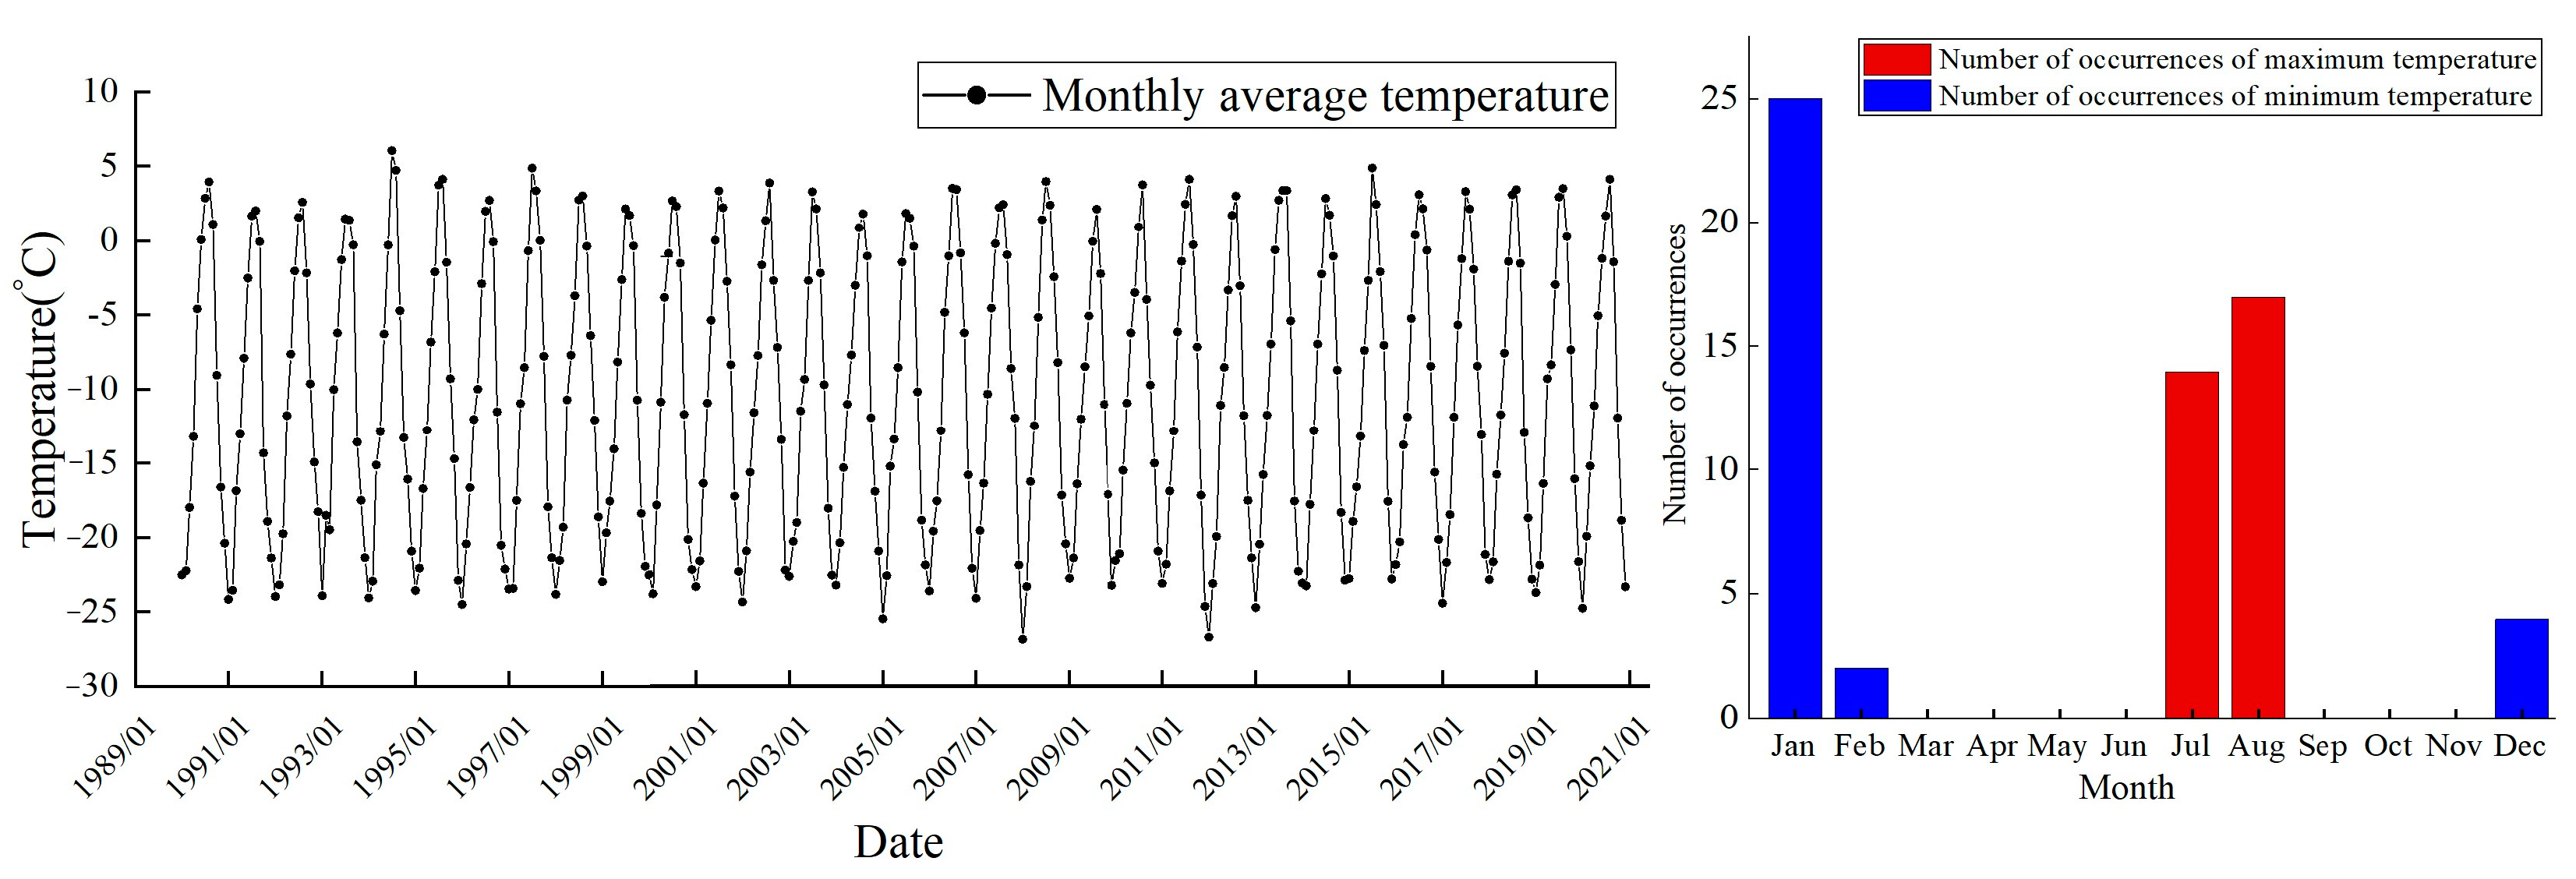
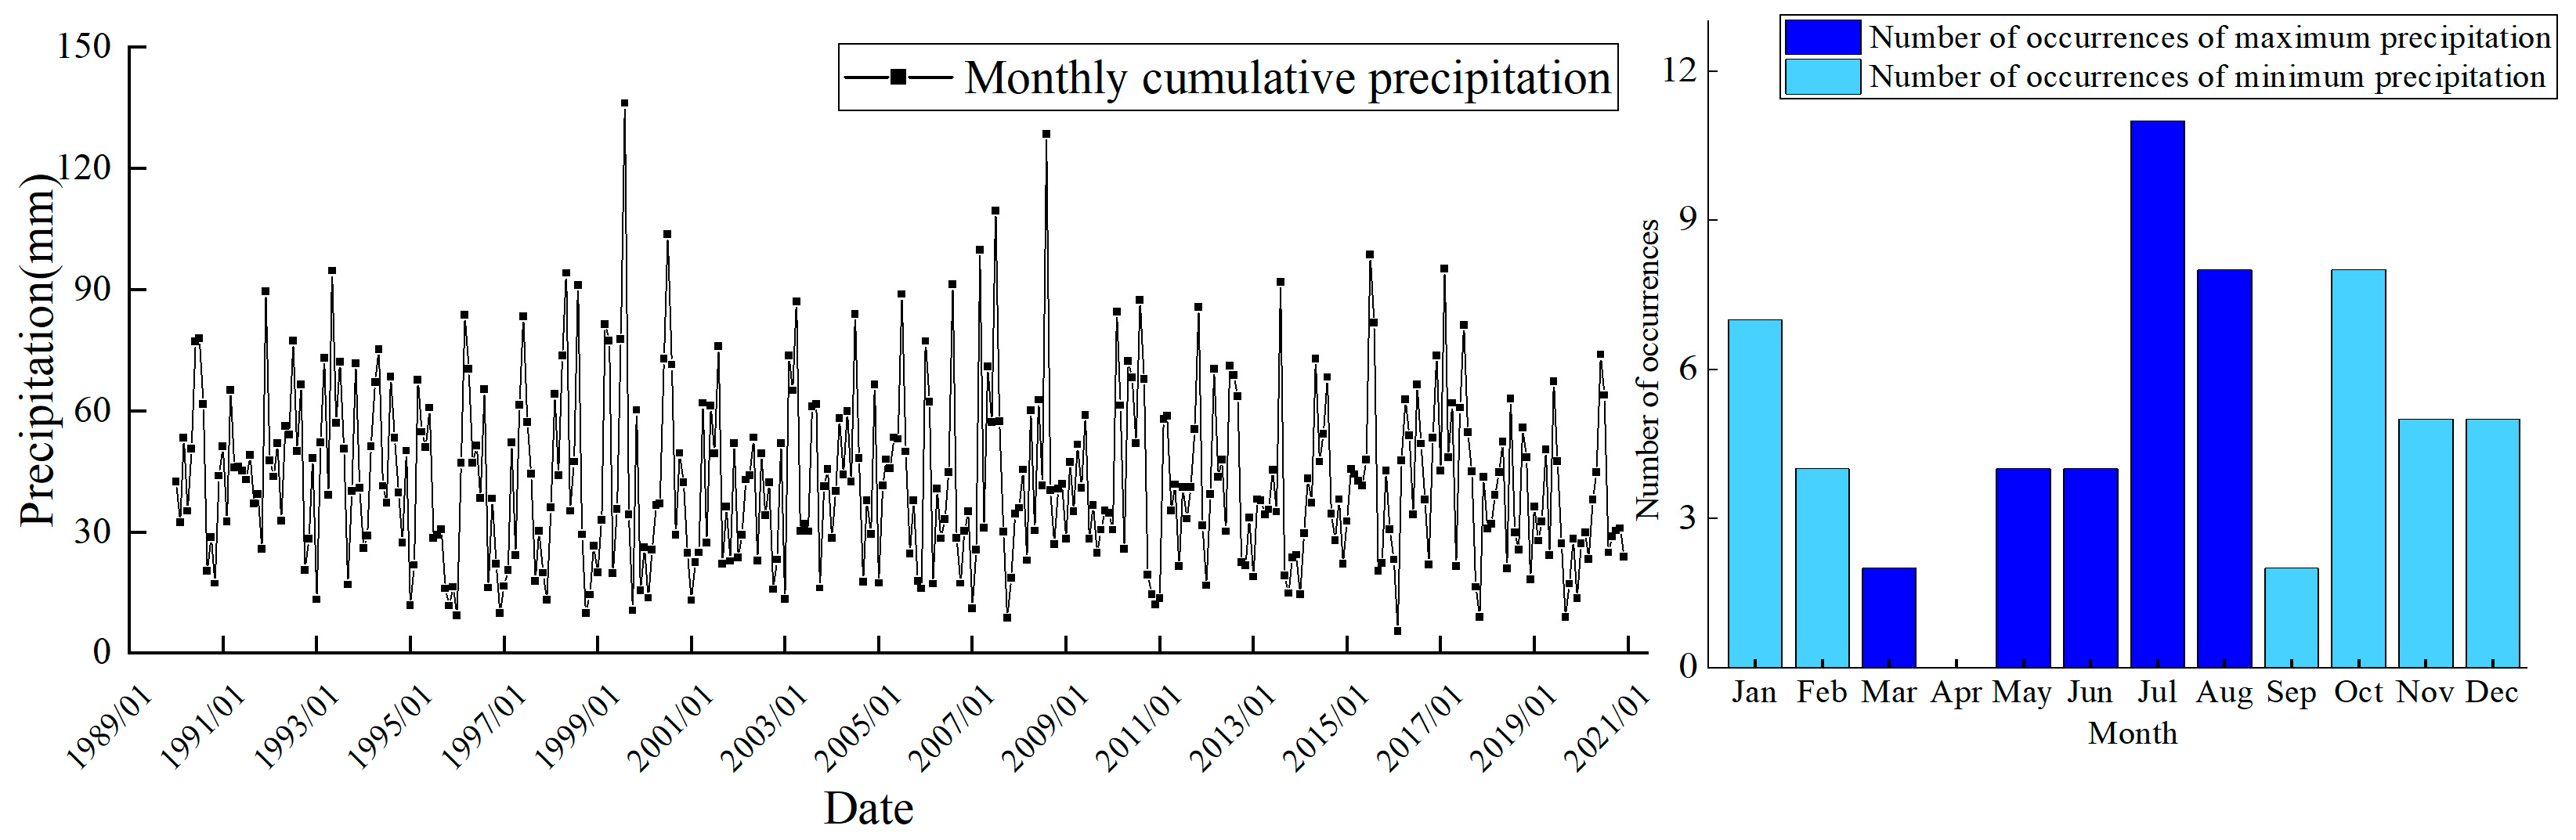
As shown in Figure 6, Figure 7, Figure 8 and Figure 9, in the Lake Karakul basin, precipitation is mainly concentrated in July–October each year, but even in the months when precipitation is concentrated, the total monthly precipitation is only about 70 mm; monthly cumulative precipitation exceeded 100 mm only in August 1999, July 2007 and August 2008. The annual maximum temperature in the Lake Karakul basin reached only about 5 °C and was concentrated in July or August each year; the annual minimum temperature reached −25 °C and was concentrated in December, January and February each year.

Figure 7.
Variation curves of accumulated precipitation and accumulated temperature in the Lake Karakul basin(The dotted line is the trend line).

Figure 8.
Temperature profiles and monthly distribution of temperature extremes in the Lake Karakul Basin.
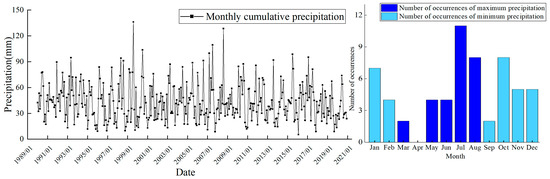
Figure 9.
Precipitation variability curves and monthly distribution of precipitation extremes in the Lake Karakul Basin.
Table 1 shows the climate change for various time periods in the Lake Karakul watershed. There was an overall increase in temperature within the Lake Karakul basin from 1990 to 2020; the average temperature distance from 1990 to 2005 was negative, indicating colder temperatures during that time period, and its average cumulative temperature increased significantly between 2006 and 2020 relative to this time period. In terms of precipitation in the basin, cumulative precipitation in the lake basin was in a state of decline, with the precipitation distance level decreasing from 29.39 mm in the period 1990–1995 to −37.28 mm in the period 2016–2020. During this process, the annual cumulative precipitation had been declining, except for the period 2006–2010, when precipitation rebounded. In general, as a whole, the climate of the Lake Karakul basin is moving in the direction of dry heat.

Table 1.
Climate change table for different time periods in the Lake Karakul basin.
4. Discussion
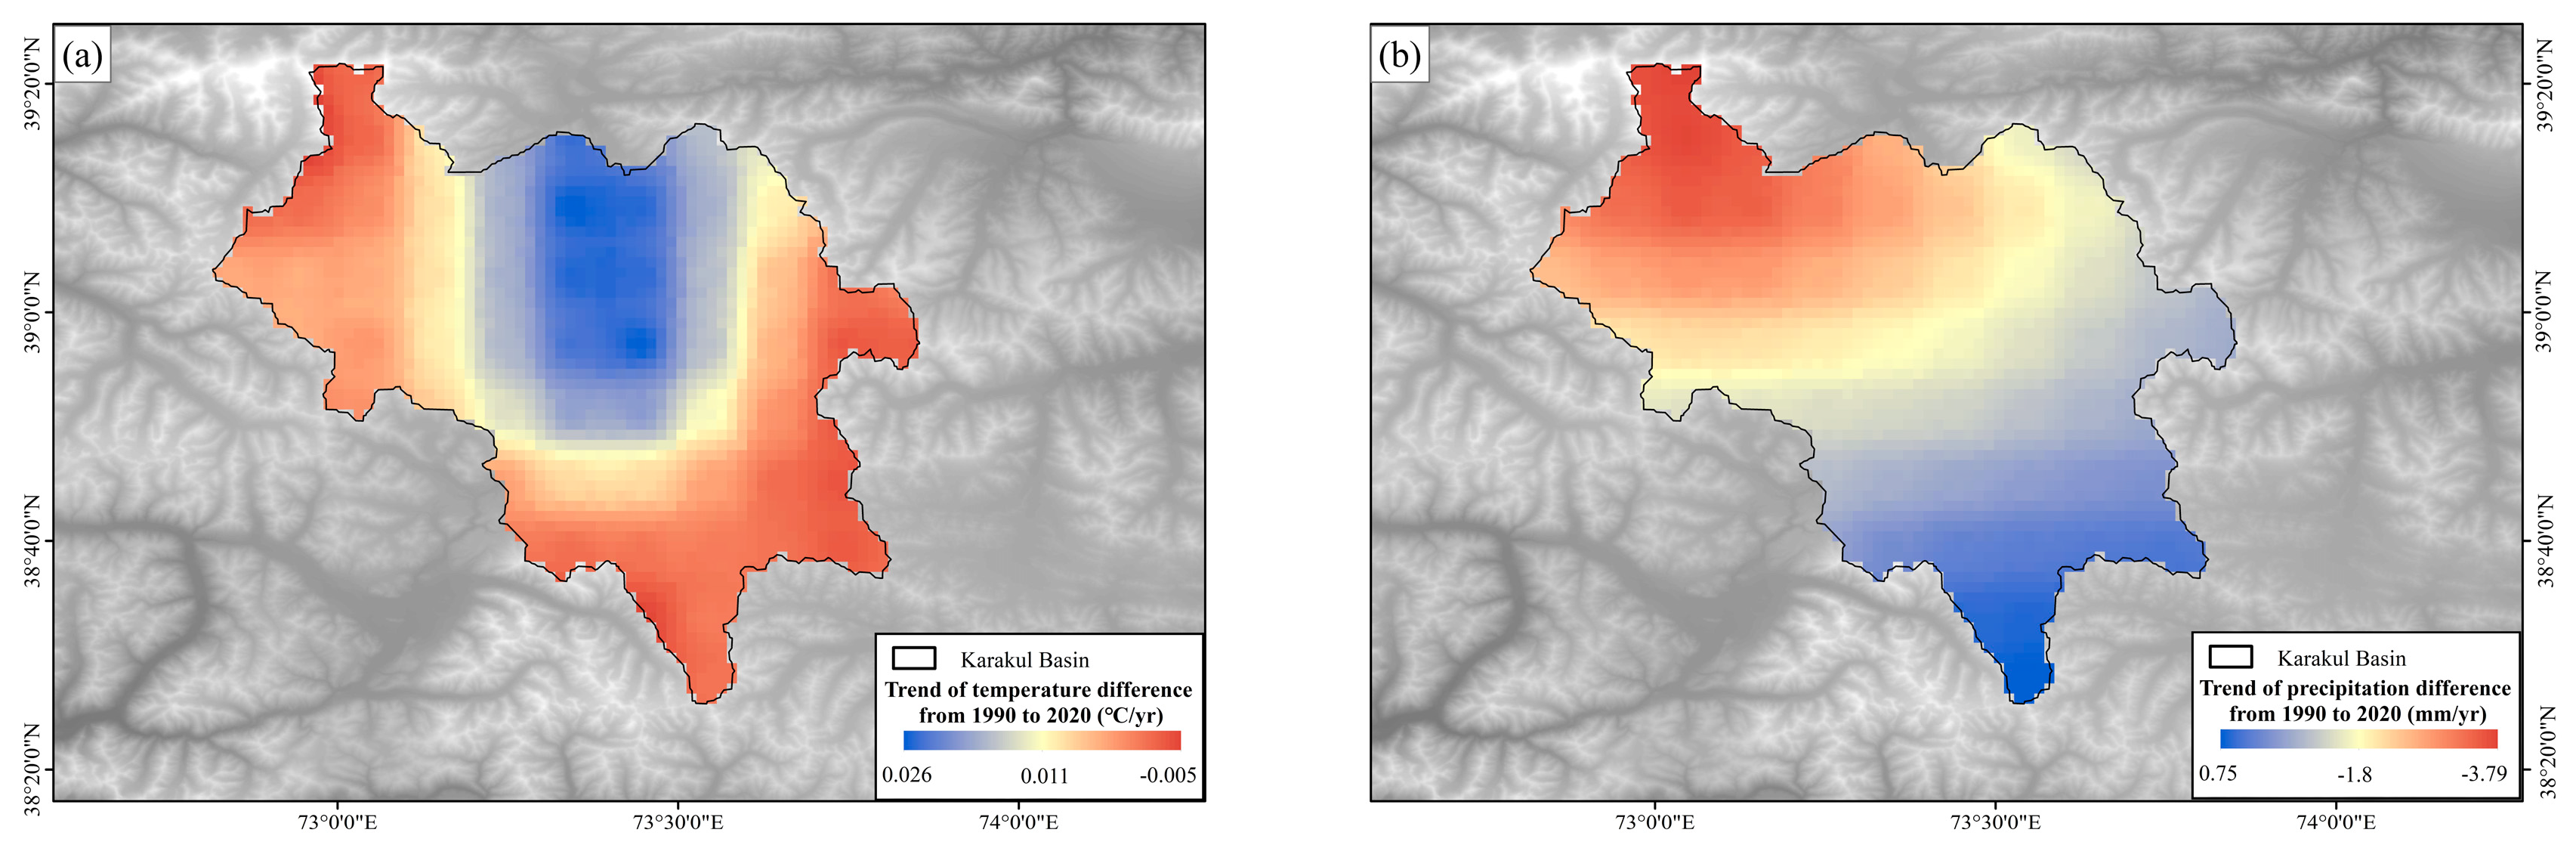
The interaction and influence among lakes, their respective watersheds, climate, topography, human activities and other factors significantly impact the monitoring indicators of lakes, including their area, level and volume. Analysis of the primary drivers of variations in the lakes is crucial for facilitating lake monitoring and predicting future trends [37,38,39]. In this paper, ERA5 data were processed using SLOPE trend analysis to analyze the temperature and precipitation trends around the Lake Karakul basin from 1990 to 2020. As shown in Figure 10, the overall temperature around Lake Karakul basin showed an increasing trend from 1990 to 2020, and the trend of temperature variation around the lake reached +0.026 °C/year. Most of the areas in the basin showed a decreasing trend in precipitation, with the northeast part of the basin showing the most pronounced decrease in precipitation, and the trend of decreasing reached −3.79 mm/year.
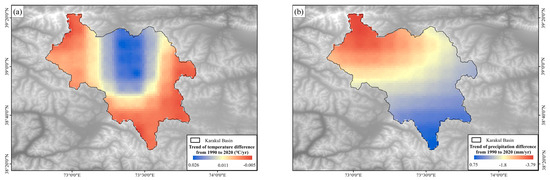
Figure 10.
(a) Spatial distribution of temperature trends within the Lake Karakul basin, 1990–2020. (b) Spatial distribution of precipitation trends within the Lake Karakul basin, 1990–2020. Variation in precipitation and temperature in the Lake Karakul basin, 1990–2020.
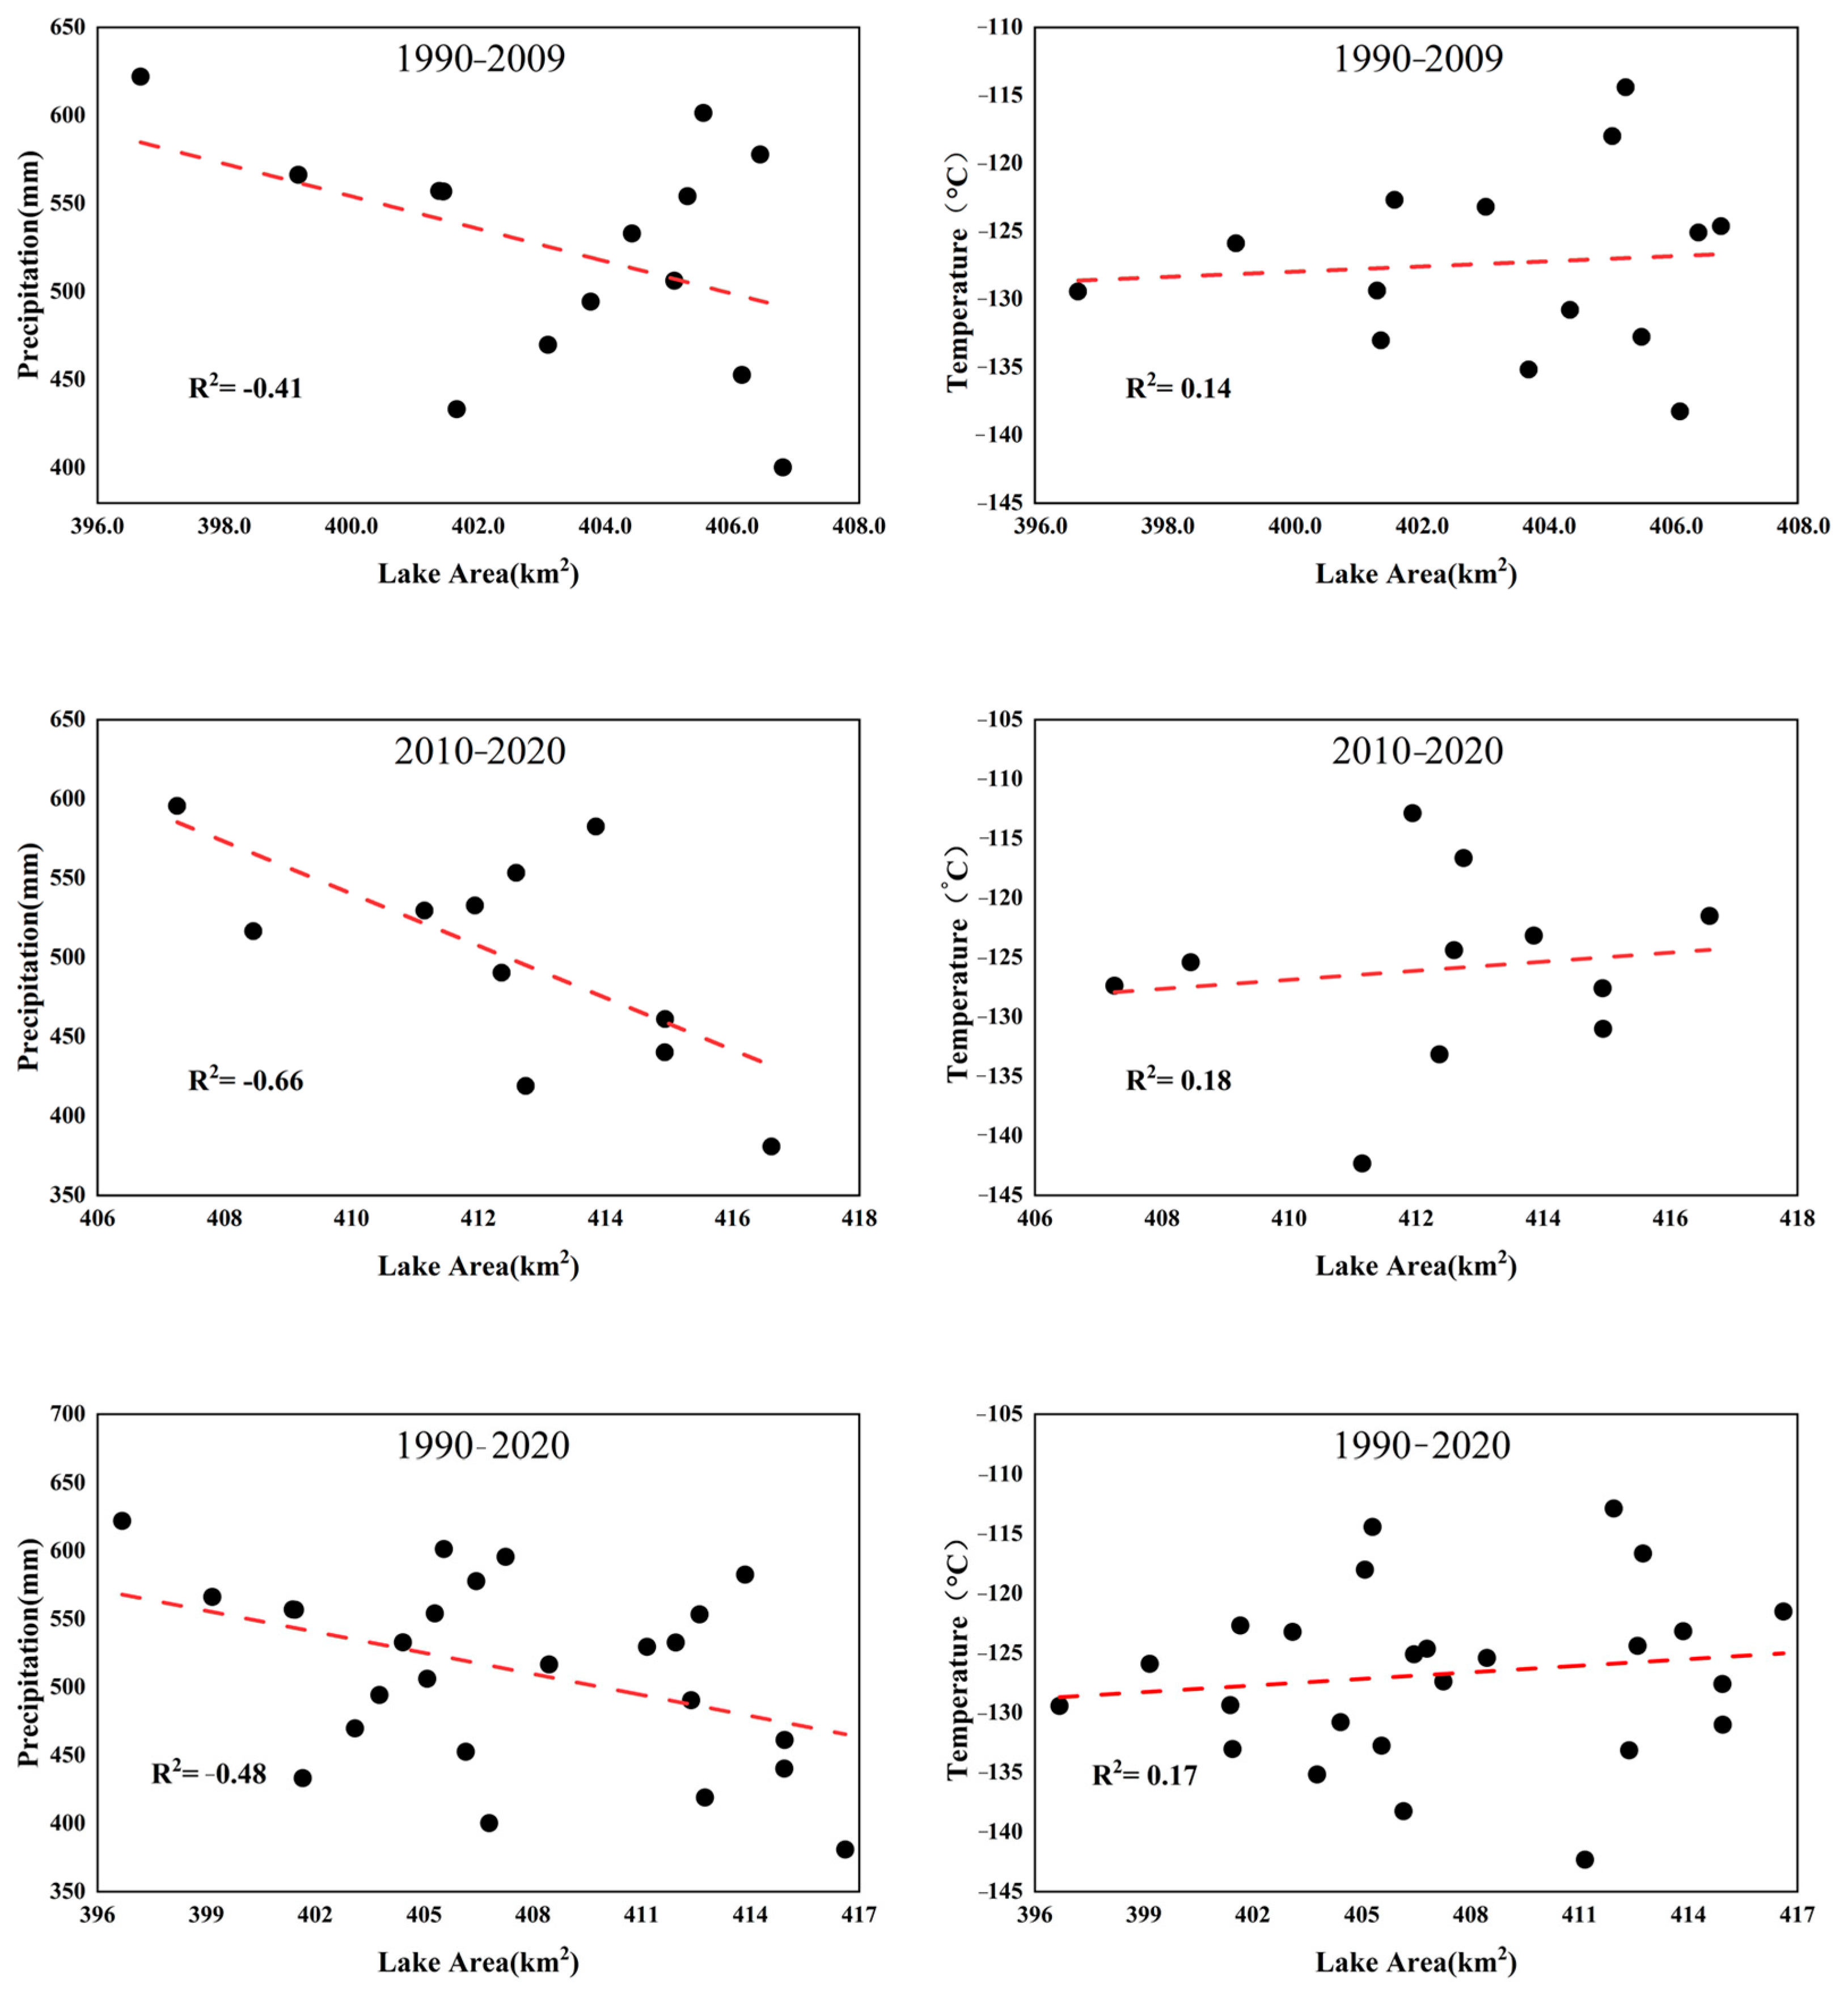
This study analyzed the correlation between climate data and lake area in the Lake Karakul basin, and discussed the primary drivers of variation affecting Lake Karakul. As shown in Figure 11, there was a positive correlation between the area of Lake Karakul and the annual cumulative temperature of the watershed from 1990 to 2009, the correlation coefficient was 0.34, which indicated that the lake area expanded with the increase in temperature in the watershed during this time period. The area of Karakul Lake during the same time period exhibited a negative correlation with precipitation in the watershed; the correlation coefficient was −0.41. This suggested that precipitation had a limited impact on the growth of the lake water volume during this time period. From 2010 to 2020, the area of Lake Karakul exhibited a positive correlation with the temperature in the watershed; the correlation coefficient was 0.18. This indicates that as temperatures increased in the watershed, the lake area expanded. Additionally, the lake area showed a negative correlation with the watershed; the negative correlation coefficient was −0.66, indicating that the precipitation in the watershed contributed less to the increase in the lake water volume during this time period.
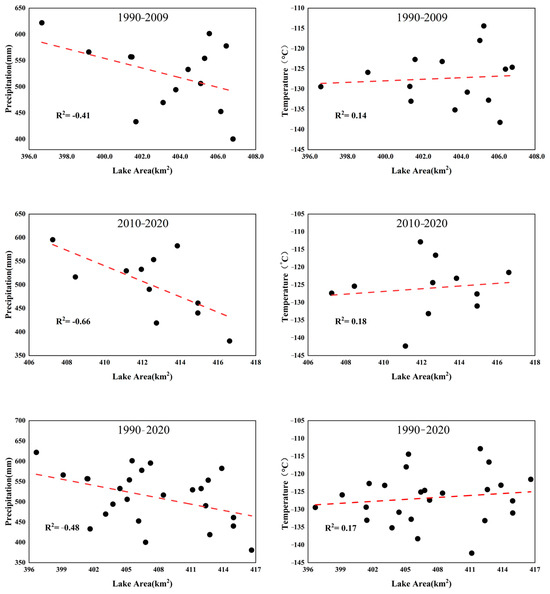
Figure 11.
Correlation between the area of Lake Karakul and the climate of the basin at different time periods.
Analyzed over the entire monitored time frame, Lake Karakul shows a predominantly negative correlation with precipitation within the lake basin. Since precipitation increased water recharge to the lake and played a positive role in variations in lake volume, the negative correlation between the area of Lake Karakul and precipitation within the watershed indicated that precipitation in the watershed had a limited effect on variations in the lake volume. Variations in precipitation within the basin were not a major driver of volume variations in Lake Karakul. Temperature had two effects on alpine lakes: on the one hand, temperature affected the evapotranspiration of lakes, and higher temperatures led to an increase in lake volume loss; on the other hand, temperature affected the melting of glacial ice and snow around the lakes, and higher temperatures promoted the melting of glacial ice and snow which led to an increase in the recharge of the lake water source [40,41,42]. The bidirectional effect of temperature on lakes led to a low correlation between this factor and lake variation characteristics. The positive correlation between temperature and the area of Lake Karakul indicated that the primary effect of temperature on the lake was to promote the melting of glacial ice and snow in the basin of Lake Karakul, resulting in an overall trend of expansion of the lake. The negative correlation between precipitation and lake area within the Lake Karakul basin was strengthened from 1990 to 2020, indicating that the contribution of precipitation to lake area is decreasing; the positive correlation between temperature and lake area within the watershed increased, showing the increasing positive effect of temperature on lake volume. In summary, increased temperatures within the watershed in which the lake was located were the main driver affecting Lake Karakul, an alpine lake in Central Asia.
To further identify the primary drivers of variation in Lake Karakul, this study analyzed variations in evapotranspiration and glacier area within the Lake Karakul watershed. The evapotranspiration data were obtained from the ERA5 dataset, and the glacier boundaries were obtained by interpreting remotely sensed imagery within the basin. Since snow would affect the work of glacier boundary extraction and cause misjudgment, this paper chose remote sensing images in August and September when selecting images for the study, and the glacier was in a stage of ablation in this period, which can reduce the error of the glacier extent extraction work to a certain extent. Cloud cover also affected the extraction of glacier extent, so to improve the accuracy of glacier boundary extraction, the remote sensing images of different years were compared, and the image with the least impact of cloud cover on the glacier boundary extraction was selected for the study, and the glacier extent obtained was more accurate.
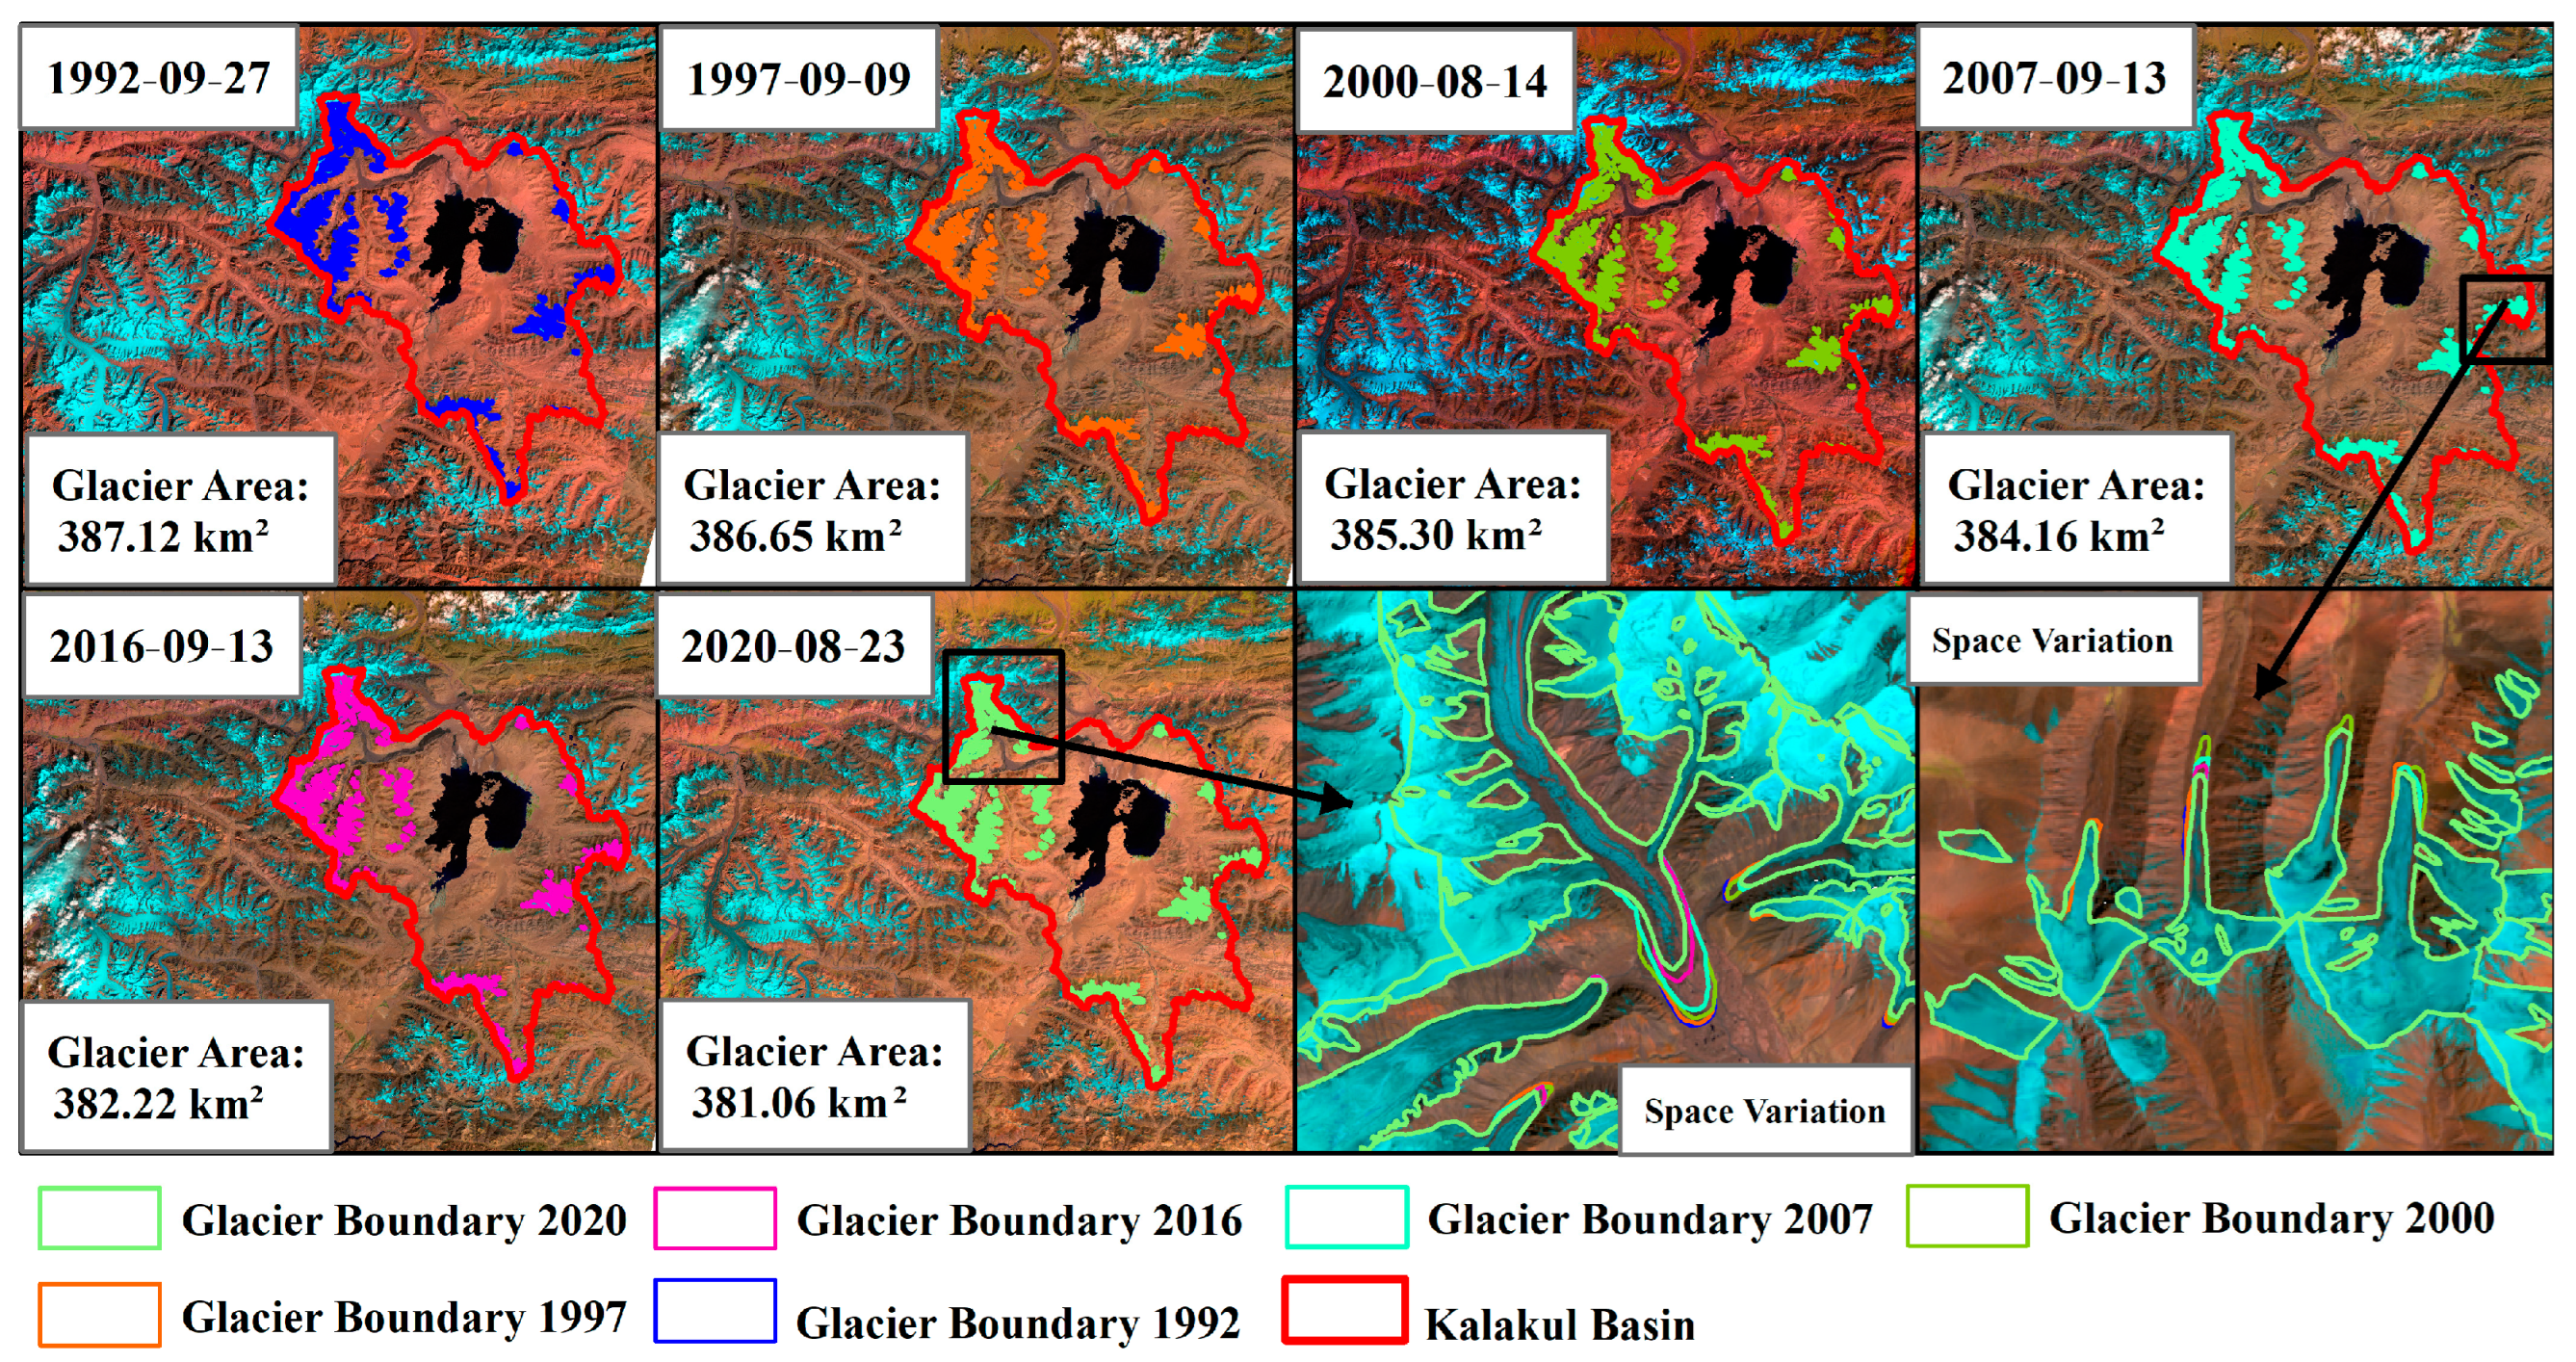
As shown in Figure 12, the glaciers within the basin of Lake Karakul showed an overall retreat trend. From 1992 to 2020, the end of the glacier ice tongue has been in retreat. The area covered by the glacier declined from 387.12 km2 in 1992 to 381.06 km2 in 2020; the average annual rate of variation was 0.22 km2/year, which indicates that the glacier in the Lake Karakul basin is continuously ablating. As shown in Figure 13, the average evapotranspiration in the Lake Karakul basin was in a trend of increasing fluctuation from 1990 to 2020; the average evapotranspiration for several years was 69 mm, and the rate of variation was 4.3 mm/10 year. Analyzing the overall variation in the Lake Karakul basin in conjunction with Chapter discussions evapotranspiration fluctuated and increased in the basin from 1990 to 2020, which coincided with the trend of gradually increasing temperatures and decreasing precipitation in the basin. Glaciers in the basin were on a decreasing trend, and this trend increased the amount of surface runoff recharge received by Lake Karakul.
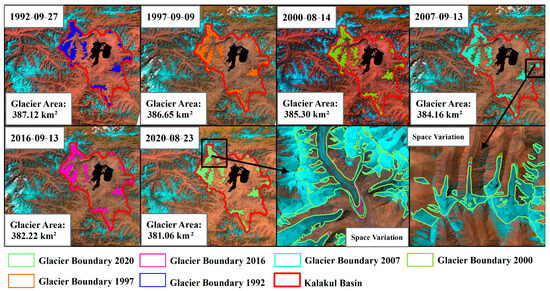
Figure 12.
Variation in glacier coverage in the Lake Karakul Basin, 1992–2020.
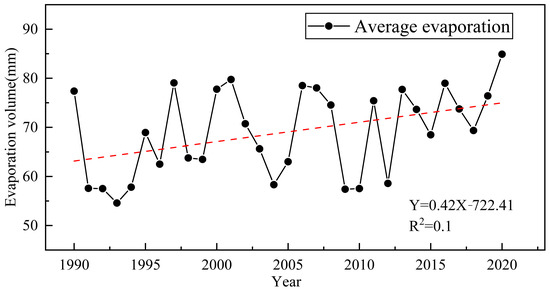
Figure 13.
Curve of mean annual evapotranspiration in the Lake Karakul basin, 1990–2020.
Based on the timeframe of water volume variations in Lake Karakul and glacier area monitoring time points monitored in this study, variations in lake water volume, variations in glacier area coverage in the basin, and variations in average annual evapotranspiration in the basin during the three time periods of 2004–2007, 2007–2016, and 2016–2020 were analyzed, and the results are shown in Table 2. In 2004–2007, the glacier area in the basin where Lake Karakul is located retreated by 1.14 km2; the volume of water in the lake accumulated by 0.208 km3, and the average multi-year evaporation was 64.46 mm. In 2007–2016, the glacier area in the watershed retreated by 1.19 km2; the lake water volume accumulated by 0.58 km3, and the average multi-year evaporation was 67.91 mm. In 2016–2020, the glacier area in the watershed retreated by 1.16 km2; the lake water volume accumulated by 0.03 km3, and the average multi-year evaporation was 76.09 mm. The volume of water in Lake Karakul has increased with the melting of glaciers in the watershed, and the increase in evaporation in the watershed has not prevented the expansion of Lake Karakul. It is noteworthy that in 2019–2020, a large water volume loss was observed in Karakul Lake, with a lake water volume loss of 0.164 km3, which contributed to the smaller accumulation of water in the lake in 2016–2020 in Table 2. Whether the loss of water from Lake Karakul was a short-term fluctuation in lake variation or a long-term trend needs to be monitored further.
Table 2.
Variations in glacier area, mean evapotranspiration and lake water volume in the Lake Karakul basin over different time periods.
In summary, the contribution of glacier melt to lake water accumulation within the Karakul Lake basin was stronger than the depletion of lake water by evapotranspiration, and in combination with the correlation relationship between temperature, precipitation and the lake demonstrated in Figure 11 of this paper, it illustrated that the increase in snow, ice, and glacier melt caused by warmer temperatures was the main driver of variations affecting Karakul Lake.
5. Conclusions
In this study, based on multi-source remote sensing data, we established a monitoring process for unmeasured lakes in the alpines of Central Asia, reconstructed the variation curve of the area and the variation curve of the surface elevation of Lake Karakul using optical image data and satellite altimetry data. We established the variation curve of the relative volume of water of Lake Karakul from 2003 to 2020 based on the formula of volume variation. Meanwhile, this study analyzed the meteorological variation within the study lake basin based on ERA5 remotely sensed meteorological reanalysis data, and analyzed the main drivers of lake variation in relation to glacier cover in the basin. This study provides data support for the study of lake water quantity changes and drivers in Central Asia.
The results of the study showed that the area of Lake Karakul showed an overall increasing trend from 1988 to 2020; the surface elevation of the lake showed an overall increasing trend from 2003 to 2020; and the water volume of the lake was in an overall cumulative state from 2003 to 2020. Currently, the trend of Lake Karakul is expansion. The Karakul Lake basin has developed towards dry heat in recent years. Temperature variations within the Lake Karakul basin were the primary drivers of lake variation. The temperature rise in the basin where the lake was located promotes glacier melting in the basin, and glacier covered area in the basin decreased from 387.12 km2 in 1992 to 381.06 km2 in 2020, which was in line with the variation in the relative water volume of the lake; the ice ablation runoff brought by the temperature rise was stronger than the lake water volume loss caused by evapotranspiration from the lake, resulting in the expansion of Lake Karakul from 1990 to 2020.
The results of this study will help to improve the study of alpine lakes in Central Asia. Establishing the relationship between temperature, precipitation and glacier area and lake variation trends in the basin where the Central Asian alpine lakes are located will help to establish a perfect lake monitoring system, which can provide effective data support for water resource utilization and disaster prediction. There are some shortcomings in this study, such as the lack of observation of the sedimentation zones of the lake material and the lack of monitoring water variations in other lakes in the region. Further efforts are required to enhance the monitoring of large-scale water variations in alpine lakes in Central Asia.
Author Contributions
Conceptualization, W.D. and J.L.; methodology, J.L.; software, Y.P.; validation, Y.P.; formal analysis, H.C.; investigation, W.D. and Y.P.; resources, W.D. and Y.P.; data curation, Y.P.; writing—original draft preparation, W.D. and Y.P.; writing—review and editing, W.D. and Y.Y., C.C. and Y.P.; visualization, Y.P.; supervision, H.C.; project administration, J.L. and A.B.; funding acquisition, H.C. All authors have read and agreed to the published version of the manuscript.
Funding
This work was supported in part by the Fundamental Research Funds for the Universities of Henan Province under Grant NSFRF220424, in part by the project of Provincial Key Technologies R & D Program of Henan under Grant 222102320306, in part by the National Natural Science Foundation of China under Grant U22A20620, Education Ministry of industry-university cooperative education project under Grant 220802313194658 and 202102245019, in part by Tianshan Talent-Science and Technology Innovation Team under Grant 2022TSYCTD0006, in part by the Third Integrated Scientific Expedition Project in Xinjiang under Grant 2021xjkk1403, in part by Key program of International Cooperation, Bureau of International Cooperation, Chinese Academy of Sciences under Grant 131551KYSB20210030, in part by The Key R&D Program of Xinjiang Uygur Autonomous Region under Grant 2022B03021, in part by The Tianshan Talent Training Program of Xinjiang Uygur Autonomous region under Grant No. 2022TSYCLJ0011. We thank them for their support for this research.
Institutional Review Board Statement
Not applicable.
Informed Consent Statement
Not applicable.
Data Availability Statement
The ICESat-1/GLA14 data presented in this study are openly available in the National Snow & Ice Data Center (NSIDC) at https://nsidc.org/data/glah14/versions/34/ (accessed on 10 April 2023). The CryoSat-2 data presented in this study are openly available in the European Space Agency (ESA) at https://earth.esa.int/eogateway/missions/cryosat/data/ (accessed on 10 April 2023). The Randolph Glacier Inventory (RGI) 6.0 presented in this study are openly available in the Global Land Ice Measurements from Space (GLIMS) website at http://www.glims.org/RGI/ (accessed on 10 April 2023). The fifth generation of ECMWF Atmospheric Reanalysis of Global Climate (ERA5) data presented in this study are openly available in ECMWF at https://cds.climate.copernicus.eu/ (accessed on 10 April 2023).
Acknowledgments
We thank the following agencies for their data that was available online. The NSIDC National Snow & Ice Data Center (https://nsidc.org/); The ESA European Space Agency (https://earth.esa.int/); The GLIMS Global Land Ice Measurement Space (http://www.glims.org/); The ECMWF European Centre for Medium-Range Weather Forecasts (https://cds.climate.copernicus.eu/).
Conflicts of Interest
The authors declare no conflict of interest.
References
- Fang, Y.; Cheng, W.M.; Zhang, Y.C.; Wang, N.; Zhao, S.M.; Zhou, C.H.; Chen, X.; Bao, A.M. Changes in inland lakes on the Tibetan Plateau over the past 40 years. J. Geogr. Sci. 2016, 26, 415–438. [Google Scholar] [CrossRef]
- Zhang, Q.F.; Chen, Y.N.; Li, Z.; Fang, G.H.; Xiang, Y.Y.; Ji, H.P. Why are glacial lakes in the eastern Tianshan Mountains expanding at an accelerated rate? J. Geogr. Sci. 2023, 33, 121–150. [Google Scholar] [CrossRef]
- Ran, Q.W.; Aires, F.; Ciais, P.; Qiu, C.J.; Hu, R.H.; Fu, Z.; Xue, K.; Wang, Y.F. The Status and Influencing Factors of Surface Water Dynamics on the Qinghai-Tibet Plateau During 2000–2020. IEEE Trans. Geosci. Remote Sens. 2023, 61, 4200114. [Google Scholar] [CrossRef]
- Che, X.H.; Feng, M.; Sun, Q.; Sexton, J.O.; Channan, S.; Liu, J.P. The Decrease in Lake Numbers and Areas in Central Asia Investigated Using a Landsat-Derived Water Dataset. Remote Sens. 2021, 13, 1032. [Google Scholar] [CrossRef]
- Ge, Y.X.; Wu, N.; Abuduwaili, J.; Issanova, G. Assessment of spatiotemporal features and potential sources of atmospheric aerosols over the Tianshan Mountains in arid central Asia. Atmos. Environ. 2023, 294, 119502. [Google Scholar] [CrossRef]
- Chen, X.; Jiang, F.; Wang, Y.; Li, Y.; Hu, R. Characteristics of the eco-geographical pattern in arid land of Central Asia. Arid. Zone Res. 2013, 30, 385–390. [Google Scholar]
- Aichner, B.; Makhmudov, Z.; Rajabov, I.; Zhang, Q.; Pausata, F.S.R.; Werner, M.; Heinecke, L.; Kuessner, M.L.; Feakins, S.J.; Sachse, D.; et al. Hydroclimate in the Pamirs Was Driven by Changes in Precipitation-Evaporation Seasonality Since the Last Glacial Period. Geophys. Res. Lett. 2019, 46, 13972–13983. [Google Scholar] [CrossRef]
- Xu, Y.Y.; Lin, J.; Zhao, J.W.; Zhu, X.Y. New method improves extraction accuracy of lake water bodies in Central Asia. J. Hydrol. 2021, 603, 127180. [Google Scholar] [CrossRef]
- Huang, W.J.; Duan, W.L.; Chen, Y.N. Unravelling lake water storage change in Central Asia: Rapid decrease in tail-end lakes and increasing risks to water supply. J. Hydrol. 2022, 614, 128546. [Google Scholar] [CrossRef]
- Han, W.X.; Huang, C.L.; Gu, J.; Hou, J.L.; Zhang, Y.; Wang, W.Z. Water Level Change of Qinghai Lake from ICESat and ICESat-2 Laser Altimetry. Remote Sens. 2022, 14, 6212. [Google Scholar] [CrossRef]
- Chen, J.; Duan, Z. Monitoring Spatial-Temporal Variations of Lake Level in Western China Using ICESat-1 and CryoSat-2 Satellite Altimetry. Remote Sens. 2022, 14, 5709. [Google Scholar] [CrossRef]
- Zhang, M.M.; Chen, F.; Guo, H.D.; Yi, L.; Zeng, J.Y.; Li, B. Glacial Lake Area Changes in High Mountain Asia during 1990–2020 Using Satellite Remote Sensing. Research 2022, 2022, 9821275. [Google Scholar] [CrossRef] [PubMed]
- Li, W.; Xie, X.K.; Li, W.Q.; van der Meijde, M.; Yan, H.W.; Huang, Y.T.; Li, X.T.; Wang, Q.W. Monitoring of Hydrological Resources in Surface Water Change by Satellite Altimetry. Remote Sens. 2022, 14, 4904. [Google Scholar] [CrossRef]
- Wang, Y.; Yao, X.J.; Hu, N.; Sha, T.; Chu, X.D. The Spatiotemporal Change of Xiao Qaidam Lake from 1990 to 2020 and Its Potential Hazards. Sustainability 2022, 14, 11372. [Google Scholar] [CrossRef]
- Wang, J.B.; Wang, J.Y.; Chen, S.D.; Luo, J.B.; Sun, M.Z.; Sun, J.L.; Yuan, J.J.; Guo, J.Y. Study on the Variations in Water Storage in Lake Qinghai Based on Multi-Source Satellite Data. Remote Sens. 2023, 15, 1746. [Google Scholar] [CrossRef]
- Wu, Y.H.; Zhang, X.; Zheng, H.X.; Li, J.S.; Wang, Z.Y. Investigating changes in lake systems in the south-central Tibetan Plateau with multi-source remote sensing. J. Geogr. Sci. 2017, 27, 337–347. [Google Scholar] [CrossRef]
- Zhang, Y.; An, C.B.; Zheng, L.Y.; Liu, L.Y.; Zhang, W.S.; Lu, C.; Zhang, Y.Z. Assessment of lake area in response to climate change at varying elevations: A case study of Mt. Tianshan, Central Asia. Sci. Total Environ. 2023, 869, 161665. [Google Scholar] [CrossRef] [PubMed]
- Wufu, A.; Yang, S.T.; Chen, Y.; Lou, H.Z.; Li, C.J.; Ma, L.G. Estimation of Long-Term River Discharge and Its Changes in Ungauged Watersheds in Pamir Plateau. Remote Sens. 2021, 13, 4043. [Google Scholar] [CrossRef]
- Goerlich, F.; Bolch, T.; Paul, F. More dynamic than expected: An updated survey of surging glaciers in the Pamir. Earth Syst. Sci. Data 2020, 12, 3161–3176. [Google Scholar] [CrossRef]
- Mischke, S.; Lai, Z.P.; Aichner, B.; Heinecke, L.; Mahmoudov, Z.; Kuessner, M.; Herzschuh, U. Radiocarbon and optically stimulated luminescence dating of sediments from Lake Karakul, Tajikistan. Quat. Geochronol. 2017, 41, 51–61. [Google Scholar] [CrossRef]
- Heinecke, L.; Fletcher, W.J.; Mischke, S.; Tian, F.; Herzschuh, U. Vegetation change in the eastern Pamir Mountains, Tajikistan, inferred from Lake Karakul pollen spectra of the last 28 kyr. Palaeogeogr. Palaeoclimatol. Palaeoecol. 2018, 511, 232–242. [Google Scholar] [CrossRef]
- Yan, D.N.; Xu, H.; Lan, J.H.; Zhou, K.G.; Ye, Y.D.; Zhang, J.X.; An, Z.S.; Yeager, K.M. Solar activity and the westerlies dominate decadal hydroclimatic changes over arid Central Asia. Glob. Planet. Change 2019, 173, 53–60. [Google Scholar] [CrossRef]
- Xiang, J.; Li, H.; Zhao, J.Y.; Cai, X.B.; Li, P. Inland water level measurement from spaceborne laser altimetry: Validation and comparison of three missions over the Great Lakes and lower Mississippi River. J. Hydrol. 2021, 597, 126312. [Google Scholar] [CrossRef]
- Lai, Y.R.; Wang, L. Monthly Surface Elevation Changes of the Greenland Ice Sheet From ICESat-1, CryoSat-2, and ICESat-2 Altimetry Missions. IEEE Geosci. Remote Sens. Lett. 2022, 19, 2000305. [Google Scholar] [CrossRef]
- Feng, Y.; Yang, L.K.; Zhan, P.F.; Luo, S.X.; Chen, T.; Liu, K.; Song, C.Q. Synthesis of the ICESat/ICESat-2 and CryoSat-2 observations to reconstruct time series of lake level. Int. J. Digit. Earth 2023, 16, 183–209. [Google Scholar] [CrossRef]
- Wang, F.; Bamber, J.L.; Cheng, X. Accuracy and Performance of CryoSat-2 SARIn Mode Data Over Antarctica. IEEE Geosci. Remote Sens. Lett. 2015, 12, 1516–1520. [Google Scholar] [CrossRef]
- Jiang, L.G.; Nielsen, K.; Andersen, O.B.; Bauer-Gottwein, P. Monitoring recent lake level variations on the Tibetan Plateau using CryoSat-2 SARIn mode data. J. Hydrol. 2017, 544, 109–124. [Google Scholar] [CrossRef]
- Meloni, M.; Bouffard, J.; Parrinello, T.; Dawson, G.; Garnier, F.; Helm, V.; Di Bella, A.; Hendricks, S.; Ricker, R.; Webb, E.; et al. CryoSat Ice Baseline-D validation and evolutions. Cryosphere 2020, 14, 1889–1907. [Google Scholar] [CrossRef]
- Jiang, L.G.; Schneider, R.; Andersen, O.B.; Bauer-Gottwein, P. CryoSat-2 Altimetry Applications over Rivers and Lakes. Water 2017, 9, 211. [Google Scholar] [CrossRef]
- Munoz-Sabater, J.; Dutra, E.; Agusti-Panareda, A.; Albergel, C.; Arduini, G.; Balsamo, G.; Boussetta, S.; Choulga, M.; Harrigan, S.; Hersbach, H.; et al. ERA5-Land: A state-of-the-art global reanalysis dataset for land applications. Earth Syst. Sci. Data 2021, 13, 4349–4383. [Google Scholar] [CrossRef]
- Hisam, E.; Mehr, A.D.; Alganci, U.; Seker, D.Z. Comprehensive evaluation of Satellite-Based and reanalysis precipitation products over the Mediterranean region in Turkey. Adv. Space Res. 2023, 71, 3005–3021. [Google Scholar] [CrossRef]
- Li, J.L.; Sheng, Y.W. An automated scheme for glacial lake dynamics mapping using Landsat imagery and digital elevation models: A case study in the Himalayas. Int. J. Remote Sens. 2012, 33, 5194–5213. [Google Scholar] [CrossRef]
- Lin, J.T.; Feng, X.Z.; Xiao, P.F.; Li, H.; Wang, J.G.; Li, Y. Comparison of Snow Indexes in Estimating Snow Cover Fraction in a Mountainous Area in Northwestern China. IEEE Geosci. Remote Sens. Lett. 2012, 9, 725–729. [Google Scholar] [CrossRef]
- Gao, M.; Gu, X.F.; Liu, Y.; Zhan, Y.L.; Wei, X.Q.; Yu, H.D.; Liang, M.; Weng, C.Y.; Ding, Y.Z. An Improved Spatiotemporal Data Fusion Method for Snow-Covered Mountain Areas Using Snow Index and Elevation Information. Sensors 2022, 22, 8524. [Google Scholar] [CrossRef] [PubMed]
- Lei, Y.B.; Yao, T.D.; Sheng, Y.W.; Yang, K.; Yang, W.; Li, S.H.; Zhou, J.; Jiang, Y.Z.; Yu, Y.F. Unprecedented lake expansion in 2017-2018 on the Tibetan Plateau: Processes and environmental impacts. J. Hydrol. 2023, 619, 129333. [Google Scholar] [CrossRef]
- Zhang, G.Q.; Bolch, T.; Chen, W.F.; Cretaux, J.F. Comprehensive estimation of lake volume changes on the Tibetan Plateau during 1976–2019 and basin-wide glacier contribution. Sci. Total Environ. 2021, 772, 145463. [Google Scholar] [CrossRef]
- Tang, L.Y.; Duan, X.F.; Kong, F.J.; Zhang, F.; Zheng, Y.F.; Li, Z.; Mei, Y.; Zhao, Y.W.; Hu, S.J. Influences of climate change on area variation of Qinghai Lake on Qinghai-Tibetan Plateau since 1980s. Sci. Rep. 2018, 8, 7331. [Google Scholar] [CrossRef]
- Liu, H.J.; Chen, Y.N.; Ye, Z.X.; Li, Y.P.; Zhang, Q.F. Recent Lake Area Changes in Central Asia. Sci. Rep. 2019, 9, 16277. [Google Scholar] [CrossRef]
- Lutz, A.F.; Immerzeel, W.W.; Kraaijenbrink, P.D.A.; Shrestha, A.B.; Bierkens, M.F.P. Climate Change Impacts on the Upper Indus Hydrology: Sources, Shifts and Extremes. PLoS ONE 2016, 11, e0165630. [Google Scholar] [CrossRef]
- Zhang, G.Q.; Xie, H.J.; Yao, T.D.; Kang, S.C. Water balance estimates of ten greatest lakes in China using ICESat and Landsat data. Chin. Sci. Bull. 2013, 58, 3815–3829. [Google Scholar] [CrossRef]
- Cui, B.L.; Xiao, B.; Li, X.Y.; Wang, Q.; Zhang, Z.H.; Zhan, C.; Li, X.D. Exploring the geomorphological processes of Qinghai Lake and surrounding lakes in the northeastern Tibetan Plateau, using Multitemporal Landsat Imagery (1973–2015). Glob. Planet. Change 2017, 152, 167–175. [Google Scholar] [CrossRef]
- Ibarra-Morales, D.; Silva-Aguilera, R.A.; Oseguera, L.A.; Merino-Ibarra, M.; Alcocer, J. Impacts of global change on two tropical, high mountain lakes in Central Mexico. Sci. Total Environ. 2022, 852, 158521. [Google Scholar] [CrossRef]


Disclaimer/Publisher’s Note: The statements, opinions and data contained in all publications are solely those of the individual author(s) and contributor(s) and not of MDPI and/or the editor(s). MDPI and/or the editor(s) disclaim responsibility for any injury to people or property resulting from any ideas, methods, instructions or products referred to in the content. |
© 2023 by the authors. Licensee MDPI, Basel, Switzerland. This article is an open access article distributed under the terms and conditions of the Creative Commons Attribution (CC BY) license (https://creativecommons.org/licenses/by/4.0/).