Article

Air Quality Characterization and Trend Analysis in a Brazilian Industrialized Metropolitan Area in the Period from 1995 to 2022

by
Amanda Karine Chaves Ribeiro
1,
Elson Silva Galvão
2 and
Taciana Toledo de Almeida Albuquerque
1,2,3,*
1
Graduate Program in Sanitation, Environment and Water Resources, Federal University of Minas Gerais, Av. Pres. Antônio Carlos, 6627, Belo Horizonte 31270-901, MG, Brazil
2
Graduate Program in Environmental Engineering, Federal University of Espírito Santo, Av. Fernando Ferrari, 514, Vitória 29075-910, ES, Brazil
3
Department of Sanitary and Environmental Engineering, Federal University of Minas Gerais, Av. Pres. Antônio Carlos, 6627, Belo Horizonte 31270-901, MG, Brazil
*
Author to whom correspondence should be addressed.
Atmosphere 2023, 14(12), 1792; https://doi.org/10.3390/atmos14121792
Submission received: 26 October 2023 / Revised: 24 November 2023 / Accepted: 2 December 2023 / Published: 6 December 2023
(This article belongs to the Special Issue Air Quality in Metropolitan Areas and Megacities)

Abstract

:
The Brazilian population grew approximately 9% from 2006 to 2016, and the number of deaths caused by air pollution increased by 14% in Brazil in the same period. Facing the lack of studies on air quality in the Metropolitan Area of Belo Horizonte (MABH)—the third most populous Brazilian metropolitan area—this study aimed to investigate the air quality and the trends of air pollutant concentrations in the MABH between 1995 and 2022, using data from the air quality monitoring network. The methodology consisted of checking MABHs air quality trends following the WHO air quality guidelines. The Mann–Kendall test was used to check statistically for the possibility of tendencies. The results showed a trend of stability in the concentrations of air pollutants in the MABH without any trend of improvement or worsening. However, the time series of the MABH exposed the challenge of ensuring better air quality that protects human health. Furthermore, the results reinforced the importance of focusing on pollutant sources and exposed the need for improvements in air quality management. Thus, it is essential to reverse the current dismantling scenario of the public environmental agencies in Brazil.

1. Introduction

Human activities have significantly impacted the planet’s environment and lifestyle, resulting in air quality issues that pose risks to both human health and the ecosystem [1,2]. A substantial amount of evidence has pointed out the effects of air pollution on human health, particularly in urban centers [2,3]. According to the Global Health Observatory of the World Health Organization, 6.7 million deaths worldwide are attributed to exposure to airborne pollutants [4]. As a result, directing efforts, technological advancements, and financial resources toward air quality research is paramount to comprehending the origin, composition, behavior, interactions, and control mechanisms of air pollution, ultimately safeguarding public health.
Currently, more than 6000 cities across 117 countries employ air quality monitoring programs, showing that approximately 99% of the global population is exposed to dangerously high concentrations of pollutants that exceed the air quality guidelines set forth by the World Health Organization (WHO), thus presenting a grave threat to populations worldwide [5,6]. The worldwide air quality monitoring network is expanding, yielding increasing evidence regarding the consequences of human exposure to air pollutants. According to WHO reports, low- and middle-income countries exhibit higher levels of particulate matter [6]. However, some authors highlighted the challenge of insufficient data for managing air quality and highlighted the importance of identifying the highest local air pollution levels, which is crucial information for assessing global human exposure to air pollution and planning efforts to mitigate its impacts [7].
Implementing efficient instruments and guidelines for controlling and managing local air quality is the initial step to assessing the true state of air quality and identifying external factors influencing it. To establish an effective air quality management program, the following actions are necessary: (i) emission control programs; (ii) installation and operation of air pollution monitoring systems; (iii) assurance of public data accessibility; (iv) dispersion modeling; (v) implementation of more stringent and globally harmonized air quality standards; (vi) local management systems; and (vii) policies encouraging the assessment of air pollution risks to human health [4,7]. Galvão, Feroni, and Orlando [8] clarify how these tools and actions have pros and cons when applied individually, not being able to describe an ideal and complete representation of reality on their own, being such tools mutually complementary.
In Brazil, the population witnessed a growth of approximately 9% from 2006 to 2016, and air pollution-related deaths increased by 14% in the same period [9]. In Brazil, fine particulate concentrations exceeding WHO guidelines [annual concentration of 10 μg/m3] were responsible for an increase of 48,700 ± 7570 deaths due to all causes between 2014 and 2018, highlighting the urgent need to improve air quality policies in Brazil [10].
In 2021, a new edition of the WHO global air quality guidelines was published [11], offering updated recommendations for safeguarding public health from the adverse effects of air pollutants. Additionally, the fact that the final Brazilian standard is outdated, coupled with the country still adhering to the first interim standard with no migration deadline for the subsequent stages, underscores the nation’s challenges in effectively monitoring and improving air pollutant concentrations throughout the Brazilian territory.
The air quality monitoring network (AQMN) in Brazil consists of 286 stations, incorporating automatic and manual monitoring, which is insufficient for an appropriate air quality monitoring program. Brazil has approximately 203 million inhabitants and a rate of only 1.4 monitors (one per criteria pollutant) per million inhabitants. As a comparison, for PM2.5 monitoring, most European countries and the USA have a rate above 3 monitors per million inhabitants [7]. However, this network is present in only 11 out of the 26 states and the Federal District, with no stations in northern Brazil, despite the region’s significant environmental impact due to biomass burning emissions. Furthermore, only 16% of these stations are located outside Brazil’s southeastern region, 5.5% in the northeast, 7.5% in the south, and 3% in the center-west region. The southeast of Brazil represents approximately 84% of the national network, with stations in all four states: Rio de Janeiro, São Paulo, Minas Gerais, and Espírito Santo [12]. Consequently, the Brazilian air quality monitoring network lacks representativeness of the national territory, and not all states that monitor air quality can ensure the quantity and quality of the data. According to the Institute of Energy and Environment of São Paulo (IEMA-SP) [12], the main causes are (i) lack of policies and clarity of purpose in the use of air quality data; (ii) scarce human resources; (iii) absence of perennial funding; (iv) lack of strategic planning for the monitoring network; (v) lack of standardization of the data; and (vi) difficulty in publishing data and elaborating reports.
Regarding air quality monitoring in Minas Gerais, the state government adopted the “network and operation by polluting companies” monitoring management model. In this approach, companies that perform potentially polluting activities are responsible for installing and operating monitoring stations based on environmental licensing conditions or terms of conduct adjustments. The environmental agency conducts audits, validates, and publishes the data. The automatic AQMN in the state of Minas Gerais currently comprises 53 automatic stations operating since 1995 [12,13,14].
The Metropolitan Area of Belo Horizonte (MABH) is the third-most populous Brazilian metropolitan region. Currently, 17 automatic monitoring stations, managed by the State Environmental Foundation of Minas Gerais (FEAM) and funded by polluting industries, continuously operate in the MABH [13]. Some authors have pointed out the existing fragility of the MABHs air quality network, citing limited data availability and a lack of transparency in station data [15,16,17]. These studies reinforce the need to improve the monitoring network in Minas Gerais and the adoption of more restrictive air quality standards in force in Brazil since current levels do not satisfactorily protect the lives of the population.
Some studies have focused on analyzing air pollution in the MABH, investigating aspects such as (a) evaluation of air quality model results [18,19], (b) evaluation of the influence of meteorology on fine particle concentration [20], (c) identification of some pollutants’ behavior and their relation with atmospheric conditions [20], (d) health effects of inhaling fine particulate matter [18,21], and (e) emission inventories and control strategies [19,21,22,23,24]. All these studies highlight the need for reliable air quality data for assessment and air quality management. Despite the rapid growth of MABH and the strong influence of industrial and road traffic emissions [18], none of the studies focused on MABH, seeking to know the actual situation regarding air quality and understand the evolution of air pollution in this metropolitan area.
The primary objective of this research is to assess the air quality status in the MABH based on the guidelines set by the WHO. Additionally, this study aims to investigate the temporal trends in atmospheric pollutant concentrations from the inception of automatic air quality monitoring in 1995 to 2022, highlighting noteworthy patterns observed throughout the time series.

2. Materials and Methods

2.1. Study Area

The MABH has approximately six million inhabitants and an area of 9468 km2 [25], across 34 municipalities, and serves as a prominent commercial, industrial, cultural, and tourist hub within the state of Minas Gerais. The area experiences significant heavy traffic and hosts an industrial complex with considerable potential for emitting air pollutants. In particular, the 2015 state emissions inventory for MABH [26] identified road traffic sources (dust resuspension + exhaust) and industrial sources as the main contributors to particulate matter, sulfur, and nitrogen oxide emissions. Biomass burning was identified as the third-largest contributor in the region.
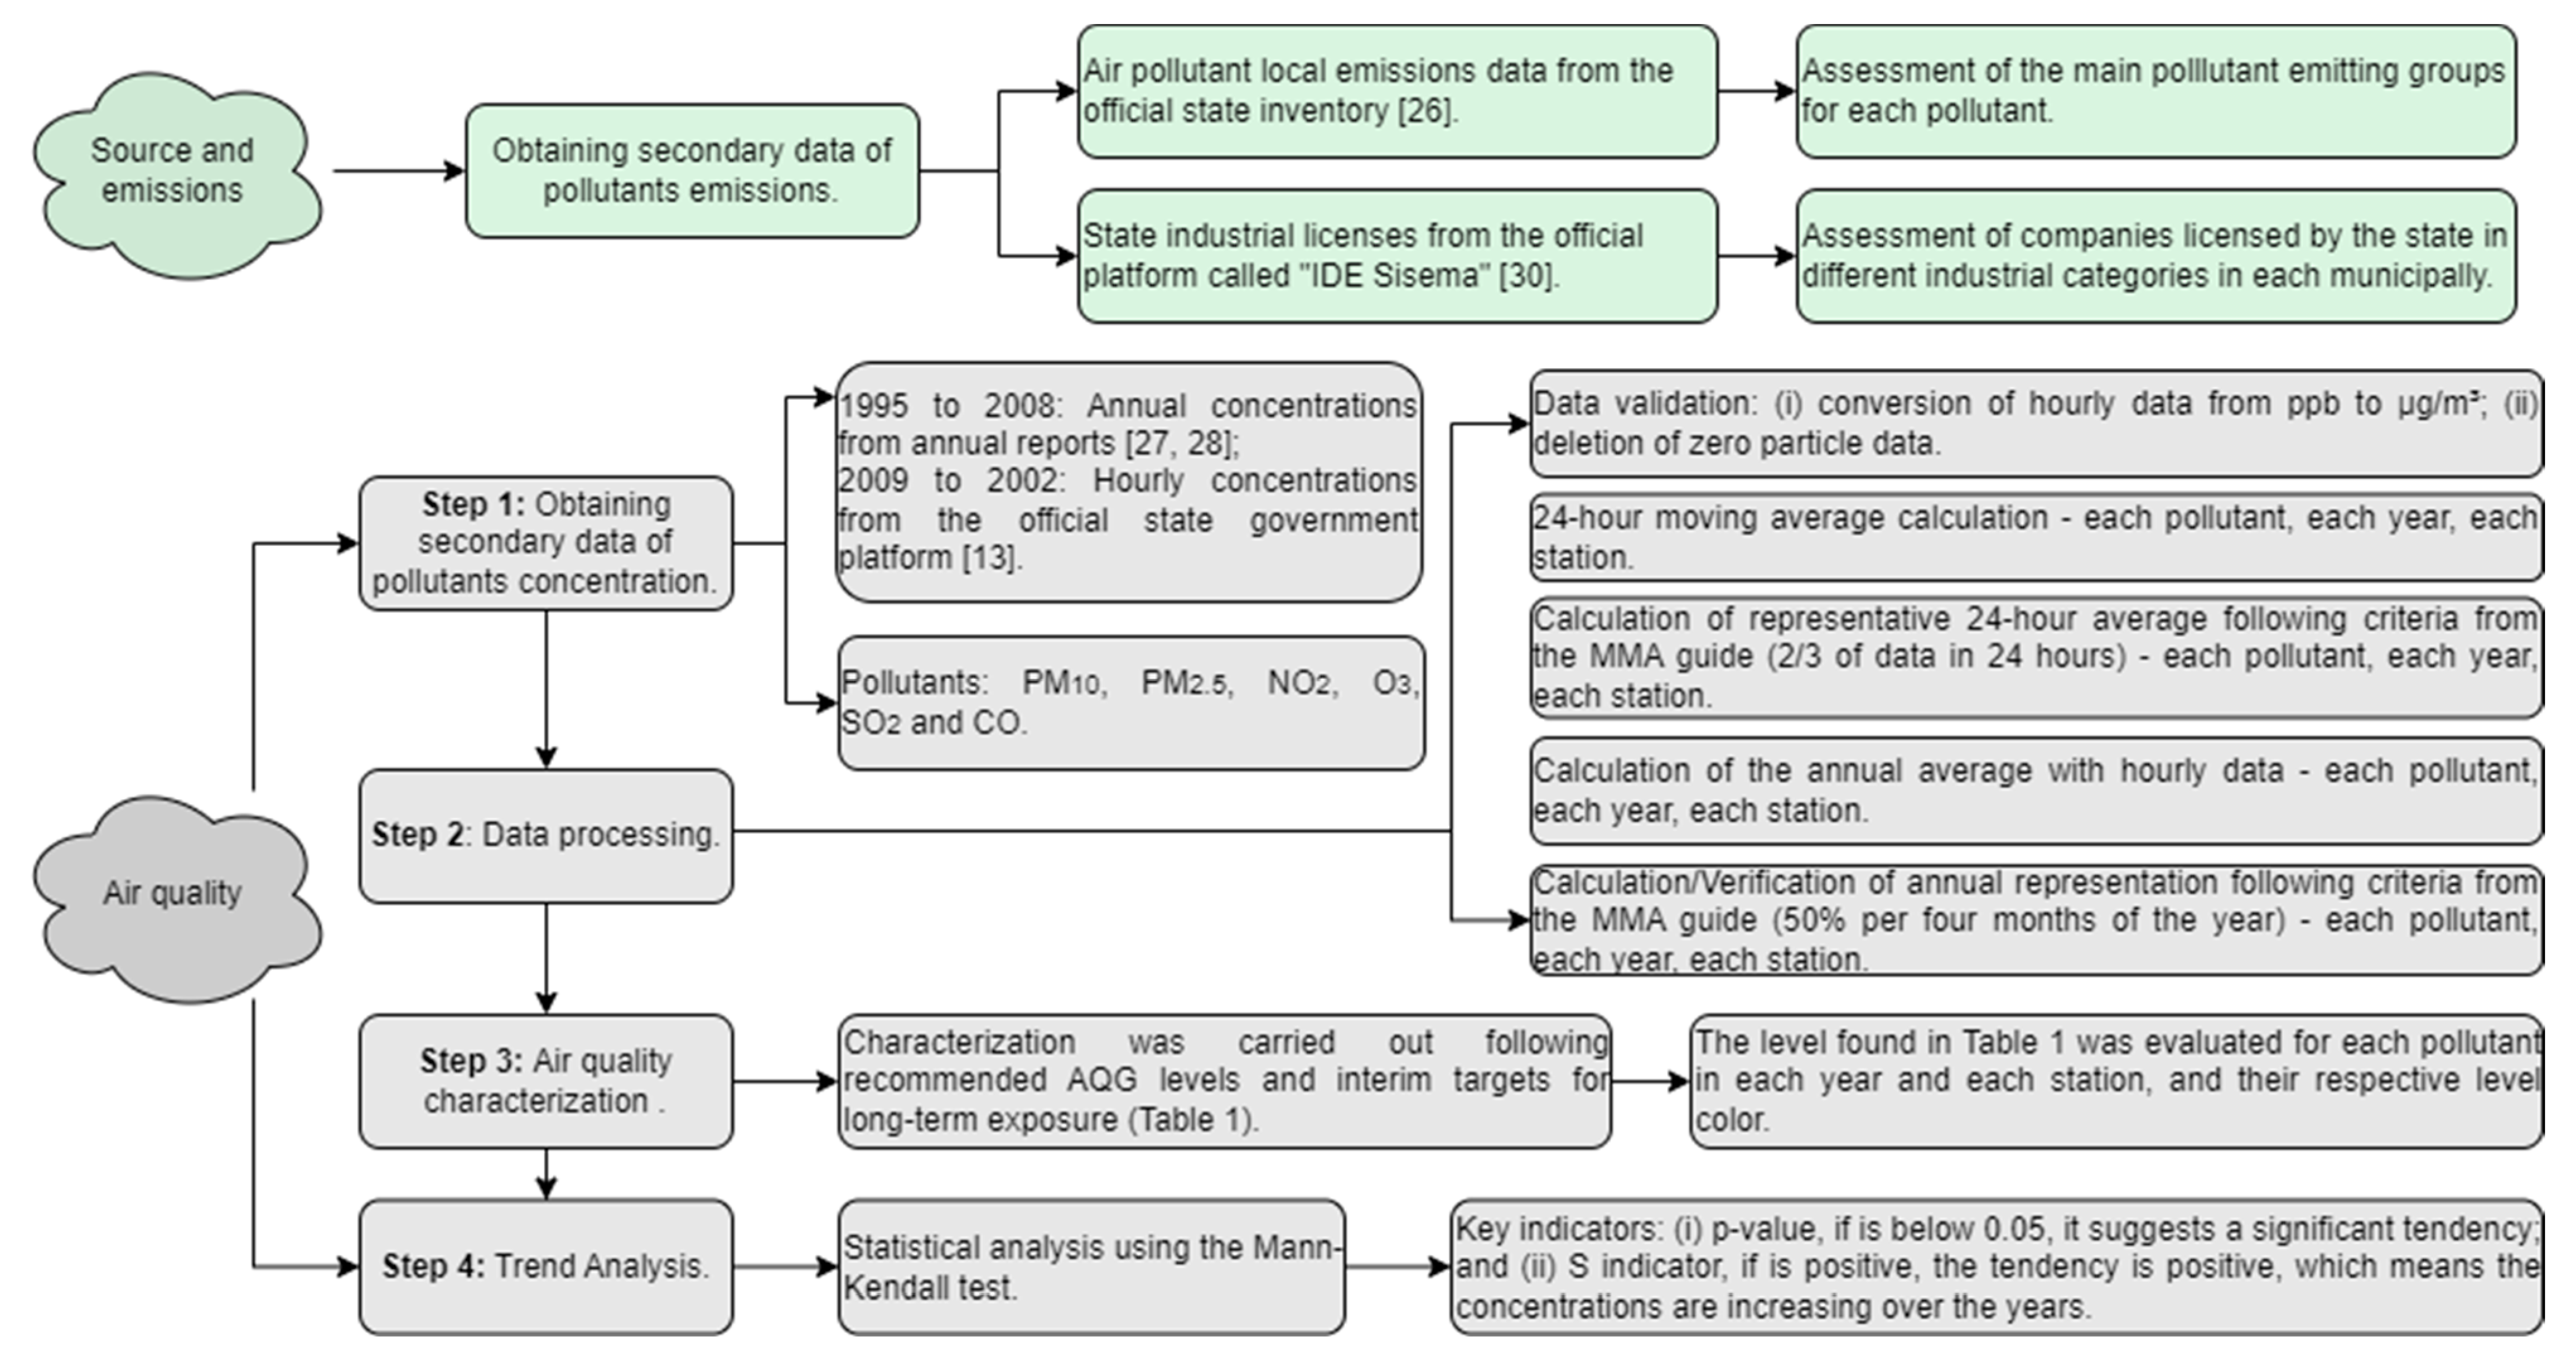
For this study, data from 17 air quality monitoring stations (Figure 1) in MABH were evaluated from the period spanning 1995 to 2022. This study considered hourly concentration data of particulate matter for particles equal to 10 μm in diameter and smaller (PM10) and particles equal to 2.5 μm in diameter and smaller (PM2.5), nitrogen dioxide (NO2), ozone (O3), sulfur dioxide (SO2), and carbon monoxide (CO) from 2009 to 2022, which were obtained from [13]. Data from the years 1995 to 2008 were acquired from the annual reports [27,28] when available. From 2008 onwards, all data were provided in.xls files by the local environmental agency (FEAM), except for PM2.5, in which the monitoring only started in the early of 2015. The network covers six of the thirty-four municipalities composing the MABH, including Belo Horizonte (BH01, BH02, BH03, and BH04), Betim (BT01, BT02, BT03), Contagem, Ibirité, São José da Lapa, and Brumadinho (Figure 1). A flow chart of the method used in this work is shown in Figure 2.

2.2. Assessment of Air Quality Trends

The scope of this study encompassed an assessment of the MABH in relation to the WHO recommendations, taking into account both the interim targets (M1, M2, M3, and M4) and the final air quality guidelines (AQG). The interim targets are indicative stages that facilitate a gradual reduction of air pollution, ultimately leading to the attainment of air quality levels specified in the AQG. These AQG levels are established based on scientific evidence suggesting that adverse health effects either do not occur or are minimal below the specified concentration thresholds. These guidelines are presented in the latest issue of the WHO series of publications [11]. This paper focuses only on the long-term exposures (Table 1).
Furthermore, the air quality trends over the past 26 years were subjected to analysis using the Mann–Kendall test, which provides a statistical assessment of the probability of positive or negative tendencies (α = 0.05). In this analysis, two key indicators were considered: (i) if the p-value is below 0.05, it suggests a significant tendency; and (ii) if S is positive, so is the tendency, which means the concentrations are increasing over the years. The average representativeness of the data was assessed following the Brazilian Environmental Ministry (MMA) recommendations by the MMA’s guide [29]. The MMA’s guide is the national guide that establishes guidelines for air quality monitoring in Brazil. Air pollutant local emissions data from the official state inventory [26] were also analyzed and used as support for discussions. It is important to highlight that, despite MABH consisting of 34 municipalities, the official inventory includes data from only three municipalities (Belo Horizonte, Contagem, and Betim), which together account for approximately 66% of the MABH population [25]. Thus, there is a lack of representativeness among the other 31 municipalities that account for 34% of the total emissions.
Figure 2. Flow chart of the methods used in the analysis of the trends and quality of the air pollution monitoring data.
Atmosphere 14 01792 g002

3. Results and Discussion

3.1. Sources and Emissions

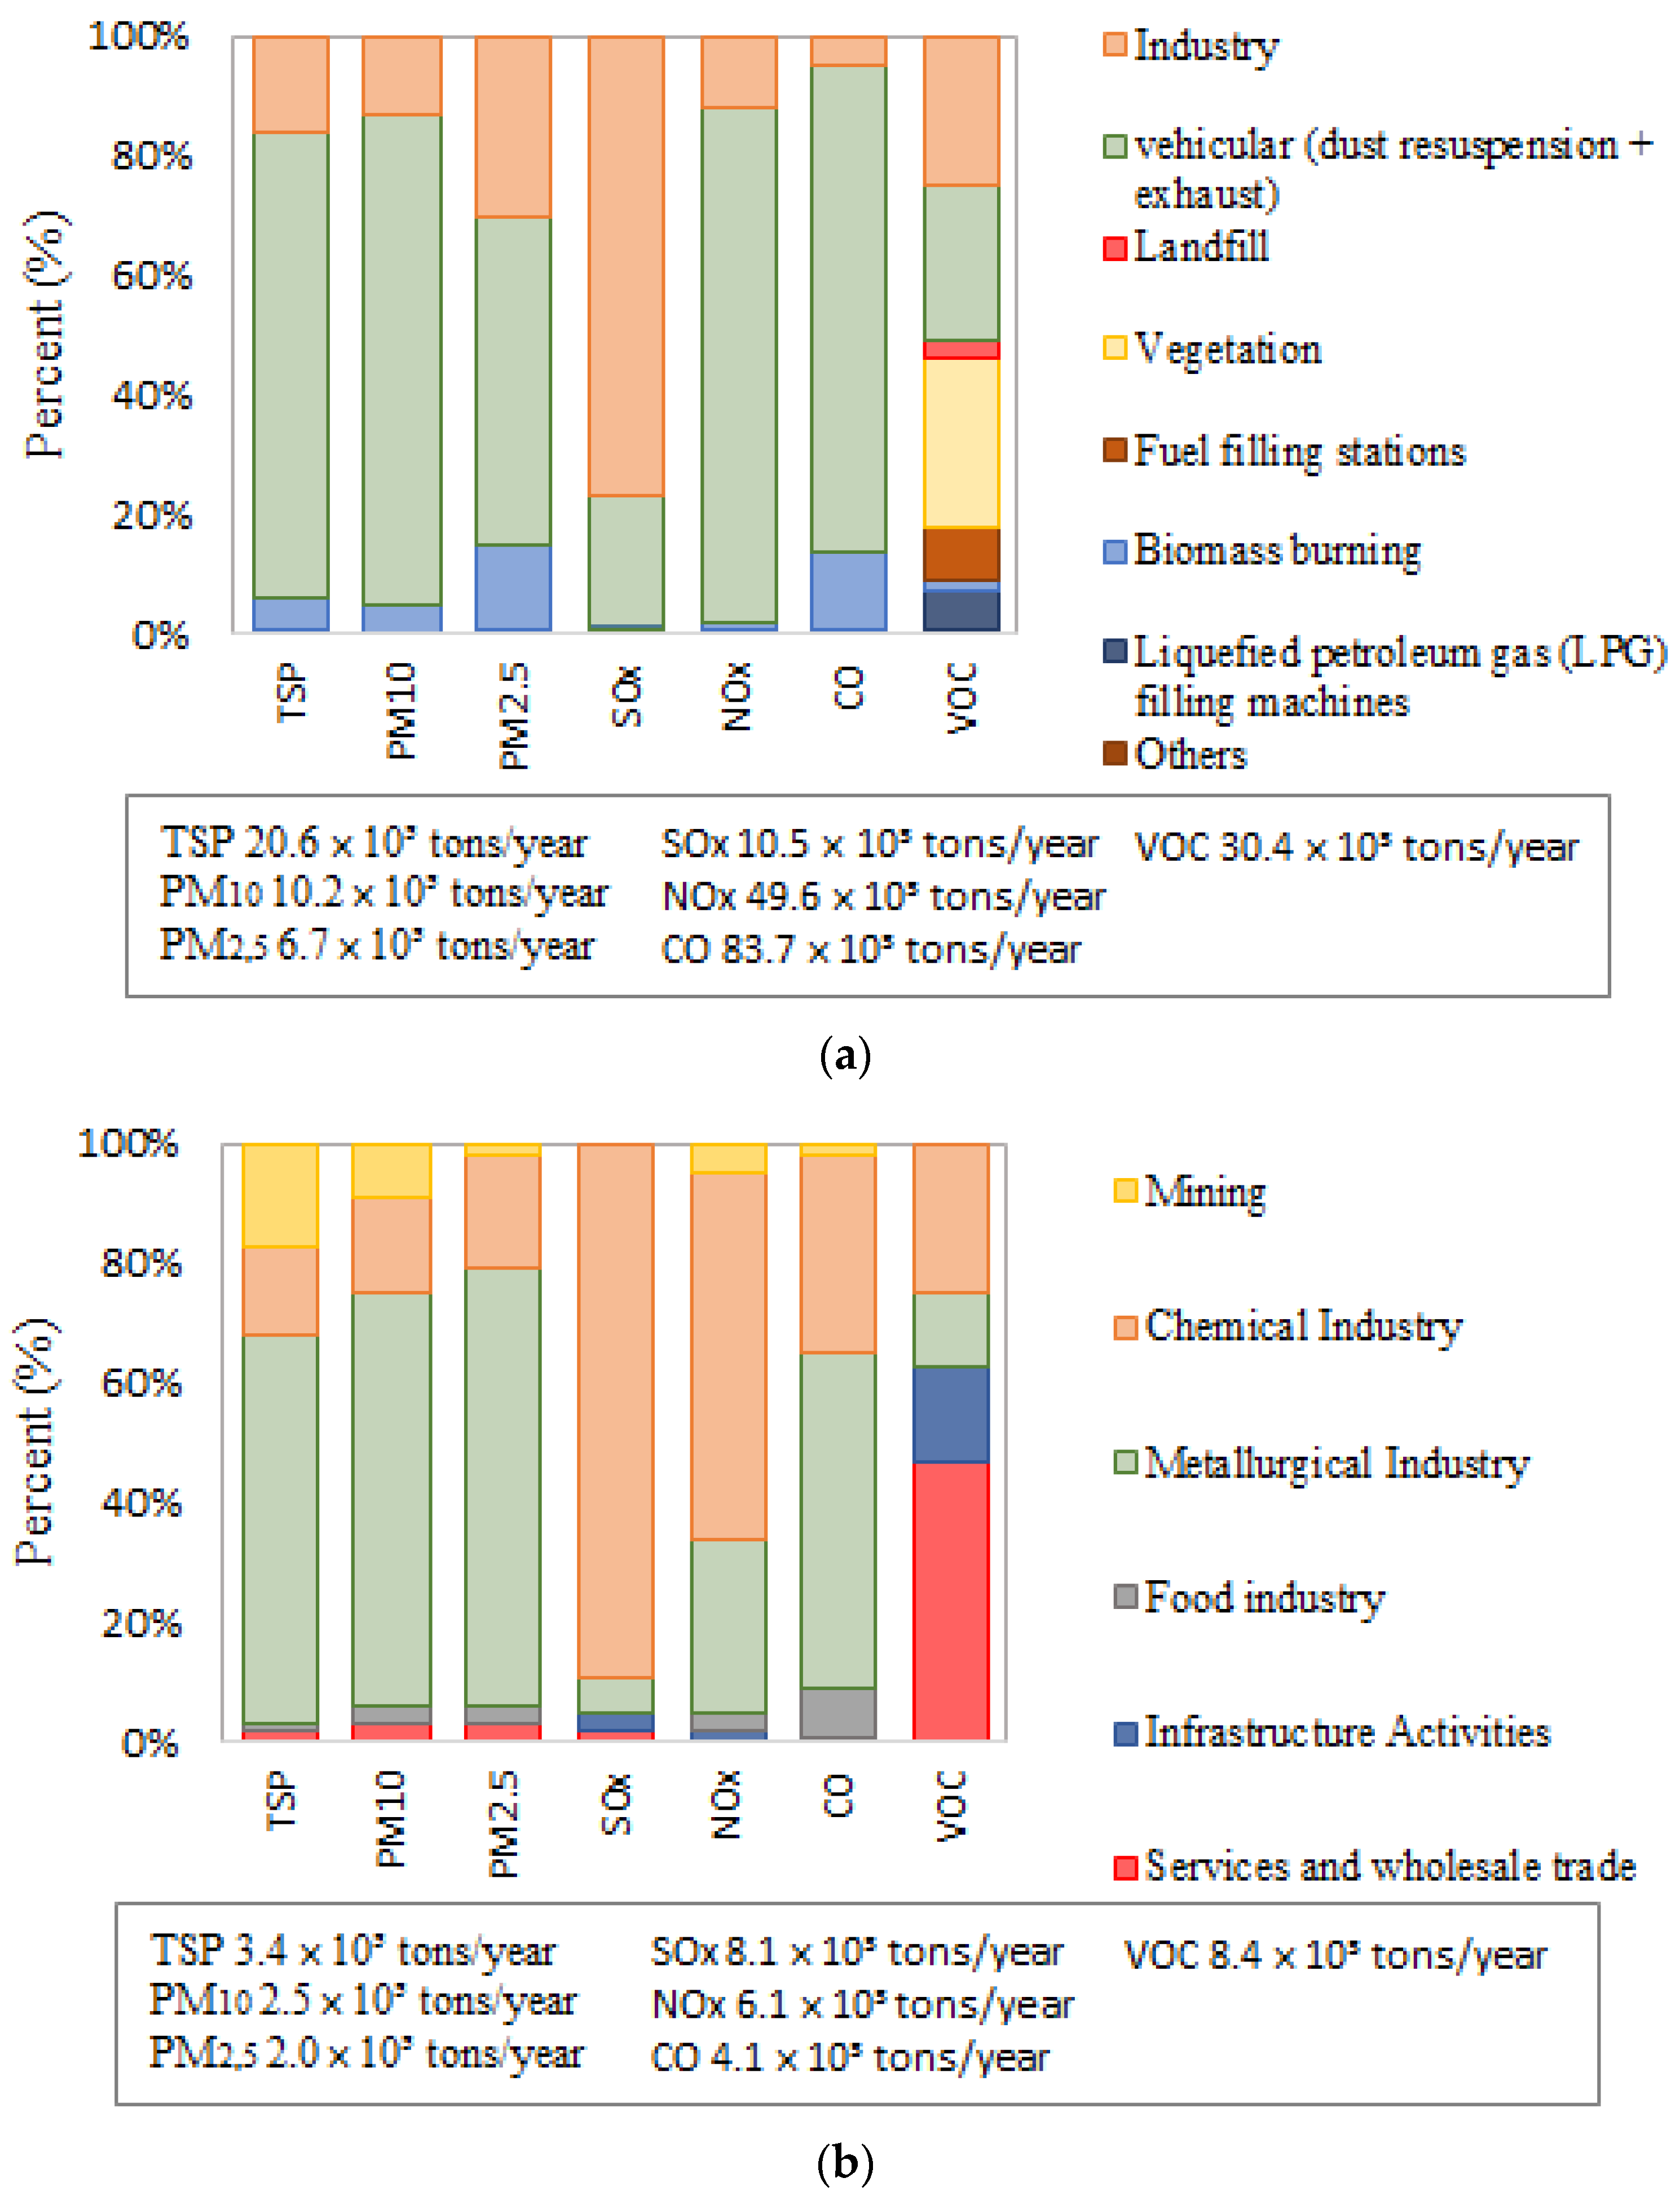
The current state of the MABH is characterized by emissions from road traffic and industrial sources. Figure 3 illustrates the total emissions of TSP (Total Suspended Particles), PM10, PM2.5, NOx (Nitrogen Oxides), SO2 (Sulfur Dioxide), CO (Carbon Monoxide), and COV (Volatile Organic Compounds) based on the official inventory for the year 2015. The emissions are presented both for all source groups (Figure 3a) and specific industrial groups (Figure 3b). As the official inventory only includes data from three of all the 34 municipalities, it is important to highlight that consequently, the official inventory results might not fully represent all the cities within the metropolitan area, and there is a lack of official information available for the emissions of the remaining regions. Therefore, to gain a comprehensive understanding, an assessment was conducted by considering companies licensed by the state [30] under different industrial categories in municipalities with air quality monitoring stations within the state’s network, as depicted in Figure 4.
Based on the inventory data, road traffic is a significant contributor to emissions, accounting for 78% of TSP emissions, 22% of SO2 emissions, 86% of NO2 emissions, 81% of CO emissions, and 26% of COV emissions [26]. Regarding the road traffic contributions to particulate emissions, the inventory combined dust resuspension with exhaust emissions as a single road traffic group. This approach presents a limitation as each component originates from different sources and necessitates distinct control mechanisms. Consequently, the official inventory fails to provide specific information about the percentage attributed to each type of road traffic emission in the MABH area, indicating a weakness in the availability of comprehensive information.
Santos et al. [24] also aimed to estimate traffic-related emissions in the MABH for the year 2015. They reported TSP emissions of approximately 2.4 × 10³ tons/year from traffic sources, whereas the state inventory estimated much higher emissions at around 16 × 103 tons/year, nearly seven times greater than the former estimate. It is worth noting that the authors considered emissions from all 34 municipalities in MABH, while the official data only included three of them. Considering only Belo Horizonte, the state inventory estimated road traffic emissions of 11 × 103 tons/year for TSP, 27 × 103 tons/year for NOx, 1.7 × 10³ tons/year for SOx, 52 × 103 tons/year for CO, and 6.4 × 10³ tons/year for VOC. However, Santos et al. [24] estimated only 1 × 10³ tons/year, 581 tons/year, 581 tons/year, 17 × 103 tons/year, and 4.7 × 10³ tons/year, respectively.
Particulate matter emissions from transportation in the Belo Horizonte region were found to exceed those of São Paulo [16], the most populous city in Brazil and the fourth most populous in the world, encompassing the largest metropolitan region in the country. This finding raises the possibility that the predominant contribution of road traffic emissions may be overestimated or, at the very least, sheds light on the inherent fragility of the state’s emission estimate from road traffic circulation and its respective contribution percentage.
Regarding TSP, PM10, PM2.5, and CO emissions, the industrial and biomass burning emissions groups constitute the other two significant contributors. The industrial group’s particulate and CO emissions are primarily associated with metallurgical industries, whereas SO2 emissions are related to chemical plants. However, it is essential to acknowledge that these results do not fully represent all the cities within MABH. Therefore, to gain a comprehensive understanding, an assessment was conducted by considering companies licensed by the state [30] under different industrial categories in municipalities with air quality monitoring stations within the state’s network, as depicted in Figure 4. The analysis reveals a variation in predominant emission typologies across different municipalities. Specifically, in Belo Horizonte, Contagem, Betim, and Ibirité, the metallurgical industry sector, waste management, and services, along with infrastructure activities, dominate the emissions profile. However, São José da Lapa and Brumadinho show a more prominent presence of mining activities, which significantly influence particulate matter emissions in these cities. São José da Lapa also has a notable presence in chemical industries, waste management, and services. However, the primary sector of production is mineral extraction and limestone processing, which are situated within the urban center of the city [31]. This difference between the categories of emission sources in the municipalities underscores the complexity of air quality management in the MABH due to the variability of emission sources across different municipalities, making it crucial to consider regional-specific factors when conducting emission assessments and air quality analyses.
Santos et al. [24] also estimated stationary emissions of MABH in 2015, showing similar results for all pollutants from industrial emissions when compared with the official inventory of MABH. However, more than five years have passed since these works, and an inventory review is required.
That way, the emission inventory in the MABH faces certain challenges. Nonetheless, the primary contributors to PM10 emissions in this region are road traffic, industrial, and biomass burning sources. The road traffic group, in particular, warrants attention, given the significant growth in the general fleet of vehicles, especially motorcycles and private vehicles, which surged by 76.6% between 2001 and 2009 [32], whereas MABHs population increased by 13.5%. It is important to note that heavy vehicles in the state of Minas Gerais, including the MABH region, were found to be the major contributors to emissions of particulate matter, including TSP, PM10, and PM2.5, in 2015, as highlighted by Santos et al. [24]. The emission breakdown for PM10 indicated that 48.8% originated from exhaust, 32.1% from tire and brake wear, and 19.1% from road wear. Consequently, it becomes evident that a significant portion of total PM10 emissions originates from non-exhaust sources [24], aligning with observations from studies conducted in other urban centers globally. The material composition of emitted particles is influenced by various factors, such as the type of engine, fuel, vehicle age, maintenance level, and the origin of deposited materials susceptible to resuspension [33,34,35]. An insightful study by Moura [36] analyzing the composition of PM10 in the MABH identified road traffic activities as a major emission source, alongside mining activities and soil dust resuspension. Regions like São José da Lapa and Brumadinho, characterized by substantial mining activities and waste management and services, contribute significantly to this pollutant’s emission profile (Figure 4).

3.2. Air Quality Status and Tendency

Regarding the annual concentrations in the MABH, all pollutants exceeded the AQG levels (Figure 5). Notably, for NO2, the concentrations surpassed the first interim target, M1 = 40 µg·m−3, showing a decreasing trend between 1995 and 2022. Nowadays, NO2 concentrations vary between the M2 and M3 targets. The PM10 levels remained in the M2 phase most of the time, including in more recent years, whereas PM2.5 showed concentrations at the M3 level since monitoring began. Furthermore, a drop in PM2.5 concentrations was observed in 2020 compared to other years. Consequently, for all pollutants with annual guidelines, the MABH failed to comply with the WHOs recommendations, highlighting the associated risk to the local population. This observation aligns with other studies demonstrating similar situations of pollutant concentrations exceeding recommended levels in some Brazilian and South American urban centers [7,10,16].
For O3, SO2, and CO, there are no specific annual levels recommended by the WHO. Nevertheless, a decrease in the average concentrations of O3 and CO is noticeable in the MABH. There is no WHO 2021 recommended value for the annual average of SO2; however, the results show that its concentrations did not present any decreasing tendency in relation to the current and first interim of the Brazilian air quality standard of 40 µg/m3. Thus, while the annual concentrations of SO2 have not decreased since 1995, they remain below the final standard of Brazilian legislation. Comparatively, in other Brazilian areas and South American cities [16], both CO and SO2 have not emerged as significant problems in urban centers, primarily due to advancements in vehicle technology and fuels [37,38].
Considering the risks of these pollutants, it is important to cite the ELAPSE project. The ELAPSE project is a Europe-wide initiative spanning from mid-2016 to mid-2019. It delves into the effects of long-term exposure to low-level air pollutants like PM2.5, Black Carbon, NO2, and O3. The project’s focus lies in investigating the health impacts—both mortality and morbidity—stemming from these pollutants. It leverages detailed individual data from around 380,000 subjects in specific cohorts of the ESCAPE study, as well as data from seven extensive European administrative cohorts comprising over 35 million subjects [39]. It is important to highlight that the ELAPSE project found adverse health effects even for air pollutant concentrations below WHO-AQG (2021) levels, demonstrating that even for pollutants levels below WHO-AQG, there is still risk for adverse health effects.
It is crucial to highlight that the Brazilian air quality standards are ruled by CONAMA Resolution No. 491/2018 [40], which established three interim standards and a final one, corresponding to the WHO recommendations at that time, the Global Update 2005 [41]. However, in 2021, a new edition of the WHO global air quality guidelines was published [11], offering updated recommendations for safeguarding public health from the adverse effects of air pollutants. Additionally, the fact that the final Brazilian standard is outdated, coupled with the country still adhering to the first interim standard with no migration deadline for the subsequent stages, underscores the nation’s challenges in effectively monitoring and improving air pollutant concentrations throughout the Brazilian territory.

3.3. PM10 Averages and Trends

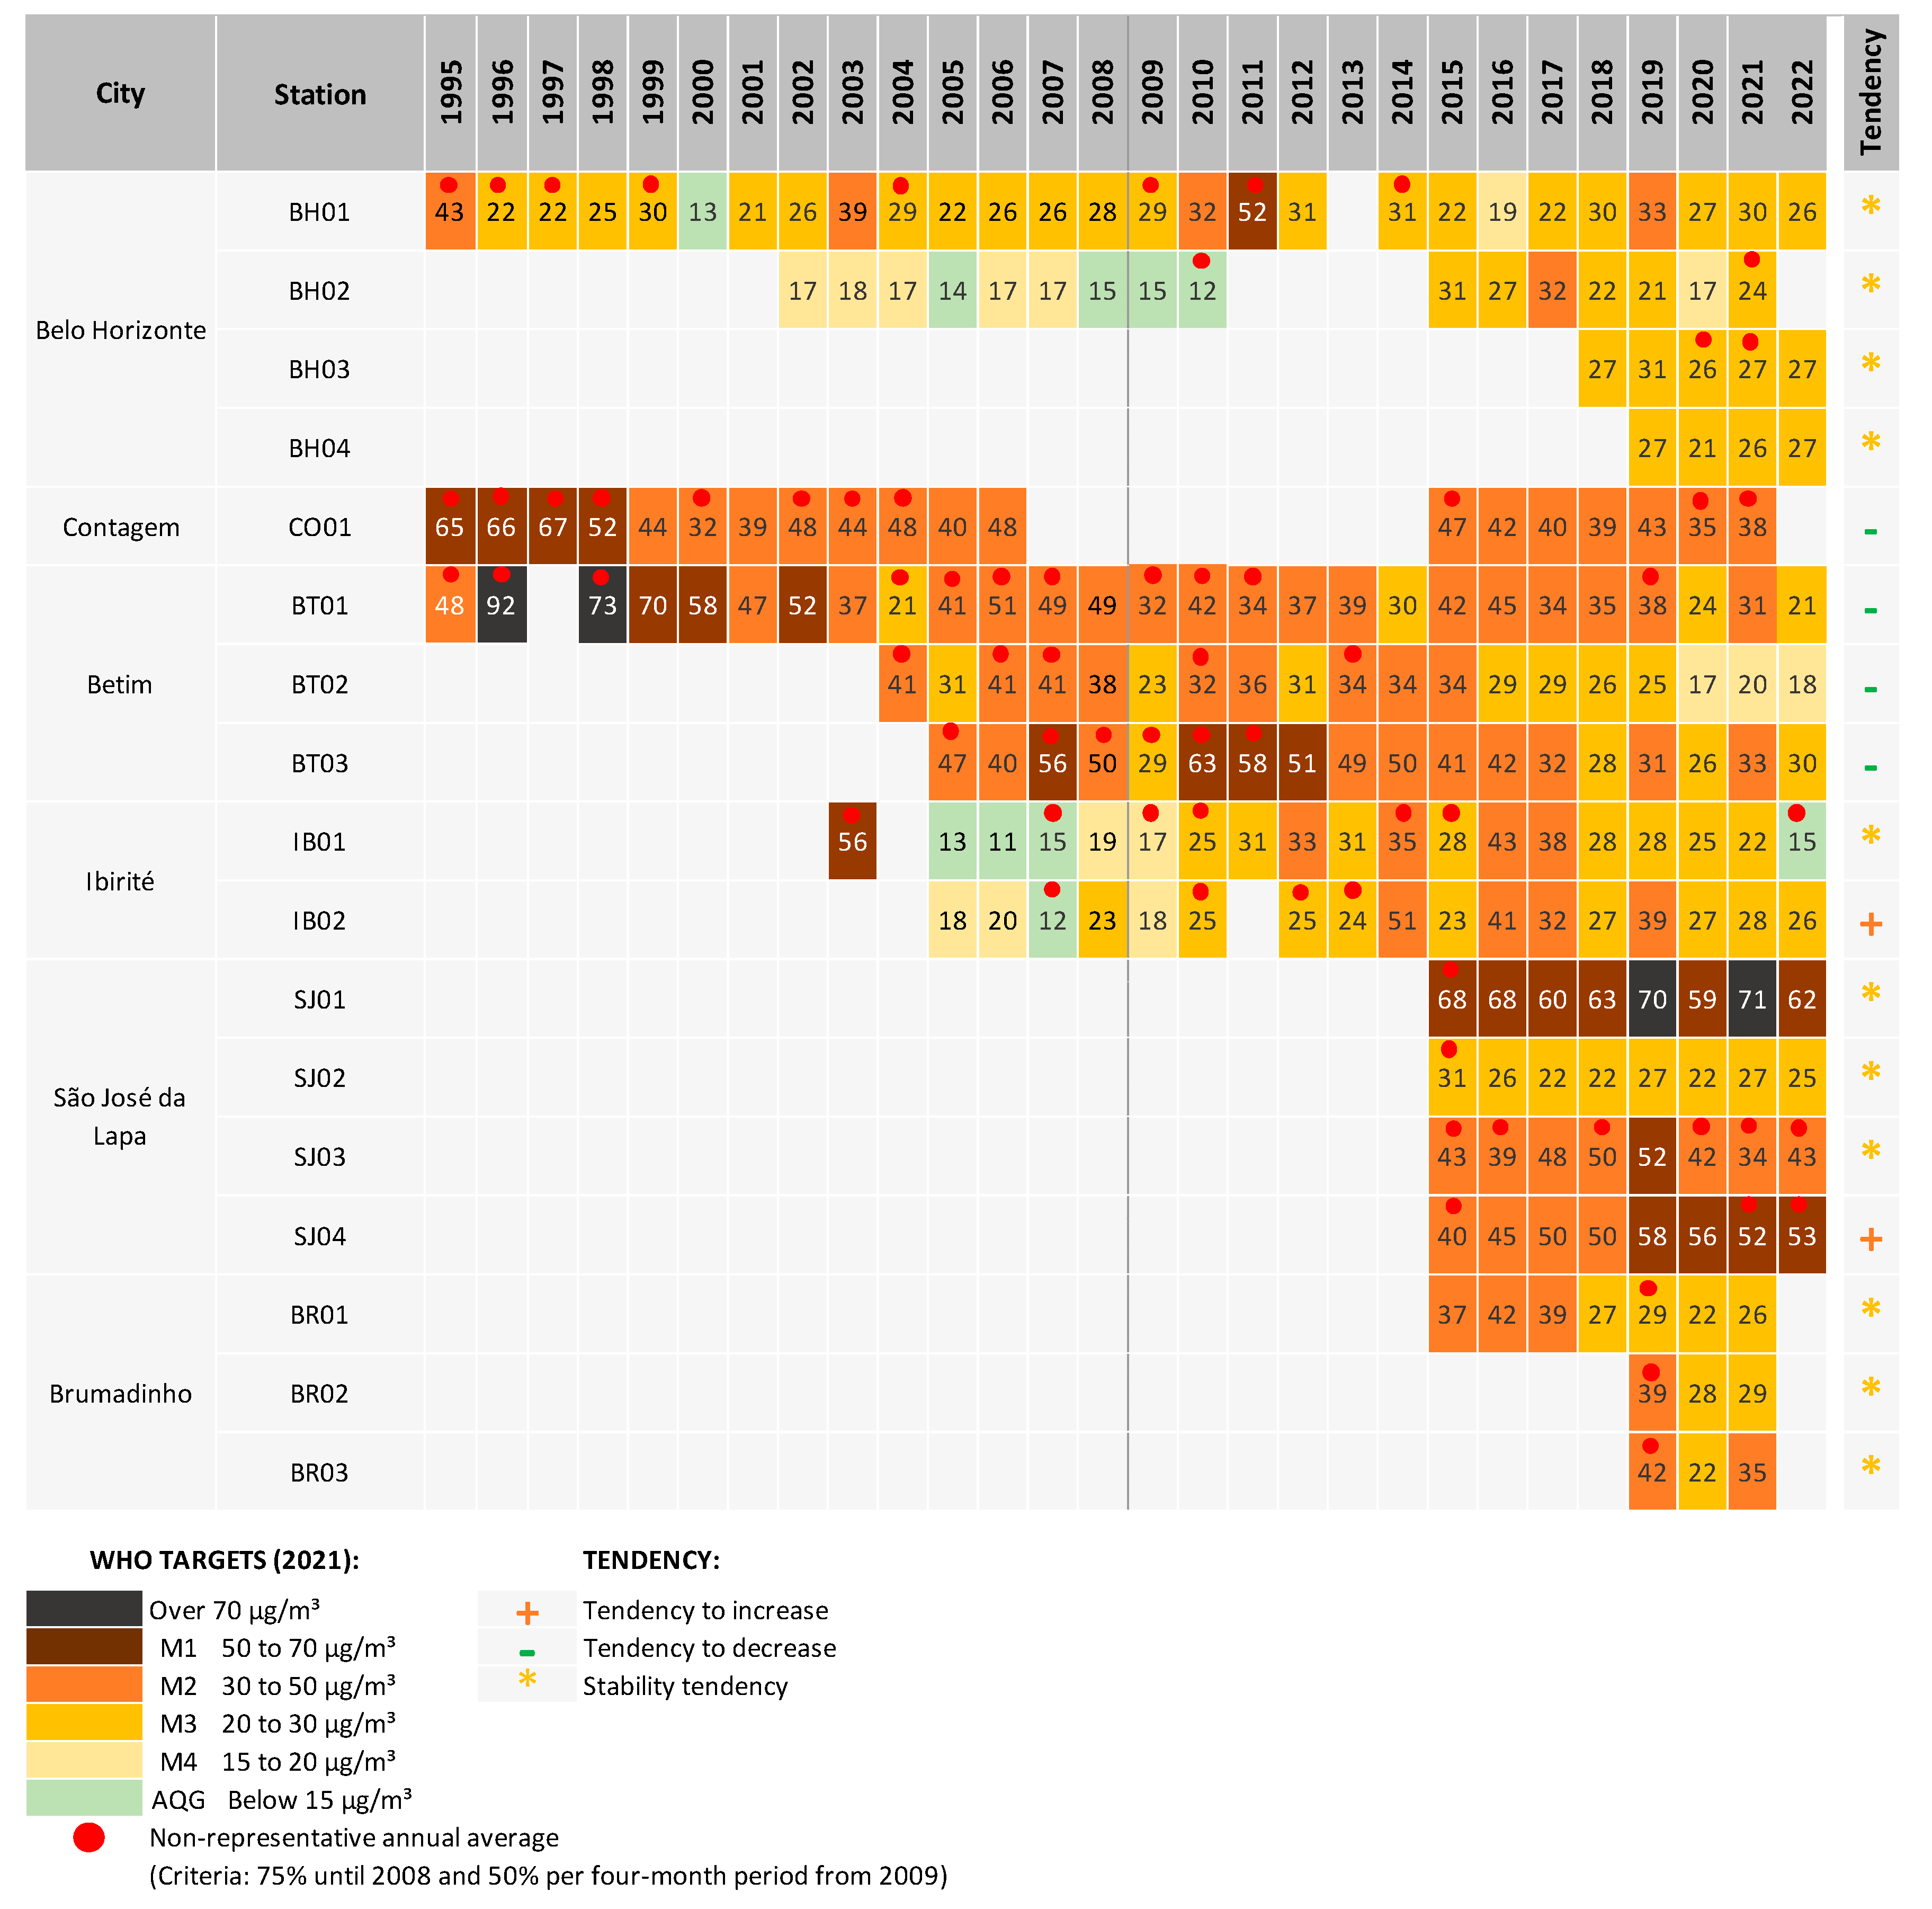
The analysis of the PM10 time series (Figure 6) reveals that annual concentrations consistently exceeded the established AQG levels for nearly all monitoring stations. Particularly concerning are three stations located in Contagem and Betim municipalities, which exhibit the most severe air quality degradation in the MABH. However, the stations of Contagem and Betim showed significant improvements in the air quality, as demonstrated by the Mann–Whitney test presented in Table 2. Despite this progress, it is crucial to acknowledge that PM10 concentrations in these regions still remain above the WHO guidelines. Throughout the entire monitoring period, the CT01, BT01, and BT03 monitoring stations registered average annual PM10 concentrations above 50 μg/m3, with BT01 Station reaching levels exceeding 70 μg/m3 (Figure 5). Comparatively, Peláez et al. [16] analyzed air quality and trends in major cities across South America, revealing that long-term PM10 concentrations in all studied cities exceeded WHO-AQG levels. Notably, Belo Horizonte reported higher annual averages of PM10 when compared to several Brazilian regions, including Vitória, São Paulo, Rio de Janeiro, and Salvador [16]. In contrast, Belo Horizonte displayed relatively lower PM10 concentrations compared to other prominent South American cities such as Bogotá, Medellín, Quito, Santiago, and Lima. Among the South American regions outside Brazil, only Buenos Aires recorded lower PM10 concentrations than Belo Horizonte. Thus, the findings underscore the persistent challenge of achieving and maintaining satisfactory air quality in the MABH, with PM10 concentrations posing significant health risks to the population. To address this issue effectively, it is essential to focus efforts on identifying the sources of PM10 pollution and implementing targeted control mechanisms. The complexity of PM10 pollution extends not only to other regions within Brazil [16,37,42,43] but also to various areas around the globe [16].
Over the last eight years, the Air Quality Monitoring Station (AQMS) in São José da Lapa has experienced a concerning trend of high PM10 concentrations, surpassing the first target level for SJ01, SJ03, and SJ04 stations. This pattern of elevated PM10 levels is unique to São José da Lapa, as no other station exhibits a similar trend. The annual averages indicate a stable trend over the years, with no discernible signs of improvement or deterioration in PM10 concentrations. Figure 7, presenting a ranking of six stations with the highest averages from 2019 to 2021, further reinforces the severity of the situation. This specific period was chosen because all active stations were concurrently operational, providing a comprehensive overview. Within this context, the monitoring stations located in São José da Lapa (SJ01 and SJ04) recorded the highest and second-highest PM10 concentrations, respectively. These two stations are in close proximity to lime industrial plants in the region, suggesting a possible association between industrial activities and PM10 pollution. Additionally, Ireno [44] reported prevailing winds blowing from the industrial region toward the SJ01 station, indicating a high probability of particle transportation towards the station. Furthermore, both SJ01 and SJ04 stations are situated near major traffic roads, potentially contributing to the observed high PM10 levels. The third-highest average concentration was observed at SJ03, also located in São José da Lapa, further emphasizing the impact of local sources in the area. Notably, Contagem (CO01) and Brumadinho (BR02 and BR03) cities also recorded high average PM10 concentrations. CO01’s ranking as the fourth-highest indicates the combined influence of industrial plants and road traffic emissions in the area. Meanwhile, the elevated PM10 concentrations in BR02 and BR03 stations in Brumadinho point to the presence of local sources related to mining industries in the vicinity.
The findings of this study indicate a substantial influence of industrial sources on PM10 pollution in the MABH. Notably, municipalities with the highest PM10 concentrations are significantly impacted by emissions from industrial activities, primarily stemming from the mining and steel industries. São José da Lapa, despite having a lower population density compared to other municipalities, exhibited PM10 concentrations well above those observed at other monitoring stations. This observation underscores the strong influence of industrial emissions on air quality in the region. The MABH, being the third-largest metropolitan area in Brazil, experiences a dual burden of pollution. Alongside pollution from urban sources, the region contends with an extensive industrial complex, further exacerbating air pollution challenges. As confirmed by Galvão et al. [45], in another industrialized region of southeastern Brazil, the mineral phases present in particulate matter are dependent on particle size. Hematite and quartz were found in significant amounts in the Settleable Particulate Matter (SPM) and in the Total Suspended Particles (TSP), whereas elemental carbon, sulfates, and halite were found in higher levels in the PM10 and PM2.5 fractions [45]. This highlights the complexity of particulate matter composition and its potential implications for human health, as health risks are also influenced by PM size [18].
The burning of biomass emerges as one of the three largest groups of emitters contributing to PM10 pollution. A study conducted by [46] identified a concerning increase in fires over the years, with peaks in burned areas in Brazil often coinciding with extreme dry events. The extensive deforestation rates, particularly before 2005 and after 2019, have significantly impacted the rise in areas subject to burning [46]. Furthermore, the dry season, occurring between July and October, concentrates a staggering 83% of the country’s burning activities [46]. The effects of biomass burning on more susceptible people, such as children and elders, were carried out in Brazil and revealed that an increase of 10 μg·m−3 of wildfire-related PM2.5 was associated with a 1.65% (95% CI 1.51–1.80) increase in hospital admissions by all causes, besides an increase of 5.09% (4.73–5.44) of respiratory hospital admissions and a 1.10% (0.78–1.42) increase in cardiovascular hospital admissions over only 0 to 1 day after the exposure [47].

3.4. PM2.5 Averages and Trends

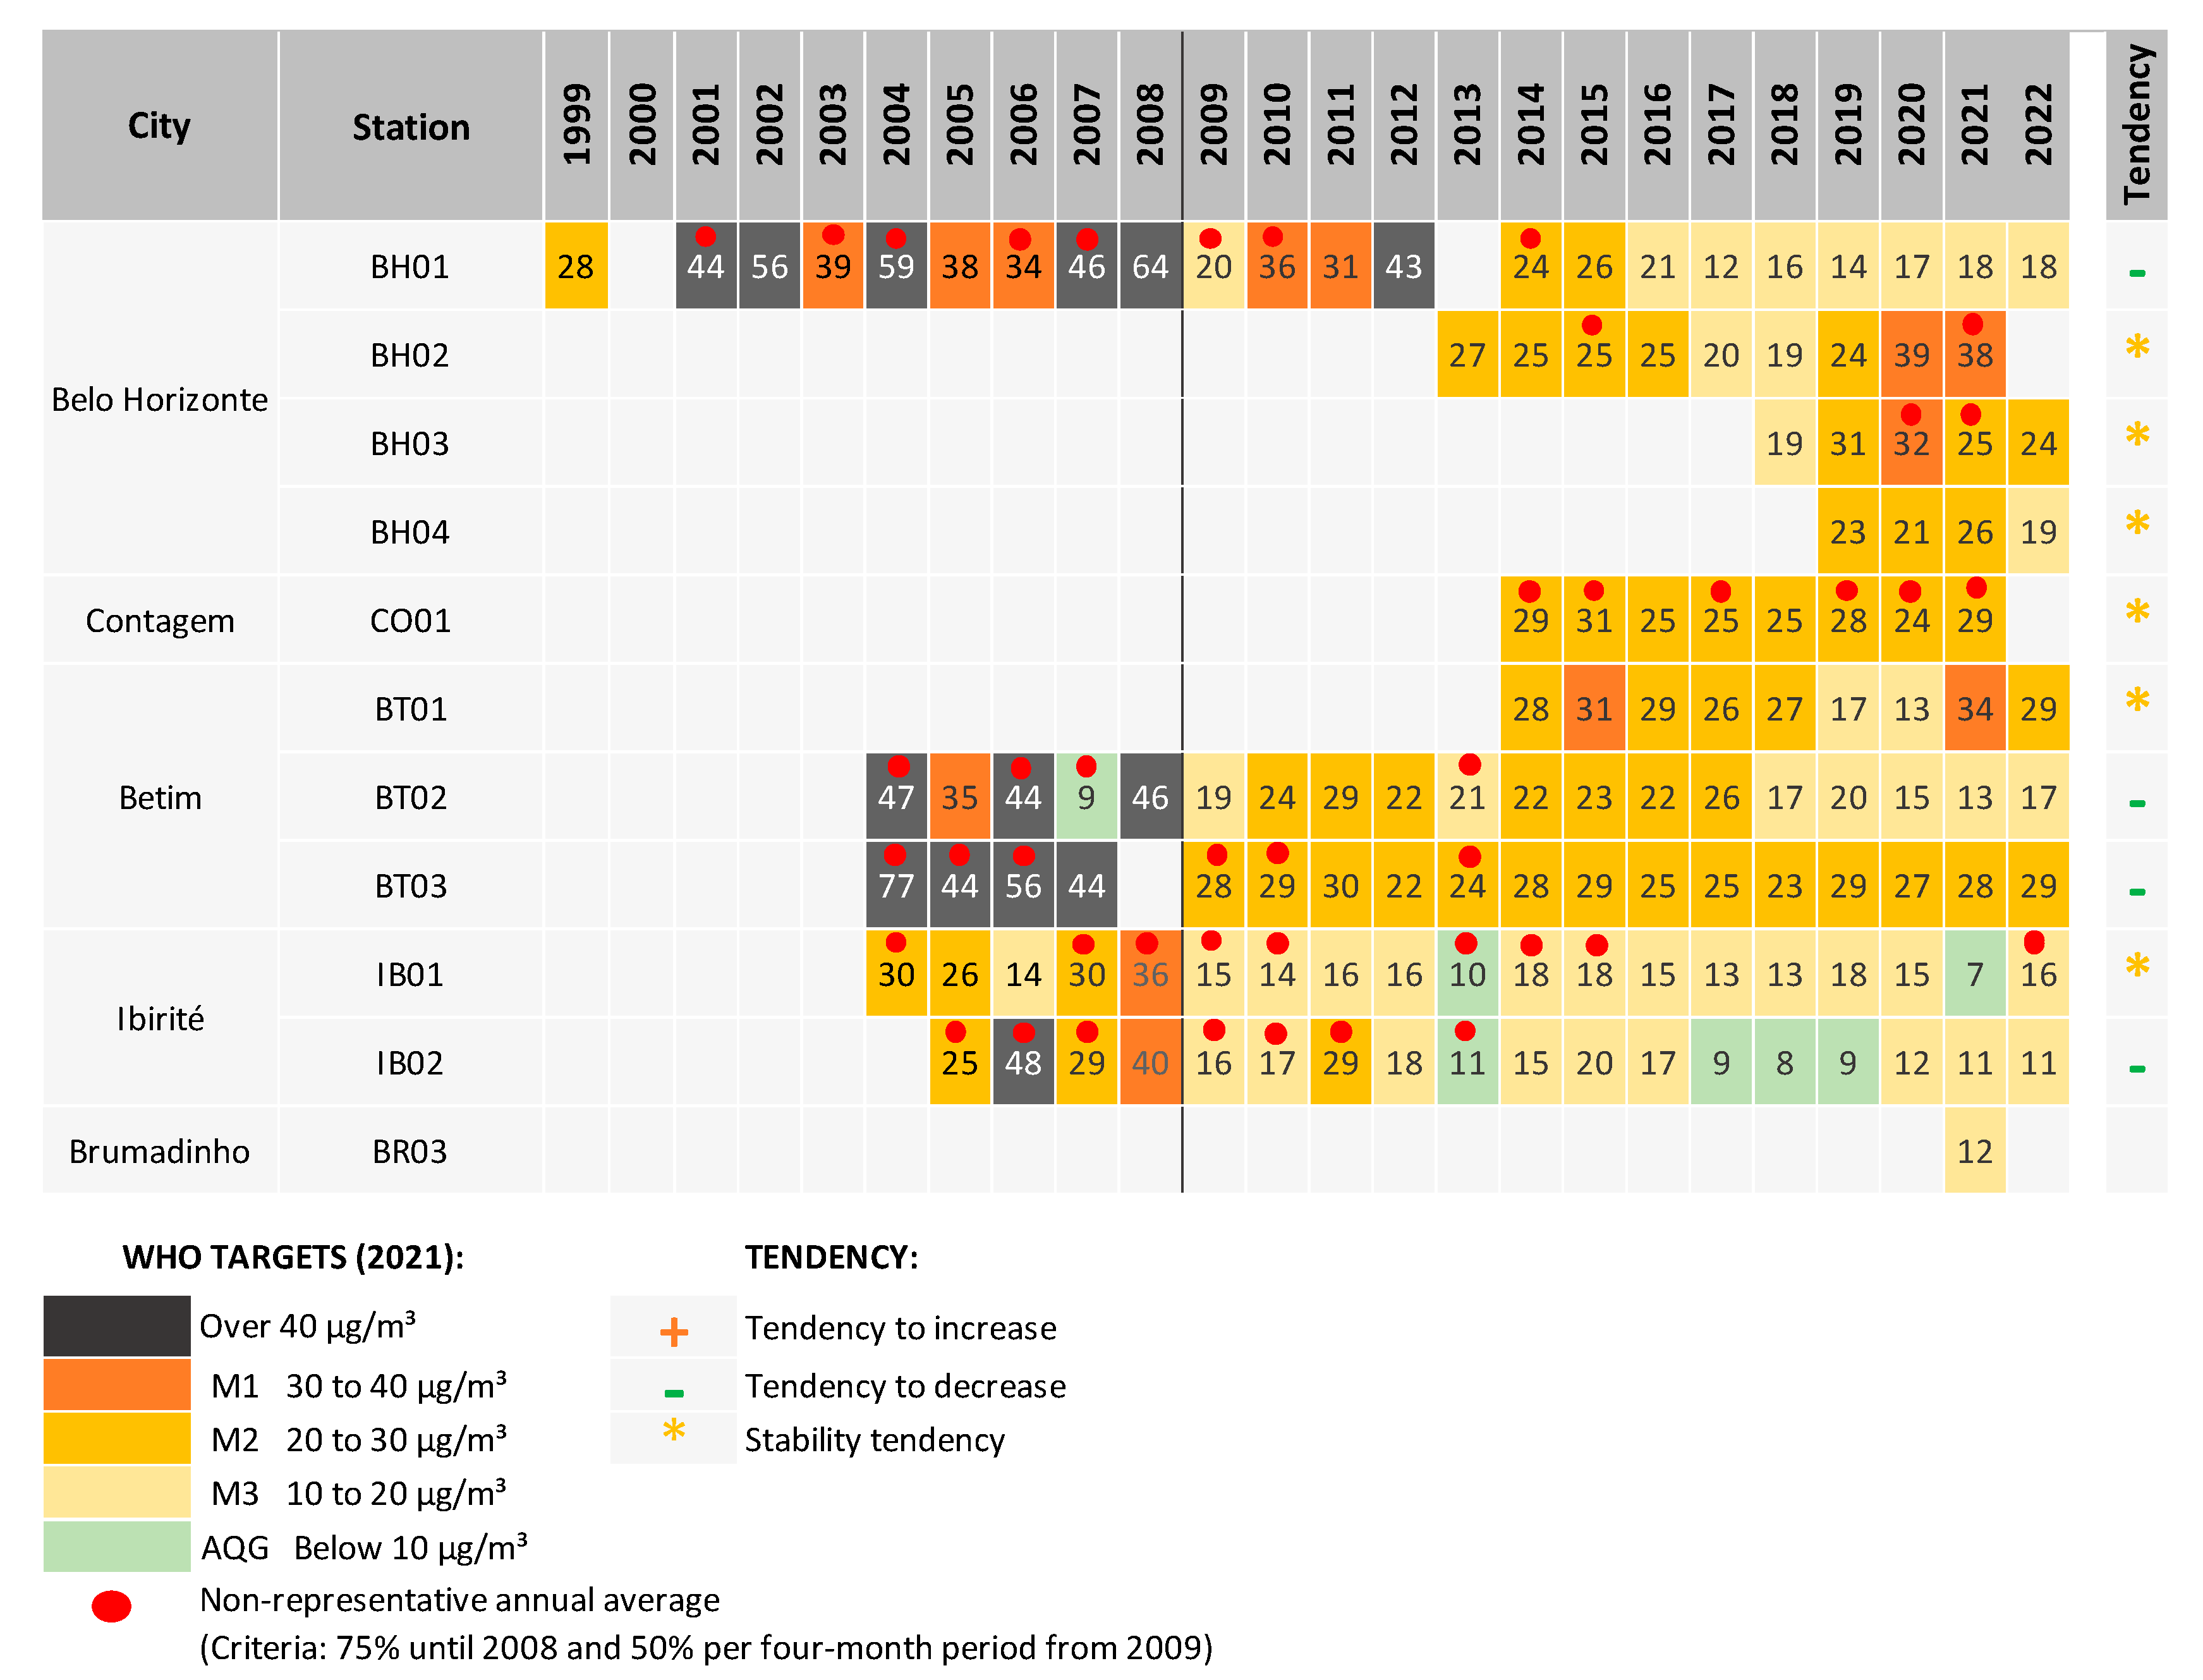
PM2.5 monitoring in the MABH area commenced in 2015 (Figure 8) and revealed concerning results. Throughout the monitoring period, the concentrations of PM2.5 consistently exceeded the AQG values, with readings falling between the M4 and M2 targets. The trend analysis of the monitoring data displayed a stable pattern for most stations, suggesting no significant improvements in air quality over time. However, station CO01 stood out as an exception, showing a noticeable and significant increase in PM2.5 concentrations over the last seven years. Despite this rise, the readings at CO01 remained within the M2 target throughout the entire time series. These findings indicate that Contagem, where station CO01 is located, experiences the most concerning air quality conditions regarding PM2.5. The consistently high levels and the positive trend observed at CO01 emphasize the severity of the situation.
Figure 8 displays the PM2.5 average concentrations for CO01 and BT01, which are the two stations with the highest readings. According to the official annual air quality report [48], BT01 is situated in an area with moderate road traffic and an industrial complex nearby. On the other hand, CO01 is located on the outskirts of the Industrial City of Contagem, close to heavily trafficked roads that connect the cities of Belo Horizonte, Contagem, and Betim. The stations SJ01, SJ04, and SJ03, located in the city of São José da Lapa, were also ranked among the worst cases in terms of PM2.5 concentrations. Among the four São José da Lapa stations, only one did not fall under the worst concentrations for both fractions of particulates. This particular station is situated near an avenue in Vespasiano, at a greater distance from the region’s lime industries. Another station with significant PM2.5 levels is BH05, located in Belo Horizonte. In the vicinity of BH05, there are various pollution sources within a 1.5 km radius, including a railway line, a steel plant, and the industrial complex of Contagem.
Regarding PM2.5 concentrations, the MABH area exhibited higher levels in regions with significant industrial influence. The stations CO01 and BT01, which recorded the two highest concentrations, were both affected by emissions from road traffic and industrial sources. According to the official state inventory [26], approximately 55% of PM2.5 emissions in the MABH area originated from road traffic emissions, 30% from industrial activities, and 14% from biomass burning. Moreover, Galvão et al. [18] conducted a study that identified higher concentrations of particulate and gas-phase PAHs associated with fire outbreaks in the MABH region. The study pinpointed four potential sources in the area: gasoline-related (31.8%), diesel-related (25.1%), biomass burning (23.4%), and mixed sources (19.6%). Their findings also underscored the increased risks associated with exposure to PM2.5-bound PAHs, particularly through ingestion and dermal contact, highlighting the urgency for mitigation and control measures to address PM2.5 pollution in the region. Additionally, it is essential to consider the spatial context. Within a 40 km radius, the intensely urbanized area of the Belo Horizonte, Contagem, Betim, and Ibirité axes is located. As PM2.5 represents the finest fraction of particulates, longer-range transport may also contribute to its presence in the region.
Regarding road traffic contributions, Santos et al. [24] found that heavy vehicles were the primary contributors to particulate emissions in the state of Minas Gerais. For PM2.5, 63.9% of emissions originated from exhaust, while 22.5% came from tire wear and brakes, and 13.5% from road wear.
Peláez et al. [16] conducted a study showing that long-term concentrations of PM2.5 in all the studied cities exceeded the WHO-AQG. In the case of Belo Horizonte, its annual PM2.5 concentrations were higher than Vitória’s but lower than São Paulo’s. However, this difference decreased over the years between 2014 and 2017, with Belo Horizonte’s annual average PM2.5 concentrations increasing while São Paulo’s decreased. In comparison to other cities in South America, Belo Horizonte exhibited lower concentrations of PM2.5 than cities like Bogotá, Medellín, Quito, Santiago, and Lima.

3.5. NO2 Averages and Trends

Figure 9 illustrates the distribution of NO2 concentrations, revealing that only Ibirité stations (IB01 and IB02) recorded annual averages below the Air Quality Guideline—AQG. However, the cities of Belo Horizonte (BH02, BH03, and BH04), Contagem (CO01), and Betim (BT01 and BT03) experienced the highest current NO2 concentrations, falling within the range of the M1 and M2 interim targets. The official inventory [26] highlights that NO2 emissions primarily originate from two sources: 86% from the road traffic group and 12% from the industrial sector. Within the industrial sector, 61% of NO2 emissions come from chemical industries, while 29% stem from metallurgical industries. An examination of NOx emissions related to the fleet profile and fuel usage in Minas Gerais in 2015 [24] revealed that 68% of NOx emissions were attributed to trucks, with an additional 23% coming from buses. Remarkably, 94% of NOx emissions from vehicle exhaust were associated with diesel-powered vehicles.
Over the last three years, the monitoring data revealed that BH02, BH03, and BT03 were the stations with the most concerning air quality, as they consistently remained between the M1 and M2 interim targets for NO2 concentrations. Figure 7 further supported this finding, confirming that the municipalities of Belo Horizonte (BH02, BH03, and BH04), Contagem (CO01), and Betim (BT03) experienced the highest NO2 levels. According to Peláez et al. [16], long-term concentrations of NO2 in all the studied cities surpassed the WHO-AQG. However, it is noteworthy that Belo Horizonte exhibited relatively lower concentrations compared to other South American cities, despite exceeding the WHO-AQG. The results showed an improvement in air quality in locations where monitoring began before 2009. Stations BH01, BT02, BT03, and IB02, situated in Belo Horizonte, Betim, and Ibirité, respectively, experienced a significant decrease in NO2 concentrations. However, other monitoring stations did not exhibit a clear trend regarding annual concentrations.

3.6. O3 Averages and Trends

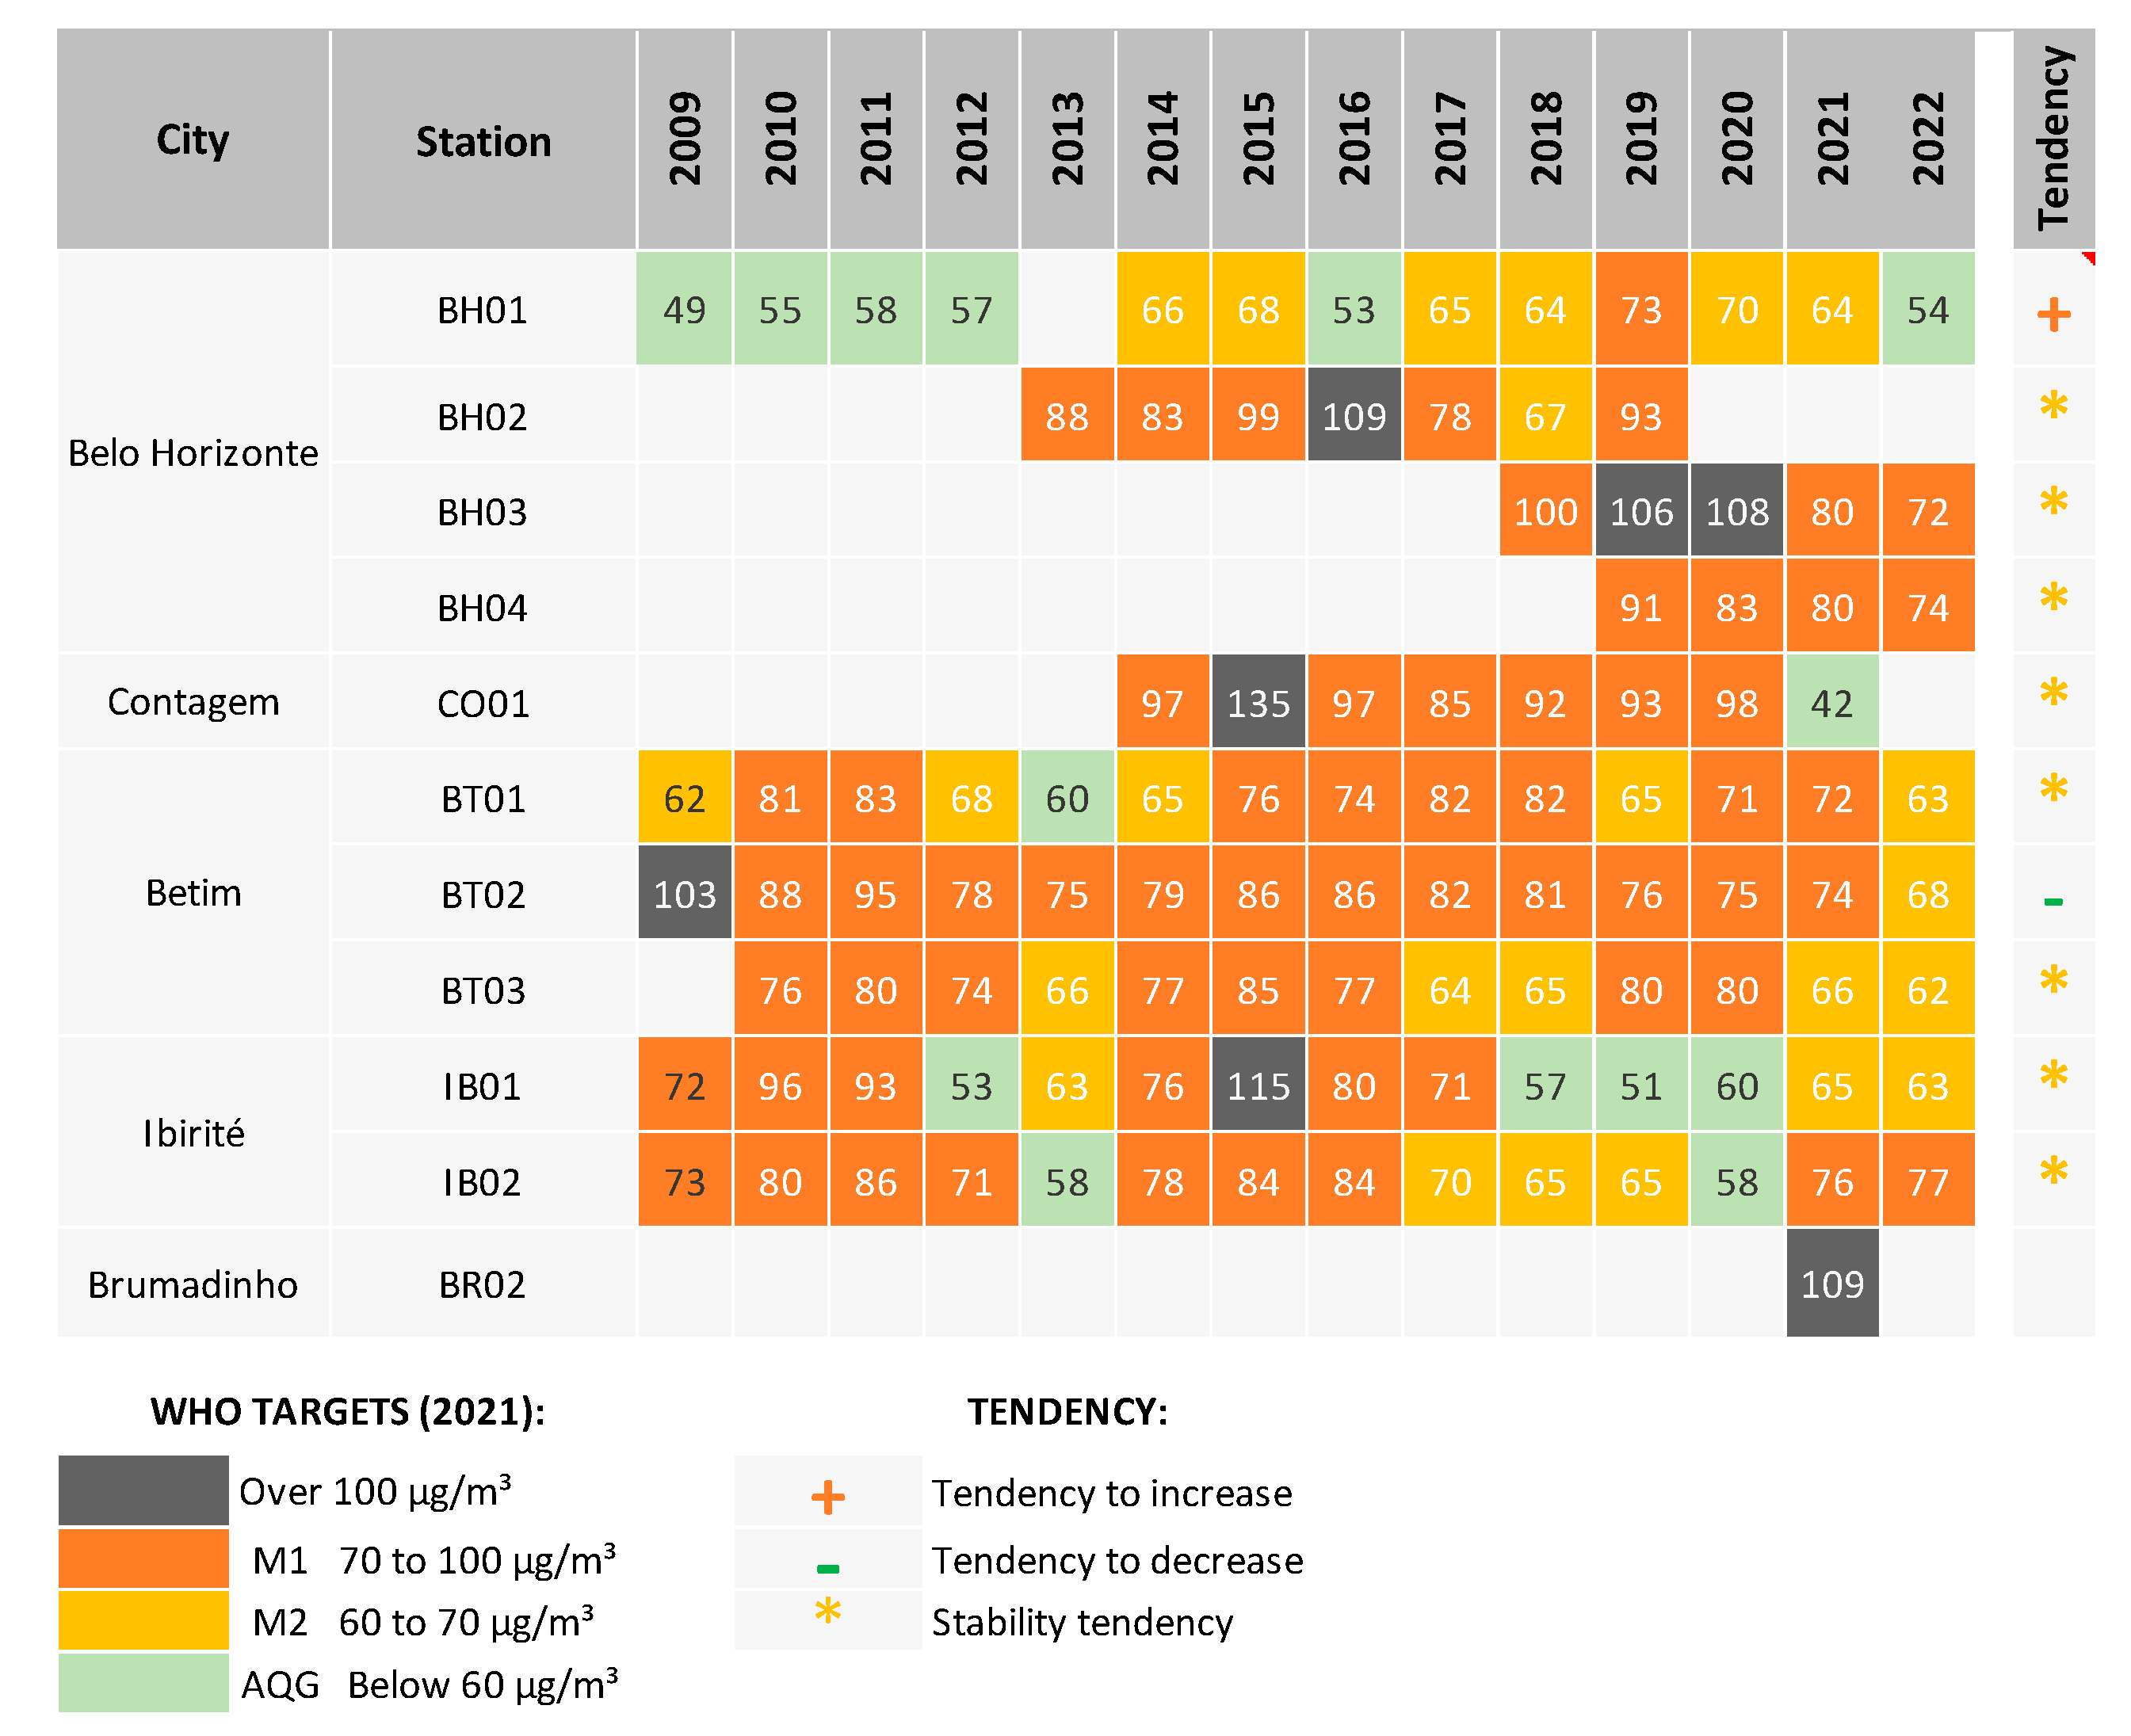
Regarding O3, Figure 10 illustrates the evolution of maximum moving averages of 6 months, calculated from the maximum daily values of representative 8 h moving averages (with a 75% representation for 8 h), starting in June 2009. the WHO guidelines, there were only a few instances when ozone concentrations remained below the AQG level, as observed at monitoring stations BH01, IB01, and IB02. However, most of the time, ozone concentrations were found between the M1 and M2 interim targets. On specific occasions, particularly in 2019 and 2021 for SJ01 and in 1996 and 1998 for BT01, concentrations exceeded 70 μg/m3, surpassing target levels. Throughout the time series, BH01 consistently displayed the best air quality among all the monitoring stations. Moreover, all the stations did not show any clear trend of improvement in air quality, except for BT02. The Mann–Whitney test indicated a negative trend for BT02, which could be attributed to the unusually high concentration in the first year of data collection in 2009, with an average exceeding 100 μg/m3.
Based on the last three years (Figure 10), the municipalities of Brumadinho (BR02), Belo Horizonte (BH03, BH02, and BH04), Contagem (CO01), and Betim (BT03) were identified as the areas with the worst Ozone (O3) pollution. Notably, Brumadinho’s station (BR02), which began monitoring in 2021, recorded the highest ozone air pollution within the MABH network, with a value of 109 μg/m3. These findings highlight the necessity for a comprehensive investigation into the factors driving the increase in ozone concentrations in this area. Aside from BR02, other stations ranking high for O3 pollution also feature prominently in the air pollution rankings for Nitrogen Dioxide (NO2), corroborating a potential correlation between high O3 and NO2 levels in these locations, warranting further scrutiny.
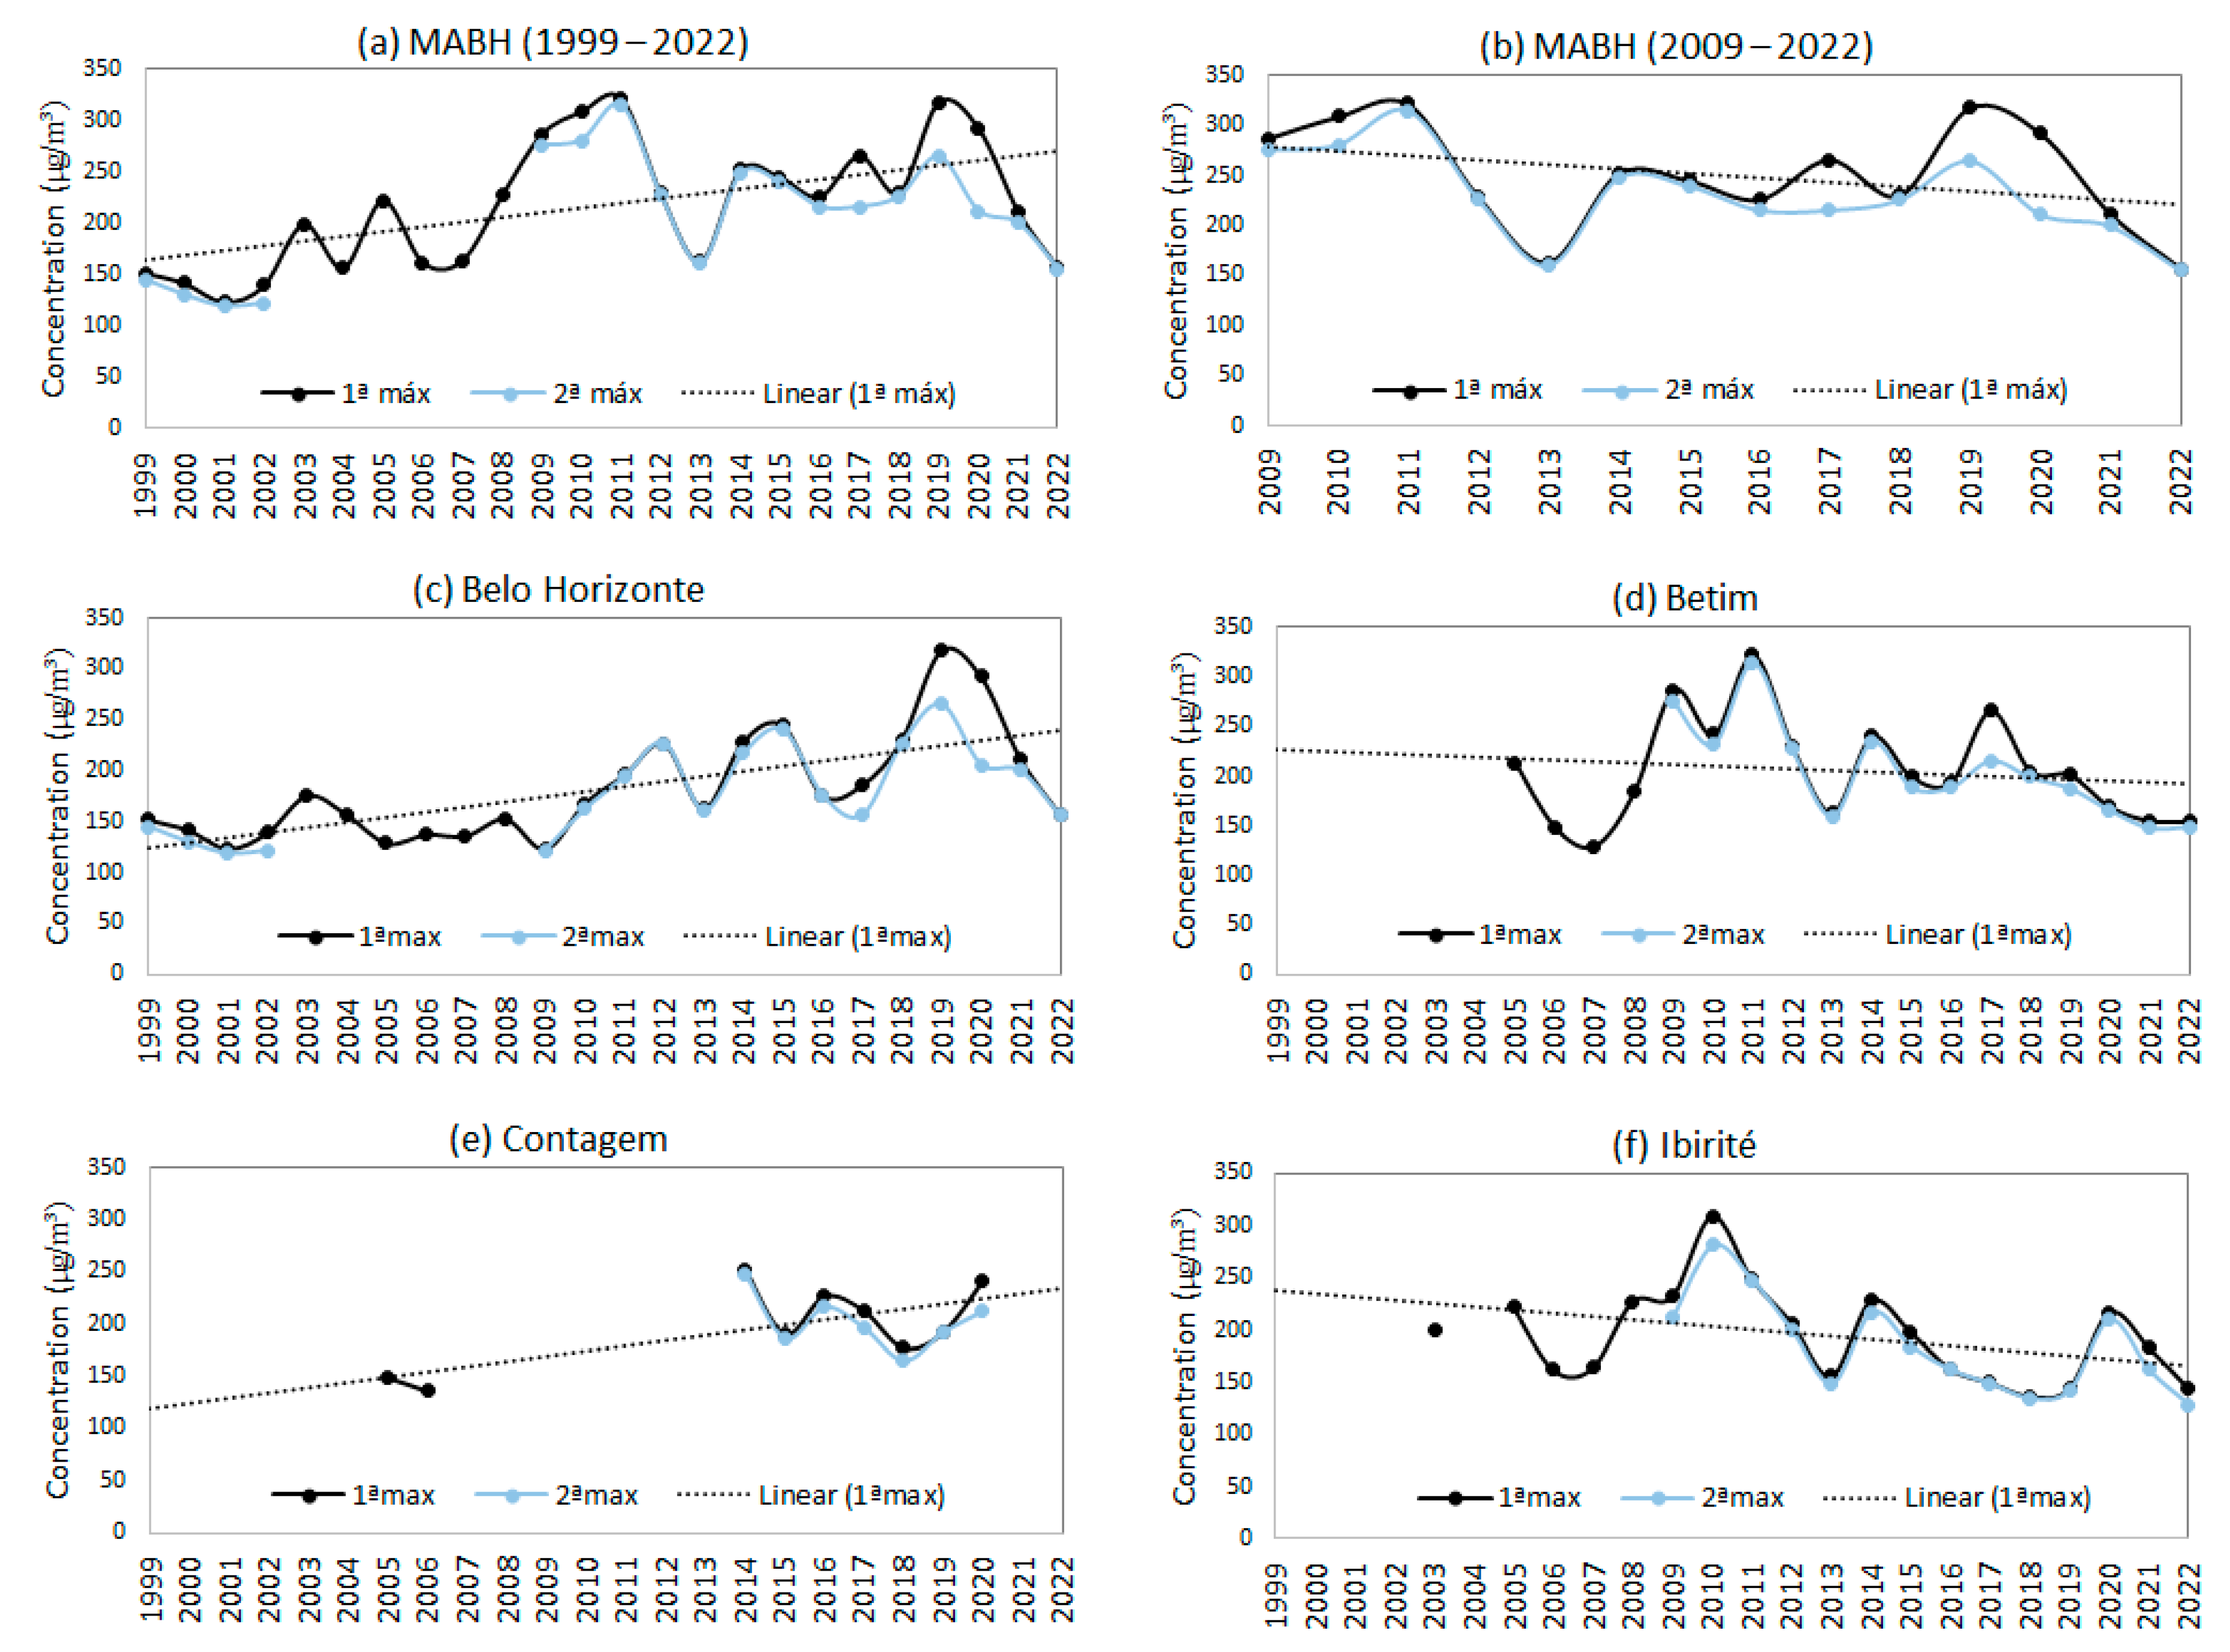
Figure 11 provides a visual representation of the historical evolution of hourly ozone concentrations in the MABHs air quality-monitoring network from 1999 to 2022, offering valuable insights into the long-term trends in ozone levels. The results from 1999 to 2022 indicate a similarity in the curves between Belo Horizonte and the entire MABH network, suggesting that O3 pollution in Belo Horizonte might influence the trend of the metropolitan region. However, analyzing the period since 2009 (panel B, Figure 11), it becomes evident that although the time series showed an increase since 1999, a reversal occurred from 2009 onwards, indicating a slight decrease. Given that O3 forms through the oxidation of atmospheric pollutants like volatile organic compounds (VOC) and NOx, it is crucial to investigate the formation processes and ideal conditions for reactivity. Understanding this is vital to finding effective ways to reduce O3 levels in the MABH. The increase in O3 concentrations, despite the presumed reduction in NO2, highlights the significance of conducting a chemical speciation study and examining the potential influence of VOC on ozone formation, as demonstrated by Alvim et al. [49] in the São Paulo region (SP/Brazil) and Galvão et al. [50] in Vitória (ES/Brazil).
According to the local emissions inventory [26], the significant contributors to VOC emissions in 2015 were biomass burning (vegetation), road traffic, and industries, particularly service and trade groups, wholesalers, and chemical industries, as well as fuel stations, liquefied petroleum gas filling plants, and landfills. However, it is important to note the possibility of overestimating VOC emissions from vegetation in this inventory. Galvão et al. [18] identified potential emission sources of PAHs in Belo Horizonte, including fine fractions of particulates and VOCs, associated with road traffic sources (gasoline and diesel), biomass burning, and mixed sources (industries and road traffic emissions related to gasoline and natural gas combustion for industrial and domestic use). Regarding particulate emissions, the local emission inventory of 2015 [26] also highlighted biomass burning as one of the main contributors, even for smaller fractions, in the region.
Peláez et al. [16] conducted a short exposure analysis and revealed that among South American cities, Brazilian cities such as Belo Horizonte, São Paulo, and Rio de Janeiro exhibited the worst O3 concentrations.

4. Conclusions

This study faces a shortage of air quality information and research focused on the MABH, which stands as the third most populous metropolitan region in Brazil. In this study, our primary objective was to comprehensively investigate the air quality characterization and trend of air pollutant concentrations within MABHs automatic network, spanning the period from 1995 to 2022.
In general, results showed that pollutants like NO2, PM10, and PM2.5 consistently exceeded WHO-AQG, posing risks to the local population. There were decreasing trends in NO2 concentrations and variations in PM levels, with a noticeable drop in PM2.5 concentrations observed in 2020. O3, CO, and SO2 did not breach WHO-AQG, and there were decreases in average concentrations for O3 and CO, whereas SO2 levels remained below the final standard in Brazilian legislation, despite not meeting WHO recommendations. This aligns with similar situations in other Brazilian and South American urban centers, highlighting the widespread challenge of air quality management in the region. Therefore, collaborative efforts involving rigorous monitoring, comprehensive research, and effective interventions are needed to ensure improved air quality and safeguard public health.
The results highlight persistent issues with high PM10 concentrations in the MABH, particularly in stations located in Contagem, Betim, and São José da Lapa. Although some stations in Contagem and Betim show improvements in air quality, they still exceed WHO guidelines. São José da Lapa stands out for consistently high PM10 levels over eight years, potentially linked to industrial and traffic-related sources. The proximity of monitoring stations to industrial sites and major roads, combined with prevailing wind patterns, suggests a strong association between these factors and heightened PM10 pollution. Additionally, PM10 levels in Brumadinho indicate mining-related sources contributing to elevated concentrations. These findings underscore the complex challenge of addressing PM10 pollution in the MABH and emphasize the need for targeted strategies to identify and control pollution sources for better air quality.
The PM2.5 monitoring from 2015 onwards consistently showed levels surpassing AQGs, notably falling between the M4 and M2 targets. While most locations displayed stable patterns, Contagem notably stood out for a significant and continuous increase in PM2.5 concentrations over seven years, remaining within the M2 target. Contagem and Betim (BT01) stations exhibited the highest PM2.5 levels, attributed to traffic and industrial emissions. São José da Lapa’s stations also ranked poorly for PM2.5 concentrations, mainly linked to industrial activities nearby. These findings align with reports indicating a majority of PM2.5 emissions originate mainly from road traffic, industries, and biomass burning. The results highlighted the urgent need for mitigation strategies. Additionally, the spatial context of the intensely urbanized Belo Horizonte-Contagem-Betim-Ibirité axis suggests potential long-range transport contributing to PM2.5 pollution in the region.
The analysis of ozone (O3) pollution in the MABH also highlights significant trends and concerns. It shows a historical increase in ozone concentrations until 2009, followed by a slight decrease thereafter. Monitoring stations showed variations in air quality, with some stations in Belo Horizonte consistently displaying better conditions, whereas newer stations in Brumadinho record alarmingly high ozone levels. There is a notable correlation between areas with high O3 pollution and elevated NO2 levels, indicating a potential link between these pollutants. This emphasizes the urgency of investigating the factors contributing to increased O3 concentrations, particularly in regions like Brumadinho, and understanding the role of pollutants like VOCs and NOx in ozone formation. The need for a chemical speciation study is emphasized to devise effective strategies for mitigating ozone pollution in the MABH region.
Lastly, this study sheds light on the existing gaps in understanding and addressing air pollution issues in the MABH. By revealing the challenges and providing valuable insights into the sources and trends of air pollutants, we hope to foster greater awareness and drive effective actions toward ensuring healthier air quality for the inhabitants of this densely populated region. Further research and a concerted effort by relevant stakeholders are essential to mitigate the adverse impacts of air pollution and protect public health in MABH.

Author Contributions

Conceptualization, A.K.C.R., E.S.G. and T.T.d.A.A.; methodology, A.K.C.R. and T.T.d.A.A.; validation, A.K.C.R.; formal analysis, A.K.C.R., E.S.G. and T.T.d.A.A.; investigation and data curation, A.K.C.R.; writing—original draft preparation, A.K.C.R. and E.S.G.; writing—review and editing, A.K.C.R., E.S.G. and T.T.d.A.A.; visualization, A.K.C.R.; supervision, T.T.d.A.A.; project administration, T.T.d.A.A.; funding acquisition, T.T.d.A.A. All authors have read and agreed to the published version of the manuscript.

Funding

This research was financed in part by the Coordenação de Aperfeiçoamento de Pessoal de Nível Superior–Brasil (CAPES)–Finance Code 001, ArcelorMittal Global R&D Brazil, METROCLIMA-MASP project (FAPESP Grant number 16/18438-0), GREENCITIES Project (FAPESP Grant number 2022/02365-5—UKRI—NERC), National Council for Scientific and Technological Development (Conselho Nacional de Desenvolvimento Científico e Tecnológico—CNPq), process 314814/2020-5 and process 406728/2022-4 and Demanda Universal (FAPEMIG Grant N.: APQ-02614-21).

Institutional Review Board Statement

Not applicable.

Informed Consent Statement

Not applicable.

Data Availability Statement

The data presented in this study are openly available in Open Science Framework at https://osf.io/vgk4m/ (accessed on 1 October 2023).

Acknowledgments

The authors would like to acknowledge the FEAM for providing the air quality and emissions data.

Conflicts of Interest

The authors declare no conflict of interest.

References

  1. World Health Organization. Evolution of WHO Air Quality Guidelines: Past, Present and Future. 2017. Available online: https://apps.who.int/iris/handle/10665/341912 (accessed on 12 January 2023).
  2. Fowler, D. A chronology of global air quality. Philos. Trans. R. Soc. A Math. Phys. Eng. Sci. 2020, 378, 20190314. [Google Scholar] [CrossRef] [PubMed]
  3. Jacobson, M.Z. Atmospheric Pollution: History, Science, and Regulation; Cambridge University Press: Cambridge, UK, 2002. [Google Scholar] [CrossRef]
  4. World Health Organization. Global Health Observatory: Air Pollution Data Portal. 2023. Available online: https://www.who.int/data/gho/data/themes/air-pollution (accessed on 12 January 2023).
  5. Organização Pan-Americana da Saúde. Novos Dados da OMS Revelam que Bilhões de Pessoas Ainda Respiram Ar Insalubre. PAHO. Available online: https://www.paho.org/pt/noticias/4-4-2022-novos-dados-da-oms-revelam-que-bilhoes-pessoas-ainda-respiram-ar-insalubre (accessed on 4 April 2022).
  6. World Health Organization. Air Quality and Health: Exposure & Health Impacts of Air Pollution. WHO, 2022. Available online: https://www.who.int/teams/environment-climate-change-and-health/air-quality-and-health/health-impacts/exposure-air-pollution (accessed on 7 April 2023).
  7. Martin, R.V.; Brauer, M.; van Donkelaar, A.; Shaddick, G.; Narain, U.; Dey, S. No one knows which city has the highest concentration of fine particulate matter. Atmos. Environ. X 2019, 3, 100040. [Google Scholar] [CrossRef]
  8. Galvão, E.S.; Feroni, R.C.; Orlando, M.T.A. A review of the main strategies used in the interpretation of similar chemical profiles yielded by receptor models in the source apportionment of particulate matter. Chemosphere 2021, 269, 128746. [Google Scholar] [CrossRef] [PubMed]
  9. Ministério da Saúde. Saúde Brasil 2018 uma Análise da Situação de Saúde e das Doenças e Agravos Crônicos: Desafios e Perspectivas. 2019. Available online: https://bvsms.saude.gov.br/bvs/publicacoes/saude_brasil_2018_analise_situacao_saude_doencas_agravos_cronicos_desafios_perspectivas.pdf (accessed on 22 September 2022).
  10. Andreão, W.L.; Albuquerque, T.T.d.A. Avoidable mortality by implementing more restrictive fine particles standards in Brazil: An estimation using satellite surface data. Environ. Res. 2021, 192, 110288. [Google Scholar] [CrossRef] [PubMed]
  11. World Health Organization. WHO Global Air Quality Guidelines: Particulate Matter (MP2.5 e MP10), Ozone, Nitrogen Dioxide, Sulfur Dioxide and Carbon Monoxide. Available online: https://iris.who.int/bitstream/handle/10665/345329/9789240034228-eng.pdf?sequence=1 (accessed on 12 January 2022).
  12. Instituto de Energia e Meio Ambiente de São Paulo. Recomendações para a Expansão e a Continuidade das Redes de Monitoramento da Qualidade do Ar no Brasil. 2022. Available online: https://energiaeambiente.org.br/wp-content/uploads/2022/07/IEMA_policypaper_qualidadedoar.pdf (accessed on 2 November 2022).
  13. Fundação Estadual do Meio Ambiente de Minas Gerais. Dados do Monitoramento Contínuo da Qualidade do Ar. 2023. Available online: http://www.feam.br/qualidade-do-ar/dados (accessed on 25 April 2023).
  14. Fundação Estadual do Meio Ambiente de Minas Gerais. Relatório Técnico: Plano de Controle da Poluição por Veículos em Uso em Minas Gerais—PCPV/MG. 2001. Available online: http://www.feam.br/images/stories/arquivos/Monitoramento/relatorio_tecnico_%20pcpv-mg.pdf (accessed on 14 March 2022).
  15. Andreão, W.L.; Albuquerque, T.T.d.A. Fine particles as a public health indicator in Brazil: From monitoring to modeling. Air Qual. Atmos. Health 2020, 13, 1453–1463. [Google Scholar] [CrossRef]
  16. Peláez, L.M.G.; Santos, J.M.; Albuquerque, T.T.d.A.; Reis, N.C.; Andreão, W.L.; Andrade, M.F. Air quality status and trends over large cities in South America. Environ. Sci. Policy 2020, 114, 422–435. [Google Scholar] [CrossRef]
  17. Pérez-Martínez, P.J.; Andrade, M.F.; Miranda, R.M. Traffic-related air quality trends in São Paulo, Brazil. J. Geophys. Res. Atmos. 2015, 120, 6290–6304. [Google Scholar] [CrossRef]
  18. Galvão, E.S.; Paiva, H.B.; Menezes, H.C.; Albuquerque, T.T.d.A.; Cardeal, Z.d.L. Cancer risk assessment and source apportionment of the gas-and particulate-phase of the polycyclic aromatic hydrocarbons in a metropolitan region in Brazil. Chemosphere 2023, 311, 136872. [Google Scholar] [CrossRef]
  19. Andreão, W.L.; Alonso, M.F.; Kumar, P.; Pinto, J.A.; Pedruzzi, R.; Albuquerque, T.T.A. Top-down vehicle emission inventory for spatial distribution and dispersion modeling of particulate matter. Environ. Sci. Pollut. Res. 2020, 27, 35952–35970. [Google Scholar] [CrossRef]
  20. Ribeiro, A.K.C.; Emrich, A.L.; Maia, B.L.V.; Marques, D.D.; Ramos, M.C.A.F.; Torres, V.A.; Galvão, E.S.; Albuquerque, T.T.A. Influence of Meteorology on Fine Particles Concentration in an Urban Center in Southeast of Brazil. In Air Pollution Modeling and Its Application XXVIII. ITM 2021; Mensink, C., Jorba, O., Eds.; Springer Proceedings in Complexity; Springer: Cham, Switzerland, 2022. [Google Scholar] [CrossRef]
  21. Andreão, W.L.; Pinto, J.A.; Pedruzzi, R.; Kumar, P.; Albuquerque, T.T.A. Quantifying the impact of particle matter on mortality and hospitalizations in four Brazilian metropolitan areas. J. Environ. Manag. 2020, 270, 110840. [Google Scholar] [CrossRef]
  22. Pinto, J.A.; Kumar, P.; Alonso, M.F.; Andreão, W.L.; Pedruzzi, R.; Espinosa, S.I.; Albuquerque, T.T.A. Kriging method application and traffic behavior profiles from local radar network database: A proposal to support traffic solutions and air pollution control strategies. Sustain. Cities Soc. 2020, 56, 102062. [Google Scholar] [CrossRef]
  23. Santos, F.S.; Miranda, G.A.; Carvalho AN, M.; Carvalho VS, B.; Albuquerque, T.T.A. Regulated air pollutant emissions from higher emitters stationary sources in Belo Horizonte, Minas Gerais, Brazil. Braz. J. Chem. Eng. 2019, 36, 775–784. [Google Scholar] [CrossRef]
  24. Santos, F.S.; Andreão, W.L.; Miranda, G.A.; Carvalho, A.N.M.; Pinto, J.A.; Pedruzzi, R.; Carvalho, V.S.B.; Albuquerque, T.T.A. Vehicular air pollutant emissions in a developing economy with the widespread use of biofuels. Urban Clim. 2021, 38, 100889. [Google Scholar] [CrossRef]
  25. Instituto Brasileiro de Geografia e Estatística. IBGE Divulga as Estimativas da População dos Municípios para 2019. 2019. Available online: https://agenciadenoticias.ibge.gov.br/agencia-sala-de-imprensa/2013-agencia-denoticias/releases/25278-ibge-divulga-as-estimativas-da-populacao-dos-municipios-para2019 (accessed on 23 October 2022).
  26. Fundação Estadual do Meio Ambiente de Minas Gerais. Relatório Técnico: Atualização do Inventário das Fontes de Emissão de Poluentes Atmosféricos da Região de Belo Horizonte, Contagem e Betim. 2018. Available online: http://www.feam.br/images/stories/2019/QUALIDADE_AR/Relatório_Técnico_Inventário_RMBH.pdf (accessed on 17 July 2022).
  27. Fundação Estadual do Meio Ambiente de Minas Gerais. Relatórios Anuais de Qualidade do Ar. 2023. Available online: http://www.feam.br/qualidade-do-ar/-relatorios-anuais-de-qualidade-do-ar (accessed on 25 April 2023).
  28. Fundação Estadual do Meio Ambiente de Minas Gerais. Notas Técnicas, Artigos e Publicações. Available online: http://www.feam.br/qualidade-do-ar/-notas-tecnicas-artigos-e-publicacoes (accessed on 25 April 2023).
  29. Ministério do Meio Ambiente. Guia Técnico para o Monitoramento e Avaliação da Qualidade do Ar. 2019. Available online: https://www.gov.br/mma/pt-br/centrais-de-conteudo/mma-guia-tecnico-qualidade-do-ar-pdf (accessed on 4 June 2022).
  30. IDE Sisema. Regularização Ambiental: Licenciamento Ambiental (FEAM). Available online: https://idesisema.meioambiente.mg.gov.br/webgis (accessed on 14 March 2023).
  31. Chaim, M.S. Utilização de Redes Neurais Artificiais para Previsão da Concentração de Material Particulado no Município de São José da Lapa (MG). Bachelor’s Thesis, Centro Federal de Educação Tecnológica de Minas Gerais, Departamento de Ciência e Tecnologia Ambiental—DCTA, Belo Horizonte, Brazil, 2019. Available online: https://www.dcta.cefetmg.br/wp-content/uploads/sites/21/2019/07/201622080513_Marcos-Souza.pdf (accessed on 25 July 2023).
  32. Plano Diretor de Desenvolvimento Integrado da Região Metropolitana de Belo Horizonte. (n.d.) Mobilidade, Comunicações, Transportes e Sistema Viário. Available online: http://www.rmbh.org.br/pddi/index9d2a.html?option=com_content&view=article&id=29&Itemid=27 (accessed on 25 July 2023).
  33. Pant, P.; Harrison, R.M. Estimation of the contribution of road traffic emissions to particulate matter concentrations from field measurements: A review. Atmos. Environ. 2013, 77, 78–97. [Google Scholar] [CrossRef]
  34. Zhang, Y.; Wang, X.; Li, G.; Yang, W.; Huang, Z.; Zhang, Z.; Huang, X.; Deng, W.; Liu, T.; Huang, Z.; et al. Emission factors of fine particles, carbonaceous aerosols and traces gases from road vehicles: Recent tests in an urban tunnel in the Pearl River Delta, China. Atmos. Environ. 2015, 122, 876–884. [Google Scholar] [CrossRef]
  35. Hetem, I.G.; Andrade, M.D.F. Characterization of fine particulate matter emitted from the resuspension of road and pavement dust in the Metropolitan Area of São Paulo, Brazil. Atmosphere 2016, 7, 31. [Google Scholar] [CrossRef]
  36. Moura, I.F.S. Avaliação de MP10 na Região Metropolitana de Belo Horizonte. Master’s Thesis, Universidade Federal de Minas Gerais, Universidade Federal de Minas Gerais Research Repository, Belo Horizonte, Brazil, 2016. Available online: https://repositorio.ufmg.br/bitstream/1843/BUBD-A9EEKR/1/disserta__o_igor_felipe_silva_moura___final.pdf (accessed on 25 July 2023).
  37. Andrade, M.F.; Kumar, P.; Freitas, E.D.; Ynoue, R.Y.; Martins, J.; Martins, L.D.; Nogueira, T.; Perez-Martinez, P.; Miranda, R.M.; Albuquerque, T.T.A.; et al. Air quality in the megacity of São Paulo: Evolution over the last 30 years and future perspectives. Atmos. Environ. 2017, 159, 66–82. [Google Scholar] [CrossRef]
  38. Carvalho, V.S.B.; Freitas, E.D.; Martins, L.D.; Martins, J.A.; Mazzoli, C.R.; Andrade, M.F. Air quality status and trends over the Metropolitan Area of São Paulo, Brazil as a result of emission control policies. Environ. Sci. Policy 2015, 47, 68–79. [Google Scholar] [CrossRef]
  39. ELAPSE, Effects of Low-Level Air Pollution: A Study in Europe. Available online: http://www.elapseproject.eu/ (accessed on 21 October 2023).
  40. CONAMA Resolution nº 491. 2018. Available online: https://www.in.gov.br/web/guest/materia/-/asset_publisher/Kujrw0TZC2Mb/content/id/51058895/do1-2018-11-21-resolucao-n-491-de-19-de-novembro-de-2018-51058603 (accessed on 14 January 2021).
  41. World Health Organization. Air Quality Guidelines for Particulate Matter, Ozone, Nitrogen Dioxide and Sulfur Dioxide: Global Update 2005. 2006. Available online: https://apps.who.int/iris/handle/10665/107823 (accessed on 12 January 2022).
  42. Instituto Estadual do Ambiente do Rio de Janeiro. Relatório da Qualidade do Ar do Estado do Rio de Janeiro: Ano Base 2018. 2020. Available online: http://www.inea.rj.gov.br/wp-content/uploads/2020/11/relatorio-qualidade-ar-2018.pdf (accessed on 2 June 2022).
  43. Instituto de Meio Ambiente e Recurso Hídricos do Espírito Santo. Qualidade do Ar: Relatórios de Qualidade do Ar. 2022. Available online: https://iema.es.gov.br/qualidadedoar/relatorios (accessed on 2 June 2022).
  44. Ireno, P.K.M. Modelagem da Dispersão de Material Particulado para Avaliação da Qualidade do Ar do Município de São José da Lapa/MG. Master Degree Thesis, Universidade Federal de Minas Gerais, Universidade Federal de Minas Gerais Research Repository, Belo Horizonte, Brazil, 2015. Available online: http://hdl.handle.net/1843/IGCM-AXAHXG (accessed on 12 September 2022).
  45. Galvão, E.S.; Santos, J.M.; Reis, N.C., Jr.; Feroni, R.C.; Orlando, M.T.A. The mineralogical composition of coarse and fine particulate material, their fate, and sources in an industrialized region of southeastern Brazil. Environ. Monit. Assess. 2022, 194. [Google Scholar] [CrossRef]
  46. MAPBIOMAS. (n.d.) A cada ano, Brasil queima área maior que a Inglaterra. Available online: https://brasil.mapbiomas.org/a-cada-ano-brasil-queima-area-maior-que-a-inglaterra (accessed on 25 July 2023).
  47. Tingting, Y.; Yuming, G.; Chen, G.; Yue, X.; Xu, R.; Coêlho, M.S.Z.S.; Saldiva, P.H.N.; Zhao, Q.; Li, S. Risk and burden of hospital admissions associated with wildfire-related PM2·5 in Brazil, 2000–2015: A nationwide time-series study. Lancet 2021, 5, 599–607. [Google Scholar] [CrossRef]
  48. Fundação Estadual do Meio Ambiente de Minas Gerais. Monitoramento da Qualidade do Ar na Região Metropolitana de Belo Horizonte: Ano Base de 2014. 2023. Available online: http://www.feam.br/images/stories/2016/QUALIDADE_AR/Monitoramento_da_qualidade_do_ar_2014.pdf (accessed on 25 September 2023).
  49. Alvim, D.S.; Gatti, L.V.; Corrêa, S.M.; Chiquetto, J.B.; Santos, G.M.; Rossatti, C.S.; Pretto, A.; Rozante, J.R.; Figueiroa, S.N.; Pendharkar, J.; et al. Determining VOCs Reactivity for Ozone Forming Potential in the Megacity of São Paulo. Aerosol Air Qual. Res. 2018, 18, 2460–2474. [Google Scholar] [CrossRef]
  50. Galvão, E.S.; Santos, J.M.; Reis, N.C., Jr.; Stuetz, R.M. Volatile organic compounds speciation and their influence on ozone formation potential in an industrialized urban area in Brazil. Environ. Technol. 2016, 37, 2133–2148. [Google Scholar] [CrossRef] [PubMed]
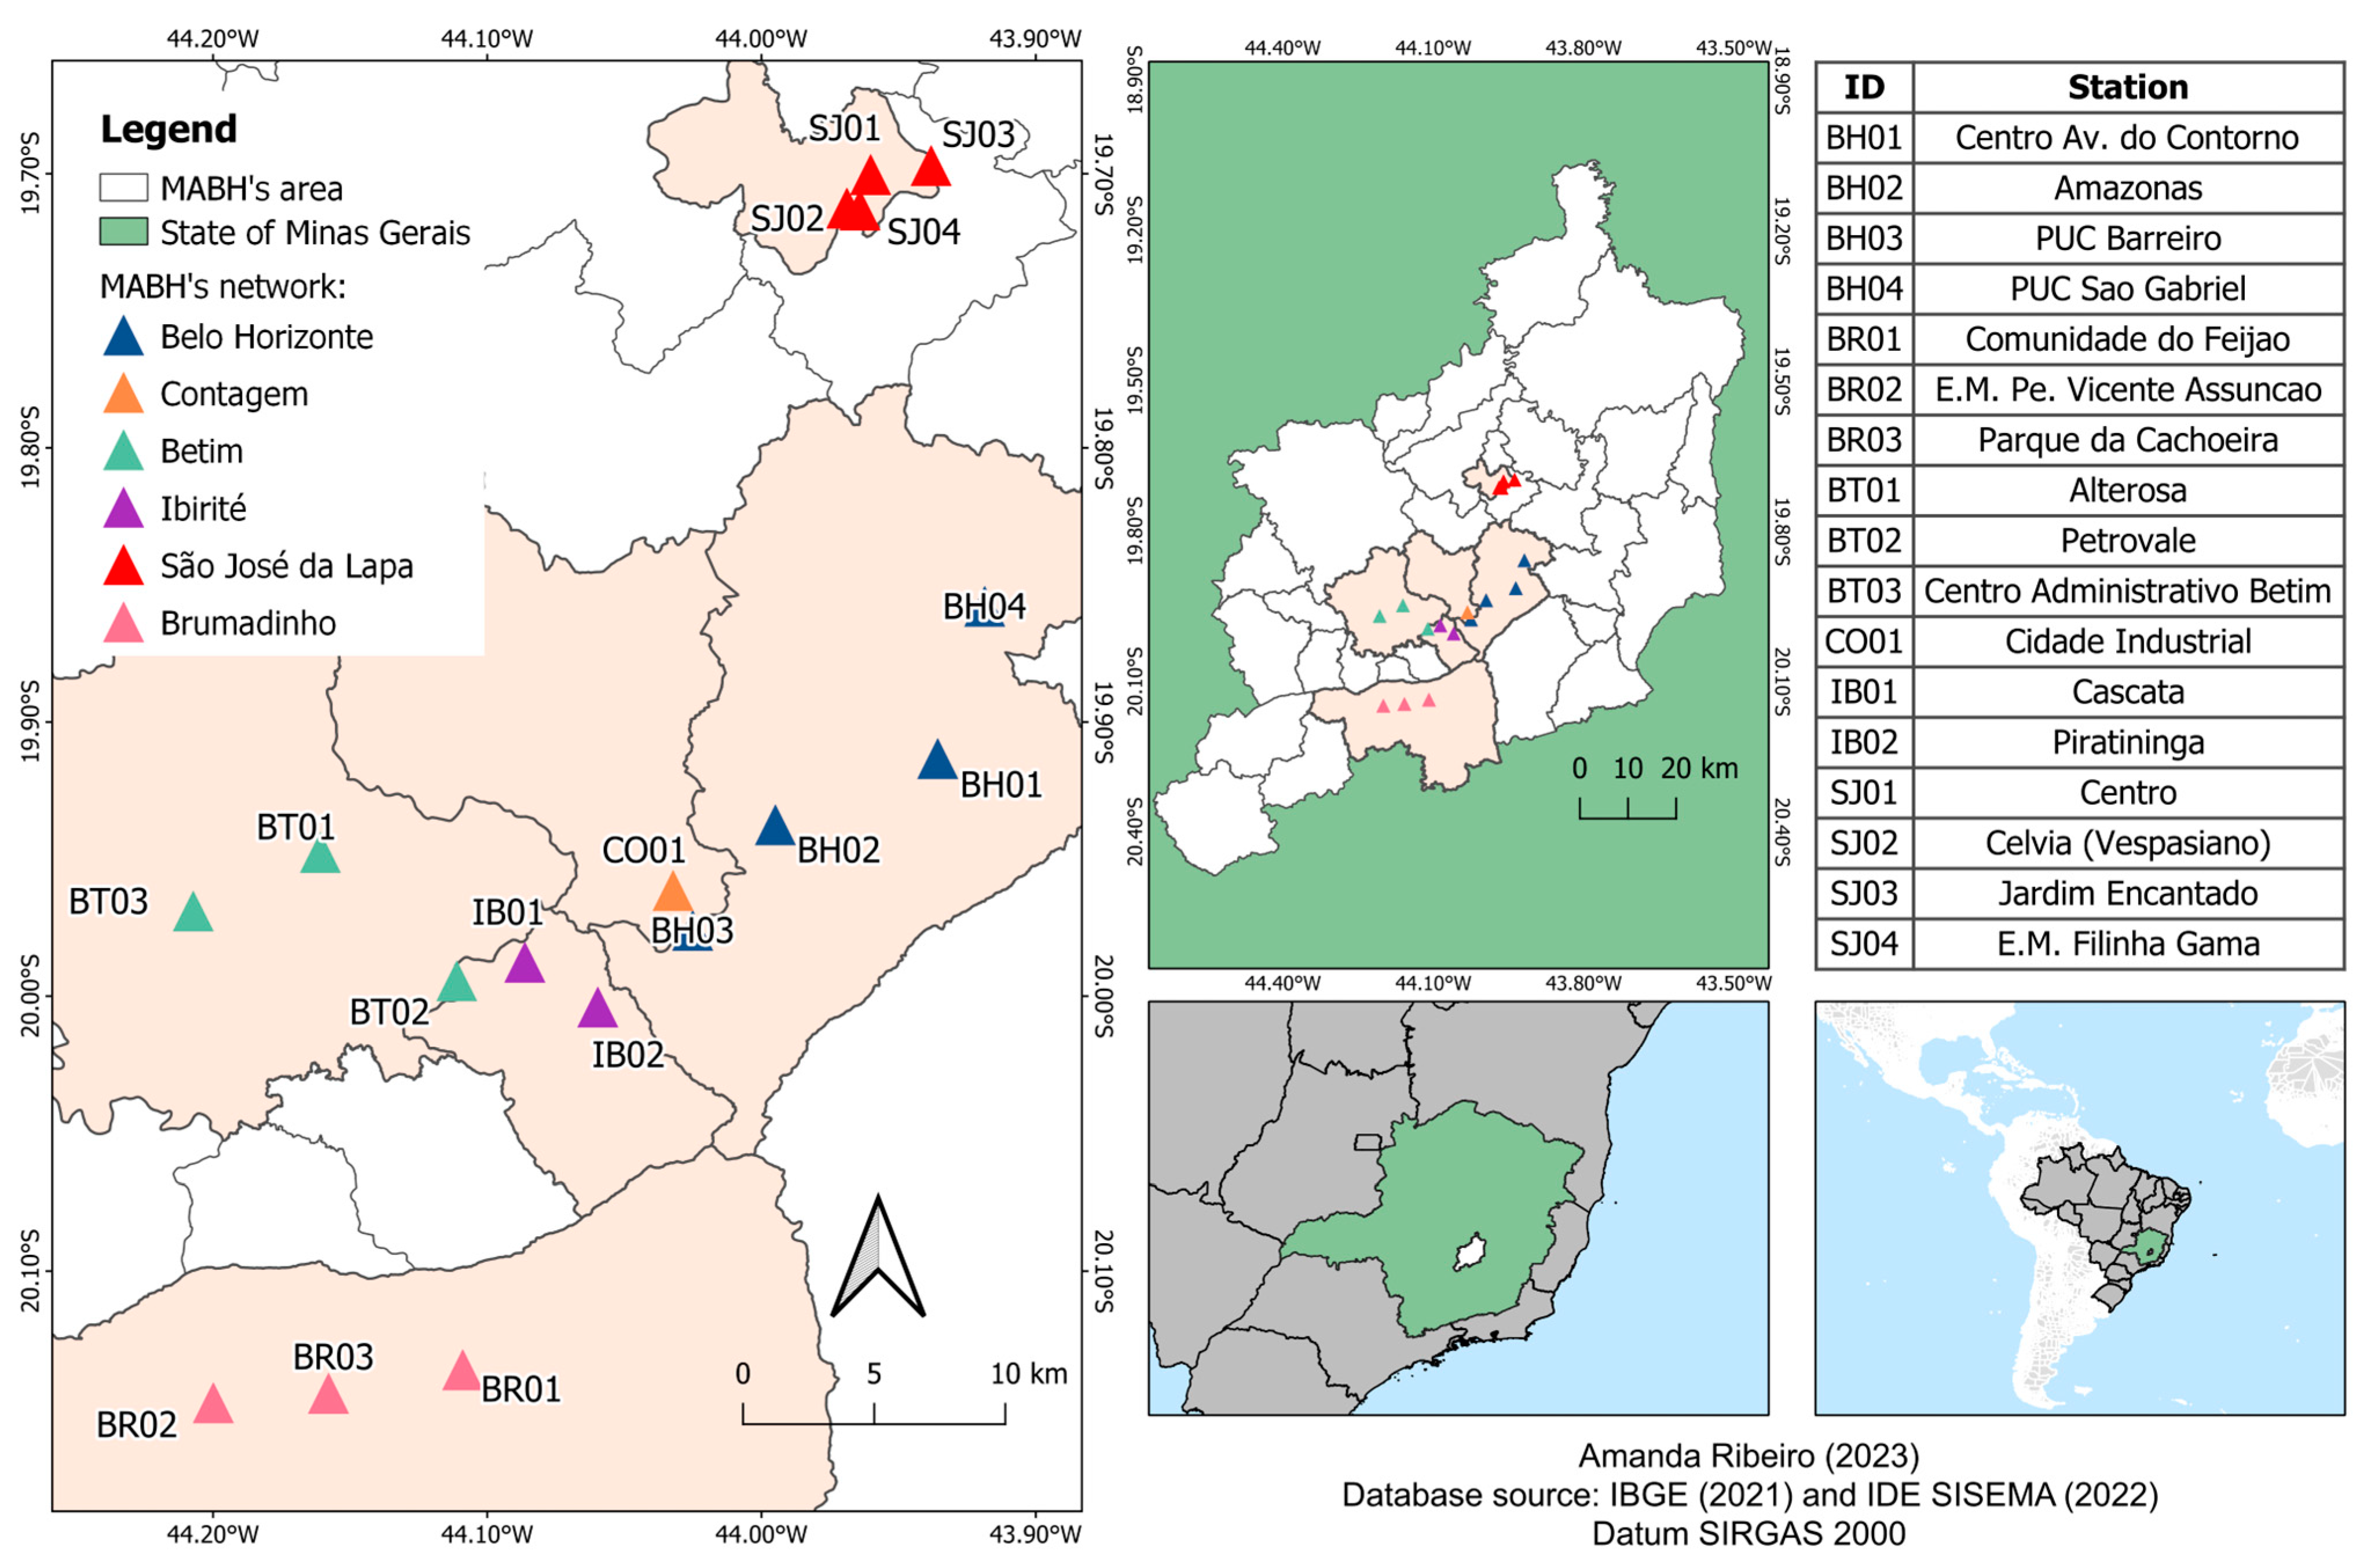
Figure 1. Locations of the MABHs air quality network.
Atmosphere 14 01792 g001
Figure 3. State official source inventory for the year 2015, in the MABH considering Belo Horizonte, Betim, and Contagem, in tons/year. (a) All sources groups. (b) Industrial groups.
Atmosphere 14 01792 g003
Figure 4. State licenses by industrial category for each city covered by the air quality network: Belo Horizonte; Betim; Contagem; Brumadinho; Ibirité; and São José da Lapa.
Atmosphere 14 01792 g004
Figure 5. Evolution between 1995 and 2022 of the average values of pollutant concentrations measured at the MABH air quality monitoring for annual concentrations of (a) PM10, (b) PM2.5, (c) O3, (d) NO2, (e) SO2, and (f) CO. Note: NA—Not Apply.
Atmosphere 14 01792 g005
Figure 6. Average annual concentrations of PM10, in μg/m3, between 1995 and 2022, classified according to WHO air quality guidelines.
Atmosphere 14 01792 g006
Figure 7. Ranking of the MABHs six stations with the highest last three-year averages (2019–2021).
Atmosphere 14 01792 g007
Figure 8. Average annual concentrations of PM2.5, in μg/m3, between 1995 and 2022, classified according to WHO air quality guidelines.
Atmosphere 14 01792 g008
Figure 9. Average annual concentrations of NO2, in μg/m3, between 1995 and 2022, classified according to WHO air quality guidelines.
Atmosphere 14 01792 g009
Figure 10. The annual maximum peak season concentrations of O3, in μg/m3, between 1995 and 2022 were classified according to WHO air quality guidelines.
Atmosphere 14 01792 g010
Figure 11. First and second maximum concentrations of hourly ozone at the MABHs air quality-monitoring network, from 1999 to 2022.
Atmosphere 14 01792 g011
Table 1. Recommended AQG levels and interim targets for long-term exposures.
PollutantAveraging TimeLevels
Interim TargetsAQG
1234
P M 2.5 μg/m3Annual a352515105
P M 10 μg/m3Annual a7050302015
O 3 μg/m3Peak season b10070--60
N O 2 μg/m3Annual a403020-10
a Approximately 99th percentile (i.e., 3–4 exceedance days per year). b Average of daily maximum 8 h mean O3 concentration in the six consecutive months with the highest six-month running-average O3 concentration. Reference: Adapted from OMS (2021) [11].
Table 2. Mann–Kendall test results between 1995 and 2022 for PM10, PM2.5, NO2, and O3.
CityStationPM10
(1995–2022)
PM2.5
(2015–2022)
NO2
(1995–2022)
O3
(1995–2022)
p-ValueSTendencyp-ValueSTendencyp-ValueSTendencyp-ValueSTendency
Belo HorizonteBH010.2556None0.803None0.00−125Negative0.1031None
BH020.1335None0.555None1.000None0.39−8None
BH031.000None0.812None1.000None0.46−4None
BH040.732None1.000None0.73−2None0.09−6None
ContagemCO010.01−79Negative0.0021Positive0.39−8None0.39−8None
BetimBT010.00−193Negative0.1114None0.60−6None1.00−1None
BT020.00−111Negative0.398None0.00−83Negative0.00−59Negative
BT030.01−69Negative0.714None0.03−59Negative0.36−16None
IbiritéIB010.4821None0.1313None0.09−49None0.13−29None
IB020.0166Positive0.625None0.00−85Negative0.38−17None
São José da LapaSJ010.90−2None0.546None------
SJ020.71−4None0.13−13None------
SJ030.90−2None0.11−14None------
SJ040.0418Positive0.2710None------
BrumadinhoBR010.07−13None1.00−1None------
BR021.00−1None0.303None------
BR031.00−1None1.00−1None------
Note: (i) if the p-value is below 0.05, it suggests a significant tendency; and (ii) if S is positive, it suggests a positive tendency.
Disclaimer/Publisher’s Note: The statements, opinions and data contained in all publications are solely those of the individual author(s) and contributor(s) and not of MDPI and/or the editor(s). MDPI and/or the editor(s) disclaim responsibility for any injury to people or property resulting from any ideas, methods, instructions or products referred to in the content.