Climatic and Vegetation Response Patterns over South Africa during the 2010/2011 and 2015/2016 Strong ENSO Phases
Abstract
1. Introduction
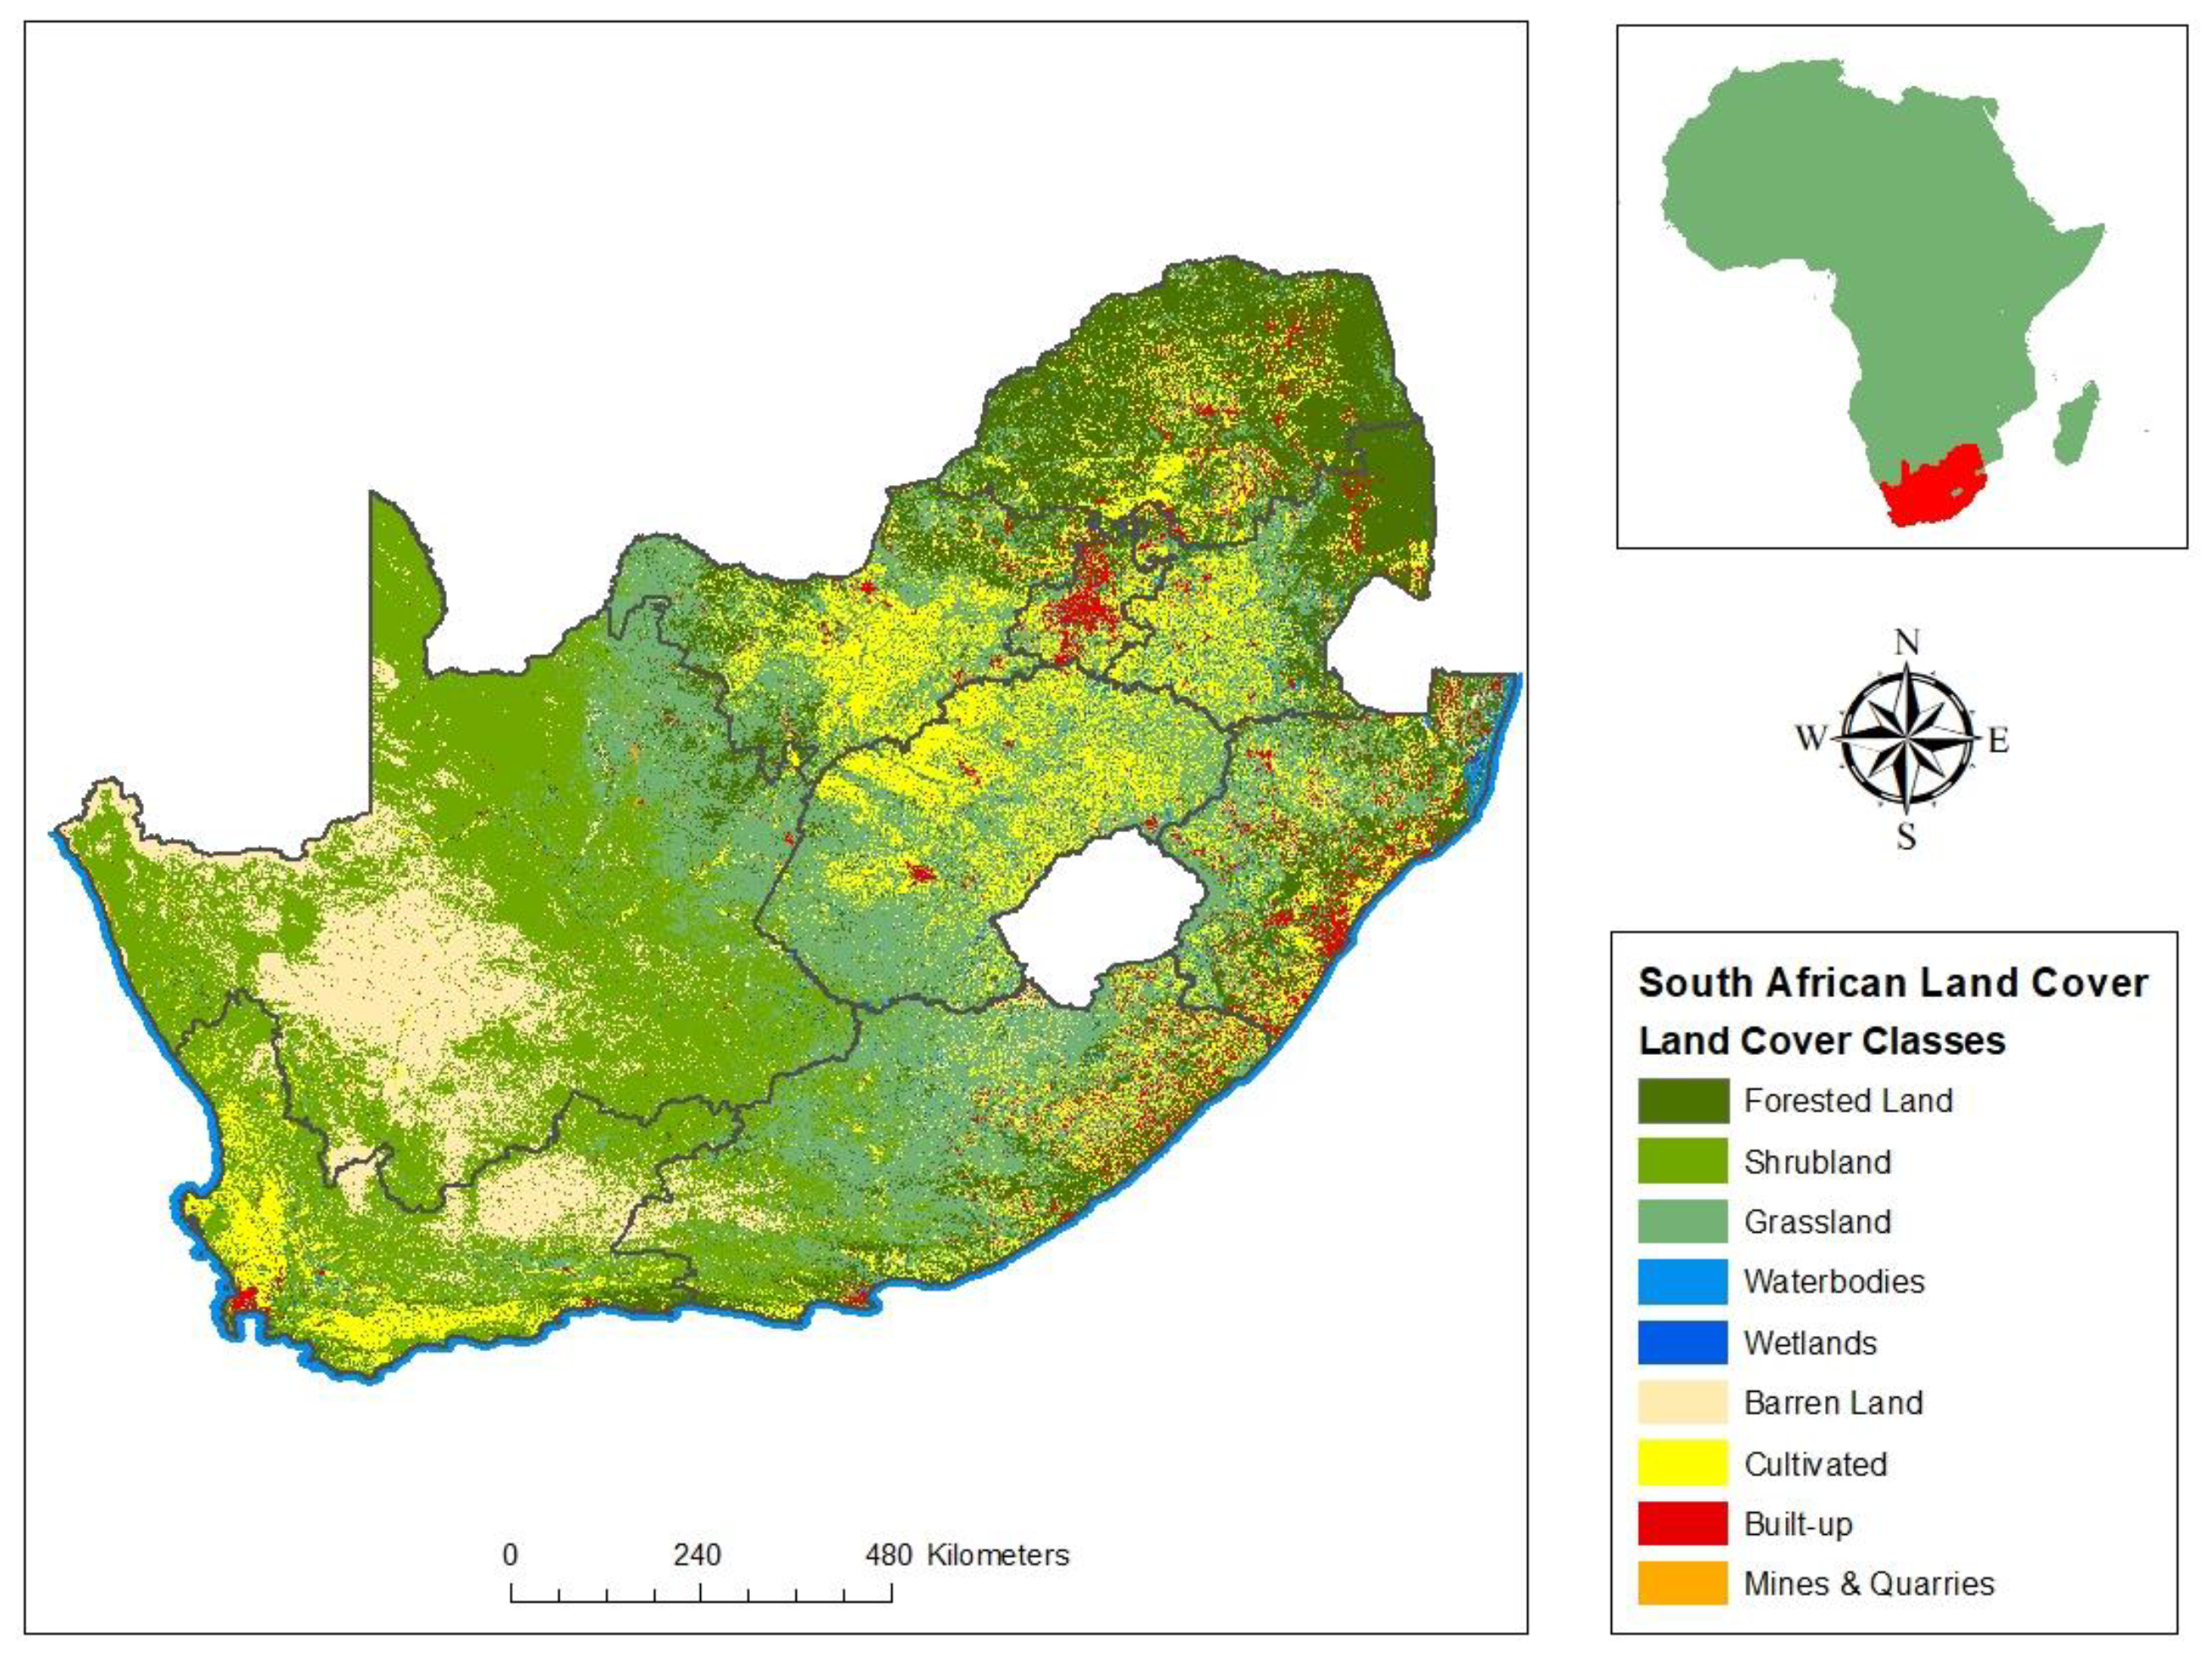
2. Study Area
3. Data and Methods
3.1. Data
3.1.1. Global Precipitation Measurement
3.1.2. Moderate Resolution Imaging Spectroradiometer
3.1.3. Modern-Era Retrospective analysis for Research and Applications, Version 2
3.1.4. Atmospheric Infrared Sounder
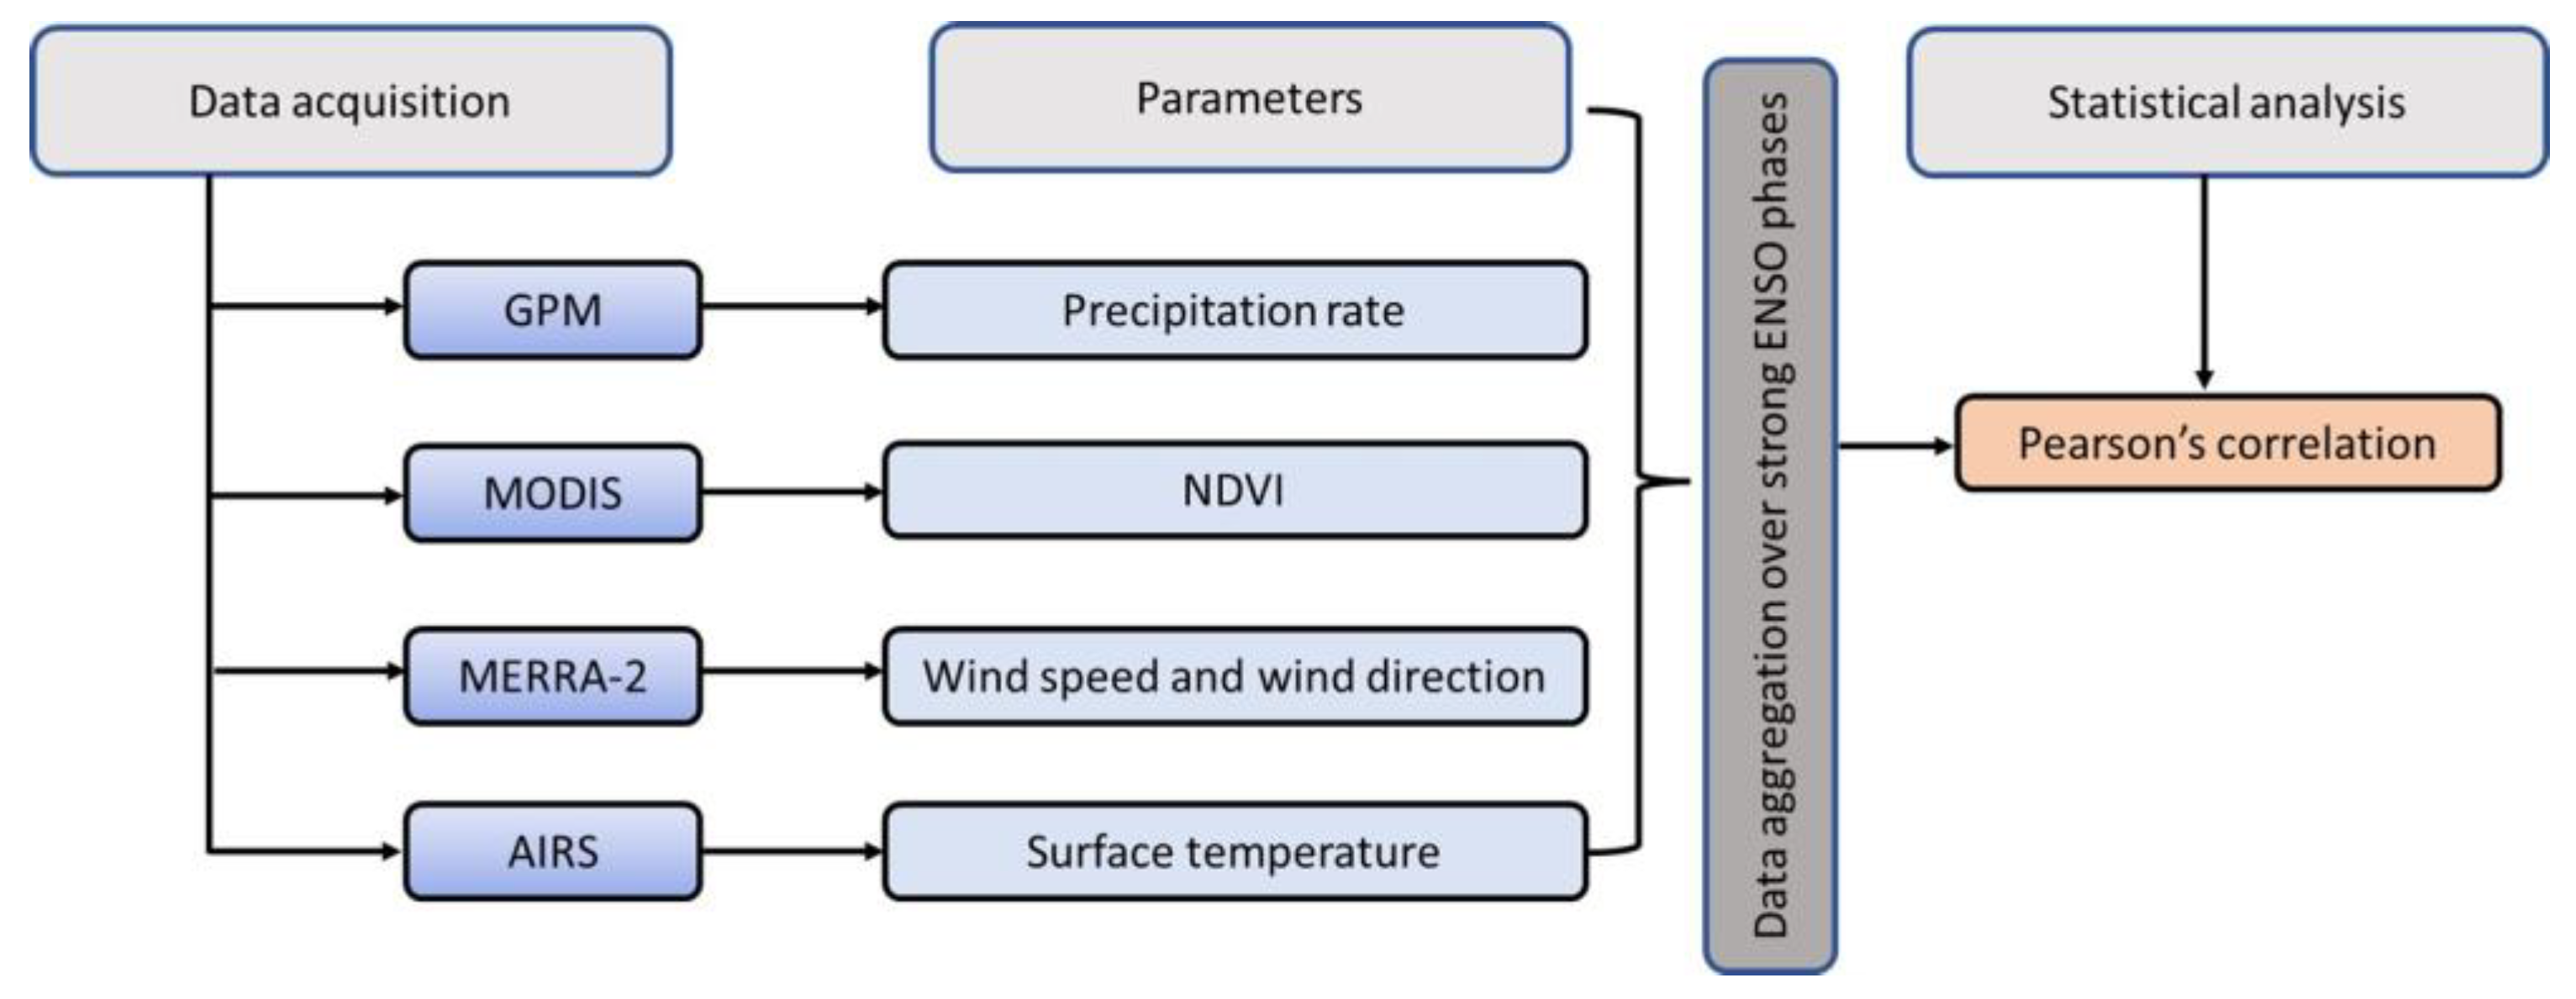
3.2. Methods
Pearson’s Correlation
4. Results and Discussion
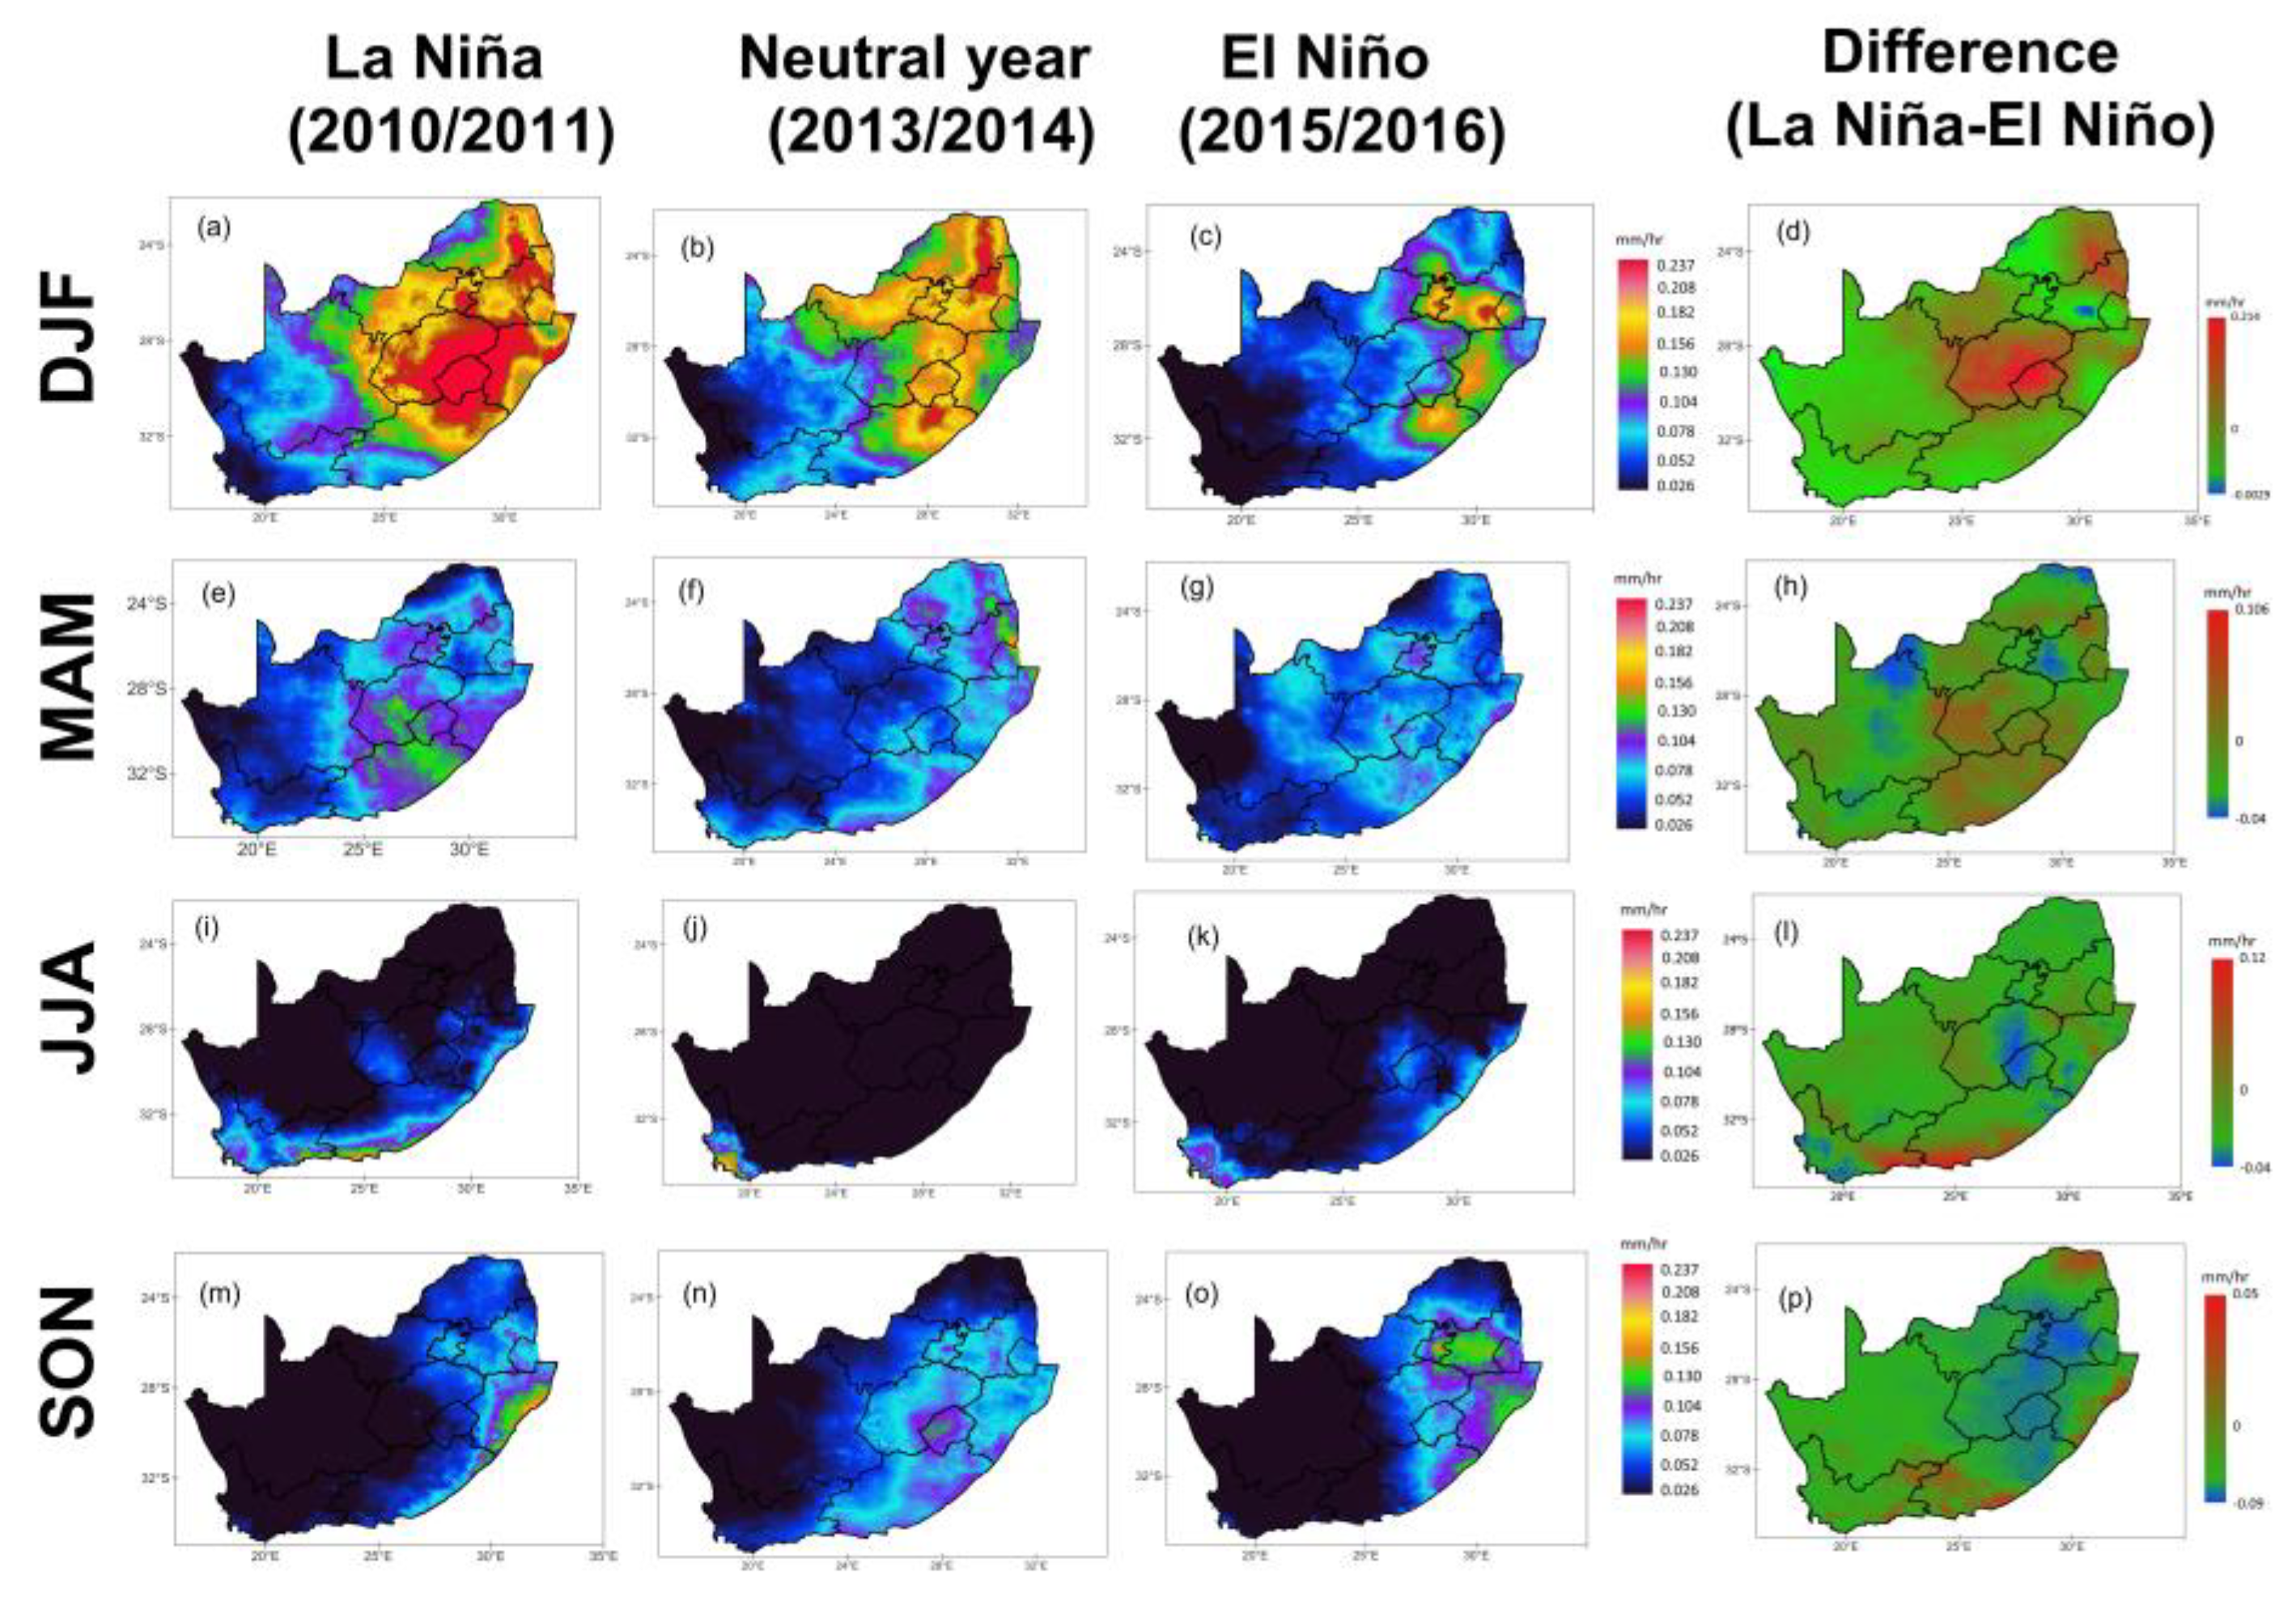
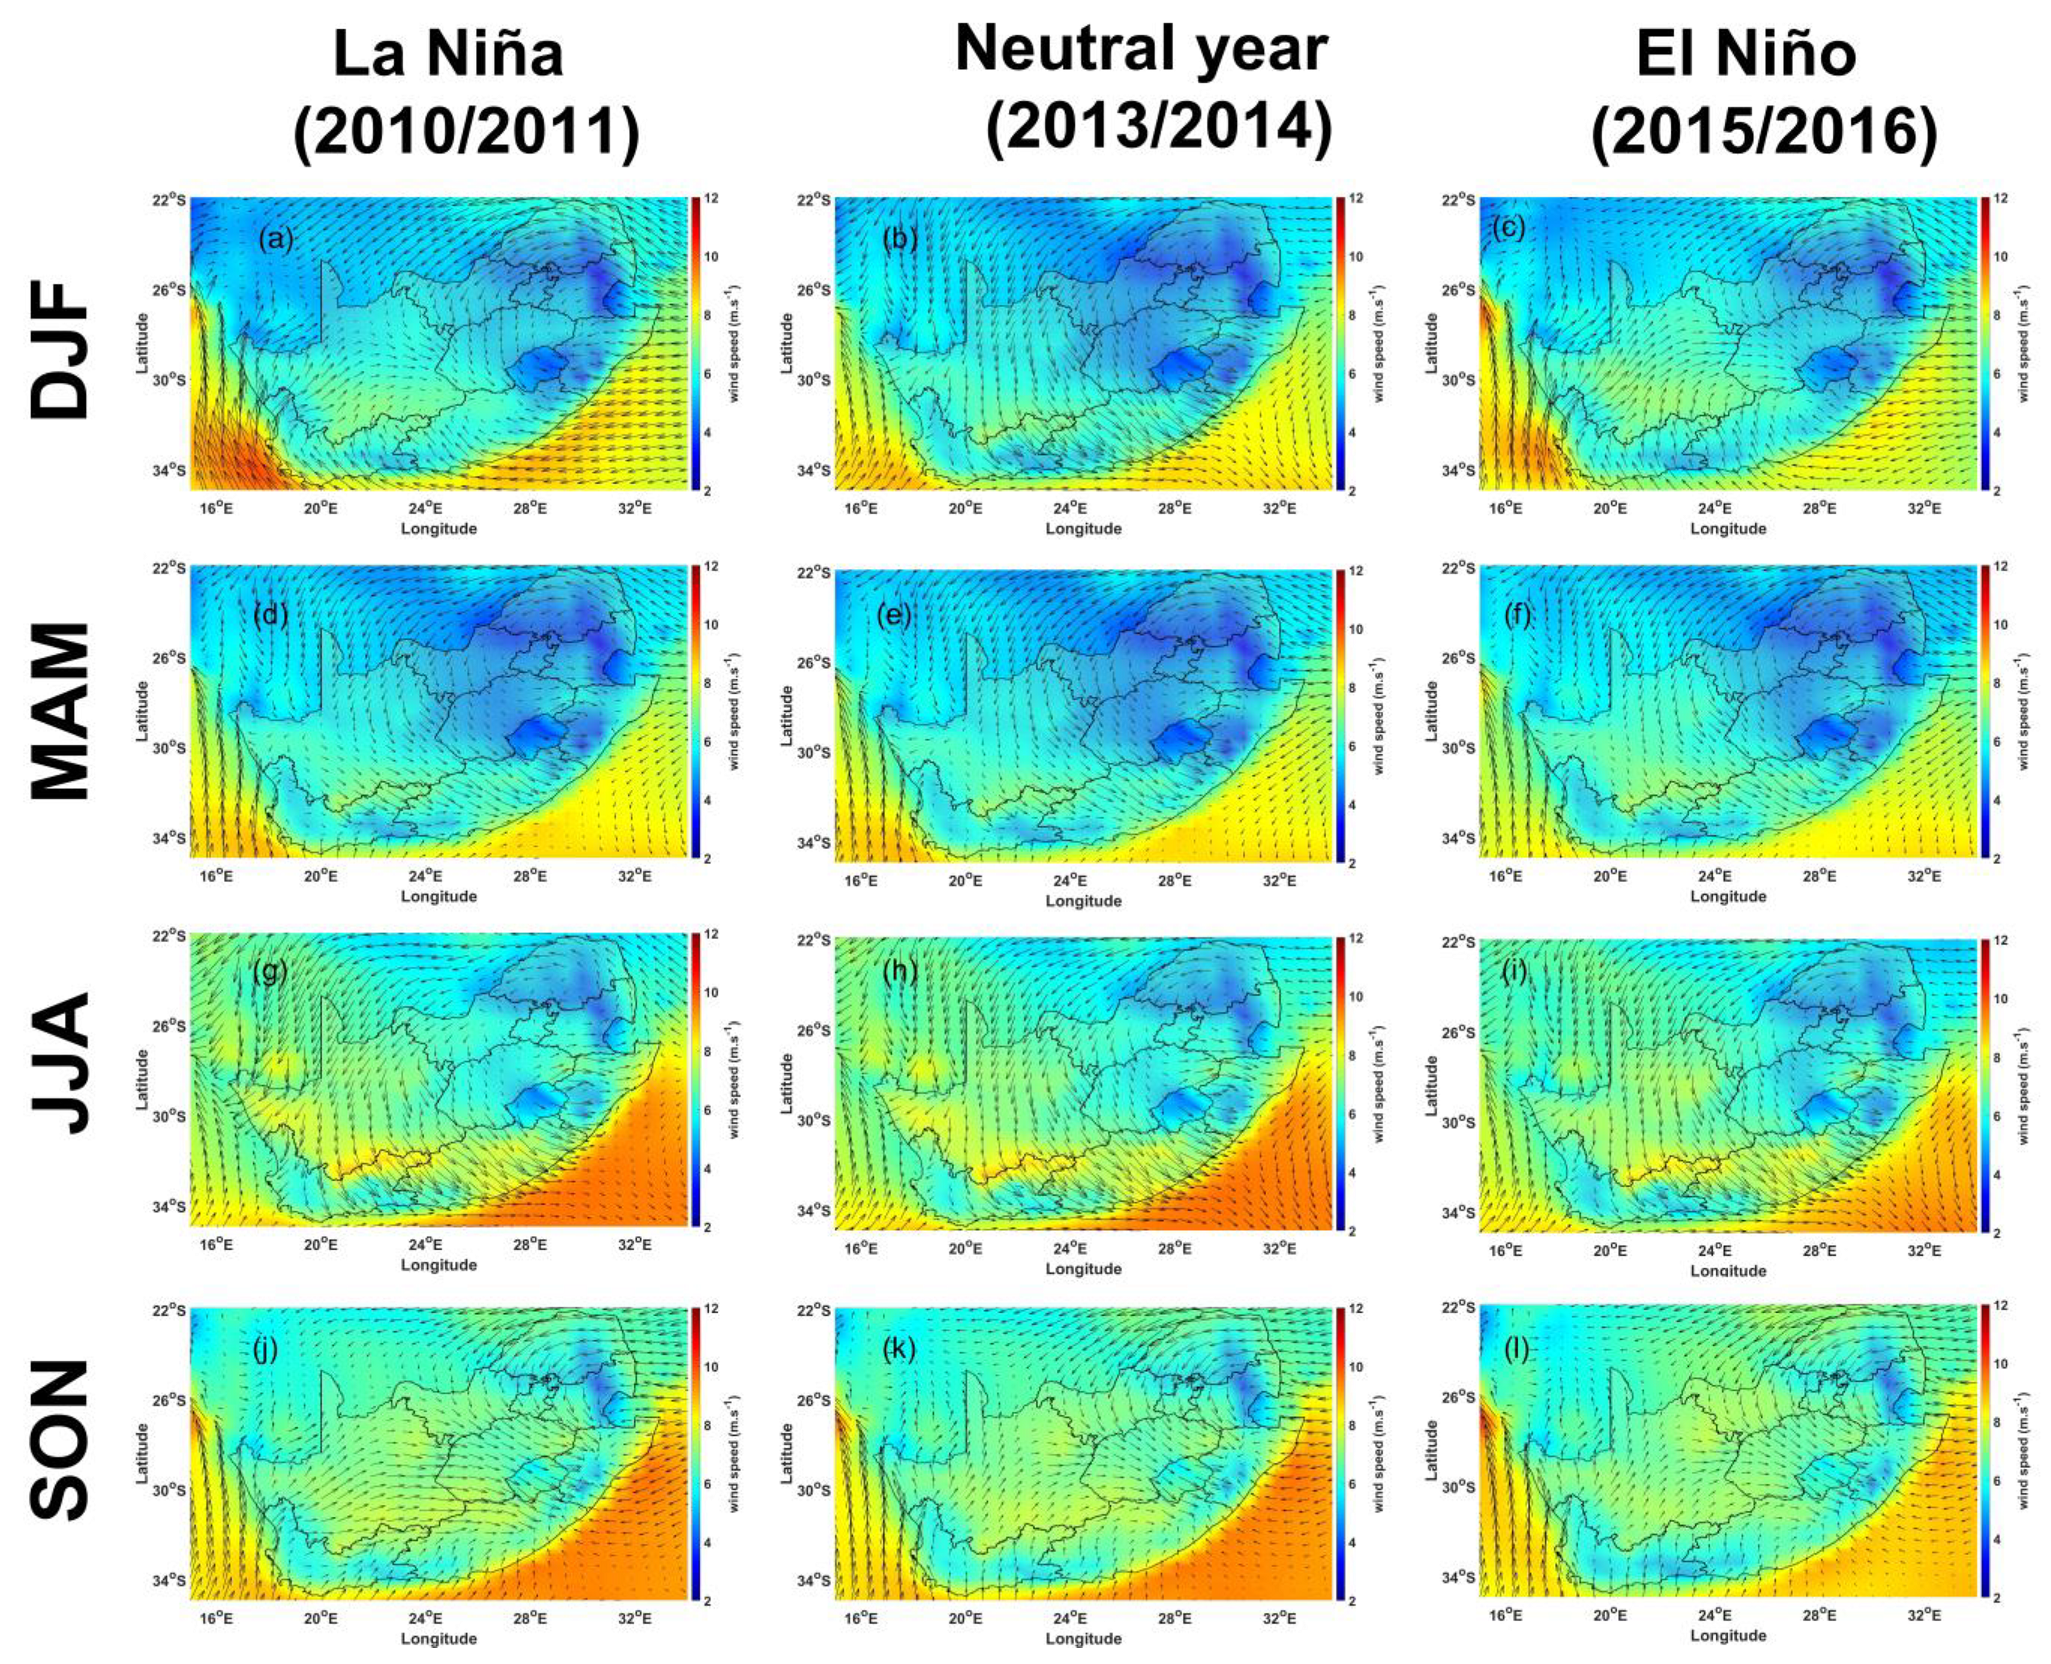
4.1. Comparing the Seasonal Spatial Distribution of Precipitation, Temperature, NDVI, and Wind Speed and Direction during the El Niño and La Niña Periods
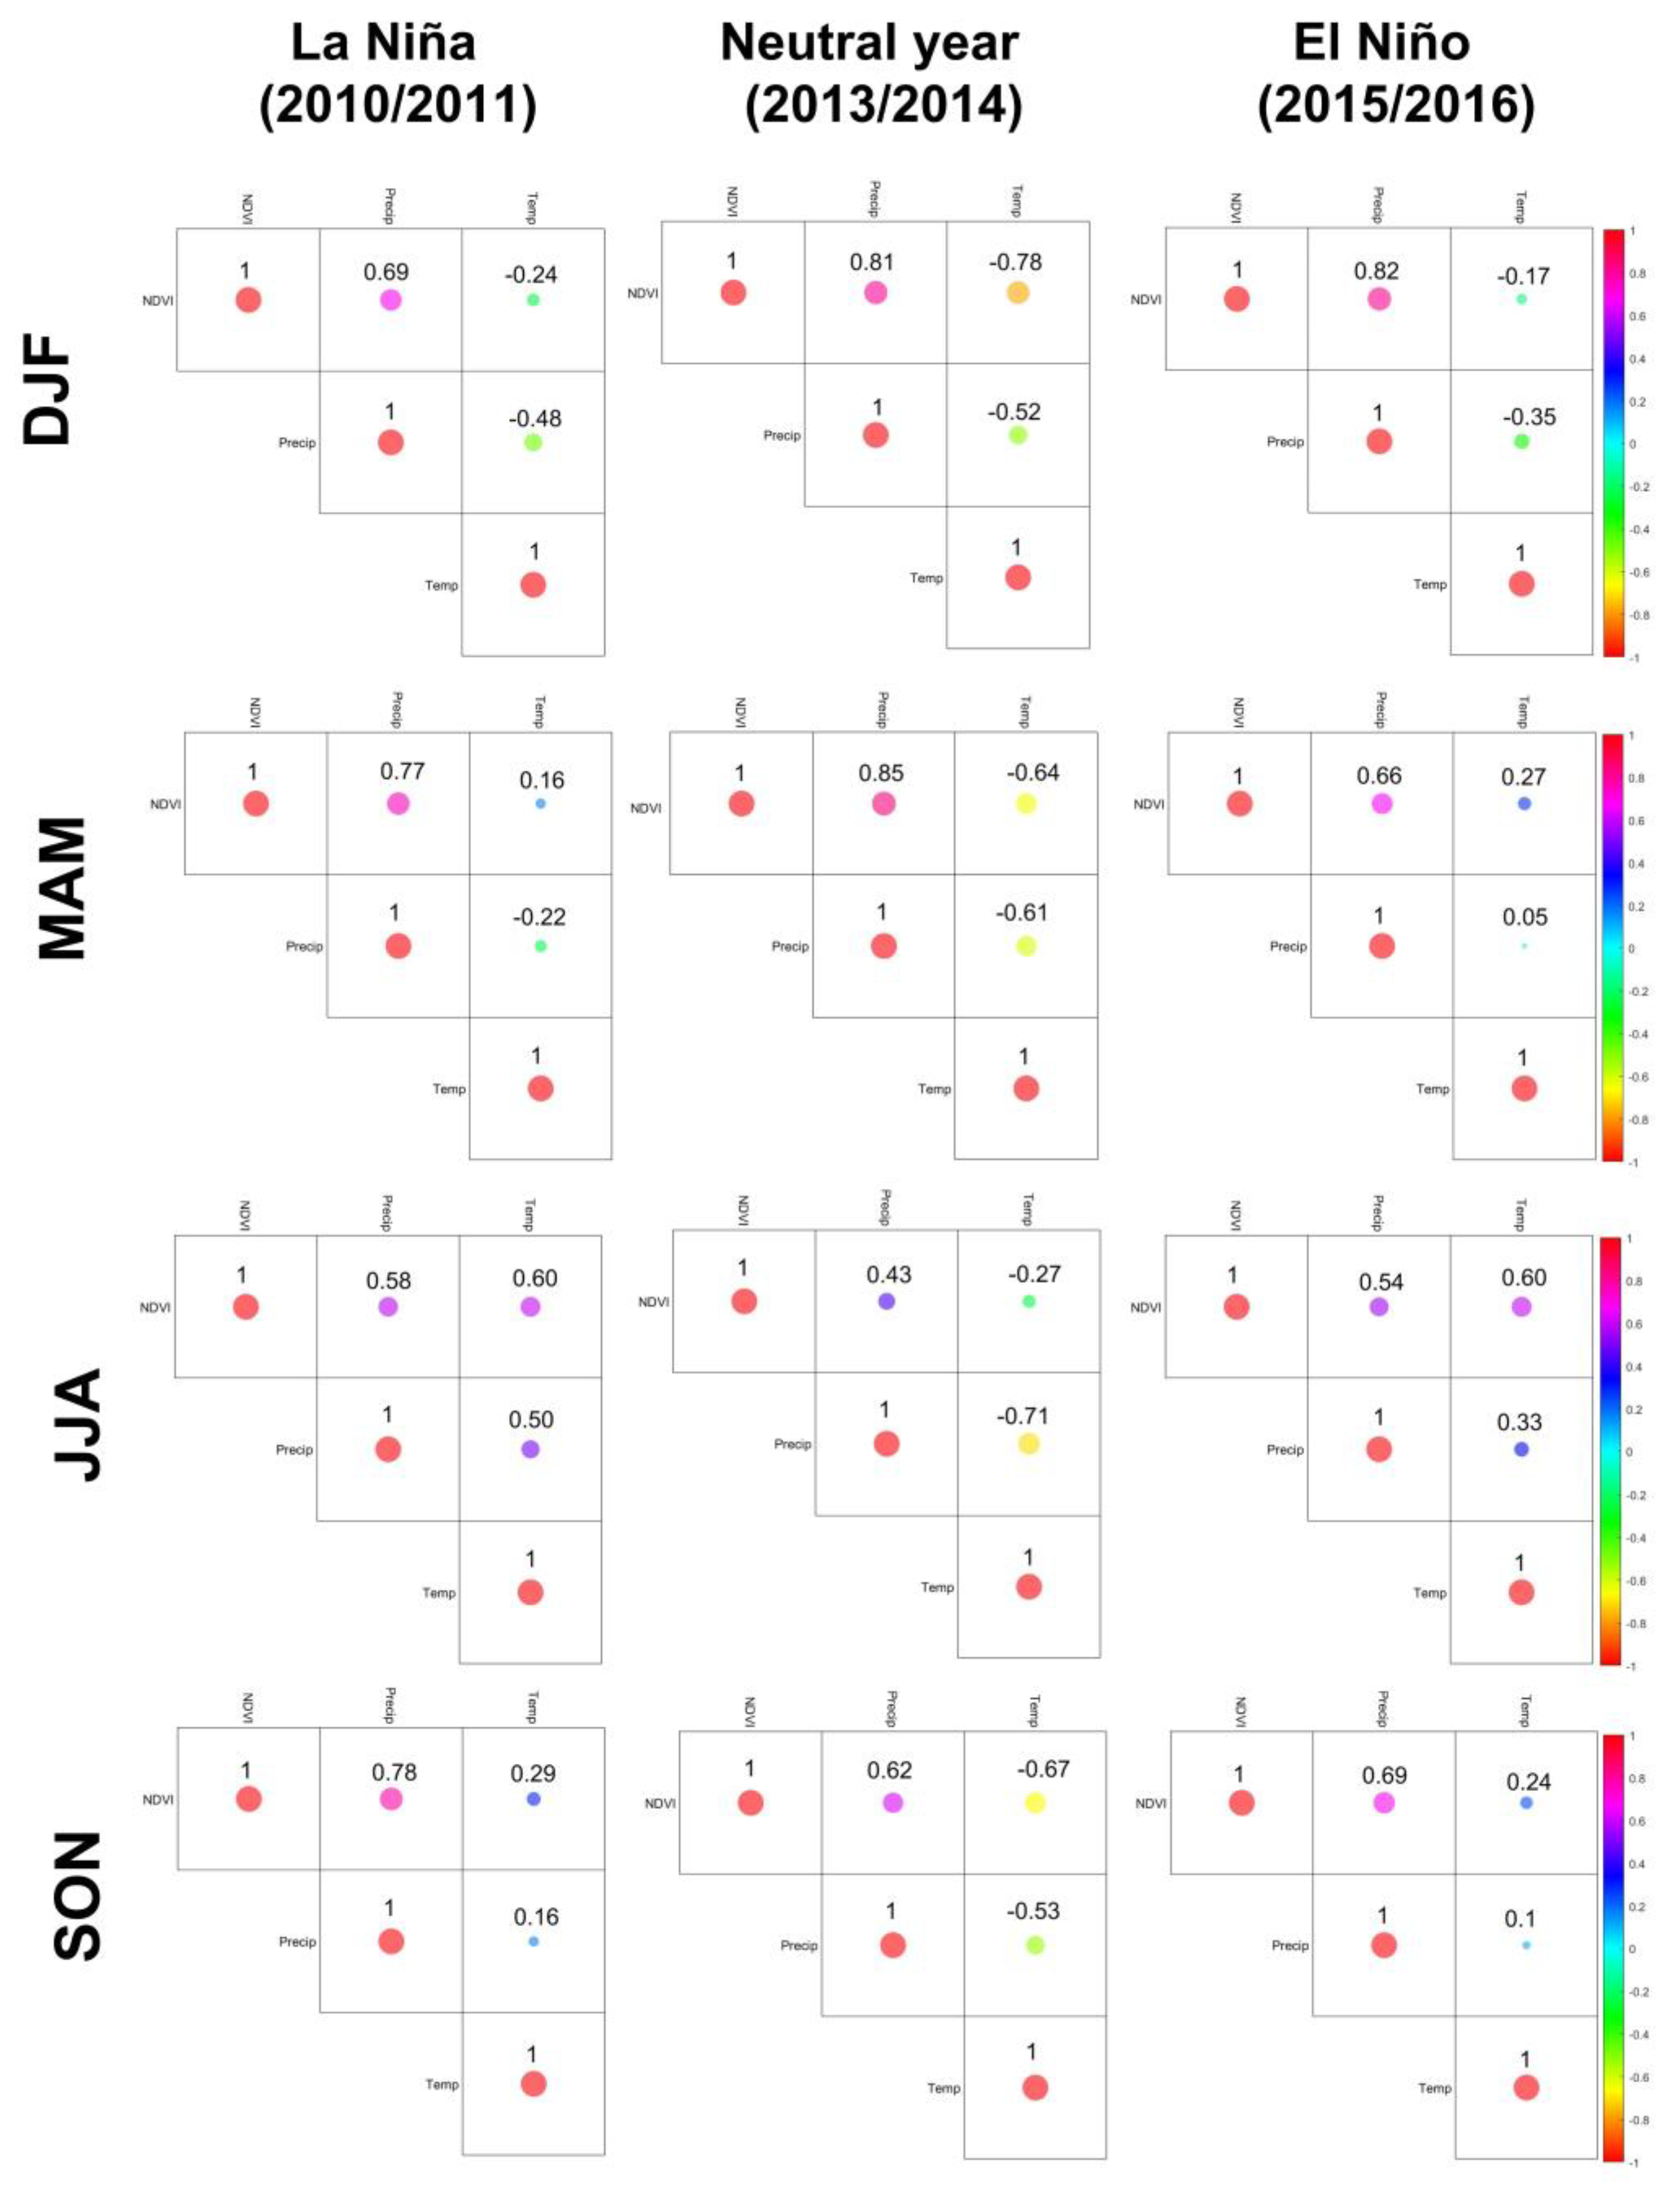
4.2. Comparing Seasonal Correlations between Precipitation, Temperature and NDVI during La Niña, Neutral Year, El Niño Periods
5. Conclusions
Author Contributions
Funding
Institutional Review Board Statement
Informed Consent Statement
Data Availability Statement
Acknowledgments
Conflicts of Interest
References
- Hanley, D.E.; Bourassa, M.A.; O’Beiwn, J.J.; Smith, S.R.; Spade, E.R. A Quantitative Evaluation of ENSO Indices. J. Clim. 2003, 16, 1249–1258. [Google Scholar] [CrossRef]
- Mariotti, A. How ENSO impacts precipitation in southwest central Asia. Geophys. Res. Lett. 2007, 34, L16706. [Google Scholar] [CrossRef]
- Mason, S.J.; Jury, M. Climatic variability and change over the southern Africa: A reflection on underlying processes. Prog. Phys. Geogr. 1997, 21, 23–50. [Google Scholar] [CrossRef]
- Reason, C.J.C.; Jagadheesha, D. A model investigation of recent ENSO impacts over Southern Africa. Meteorol. Atmos. Phys. 2005, 89, 181–205. [Google Scholar] [CrossRef]
- Rouault, M.; Richard, Y. Intensity and spatial extent of droughts in southern Africa. Geophys. Res. Lett. 2005, 32, L15702. [Google Scholar] [CrossRef]
- Cook, K.H. A southern Hemisphere wave response to ENSO with implications for southern Africa precipitation. J. Atmos. Sci. 2001, 58, 2146–2162. [Google Scholar] [CrossRef]
- Reason, C.J.C.; Allan, R.J.; Lindesay, J.A.; Ansell, T.J. ENSO and climatic signals across the Indian Ocean basin in the global context: Part I, interannual composite patterns. Int. J. Climatol. 2001, 20, 1285–1327. [Google Scholar] [CrossRef]
- Hoell, A.; Funk, C.; Magadzire, T.; Zinke, J.; Husak, G. El Niño-Southern Oscillation diversity and southern Africa teleconnections during austral summer. Clim. Dyn. 2015, 45, 1583–1599. [Google Scholar] [CrossRef]
- Mulenga, H.; Rouault, M.; Reason, C. Dry summers over northeastern South Africa and associated circulation anomalies. Clim. Res. 2005, 25, 29–41. [Google Scholar] [CrossRef]
- Sazib, N.; Mladenova, L.E.; Bolten, J.D. Assessing the impact of ENSO on agriculture over Africa using earth observation data. Front. Sustain. Food Syst. 2020, 4, 509914. [Google Scholar] [CrossRef]
- Ma, Y.; Sun, J.; Dong, T.; Yu, W.; Dong, W. More profound impact of CP ENSO on Australian spring rainfall in recent decades. Clim. Dyn. 2022, 1–15. [Google Scholar] [CrossRef]
- Erasmi, S.; Schucknecht, A.; Barbosa, M.P.; Matschullat, J. Vegetation Greenness in Northeastern Brazil and Its Relation to ENSO Warm Events. Remote Sens. 2014, 6, 3041–3058. [Google Scholar] [CrossRef]
- Whan, K.; Zwiers, F. The impact of ENSO and the NAO on extreme winter precipitation in North America in observations and regional climate models. Clim. Dyn. 2017, 48, 1401–1411. [Google Scholar] [CrossRef]
- Power, S.; Delage, F.; Chung, C.; Kociuba, G.; Keay, K. Robust twenty-first-century projections of El Nino and related precipitation variability. Nature 2013, 502, 541–545. [Google Scholar] [CrossRef]
- Huang, P.; Xie, S.P. Mechanisms of change in ENSO-induced tropical Pacific rainfall variability in a warming climate. Nat. Geosci. 2015, 8, 922–948. [Google Scholar] [CrossRef]
- Fasullo, J.T.; Otto-Bliesner, B.L.; Stevenson, S. ENSO’s changing influence on temperature, precipitation, and wildfire in a warming climate. Geophys. Res. Lett. 2018, 45, 9216–9225. [Google Scholar] [CrossRef]
- Philippon, N.; Rouault, M.; Richard, Y.; Favre, A. The influence of ENSO on South Africa winter rainfall. Int. J. Climatol. 2012, 32, 2333–2347. [Google Scholar] [CrossRef]
- Rouault, M.; Richard, Y. Spatial extension and intensity of droughts since 1922 in South Africa. Water SA 2003, 29, 489–500. [Google Scholar]
- Jury, M.R. Climate trends in Southern Africa. S. Afr. J. Sci. 2013, 109, 1–11. [Google Scholar] [CrossRef]
- Zhao, L.; Dai, A.; Dong, B. Changes in global vegetation activity and its driving factors during 1982–2013. Agric. For. Meteorol. 2018, 249, 198–209. [Google Scholar] [CrossRef]
- Georganos, S.; Abdi, A.; Tenenbaum, D.E.; Kalogirou, S. Examining the NDVI-rainfall relationship in the semi-arid Sahel using geographically weighted regression. J. Arid. Environ. 2017, 146, 64–74. [Google Scholar] [CrossRef]
- Kalisa, W.; Igbawua, T.; Henchiri, M.; Ali, S.; Zhang, S.; Bai, Y.; Zhang, J. Assessment of climate impact on vegetation dynamics over East Africa from 1982 to 2015. Sci. Rep. 2019, 9, 16865. [Google Scholar] [CrossRef]
- Botai, C.M.; Botai, J.O.; Adeola, A.M. Spatial distribution of temporal precipitation contrasts in South Africa. S. Afr. J. Sci. 2018, 114, 70–78. [Google Scholar] [CrossRef]
- Luo, B.; Minnett, P.J.; Szczodrak, M.; Nalli, N.R.; Morris, V.R. Accuracy assessment of MERRA-2 and ERA-interim sea surface temperature, air temperature, and humidity profiles over the Atlantic Ocean using AEROSE measurements. J. Clim. 2020, 33, 6889–6909. [Google Scholar] [CrossRef]
- Jamali, S.; Seaquist, J.W.; Ardö, J.; Eklundh, L. Investigating temporal relationships between rainfall, soil moisture and MODIS-derived NDVI and EVI for six sites in Africa. In Proceedings of the 34th International Symposium on Remote Sensing of Environment, Sydney, NSW, Australia, 10–15 April 2011. [Google Scholar]
- The World Bank Group. Climate Change Knowledge Portal. Available online: https://climateknowledgeportal.worldbank.org/country/south-africa/climate-data-historical (accessed on 16 November 2022).
- National Aeronautics and Space Administration. Global Precipitation Measurement. Available online: https://www.nasa.gov/mission_pages/GPM/main/index.html (accessed on 16 November 2022).
- Skofronick-Jackson, G.; Kirschbaum, D.; Petersen, W.; Huffman, G.; Kidd, C.; Stocker, E.; Kakar, R. The Global Precipitation Measurement (GPM) mission’s scientific achievements and societal contributions: Reviewing four years of advanced rain and snow observations. Q. J. R. Meteorol. Soc. 2018, 144, 27–48. [Google Scholar] [CrossRef]
- Skofronick-Jackson, G.; Petersen, W.A.; Berg, W.; Kidd, C.; Stocker, E.F.; Kirschbaum, D.B.; Kakar, R.; Braun, S.A.; Huffman, G.J.; Iguchi, T.; et al. The Global Precipitation Measurement (GPM) mission for science and society. Bull. Amer. Meteor. Soc. 2017, 98, 1679–1695. [Google Scholar] [CrossRef]
- Skofronick-Jackson, G.M.; Johnson, B.T.; Munchak, S.J. Detection thresholds of falling snow from satellite-borne active and passive sensors. IEEE Trans. Geosci. Remote Sens. 2013, 51, 4177–4189. [Google Scholar] [CrossRef]
- National Aeronautics and Space Administration. MODIS Data. Available online: https://terra.nasa.gov/data/modis-data (accessed on 16 November 2022).
- Huang, S.; Tang, L.; Hupy, J.P.; Wang, Y.; Shao, G. A commentary review on the use of Normalized Difference Vegetation Index (NDVI) in the era of popular remote sensing. J. For. Res. 2021, 32, 1–6. [Google Scholar] [CrossRef]
- Tian, J.; Wang, L.; Li, X.; Gong, H.; Shi, C.; Zhong, R.; Liu, X. Comparison of UAV and WorldView-2 imagery for mapping leaf area index of mangrove forest. Int. J. Appl. Earth. Obs. Geoinf. 2017, 61, 22–31. [Google Scholar] [CrossRef]
- Zhu, X.; Liu, D. Improving Forest aboveground biomass estimation using seasonal Landsat NDVI time-series. ISPRS J. Photogramm. Remote. Sens. 2015, 102, 222–231. [Google Scholar] [CrossRef]
- Vicente-Serrano, S.M.; Camarero, J.J.; Olano, J.M.; Martín-Hernández, N.; Peña-Gallardo, M.; Tomás-Burguera, M.; Gazol, A.; Azorin-Molina, C.; Bhuyan, U.; El Kenawy, A. Diverse relationships between forest growth and the Normalized Difference Vegetation Index at a global scale. Remote. Sens Environ. 2016, 187, 14–29. [Google Scholar] [CrossRef]
- Dutrieux, L.P.; Verbesselt, J.; Kooistra, L.; Herold, M. Monitoring Forest cover loss using multiple data streams, a case study of a tropical dry forest in Bolivia. ISPRS J. Photogramm. Remote. Sens. 2015, 107, 112–125. [Google Scholar] [CrossRef]
- Huete, A.R.; Didan, K.; Leeuwen, W.J.; Jacobson, A.; Solanos, R.; Laing, T.D. MODIS Vegetation Index (MOD 13). Algorithm theoretical basis document Version 3.1. 1999. Available online: https://vip.arizona.edu/documents/MODIS/MODISVIATBD.pdf (accessed on 16 November 2022).
- Justice, C.O.; Townshend, J.R.G.; Vermote, E.F.; Masuoka, E.; Wolfe, R.E.; Saleous, N.; Roy, D.P.; Morisette, J.T. An overview of MODIS Land data processing and product status. Remote. Sens. Environ. 2002, 83, 3–15. [Google Scholar] [CrossRef]
- National Aeronautics and Space Administration. Atmospheric Composition, Water & Energy Cycles and Climate Variability. Available online: https://disc.gsfc.nasa.gov/datasets/M2I3NPASM5.12.4/summary (accessed on 16 November 2022).
- Wargan, K.; Labow, G.; Frith, S.; Pawson, S.; Livesey, N.; Partyka, G. Evaluation of the ozone fields in NASA’s MERRA-2 reanalysis. J. Clim. 2017, 30, 2961–2988. [Google Scholar] [CrossRef]
- Gelaro, R.; McCarty, W.; Suárez, M.J.; Todling, R.; Molod, A.; Takacs, L.; Randles, C.A.; Darmenov, A.; Bosilovich, M.G.; Reichle, R.; et al. The modern-era retrospective analysis for research and applications, version 2 (MERRA-2). J. Clim. 2017, 30, 5419–5454. [Google Scholar] [CrossRef]
- Buchard, V.; Randles, C.A.; da Silva, A.M.; Darmenov, A.; Colarco, P.R.; Govindaraju, R.; Ferrare, R.; Hair, J.; Beyersdorf, A.J.; Ziemba, L.D.; et al. The MERRA-2 aerosol reanalysis, 1980 onward. Part II: Evaluation and case studies. J. Clim. 2017, 30, 6851–6872. [Google Scholar] [CrossRef]
- Randles, C.A.; da Silva, A.M.; Buchard, V.; Colarco, P.R.; Darmenov, A.; Govindaraju, R.; Smirnov, A.; Holben, B.; Ferrare, R.; Hair, J.; et al. The MERRA-2 aerosol reanalysis, 1980 onward. Part I: System description and data assimilation evaluation. J. Clim. 2017, 30, 6823–6850. [Google Scholar] [CrossRef]
- Pagano, T.S.; Chahine, M.T.; Fetzer, E.J. The Atmospheric Infrared Sounder (AIRS) on the NASA Aqua Spacecraft: A general remote sensing tool for understanding atmospheric structure, dynamics and composition. Remote Sens. Clouds Atmos. XV 2010, 7827, 162–169. [Google Scholar]
- Chahine, M.T.; Pagano, T.; Aumann, H.; Atlas, R.; Barnet, C.; Blaisdell, J.; Chen, L.; Divakarla, M.; Fetzer, E.; Goldberg, M.; et al. AIRS: Improving weather forecasting and providing new data on greenhouse gases. Bull. Am. Meteorol. Soc. 2006, 87, 911–926. [Google Scholar] [CrossRef]
- Menzel, W.P.; Schmit, T.J.; Zhang, P.; Li, J. Satellite-based atmospheric infrared sounder development and applications. Bull. Am. Meteorol. Soc. 2018, 99, 583–603. [Google Scholar] [CrossRef]
- Pearson’s Correlation Coefficient. In Encyclopedia of Public Health; Kirch, W., Ed.; Springer: Dordrecht, The Netherlands, 2008; pp. 1090–1091. [Google Scholar]
- Benesty, J.; Chen, J.; Huang, Y.; Cohen, I. Pearson Correlation Coefficient. In Noise Reduction in Speech Processing; Springer: Berlin/Heidelberg, Germany, 2009; Volume 2, pp. 37–40. [Google Scholar]
- Chase, B.M.; Thomas, D.S. Multiphase late quaternary aeolian sediment accumulation in western South Africa: Timing and relationship to paleoclimatic changes inferred from the marine record. Quat. Int. 2007, 166, 29–41. [Google Scholar] [CrossRef]
- Lyon, B.; Mason, S. The 1997/98 summer rainfall season in southern Africa. Part II: Model simulations and coupled model forecasts. J. Clim. 2009, 22, 3802–3818. [Google Scholar] [CrossRef]
- Shikwambana, L.; Sivakumar, V. Investigation of various aerosols over different locations in South Africa using satellite, model simulations and LIDAR. Meteorol. Appl. 2019, 26, 275–287. [Google Scholar] [CrossRef]
- Simms, E.L.; Ward, H. Multisensor NDVI-Based Monitoring of the Tundra-Taiga Interface (Mealy Mountains, Labrador, Canada). Remote Sens. 2013, 5, 1066–1090. [Google Scholar] [CrossRef]
- Abutaleb, K.; Mudede, F.M.; Nkongolo, N. Estimating urban greenness index using remote sensing data: A case study of an affluent vs poor suburbs in the city of Johannesburg. Egypt. J. Remote. Sens. 2013, 24, 343–351. [Google Scholar] [CrossRef]
- Mondal, I.; Thakur, S.; De, A.; De, T.K. Application of the METRIC model for mapping evapotranspiration over the Sundarban Biosphere Reserve, India. Ecol. Indic. 2022, 136, 108553. [Google Scholar] [CrossRef]
- Kruger, A.C.; Goliger, A.M.; Retief, J.V.; Sekele, S. Strong wind climatic zones in South Africa. Wind Struct. Int. J. 2010, 13, 37–55. [Google Scholar] [CrossRef]
- van Rooy, M.P. Influence of berg winds on the temperatures along the west coast of South Africa. Q. J. R. Meteorol. Soc. 1936, 62, 528–537. [Google Scholar] [CrossRef]
- Shikwambana, L.; Kganyago, M.; Xulu, S. Analysis of wildfires and associated emissions during the recent strong ENSO phases in Southern Africa using multi-source remotely derived products. Geocarto Int. 2022, 1–17. [Google Scholar] [CrossRef]
- Kottek, M.; Grieser, J.; Beck, C.; Rudolf, B.; Rubel, F. World map of the Köppen-Geiger climate classification updated. Meteorol. Z. 2006, 3, 259–263. [Google Scholar] [CrossRef]


| Input Data Source | Product Used | Time Analysis | Output Data |
|---|---|---|---|
| GPM (0.1°) | Precipitation rate (mm/hr) | 2010-2011 2013–2014 2015–2016 |
|
| MODIS (550 nm) | NDVI | 2010–2011 2013–2014 2015–2016 |
|
| MERRA-2 (550 nm) | Wind speed (m.s−1) and wind direction | 2010–2011 2013–2014 2015–2016 |
|
| AIRS (1°) | Temperature (°C) | 2010–2011 2013–2014 2015–2016 |
|
Disclaimer/Publisher’s Note: The statements, opinions and data contained in all publications are solely those of the individual author(s) and contributor(s) and not of MDPI and/or the editor(s). MDPI and/or the editor(s) disclaim responsibility for any injury to people or property resulting from any ideas, methods, instructions or products referred to in the content. |
© 2023 by the authors. Licensee MDPI, Basel, Switzerland. This article is an open access article distributed under the terms and conditions of the Creative Commons Attribution (CC BY) license (https://creativecommons.org/licenses/by/4.0/).
Share and Cite
Shikwambana, L.; Xongo, K.; Mashalane, M.; Mhangara, P. Climatic and Vegetation Response Patterns over South Africa during the 2010/2011 and 2015/2016 Strong ENSO Phases. Atmosphere 2023, 14, 416. https://doi.org/10.3390/atmos14020416
Shikwambana L, Xongo K, Mashalane M, Mhangara P. Climatic and Vegetation Response Patterns over South Africa during the 2010/2011 and 2015/2016 Strong ENSO Phases. Atmosphere. 2023; 14(2):416. https://doi.org/10.3390/atmos14020416
Chicago/Turabian StyleShikwambana, Lerato, Kanya Xongo, Morwapula Mashalane, and Paidamwoyo Mhangara. 2023. "Climatic and Vegetation Response Patterns over South Africa during the 2010/2011 and 2015/2016 Strong ENSO Phases" Atmosphere 14, no. 2: 416. https://doi.org/10.3390/atmos14020416
APA StyleShikwambana, L., Xongo, K., Mashalane, M., & Mhangara, P. (2023). Climatic and Vegetation Response Patterns over South Africa during the 2010/2011 and 2015/2016 Strong ENSO Phases. Atmosphere, 14(2), 416. https://doi.org/10.3390/atmos14020416


