Article

New Laboratory Experiments to Study the Large-Scale Circulation and Climate Dynamics

1
Department of Aerodynamics and Fluid Mechanics, Brandenburg University of Technology (BTU) Cottbus-Senftenberg, Siemens-Halske-Ring 15a, D-03046 Cottbus, Germany
2
Institute of Continuous Media Mechanics, Korolyov 1, 614013 Perm, Russia
3
Laboratoire de Mathématiques et Physique, Université de Perpignan Via Domitia, 52 Avenue Paul Alduy, 66860 Perpignan, France
4
Department of Statistical Physics and Nonlinear Dynamics, Brandenburg University of Technology (BTU) Cottbus-Senftenberg, D-03046 Cottbus, Germany
5
Department of Civil and Environmental Engineering, Imperial College London, London SW7 2AZ, UK
6
ELKH-ELTE Theoretical Physics Research Group, H-1117 Budapest, Hungary
*
Author to whom correspondence should be addressed.
These authors contributed equally to this work.
Atmosphere 2023, 14(5), 836; https://doi.org/10.3390/atmos14050836
Submission received: 23 March 2023 / Revised: 21 April 2023 / Accepted: 2 May 2023 / Published: 6 May 2023
(This article belongs to the Special Issue Large-Scale Climate Change and Implications for Weather Extremes)

Abstract

:
The large-scale flows of the oceans and the atmosphere are driven by a non-uniform surface heating over latitude, and rotation. For many years scientists try to understand these flows by doing laboratory experiments. In the present paper we discuss two rather new laboratory experiments designed to study certain aspects of the atmospheric circulation. One of the experiments, the differentially heated rotating annulus at the Brandenburg University of Technology (BTU) Cottbus, has a cooled inner cylinder and a heated outer wall. However, the structure of the atmospheric meridional circulation motivates a variation of this “classical” design. In the second experiment described, operational at the Institute of Continuous Media Mechanics (ICMM) in Perm, heating and cooling is performed at different vertical levels that resembles more the atmospheric situation. Recent results of both experiments are presented and discussed. Differences and consistencies are highlighted. Though many issues are still open we conclude that both setups have their merits. The variation with heating and cooling at different levels might be more suited to study processes in the transition zone between pure rotating convection and the zone of westerly winds. On the other hand, the simpler boundary conditions of the BTU experiment make this experiment easier to control.

1. Introduction

The large-scale flows of the oceans and the atmosphere are driven by a non-uniform surface heating over latitude, and rotation. The former is responsible for large-scale convective processes like the ocean overturning circulation or, the atmospheric counterpart, the Hadley cell. The latter generates ocean boundary currents and the westerlies of the atmosphere [1].
For almost a century, scientists try to understand these flows by doing laboratory experiments [2]. Some of these experiments try to isolate crucial elements of the flow. For instance, the convection driven meridional circulation is studied by so called horizontal convection experiments. In this configuration, a horizontal surface at the lower or the upper boundary is heated differentially [3]. Some authors use salt to generate a surface buoyancy gradient [4]. In other versions, parts of the upper and lower boundaries are heated with different temperatures or the sidewalls of the tank considered are kept at different fixed temperatures. Other experiments just highlight the rotation and focus, e.g., on the formation of boundary currents [5] or the initiation and development of severe cyclones [6,7].
The differentially heated rotating annulus includes both effects, convection and rotation, and is considered as an analog to the large-scale atmospheric circulation. The early years of research using the annulus experiments are comprehensively reviewed by [8]. The work until the mid-1970s is summarized in a review article by [9] and until the 1990s in a book chapter by [10]. To our knowledge the most recent review that also nicely embeds the annulus experiments in current work on the general atmospheric circulation is given by [11]. Insightful are further articles commemorating the 80th birthday of Raymond Hide [12,13]. Finally we mention that the experiments done by Exner on atmospheric vortices celebrate their 100th anniversary this year [14].
In the present paper we discuss two rather new laboratory experiments designed to study certain aspects of the atmospheric circulation [15]. In particular we show how such laboratory models can help to understand pressing issues on the stability of the jet-stream under climate change [16]. Extreme weather is associated with the meandering of the jet stream. Polar amplification, the reduction of the North–South temperature contrast, is considered to be essential in driving midlatutude extreme weather [17]. It is argued that Polar amplification leads to a weaker zonal mean flow and to stronger meanders in the jet-stream [18]. Although this seems to be consistent with observations [19] and also with lab experiments [20] a number of open issues remain that seem to be accessible to laboratory modeling. For instance, it is not clear yet which role zonal asymmetries in surface heating play for the waviness of the jet stream [21] and how strong the waviness influences the frequency of extreme weather. Experiments with a small tank have shown that waviness becomes larger but variability smaller with a reduced temperature gradient [20]. The experiments described here are closer to the atmosphere and are hence useful tools to quantitatively answer questions like these in the future.
One of the experiments, the differentially heated rotating annulus at BTU Cottbus, has a classical “Hide-setup” with an cooled inner cylinder and a heated outer wall. Following numerical experiments by [22], the aspect ratio d / L , where d is depth and L gap width, is small. The outer radius b is of the order of one meter and the ratio b / L is order one. In such a system buoyancy forces play an important role which is relevant when small-scale features are studied [23].
The atmosphere is characterized by heating at the bottom in the tropics and cooling at the top of the polar latitudes. This particular forcing is not correctly reproduced in the classical Hide-setup and this motivates a different design that includes heating and cooling at different vertical levels. Ref. [24] showed first results with such an experiment. Vertical separation of heating and cooling leads to more spatio-temporal complexity, including the coexistence and interaction between free convection and baroclinic wave modes. Ref. [25] recently presented an experiment without any inner cylinder, rather similar to the dishpan-setup by [8]. In accordance with [24], the dishpan version also shows more irregularity and flow complexity and it is worth to contrast some recent findings from the Hide- and the “Fultz-design” and discuss the advantages and disadvantages of both systems. The main research questions we ask here are: (i), what inherent differences can be found with respect to flow regimes between the Hide and the Fultz set-up? (ii), is one of the set-ups more suited for meteorological and climate applications?
Finally we mention that recently also an experiment with a mixed type of thermal forcing has been described [26]. This experiment comprises of a cylindrical annulus with peripheral spot heating at the bottom on the outer edge and uniform cooling on the inner sidewall. The experiment has an aspect ratio of about one and a gap width of just 12 cm. Although relevant in our context, the experiment is not in the same category as the experiments described here having a small aspect ratio and a much larger outer radius.
The paper is organized as follows. We first present the setups of both experiments. In Section 3, we exemplary discuss recent results that highlight the ability of the experiments to map fundamental aspects of atmospheric dynamics. Then, in Section 4, we discuss special features of the experiments and how a combination of the experimental data can give new insight into issues of climate dynamics and climate change. We Section 5 we give conclusions and a brief outlook.

2. Experimental Setup

2.1. The BTU Experiment
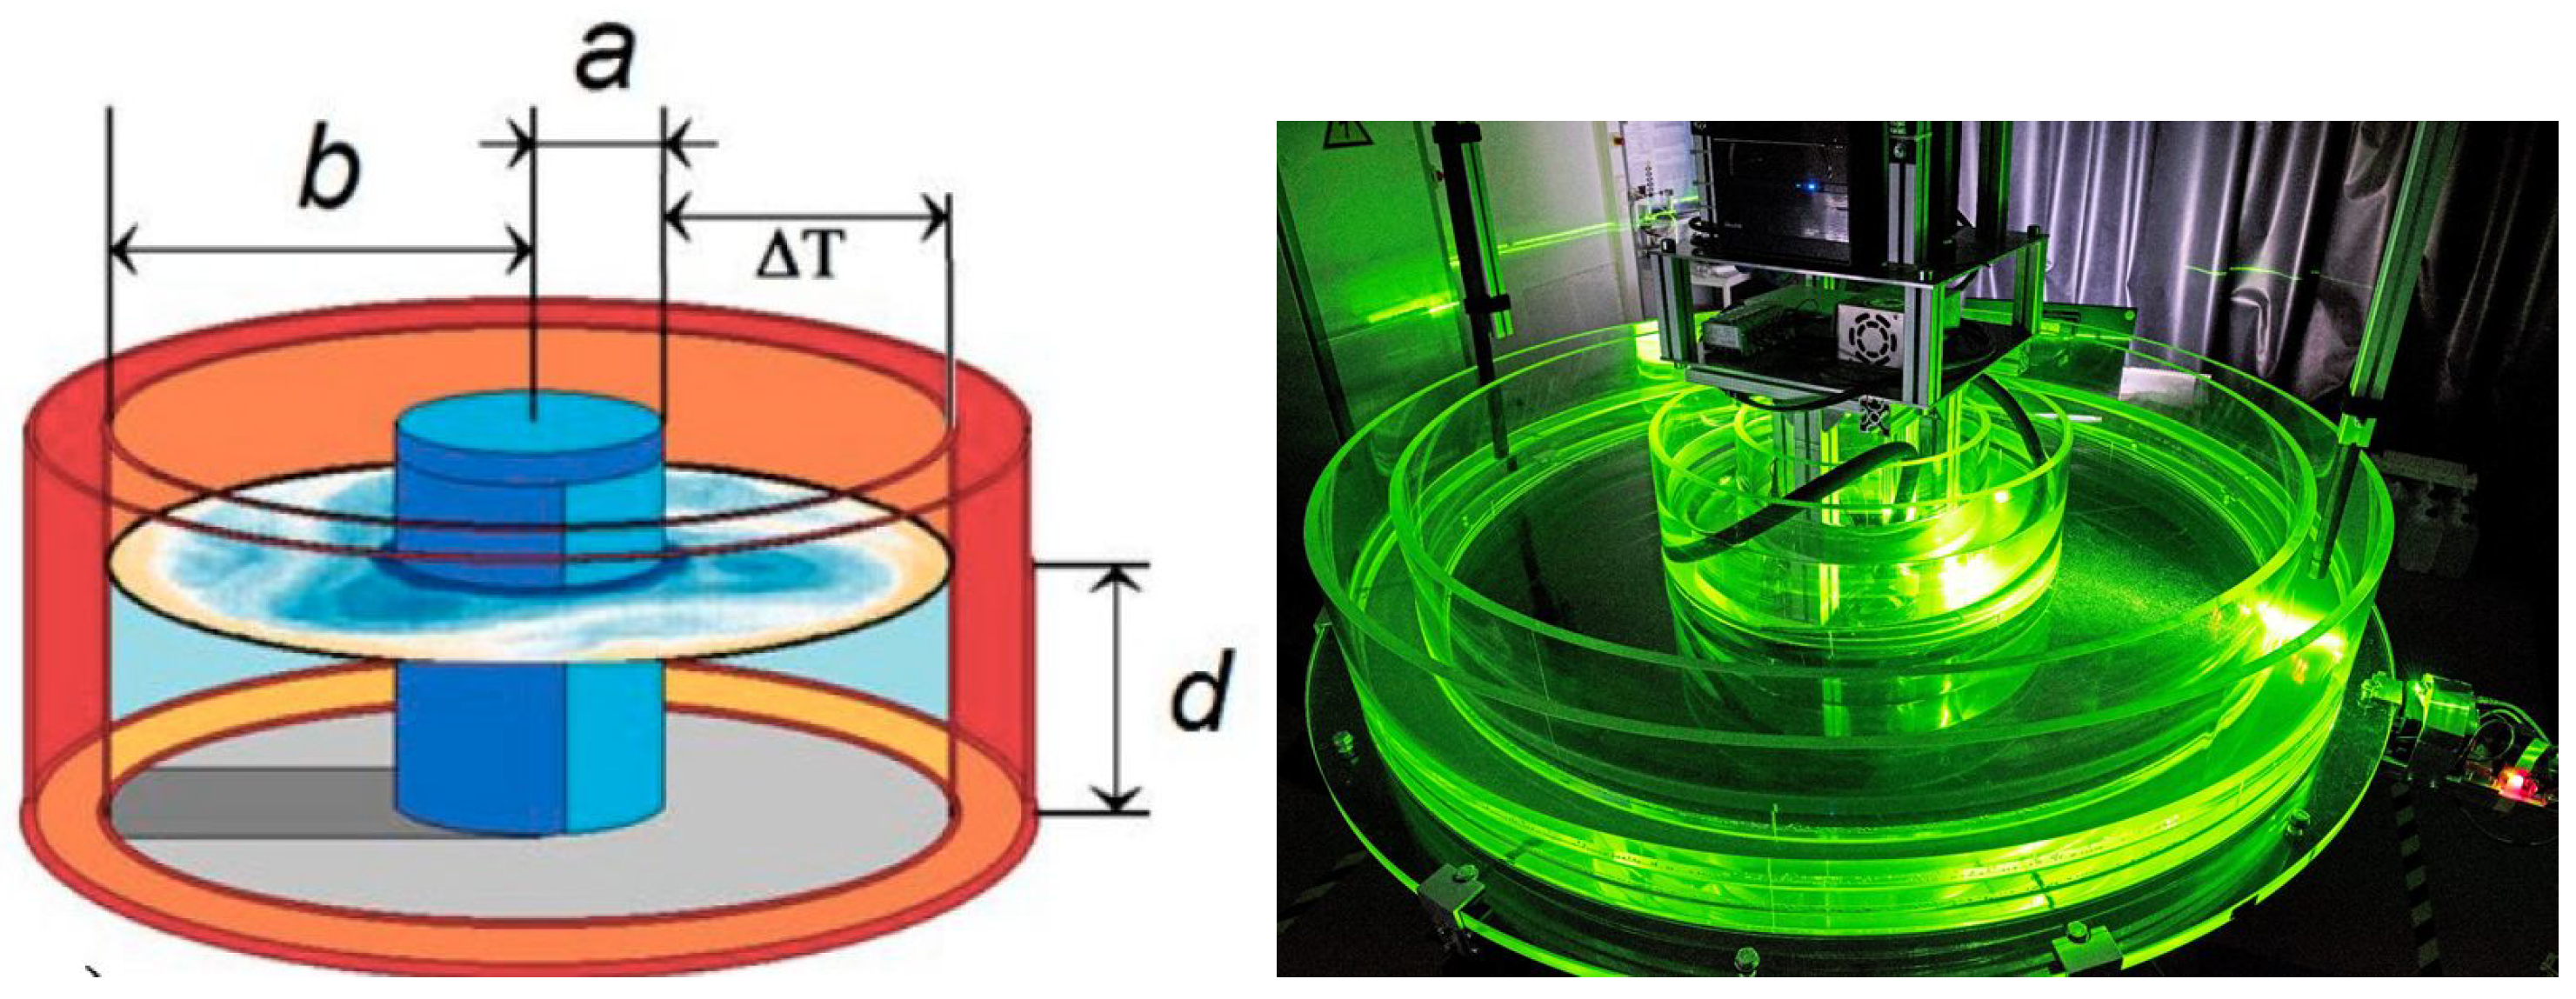
For the BTU experiment the classical Hide-setup is used that consists of three concentric cylinders (see Figure 1) [9]. In the heating and cooling chambers we use water. Furthermore, the working fluid in the central annular chamber is water. The water in the inner cylinder is cooled and the water in the outer annulus is heated. Unlike to our earlier experiments with climate applications [20,27,28] we discuss here the very similar but significantly larger tank that has shown features closer to the atmospheric dynamics [22,29]. The experimental setup is described in detail in [23] and will not be repeated here. The relevant dimensionless parameters used for annulus experiments are the thermal Rossby number R o T , the Taylor number T a , and the Prandtl number P r :
R o T = g d Δ ρ ρ 0 Ω 2 ( b a ) 2 , T a = 4 Ω 2 ( b a ) 5 ν 2 d , P r = ν κ .
All variables and parameters are given in Table 1, except the density difference Δ ρ = ρ 0 α Δ T , and the constant of gravity, g = 9.81 m s 1 . It should be noted that it is not obvious how to reconcile the three dimensionless parameters with those of the real Earth’s atmosphere. A first estimate using parameters from the atmosphere gives P r = 0.78 , R o = 10 2 , and T a = 5.8 × 10 30 . The huge value for T a results from the fact that the mid-latitude belt, b a , is about 5000 km wide but the depth from the ground to the stratopause is just 50 km. In the formula for T a the width occurs at the fifth power which finally results in the huge number for T a . We can summarize that from a model theory point of view the experiment and the atmosphere fulfill an incomplete similarity only. It is also rather obvious that three dimensionless parameters are not enough to fully describe the experiment. e.g., geometric aspects seem to be underrepresented [30]. However, empirical arguments found from laboratory studies justify the three parameter approach [11]. Following the diagram by [31], with 1 < P r < 10 , R o 1 and T a , we can state that the experiment and the atmosphere are in a comparable geostrophic turbulent regime.
Figure 1. Sketch of the BTU experiment (left). Outer (inner) radius b ( a ) , fluid height d, temperature difference Δ T . Picture of the annulus taken in the lab (right). See also [27,32].
Atmosphere 14 00836 g001
For measuring the surface temperature we use an infrared camera (Jenoptik, module IR-TCM 640). This camera has a spatial resolution of 640 × 480 pixel, a spectral range of 7.5–14 μ m, a thermal sensitivity < 80 mK and an accuracy of 1.5 K. The used thermocouples (sheathed sensors consisting of two wires NiCr-Ni from ALMEMO®) hane a diameter of 0.5 mm, and a wire length of 10 cm. The sensors have an accuracy of 0.1 C.

2.2. The ICMM Experiment

The alternative to Hide’s classical setup is the so-called dishpan configuration, which consists of a cylindrical vessel with a rim heating at the bottom periphery and cooling at the center [33]. The laboratory flows in Fultz’s experiments were very similar to the typical atmospheric flows but less steady and regular than in the classical annular configuration. The principal scheme of the ICMM laboratory model is in general similar to the Fultz-configuration except the location of the heater (Figure 2a). The shallow rotating cylindrical layer of fluid with a localized heater at the bottom periphery and a localized cooler in the central part of the upper boundary is considered. The rim heater is intentionally shifted from the sidewall to decrease the influence of the no-slip vertical boundaries and to provide an anticyclonic (easterly) motion in the upper layer close to the outer wall. The working fluid is a silicon oil (Prandtl number at room temperature is about 63). The full description of the experimental setup is provided in [25] and all the relevant experimental parameters can be found in Table 1 and Table 2. The experiments performed at BTU and ICMM are given in Table 3.
For visualizing the flow with aluminum flakes we use a Bobcat 2020 camera with 4 Mpx ( 2048 × 2048 pixels). The rate of recording was 1 frame per second. The aluminum flakes have a typical thickness of about 0.5–1 micrometer and a length that varies from 25 to 125 micrometers.

2.3. Specifics of the Different Experimental Models

The application of results of laboratory modeling to the processes relevant for the atmosphere requires a careful approach and a deep understanding of the mechanisms responsible for the flow formation and dynamics. The comparison of results from different laboratory models may on the one hand help to separate some universal features of baroclinic waves in a rotating fluid layer with horizontal temperature difference and on the other hand may help to isolate effects that are mainly determined by specifics of the experimental setup.
The main deviations of the different experimental setups include (i) the geometry (type of the working volume, aspect ratio, depth of the fluid), (ii) the heating and cooling realization and (iii) the fluid properties. The BTU experiment as well as the one by [24] have an annulus geometry. In contrast, the ICMM experiments are carried out in a cylindrical layer without an inner cylinder. The aspect ratio h / ( b a ) (see Table 1) determines the organization of the meridional circulation and may hence play a significant role in a flow formation. The BTU and ICMM setups in comparison with the one by [24] have a smaller aspect ratio (substantially less than unity). In shallow layers of fluids with high Prandtl numbers, which are considered in particular in the ICMM experiment, the influence of the Ekman layer on the baroclinic and inertial waves cannot be neglected [23]. We further point out that the driver of the motions in the described experiments is a thermal convection. This implies that the location of the heating and cooling and the type of the boundary conditions are important. In the “classical” BTU configuration, boundary conditions of the first kind (constant temperature) are realized along the vertical sidewalls. In Scolan and Read [24] and also the ICMM setup, heating and cooling is applied at different levels, but with different boundary conditions: boundary conditions of the second kind in the ICMM setup and mixed conditions in the setup by [24]. Finally we note that the fluid properties given in Table 1 are also important for the flow under consideration. In [34] it was shown that increasing the Prandtl number leads to less regular flows. Water with P r = 7 was the working fluid used in the BTU and the Oxford experiments. In contrast, silicon oil with P r = 63 was used in the ICMM experiments. It should be noted that due to so called surface active agents (surfactants) an open water surface can show surprising and quite specific properties and may hence behave rather as a deformable film than a free surface [35].

3. Results

3.1. BTU Configuration

The BTU experiment has proven to be a good analog to atmospheric flows even with respect to small-scale processes or climate dynamics. Here we demonstrate this by highlighting three aspects: (i) the energy spectrum retrieved from the experiment and from atmospheric data, (ii) a comparison of extreme value distributions derived from the experiment and from atmospheric reanalysis data, and (iii) an experimental determination of local instability measures pointing to rare and localized turbulence events in space and time. The latter might well be relevant in the context of extreme events. The results reviewed in Section 3.1.1 and Section 3.1.2 are already published [29,36] whereas Section 3.1.3 discusses new findings. In Section 3.2 we consider new numerical results on the meridional structure of the flow and we show that even with the Hide-setup a realistic meridional streamfunction seems possible.

3.1.1. Spectra

In the atmosphere the energy spectrum when dominated by meso-scale processes follows a 5 / 3 power law, whereas at large-scales, when it is dominated by Rossby waves, the power law slopes with 3 . This was first discussed by [37]. Whereas it is rather clear that the 3 slope corresponds with 2D turbulence of quasigeostrophic flow, it is still under discussion whether the 5 / 3 part is due to a Kolmogorov-type stratified turbulence [38] or due to gravity wave turbulence, where different gravity wave modes weakly interact. Using numerical data from the Japan Meteorological Agency, ref. [39] found that the energy spectrum of gravity modes exactly follows the 5 / 3 power law in the synoptic- and meso-scales. Ref. [40] used the MOSAIC dataset and separated the kinetic energy spectrum into divergent and rotational parts. They found a dominance of the divergence spectrum at the meso-scale and considered this as support for the gravity wave hypothesis since gravity waves contribute significantly to divergence.
Taking Particle Image Velocimetry (PIV) data from a large BTU tank experiment, ref. [29] presented the energy distribution between the large-scale balanced flow and the small-scale imbalanced flow. It was already discussed in [23] that weakly nonlinear internal gravity waves, spontaneously emitted from the baroclinic jet, can be observed in the differentially heated rotating annulus experiment. Similarly to the atmospheric spectra, the experimental kinetic energy spectra reveal the typical subdivision into the 5 / 3 slope for small-scales and the 3 slope for large-scales. Following [40] and separating the spectra into the non-divergent vortex and divergent wave components, it emerges that in the meso-scale range, the gravity waves observed in the experiment cause a flattening of the spectra from a slope of 3 to 5 / 3 and provide most of the energy for smaller scales. At even smaller scales, our data analysis suggested a transition toward a turbulent regime with a forward energy cascade up to where dissipation by diffusive processes dominates.
This correspondence between characteristics of the observed atmospheric kinetic energy spectrum and the one from the experiment is a strong argument for operating the baroclinic annulus as an analog to the atmospheric circulation. Moreover, it shows that the baroclinic annulus experiment is a useful tool to test concepts from geophysical fluid dynamics like, e.g., the concept of spontaneous imbalance and gravity wave emission at fronts in connection with Rossby wave trains.

3.1.2. Extreme Event Distributions

Extreme weather events such as heat waves and cold spells are part of the atmospheric jet stream dynamics. In two recent papers we studied distributions of such events in rotating annulus experiments [20,36]. In the first one we considered the effect of polar warming on the mid-latitude jet stream using a tank similar to the one seen in Figure 1 but smaller. The outer wall was at b = 12 cm and the gap width was just b a = 7.5 cm. We showed that a monotonic decrease in the meridional temperature gradient slows down the eastward propagation of Rossby waves and leads to a broadening of the wave spectrum. Temperature variability becomes smaller in regions influenced by the Rossby wave trains. A reduced variability implies a narrower temperature distribution and a reduction of the strength of extreme events. In contrast, the number of extreme events can increase in the mid-latitudes. Interestingly, in spite of the radical reduction of complexity of the laboratory experiment compared with the atmosphere, the found trends in the laboratory data correspond with findings from an analysis using reanalysis data [20].
In the second paper [36] we used surface temperature data from the big tank (see Table 1) measured with an infrared camera to analyze extreme event distributions. Probability density distributions of spatial mean and variance extremes from a long-term laboratory experiment (24 h of observation) with Δ T = 4  °C and Ω = 2 rpm (i.e., 7.9 experimental “years”) have been studied and were compared to the atmospheric probability density distributions taken from reanalysis data. Empirical distributions of extreme value monthly block data were derived for the experimental and atmospheric cases. Generalized extreme value distributions have been adjusted to the empirical distributions, and the distribution parameters have been compared. A good agreement between experimental and atmospheric distributions was found and these results hence indicate that the laboratory model is a useful tool for investigating trends in extreme event frequency due to climate change. In the future we plan to do “Arctic Amplification” experiments using the big tank by reducing the radial heat contrast.

3.1.3. Local Instabilities as Rare Events

In this and the following section we describe new results obtained from measurements with temperature probes and numerical modelling. A series of temperature probes have been positioned in the fluid to measure horizontal and vertical temperature gradients (see Table 4). The sensors can be used to estimate key parameters for local instabilities. The thermal wind is given by
U T = g d ( b a ) α Δ T f ζ ,
where ζ = 1 , g is the constant of gravity, f = 2 Ω and the other parameters can be found in Table 1. From experiments with a smaller tank we found that a better estimate for U T is given by the power law (2) but with ζ = 0.55 [20]. From this we calculate U T by using Δ T = T 1 T 5 where the indices indicate the sensor numbers (see Table 4). Using U T we estimate the local Reynolds number R e and the local Rossby number R o
R e = U T ( b a ) ν , R o = U T f ( b a ) .
By using ρ = ρ 0 ( 1 α T ) , the near surface buoyancy frequency N 2 = g / ρ 0 d ρ / d z is given by
N 2 = g α d T d z g α ( T 3 T 6 ) Δ z ,
with Δ z = 1 cm. With this estimate and the thermal wind U T we can obtain a first guess for the Richardson number and the Froude number
R i = N 2 d 2 U T 2 , F r = U T N ( b a ) .
De Bruyn Kops et al. [41] discussed Reynolds and Froude number scaling in stably-stratified flows. In such flows there is a competition between Reynolds number related turbulence and stratification effects that tend to suppress turbulence. Therefore, the authors argue, turbulence erupts in patches and this leads to intermittency. The latter can also be seen as turbulence events localized in space and time. When rotation is added the flow becomes even more complex due to new instabilities in stratified rotating flows. Using the estimates for N / f , R o , N , R i , we can track different kinds of local instabilities in the rotating annulus. We point out that local instability in a generically stable flow can be considered as an extreme event since, even if rare, it can strongly affect the flow behaviour.
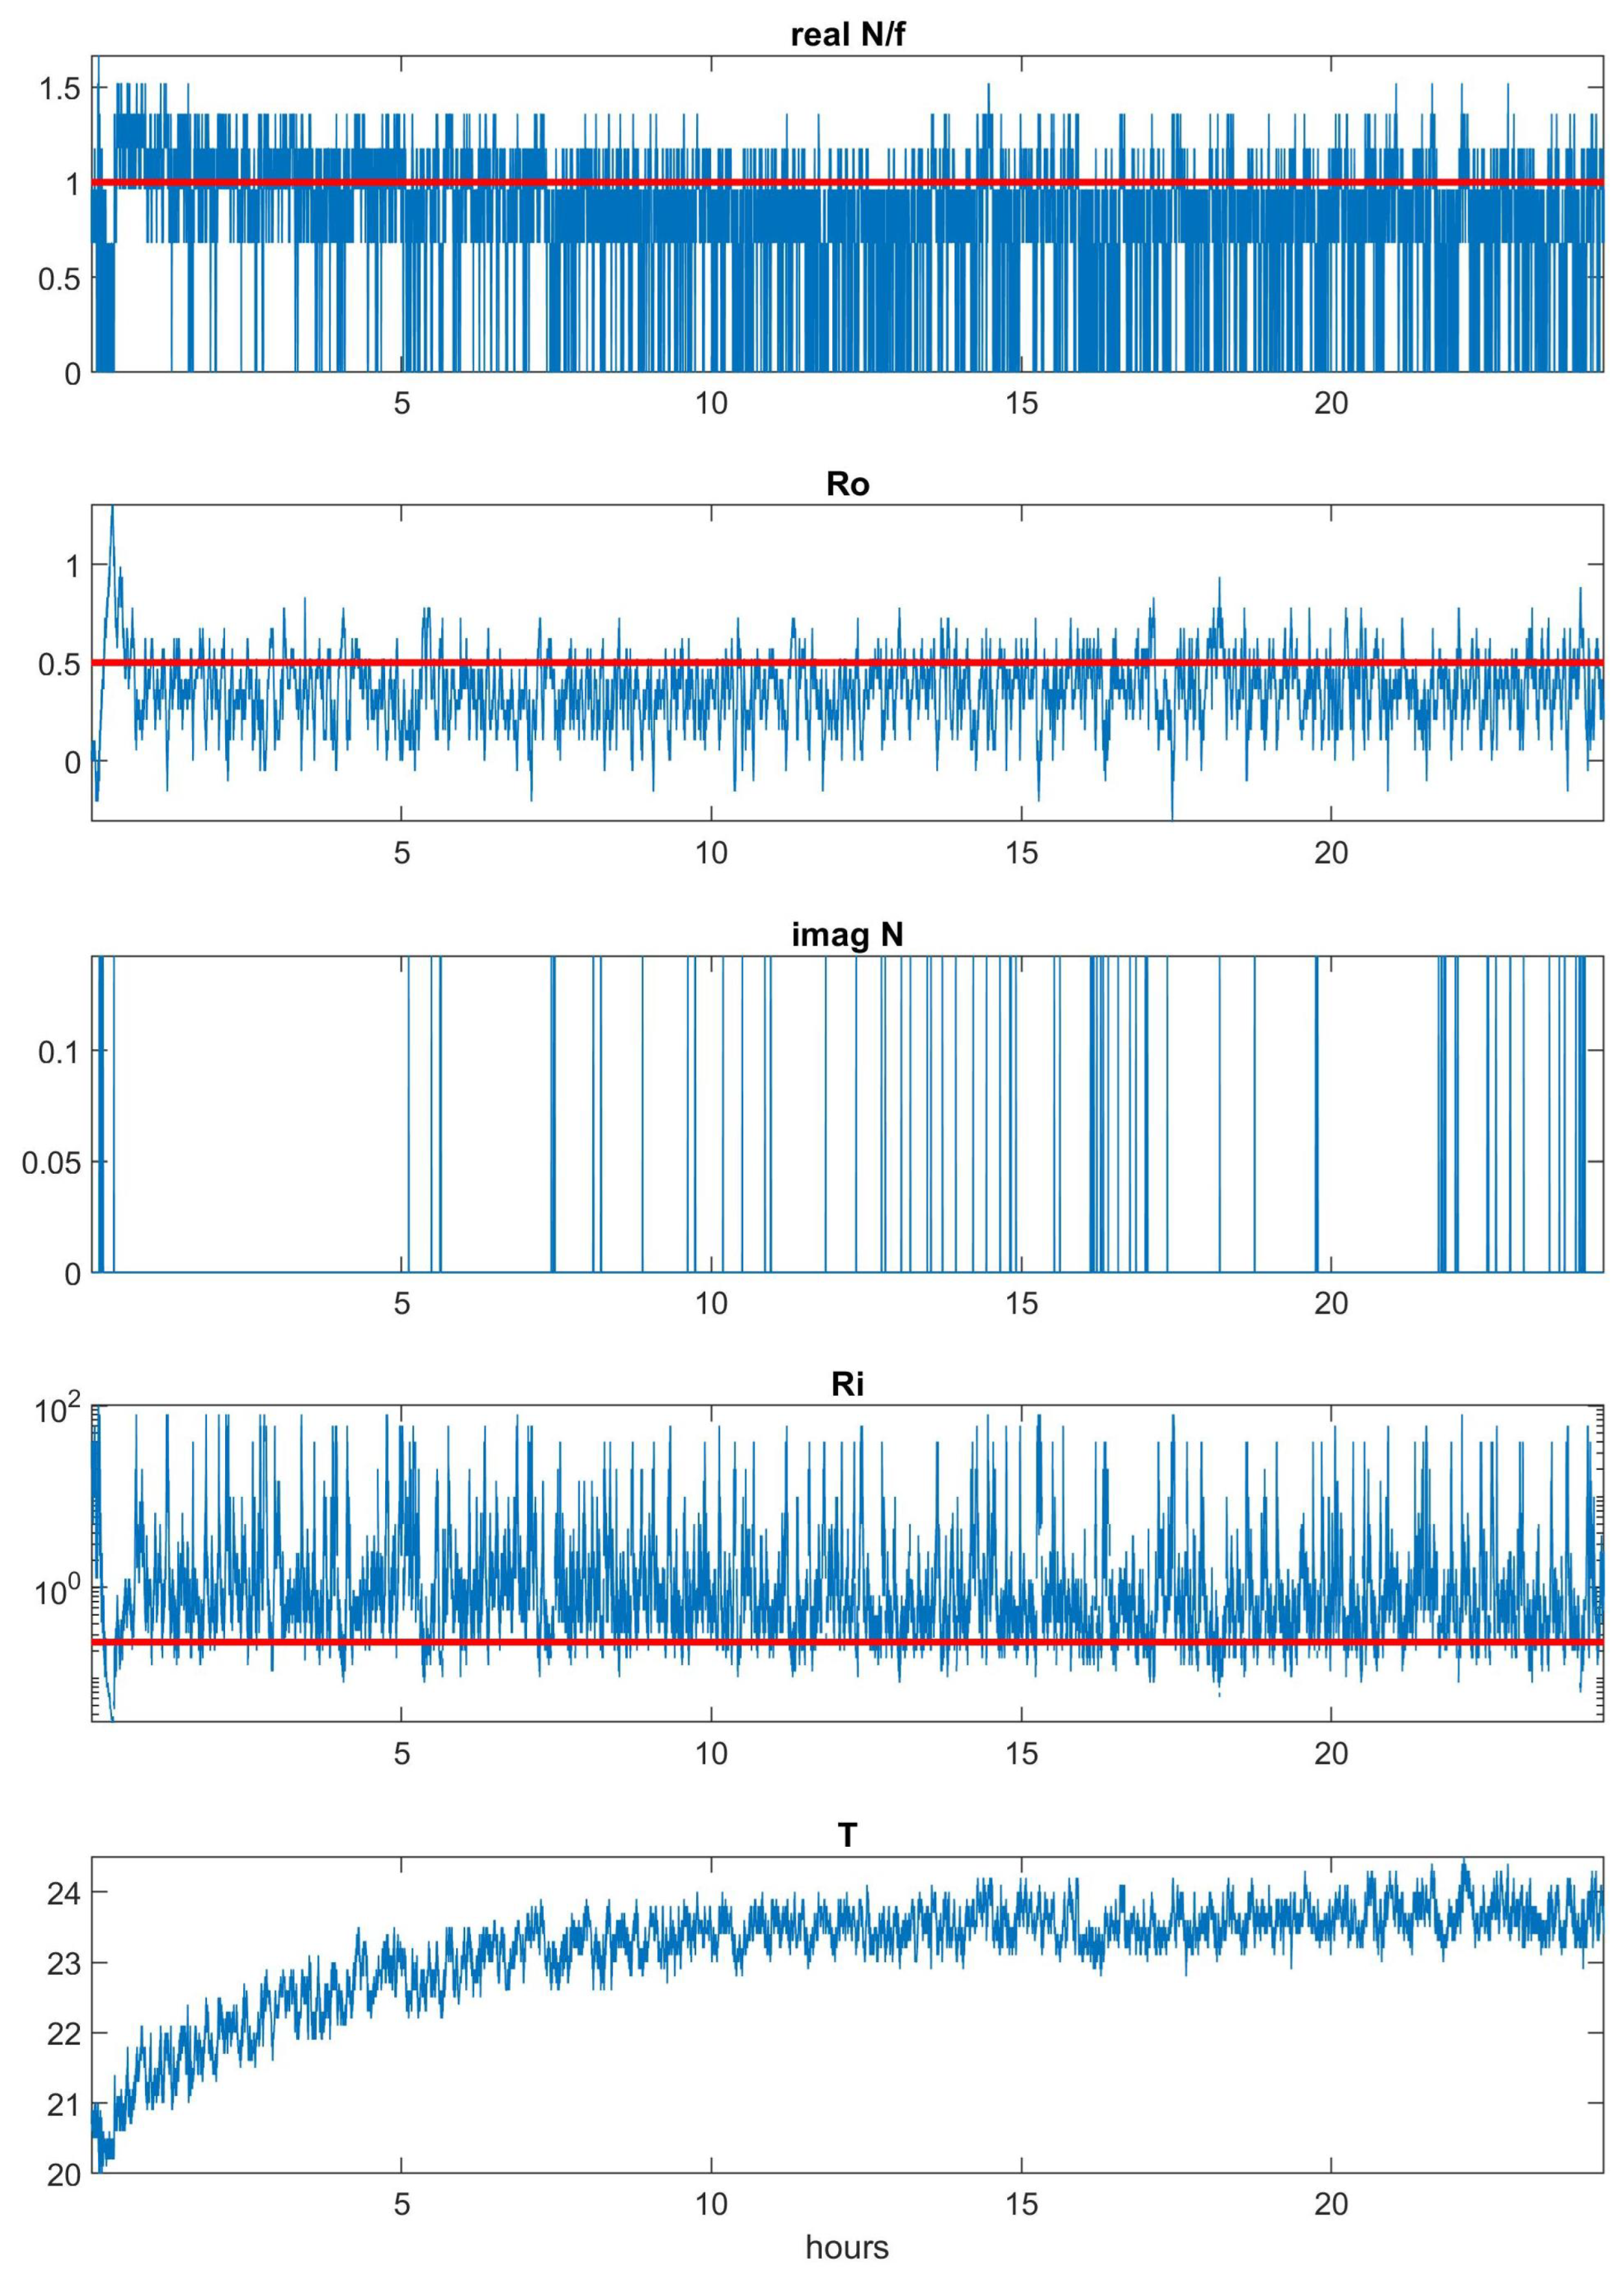
We used the sensor data from the experiment BTU 1 (see Table 3). The same experiment was considered in Section 3.1.2 but there we used infrared surface temperature data. In Figure 3, we show the time-series for N / f , R o , the imaginary part of N, R i , and T 3 . We know from [23,29] that internal gravity waves can be generated at baroclinic fronts by so called spontaneous emission especially when N / f and R o are in the order of one or larger. From the first two rows of Figure 3 we see that such episodes exist and during such periods we can expect more small-scale features in the flow. For the critical (red) line in the Rossby number plot we use R o = 0.5 since values above 1 occur only in the first transient period of the experiment. As is obvious in the plot of T 3 shown at the bottom of the Figure, the transient period covers the first 7 h of the experimental run. The following row shows the imaginary part of N. Whenever this part is non-zero, the flow is locally convective unstable. Episodes of such complex N exist implying convectively triggered local turbulence. Finally, in the forth row of Figure 3 we plot R i . Following classical linear theory of homogeneous shear flow, whenever R i < 1 / 4 , Kelvin-Helmholtz instability will generate local turbulence. It should be pointed out that this value for shear instability might be too small for stratified flows. Ref. [41] argue that assuming R i to be order one, localized turbulence can be expected if R e F r 2 > O ( 1 ) . This is fulfilled in our experiment where the mean R e = 2327 and the mean F r = 0.44 which gives R e F r 2 > O ( 10 2 ) .
Obviously, in the meteorological context, such rather rare local turbulence events described above can be interpreted as extreme events. Laboratory “climate change scenario experiments” could hence help to pinpoint changes in the frequency of rare events like sporadic localized turbulence. We can determine trends on the frequency for such events when experimental parameters like the radial temperature gradient are changed. Probability density functions of the discussed events of local instabilities will be discussed in future work. Finally we note that, as shown by the fifth row of Figure 3, transient processes occurring after switching on the tank rotation can have an impact on the distribution of instabilities. The time series of the imaginary part of N, denoted as N (third row of Figure 3) shows first signs of an influence of adaptation processes on the frequency of convective instability. Apart from the first minutes with very strong transient effects we observe no convective instability for the first 5 h of the experiment. After this period the trend in T 3 becomes small and events of convective instability occur more frequently. Therefore the time series of the imaginary part of N points to a sensitivity of the statistical distribution of convective instability as a result of changes in the boundary conditions (see also [27], where transient effects are discussed in more detail).

3.2. Numerical Simulation

The differentially heated rotating annulus has intensively been studied numerically. This is true in particular for smaller tanks keeping the numerical effort within reasonable limits. We mention here as an example the benchmark study by [42]. More recently, numerical results and comparisons with experimental data have been performed also for the large BTU experiment [22,23,43]. To take advantage of modern generation computing hardware, a scalable numerical method, based on a higher-order compact scheme, has been developed to solve rotating stratified flows in cylindrical annular domains [44]. This code was successfully applied to study stratorotational instability [45] but also to simulate baroclinic instability using the geometry and the parameters of the large BTU tank.
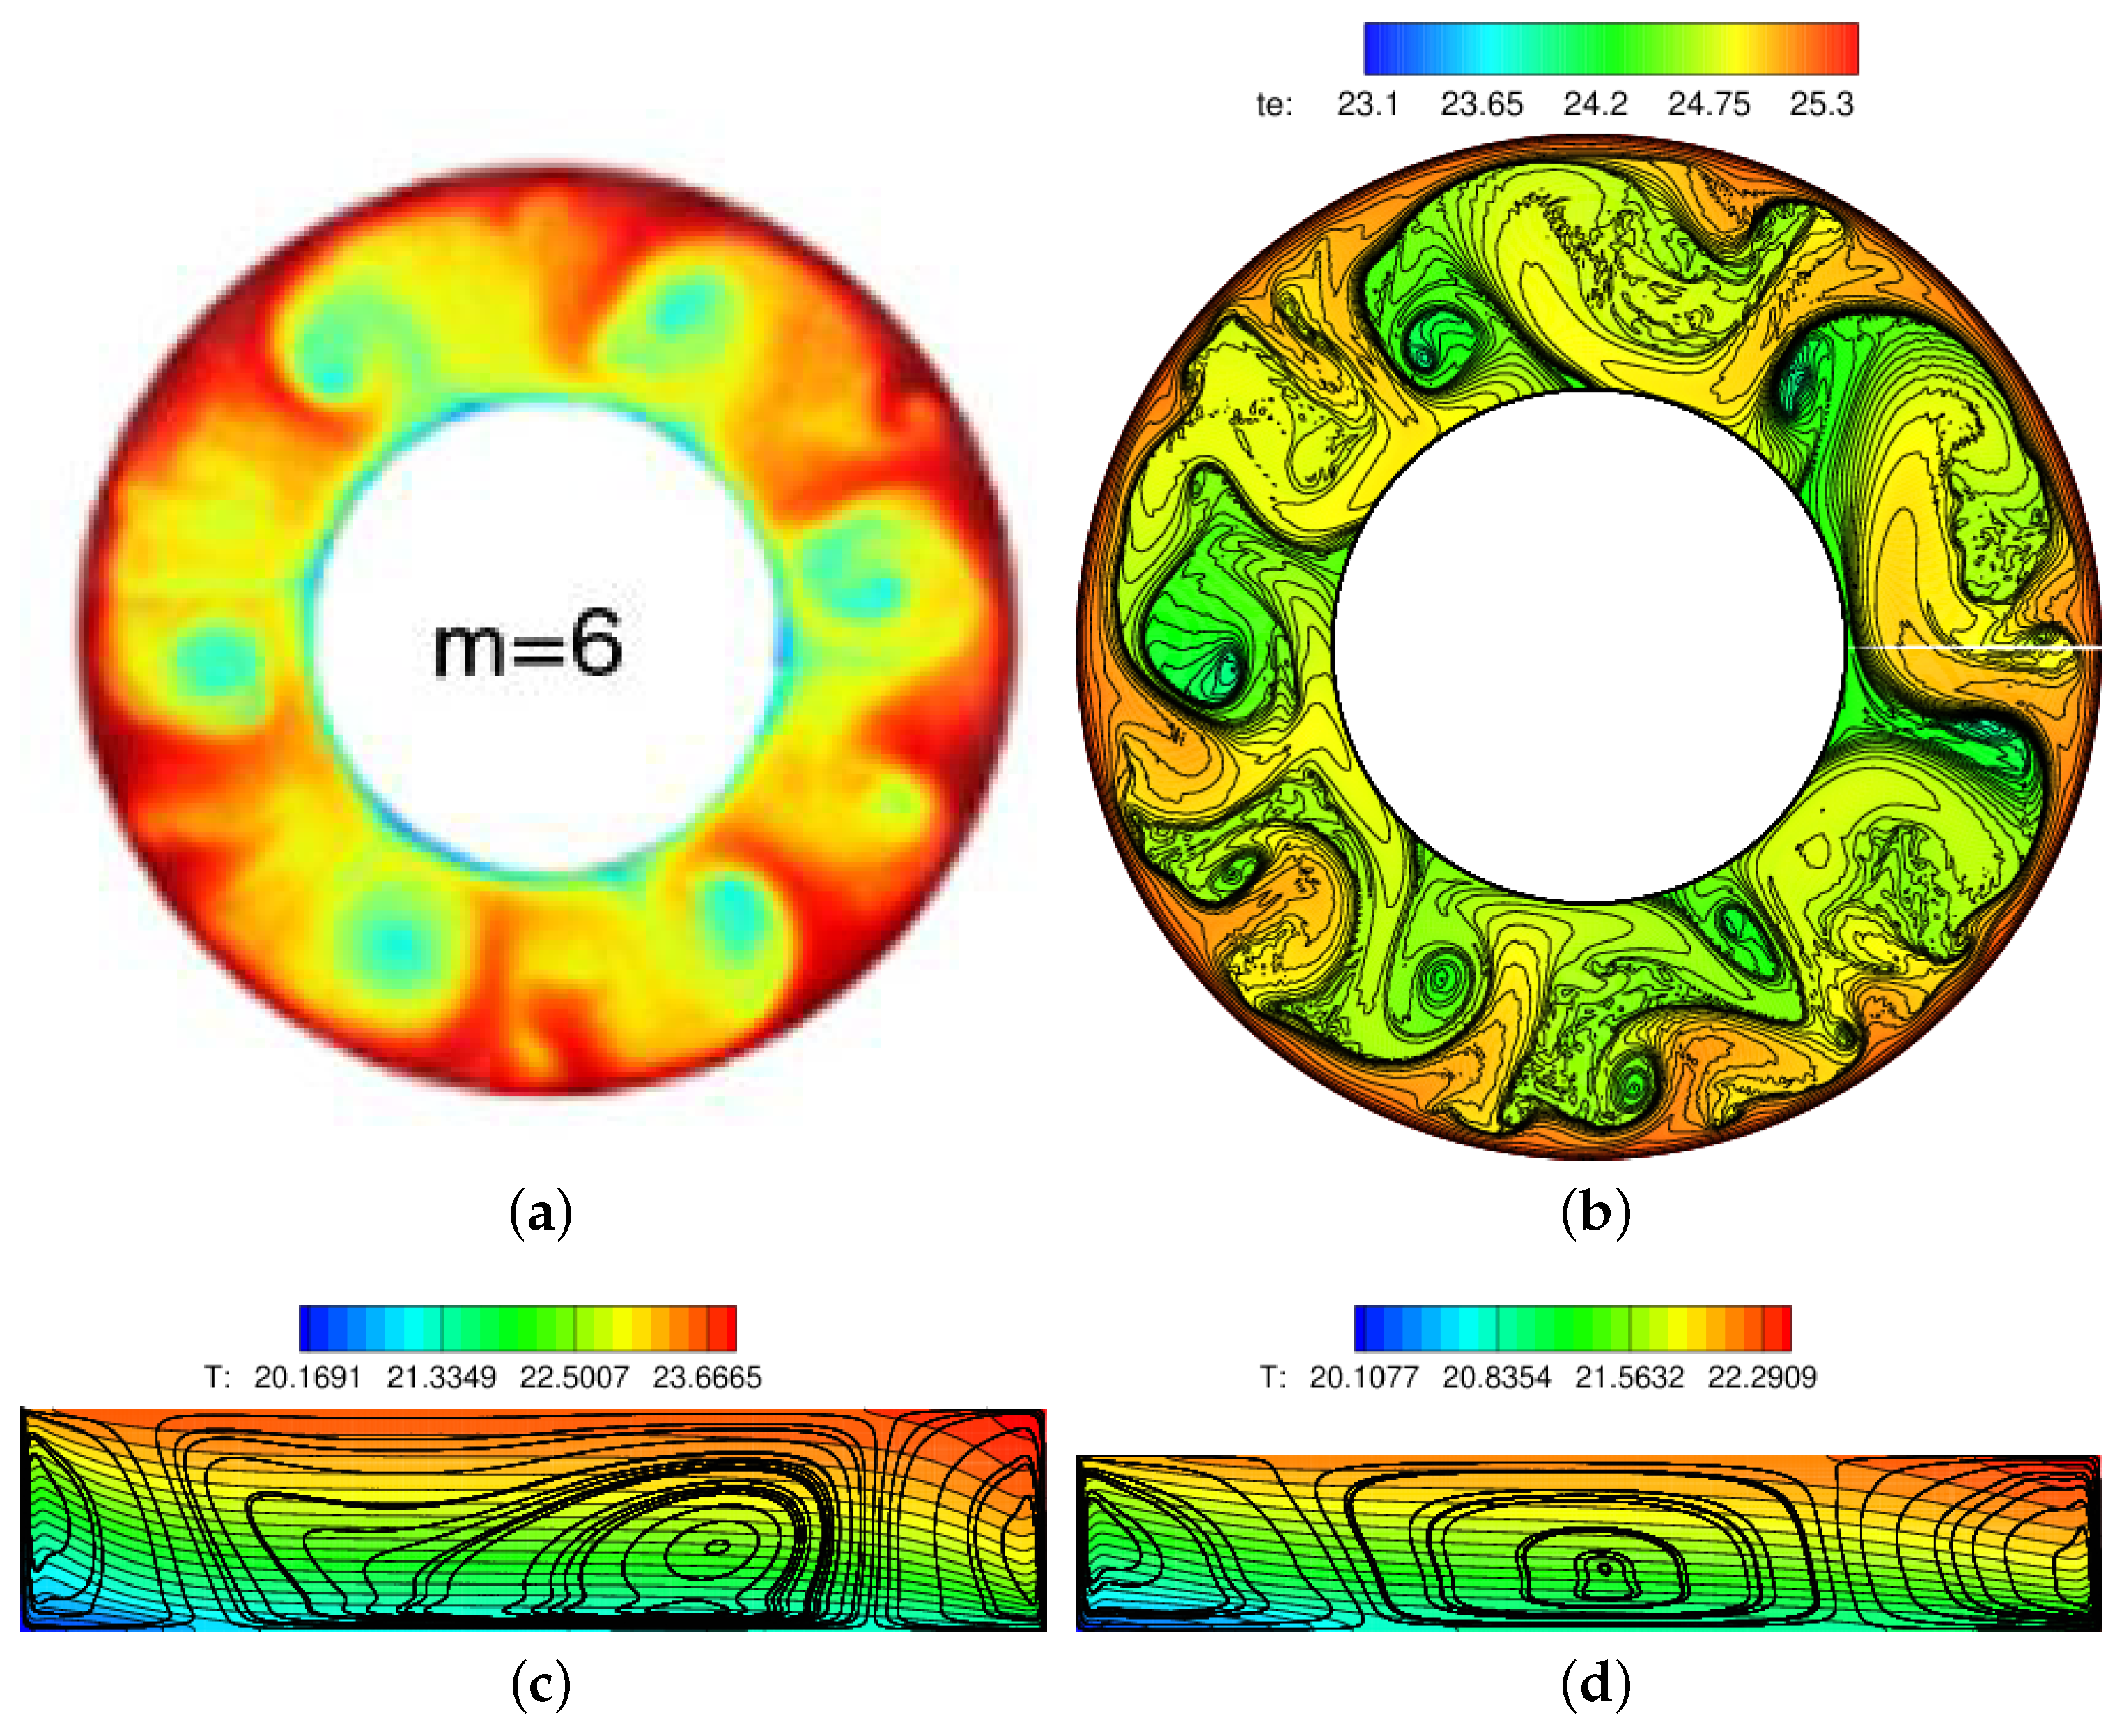
To illustrate the ability of the code to simulate the baroclinic flow, in Figure 4a,b we show the experimental and the numerically simulated surface temperature, respectively, for the parameters of BTU 2 (see Table 3). In the context of our presentation of results from experiments with the Hide- and the dishpan-setup with different thermal forcing, the meridional mean streamfunction is of great relevance. The streamfunction is computed from the azimuthally averaged radial and the vertical velocity components and it is then averaged over several baroclinic wave periods. We show in Figure 4c,d the meridional streamfunction of a simulation using the parameters of BTU 1 of Table 3 in Figure 4a and BTU 2 in Figure 4b. For the first set of parameters (BTU 1) the flow shows larger irregularities typical for geostrophic turbulence [36]. For the parameters BTU 2 used in Figure 4a,b,d the flow is in a rather regular baroclinic wave regime with azimuthal wave number m = 6 . Note that a very similar case has recently been benchmarked and the authors show the surface temperature field in their Figure 7 for m = 7 [23].
It is remarkable that in both cases we see a three cell structure in the meridional streamfunction with a strong analogy to the atmospheric circulation. For the Hide-setup with heated and cooled walls and an aspect ratio h / L 1 the one cell structure is the generic case although [46] reported multi-cell solutions in their numerical simulations of a small annulus with aspect ratio about one. However, for a more atmosphere-like configuration still with walls at fixed but different temperatures and with h / L = 1 / 7 < 1 , the single cell solution seems to become unstable, breaks up and forms a three-cell structure. We see that, as expected, the three cells are more regular in the regular baroclinic wave regime (Figure 4b). Note that so far, this pattern of meridional circulation has not been confirmed experimentally. Interestingly, it seems that for the three-cell structure to occur we do not need Rayleigh-Bénard type convection at the outer and inner part of the annulus. However, local convection in the tropics and polar regions of the atmosphere is better represented when heating and cooling regions are implemented at the bottom and top of the tank. In this case, interactions between zones of “tropical” convective instability and the central stably-stratified baroclinic wave zone, representing the zone of mid-latitude westerlies, can be studied. In fact, this is the reason for designing experiments deviating from the Hide-setup [24,25] described in Section 2.2 and Section 3.3 below.

3.3. The ICMM Configuration

The ICMM model is characterized by a number of deviations from Hide’s classical configuration. The main differences are the location of heat and cold sources, the type of boundary temperature condition (of second kind) and the working fluid with a relatively high value for the Prandtl number. Here, we give only a brief description of the main results, their detailed description and analysis can be found in [25,47].

3.3.1. Experiment

The flow structure for the relatively small angular velocity (ICMM 1, Table 3) is shown in Figure 5a. The ring-shaped strip visible in the periphery is the heater, which triggers an intensive convective flow, consisting of multiple plumes. In agreement with a scheme presented in Figure 2a, an ascending convective flow over the heater provides the formation of convergent and divergent radial flows in the upper layer. Radial transport of angular momentum provides an anticyclonic circulation (easterlies) near the sidewall and a cyclonic circulation (westerlies) at radii smaller than the radius of the heater. The observed cyclonic part of the flow is nearly axisymmetric and corresponds to the upper-symmetric, Hadley-like regime which is characteristic for the rotating layers with horizontal temperature difference at moderate rotation rate [24,33,48].
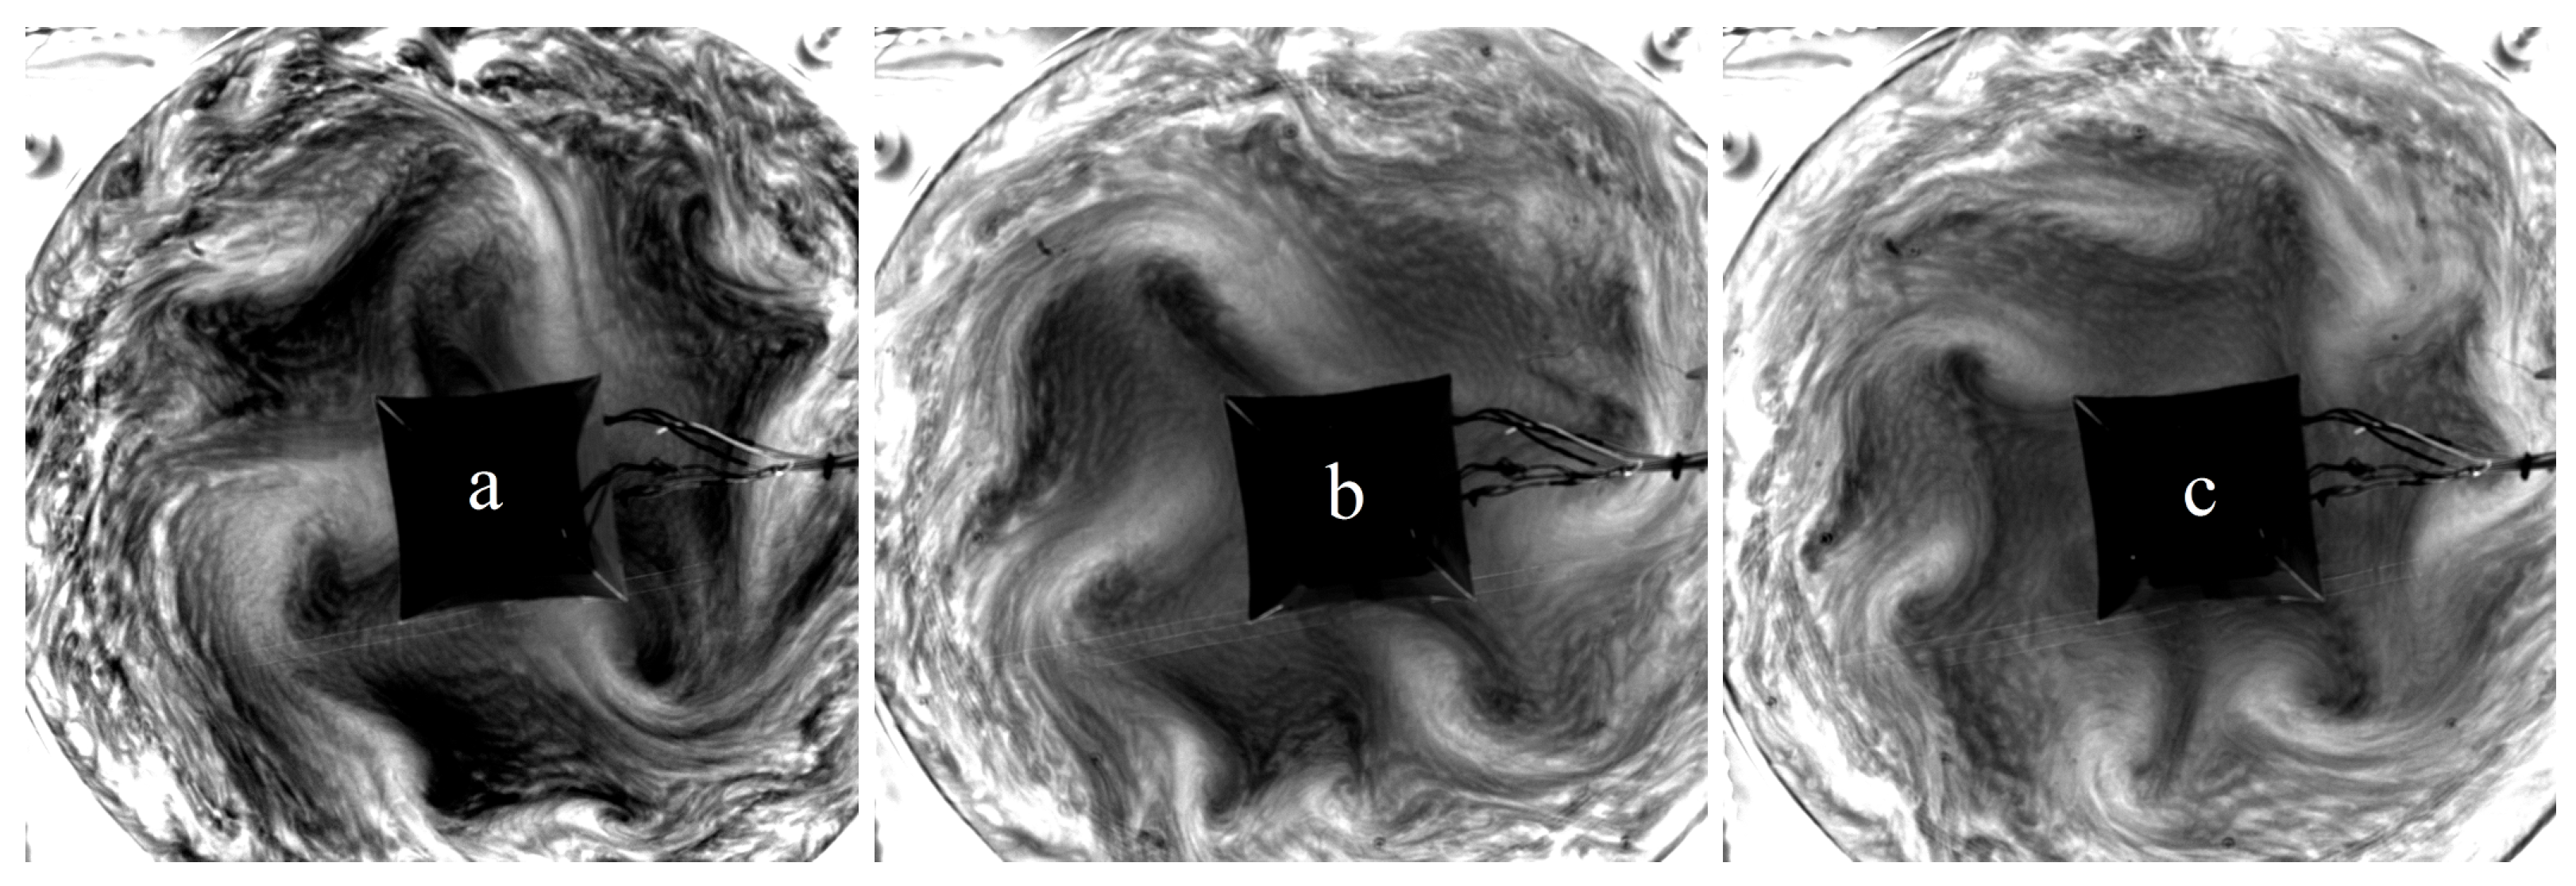
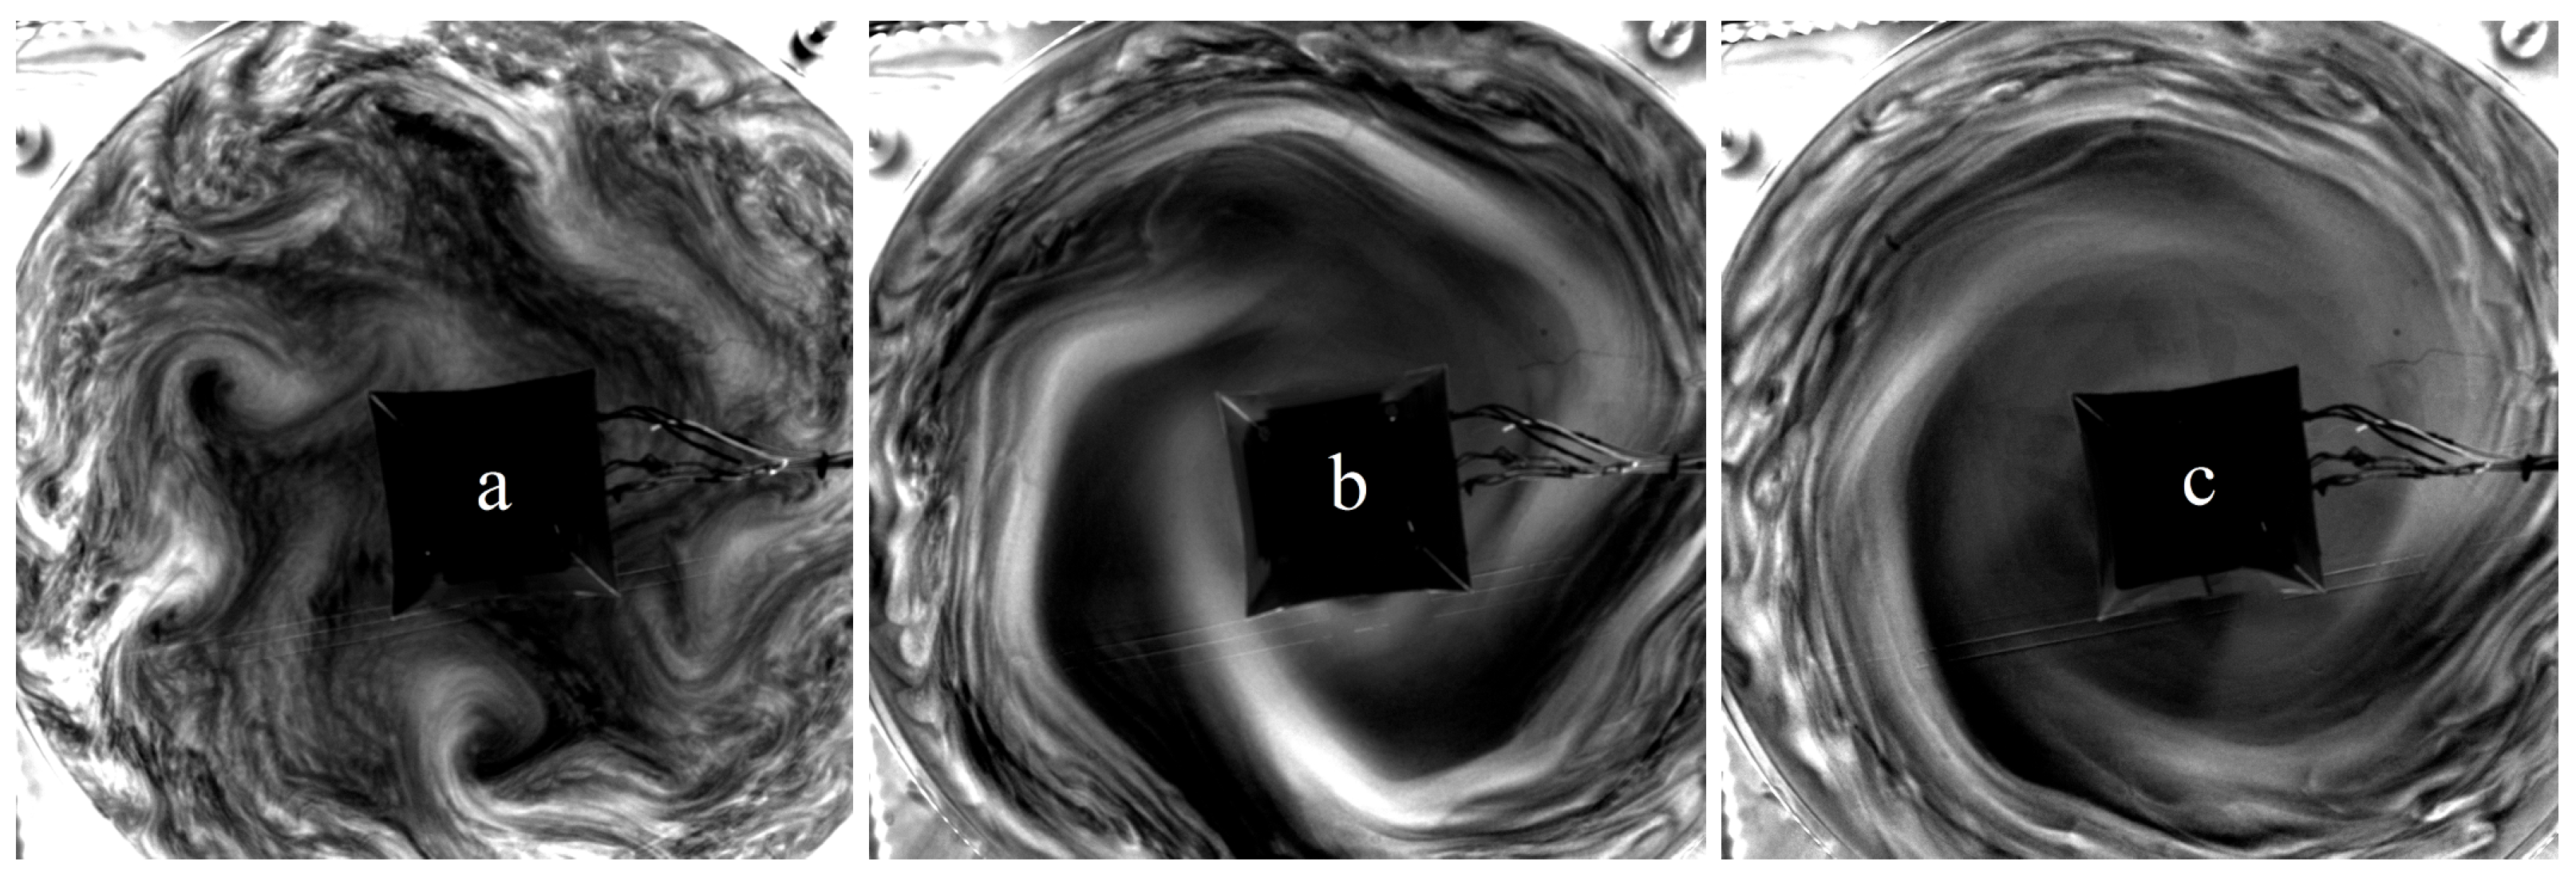
An increase in the angular velocity results in an increase of the Taylor number and a decrease of the thermal Rossby number and leads to an instability of the axisymmetric flow and a transition to the baroclinic wave regime (Figure 5). This transition may occur at different values of the control parameters that partly depend on the particular experimental setup. However, qualitatively the transition is similar for all known configurations [11,24,33] and it is a robust feature of the rotating fluid layers with a horizontal temperature difference. Nevertheless, the flow structure and dynamics in the baroclinic wave regime strongly depend on the experimental realization. e.g., in a classic Hide-configuration, there is an area of parameters on the R o T T a diagram with steady regular waves. The applied vertical separation of the heating and cooling [24] reduces this area. In the case of the ICMM setup, in regimes with evident baroclinic waves, as shown in Figure 5c, the flow is constantly evolving, which leads to changes in the wave modes and amplitudes. A further increase in the angular velocity leads to an even more complex flow structure and dynamics. Figure 6 shows a transition from the main mode m = 3 to m = 7 during the experimental run ICMM 7, i.e., without changing the experimental parameters. The lifetime of the dominant wave modes varies from a few to tens of rotation periods. This regime with regular but unsteady waves is rather sensitive to the control parameters, and relatively small variations of R o T and T a (Exp. 8a, Figure 7a) may lead to an irregular flow structure. Decreasing R o T by decreasing the heating power results in an surprising regularization of the flow (Figure 7b). A further decrease of R o T finally leads to a weakening of the baroclinic waves (Figure 7c).
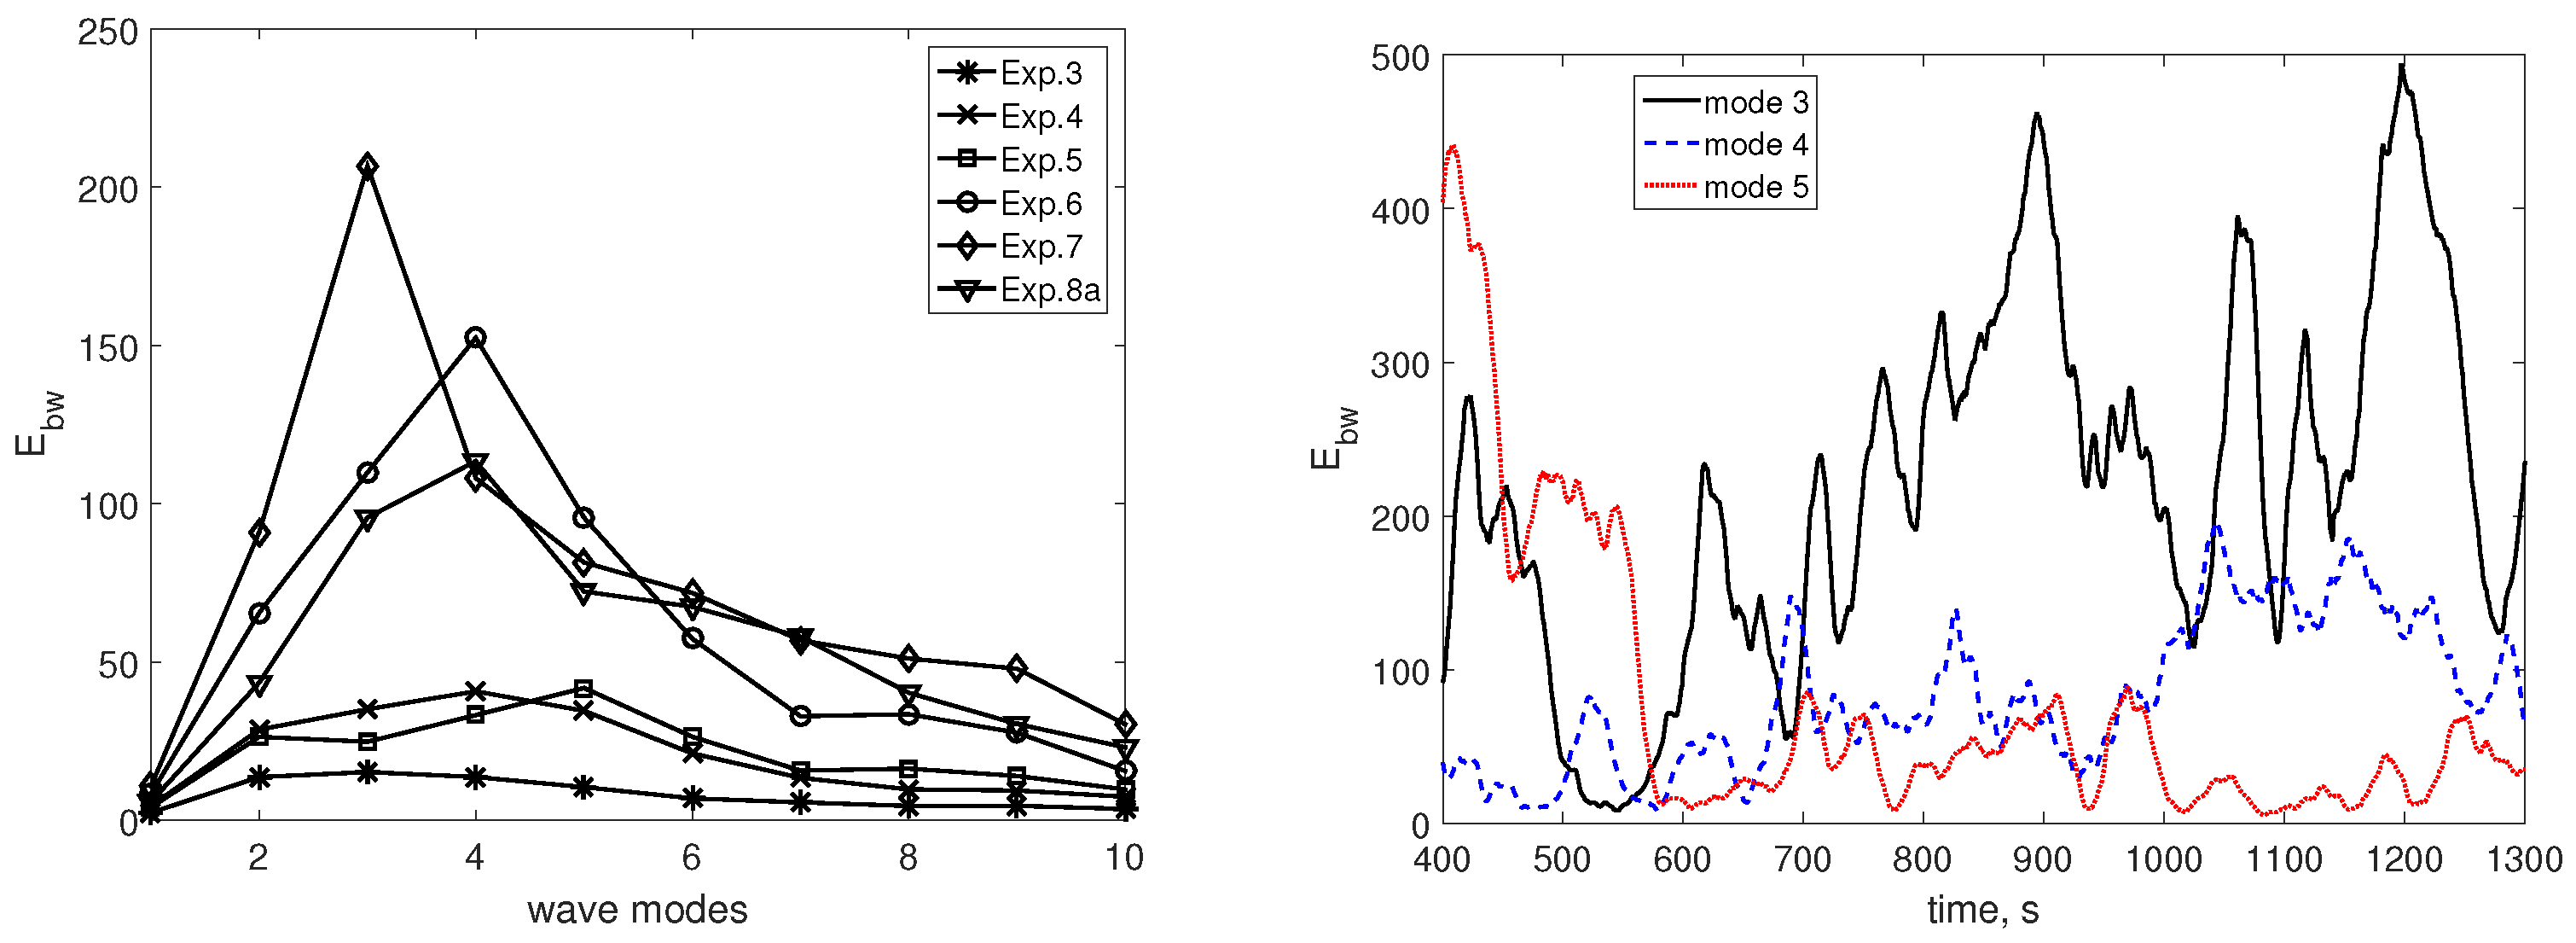
Fourier decomposition of the brightness field of instantaneous grey scale images (in the mid-radius) can provide valuable information about the modes of baroclinic waves and their temporal behaviour. The energy of the main modes of baroclinic waves for a series of experiments with increasing rotation rates are presented in Figure 8. It is evident that the flow in a baroclinic wave regime is characterized by a number of the most energetic modes (Figure 8—left). The temporal evolution of the main modes shows that modes can coexist leading to deviations from the regular structure (Figure 8—right).

3.3.2. Numerical Simulation

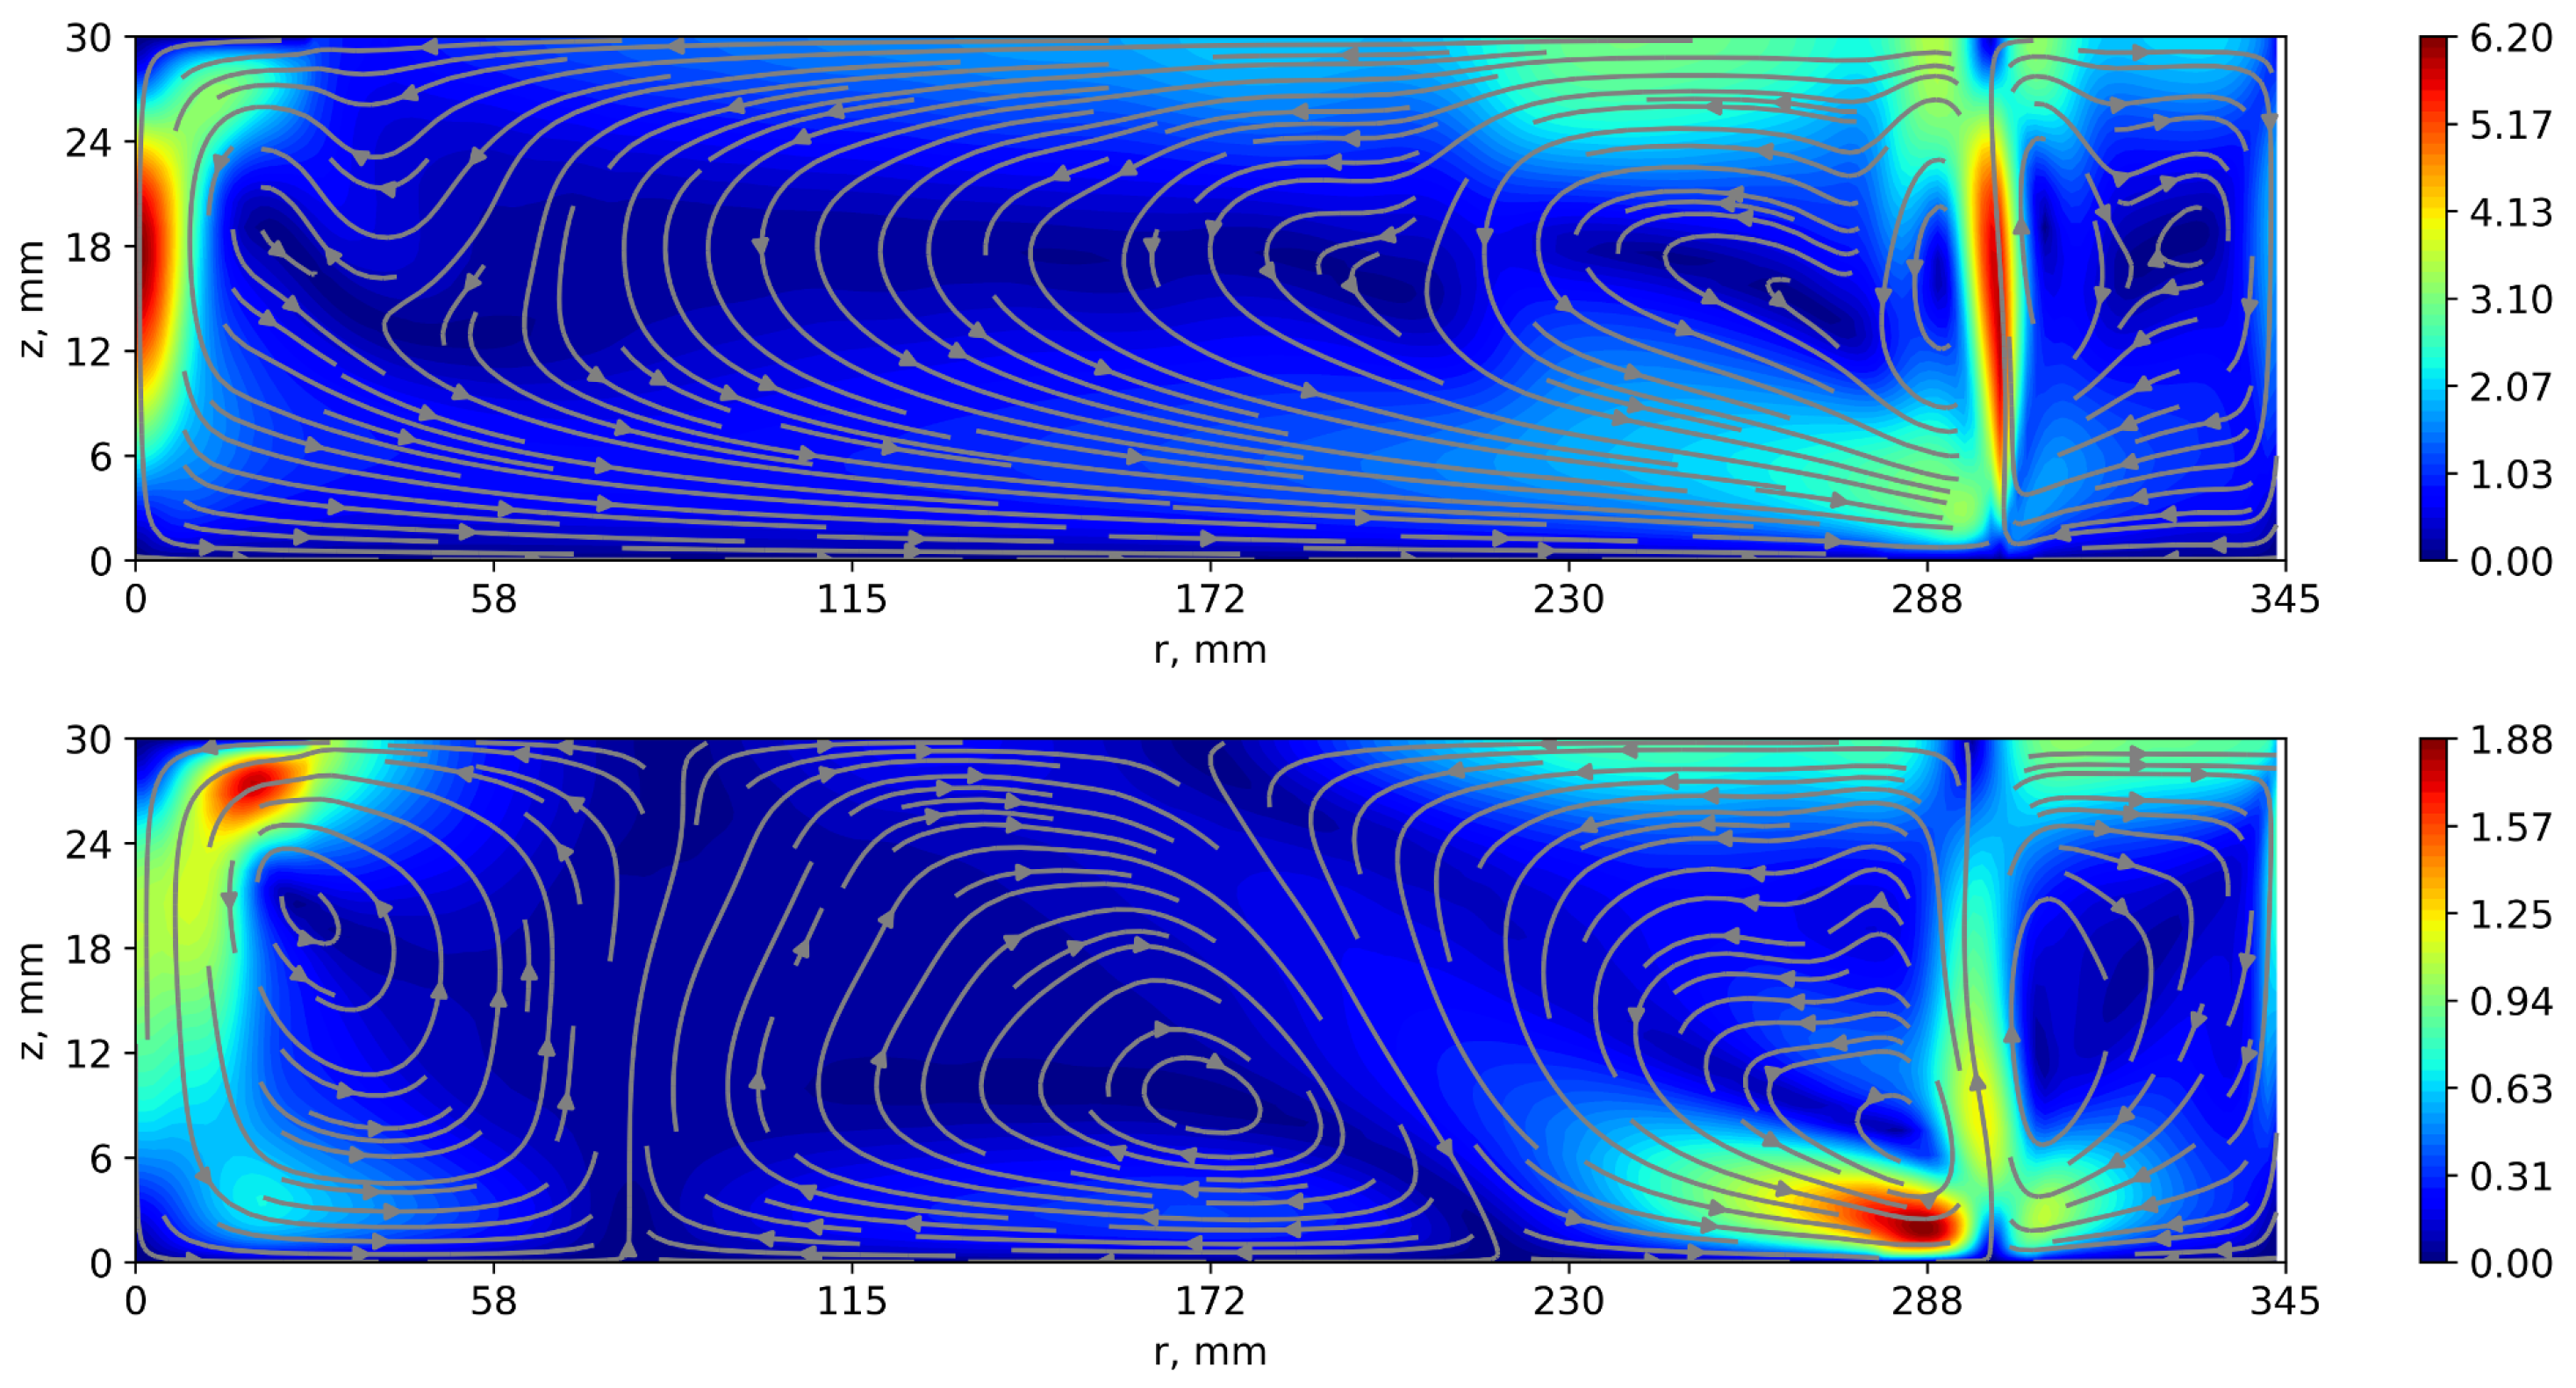
One of the goal of the ICMM laboratory model was the realization of an Earth-like mean meridional and zonal circulation. The presented experimental results were focused on the flow structure at the upper layer and did not provide full information about the three-dimensional flow structure. To solve this problem, a direct numerical simulation of thermal convection in a rotating cylindrical layer was performed using the freely distributed computational fluid dynamics package OpenFOAM v2106 [47]. The computational domain is a digital copy of the experimental model in terms of its geometric dimensions, the location of the rim heater and the central disc cooler. It should be noted that the obvious gain in the volume of information is at the expense of a colossal growth of “time” costs: to calculate one second of physical time (on 112 computing cores) it requires about 300 s of calculations. This limits the number and duration of simulations with the “digital twin” of the ICMM laboratory model. The findings from the numerical simulations show a good overall agreement with the experimental results. The mean meridional circulation for two different regimes is shown in Figure 9. The circulation in the axisymmetric regime corresponds well to the general scheme presented in Figure 2a and also with the findings from the French code (Figure 4c,d), i.e., the digital twin of the BTU experiment using the Hide-setup. Most of the layer is covered by a main Hadley-like cell and because of the shift of the rim heater near the sidewall an additional cell is formed providing an anticyclonic belt. In the baroclinic wave regime, corresponding to the experiment ICMM 7 (Table 3), one can see the appearance of an extra cell in the center. This can be seen as an experimental analog of the Ferrel cell, which appears only after averaging in azimuthal direction and time, similar to the real Ferrel cell. Decreasing of the heating power leads to a more regular wave regime as shown in Figure 7b which is also connected with a disappearance of the Ferrel-like cell. It means that the three-cell structure, which occurs in analogy to the Hadley, Ferrel and polar cell, exist in a specific range of the control parameters only.
Baroclinic waves, in the ICMM configuration, in contrast to the classical Hide-model, are unstable. Experiments [25] have shown that the observed baroclinic waves are a superposition of different wave modes, which drift in the rotating system in the cyclonic (prograde) direction. The amplitude of these wave modes varies significantly with time, and without a dedicated frequency. In this context, in addition to the mean structure, it is useful to consider the structure of characteristic pulsations, which are mainly due to a linear superposition and nonlinear interaction of wave modes. Indeed, the pulsation fields of the azimuthal and radial velocity components in the axisymmetric and the wave regime are qualitatively different. In the axisymmetric regime, velocity pulsations are concentrated in the areas of the rising and sinking currents above the heater and under the cooler, obviously formed by small-scale convective processes. In the wave regime, the pulsations are localized in the upper part of the fluid layer and the area of baroclinic wave formation. This localization of the baroclinic waves in the upper layer is in agreement with [23], where a strong dependence of the wave formation with respect to depth was found.

4. Discussion

In the present paper we review and contrasted two setups for the differentially heated rotating tank used to study features of the large-scale atmospheric circulation. One of the experimental setups consists of two concentric cylinders with a flat bottom plate and an open top. The inner cylinder wall is heated and the outer wall cooled. The annulus region between the cylinders is filled with water and the whole tank is mounted on a rotating platform. We coined the term “Hide-setup” for this experiments after R. Hide, one of the pioneers in this field. The other experimental setup is the so called dishpan-setup or “Fultz-setup”, because D. Fultz, another pioneer in experimental geophysical fluid dynamics, provided series of experiments in such a configuration. It has no inner cylinder and heating is done along a ring fixed at the bottom and close to the outer wall. The free surface fluid (silicon oil) is cooled from above in the center of the cylinder by a thermoelectric (Peltier) cooler.
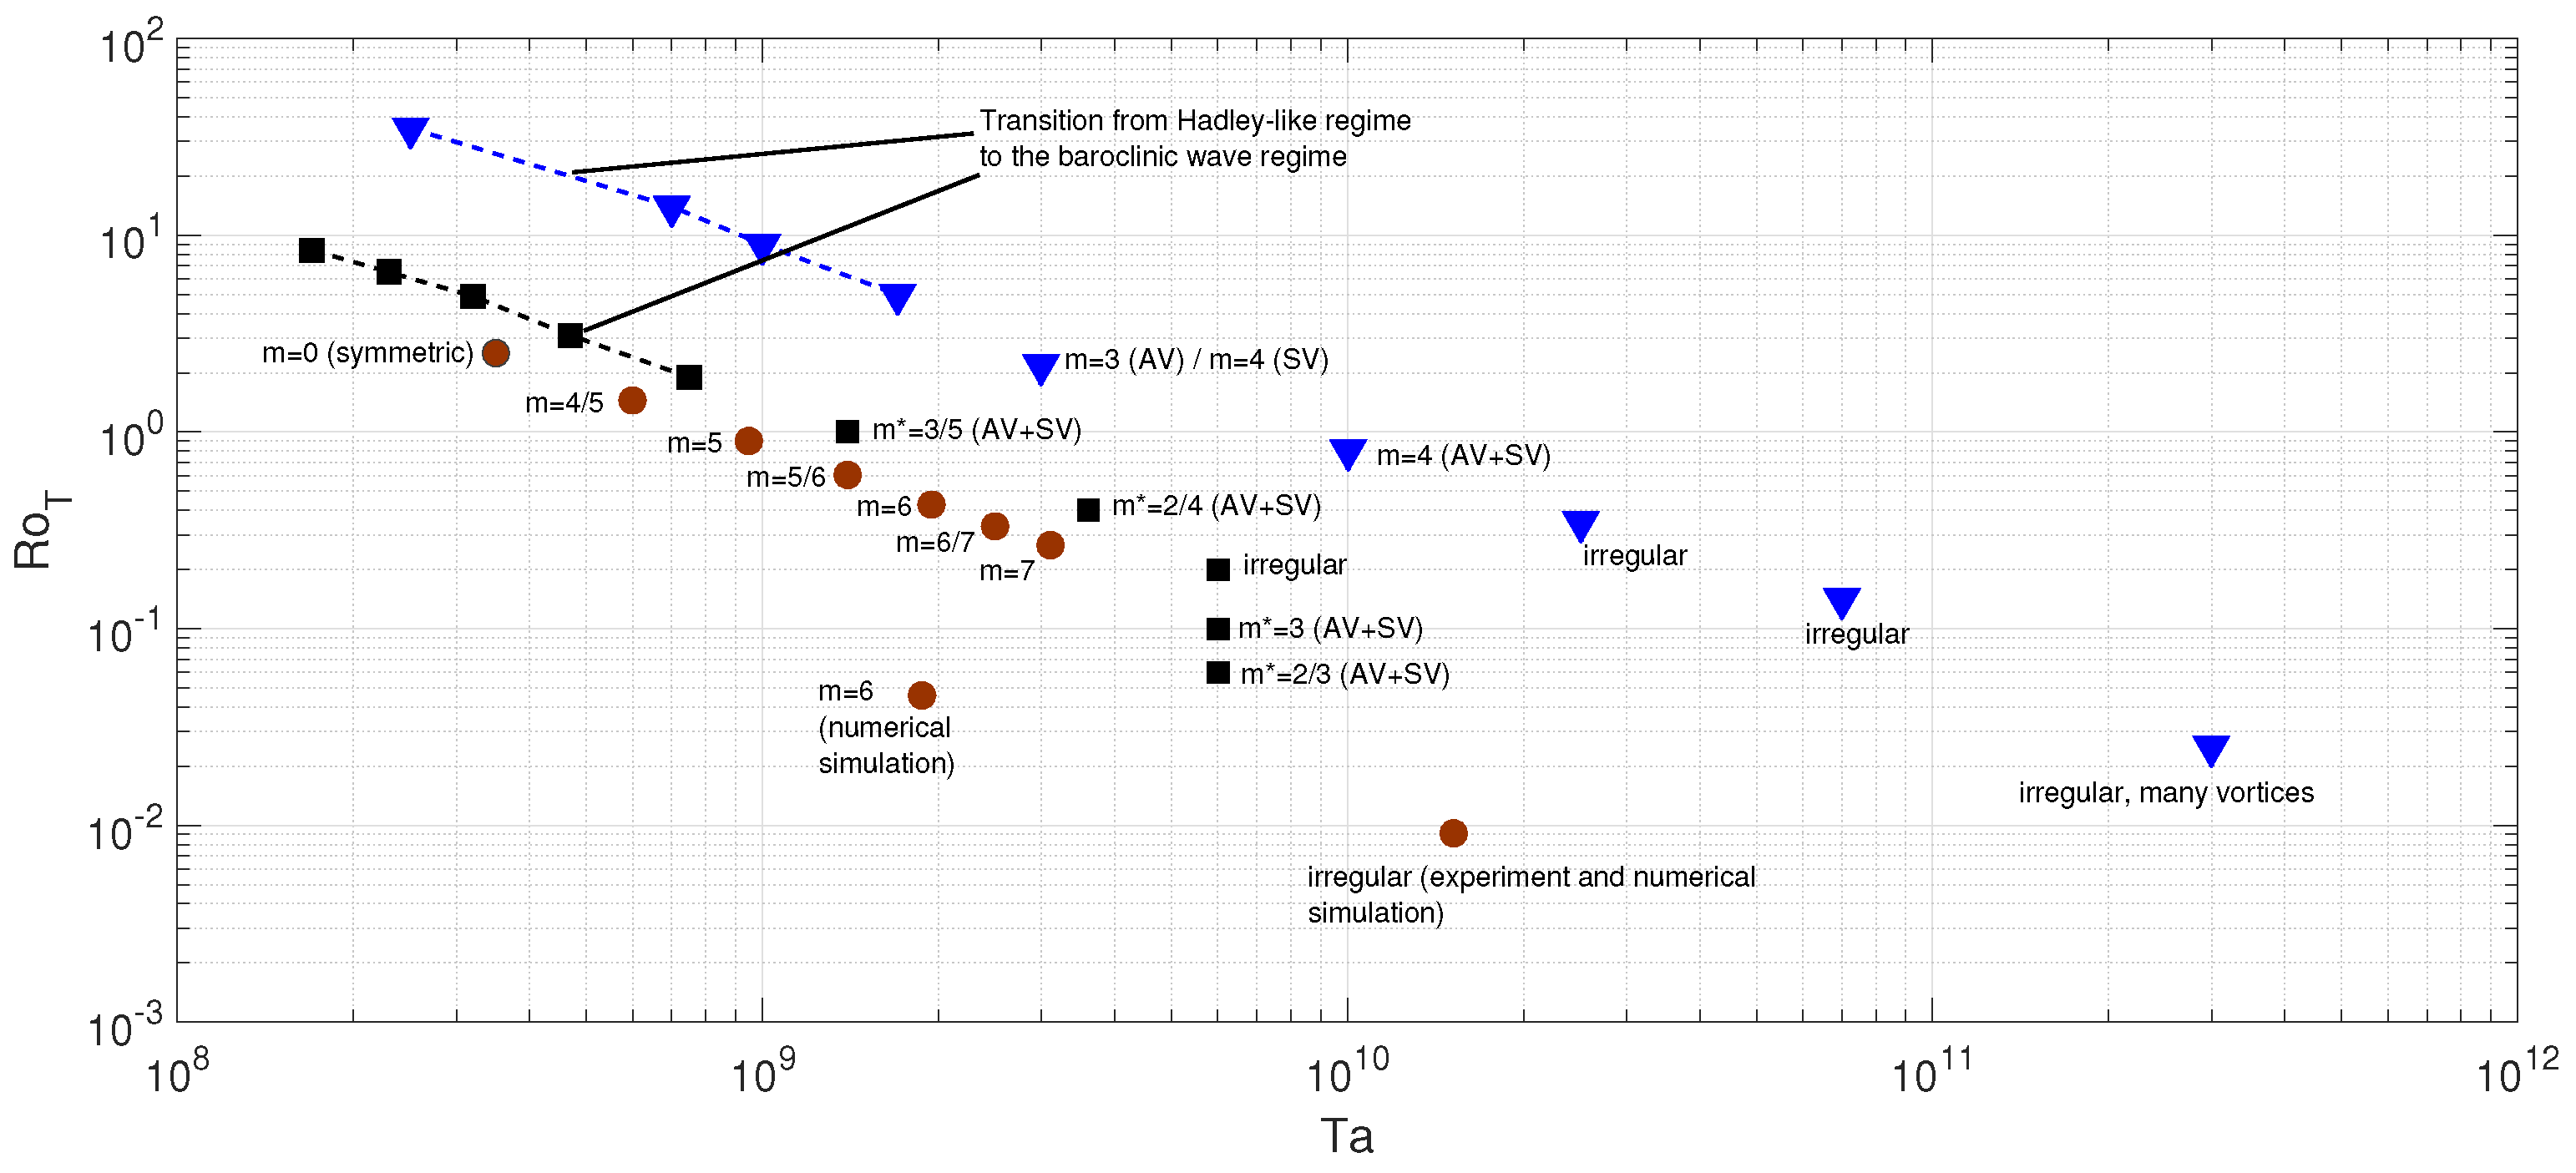
We discussed exemplary a number of recent results that underline for both setups the potential to experimentally verify concepts of atmospheric dynamics and to test new hypotheses in this area. From Figure 10 we can conclude that, plotted in a R o T - T a -frame, the parameter range for the experiments is large and it has, at least with respect to the used large cylinders with small aspect ratios, not systematically explored. The data points in Figure 10 show recent measurements by [23,24,25], whereas as shown by [24] in their Figure 10, the relevant parameter range for T a < 5 · 10 8 is covered rather well for experiments with a Hide-setup and an aspect ratio of about one, the data points are rather sparse for the newer experiments with larger gap width discussed here. One reason is that the experiments have only been in operation for a relatively short time. Another reason is that the experiments are much more complex to operate than their smaller counterparts.
For the BTU experiment already quantitative results directly related to meteorology and climatology are available. Those cover a range from spectra of baroclinic and internal gravity waves [29] that seem to be emitted from the balanced large-scale flow to extreme value distributions of temperature and variability [36]. The distributions have been directly compared to ones using reanalysis data with an overall surprisingly good correspondence. For the experiment described by [25] such quantitative comparisons are not available yet. However, even a qualitative comparison of some major findings from the BTU- and the ICMM-tank as done here can be fruitful.
If we take another look at Figure 10 we find that for the BTU experiment with Hide-design, the azimuthal wave numbers are usually higher for similar nondimensional parameters when compared to the Oxford and ICMM experiment. The range of wave numbers follows the empirical rule found by [49] for the BTU tank but not for the other two systems shown in Figure 10. One possible explanation for this is a localization of the baroclinic wave zone in the center of the domain in the Oxford and ICMM setups. The characteristic width is not fix and just determined by the side walls but is more flexible and depends on the flow regime and its pulsations. Note that the gap width of the three experiments is rather similar, b a = 350 , 345 , 463 mm for the BTU, ICMM, and Oxford experiment, respectively, but the aspect ratio of the BTU tank is about twofold and for the Oxford tank about sevenfold the ICMM tank. As discussed by [43], the aspect ratio has an impact on the convection and the heat transport. Curvature effects might be smallest for the BTU experiment. The waves in the regular wave regime seem to be more stable for the annulus but this might also be due to the different Prandtl numbers for the BTU and ICMM experiments. It is important to note that for the irregular regime, the behavior for the different systems might become more similar and this regime is certainly most relevant for comparisons with the Earth atmosphere. It is not tested yet whether one of the two setups is better when compared, e.g., with reanalysis data. We know that regarding this the BTU annulus is doing a good job, not only qualitatively [36]. Only such quantitative comparisons can finally proof whether one of the setups it better suited for atmospheric applications in particular for reproducing fundamental statistical behavior. Finally we mention that it is not clear yet whether the contrasted experiments with different geometry and different heating characteristics should be described by the same nondimensional parameters. In fact, with respect to the two parameters R o T and T a geometrical effects seem to be not well represented.
An important point for the two presented experimental setups is how well they can mimic the meridional circulation of the atmosphere. For the Earth’s atmosphere three circulation cells can be observed, the Hadley-, Ferrel-, and the Polar-cell. Hence, the mid-latitude region with strong westerlies and baroclinic waves is embedded between two circulation cells and not between heated walls. In fact, this is one of the motivations to modify the Hide-setup and to make the experiment more atmosphere-like. In this context it is important to note that for a small tank with classical Hide-setup but a free surface, ref. [46] reported the occurrence of a three-cell meridional stream function in numerical simulations similar to Figure 4 and Figure 9 (see also [50]). Williams [46] argues that the sidewall boundary layer does not play a role for the interior baroclinic wave field but might play a role for the interior mean flow field. The latter effect might be stronger for experiments with a rigid lid. At this point it remains unclear what effect the lateral boundary conditions play for the dynamics of the baroclinic waves. Careful comparisons of experiments with both setups in the stable regime with only an azimuthal flow and cases from the wave regime could finally solve this relevant issue. Finally, we would also like to mention that less doubt exists for the importance of the Ekman layers for the organization of the mean and the wave field. The experiments summarized in Figure 10 have all been performed with a free upper surface and the diagram would look different when rigid lids would have been used.

5. Conclusions

Let us come back to the research questions formulated in the introduction. One of the main differences between the two experimental set-ups is the tendency of the baroclinic waves to show more intrinsic instability for the Fultz set-up. This cannot be explained by a choice of different nondimensional parameters since they were rather similar in the experiments performed (see Figure 10). In regimes where the Hide set-up shows regular waves, prominent fluctuations can already be found for the Fultz set-up. Due to the wide gap in the Fultz set-up, the wave’s amplitude is larger which might be part of the explanation for the higher variability. However, numerical simulations and an accompanying theoretical analysis are necessary to explain the observations. With respect to the second question asked we might state in conclusion that both setups can cover interesting atmospheric features and the future will show whether, with respect to atmospheric applications, one of the setups will be advantageous. It is likely that one system will be better for certain aspects and the other for other ones. Obviously, the new Fultz-setup with heating and cooling at different levels is certainly advantageous to study processes in the transition zone between pure rotating convection and the zone of westerly winds.
We should not end this article without mentioning that the differentially heated rotating annulus/dishpan experiment is a tool to study, in analogy to the atmosphere, fundamental dynamic processes like the formation of the jet-stream and its interactions with long waves that has implications for the Earth’s climate as well. Without an atmosphere-like radiative balance and latent heat conversions it however lacks important elements relevant for other atmospheric processes and this lack, of course, limits the scope of the experiments for atmospheric research.

Author Contributions

U.H. and A.S. did the conceptualization of the study, and have written the original draft. S.A. and A.V. have done numerical simulations and E.P., C.R., I.D.B. and M.V. did the data curation and reviewed and edited the manuscript. All authors have read and agreed to the published version of the manuscript.

Funding

C.R. and U.H. thank the Deutsche Forschungsgemeinschaft DFG for financial support (HA 2932/8-2). I.D.B. and U.H. further acknowledge DFG for supporting this work via the projects BO 3113/4-1 and DFG HA 2932/17-4. S.A. and U.H. thank also the Deutscher Akademischer Austauschdienst (DAAD), Germany, and Ministère des Affaires Étrangères, France, for the financial support in the frame of the PROCOPE project PHC 46672RE. S.A. and U.H. also gratefully acknowledge the computing time granted by the Resource Allocation Board and provided on the supercomputer Lise and Emmy at NHR@ZIB and NHR@Göttingen as part of the NHR infrastructure. The calculations for this research were conducted with computing resources under the project code bbi0019. A.S., E.P. and A.V. thank the Russian Science Foundation for financial support (grant RSF-22-21-00572). A.S. and A.V. also gratefully acknowledge the computing time for simulation in Triton supercomputer of the ICMM UB RAS. M.V. was supported by the National Research, Development and Innovation Office (NKFIH) under grant FK135115.

Institutional Review Board Statement

Not applicable.

Informed Consent Statement

Not applicable.

Data Availability Statement

The experimental and numerical data are stored on local repositories. We will be happy to provide the data on request.

Acknowledgments

U.H., I.D.B., C.R. and M.V. thank the technicians of the Department of Aerodynamics and Fluid Mechanics at BTU, Robin Stöbel and Stefan Rohark, for help with the experimental setup and the technical equipment.

Conflicts of Interest

The authors declare no conflict of interest. The funders had no role in the design of the study; in the collection, analyses, or interpretation of data; in the writing of the manuscript; or in the decision to publish the results.

References

  1. Vallis, G.K. Atmospheric and Oceanic Fluid Dynamics: Fundamentals and Large-Scale Circulation, 2nd ed.; Cambridge University Press: Cambridge, UK, 2017. [Google Scholar] [CrossRef]
  2. Rossby, C.G. On the solution of problems of atmospheric motion by means of model experiments. Mon. Weather Rev. 1926, 54, 237–241. [Google Scholar] [CrossRef]
  3. Hughes, G.O.; Griffiths, R.W. Horizontal convection. Annu. Rev. Fluid Mech. 2008, 40, 185–208. [Google Scholar] [CrossRef]
  4. Passaggia, P.Y.; Hurley, M.W.; White, B.; Scotti, A. Turbulent horizontal convection at high Schmidt numbers. Rev. Phys. Fluids 2017, 2, 090506. [Google Scholar] [CrossRef]
  5. Baker, D.J.; Robinson, A.R. A laboratory model for the general ocean circulation. Philos. Trans. R. Soc. 1969, 265, 533–566. [Google Scholar]
  6. McEwan, A.D. Angular momentum diffusion and the initiation of cyclones. Nature 1976, 260, 126–128. [Google Scholar] [CrossRef]
  7. Sukhanovskii, A.; Popova, E. The importance of horizontal rolls in the rapid intensification of tropical cyclones. Bound. Layer Meteorol. 2020, 175, 259–276. [Google Scholar] [CrossRef]
  8. Fultz, D.; Long, R.R.; Owens, G.V.; Weil, J. Two-dimensional flow around a circular barrier in a rotating shell. AMS Meteorol. Monogr. 1959, 4, 21. [Google Scholar]
  9. Hide, R.; Mason, P.J. Sloping convection in a rotating fluid. Adv. Phys. 1975, 24, 47–100. [Google Scholar] [CrossRef]
  10. Read, P.L. Chapter 4.3—Rotating annulus flows and baroclinic waves. In Rotating Fluids in Geophysical and Industrial Applications; Hopfinger, E.J., Ed.; Springer: Wien, Austria, 1992; pp. 185–216. [Google Scholar]
  11. Read, P.L.; Perez, E.P.; Moraz, I.M.; Young, R.M.B. Chapter 1—Circulation of planetary atmospheres: Insights from rotating annulus and related experiments. In Modeling Atmospheric and Oceanic Flows: Insight from Laboratory Experiments and Numerical Simulations; von Larcher, T., Williams, P.D., Eds.; Wiley: Hoboken, NJ, USA, 2014; pp. 9–45. [Google Scholar]
  12. Hide, R. A path of discovery in geo physical fluid dynamics. Astron. Geophys. 2010, 51, 4.16–4.23. [Google Scholar] [CrossRef]
  13. Ghil, M.; Read, P.L.; Smith, L. Geophysical flows as dynamical systems: The influence of Hide’s experiments. Astron. Geophys. 2010, 51, 4.28–4.35. [Google Scholar] [CrossRef]
  14. Exner, F.M. Über die Bildung von Windhosen und Zyklonen. Sitzungsberichte der Akademie der Wiss. Wien, Abt. Ha 1923, 132, 1–16. [Google Scholar]
  15. Fultz, D. Experimental analogies to atmospheric motions. In Compendium of Meteorology; Malone, T.F., Ed.; American Meteorological Society: Boulder, CO, USA, 1951. [Google Scholar]
  16. Osman, M.B.; Coats, S.; Das, S.B.; Chellman, N. North Atlantic jet stream projections in the context of the past 1250 years. PNAS 2021, 118, e2104105118. [Google Scholar] [CrossRef] [PubMed]
  17. Stendel, M.; Francis, J.; White, R.; Williams, P.D.; Woollings, T. Chapter 15—The jet stream and climate change. In Climate Change (Third Edition); Letcher, T.M., Ed.; Elsevier: Amsterdam, The Netherlands, 2021; pp. 327–357. [Google Scholar] [CrossRef]
  18. Alizadeh, O.; Lin, Z. Rapid Arctic warming and its link to the waviness and strength of the westerly jet stream over West Asia. Glob. Planet. Chang. 2021, 199, 103447. [Google Scholar] [CrossRef]
  19. Francis, J.A.; Vavrus, S.J. Evidence for a wavier jet stream in response to rapid Arctic warming. Environ. Res. Lett. 2015, 10, 014005. [Google Scholar] [CrossRef]
  20. Rodda, C.; Harlander, U.; Vincze, M. Jet stream variability in a polar warming scenario–a laboratory perspective. Weather Clim. Dynam. 2022, 3, 937–950. [Google Scholar] [CrossRef]
  21. Moon, W.; Kim, B.M.; Yang, G.H.; Wettlaufer, J.S. Wavier jet streams driven by zonally asymmetric surface thermal forcing. Proc. Natl. Acad. Sci. USA 2022, 119, e2200890119. [Google Scholar] [CrossRef] [PubMed]
  22. Borchert, S.; Achatz, U.; Fruman, M.D. Gravity wave emission in an atmosphere-like configuration of the differentially heated rotating annulus experiment. J. Fluid Mech. 2014, 758, 287–311. [Google Scholar] [CrossRef]
  23. Rodda, C.; Hien, S.; Achatz, U.; Harlander, U. A new atmospheric-like differentially heated rotating annulus configuration to study gravity wave emission from jets and fronts. Exp. Fluids 2019, 62, 2. [Google Scholar] [CrossRef]
  24. Scolan, H.; Read, P.L. A rotating annulus driven by localized convective forcing: A new atmosphere-like experiment. Exp. Fluids 2017, 58, 75. [Google Scholar] [CrossRef]
  25. Sukhanovskii, A.; Popova, E. A shallow layer laboratory model of large-scale atmospheric circulation. arXiv 2022, arXiv:2210.15266. [Google Scholar]
  26. Banerjee, A.K.; Bhattacharyaa, A.; Balasubramaniana, S. Experimental study of rotating convection in the presence of bi-directional thermal gradients with localized heating. AIP Adv. 2018, 8, 115324. [Google Scholar] [CrossRef]
  27. Vincze, M.; Borcia, I.D.; Harlander, U. Temperature fluctuations in a changing climate: An ensemble based experimental approach. Sci. Rep. 2017, 7, 254. [Google Scholar] [CrossRef] [PubMed]
  28. Vincze, M.; Bozóki, T.; Herein, M.; Borcia, I.D.; Harlander, U.; Horicsányi, A.; Nyerges, A.; Rodda, C.; Pál, A.; Pálfy, J. The Drake Passage opening from an experimental fluid dynamics point of view. Sci. Rep. 2021, 11, 19951. [Google Scholar] [CrossRef] [PubMed]
  29. Rodda, C.; Harlander, U. Transition from geostrophic flows to inertia-gravity waves in the spectrum of a differentially heated rotating annulus experiment. J. Atmos. Sci. 2020, 77, 2793–2806. [Google Scholar] [CrossRef]
  30. Read, P.L. Dynamics and circulation regimes of terrestrial planets. Planet. Space Sci. 2011, 59, 900–914. [Google Scholar] [CrossRef]
  31. Folis, W.W.; Hide, R. Thermal convection in a rotating annulus of liquid: Effect of viscosity on the transition between axisymmetric and non-axisymmetric flow regimes. J. Atmos. Sci. 1965, 22, 541–558. [Google Scholar]
  32. Rodda, C. Gravity Wave Emission from Jet Systems in the Differentially Heated Rotating Annulus Experiment; Cuvillier Verlag: Göttingen, Germany, 2019; p. 200. [Google Scholar]
  33. Fultz, D.; Long, R.R.; Owens, G.V.; Bohan, W.; Kaylor, R.; Weil, J. Studies of Thermal Convection in a Rotating Cylinder with Some Implications for Large-Scale Atmospheric Motions; American Met. Soc.: Boston, MA, USA, 1959; pp. 1–104. [Google Scholar] [CrossRef]
  34. Fein, J.S.; Pfeffer, R.L. An experimental study of the effects of Prandtl number on thermal convection in a rotating, differentially heated cylindrical annulus of fluid. J. Fluid Mech. 1976, 75, 81–112. [Google Scholar] [CrossRef]
  35. Manikantan, H.; Squires, T.M. Surfactant dynamics: Hidden variables controlling fluid flows. J. Fluid Mech. 2020, 892, 1. [Google Scholar] [CrossRef]
  36. Harlander, U.; Borcia, I.D.; Vincze, M.; Rodda, C. Probability Distribution of Extreme Events in a Baroclinic Wave Laboratory Experiment. Fluids 2022, 7, 274. [Google Scholar] [CrossRef]
  37. Nastrom, G.D.; Gage, K.S. A Climatology of Atmospheric Wavenumber Spectra of Wind and Temperature Observed by Commercial Aircraft. J. Atmos. Sci. 1985, 42, 950–960. [Google Scholar] [CrossRef]
  38. Lindborg, E. A Helmholtz decomposition of structure functions and spectra calculated from aircraft data. J. Fluid Mech. 2015, 762, R4. [Google Scholar] [CrossRef]
  39. Terasaki, K.; Tanaka, H.L.; Žagar, N. Energy spectra of Rossby and gravity waves. SOLA 2011, 7, 45–48. [Google Scholar] [CrossRef]
  40. Callies, J.; Ferrari, R.; Bühler, O. Transition from geostrophic turbulence to inertia–gravity waves in the atmospheric energy spectrum. Proc. Natl. Acad. Sci. USA 2014, 111, 17033–17038. [Google Scholar] [CrossRef]
  41. de Bruyn Kops, S.M.; Riley, J.J.; Winters, K.B. Chapter 2—Reynolds and Froude number scaling in stably-stratified flow. In IUTAM Symposium on Reynolds Number Scaling in Turbulent Flow; Smits, A.J., Ed.; Springer Science + Business Media: Dordrecht, The Netherlands, 2004; pp. 71–76. [Google Scholar]
  42. Vincze, M.; Borchert, S.; Achatz, U.; von Larcher, T.; Baumann, M.; Liersch, C.; Remmler, S.; Beck, T.; Alexandrov, K.D.; Egbers, C.; et al. Benchmarking in a rotating annulus: A comparative experimental and numerical study of baroclinic wave dynamics. Meteorol. Z. 2015, 23, 611–635. [Google Scholar] [CrossRef]
  43. Wright, S.; Su, S.; Scolan, H.; Young, R.M.B.; Read, P.L. Regimes of Axisymmetric Flow and Scaling Laws in a Rotating Annulus with Local Convective Forcing. Fluids 2017, 2, 41. [Google Scholar] [CrossRef]
  44. Abide, S.; Viazzo, S.; Raspo, I.; Randriamampianina, A. Higher-order compact scheme for high-performance computing of stratified rotating flows. Comput. Fluids 2018, 174, 300–310. [Google Scholar] [CrossRef]
  45. Meletti, G.; Abide, S.; Viazzo, S.; Harlander, U. A parameter study of strato-rotational low-frequency modulations: Impacts on momentum transfer and energy distribution. In Taylor-Couette and Related Flows on the Centennial of Taylor’s Seminal Philosophical Transactions Paper (Part 2); Lueptow, R., Hollerbach, R., Serre, E., Eds.; Philosophical Transactions A: London, UK, 2023; pp. 1–22. [Google Scholar]
  46. Williams, G.P. Baroclinic annulus waves. J. Fluid Mech. 1971, 49, 417–449. [Google Scholar] [CrossRef]
  47. Vasiliev, A.; Popova, E.; Sukhanovskii, A. The flow structure in a laboratory model of general atmosphere circulation. Comput. Contin. Mech. 2023, accepted. [Google Scholar]
  48. Batalov, V.; Sukhanovsky, A.; Frick, P. Laboratory study of differential rotation in a convective rotating layer. Geophys. Astrophys. Fluid Dyn. 2010, 104, 349–368. [Google Scholar] [CrossRef]
  49. Hide, R.; Mason, P.J. Baroclinic waves in a rotating fluid subject to internal heating. Philos. Trans. R. Soc. Lond. Ser. Math. Phys. Sci. 1970, 268, 201–232. [Google Scholar] [CrossRef]
  50. Tajima, T.; Nakamura, T. Meridional Flow Field of Axisymmetric Flows in a Rotating Annulus. J. Atmos. Sci. 2000, 57, 3109–3121. [Google Scholar] [CrossRef]
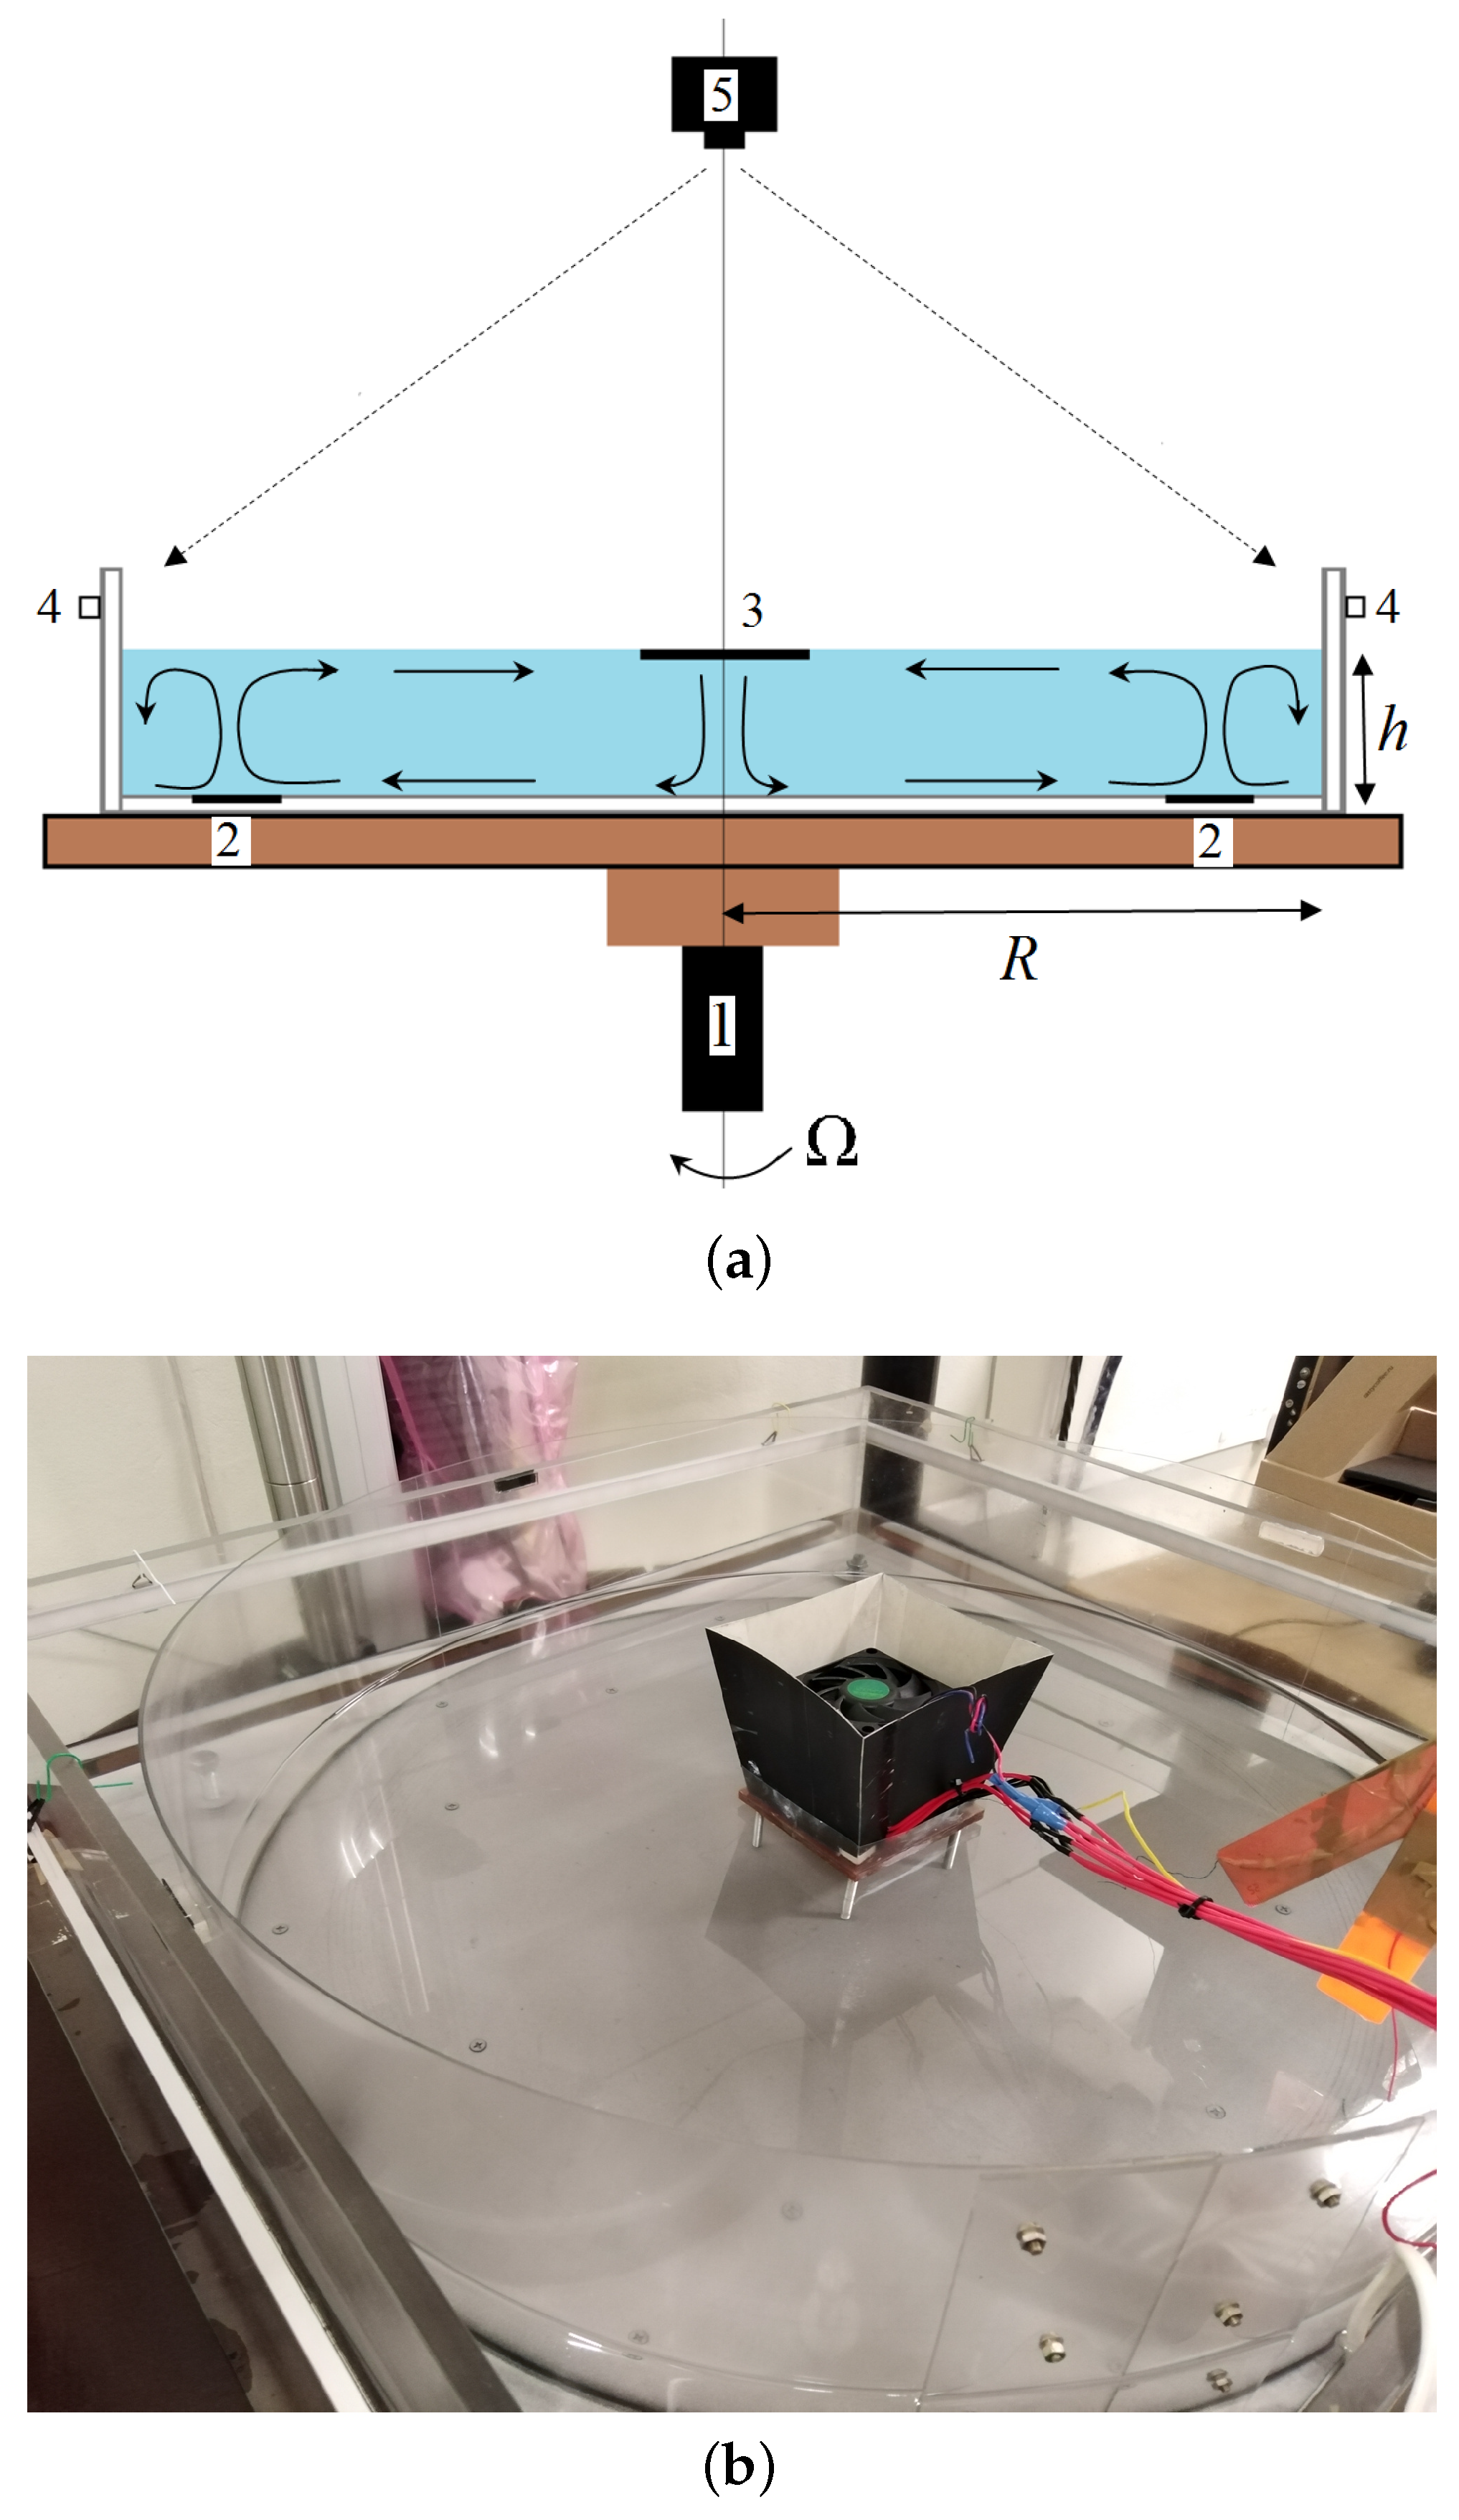
Figure 2. (a) Scheme of the laboratory model, 1—rotating table, 2—rim heater, 3—cooler, 4—LED illumination, 5—CCD camera; (b) Photo of the experimental set-up. (Colour online).
Atmosphere 14 00836 g002
Figure 3. Time-series of N / f , R o , the imaginary part of N, R i , and T 3 . For the meaning of the red lines see text.
Atmosphere 14 00836 g003
Figure 4. Surface temperature measured (a) and simulated for Δ T = 2.5 K and Ω = 0.7 rpm (b). Meridional streamfunction derived from the time and azimuthally averaged velocity field from numerical simulations for (c) Δ T = 4 K and Ω = 2 rpm, (d) Δ T = 2.5 K and Ω = 0.7 rpm.
Atmosphere 14 00836 g004
Figure 5. Transition from the Hadley regime to the baroclinic waves. (a) Exp. 1, (b) Exp. 4, (c) Exp. 6 (Table 3). Instantaneous images are shown.
Atmosphere 14 00836 g005
Figure 6. Variation of wave number during Exp. 7, (a)—m = 3, (b)—m = 4, (c)—m = 7. Instantaneous images are shown.
Atmosphere 14 00836 g006
Figure 7. Regularization of baroclinic waves with decreasing R o T , (a)—Exp. 8a, (b)—Exp. 8b, (c)—Exp. 8c. Instantaneous images are shown.
Atmosphere 14 00836 g007
Figure 8. Energy (in arbitrary units) of different modes of baroclinic waves. left—mean energy for the most energetic modes, right—time series of energy of modes 3–5 for experiment ICMM 7 (fragment).
Atmosphere 14 00836 g008
Figure 9. Mean meridional circulation for different regimes (averaged over azimuthal coordinate and time). Upper panel – axisymmetric regime (Hadley), R o T = 8.7 , T a = 1.7 · 10 8 , lower panel— atmospheric-like regime R o T = 0.4 , T a = 3.6 · 10 9 . Color bar shows magnitude of velocity (in mm/s).
Atmosphere 14 00836 g009
Figure 10. Map of regimes. Results of BTU experiments [23] (circles), Oxford experiments [24] (triangles), and ICMM experiments [25] (squares). AV (amplitude vacillation), SV (shape vacillation). Dotted line defines transitional regimes [24,25]. Results for the ICMM configuration, marked by “*” correspond to the unsteady wave regime.
Atmosphere 14 00836 g010
Table 1. Parameters of the laboratory experiment. Note that in both experimental set-ups the bottom is flat and no bottom topography is used.
Geometry BTUICMM
inner radiusa (mm)350-
outer radiusb (mm)700345
gap width ( b a ) (mm)350345
fluid depthd (mm)6030
fluid properties
density ρ 0 ( kg m 3 )997911
kin. viscosity ν ( m 2 s 1 )1.004 × 10 6 5.2 × 10 6
therm. diffusivity κ ( m 2 s 1 )0.1434 × 10 6 0.083 × 10 6
exp. coefficient α (1/K)0.207 × 10 3 0.9 × 10 3
P r ν κ 1 7.062.7
Table 2. The main heater properties of the BTU and ICMM experimental model. In the BTU experiment, the inner cylinder is filled with cold water and the outer annulus with warm water. Then, due to heat conduction of the perspex walls, the inner perspex wall of the center annulus is cooled and the outer wall heated.
Heater Properties     
BTU     
thickness perspex walls   l p    10  mm
radius cooling chamber   r c    340  mm
width heating chamber   r h    85  mm
ICMM     
heater width  l   25  mm
heater radius   r h    293  mm
cooler radius   r c    28  mm
heating power   P h    123  Wt
cooling power   P c    ≈3  Wt
Table 3. Main forcing and nondimensional parameters. Note that E is the Ekman number E = γ T a 1 / 2 , where γ is the geometric factor γ = 2 ( h / R ) 5 / 2 .
Exp.  Ω , rad s 1   Δ T    Ro T   Ta   E
BTU
  1    0.21  4    0.0091  15.2 × 10 9   0.0013
  2    0.073  2.5    0.046  1.87 × 10 9   0.0038
ICMM
  1    0.08  25.1    8.4  1.7 × 10 8   0.068
  2    0.09  25.7    6.5  2.3 × 10 8   0.061
  3    0.11  26.9    4.9  3.2 × 10 8   0.05
  4    0.13  24.5    3.1  4.7 × 10 8   0.042
  5    0.17  25.1    1.9  7.5 × 10 8   0.033
  6    0.23  23.9    1.0  1.4 × 10 9   0.024
  7    0.37  23.9    0.4  3.6 × 10 9   0.015
  8a    0.48  24.5    0.2  6 × 10 9   0.012
  8b    0.48  10.2    0.1  6 × 10 9   0.012
  8c    0.48  7.2    0.06  6 × 10 9   0.012
Table 4. Positions of the sensors with numbers 1 to 8. The vertical (z) and horizontal (x) sensor positions are given in cm. The inner cooled wall is located at x = 0 cm, the outer heated wall at x = 35 cm. The fluid surface is at z = 0 cm and the bottom is at z = 6 cm.
cm x = 2.5 x = 9.0 x = 15.5 x = 22.5 x = 28.0
z = 0 54321
z = 1 --6--
z = 2 --7--
z = 3 --8--
Disclaimer/Publisher’s Note: The statements, opinions and data contained in all publications are solely those of the individual author(s) and contributor(s) and not of MDPI and/or the editor(s). MDPI and/or the editor(s) disclaim responsibility for any injury to people or property resulting from any ideas, methods, instructions or products referred to in the content.