Article

Combined Effects of Land Use/Cover Change and Climate Change on Runoff in the Jinghe River Basin, China

1
College of Water Resources and Architectural Engineering, Northwest A&F University, Xianyang 712100, China
2
Northwest Engineering Corporation Limited, Power China, Xi’an 710065, China
3
State Key Laboratory of Eco-Hydraulics in Northwest Arid Region of China, Xi’an University of Technology, Xi’an 710048, China
4
Yellow River Institute of Hydraulic Research, Zhengzhou 450003, China
*
Author to whom correspondence should be addressed.
Atmosphere 2023, 14(8), 1237; https://doi.org/10.3390/atmos14081237
Submission received: 25 June 2023 / Revised: 27 July 2023 / Accepted: 30 July 2023 / Published: 31 July 2023
(This article belongs to the Special Issue Impacts of Climate Change on Basin Hydrology)

Abstract

:
In the context of global warming and intensified human activities, the quantitative assessment of the combined effects of land use/cover change (LUCC) and climate change on the hydrological cycle is crucial. This study was based on the simulation results of future climate and LUCC in the Jinghe River Basin (JRB) using the GFDL–ESM2M and CA–Markov combined with the SWAT models to simulate the runoff changes under different scenarios. The results revealed that the future annual precipitation and average temperature in the JRB are on the increase, and the future LUCC changes are mainly reflected in the increase in forest and urban lands and decrease in farmlands. Changes in runoff in the JRB are dominated by precipitation, and the frequency of extreme events increases with the increase in the concentration of CO2 emissions. Under four climate scenarios, the contribution of future climate change to runoff changes in the JRB is −8.06%, −27.30%, −8.12%, and +1.10%, respectively, whereas the influence of future LUCC changes is smaller, ranging from 1.14–1.64%. In response to the future risk of increasing water-resources stress in the JRB, the results of this study can provide a scientific basis for ecological protection and water-resources management and development.

1. Introduction

The mechanisms of runoff generation and confluence in river basins have changed, thereby leading to changes in river-runoff dynamics [1,2]. The fifth assessment report of the Intergovernmental Panel on Climate Change indicated that the global mean temperature will increase by about 1.1 °C and may reach or exceed 1.5 °C in the next 20 years [3]. This temperature increase is expected to enhance the water-vapor-holding capacity of the atmospheric boundary layer, resulting in increased intensity and frequency of extreme precipitation events, especially in the middle–low latitudes [4,5]. Simultaneously, changes in meteorological factors, such as temperature and precipitation, will also alter the hydrological cycle in river basins globally [6]. In recent years, urbanization, land desertification, and deforestation have intensified under the influence of human activities, resulting in global land use/cover change (LUCC), which in turn alters the underlying surface conditions [7,8,9]. Changes in the underlying surface conditions can affect the hydrological cycle in river basins by altering soil evaporation, canopy interception, runoff frequency and intensity, and eventually, river dynamics [10]. Future climate and LUCC—especially in the next few decades—will have a substantial impact on hydrological changes in most river basins globally, with the combined effects of the two on runoff being notably different in distinct river basins [11,12]. Therefore, simulating and predicting the hydrological processes in river basins under different future climate and LUCC scenarios have great theoretical and practical importance for elucidating the drivers of future runoff changes as well as realizing scientific management and rational planning of water resources.
Currently, the projections for future LUCC typically have generalized hypotheses about future conversions and are modeled based on socioeconomic and geographical driving factors [13,14]. Commonly used models to simulate LUCC include CA–Markov, CLUE–S, Markov–FLUS and other coupled models [15,16]. Among them, the CA–Markov model is widely used in regional LUCC simulation and prediction [17]. Chen et al. [18] predicted the future LUCC in the Luanhe River Basin based on the CA–Markov model, and used the SWAT model to assess the combined impacts of future climate and LUCC on hydrological drought in conjunction with the results of RCP2.6, RCP4.5, and RCP8.5 future climate scenarios. Daba and You [19] projected the 2038 LUCC along the upper stream of the Awash River based on the CA–Markov model and made recommendations for sustainable water-resource planning and management in the basin. Li et al. [20] quantitatively predicted the LUCC at different periods using the CA–Markov model and investigated the impact of LUCC on runoff and evapotranspiration in the upper reach of the Han River in China. Overall, LUCC primarily affects hydrology and water resources by influencing the hydrological cycle process in river basins, and the variability between different LUCC scenarios will affect the prediction of the hydrological response [21,22]. Therefore, considering the future, LUCC is essential to improve the simulation accuracy of future hydrological processes.
Hydrological processes typically involve complex nonlinear, abrupt, and random processes [23,24]. The quantitative identification of the runoff response to future climate and LUCC has become a pressing issue in relation to watershed hydrological cycles [25]. Increasing evidence has proposed a watershed test, statistical analysis, and model simulation methods [26,27,28]. Among these, hydrological model simulation has been widely used because it comprehensively considers the spatial heterogeneity of river basins and physical processes [11,29]. The calibrated hydrological model can have different climate and LUCC scenarios input to assess the hydrological response patterns in a changing environment [30,31]. However, previous studies have focused more on the impacts of future climate change on hydrological processes and less on the impacts of future LUCC, which will increase the uncertainty of runoff simulation results [32,33].
In this study, a semi-distributed model was used to simulate the hydrological processes in a river basin in China by inputting meteorological and LUCC data describing different future scenarios. Future runoff changes were predicted, and driving factors were quantitatively identified. The Jinghe River Basin (JRB) was selected specifically because of the large number of ecological restoration projects, such as the Grain for Green Project and Protection of Forest System in the Middle Yellow River [34,35], and the pronounced impact of the LUCC on the hydrological cycle. We analyzed the characteristics of future climate and LUCC under different future climate scenarios and periods in the study area. Based on this analysis, we predicted the runoff change under the combined action of the two abovementioned factors and quantitatively identified their contributions to the runoff change. We make recommendations that can serve as a scientific basis for watershed management in the context of climate change and LUCC.

2. Materials and Methods
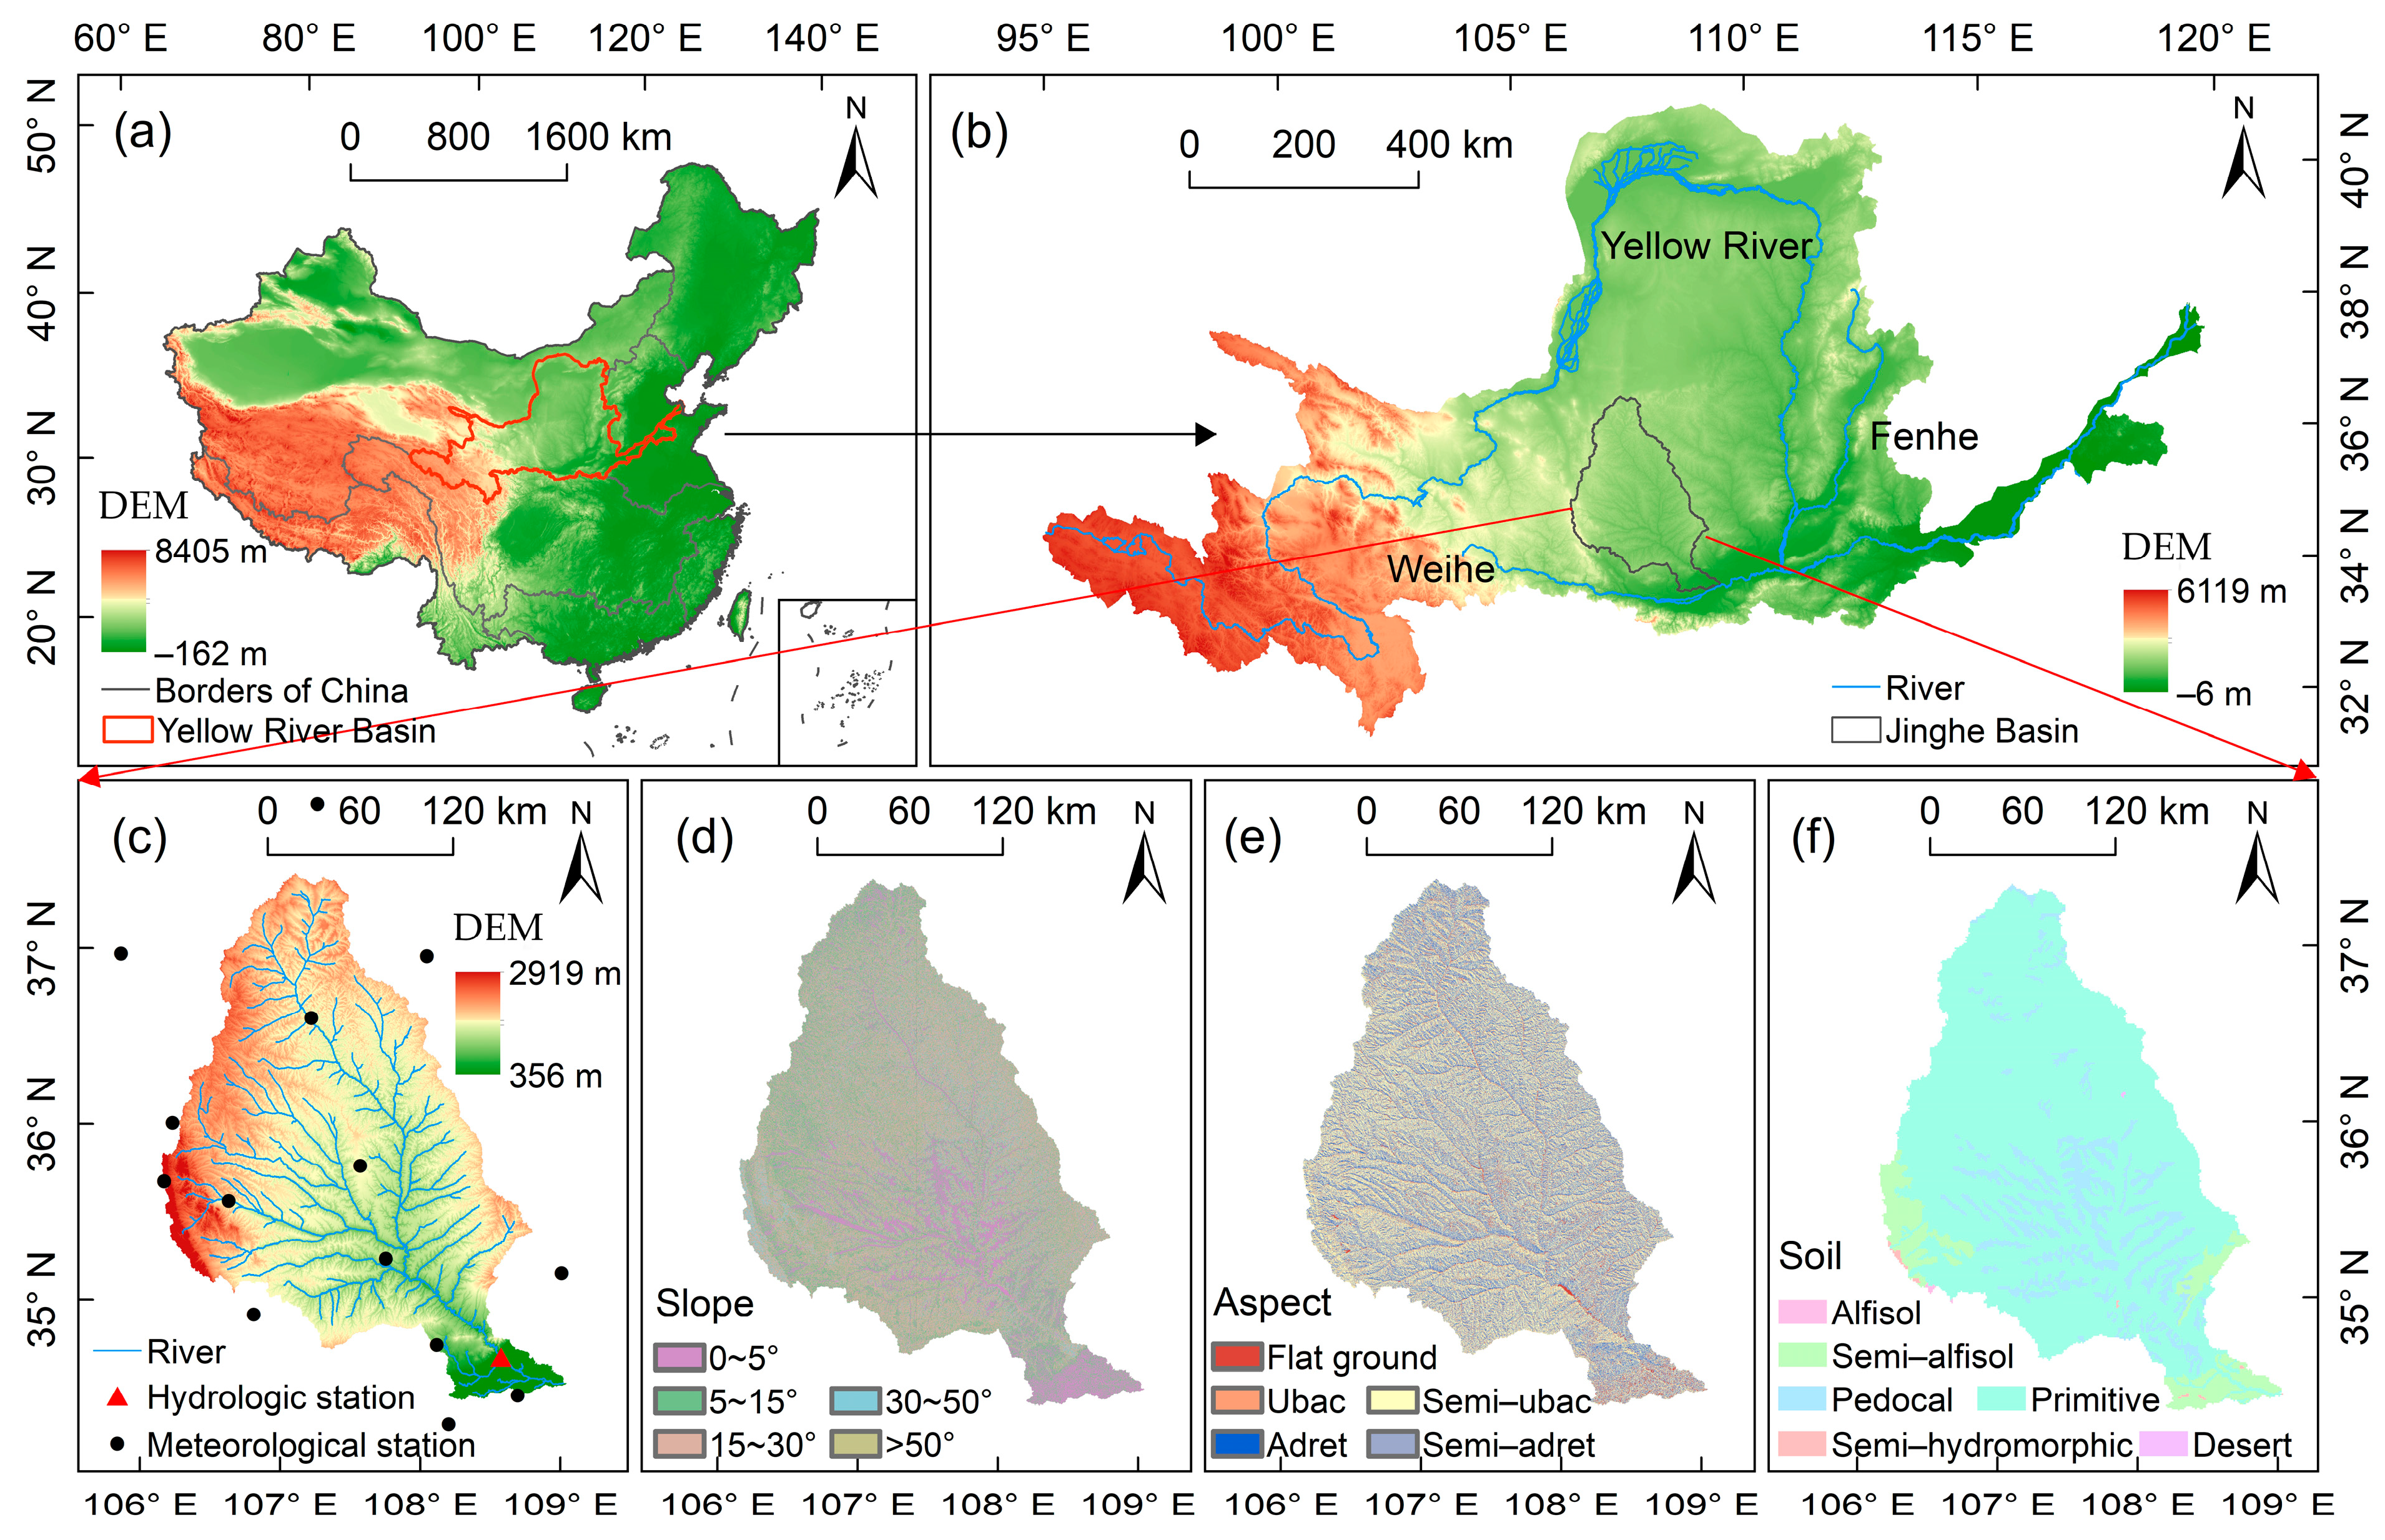
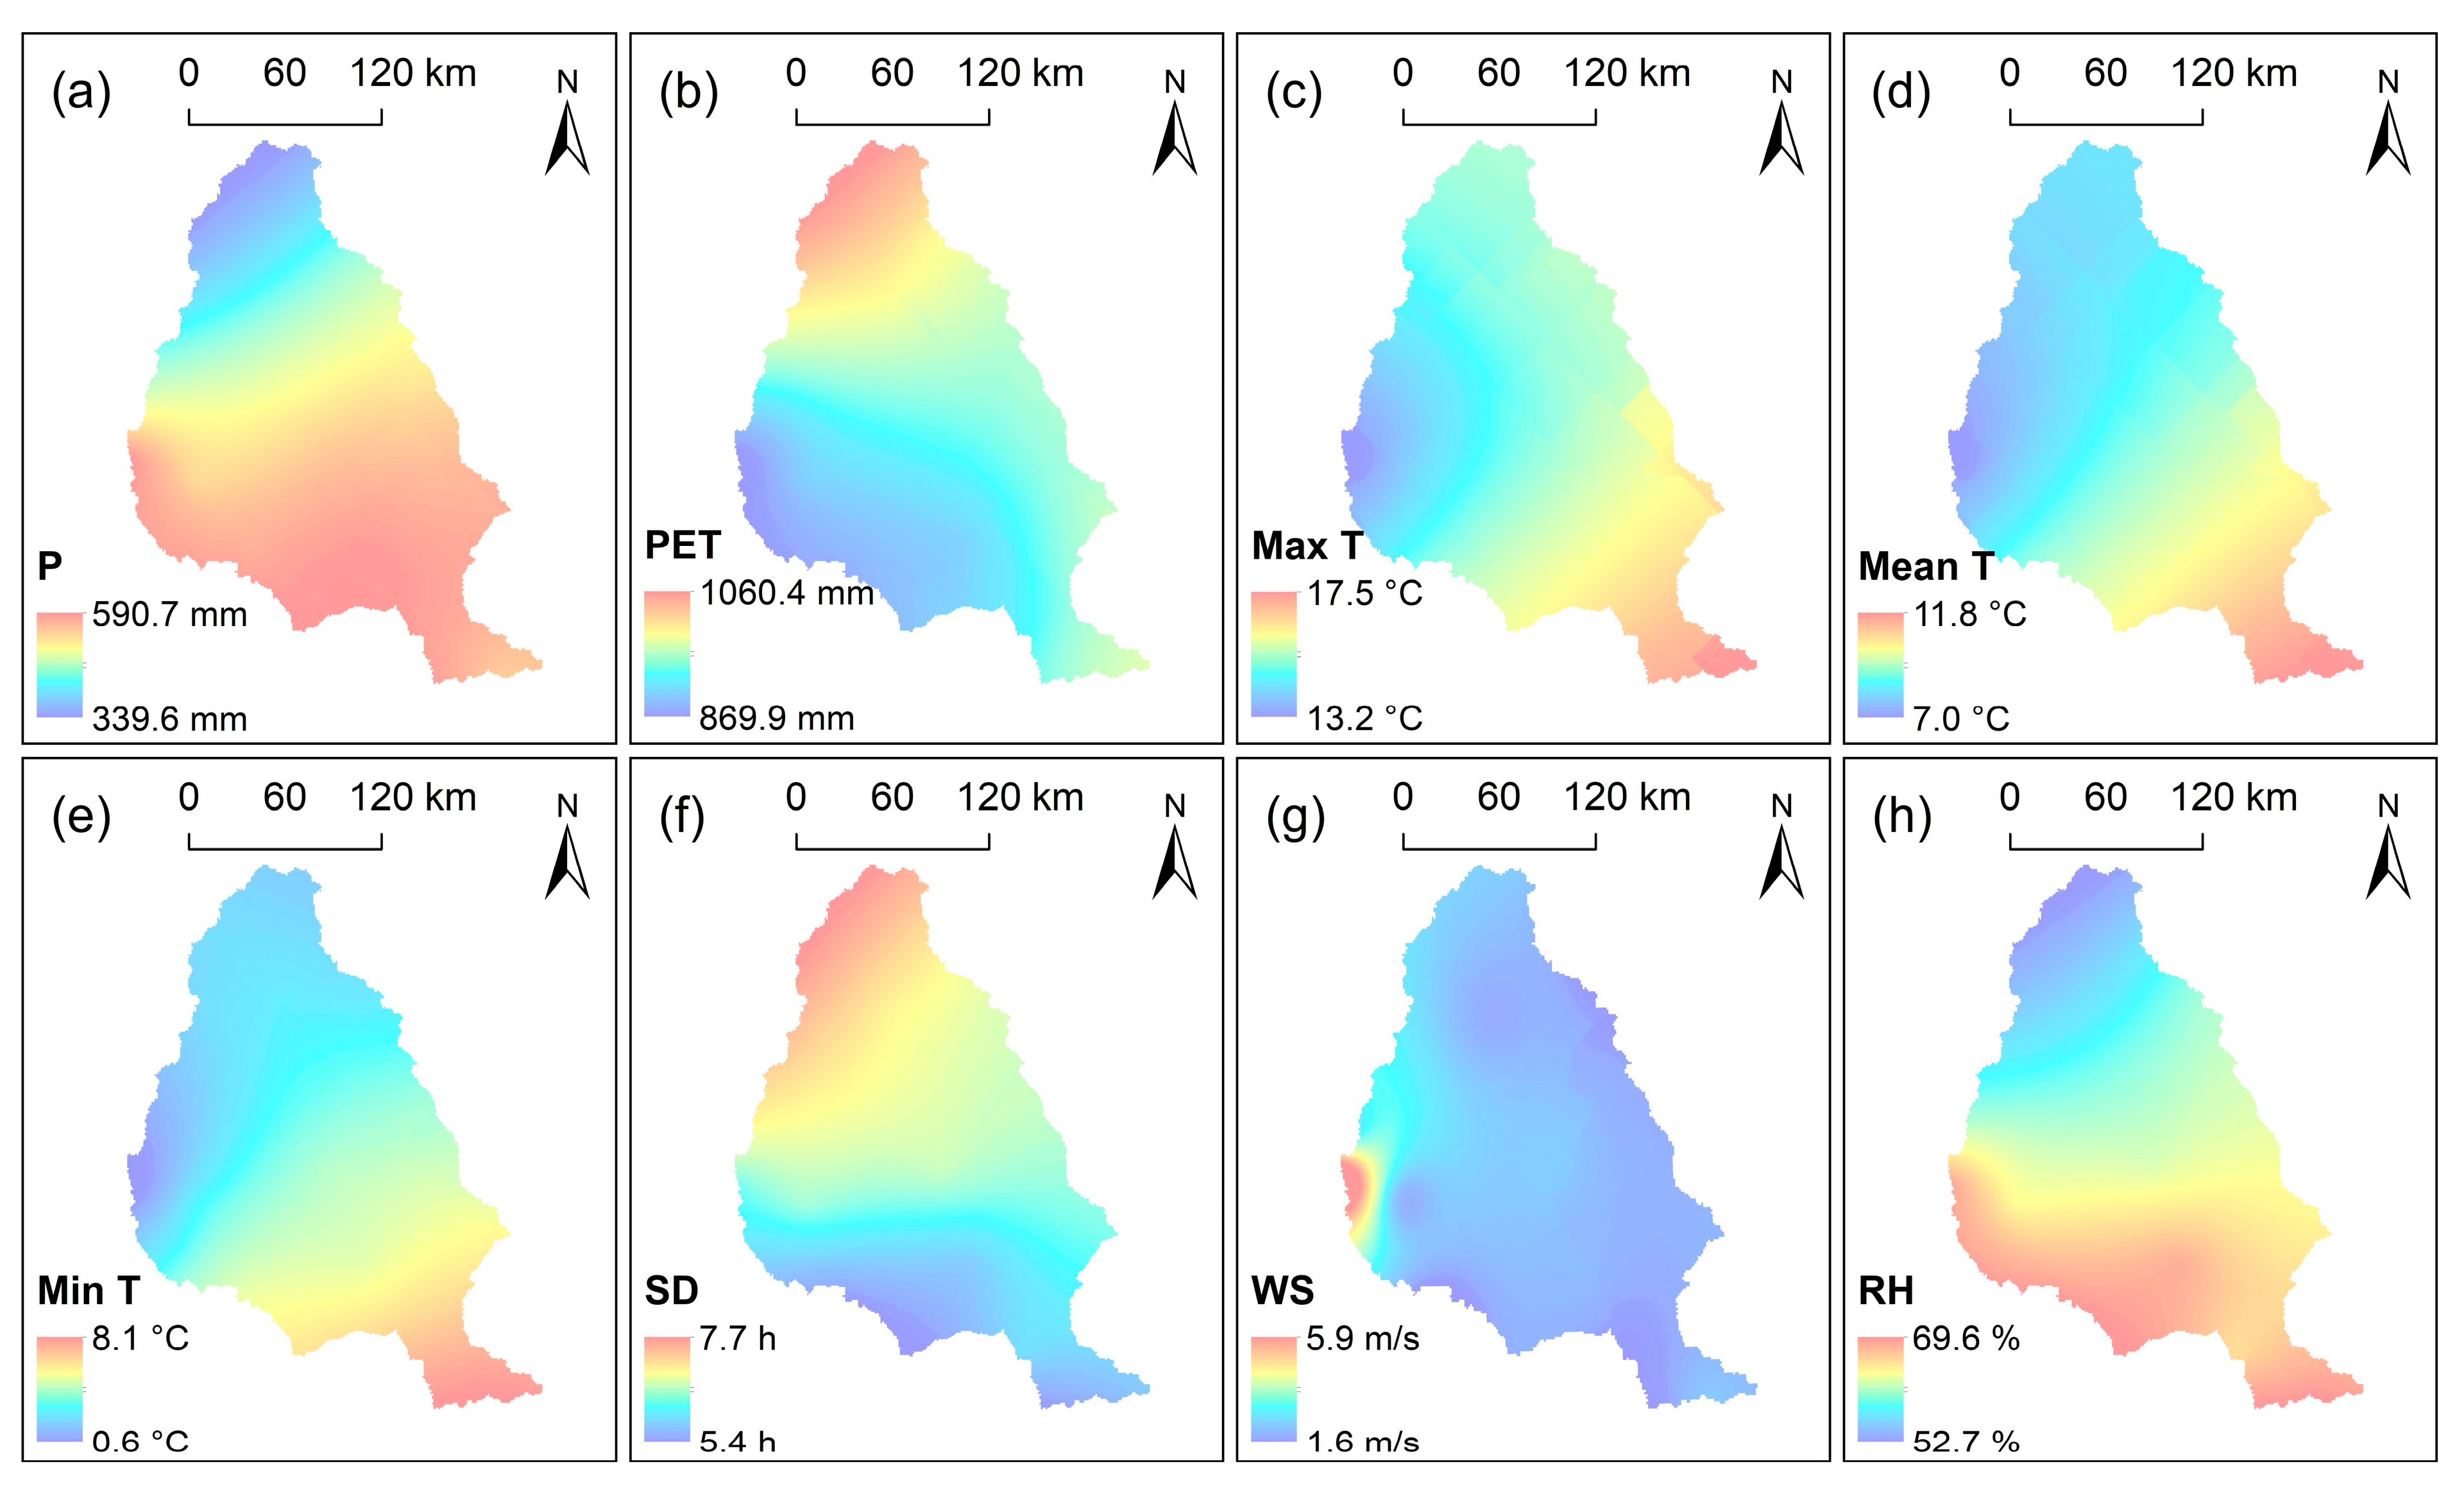
2.1. Study Area

The Jing River emanates from the foothills of Liupan Mountain and flows through Shaanxi, Gansu, and Ningxia Provinces into the Wei River in Chenjiatan, Xi’an City, Shaanxi Province. With a total length of 455.1 km, the Jing River is the largest tributary of the Wei River and a secondary tributary of the Yellow River (Figure 1a,b). The JRB is located in a high-intensity soil and water erosion area of the Loess Plateau (34°46′–37°19′ N, 106°14′–108°42′ E; 356–2919 m elevation; 45,421 km2 drainage area; Figure 1c). In the JRB, areas with slopes of less than 30° account for 91.13% of the total drainage area, whereas areas with slopes between 15° and 30° account for 37.35% of the total drainage area (Figure 1d). The JRB is characterized by different area ratios of slope-aspect grades (flat ground (2.54%) < ubac (10.24%) < adret (11.09%) < semi–adret (37.46%) < semi–ubac (38.68%); Figure 1e) and dominated by primitive soil, accounting for approximately 79.95% of the total drainage area (Figure 1f). The JRB has a temperate continental climate, with a rainy and hot period as well as distinct seasons; the annual mean precipitation and temperature are 517.9 mm and 8 °C, respectively [36]. The JRB is dominated by farm- and grasslands, with the sum of the two areas accounting for more than 85% of the total area of the basin [37]. There are no large reservoirs in the JRB; therefore, the influence of reservoirs on natural runoff is limited.

2.2. Data Sources

Daily measurements from 14 national meteorological stations (China Meteorological Data Service Centre, http://data.cma.cn, accessed on 15 September 2022) spanning from 1951 to 2019 in and around the JRB (Figure 1c) were used. This study was based on the standard-sequence method proposed by DeGaetano et al. [25], with the sites with the best correlations being used to interpolate missing data. On this basis, the inverse-distance-weighting (IDW) method was used to obtain the spatial change characteristics of each meteorological indicator in the JRB. In addition, the Penman–Monteith formula, which is recommended by the World Food and Agriculture Organization, was used for calculating the potential evapotranspiration at each site [38]. Monthly runoff data, also spanning from 1951 to 2019, came from the Zhangjiashan Hydrological Station (that is, the control station of the JRB) and was primarily sourced from the Yellow River Conservancy Commission.
This study used the RCP2.6, RCP4.5, RCP6.0, and RCP8.5 climate scenarios of the geophysical fluid dynamics laboratory Earth-system model with modular ocean model (GFDL–ESM2M) version 4, proposed by the National Oceanic and Atmospheric Administration. Datasets, obtained from the National Tibetan Plateau Data Center (http://data.tpdc.ac.cn, accessed on 3 October 2022). Previous studies have revealed that the widely used GFDL–ESM2M climate model is better suited to a variety of climatic conditions in different regions. In addition, the adaptability of the precipitation and temperature datasets contained in the GFDL–ESM2M climate model in China was tested and verified to better reflect the future climate-change characteristics of China [39].
The 30 × 30 m resolution digital elevation model (DEM) of the JRB was derived from the Geospatial Data Cloud (http://www.gscloud.cn, accessed on 5 January 2023). The 1 × 1 km resolution LUCC and soil datasets for each period were obtained from the Resources and Environment Science and Data Center of the Chinese Academy of Sciences (http://www.resdc.cn, accessed on 20 November 2022). Here, we used Krasovsky_1940_Albers-projected coordinates.

2.3. Methods

2.3.1. Cellular Automata–Markov Model

The Cellular Automata–Markov (CA–Markov) model can use local simple transformations to simulate and predict the spatial structure of complex systems and can compensate for the shortcomings of Markov in spatial prediction [40]. The CA–Markov model, through the combination of the two techniques, can simulate the spatiotemporal variation characteristics of complex geographic systems [19]. In this study, the CA–Markov model was used to predict future LUCC. Initially, a suitability atlas of LUCC transfer under the influence of various factors was established and was subsequently combined with the area-transfer matrix output using the Markov model, with future changes predicted based on the LUCC data of the baseline year 2018 [41]. The CA model is formulated as follows:
S i + 1 = f S i , N ,
where Si is the cellular state at the i-th moment, N is the cellular neighborhood, and f is the cellular transition rule.
In this study, the process of LUCC type is regarded as a Markov process, and the calculation formula of transition probability matrix is as follows [42]:
P i , j = P 1 , 1 P 1 , 2 P 1 , j P 2 , 1 P 2 , 2 P 2 , j P i , 1 P i , 2 P i , j ,
where Pi,j is the probability that state i transfers to state j, and satisfies that Pi,j > 0 and i = 1 n P i , j = 1 .
The LUCC status at each moment can be calculated using the following Equation (3):
S i + 1 = P i , j S i ,
The Kappa coefficient (Ka) examines the consistency between the simulated image results and measured image data in their entirety and is widely used in accuracy evaluations of LUCC simulations and remote sensing image interpretations [43]:
K a = P 0 P c 1 P c ,
where P0 is the comparison probability between the predicted and measured images, and Pc is the expected value of the correct ratio of the predicted image. According to the results of Ka, the prediction accuracy can be divided into the following five levels: almost inconsistent [0.0, 0.2), low consistency [0.2, 0.4), moderately consistent [0.4, 0.6), highly consistent [0.6, 0.8), and almost completely consistent [0.8, 1.0].

2.3.2. SWAT Model

In this study, the SWAT model was used in simulating the runoff change process in the JRB from 1951 to 1996, with the years 1951–1960, 1961–1980, and 1981–1996 being used as the warm-up, calibration, and verification periods, respectively, and the SUFI-2 algorithm of SWAT-CUP was used for parameter optimization [44]. In addition, the correlation coefficient (R2), Nash–Sutcliffe efficiency coefficient (NS), and relative error (RE) were used to verify the accuracy of the simulation results and evaluate the applicability of the SWAT model in the JRB [45,46]:
R 2 = i = 1 m ( Q i Q ¯ ) ( S i S ¯ ) 2 i = 1 m ( Q i Q ¯ ) 2 i = 1 m ( S i S ¯ ) 2 ,
N S = 1 i = 1 m ( Q i S i ) 2 i = 1 m ( Q i Q ¯ ) 2 ,
R E = Q ¯ S ¯ Q ¯ × 100 ,
where Q and S are the observation and simulated values of annual-scale runoff, respectively, in m3/s; Q ¯ and S ¯ are the means of the observation and simulated values, respectively, in m3/s; m is the number of simulated fields.

2.3.3. Scenario Settings

To analyze the law governing the responses of future runoff changes to climate and LUCC in the JRB, hydrometeorological data from 1951 to 2019 and LUCC in 2018 were used as the baseline scenario (A0). The following two set-ups for future climate and LUCC combinations were established:
A1: Set-up considering future climate change alone, that is, the combination of meteorological data from 2020 to 2050 under four future scenarios and LUCC in 2018 (historical).
A2: Set-up considering the combined effect of future climate and LUCC, that is, future runoff changes under the combinations of 2020–2029 meteorological data and LUCC in 2025, 2030–2039 meteorological data and LUCC in 2035, and 2040–2050 meteorological data and LUCC in 2045.
Through a comparative analysis of the runoff simulation results under different scenarios, the influences of climate and LUCC on runoff change can be quantitatively analyzed (Figure 2).

3. Results

3.1. Meteorological Variation Characteristics

3.1.1. Historical Climate Change Characteristics

Based on meteorological data from 1951 to 2019 from the JRB, this study used the IDW interpolation method to obtain the spatial-variation characteristics of each meteorological element in the river basin (Figure 3). The multi-annual mean precipitation in the JRB lies between 339.6 and 590.7 mm, with its spatial variation being similar to that of the multi-annual mean relative humidity (52.7–69.6%), thereby gradually decreasing from south to north. The multi-annual mean potential evapotranspiration in the JRB lies between 869.9 and 1,060.6 mm, with its spatial variation being similar to the multi-annual mean sunshine duration (5.4–7.7 h), thereby gradually increasing from southwest to northeast. The multi-annual mean maximum temperature (13.2–17.5 °C), minimum temperature (0.6–8.1 °C), and mean temperature (7.0–11.8 °C) in the JRB exhibit similar spatial variation patterns, thereby gradually decreasing from southeast to northwest. The multi-annual mean wind speed in the JRB lies between 1.6 and 5.9 m/s, with its spatial variation generally characterized as low in the east and high in the west.

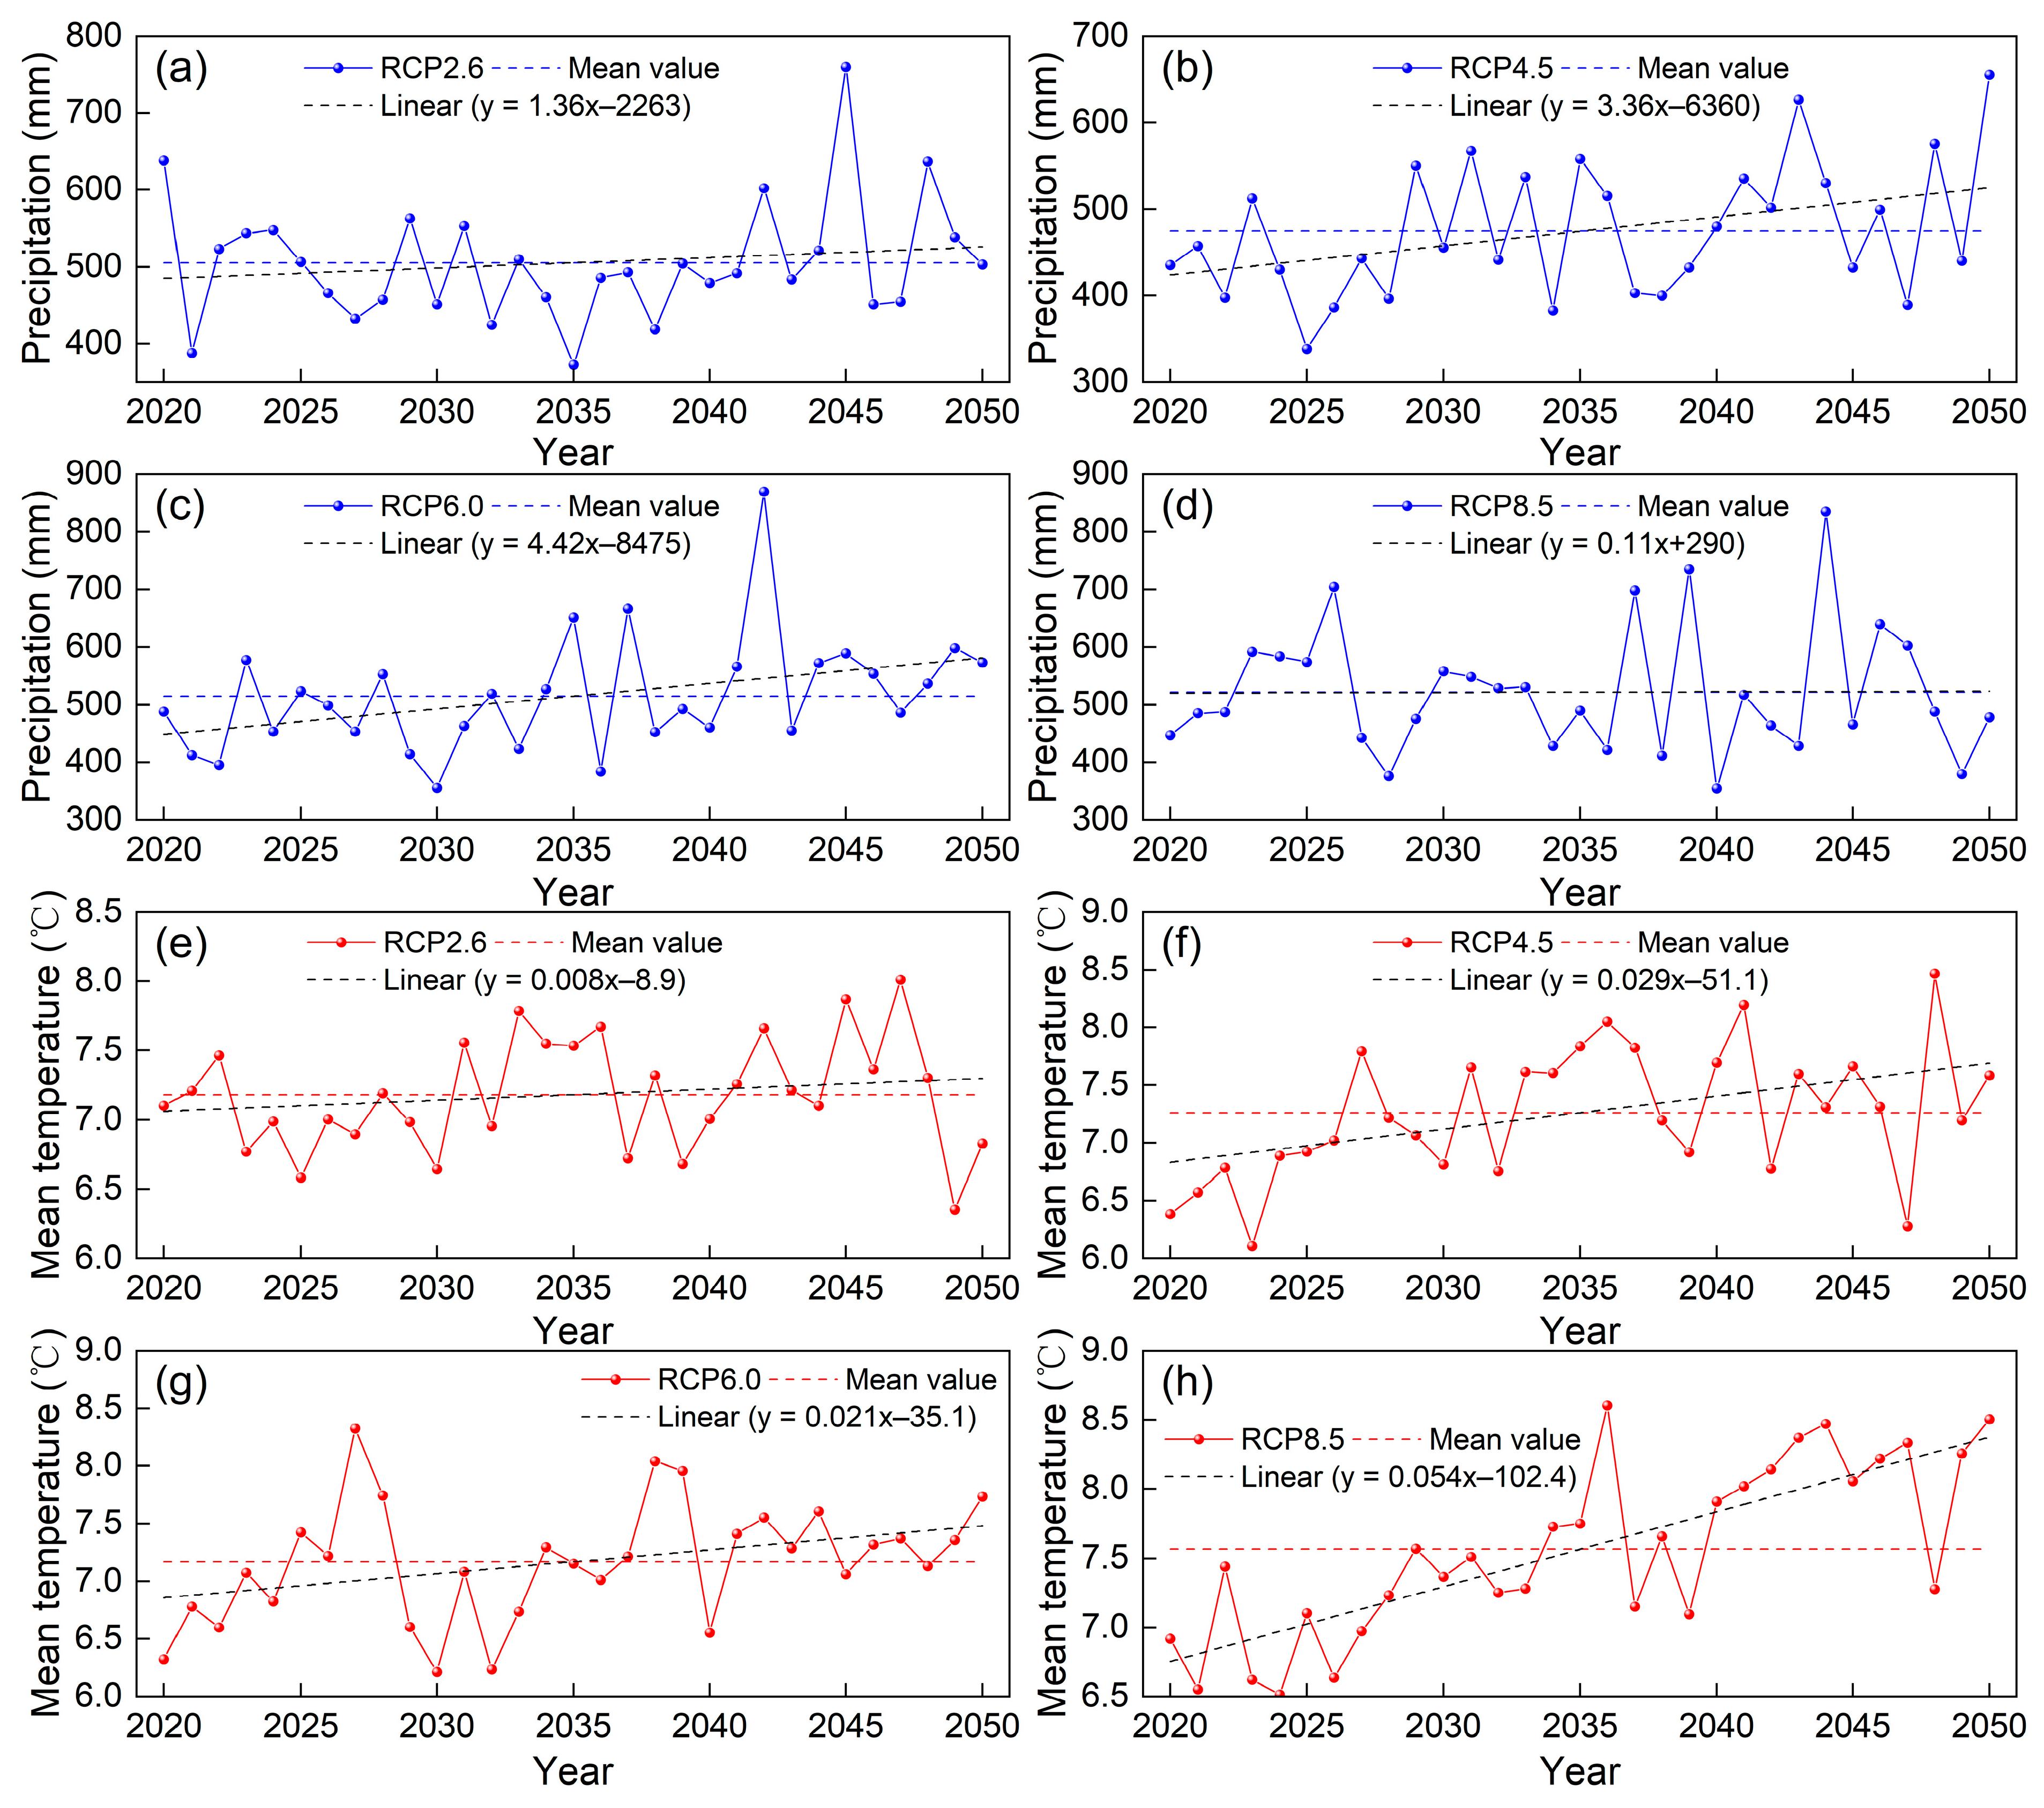
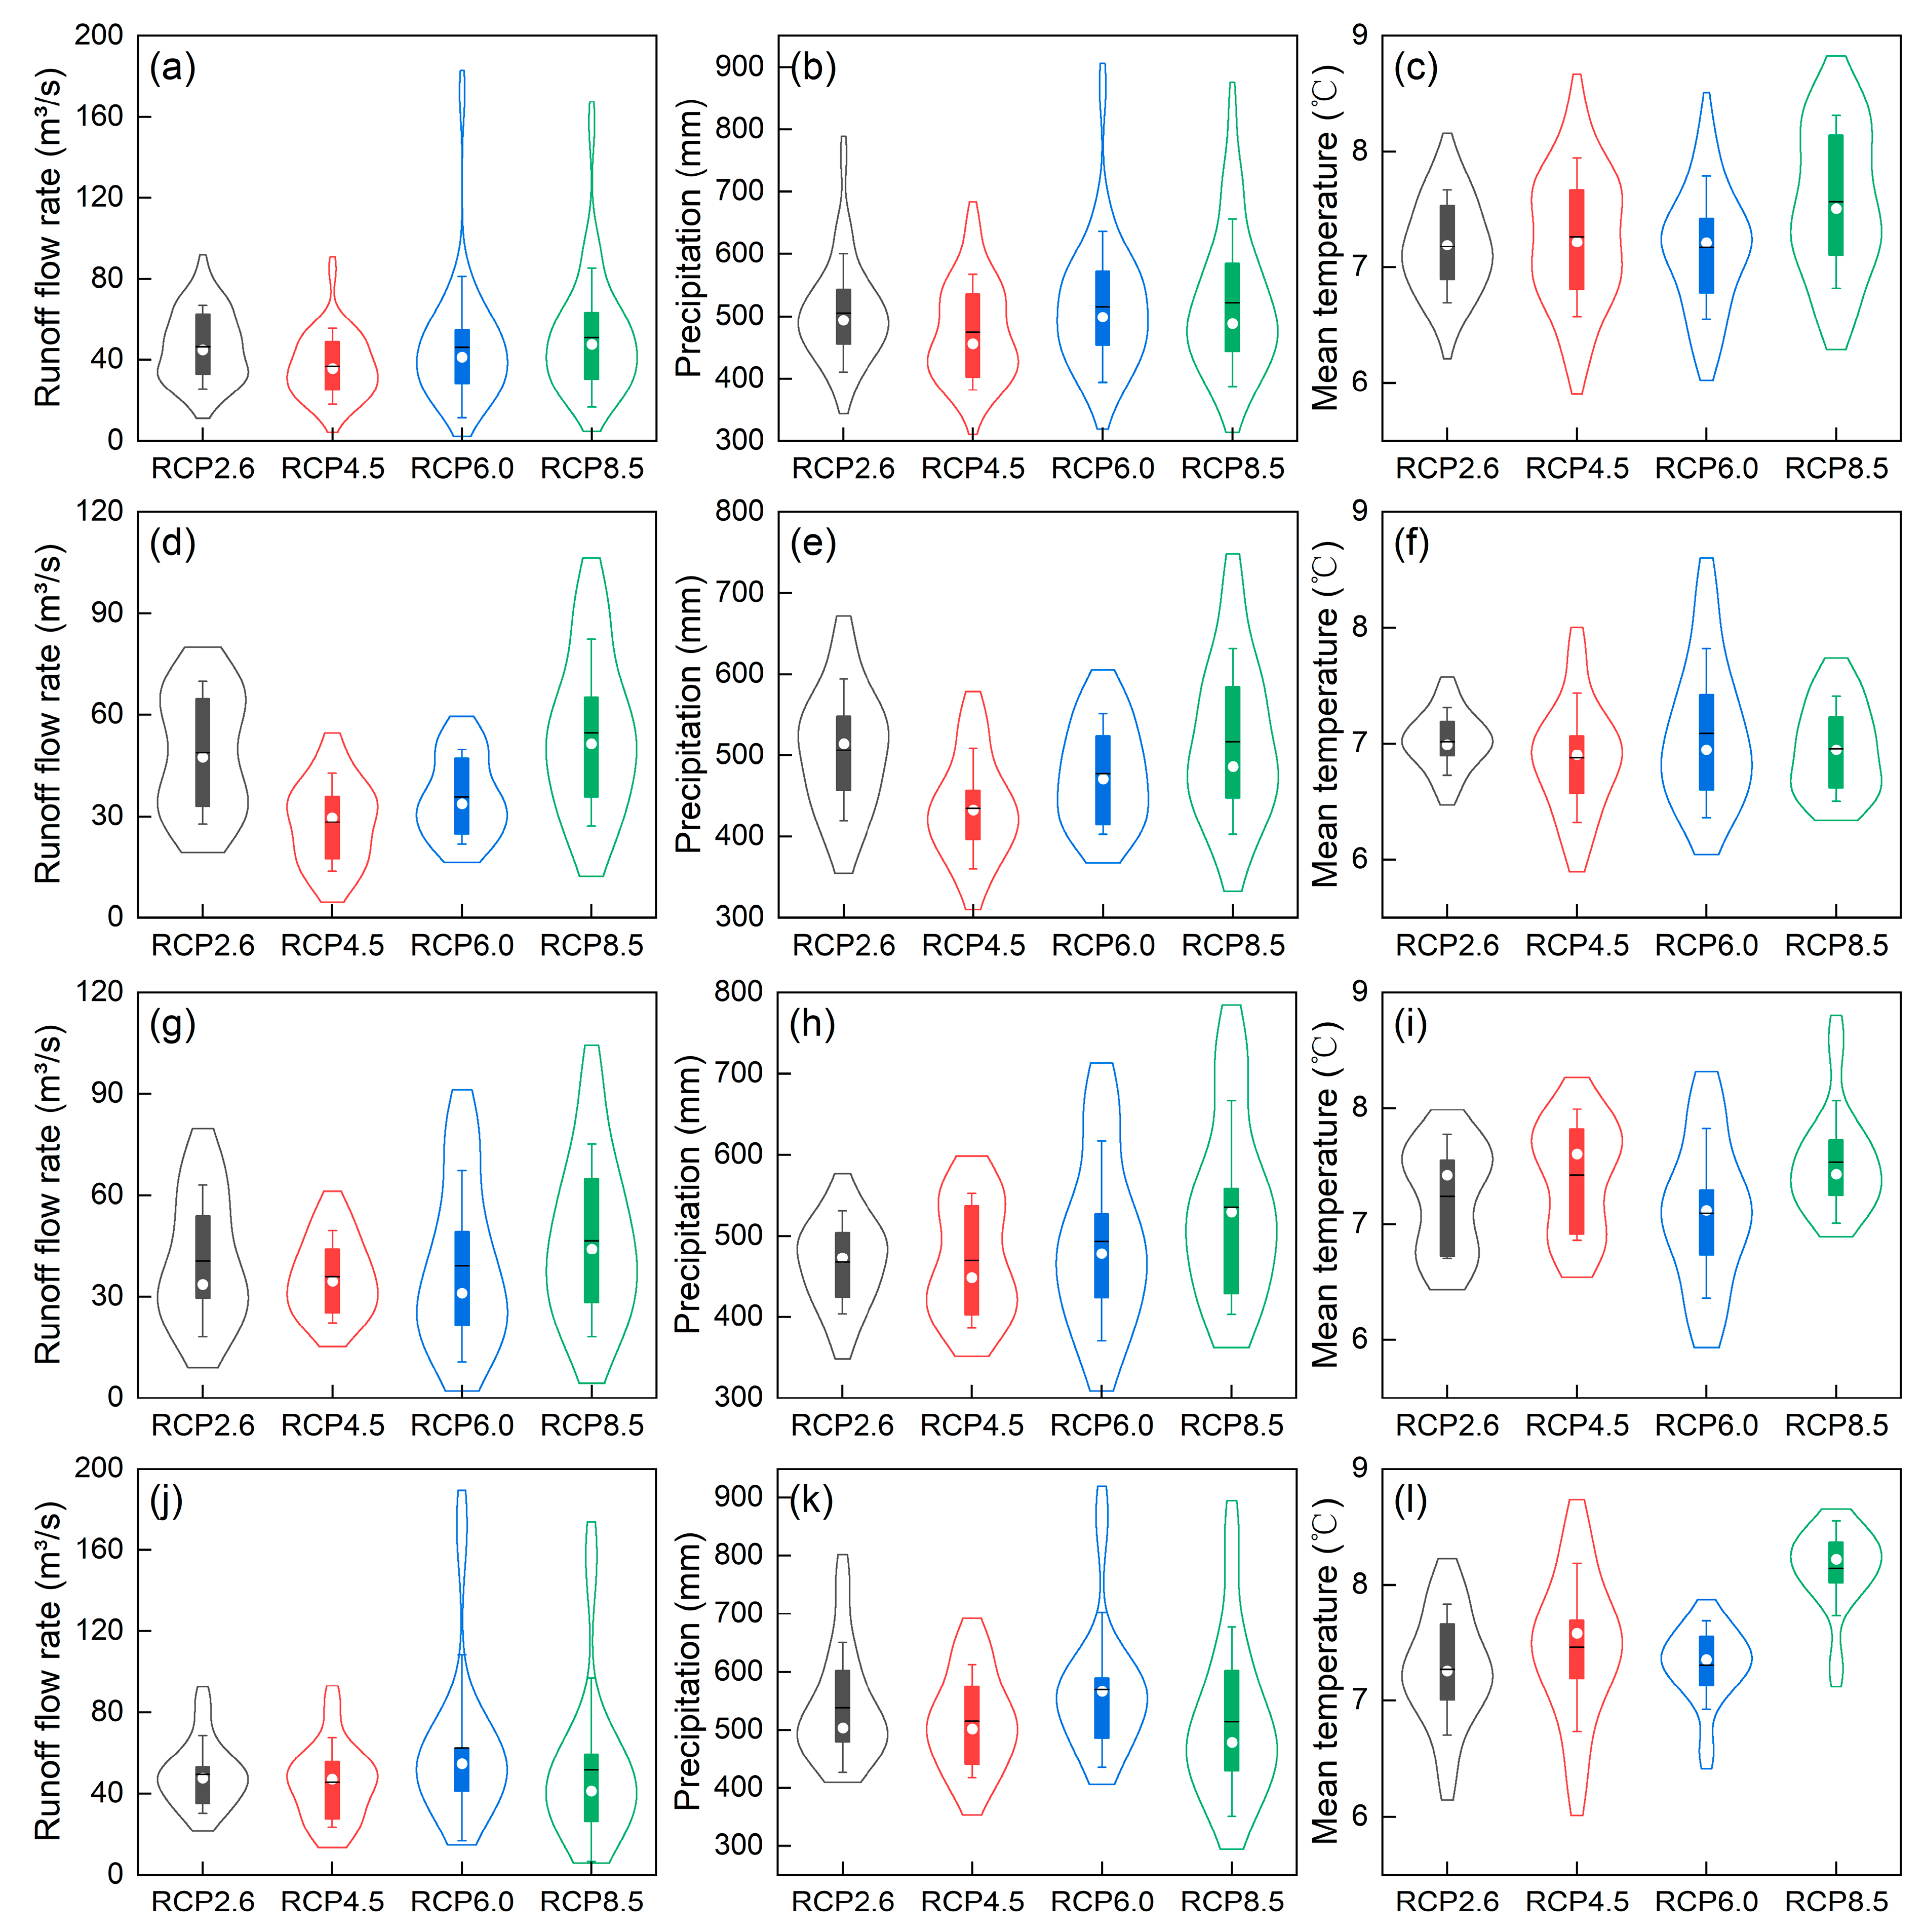
3.1.2. Future Climate Change Characteristics

Based on 23 grid points with spatial resolutions of 0.5 × 0.5° in and around the JRB, the meteorological elements in the river basin from 2020 to 2050 under four climate scenarios were calculated, and the variation characteristics of annual precipitation and mean values of temperature under different climate scenarios were analyzed (Figure 4). Under the RCP2.6, RCP4.5, RCP6.0, and RCP8.5 climate scenarios, the multi-annual mean precipitations in the JRB are 505.2, 474.4, 515.2, and 521.9 mm, respectively (Figure 4a–d). Among them, the multi-annual mean precipitations under the RCP6.0 and RCP8.5 climate scenarios are relatively close to the multi-annual mean precipitation in the 1951–2019 historical period (517.9 mm), showing differences of −2.7 and 4.0 mm, respectively. Under the RCP4.5 climate scenario, the multi-annual mean precipitation exhibits the greatest difference (−43.5 mm) from that of the historical period. Under the four climate scenarios, the annual precipitations in the JRB exhibit increasing trends with rates of 1.360, 3.360, 4.420, and 0.114 mm/a, respectively. Under the RCP6.0 climate scenario alone, the annual precipitation shows a significant (p < 0.05) increasing trend. Under the RCP2.6, RCP4.5, RCP6.0, and RCP8.5 climate scenarios, the multi-annual mean temperatures in the JRB from 2020 to 2050 are 7.2, 7.3, 7.2, and 7.6 °C, respectively. Except for the RCP2.6 climate scenario, the annual mean temperature shows a significant (p < 0.05) increasing trend (Figure 4e–h), with the rate of increase in the RCP8.5 scenario being the highest (0.054 °C/a). Under the RCP2.6 scenario, the increase rate is the lowest (0.008 °C/a). Under the RCP4.5 and RCP6.0 climate scenarios, the increase rates are 0.029 and 0.021 °C/a, respectively.

3.2. Characterization and Prediction of LUCC

3.2.1. Historical LUCC Characteristics

The spatial changes and area proportions of various types of LUCC in the JRB from 1980 to 2018 are shown in Figure 5. In the past 40 years, the farmland area in the JRB first increased and then decreased, reaching the maximum in 1990 and becoming smaller than the grassland area after 2010. The forest land area showed an oscillating pattern, reaching the minimum value in 2000, with a maximum increase of 10.59% from 2000 to 2010. The grassland area did not change before 2010, with a maximum increase of 0.62%, but increased rapidly after 2010. Water bodies have exhibited a decreasing trend in the past 40 years, especially in the period from 2010 to 2018, with a maximum decrease of 17.67%. In the past 40 years, the urban land area has shown an increasing trend, with a change of greater than 10% after 1990; of which the increase in 2018 was 34.91% compared to that in 2010. Overall, LUCC in the JRB over the past 40 years was characterized by a decrease in farmland and an increase in urban and forest land.

3.2.2. CA–Markov Model Applicability Analysis

To verify the applicability of the CA–Markov model in predicting LUCC in the JRB, this study constructed a suitability atlas of different LUCC types based on the DEM, slope, aspect, soil (Figure 1c–f), and historical climate (Figure 3) data. At the same time, based on the LUCC transition matrix in 1980–1990 and 1990–2000, combined with the measured LUCC in 1990 and 2000, the LUCC in 2000 and 2010 was predicted. Finally, the 2000 and 2010 forecasts were compared with the measured LUCC using the Crosstab module of the IDRISI 17 software, with the calculated Kappa coefficients being 0.948 and 0.939, respectively (Figure 6). The results showed that the CA–Markov model had high prediction accuracy for the LUCC in the JRB in 2000 and 2010, with predictions being consistent with observations, thereby meeting the accuracy requirements for LUCC predictions in the JRB.

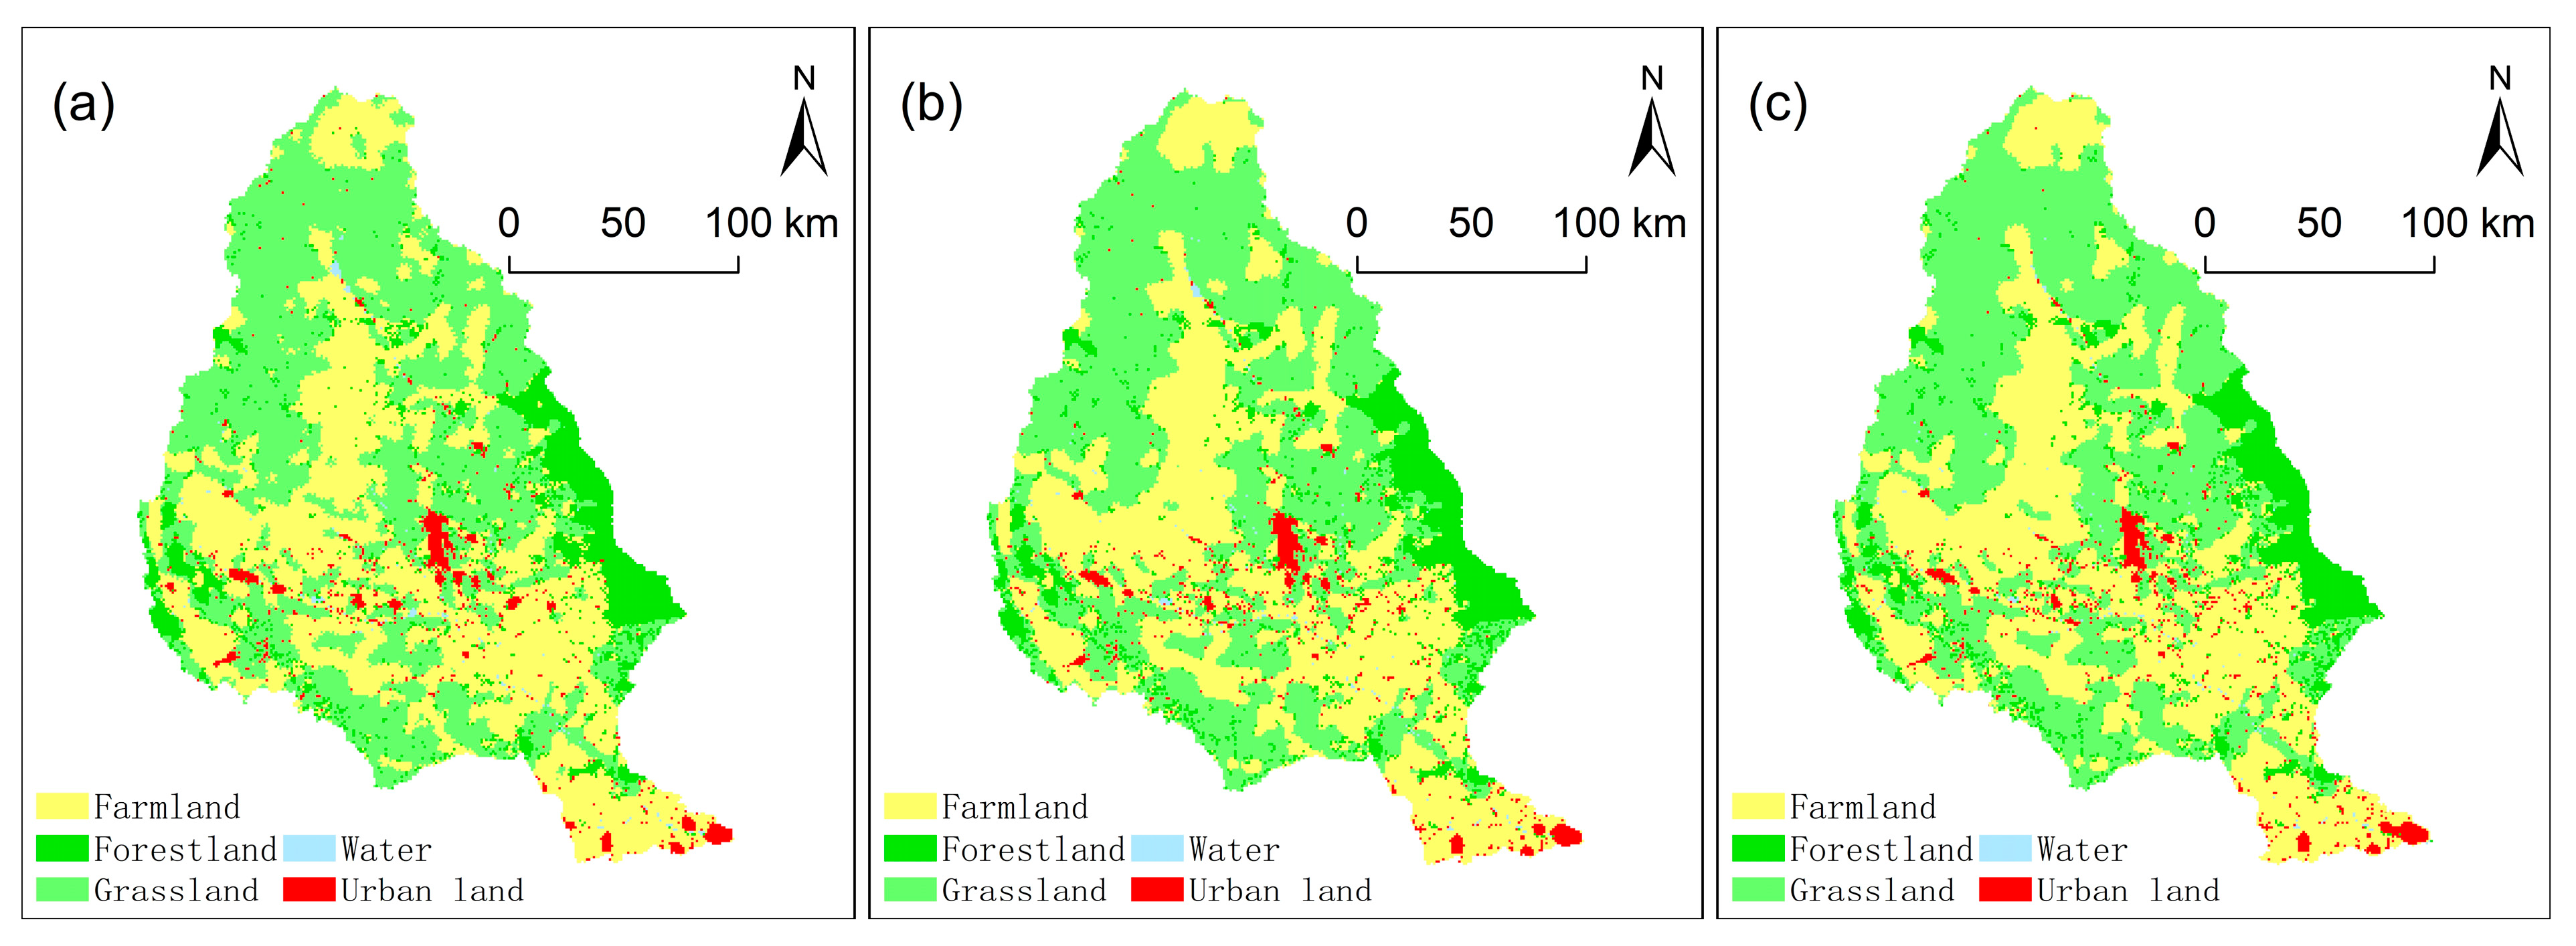
3.2.3. Future LUCC Scenarios

The results of the forecasted LUCC in the JRB for 2025, 2035, and 2045 are shown in Figure 7 and Table 1. The LUCC of each type in each future period was indistinguishable from 2018, and the area-size order was as follows: grassland > farmland > forest land > urban land > water. Farmland in the JRB showed a decreasing trend. Compared with 2018, farmland area in 2025, 2035, and 2045 decreased by 56, 170, and 162 km2, respectively. Forest area increased by 3.05%, 6.30%, and 6.47% in 2025, 2035, and 2045, respectively. Grassland decreased by ~1%. Compared to 2018, urban land increased significantly by 11.40%. Except for 2045, water bodies remained unchanged. In addition, the characteristics of future LUCC in the river basin are as follows: the forest area in the eastern mountainous region increased, the farmland area in the middle and lower reaches decreased, and urban land expanded outward based on the original extent. In several LUCC types with a greater degree of change, an increase in the area of urban land favors an increase in the rate of runoff production; a decrease in the area of farmland favors a decrease in agricultural water use and an increase in the area of forest land, which has the effect of storing water and intercepting rainfall to effectively conserve water, resulting in a decrease in the amount of runoff. However, the magnitude of future changes in urban land is greater compared to forest land, and there is a greater likelihood that future LUCC will favor an increase in runoff.

3.3. Quantitative Evaluation of the Impact of Climate Change and LUCC on Runoff Change

3.3.1. Applicability Analysis of the SWAT Model

The simulation results of the calibration and verification periods in relation to the calibration and verification of the applicability of the SWAT model to the JRB are shown in Figure 8. The R2, NS, and RE of the observed and simulated annual runoff were 0.90, 0.89, and 3.33% in the calibration period and 0.73, 0.56, and −7.68% in the verification period, respectively. According to the results of each evaluation index, the SWAT model was more effective in simulating the annual runoff in the JRB.

3.3.2. Runoff Response to Future Climate Change

Based on the SWAT model, annual runoff changes in the JRB under the four climate scenarios were simulated and predicted (Figure 9). Under the RCP2.6, RCP4.5, RCP6.0, and RCP8.5 climate scenarios, the multi-annual mean runoff-flow rate from 2020 to 2050 was 45.80, 36.22, 45.77, and 50.36 m3/s, respectively. Under the RCP2.6, RCP4.5, and RCP6.0 climate scenarios, all annual runoff-flow rates exhibited increasing trends, with increasing rates of 0.006, 0.672, and 1.135 m3/(s·a), respectively. Under the RCP4.5 and RCP6.0 climate scenarios, the annual runoff-flow rate showed significant (p < 0.05) increasing trends. Under the RCP8.5 climate scenario, the annual runoff-flow rate in the JRB exhibited a nonsignificant decreasing trend at a rate of −0.103 m3/(s·a).
To further analyze the relationship between precipitation and runoff change in the JRB from 2020 to 2050, the future change in precipitation and runoff-flow rate under different scenarios were studied. The RCP4.5 climate scenario was selected since its precipitation was the lowest. The baseline analysis involved three other scenarios (Table 2). The results showed that the runoff-flow rate is consistent with the change in precipitation, with the ratio of ΔR/ΔP being positive. In addition, under the RCP2.6, RCP6.0, and RCP8.5 climate scenarios, ΔR/ΔP was 0.31, 0.23, and 0.30 m3/(mm·s), respectively, indicating that the sensitivity of runoff-flow rate changes to precipitation changes was different under different scenarios; that is, it was also affected by changes in meteorological factors, such as temperature and evaporation.

3.3.3. Runoff Responses to Future Climate Change and LUCC

The characteristics of hydrometeorological change in the JRB in different future periods under the four climate scenarios are shown in Figure 10. Under the combined influences of climate and LUCC in the future, the multi-annual mean runoff-flow rate from 2020 to 2050 under the RCP2.6, RCP4.5, RCP6.0, and RCP8.5 climate scenarios was 46.38, 36.81, 46.29, and 51.04 m3/s, respectively; that is, with the increase of carbon dioxide emission concentration, the runoff-flow rate first decreased and then increased, which is entirely consistent with the change in precipitation. In addition, with the increase in carbon dioxide emission concentration, the variation trends of runoff-flow rate and precipitation are completely consistent in the early (2020–2029) and late (2040–2050) periods and are consistent in the middle (2030–2039) period. Except for the RCP8.5 climate scenario, the maximum values of the multi-annual mean runoff-flow rate and precipitation of the other three climate scenarios all appeared in the later period; moreover, the maximum values of annual mean temperature of the four climate scenarios all appeared in the later period. This shows that the runoff change in the JRB is dominated by precipitation, and with the increase in carbon dioxide emission concentration, precipitation and runoff would increase in the future.
To further elucidate the characteristics of hydrometeorological changes in different periods, the discreteness of the hydrometeorological elements in the JRB was calculated (Table 3). Under the RCP6.0 climate scenario, the dispersion degree of the runoff-flow rate in the JRB was the highest, with the extreme-value ratio and coefficient of variation being 13.41 and 0.63, respectively. Under the RCP2.6 climate scenario, the dispersion degree of runoff-flow rate was the lowest, with the extreme-value ratio and coefficient of variation being 4.92 and 0.37, respectively. In addition, under the RCP2.6 climate scenario, the dispersion degree of the runoff-flow rate in the JRB was the highest in the middle period, with the coefficient of variation being 0.46. Under the RCP4.5 climate scenario, the dispersion degree of the runoff-flow rate was the highest in the earlier period, with the coefficient of variation being 0.43. Under the RCP6.0 and RCP8.5 climate scenarios, the dispersion degree of the runoff-flow rate was the highest in the later period, with the coefficients of variation being 0.61 and 0.73, respectively.
Under the four climate scenarios, precipitation and mean temperature in the JRB in different periods were more concentrated than the runoff-flow rate. In particular, mean temperature had the lowest degree of dispersion. Under the RCP6.0 climate scenario, the maximum extreme ratios of precipitation and mean temperature from 2020 to 2050 were 2.44 and 1.34, respectively, whereas the coefficients of variation were less than those of the RCP8.5 climate scenario; that is, 0.20 and 0.07, respectively. Under the RCP2.6 climate scenario, the minimum coefficient of variation of precipitation and mean temperature were 0.16 and 0.06, respectively. The extreme-value ratio of precipitation was slightly higher than that of the RCP4.5 climate scenario; that is, 2.04, with the minimum extreme value ratio of mean temperature being 1.26. In addition, under the four climate scenarios, precipitation had the largest dispersion during the later period. The dispersion degree of mean temperature was the highest in the later period under the RCP2.6 and RCP4.5 climate scenarios, but the lowest under the RCP6.0 and RCP8.5 climate scenarios. This shows that the change in runoff-flow rate in the JRB was not only affected by meteorological factors, such as precipitation and air temperature, but also by changes in LUCC and other factors. Further, with the increase in carbon dioxide emission concentration, the possibility of extreme precipitation and flood disasters in the future increases.

3.3.4. Combined Effects of Climate Change and LUCC on Runoff Change

Under the influence of future climate alone, except for the RCP8.5 climate scenario, the multi-annual mean runoff-flow rate in the JRB decreased to a certain extent compared with the historical period (1961–2019). In addition, under the RCP2.6, RCP4.5, RCP6.0, and RCP8.5 climate scenarios, the contribution rate of climate change to the change in runoff-flow rate in the JRB was −8.06%, −27.30%, −8.12%, and +1.10%, respectively (Table 4). Under the combined influence of future climate change and LUCC, the multi-annual mean runoff-flow rate in the JRB decreased by 6.79%, 25.66%, and 6.98% under the RCP2.6, RCP4.5, and RCP6.0 climate scenarios, respectively. Under the RCP8.5 climate scenario, the multi-annual mean runoff-flow rate in the JRB increased by 2.45%. Considering the runoff-response processes in the A1 and A2 set-ups, the results showed that the contribution rate of the LUCC to the change in runoff-flow rate in the JRB was +1.27%, +1.64%, +1.14%, and +1.35% under the RCP2.6, RCP4.5, RCP6.0, and RCP8.5 climate scenarios, respectively.
In general, influenced by the increasing trend of future precipitation, future runoff in the JRB showed increasing trends under the RCP2.6, RCP4.5, and RCP6.0 climate scenarios. However, under the RCP8.5 climate scenario, future precipitation in the JRB showed a nonsignificant increasing trend, with the temperature increasing significantly, thereby resulting in a decreasing trend in runoff. In addition, except for the RCP8.5 climate scenario, the multi-annual mean precipitation in the JRB was smaller than that in the historical period, with future climate change likely leading to a decrease in the multi-annual mean runoff in the river basin. Future LUCC will be conducive to the increase in the multi-annual mean runoff in the JRB, albeit with a relatively small impact; therefore, under the combined influence of future climate change and LUCC, it is more likely that the multi-annual mean runoff in the JRB will decrease in the future.

4. Discussion

4.1. Uncertainty Analysis

The existing studies do not consider LUCC and vegetation species changes that influence the hydrological cycle processes in watersheds. It is also difficult to accurately strip out the effects of LUCC and vegetation-species changes on hydrological cycle processes, especially the effects of LUCC, in practical applications [47]. In previous studies, most of the drivers of hydrological change were divided into two major factors: climate change and human activities, and first-order approximations were used, such as, LUCC was approximated as a result of human activities [48]. However, changes in LUCC and vegetation species alter hydrological processes such as filling, infiltration, and soil water-storage capacity during the runoff-generation process in the watershed and surface roughness, surface water storage, and river catchment path during confluence process, which lead to increased canopy interception and increased conversion of precipitation to evapotranspiration [49]. Therefore, human activities play an important role in altering the hydrological cycle of a watershed [50]. However, there are relatively few studies on the mechanism of change in hydrological processes in watersheds driven by LUCC, which need to be further strengthened at a later stage.
The SWAT and CA–Markov model used in this study all have certain internal systematic errors, and although they act as reference values for future studies of runoff change and its driving factors, their accuracy still needs to be further improved [51,52]. Therefore, the next step needs to comprehensively and accurately identify the depressions characteristics of DEM, develop and improve the underlying code of the SWAT model, and combine with more powerful computational capabilities and high-precision LUCC data, so as to obtain the runoff-change characteristics and the reliable future-prediction results that better reflect the actual watershed [53,54].
In addition, research on climate change and its impacts belongs to the ‘if-then-what’ type. Future emission scenarios and hydrological model selection and future LUCC will increase the uncertainty of climate-change impact on runoff [55,56]. Despite the uncertainties associated with modeling predictions of future climate impacts on runoff changes based on climate-model outputs, specific scenarios remain fundamental to helping identify possible future climate and hydrologic changes [57]. Previous studies have shown that the choice of GCM relative to emission scenarios and downscaling methods is the largest contributor to uncertainty in climate-change impact evaluation [58,59]. Therefore, when evaluating the impact of climate change in a specific region on future hydrological and water resources, it is crucial to select a suitable future climate model and to simulate future hydrological processes based on multiple climate scenarios to make the resulting conclusions more reliable.

4.2. Strategies for Rational Utilization of Water Resources in the Future

Under the four future scenarios, the future runoff alone in the JRB under the RCP8.5 scenario is slightly higher than that of the historical period, whereas the remaining scenarios are smaller than those of the historical period, especially the multi-year-average runoff in the basin under the RCP4.5 scenario decreasing by 27.30%, which indicates that climate change in the future is likely to exacerbate water scarcity in the basin. However, this study shows that the future LUCC will be beneficial to alleviate the pressure on water resources. If policy favors solving the contradiction between the supply and demand of water resources in the watershed, it should continue with the current policy; that is, it should increase the area of future urban land in accordance with the development trend of the present day, and the land retired from farmland should be changed into grassland more often. If policy favors alleviating the pressure on flood control in the watershed, it should control the continuous increase in the area of future urban land, and the retired farmland should be changed into forest land more often [22]. In addition, water resources in the JRB are concentrated in the flood season, accounting for more than 60% of the annual runoff. In the future, under the influence of changing climatic conditions, the distribution of water resources within the year will be increasingly uneven, and it is recommended to build large reservoirs and groundwater reservoirs in and around the basin so as to realize the optimal allocation of water resources through the joint storage of the two, to feed the dryness with the abundance and to improve the utilization rate of water resources [60].

4.3. Limitations of the Study

This study predicts the first level-LUCC types in the JRB alone, and its spatial resolution is 1 × 1 km, which needs to be improved in the detailed portrayal of LUCC. However, the actual individual LUCC is characterized by scattered and small patches of change, which may have implications for predicting future LUCC in the watershed [61,62]. In addition, this study quantitatively distinguishes the contribution of LUCC and climate change based on the results of runoff simulation under different scenarios but does not further investigate the mechanism of their influence; nor does it quantify the sensitivity of runoff to each level of LUCC type, which still requires further research. In addition, the influence of human activities on runoff change in the JRB has gradually increased in recent years. According to the statistics, the surface water supply in the JRB is 270 million m3, accounting for 56.72% of the total water consumption, and 65.83% of the surface water supply is supplied in the form of water diversion, and more than 80% of the diverted water is used for agricultural irrigation (Figure 11). However, the impact on future water use owing to the reduction in farmland area was not considered in this study, which may have an impact on future runoff changes.

5. Conclusions

In this study, the JRB was selected as the study area, the historical (1951–2019) and future (2020–2050) climate change characteristics were analyzed, and the LUCC in the JRB in 2025, 2035, and 2045 was predicted. The law and attribution of runoff change under different combination scenarios were studied, and the main conclusions are as follows:
(1) Under the RCP2.6, RCP4.5, RCP6.0, and RCP8.5 climate scenarios, the annual precipitation and mean temperature in the JRB from 2020 to 2050 increases at a rate of 1.36 and 0.008, 3.36 and 0.029, 4.42 and 0.021, and 0.114 mm/a and 0.054 °C/a, respectively. Under the four scenarios, the change of precipitation was not significant, whereas the temperature change was significant (p < 0.05), except under the RCP2.6 scenario. Compared with 2018, forest and urban land areas in the JRB in 2025, 2035, and 2045 increase by 3.05% and 9.46%, 6.30% and 10.05%, and 6.47% and 11.40%, respectively, whereas grassland, farmland, and water bodies slightly decrease.
(2) Based on the results of each evaluation index, the SWAT model was more efficient in simulating the annual runoff change in the JRB. Under the RCP2.6, RCP4.5, RCP6.0, and RCP8.5 climate scenarios, the contribution rates of future climate change to runoff change in the JRB were −8.06%, −27.30%, −8.12%, and +1.10%, whereas the contribution rates of the future LUCC were +1.27%, +1.64%, +1.14%, and +1.35%, respectively. In addition, with the increase in carbon dioxide emission concentration, future precipitation and runoff also increased, thereby increasing the possibility of extreme precipitation and flood disaster events.
(3) There are many uncertainties in the impacts of LUCC and climate change on runoff changes in the JRB, which need to be explored by continued in-depth studies in terms of quantification of uncertainties and different LUCC types of sensitivities. In addition, the future impacts of LUCC and climate change on runoff vary with different climate characteristics and watersheds. Therefore, there is a need to apply the research framework used in this study to other watersheds, thus contributing to future water-resource management in a wider range of watersheds.

Author Contributions

Conceptualization, Y.L. and X.M.; methodology, Y.L. and T.H.; software, Y.L. and C.W.; validation, Y.L. and X.M.; formal analysis, Y.L. and Z.G.; investigation, Y.L. and Z.G.; resource, X.M.; data curation, Y.L. and T.H.; writing—original draft preparation, Y.L.; writing—review and editing, Y.L., R.G. and X.M.; visualization, Y.L. and Z.G.; supervision, Y.L., C.W. and X.M.; project administration, Y.L. and X.M.; funding acquisition, X.M. and Z.G. All authors have read and agreed to the published version of the manuscript.

Funding

This study was funded by the National Natural Science Foundation of China (Grant No. 52179048, 42207084), the National Key R&D Program of China (Grant No. 2022YFD1900803), and the Natural Science Basic Research Program of Shaanxi Province (Grant No. 2023-JC-QN-0372).

Data Availability Statement

The digital elevation model, soil raster maps, land use, and future climate data used in this study are freely available and can be accessed from the website provided in the data section of the manuscript. Historical climate and runoff data were obtained from the China Meteorological Data Service Centre and Yellow River Conservancy Commission and can be obtained from these departments through official channels.

Acknowledgments

The authors are grateful to the China Meteorological Data Service Centre, Geospatial Data Cloud, National Tibetan Plateau Data Center, Resources and Environment Science and Data Center of the Chinese Academy of Sciences, and Yellow River Conservancy Commission for sharing the data used in this study.

Conflicts of Interest

The authors declare no conflict of interest.

Abbreviations

LUCC, land use/cover change; JRB, Jinghe River Basin; DEM, digital elevation model; GFDL–ESM2M, geophysical fluid dynamics laboratory Earth system model with modular ocean model; CA–Markov, cellular automata–markov; Ka, Kappa coefficient; SWAT, soil and water assessment tool; R2, correlation coefficient; NS, Nash–Sutcliffe efficiency coefficient; RE, relative error; K, extreme value ratio; Cv, coefficient of variation.

References

  1. Pan, Z.; Liu, P.; Gao, S.; Xia, J.; Chen, J.; Cheng, L. Improving hydrological projection performance under contrasting climatic conditions using spatial coherence through a hierarchical Bayesian regression framework. Hydrol. Earth Syst. Sci. 2019, 23, 3405–3421. [Google Scholar] [CrossRef] [Green Version]
  2. Yang, W.; Jin, F.; Si, Y.; Li, Z. Runoff change controlled by combined effects of multiple environmental factors in a headwater catchment with cold and arid climate in northwest China. Sci. Total Environ. 2021, 756, 143995. [Google Scholar] [CrossRef]
  3. North, M.A.; Hunter, N.B.; Roberts, D.C.; Slotow, R. Science for implementation: The roles, experiences, and perceptions of practitioners involved in the Intergovernmental Panel on Climate Change. Clim. Action 2022, 1, 25. [Google Scholar] [CrossRef]
  4. Papalexiou, S.M.; Montanari, A. Global and regional increase of precipitation extremes under global warming. Water Resour. Res. 2019, 55, 4901–4914. [Google Scholar] [CrossRef]
  5. Prein, A.F.; Rasmussen, R.M.; Ikeda, K.; Liu, C.; Clark, M.P.; Holland, G.J. The future intensification of hourly precipitation extremes. Nat. Clim. Chang. 2017, 7, 48–52. [Google Scholar] [CrossRef]
  6. Ahn, K.H.; Merwade, V. Quantifying the relative impact of climate and human activities on streamflow. J. Hydrol. 2014, 515, 257–266. [Google Scholar] [CrossRef]
  7. Alamdari, N.; Claggett, P.; Sample, D.J.; Easton, Z.M.; Nayeb, Y.M. Evaluating the joint effects of climate and land use change on runoff and pollutant loading in a rapidly developing watershed. J. Clean. Prod. 2022, 330, 129953. [Google Scholar] [CrossRef]
  8. Feng, Q.; Liu, W.; Xi, H.; Yang, W.; Jin, F.; Si, Y.; Li, Z. Comprehensive evaluation and indicator system of land desertification in the Heihe River Basin. Nat. Hazards 2013, 65, 1573–1588. [Google Scholar] [CrossRef]
  9. Liu, Y.; Tian, J.; Liu, R.; Ding, L. Influences of climate change and human activities on NDVI changes in China. Remote Sens. 2021, 13, 4326. [Google Scholar] [CrossRef]
  10. Wang, Q.; Xu, Y.; Cai, X.; Tang, J.; Yang, L. Role of underlying surface, rainstorm and antecedent wetness condition on flood responses in small and medium sized watersheds in the Yangtze River Delta region, China. Catena 2021, 206, 105489. [Google Scholar] [CrossRef]
  11. Chen, Q.; Chen, H.; Zhang, J.; Hou, Y.; Shen, M.; Chen, J.; Xu, C. Impacts of climate change and LULC change on runoff in the Jinsha River Basin. J. Geogr. Sci. 2020, 30, 85–102. [Google Scholar] [CrossRef] [Green Version]
  12. Yin, J.; Gentine, P.; Zhou, S.; Sullivan, S.C.; Wang, R.; Zhang, Y.; Guo, S. Large increase in global storm runoff extremes driven by climate and anthropogenic changes. Nat. Commun. 2018, 9, 4389. [Google Scholar] [CrossRef] [Green Version]
  13. Abdelkarim, A.; Alogayell, H.M.; Alkadi, I.I.; Youssef, I. Spatial–temporal prediction model for land cover of the rural–urban continuum axis between Ar-Riyadh and Al-Kharj cities in KSA in the year of 2030 using the integration of CA–Markov model, GIS-MCA, and AHP. Appl. Geomat. 2022, 14, 501–525. [Google Scholar] [CrossRef]
  14. Dunn, S.M.; Brown, I.; Sample, J.; Post, H. Relationships between climate, water resources, land use and diffuse pollution and the significance of uncertainty in climate change. J. Hydrol. 2012, 434, 19–35. [Google Scholar] [CrossRef]
  15. Huo, J.; Shi, Z.; Zhu, W.; Xue, H.; Chen, X. A multi-scenario simulation and optimization of land use with a Markov–FLUS coupling model: A case study in Xiong’an New Area, China. Sustainability 2022, 14, 2425. [Google Scholar] [CrossRef]
  16. Liu, G.; Jin, Q.; Li, J.; Li, L.; He, C.; Huang, Y.; Yao, Y. Policy factors impact analysis based on remote sensing data and the CLUE-S model in the Lijiang River Basin, China. Catena 2017, 158, 286–297. [Google Scholar] [CrossRef]
  17. Siddique, M.A.; Wang, Y.; Xu, N.; Ullah, N.; Zeng, P. The spatiotemporal implications of urbanization for urban heat islands in Beijing: A predictive approach based on CA–Markov modeling (2004–2050). Remote Sens. 2021, 13, 4697. [Google Scholar] [CrossRef]
  18. Chen, X.; Han, R.; Feng, P.; Wang, Y. Combined effects of predicted climate and land use changes on future hydrological droughts in the Luanhe River basin, China. Nat. Hazards 2021, 110, 1305–1337. [Google Scholar] [CrossRef]
  19. Daba, M.H.; You, S. Quantitatively assessing the future land-use/land-cover changes and their driving factors in the Upper Stream of the Awash River Based on the CA–Markov model and their implications for water resources management. Sustainability 2022, 14, 1538. [Google Scholar] [CrossRef]
  20. Li, T.; Liu, D.; Han, S.; Ming, G.; Fan, J.; Meng, X.; Huang, Q. Closing the feedback of evapotranspiration on the atmospheric evaporation demand based on a complementary relationship. Atmosphere 2022, 13, 1431. [Google Scholar] [CrossRef]
  21. Piras, M.; Mascaro, G.; Deidda, R.; Vivoni, E.R. Quantification of hydrologic impacts of climate change in a Mediterranean basin in Sardinia, Italy, through high-resolution simulations. Hydrol. Earth Syst. Sci. 2014, 18, 5201–5217. [Google Scholar] [CrossRef] [Green Version]
  22. Zhang, L.; Jiang, Y.; Yang, M.; Wang, H.; Dong, N.; Wang, H.; Liu, X.; Chen, L.; Liu, K. Quantifying the impacts of land use and cover change (LUCC) and climate change on discharge and sediment load in the Hunhe River Basin, Liaoning Province, Northeast China. Water 2022, 14, 737. [Google Scholar] [CrossRef]
  23. Yan, B.; Xu, Y. Quantifying interaction uncertainty between subwatersheds and base-flow partitions on hydrological processes. PLoS ONE 2022, 17, e0261859. [Google Scholar] [CrossRef] [PubMed]
  24. Zang, W.; Liu, S.; Huang, S.; Li, J.; Fu, Y.; Sun, Y.; Zheng, J. Impact of urbanization on hydrological processes under different precipitation scenarios. Nat. Hazards 2019, 99, 1233–1257. [Google Scholar] [CrossRef]
  25. Cai, L.; Chen, X.; Huang, R.; Smettem, K. Runoff change induced by vegetation recovery and climate change over carbonate and non-carbonate areas in the karst region of South-west China. J. Hydrol. 2022, 604, 127231. [Google Scholar] [CrossRef]
  26. Farsi, N.; Mahjouri, N. Evaluating the contribution of the climate change and human activities to runoff change under uncertainty. J. Hydrol. 2019, 574, 872–891. [Google Scholar] [CrossRef]
  27. Lian, J.; Chen, H.; Wang, F.; Nie, Y.; Wang, K. Separating the relative contributions of climate change and ecological restoration to runoff change in a mesoscale karst basin. Catena 2020, 194, 104705. [Google Scholar] [CrossRef]
  28. Xue, D.; Zhou, J.; Zhao, X.; Liu, C.; Wei, W.; Yang, X.; Li, Q.; Zhao, Y. Impacts of climate change and human activities on runoff change in a typical arid watershed, NW China. Ecol. Indic. 2021, 121, 107013. [Google Scholar] [CrossRef]
  29. Chen, S.; Fu, Y.H.; Wu, Z.; Hao, F.; Hao, Z.; Guo, Y.; Geng, X.; Li, X.; Zhang, X.; Tang, J.; et al. Informing the SWAT model with remote sensing detected vegetation phenology for improved modeling of ecohydrological processes. J. Hydrol. 2023, 616, 128817. [Google Scholar] [CrossRef]
  30. Han, D.; Wang, G.; Liu, T.; Xue, B.; Kuczera, G.; Xu, X. Hydroclimatic response of evapotranspiration partitioning to prolonged droughts in semiarid grassland. J. Hydrol. 2018, 563, 766–777. [Google Scholar] [CrossRef]
  31. Chi, Q.; Zhou, S.; Wang, L.; Zhu, M.; Liu, D.; Tang, W.; Zhao, X.; Xu, S.; Ye, S.; Lee, J.; et al. Quantifying the contribution of LUCC to surface energy budget: A case study of four typical cities in the Yellow River Basin in China. Atmosphere 2021, 12, 1374. [Google Scholar] [CrossRef]
  32. Shen, M.; Chen, J.; Zhuan, M.; Chen, H.; Xu, C.Y.; Xiong, L. Estimating uncertainty and its temporal variation related to global climate models in quantifying climate change impacts on hydrology. J. Hydrol. 2018, 556, 10–24. [Google Scholar] [CrossRef]
  33. Zhao, L.; Wang, W.; Li, M.; Xu, G. A comparative study on the coevolution and drivers of environmental risks and man–land relationship between China and the United States from the perspective of LUCC. Atmosphere 2023, 14, 288. [Google Scholar] [CrossRef]
  34. Xu, C.; Jiang, Y.; Su, Z.; Liu, Y.; Lyu, J. Assessing the impacts of Grain-for-Green Programme on ecosystem services in Jinghe River basin, China. Ecol. Indic. 2022, 137, 108757. [Google Scholar] [CrossRef]
  35. Lyu, J.; Yin, S.; Sun, Y.; Wang, K.; Luo, P.; Meng, X. Flood runoff simulation under changing environment, based on multiple satellite data in the Jinghe River Basin of the Loess Plateau, China. Remote Sens. 2023, 15, 550. [Google Scholar] [CrossRef]
  36. Wang, H.; Liu, G.; Li, Z.; Wang, P.; Wang, Z. Assessing the driving forces in vegetation dynamics using net primary productivity as the indicator: A case study in Jinghe River Basin in the Loess Plateau. Forests 2018, 9, 374. [Google Scholar] [CrossRef] [Green Version]
  37. Tang, C.; Li, J.; Zhou, Z.; Zeng, L.; Zhang, C.; Ran, H. How to optimize ecosystem services based on a Bayesian model: A case study of Jinghe River Basin. Sustainability 2019, 11, 4149. [Google Scholar] [CrossRef] [Green Version]
  38. Varmaghani, A.; Eichinger, W.E.; Prueger, J.H. Modification of FAO Penman–Monteith equation for minor components of energy. Hydrol. Res. 2019, 50, 607–615. [Google Scholar] [CrossRef]
  39. Liu, Y.; Jia, Z.; Ma, X.; Wang, Y.; Guan, R.; Guan, Z.; Gu, Y.; Zhao, W. Analysis of drought characteristics projections for the Tibetan Plateau based on the GFDL-ESM2M climate model. Remote Sens. 2022, 14, 5084. [Google Scholar] [CrossRef]
  40. Faichia, C.; Tong, Z.; Zhang, J.; Liu, X.; Kazuva, E.; Ullah, K.; AlShaibah, B. Using RS data-based CA–Markov model for dynamic simulation of historical and future LUCC in Vientiane, Laos. Sustainability 2020, 12, 8410. [Google Scholar] [CrossRef]
  41. Novin, M.S.; Ebrahimipour, A. Spatio-temporal modelling of land use changes by means of CA–Markov model. Model. Earth Syst. Environ. 2019, 5, 1253–1263. [Google Scholar] [CrossRef]
  42. Wang, Q.; Xu, Y.; Wang, Y.; Zhang, Y.; Xiang, J.; Xu, Y.; Wang, J. Individual and combined impacts of future land-use and climate conditions on extreme hydrological events in a representative basin of the Yangtze River Delta, China. Atmos. Res. 2020, 236, 104805. [Google Scholar] [CrossRef]
  43. Wu, X.; Lin, A.Q.; Li, Y.; Wu, H.; Cen, L.Y.; Liu, H.; Song, D.X. Simulating spatiotemporal land use change in middle and high latitude regions using multiscale fusion and cellular automata: The case of Northeast China. Ecol. Indic. 2021, 133, 108449. [Google Scholar] [CrossRef]
  44. Zhang, J.; Wang, Y. Runoff prediction under different precipitation scenarios based on SWAT model and stochastic simulation of precipitation. J. Hydrol. Eng. 2022, 27, 05022003. [Google Scholar] [CrossRef]
  45. Alejo, L.A.; Ella, V.B.; Saludes, R.B. Applicability of the climate hazards group infrared precipitation with stations as rainfall input for SWAT watershed modeling. Water Resour. 2021, 48, 925–935. [Google Scholar] [CrossRef]
  46. Li, M.; Di, Z.; Duan, Q. Effect of sensitivity analysis on parameter optimization: Case study based on streamflow simulations using the SWAT model in China. J. Hydrol. 2021, 603, 126896. [Google Scholar] [CrossRef]
  47. Lv, L.; Han, L.; Wen, X.; Shao, H.; Liu, S. Spatiotemporal changes in water yield function and its influencing factors in the Tibetan Plateau in the past 20 years. Atmosphere 2023, 14, 925. [Google Scholar] [CrossRef]
  48. Zhang, L.; Dawes, W.R.; Walker, G.R. Response of mean annual evapotranspiration to vegetation changes at catchment scale. Water Resour. Res. 2001, 37, 701–708. [Google Scholar] [CrossRef]
  49. Yang, H.; Luo, P.; Wang, J.; Mou, C.; Mo, L.; Wang, Z.; Fu, Y.; Lin, H.; Yang, Y.; Bhatta, L.D. Ecosystem evapotranspiration as a response to climate and vegetation coverage changes in Northwest Yunnan, China. PLoS ONE 2017, 10, e0134795. [Google Scholar] [CrossRef]
  50. Ni, Y.; Yu, Z.; Lv, X.; Ma, L.; Zhang, Q.; Wang, J. Response of runoff to vegetation change in typical basin of the Loess Plateau. Ecol. Eng. 2022, 182, 106704. [Google Scholar] [CrossRef]
  51. Makumbura, R.K.; Gunathilake, M.B.; Samarasinghe, J.T.; Confesor, R.; Muttil, N.; Rathnayake, U. Comparison of calibration approaches of the soil and water assessment tool (SWAT) model in a Tropical Watershed. Hydrology 2022, 9, 183. [Google Scholar] [CrossRef]
  52. Ji, G.; Lai, Z.; Xia, H.; Liu, H.; Wang, Z. Future runoff variation and flood disaster prediction of the Yellow River Basin based on CA-Markov and SWAT. Land 2021, 10, 421. [Google Scholar] [CrossRef]
  53. Chen, C.; Gan, R.; Feng, D.; Yang, F.; Zuo, Q. Quantifying the contribution of SWAT modeling and CMIP6 inputting to streamflow prediction uncertainty under climate change. J. Clean. Prod. 2022, 364, 132675. [Google Scholar] [CrossRef]
  54. Chen, J.; Du, C.; Nie, T.; Han, X.; Tang, S. Study of non-point pollution in the Ashe River Basin based on SWAT model with different land use. Water 2022, 14, 2177. [Google Scholar] [CrossRef]
  55. Schneider, U.; Finger, P.; Meyer-Christoffer, A.; Rustemeier, E.; Ziese, M.; Becker, A. Evaluating the hydrological cycle over land using the newly-corrected precipitation climatology from the global precipitation climatology centre (GPCC). Atmosphere 2017, 8, 52. [Google Scholar] [CrossRef] [Green Version]
  56. Zhang, H.; Huang, G.H.; Wang, D.; Zhang, X. Uncertainty assessment of climate change impacts on the hydrology of small prairie wetlands. J. Hydrol. 2010, 396, 94–103. [Google Scholar] [CrossRef] [Green Version]
  57. Chevuturi, A.; Klingaman, N.P.; Turner, A.G.; Guo, L.; Vidale, P.L. Projected changes in the East Asian hydrological cycle for different levels of future global warming. Atmosphere 2022, 13, 405. [Google Scholar] [CrossRef]
  58. Trolle, D.; Nielsen, A.; Andersen, H.E.; Thodsen, H.; Olesen, J.E.; Børgesen, C.D.; Refsgaard, J.C.; Sonnenborg, T.O.; Karlsson, I.B.; Christensen, J.P.; et al. Effects of changes in land use and climate on aquatic ecosystems: Coupling of models and decomposition of uncertainties. Sci. Total Environ. 2018, 657, 627–633. [Google Scholar] [CrossRef]
  59. Joseph, J.; Ghosh, S.; Pathak, A.; Sahai, A.K. Hydrologic impacts of climate change: Comparisons between hydrological parameter uncertainty and climate model uncertainty. J. Hydrol. 2018, 566, 1–22. [Google Scholar] [CrossRef]
  60. Koulelis, P.P.; Proutsos, N.; Solomou, A.D.; Avramidou, E.V.; Malliarou, E.; Athanasiou, M.; Xanthopoulos, G.; Petrakis, P.V. Effects of climate change on greek forests: A review. Atmosphere 2023, 14, 1155. [Google Scholar] [CrossRef]
  61. Fan, Q.; Ding, S. Landscape pattern changes at a county scale: A case study in Fengqiu, Henan Province, China from 1990 to 2013. Catena 2016, 137, 152–160. [Google Scholar] [CrossRef]
  62. Gedefaw, M.; Denghua, Y.; Girma, A. Assessing the impacts of land use/land cover changes on water resources of the Nile River Basin, Ethiopia. Atmosphere 2023, 14, 749. [Google Scholar] [CrossRef]
Figure 1. Geographical location of (a) China and (b) Yellow River Basin; and environmental map of Jinghe River Basin (JRB): (c) digital elevation model (DEM), (d) slop, (e) aspect, and (f) soil.
Atmosphere 14 01237 g001
Figure 2. Schematic of the framework used to determine the impacts of climate change and LUCC on runoff.
Atmosphere 14 01237 g002
Figure 3. Spatial changes of meteorological elements in the JRB from 1951 to 2019: (a) precipitation (P), (b) potential evapotranspiration (PET), (c) maximum temperature (Max T), (d) mean temperature (Mean T), (e) minimum temperature (Min T), (f) sunshine duration (SD), (g) wind speed (WS), and (h) relative humidity (RH).
Atmosphere 14 01237 g003
Figure 4. Variation characteristics of annual precipitation and mean temperature in the JRB from 2020 to 2050 under the four climate scenarios: annual precipitation changes under the (a) RCP2.6, (b) RCP4.5, (c) RCP6.0, and (d) RCP8.5 climate scenarios; annual mean temperature changes under the (e) RCP2.6, (f) RCP4.5, (g) RCP6.0, and (h) RCP8.5 climate scenarios.
Atmosphere 14 01237 g004
Figure 5. Historical LUCC characteristics and statistics in the JRB: (a) 1980, (b) 1990, (c) 2000, (d) 2010, (e) 2018, and (f) characteristics of change statistics.
Atmosphere 14 01237 g005
Figure 6. Results of LUCC projections and their differences in the JRB: (a,b) in 2000; (c,d) in 2010.
Atmosphere 14 01237 g006
Figure 7. Forecasted LUCC in the JRB: (a) 2025, (b) 2035, and (c) 2045.
Atmosphere 14 01237 g007
Figure 8. Comparison of the observed and simulated runoff in the calibration and verification periods in the JRB: (a) simulation effect of runoff flow rate and (b) correlation between observed and simulated runoff flow rates.
Atmosphere 14 01237 g008
Figure 9. Characteristics of runoff change in the JRB under the (a) RCP2.6, (b) RCP4.5, (c) RCP6.0, and (d) RCP8.5 climate scenarios.
Atmosphere 14 01237 g009
Figure 10. Characteristics of hydrometeorological changes in the JRB during different future periods: (a) runoff-flow rate, (b) precipitation, and (c) mean temperature distribution in 2020–2050; (d) runoff-flow rate, (e) precipitation, and (f) mean temperature distribution in 2020–2029; (g) runoff-flow rate, (h) precipitation, and (i) mean temperature distribution in 2030–2039; (j) runoff-flow rate, (k) precipitation, and (l) mean temperature distribution in 2040–2050.
Atmosphere 14 01237 g010
Figure 11. Statistics of water use in the JRB: (a) surface water supply and (b) water consumption.
Atmosphere 14 01237 g011
Table 1. LUCC area statistics in the JRB during different periods.
YearArea (km2)Area Ratio (%)
1234512345
201818,224458820,671176118440.6410.2346.100.392.64
202518,168472820,475176129640.5110.5445.660.392.89
203518,054487720,433176130340.2610.8845.570.392.91
204518,062488520,428149131940.2810.8945.550.332.94
1–5 represent farmland, forest land, grassland, water, and urban land, respectively.
Table 2. Analysis of the future relationship between precipitation and runoff-flow rate changes.
SceneP (mm)R (m3/s)ΔP (mm)ΔR (m3/s)ΔR/ΔP (m3/(mm·s))
RCP2.6505.245.8030.89.580.31
RCP6.0515.245.7740.89.550.23
RCP8.5521.950.3647.514.140.30
P and R represent precipitation and runoff-flow rate, respectively.
Table 3. Discrete characteristics of hydrometeorological elements in different periods under different climate scenarios.
Climate ScenariosPeriodsR (m3/s)P (mm)Mean Temperature (°C)
KCvKCvKCv
RCP2.62020–20504.920.372.040.161.260.06
2020–20292.640.361.650.141.130.03
2030–20394.100.461.490.111.170.06
2040–20503.000.321.680.171.260.06
RCP4.52020–20508.530.431.940.161.390.08
2020–20294.930.431.630.141.280.07
2030–20392.740.321.480.151.190.06
2040–20503.940.401.680.161.350.08
RCP6.02020–205013.410.632.440.201.340.07
2020–20292.490.331.460.131.320.09
2030–20396.260.611.870.211.290.09
2040–20505.450.611.910.201.180.04
RCP8.52020–205010.340.562.350.221.320.08
2020–20294.220.421.870.181.160.05
2030–20396.150.511.780.211.210.06
2040–20506.940.732.350.261.170.04
K is the extreme value ratio and Cv is the coefficient of variation.
Table 4. Quantitative identification of the contribution rates of future climate change and LUCC to runoff.
Scene A1R (m3/s)Climate Contribution Rate (%)Scene A2R (m3/s)LUCC Contribution Rate (%)
RCP2.645.80−8.06RCP2.646.38+1.27
RCP4.536.22−27.30RCP4.536.81+1.64
RCP6.045.77−8.12RCP6.046.29+1.14
RCP8.550.36+1.10RCP8.551.04+1.35
A1 is the rate of change compared with the baseline period, which reflects the impact of climate change on runoff change; A2 is the rate of change compared with A1, which reflects the impact of LUCC on runoff change.
Disclaimer/Publisher’s Note: The statements, opinions and data contained in all publications are solely those of the individual author(s) and contributor(s) and not of MDPI and/or the editor(s). MDPI and/or the editor(s) disclaim responsibility for any injury to people or property resulting from any ideas, methods, instructions or products referred to in the content.

