Abstract
High temperatures and air pollution exposure are individually known risks to human health, with amplifying adverse health effects during periods of co-exposure. This study compared co-occurring individual-level exposures to particulate matter (PM5, aerodynamic diameter of ≤5 μm) and heat among women in residential and agricultural settings in Guatemala. We measured personal and ambient exposure to PM5, temperature, and humidity among 21 female sugarcane workers in the fields and on their off days. We measured similar exposures among a group of 30 community members not involved in sugarcane work. We collected 171 personal PM5 measurements across 18 sampling days. The median workday personal PM5 concentration was 271 µg/m3, which was 3.6-fold higher than ambient area levels in the fields. The median personal PM5 concentration was 95.8 µg/m3 for off-work days and 83.5 µg/m3 for community days. The average workday individual-level temperature and humidity were 39.4 °C and 82.4%, respectively, with significantly lower temperatures on off-work and community days. The women workers and community members were exposed to high levels of PM5 and heat in both occupational and residential settings. Research needs to consider individual-level exposures at both work and home to help tailor more effective comprehensive prevention efforts to reduce risks.
1. Introduction
Extreme heat events and air pollution episodes are becoming more frequent with climate change, and these exposures continue to threaten human health [1,2]. Specific populations and regions are differentially impacted by climate and environmental hazards based on geography, residence, employment, health status, sociodemographic factors, and other social determinants of health [3]. For instance, workers and rural populations in tropical and sub-tropical low- and middle-income countries are likely to experience exposure to air pollution from sources such as transportation emissions, heating with solid fuels including biomass, burning waste, and agricultural practices such as burning [4]. Additionally, increasing ambient temperatures pose a disproportionate threat to these same populations where seasonal heat is already very high [5,6,7]. Moreover, these exposures likely co-exist. Another region experiencing increasing exposures is in the western U.S., where heat waves coupled with wildfires have increased in frequency and have been shown to have both individual and synergistic effects on daily cardiorespiratory hospitalizations in California [8]. Understanding potential vulnerability and adaptations to these climate hazards requires individual-level concurrent exposure measurements.
Workers across various industries, specifically agriculture, wildland firefighters, construction, and transportation, are at an increased risk for exposures at work, including poor air quality and high temperatures, including in the U.S. and Latin America [9,10]. Laboring in hot conditions increases heat stress, which increases the risk of heat-related illnesses, including cramps, syncope, exhaustion, and even death from exertional heat stroke [11]. In addition to heat-related illness, occupational heat stress has been associated with an increased risk of acute kidney injury and chronic kidney disease of unknown etiology (CKDu) [12,13]. Epidemics of CKDu are occurring in hot, rural agricultural communities along the Pacific Coast of Latin America, India, Sri Lanka, India, and Mexico [14,15,16].
Sugarcane workers in agricultural communities across Latin America have been identified as one of the occupational populations at high risk of CKDu [17,18,19]. In many of the countries, sugarcane fields are burned prior to harvesting cane to remove foliage and facilitate cutting. Workers re-suspend soil and/or ash while cutting and seeding cane, and they can be in the fields while neighboring fields are being burned. From our previous pilot study, we observed that sugarcane workers experience daily exposure to particulate matter (PM), soil, and ash containing silica, metals, and other potential nephrotoxins at elevated levels throughout the six-month sugarcane harvest [20]. In addition to the occupational exposure to high levels of PM, living conditions in rural settings in Latin America are also conducive to increased PM exposures. The majority of households cook with solid fuels, such as wood or other biomass, which are typically burned indoors or immediately adjacent to living quarters using a three-stone open fire, making cooking an important source of household and community air pollution exposure [21]. In Guatemala, women spend on average five hours per day cooking, and previous investigations reported average indoor PM10 (median diameter ≤ 10 µm) and PM2.5 (≤2.5 µm) concentrations of 717 μg/m3 and 528 μg/m3, respectively [22,23]. While there are several studies examining household PM exposures in this region [21,22,24,25,26,27], there are few studies in which personal exposure to PM has been characterized in the agricultural occupational setting, or studied in tandem with household exposure. Recent literature suggests that exposure to high temperatures in tandem with environmental exposures, such as airborne PM and its constituents, contribute to the high prevalence of CKDu observed in these countries [20]. PM has the potential to penetrate the circulatory system, then reach the nephrons and be taken up by renal tubular cells, which could potentially damage renal function [28]. Heat stress and dehydration might produce further adverse effects on renal function.
Given the potential for high exposure to both heat and PM among women in Latin America, an understudied population at-risk of CKDu, we conducted a pilot study to characterize co-exposure among female sugarcane workers and female community members, not currently involved in sugarcane work, living in communities next to sugarcane fields in southwest Guatemala. We prospectively evaluated exposure to PM with a 50% cut point (d50) of 5 µm (PM5) by collecting repeated personal breathing zone air samples in the sugarcane fields and during everyday activities in the household setting while simultaneously monitoring individual-level exposures to ambient temperature and humidity. We present details of our study design, data collection methods, and a characterization of occupational and residential exposures for female sugarcane workers and a comparison group of female community members. The objective of this research was to use a comprehensive approach to assess work plus non-work exposures to both PM and heat across time in order to characterize exposures that may be contributing to acute and chronic kidney injury. To do this, we examined and compared three exposure scenarios: (1) workday field exposures for female sugarcane workers, (2) off-work day exposures for the workers, and (3) community and household exposures for female community members. This women-focused study will advance the understanding of individual-level exposures to heat and potential airborne nephrotoxicants in the environment among female workers and contribute to development of workplace policies to protect their health. This current work characterizing exposures is part of a larger longitudinal study investigating occupational and non-occupational exposures and kidney health among females in Guatemala in which the community members may be the most relevant comparison group for evaluating potential exposure-related kidney effects.
2. Methods
2.1. Study Population and Design
We conducted a longitudinal study across two six-month sugarcane harvest seasons (2021–2022 and 2022–2023) in collaboration with a large sugarcane agribusiness in southwest Guatemala. This study was developed and conducted through a long-standing collaborative partnership with the company and its clinical staff under a memorandum of understanding with the University of Colorado. We collected repeat personal measures of PM5 and individual-level ambient temperature and humidity among female sugarcane workers and female members of communities within ~10 km from sugarcane fields who did not currently work in the sugarcane industry. The workers were employed as seeders and their main tasks included carrying, planting, and covering cane seeds (i.e., seeds are a cut segment of cane approximately 45 cm long). Workplace details have been previously described [12]. The workers wear long-sleeved shirts, hats, gloves, and boots, but no respiratory protection, while in the field seeding. They work six continuous days with one day off over the weekend and their typical work shift ranges from six to eight hours.
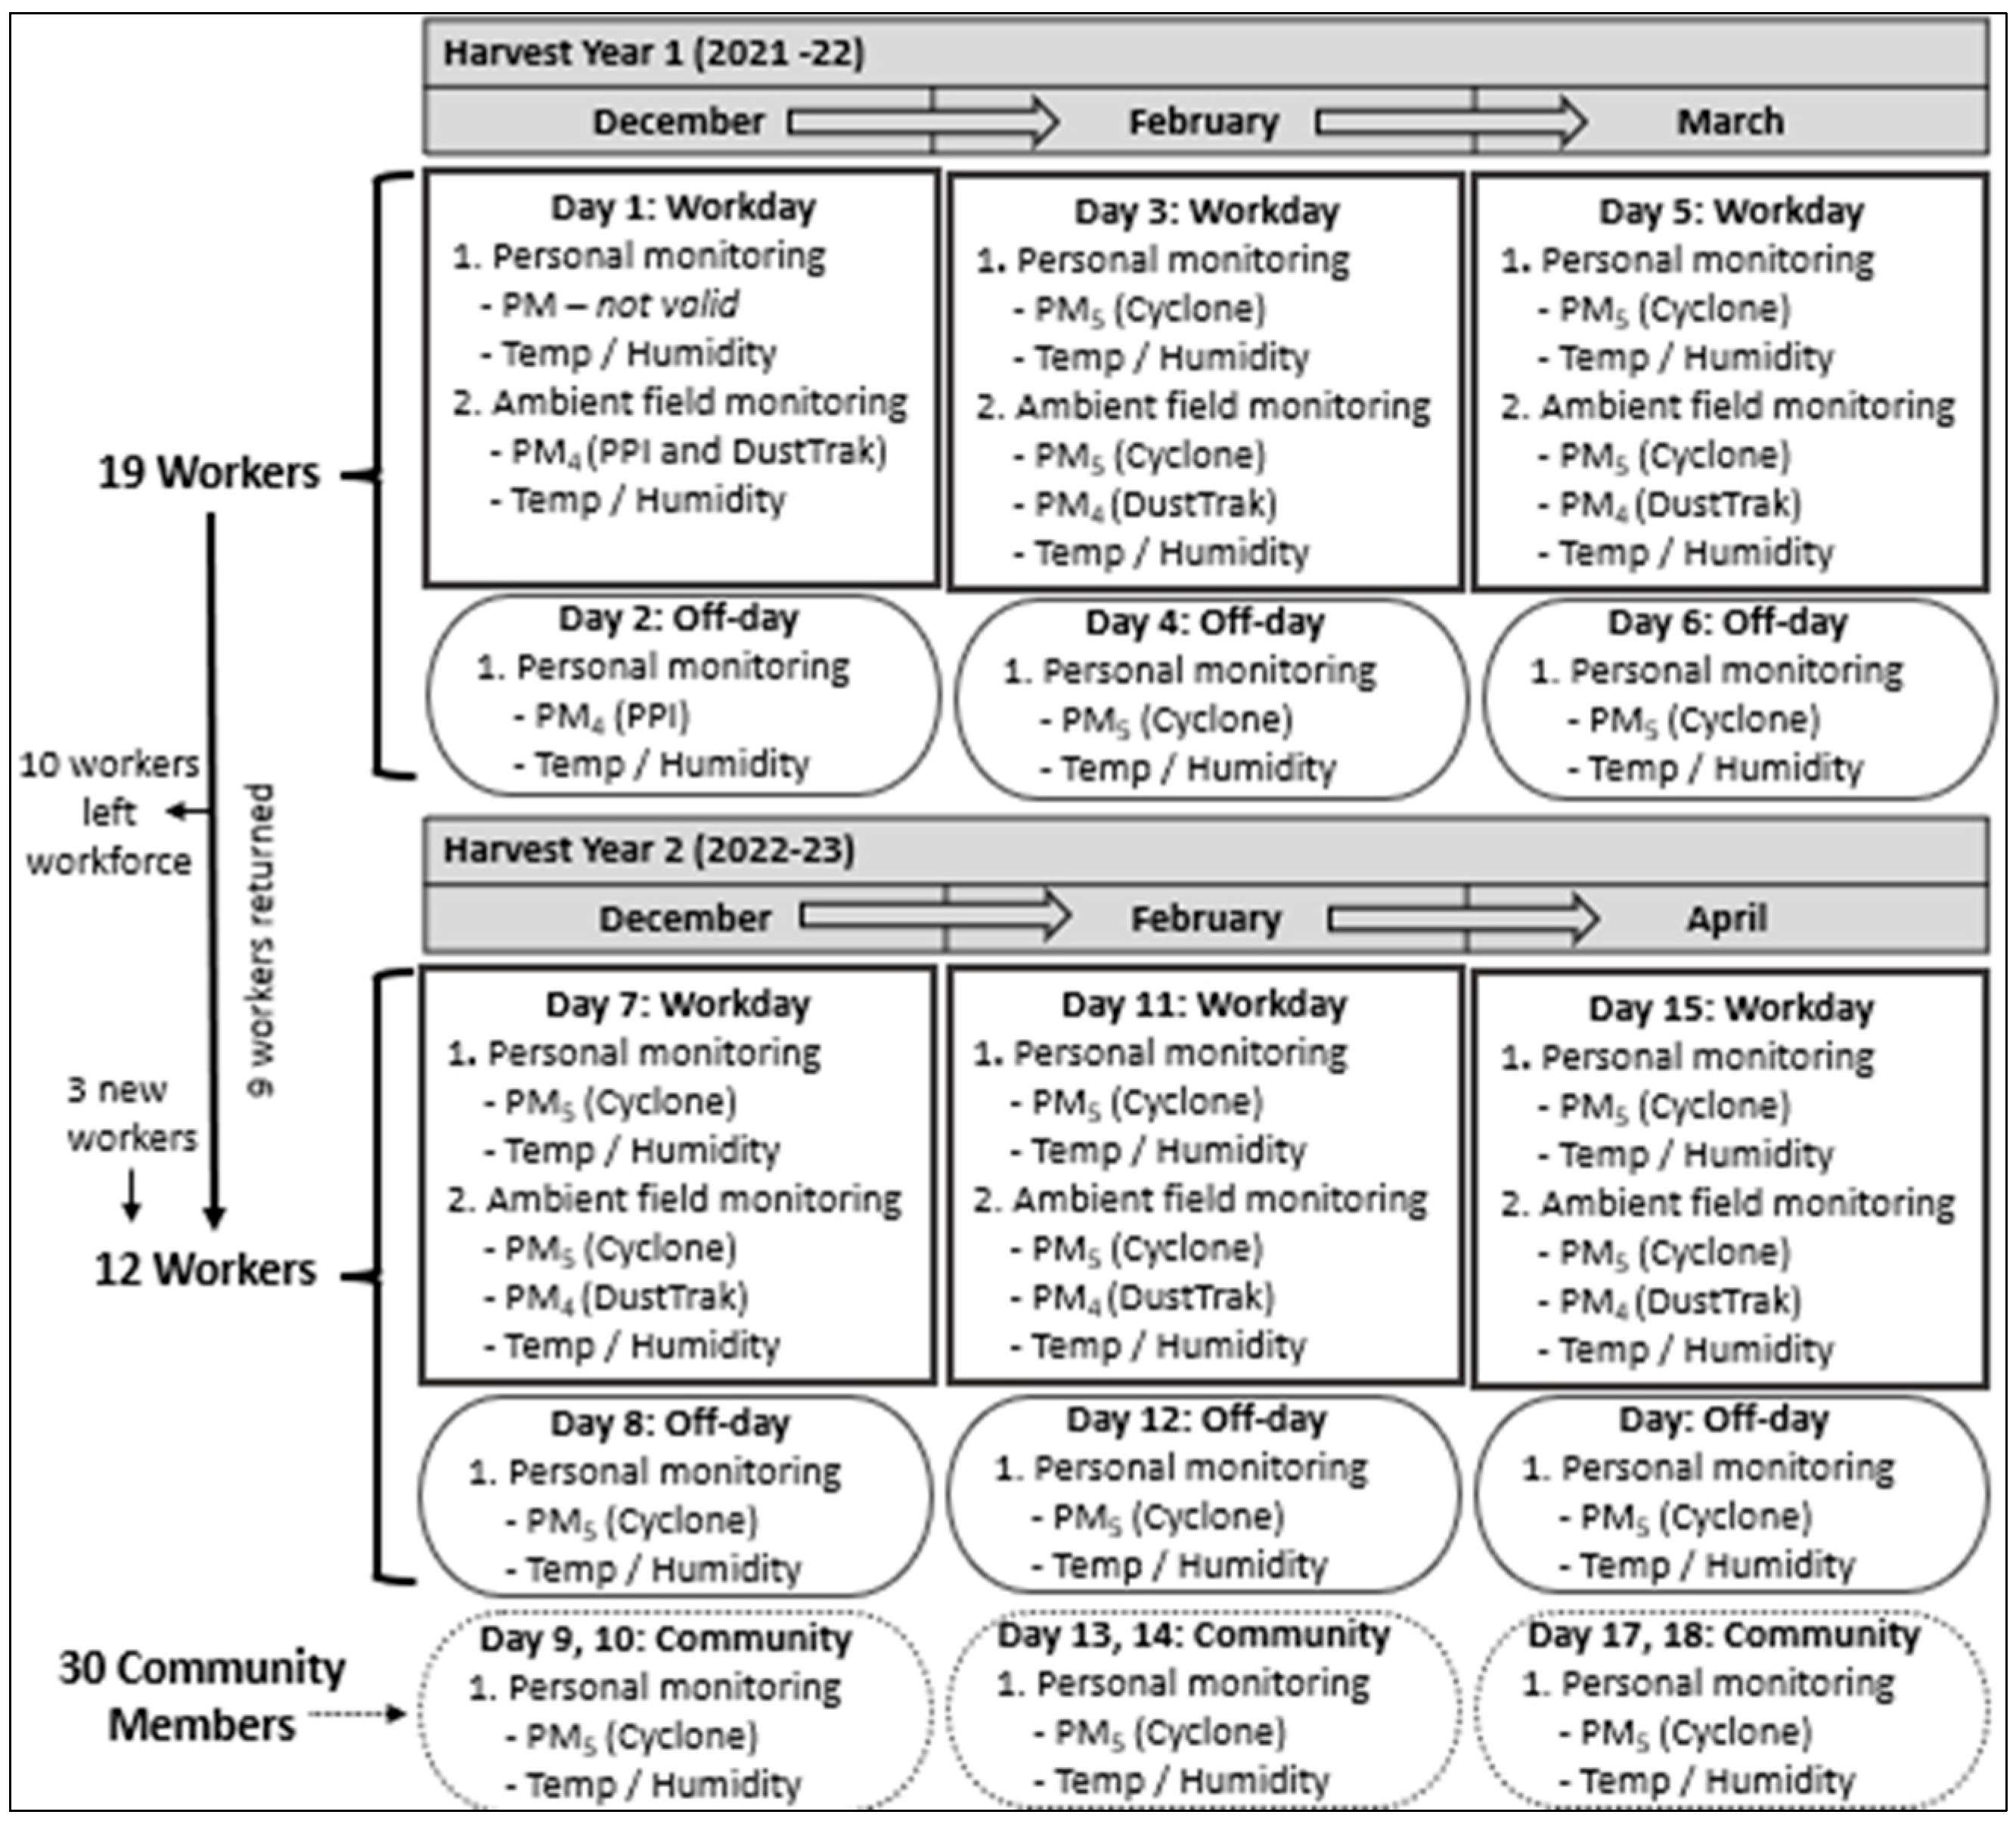
We recruited and consented all female workers (n = 21) who were employed as a seeder at the agribusiness as of December 2021 or December 2022, see Figure 1. Workers either participated in one or two seasons depending on their employment duration. The harvest season starts in late November and lasts through April. The women started working the harvest one week prior to recruitment. We also recruited and consented 30 females from communities in the Departments of Escuintla and Suchitepéquez, where sugarcane is the predominate crop. The community members were recruited in December 2022 and participated during the second harvest season. Inclusion criteria for community members were that they did not currently work in the sugarcane industry and that they lived in a house with either a male sugarcane cutter (26 out of 30, 87%) or lived in the same neighborhood as another participating female member (4 out of 30, 13%). All participants were ≥18 years of age and reported not being pregnant. Signed informed consent was obtained from all participants. The study was approved by the Colorado Multiple Institution Review Board (COMIRB) and in Guatemala by ZUGUEME Comité Ética Independiente.
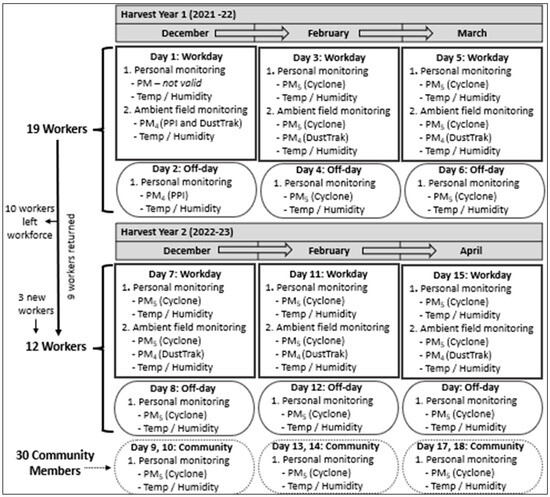
Figure 1.
Study design and data collection details for 18 sampling days during the two harvest seasons. Workers were monitored one workday and one off-work day per month. Community members were each monitored one day per month in two distinct groups.
We measured personal and ambient PM5 and individual- and field-level temperature and relative humidity across six sampling sessions on 18 sampling days over the two harvest seasons. The 18 sampling days comprised of the following: (1) six workdays for the workers in the sugarcane fields (three workdays per harvest), (2) six off-work days for the workers during the same week as work sampling days (three days per harvest), and (3) six sampling days for the community members during the second harvest (up to three days per community member). The worker’s off-work days and the community member sampling days were comprised of daily activities in the household and community settings. There were 21 workers (41%) and 30 community members (59%), and their ages ranged from 19 to 60 years (mean: 36, standard deviation (SD): 11). This study’s design sought to increase the understanding of total exposure to PM and heat in female sugarcane workers during their work and rest days as well as a group of community members’ exposures experienced while living in areas nearby sugarcane fields.
2.2. Particulate Matter Measurement
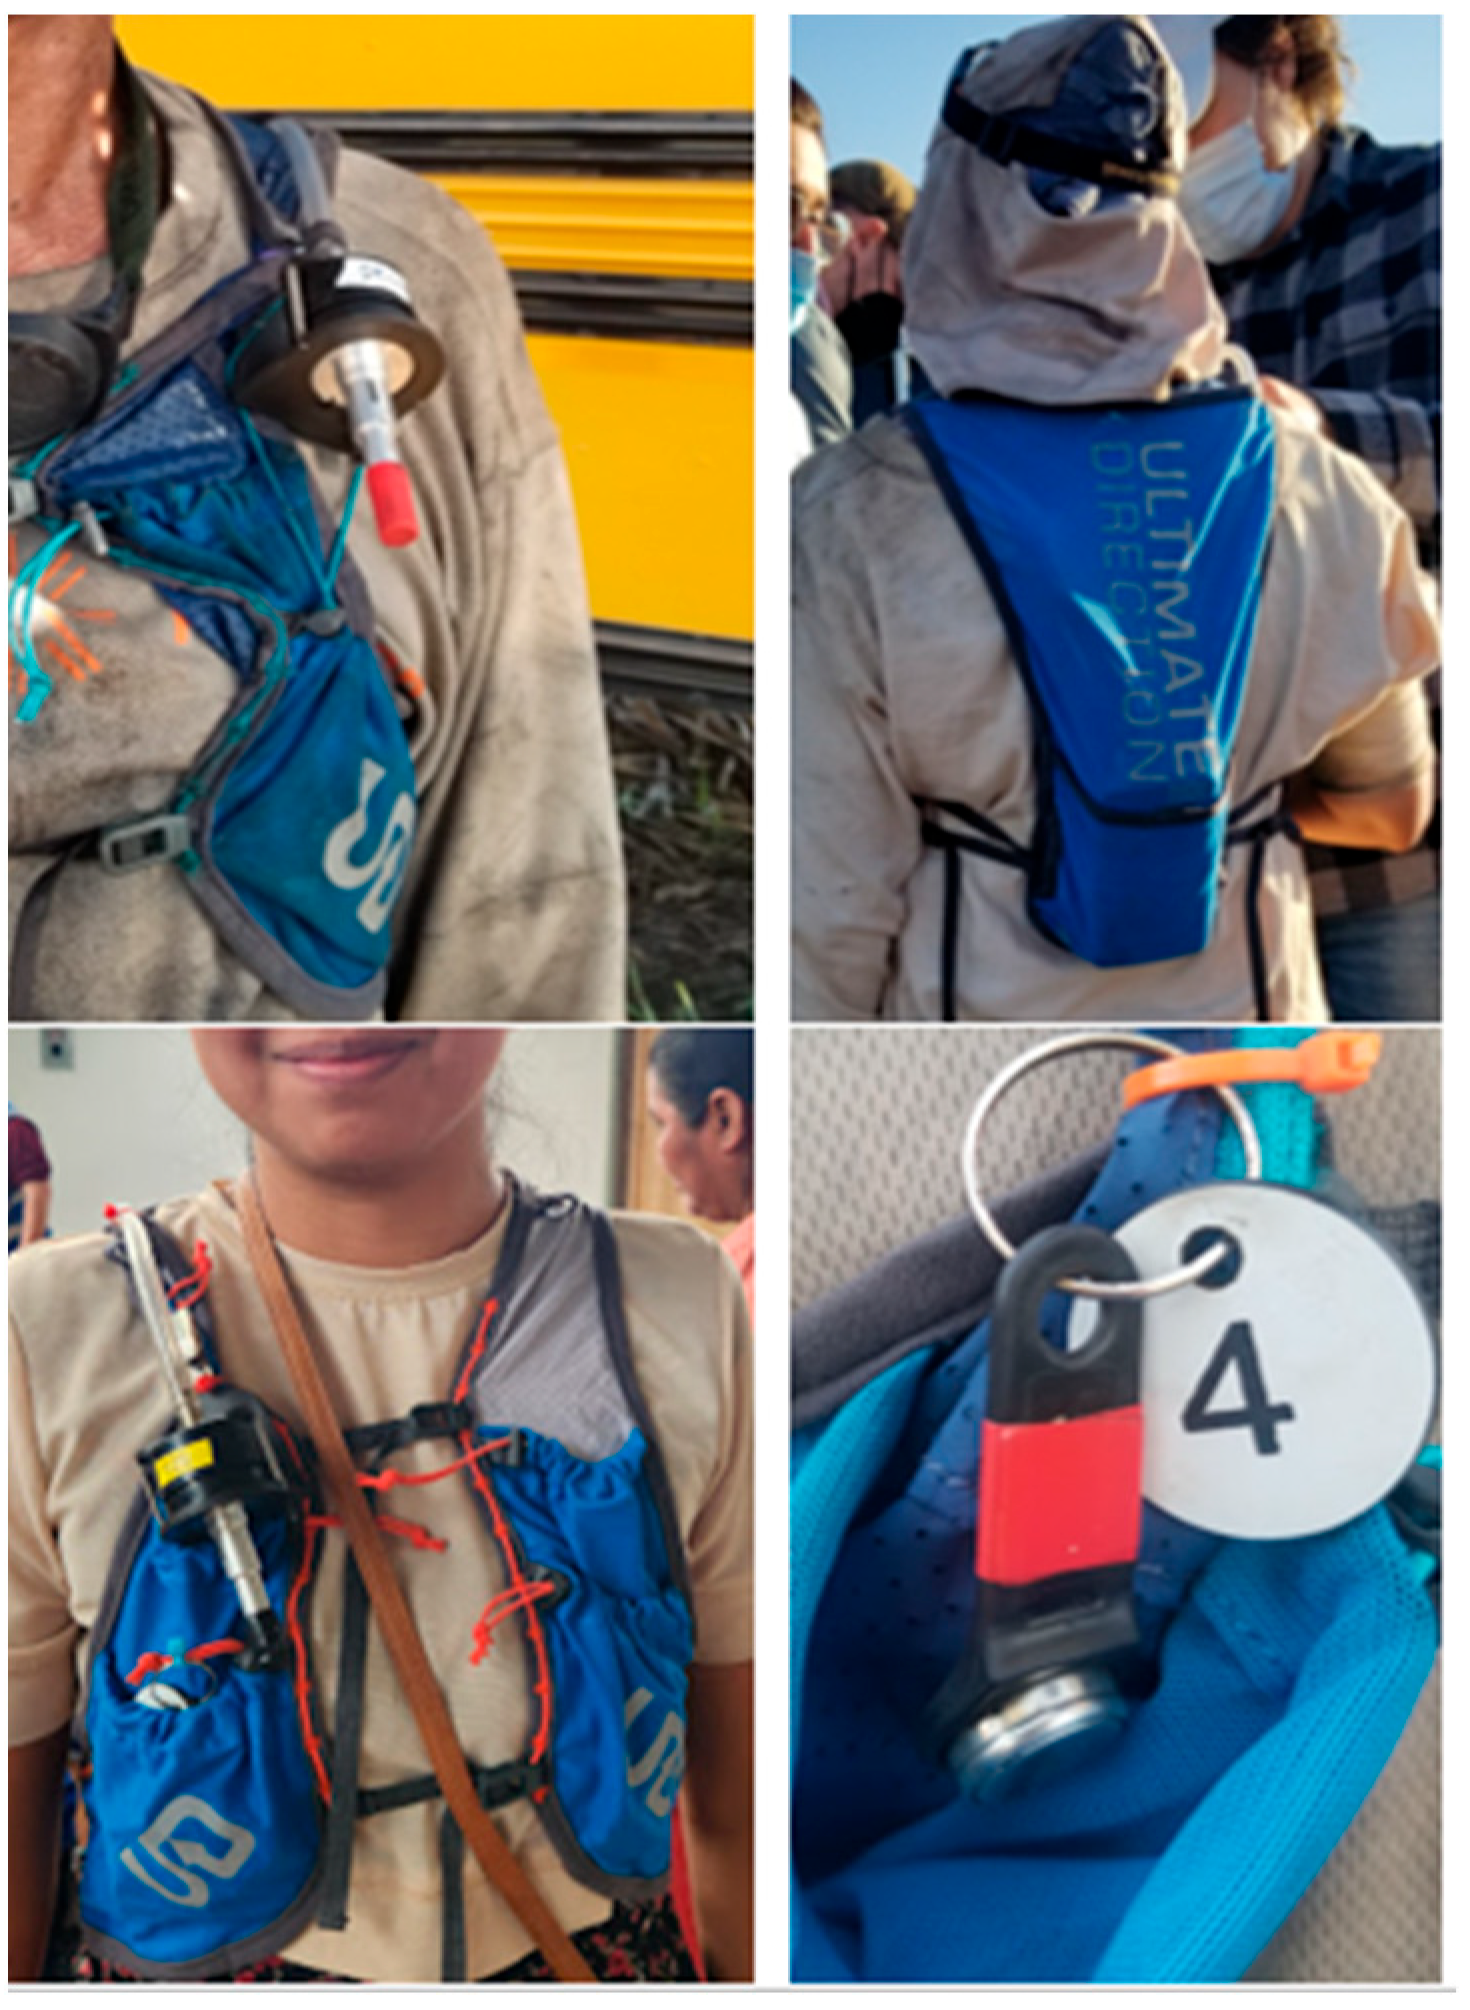
Details of our sampling approach are described in Adgate et al. (2024) [29] and are briefly summarized here. Each participant was outfitted with a size-selective sampling train. The sampling period was approximately 4 h (half a work shift) for the workdays and approximately 6 to 8 h for the worker’s off-work days and on the community member sampling days (~8 a.m. to ~3 p.m.). Study personnel integrated air sampling systems into a lightweight, breathable vest (Ultimate Direction, Model V2, Broomfield, CO, USA) to ensure the samplers and sampling trains (connected via tubing) were securely attached near the breathing zone of the participants (Figure 2). During workday sampling, research assistants were in the field with the workers to troubleshoot pump issues if necessary.
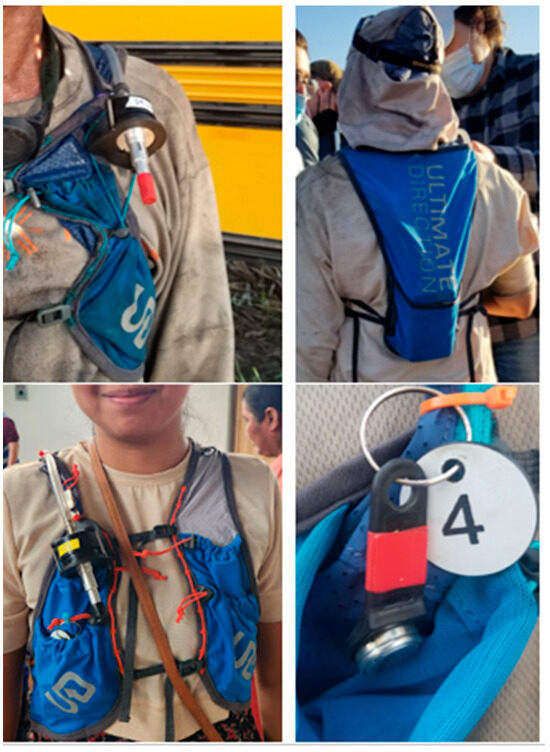
Figure 2.
Left top picture shows the sampler set-up and vest from the front of a worker with tubing, cassette, and cyclone inlet. The right top picture shows the pump location in a pocket on the back of the vest. The left bottom picture shows the sampler set-up and vest on a community member. The right bottom is the iButton logger zip-tied to the front of the vest.
Two types of personal sampling inlets were deployed during this study. Initially, sampling trains were fitted with an XR5000 sampling pump attached to a SKC respirable parallel particle impactor (PPI) (SKC Inc., Eighty-Four, PA, USA) loaded with a 37-mm (mm) 5.0 μm pore size polyvinyl chloride filter (PVC, SKC Model 225-5-37). However, our first study workday samples (December 2021) were not valid due to overloading of the impaction plates. Given the large contribution of coarse particles to the exposure, we switched to a SKC aluminum Cyclone sampler (Model 225-01-02, Eighty-Four, PA, USA) to address the overloading issue. By design, cyclone samplers use centrifugal force to segregate larger particles (i.e., non-respirable) into a small receptacle that is away from the filter instead of impaction plates directly downstream of the inlet that are more susceptible to overloading from large non-respirable particles in this environment. These samplers were also loaded with a 37-mm pore size of 5.0 μm polyvinyl chloride filter (PVC, SKC Model 225-5-37). The cyclone samplers were used for all subsequent work, off-work, and community measurements. To protect against overloading the cyclone samplers, we reduced the duration of sampling to 4 h for each workday. For the first harvest, workers were randomly assigned to either the first 4-h the work shift (morning) or after a 4-h delay (afternoon). During the second harvest we only sampled during the mornings on workdays due to shortened shift durations that could not accommodate a second 4-h measurement. Sampling trains were calibrated to 4 L/min for PPI samplers and 2 L/min for cyclone samplers. While the PPI samplers collected respirable PM (i.e., those particles with a 50% cut point of 4 µm), the proposed study size fraction to measure occupational PM exposure, the inlet efficiency of these cyclone samplers at 2 L/min has been reported to be 50% for particles 5 µm in diameter (PM5).
Full shift (~8 h) ambient particulate matter samples were collected during workdays with a stationary PPI measuring PM4 (December 2021) and cyclone measuring PM5 (February 2022–April 2023). These samples were co-located with a DustTrak DRX Aerosol Monitor (TSI, Shoreview, MN, USA) measuring real-time PM4. Ambient samplers and the DustTrak monitor were placed on a table approximately 1 m off the ground in the field near the workers for the duration of the work shift.
2.3. Heat Exposure Monitoring
We collected individual-level exposure to heat using a wireless iButton sensor (Hygrochron™, model DS1923, Maxim Integrated, San Jose, CA, USA) affixed to a key fob attached to the front of the marathon vest (Figure 2) to avoid direct sunlight, which can cause higher temperatures, and to prevent it from getting covered in dust [30]. The iButtons measured each participant’s individual-level ambient temperature and relative humidity at 2-min intervals throughout the sampling period on work, off-work, and community sampling days. The iButtons have a range of −20 to 85 °C at a 0.5 °C resolution with a temperature precision of ±0.5 °C and timing precision of ±2 min per month. iButton thermometers were factory-calibrated using NIST standards [31].
We calculated individual-level average and maximum temperature and humidity measures during the entire work shift (~8 h) and during the entire sampling period for off-work days and community days (~6 to 8 h). We also calculated heat index using the National Oceanic and Atmospheric Administration (NOAA) Rothfusz equation [32]. Heat index was calculated at every 2-min interval based on the temperature and relative humidity and then heat index was summarized as daily average and maximum values. Heat index is a combination of temperature and humidity and is often used for heat advisories by the National Weather Service and by the U.S. Occupational Safety and Health Administration (OSHA) for assessing risk of heat-related illnesses. We compared the iButton heat index measures with OSHA’s established risk categories in degrees Fahrenheit [33].
In addition to individual-level heat monitoring, we collected field-level meteorological data during the entire work shift only on the study workdays. A Wet Bulb Globe Temperature (WBGT) meter (Kestrel 5400, Boothwyn, PA, USA) was placed in the same field where the participants were working to estimate field-level ambient temperature, relative humidity, and wind speed.
2.4. Lab Analyses
The PVC filters were weighed before and after each sampling event at Colorado State University using a Mettler MT5 Balance (Mettler-Toledo, Inc., Columbus, OH, USA) to determine collected sample mass. Prior to gravimetric analysis, filters were desiccated for at least 24 h and static neutralized with a U-electrode (Mettler-Toledo, Inc.). All gravimetric analysis was performed in a temperature and humidity-controlled environment. Time-weighted average concentrations were determined by dividing the mass on each filter by the volume of air sampled. Laboratory and field blank filters were used to correct for measurement error. PM results are presented in µg/m3.
2.5. Statistical Analysis
We characterized distributions of PM levels and heat metrics using descriptive statistics. The distributions of the workday concentrations, off-work concentrations, and community concentrations were skewed; thus, comparisons between the days were assessed using non-parametric Mann–Whitney Wilcoxon and Kruskal–Wallis tests. We compared PM 4-h sampling periods in the morning (n = 11) and afternoon (n = 11) from the two workdays during the first harvest (February and March 2022) and found no significant difference between the means of the morning and the afternoon sampling periods (p = 0.74), so we combined all 4-h workday sampling periods (Supplemental Table S1).
We examined correlations between the individual-level heat monitoring metrics (average and maximum for temperature, humidity, and heat index) and personal PM concentrations by work, off-work, and community sampling days. For this analysis, we calculated the individual-level heat metrics to coincide with the respective individual air monitoring duration. For example, on workdays, if the air measurement was for 4-h in the morning, we calculated individual average and maximum heat indices for the same 4-h period. All analyses were conducted in SAS version 9.4 (Cary, NC, USA).
3. Results
3.1. Particulate Matter Exposure
We obtained 171 personal PM5 measurements from the 51 participants (96% of 178 attempted). Four samples were not valid during off-work days during Year 1 and three samples were not valid during off-work days in Year 2. Of the 171 samples, 51 were collected across five workdays, 62 samples were collected across six off-work days for the workers, and 58 samples were collected across six community member days.
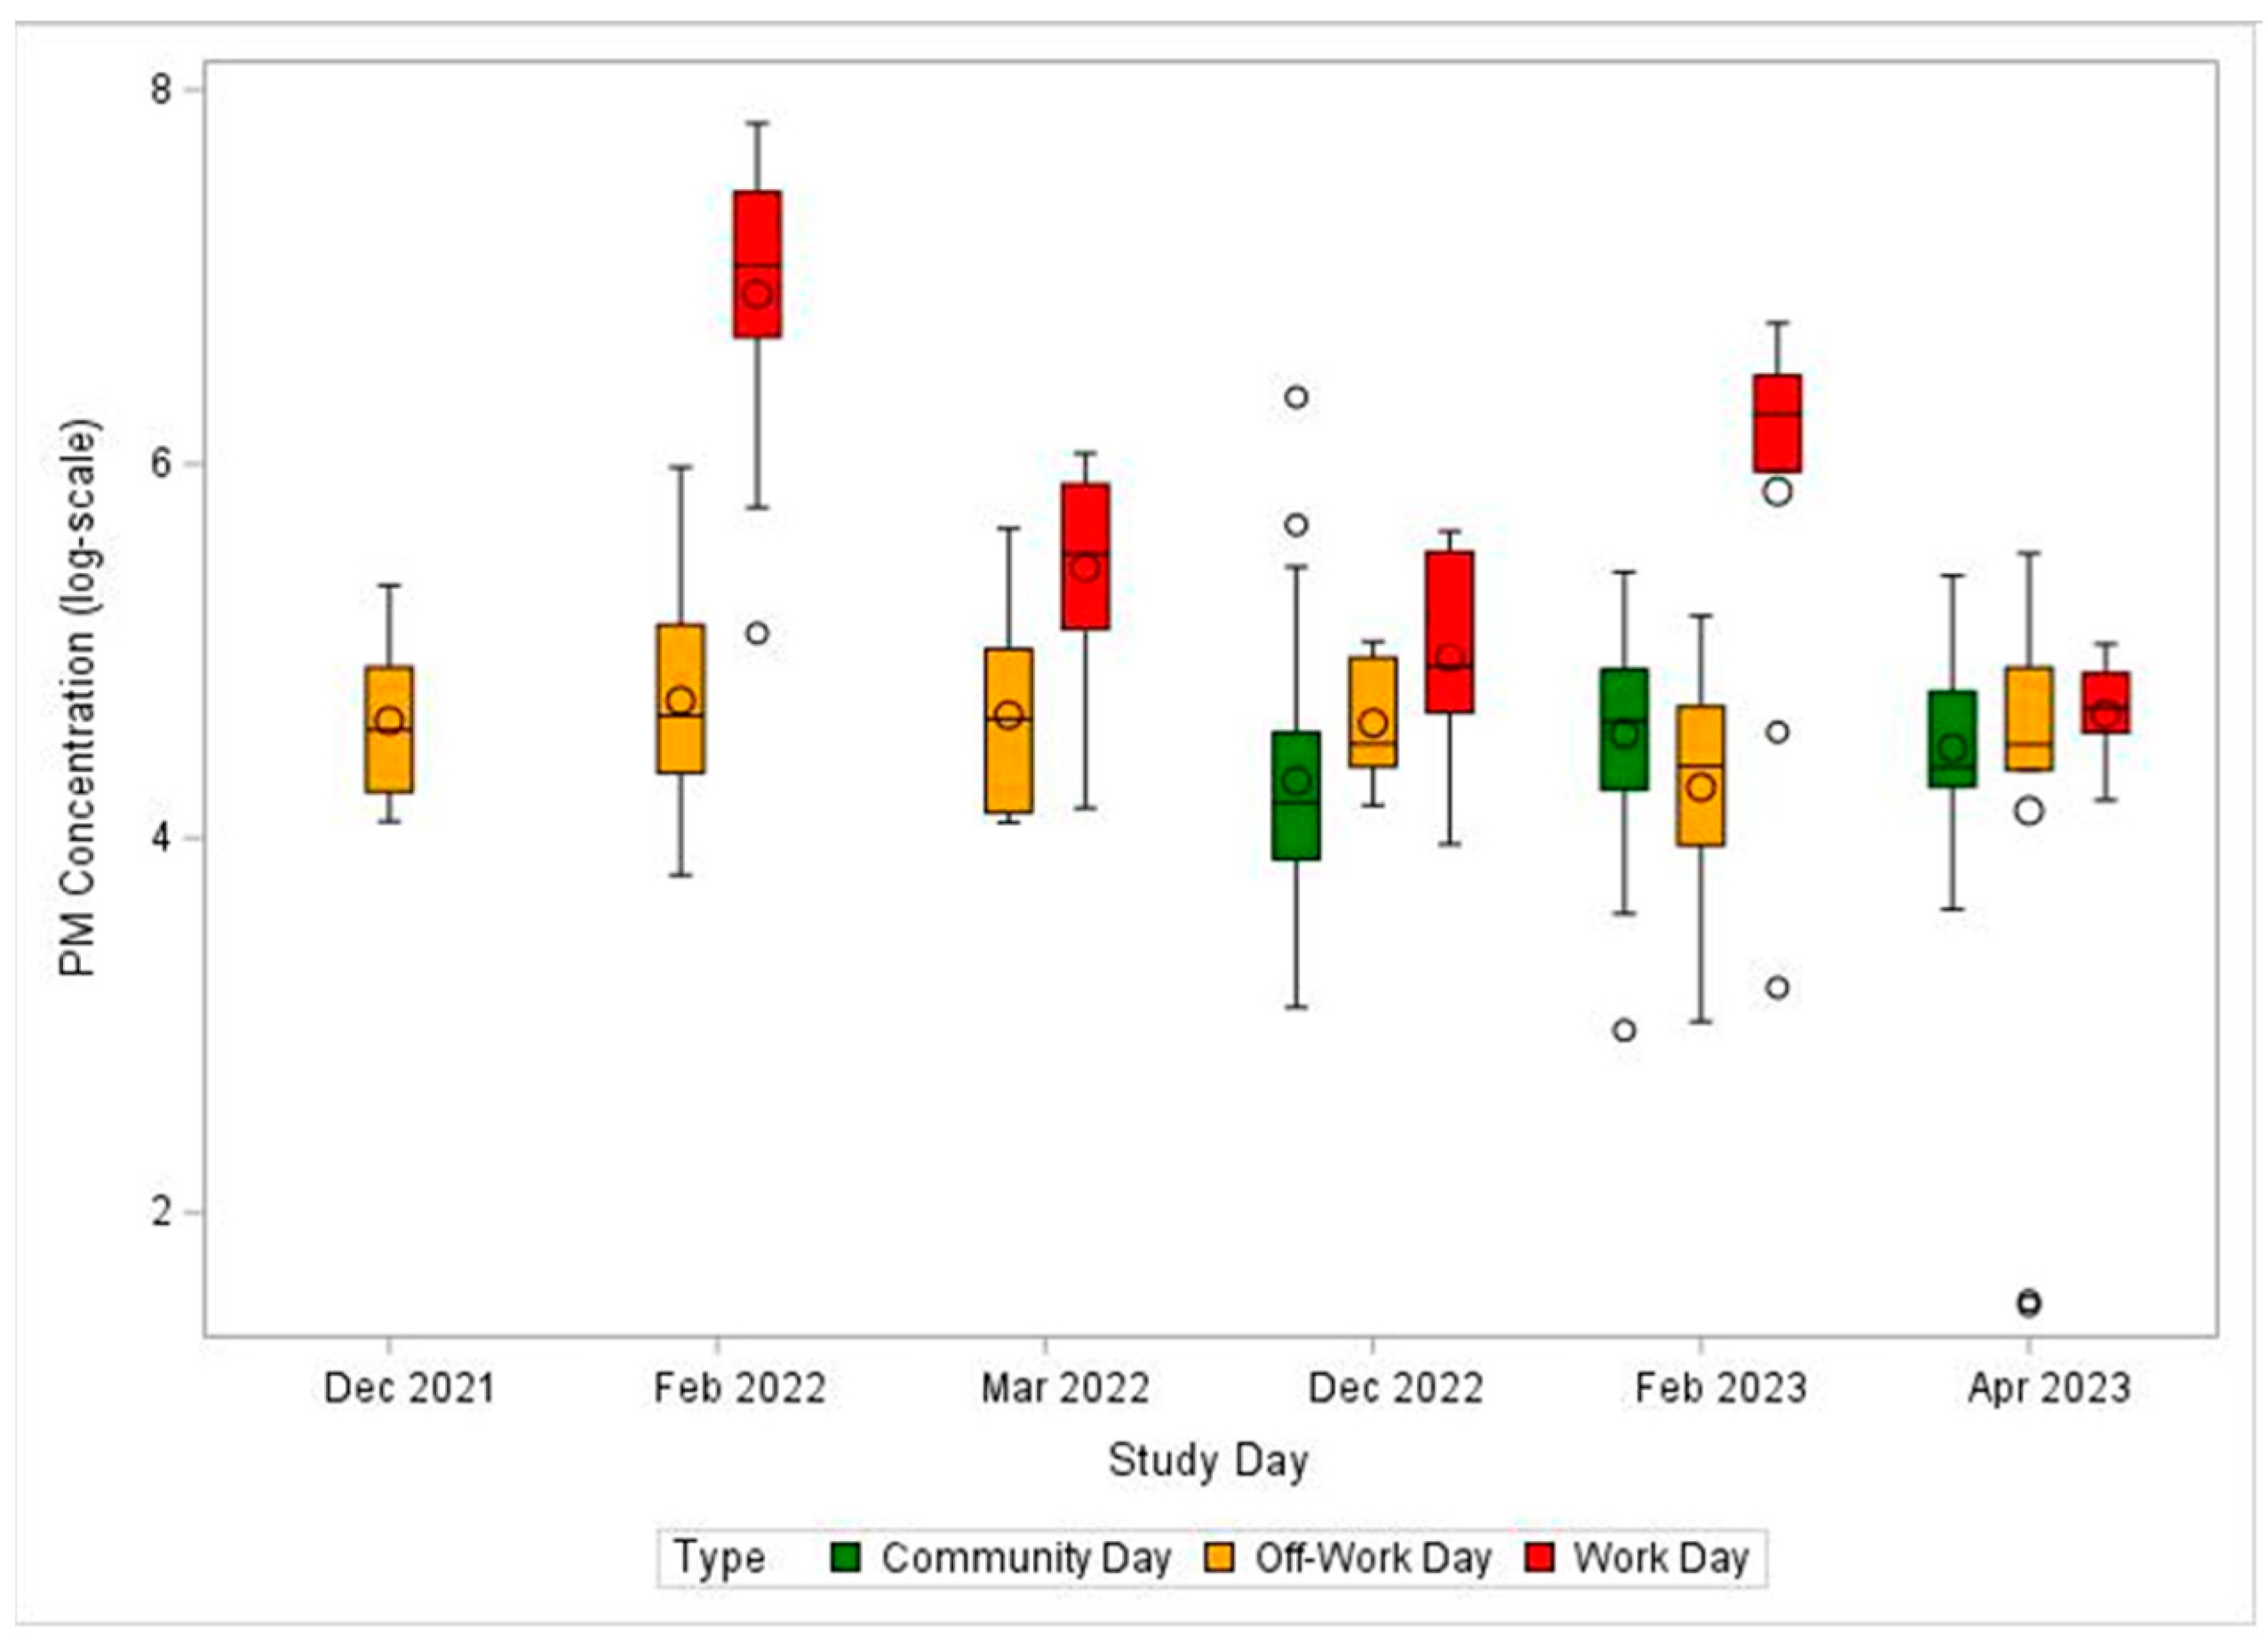
Personal breathing zone concentrations of PM5 during each sampling session are shown in Table 1. The distribution of mass concentrations by sampling month and day type are presented in Figure 3, and the distribution by sample year and day type are presented in Supplement Figure S1. Median personal PM5 concentrations were significantly higher on workdays compared to off-work days and community days despite having a shorter sampling period (271.7, 95.8, and 83.5 µg/m3, respectively, χ2 = 44.1, p ≤ 0.001, df = 2). Workday PM5 concentrations ranged from 24.5 to 2492 μg/m3, with a median value of 271.7 µg/m3. There was a significant difference between workday PM5 concentrations (χ2 = 25.3, p ≤ 0.001, df = 4). February 2022 and February 2023 had higher median workday concentrations (1167 and 526.2 µg/m3, respectively) compared to March 2022 (249.4 µg/m3), December 2022 (134.0 µg/m3), and April 2023 (110.3 µg/m3). It was noted that the study field on the workday in February 2022 had been recently plowed and was dry, and the field on the workday in March 2022 had recently been irrigated. Personal PM5 concentrations for the workers on their off-work days ranged from 4.5 to 396.3 μg/m3, with a median value of 95.8 μg/m3. The median concentration for community member sampling days was slightly lower at 83.5 μg/m3 with a range from 19.5 to 576.4 μg/m3.

Table 1.
Summary statistics for 171 personal PM5 (µg/m3) from 21 female sugarcane workers and 30 female community members at 6 sampling sessions across 2 harvest seasons.
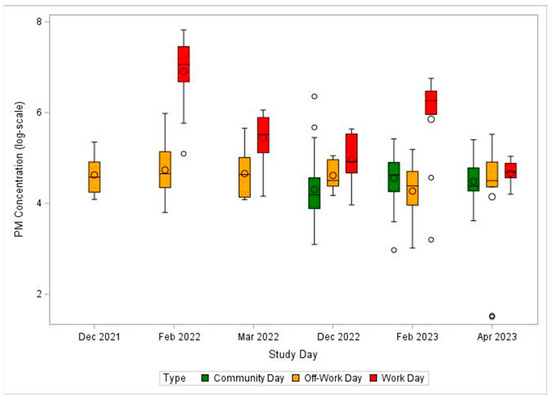
Figure 3.
Box plots of log-transformed personal particulate matter (PM5) measurements by sampling month and day type (community, off-work, and work) across two study harvest seasons. Workday samples were not valid in December 2021. Community days were only conducted during the second harvest.
The time weighted average ambient PM5 measurements on the workdays ranged from 63.59 to 195.3 µg/m3 (Table 2). The mean ambient PM5 level was 3.6-fold lower than the mean personal PM5 level, with lower levels on four of the five workdays. The mean PM4 concentrations for ambient DustTrak samples ranged from 55–168 µg/m3.
Table 2.
Summary statistics for full work shift (~8 h) ambient PM5 measurements and field weather indices collected in the same field as the personal samples for female sugarcane workers across two harvest seasons.
3.2. Heat Exposure
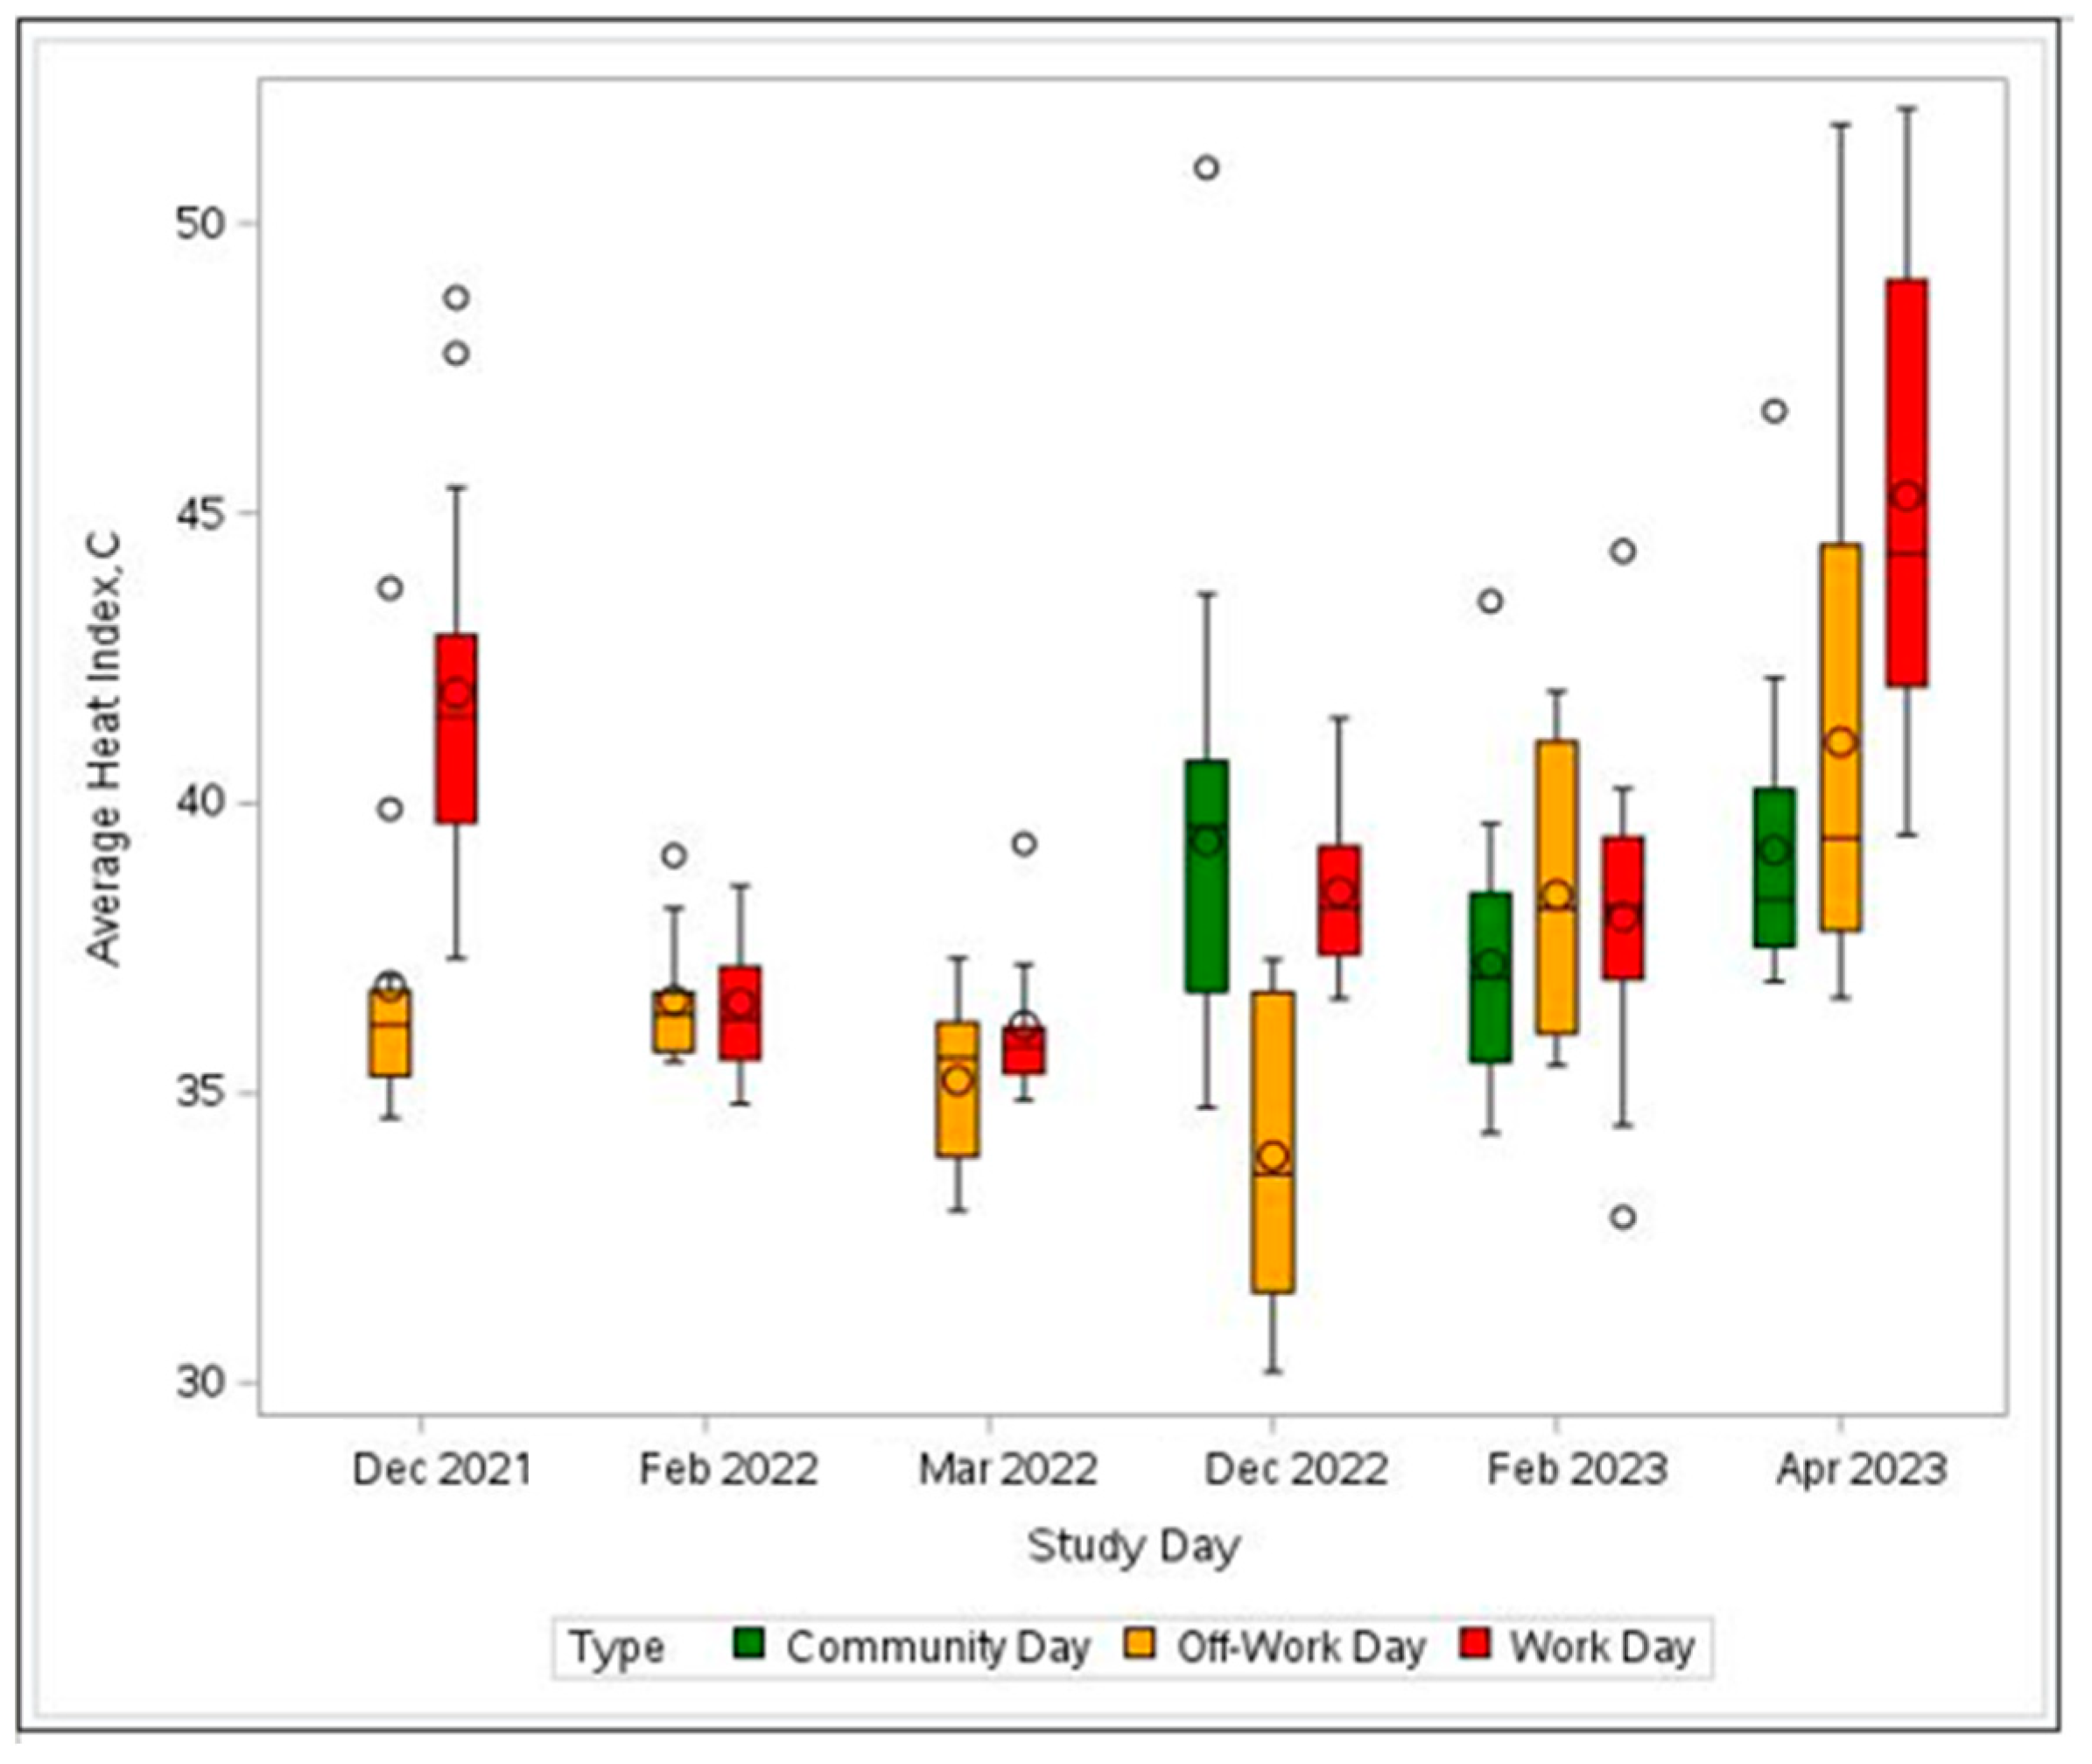
For all study days, the means of the individual-level average temperatures ranged from 30.8 °C to 35.3 °C, and the means of the individual maximum temperatures ranged from 36.4 °C to 43.3 °C (Table 3). The average heat index and maximum heat index were 39.4 °C and 53.6 °C (102.9 °F and 128.5 °F, respectively) for workdays, and 37.0 °C and 47.8 °C (98.6 °F and 118.0 °F, respectively) for the off-work days. For the community days, the average heat index was 38.6 °C (101.4 °F), and the maximum heat index was 51.3 °C (124.2 °F). The distribution of heat index levels by sampling month and day type are presented in Figure 4. Box plot figures of the distributions for temperature and humidity are presented in the Supplemental Figures S2 and S3. All individual-level heat exposure indices were significantly different between the types of days (average heat index: χ2 = 13.7, p = 0.001; maximum heat index: χ2 = 13.7, p = 0.001; maximum temperature: χ2 = 45.4, p < 0.001; average temperature: χ2 = 13.6, p = 0.001; maximum humidity: χ2 = 17.4, p < 0.001; and average humidity: χ2 = 20.7, p < 0.001), Table 3. Workdays had significantly higher heat indices compared to the off-days and community days, except for average humidity, which was higher on the community days. Furthermore, average individual-level temperatures were higher than the field-level temperatures on all five workdays, with two of the workdays having average individual-level temperatures 2.4 °C higher than the field temperatures. Individual-level humidity measures were higher than field humidity measures on two of the five workdays.
Table 3.
Summary statistics for personal heat exposure measurements from 21 female sugarcane workers and 30 female community members across the two harvest seasons.

Figure 4.
Box plots of average heat index levels by sampling month and day type (community, off-work, work) across two study harvest seasons. Community days were only conducted during the second harvest.
When comparing the observed individual maximum heat index levels to the U.S. OSHA heat index-based risk levels, 13 of the 18 sampling days (72%) were categorized as very high to extreme risk (Supplemental Table S2). All of the community days (n = 6/6), one-third of the off-work days for workers (n = 2/6), and almost all of the workdays (n = 5/6) were categorized as very high to extreme risk days.
Moderate negative correlations were found between both individual-level average and maximum humidity and PM5 on workdays (r = −0.54, r = −0.52 respectively, p < 0.001 for both). Additionally, moderate negative correlations were found for individual-level average and maximum heat index and PM5 on workdays (r = −0.46, r = −0.67, respectively, p < 0.001 for both). Therefore, as humidity and heat index increased, PM5 concentrations were observed to decrease on workdays. On the off-work days, there was a weak negative correlation between individual-level maximum temperature and PM5 (r = −0.27, p = 0.04). No correlations were observed between PM5 and any of the heat indices on the community sampling days. We observed fewer correlations on the off-work and community days, which may be due to varied tasks throughout the day, both indoors and outdoors.
4. Discussion
This research found that women in rural Guatemala are exposed to high levels of airborne PM5 and high heat index levels at the workplace as well as in the home environment when sugar harvesting is performed in the dry season. Workday personal PM5 measurements were significantly higher than personal PM5 measurements on the off-work days and community days. In addition, personal exposure measurements of PM5 and individual-level temperature were higher than ambient PM5 and field-level temperatures on workdays. Future occupational studies should be cautious in the interpretation of area measurements as estimates of personal exposure when examining exposure–response relationships. This study demonstrates the need to measure exposures in both occupational and non-occupational environments to better understand an individuals’ exposure risks in agricultural communities.
The workday personal PM5 measurements ranged from 24.5 to 2492 μg/m3, with a median value of 271.7 µg/m3. We observed that on workdays none of the workers were exposed to levels of PM exceeding the OSHA permissible exposure limit (PEL) for respirable particulates not otherwise regulated at 5 mg/m3 (OSHA, Code of Federal Regulations, Title 29). However, using this PEL is not relevant, especially since this guidance applies to particles that are inert or considered of “low toxicity”, [34] which reduces its applicability for this study given that amorphous silica and metals are known to be present [20].
We observed highly variable personal PM5 measurements between workdays despite worker seeding job tasks being consistent across workdays. PM5 concentration on the two February workdays during both harvest seasons were significantly higher than the three other workdays. One possible explanation for the variation is soil moisture differences between the sampling periods. Notably, we observed that the field where the workers were seeding in February 2022 was recently plowed and dry, while in March 2022, the study field had been recently irrigated. During seeding, which is usually performed after land preparation activities, particles are resuspended by wind and worker practices due to the soil structure loss during planting seed cane segments [35]. A recent study has shown that PM2.5 variability is linked to soil moisture in which low soil moisture contributes to elevated PM levels [36]. Another possible explanation for PM measurement variability is the sample location proximity to nearby dirt roads, which serve as byways for large trucks and heavy equipment. Large trucks on these roads generate substantial amounts of airborne dust. On the April 2023 workday, personal PM concentrations were relatively low and lower than the ambient PM concentration; however, personal heat index levels were high. It was noted by field research staff that several workers spent more time resting in the shade that day, potentially limiting personal PM exposure. Understanding the work behaviors and other factors that influence these variations in occupational exposure can help inform preventive measures to reduce PM and heat exposure.
For purposes of comparison, we researched but were unable to find other published occupational air pollution exposure assessment studies among manual field workers in similar field and climatic conditions. Several studies in the region have measured household air pollution in relation to cooking practices, mainly PM2.5 in woodstove using homes. Indoor PM2.5 concentrations in Guatemala are often higher [37] than the World Health Organization (WHO) air quality guideline for PM, which currently stands at 10 µg/m3 as an annual mean and 25 µg/m3 as a 24-h mean [38]. In a study among 49 rural Honduran women, mean 24-h personal PM2.5 concentrations, using methods similar to ours, were 60.2 ± 25.7 μg/m3 [24]. Another study in Honduras observed that traditional stove users in Honduras had mean personal 24-h PM2.5 concentrations of 126 μg/m3 [39]. Although our area and personal samples measured a slightly higher cut point (PM5), our measured concentrations were well above the WHO health-based guidelines. Another occupational air pollution exposure, wildfire-related PM, may be worthy of comparison. Wildfire smoke is a complex mixture of gases and particles from burning vegetation, and the smoke is made up of potentially toxic compounds. Our PM5 workday concentrations were higher than the Oregon OSHA wildfire smoke standard for PM2.5 at 35.5 μg/m3 (Air Quality Index, AQI, value of 101), and California’s standard at 55.5 μg/m3 (AQI value of 151) [40,41]. Of note, there is continuing discussion among the scientific community surrounding more health-relevant metrics for PM2.5 exposures beyond concentration.
Our data demonstrate that workers both at work and off-work, and community members, were exposed to high temperatures and humidity. Moreover, we observed that heat exposure was significantly higher on workdays compared to the off-work days with average individual maximum temperatures as high as 43.3 °C. OSHA has identified levels of risk based on the heat index, ranging from low risk to extreme risk, and all of our sampled days fall into the high or very high extreme categories based on the individual heat index maximum levels [33]. García-Trabanino et al. (2015) measured field temperature and humidity during similar work shift hours on six days in Nicaragua [42]. They observed mean heat index ranging from 98–111 °F. The mean average heat index for our current study ranged from 97.1 to 113.5 °F on the workdays. Heat indices meeting or exceeding 103 °F can lead to dangerous heat disorders, and other adverse health outcomes including kidney injury, with prolonged exposure and/or physical activity in the heat. In addition, the workers wear protective clothing and work in full sunshine during their work shift. In these scenarios, OSHA recommends providing access to adequate potable water, acclimatizing workers, and modifying work rest cycles based on established American Conference of Governmental Industrial Hygienists (ACGIH) guidelines [33,43]. ACGIH guidelines provide recommendations on work/rest schedules according to WBGT and workload categories (referred to as ‘metabolic work rates’) [44]. A modified work/rest cycle could potentially reduce PM exposure as noted above. The agribusiness where the workers were employed has already implemented a water, electrolytes, rest, and shade program to reduce heat stress among their workers. Details of this program have been previously published [45].
Limitations of the study include the relatively small number of participants in a targeted geographic area during the dry season, thus limiting generalizability of our findings. We also used convenience sampling for recruitment of the community women, and consequently, their exposures may not be representative of the population at large. Different sampling equipment was used in December 2021 (PPI) compared to the subsequent sessions (cyclone) although off-work PPI sampler measurements were not significantly different than subsequent off-work cyclone-based measurements. Due to the field conditions, only 4 h of sampling was conducted for each worker on their workdays; however, we were able to show that the morning and afternoon 4-h periods were similar, consistent with the observation that workers conducted the same tasks during the entire 8-h work shift. Variation in sample duration due to varying schedules and conditions may be a source of unrecognized bias. For example, workday sample duration was consistent except for March 2022 when afternoon rain cut our sampling time short, which may have resulted in lower PM concentrations. We acknowledge that sugarcane fieldwork involves a diverse range of tasks and field conditions, making it difficult to generalize findings from this study regarding potentially harmful PM exposures across an entire harvest season or to other agricultural environments. We originally planned to measure the respirable fraction (PM4); however, our results still demonstrate an occupational exposure to PM, which includes particles that will penetrate deep into the lungs. While PM2.5 and PM10 are more commonly used to measure environmental exposures, our goal was to compare these results to other similar occupational studies and occupational exposure regulatory limits.
This study included personal air and heat monitoring conducted during work and around the household among two female populations at risk for disproportionate exposure to climate hazards. Females are often considered to undertake less hazardous work compared to men; however, this study suggests that women’s’ exposure to PM and heat extremes should not be discounted in studies looking for exposure-related adverse health outcomes. We also observed that workers and community members had similar residential PM and heat exposure levels, suggesting that nearby community member residences are good proxies for exposures of female workers when they are off the job. By using personal exposure sampling methods, we can more accurately characterize exposures in the workplace and during performance of everyday household activities, and, in turn, more precisely assess exposure impacts on kidney health, which we will do in future studies. It is important to note that heat stress has been shown to exacerbate the effects of airborne pollutants, causing a multiplier negative effect on health [46,47,48]. Increasing our understanding of daily exposures to extreme heat and poor air quality can provide greater insight on the health effects of these co-existing exposures as well as other adverse effects including worker productivity and the effects on livelihoods in low socio-economic communities.
5. Conclusions
We monitored personal PM and heat exposures at work and at home and demonstrated elevated levels for women agricultural workers compared to area sampling levels and air quality benchmarks. We also demonstrated that the residential PM and heat exposures for community members are elevated compared to standard guidelines. These findings show that it is necessary to address both work and community air pollution, and heat exposures among women in future research and in the development of preventative strategies. In addition, our findings emphasize the need to estimate exposure using personal sampling measurements to better characterize and understand the impacts of combined exposures on populations at risk for adverse health outcomes, such as CKDu. Further studies considering the synergistic health effects of co-occurring heat and PM exposures are warranted. Research that considers individual exposures both at work and home can help tailor more effective comprehensive prevention efforts to reduce risks, thereby preventing disease for workers, their families, and their communities.
Supplementary Materials
The following supporting information can be downloaded at: https://www.mdpi.com/article/10.3390/atmos15101175/s1, Supplemental Table S1: Summary statistics for ~4-h personal particulate matter measurements (PM5 in µg/m3) from 14 female sugarcane workers for two workdays stratified by the morning (AM) or afternoon (PM) collection times for the sampling campaigns during the first study harvest season; Supplemental Table S2: Percentage of days meeting criteria for U.S. Occupational Safety and Health Administration heat index-based risk levels during the 18 sampling days across two harvest seasons Supplemental Figure S1: Box plots of personal PM5 measurements (µg/m3); Supplemental Figure S2: Box plots of average temperature by sampling month and day type (community, off-work, work) across two study harvest seasons. Community sampling days occurred only during the 2nd harvest; Supplemental Figure S3: Box plots of average relative humidity by sampling month and day type (community, off-work, work) across two study harvest seasons. Community sampling days occurred only during the 2nd harvest.
Author Contributions
J.B.-D., G.E., K.A.J., J.W.S., L.S.N. and J.L.A. contributed to project conception, experimental design, data acquisition, and interpretation; J.B.-D., L.K., G.E., D.J., L.C., J.S., C.C., K.V.H., S.B. and M.D. contributed to sample collection, experimental design, data acquisition, and data analysis; A.C. and D.P. contributed to project conception and experimental design. All authors have read and agreed to the published version of the manuscript.
Funding
This work was funded with support from the National Institute of Environmental Health Sciences of the National Institutes of Health (NIEHS K01 ES032015 and R01 ES031585). It was also supported by resources from Pantaleon under a memorandum of understanding with the University of Colorado. Funders had no role in data analysis, interpretation of data, writing the manuscript, or the decision to submit the findings for publication.
Institutional Review Board Statement
The study was conducted according to the guidelines of the Declaration of Helsinki and approved by the Colorado Multiple Institution Review Board (COMIRB, #20-3083) and in Guatemala by ZUGUEME Comité Ética Independiente.
Informed Consent Statement
Signed informed consent was obtained from all participants.
Data Availability Statement
The data presented in this study are available on request from the corresponding author.
Acknowledgments
We wish to thank our Guatemalan collaborators, including all the participating women who have made this work possible.
Conflicts of Interest
The authors declare no conflicts of interest.
References
- Sarofim, M.C.; Saha, S.; Hawkin, M.D.; Mills, D.M.; Hess, J.; Horton, R.; Kinney, P.; Schwartz, J.; St, J.A. Ch. 2: Temperature-Related Death and Illness. In The Impacts of Climate Change on Human Health in the United States: A Scientific Assessment; U.S. Global Change Research Program: Washington, DC, USA, 2016. [Google Scholar] [CrossRef]
- Reidmiller, D.R.; Avery, C.W.; Easterling, D.R.; Kunkel, K.E.; Lewis, K.L.M.; Maycock, T.K.; Stewart, B.C. Impacts, Risks, and Adaptation in the United States: Fourth National Climate Assessment, Volume II: Report-in-Brief; U.S. Global Change Research Program: Washington, DC, USA, 2018. [Google Scholar]
- Crimmins, A.; Balbus, J.; Gamble, J.L.; Beard, C.B.; Bell, J.E.; Dodgen, D.; Eisen, R.J.; Fann, N.; Hawkins, M.D.; Herring, S.C.; et al. Ch. 9: Populations of concern. In The Impacts of Climate Change on Human Health in the United States: A Scientific Assessment; Program USGCR, Ed.; U.S. Global Change Research Program: Washington, DC, USA, 2016. [Google Scholar]
- World Health Organization. Africa Region: Air Pollution. 2023. Available online: https://www.afro.who.int/health-topics/air-pollution (accessed on 14 August 2024).
- Kjellstrom, T.; Holmer, I.; Lemke, B. Workplace heat stress, health and productivity—An increasing challenge for low and middle-income countries during climate change. Glob. Health Action 2009, 2, 2047. [Google Scholar] [CrossRef] [PubMed]
- Birkmann, J.; Liwenga, E.; Pandey, R.; Boyd, E.; Djalante, R.; Gemenne, F.; Leal Filho, W.; Pinho, P.F.; Stringer, L.; Wrathall, D. Poverty, Livelihoods and Sustainable Development. In Climate Change 2022: Impacts, Adaptation and Vulnerability. Contribution of Working Group II to the Sixth Assessment Report of the Intergovernmental Panel on Climate Change; Cambridge University Press: Cambridge, UK; New York, NY, USA, 2022. [Google Scholar] [CrossRef]
- Sahu, S.; Sett, M.; Kjellstrom, T. Heat Exposure, Cardiovascular Stress and Work Productivity in Rice Harvesters in India: Implications for a Climate Change Future. Ind. Health 2013, 51, 424–431. [Google Scholar] [CrossRef] [PubMed]
- Chen, C.; Schwarz, L.; Rosenthal, N.; Marlier, M.E.; Benmarhnia, T. Exploring spatial heterogeneity in synergistic effects of compound climate hazards: Extreme heat and wildfire smoke on cardiorespiratory hospitalizations in California. Sci. Adv. 2024, 10, eadj7264. [Google Scholar] [CrossRef] [PubMed]
- El Khayat, M.; Halwani, D.A.; Hneiny, L.; Alameddine, I.; Haidar, M.A.; Habib, R.R. Impacts of Climate Change and Heat Stress on Farmworkers’ Health: A Scoping Review. Front. Public Health 2022, 10, 782811. [Google Scholar] [CrossRef]
- Oztas, D.; Kurt, B.; Koc, A.; Akbaba, M. Living Conditions, Access to Healthcare Services, and Occupational Health and Safety Conditions of Migrant Seasonal Agricultural Workers in the Cukurova Region. J. Agromed. 2018, 23, 262–269. [Google Scholar] [CrossRef]
- Tigchelaar, M.; Battisti, D.S.; Spector, J.T. Work adaptations insufficient to address growing heat risk for US agricultural workers. Environ. Res. Lett. 2020, 15, 094035. [Google Scholar] [CrossRef] [PubMed]
- Butler-Dawson, J.; Krisher, L.; Yoder, H.; Dally, M.; Sorensen, C.; Johnson, R.J.; Asensio, C.; Cruz, A.; Johnson, E.C.; Carlton, E.J.; et al. Evaluation of heat stress and cumulative incidence of acute kidney injury in sugarcane workers in Guatemala. Int. Arch. Occup. Environ. Health 2019, 92, 977–990. [Google Scholar] [CrossRef] [PubMed]
- Johnson, R.J.; Sanchez-Lozada, L.G.; Newman, L.S.; Lanaspa, M.A.; Diaz, H.F.; Lemery, J.; Rodriguez-Iturbe, B.; Tolan, D.R.; Butler-Dawson, J.; Sato, Y.; et al. Climate Change and the Kidney. Ann. Nutr. Metab. 2019, 74, 38–44. [Google Scholar] [CrossRef]
- Jayasumana, C. Chronic Interstitial Nephritis in Agricultural Communities (CINAC) in Sri Lanka. Semin. Nephrol. 2019, 39, 278–283. [Google Scholar] [CrossRef]
- Abraham, G.; Agarwal, S.K.; Gowrishankar, S.; Vijayan, M. Chronic Kidney Disease of Unknown Etiology: Hotspots in India and Other Asian Countries. Semin. Nephrol. 2019, 39, 272–277. [Google Scholar] [CrossRef] [PubMed]
- Aguilar-Ramirez, D.; Rana-Custodio, A.; Villa, A.; Rubilar, X.; Olvera, N.; Escobar, A.; Johnson, R.J.; Sanchez-Lozada, L.; Obrador, G.T.; Madero, M. Decreased kidney function and agricultural work: A cross-sectional study in middle-aged adults from Tierra Blanca, Mexico. Nephrol. Dial. Transplant. 2021, 36, 1030–1038. [Google Scholar] [CrossRef] [PubMed]
- Hansson, E.; Glaser, J.; Weiss, I.; Ekstrom, U.; Apelqvist, J.; Hogstedt, C.; Peraza, S.; Lucas, R.; Jakobsson, K.; Wesseling, C.; et al. Workload and cross-harvest kidney injury in a Nicaraguan sugarcane worker cohort. Occup. Environ. Med. 2019, 76, 818–826. [Google Scholar] [CrossRef]
- Keogh, S.A.; Leibler, J.H.; Decker, C.S.M.; Velazquez, J.J.A.; Jarquin, E.R.; Lopez-Pilarte, D.; Garcia-Trabanino, R.; Delgado, I.S.; Petropoulos, Z.E.; Friedman, D.J.; et al. High prevalence of chronic kidney disease of unknown etiology among workers in the Mesoamerican Nephropathy Occupational Study. BMC Nephrol. 2022, 23, 238. [Google Scholar] [CrossRef]
- Petropoulos, Z.E.; Keogh, S.A.; Jarquin, E.; Lopez-Pilarte, D.; Velazquez, J.J.A.; Garcia-Trabanino, R.; Sanchez, M.R.A.; Guevara, R.; Gruener, A.; Allen, D.R.; et al. Heat stress and heat strain among outdoor workers in El Salvador and Nicaragua. J. Expo. Sci. Environ. Epidemiol. 2023, 33, 622–630. [Google Scholar] [CrossRef] [PubMed]
- Schaeffer, J.W.; Adgate, J.L.; Reynolds, S.J.; Butler-Dawson, J.; Krisher, L.; Dally, M.; Johnson, R.J.; James, K.A.; Jaramillo, D.; Newman, L.S. A Pilot Study to Assess Inhalation Exposures among Sugarcane Workers in Guatemala: Implications for Chronic Kidney Disease of Unknown Origin. Int. J. Environ. Res. Public Health 2020, 17, 5708. [Google Scholar] [CrossRef] [PubMed]
- Pope, D.; Diaz, E.; Smith-Sivertsen, T.; Lie, R.T.; Bakke, P.; Balmes, J.R.; Smith, K.R.; Bruce, N.G. Exposure to Household Air Pollution from Wood Combustion and Association with Respiratory Symptoms and Lung Function in Nonsmoking Women: Results from the RESPIRE Trial, Guatemala. Environ. Health Perspect. 2015, 123, 285–292. [Google Scholar] [CrossRef] [PubMed]
- Naeher, L.P.; Leaderer, B.P.; Smith, K.R. Particulate matter and carbon monoxide in highland Guatemala: Indoor and outdoor levels from traditional and improved wood stoves and gas stoves. Indoor Air-Int. J. Indoor Air Qual. Clim. 2000, 10, 200–205. [Google Scholar] [CrossRef] [PubMed]
- Engle, P.L.; Hurtado, E.; Ruel, M. Smoke Exposure of Women and Young Children in Highland Guatemala: Prediction and Recall Accuracy. Hum. Organ. 1997, 56, 408–417. [Google Scholar] [CrossRef]
- Pillarisetti, A.; Carter, E.; Rajkumar, S.; Young, B.N.; Benka-Coker, M.L.; Peel, J.L.; Johnson, M.; Clark, M.L. Measuring personal exposure to fine particulate matter (PM2.5) among rural Honduran women: A field evaluation of the Ultrasonic Personal Aerosol Sampler (UPAS). Environ. Int. 2019, 123, 50–53. [Google Scholar] [CrossRef]
- Bruce, N.; McCracken, J.; Albalak, R.; Schei, M.A.; Smith, K.R.; Lopez, V.; West, C. Impact of improved stoves, house construction and child location on levels of indoor air pollution exposure in young Guatemalan children. J. Expo. Anal. Environ. Epidemiol. 2004, 14 (Suppl. 1), S26–S33. [Google Scholar] [CrossRef]
- McCracken, J.P.; Schwartz, J.; Diaz, A.; Bruce, N.; Smith, K.R. Longitudinal Relationship between Personal CO and Personal PM2.5 among Women Cooking with Woodfired Cookstoves in Guatemala. PLoS ONE 2013, 8, e55670. [Google Scholar] [CrossRef] [PubMed]
- Smith, K.R.; McCracken, J.P.; Weber, M.W.; Hubbard, A.; Jenny, A.; Thompson, L.M.; Balmes, J.; Diaz, A.; Arana, B.; Bruce, N. Effect of reduction in household air pollution on childhood pneumonia in Guatemala (RESPIRE): A randomised controlled trial. Lancet 2011, 378, 1717–1726. [Google Scholar] [CrossRef] [PubMed]
- Kim, E.A. Particulate Matter (Fine Particle) and Urologic Diseases. Int. Neurourol. J. 2017, 21, 155–162. [Google Scholar] [CrossRef] [PubMed]
- Adgate, J.; Erlandson, G.; Butler-Dawson, J.; Calvimontes, L.; Amézquita, L.; Seidel, J.; Barnoya, J.; Dally, M.; Krisher, L.; Jaramillo, D.; et al. Airborne Particulate Matter Exposure in Male Sugarcane Workers at Risk for Chronic Kidney Disease in Guatemala. Ann. Work. Expo. Health 2024. submitted. [Google Scholar]
- Wang, S.W.; Wu, C.Y.H.; Richardson, M.B.; Zaitchik, B.F.; Gohlke, J.M. Characterization of heat index experienced by individuals residing in urban and rural settings. J. Expo. Sci. Environ. Epidemiol. 2021, 31, 641–653. [Google Scholar] [CrossRef] [PubMed]
- Maxim. DS1922L iButton Temperature Loggers with 8KB Data-log Memory. 2018. Available online: https://www.maximintegrated.com/en/products/digital/data-loggers/DS1922L.html (accessed on 12 July 2024).
- Rothfusz, L. The Heat Index “Equation” (or, More than You Ever Wanted to Know about Heat Index); SR 90-23; National Oceanic and Atmospheric Administration NWS, Office of Meteorology: Forth Worth, TX, USA, 1990. [Google Scholar]
- OSHA. Using the Heat Index: A Guide for Employers; U.S. Occupational Safety and Health Administration: Washington, DC, USA, 2019. [Google Scholar]
- ACGIH. Threshold Limit Values for Chemical Substances and Physical Agents and Biological Exposure Indices. Appendix B: Particles (Insoluble or Poorly Soluble) Not Otherwise Specified; American Conference of Governmental Industrial Hygienists: Cincinnati, OH, USA, 2015. [Google Scholar]
- Madden, N.M.; Southard, R.J.; Mitchell, J.R. Soil Water Content and Soil Disaggregation by Disking Affects PM10 Emissions. J. Environ. Qual. 2009, 38, 36–43. [Google Scholar] [CrossRef] [PubMed]
- Yousefi, R.; Shaheen, A.; Wang, F.; Ge, Q.S.; Wu, R.G.; Lelieveld, J.; Wang, J.; Su, X.K. Fine particulate matter (PM2.5) trends from land surface changes and air pollution policies in China during 1980–2020. J. Environ. Manag. 2023, 326, 116847. [Google Scholar] [CrossRef]
- Johnson, M.; Pillarisetti, A.; Piedrahita, R.; Balakrishnan, K.; Peel, J.L.; Steenland, K.; Underhill, L.J.; Rosa, G.; Kirby, M.A.; Diaz-Artiga, A.; et al. Exposure Contrasts of Pregnant Women during the Household Air Pollution Intervention Network Randomized Controlled Trial. Environ. Health Perspect. 2022, 130, 097005. [Google Scholar] [CrossRef]
- World Health Organization. WHO Air Quality Guidelines Global Update 2005. In Proceedings of the Working Group Meeting, Bonn, Germany, 18–20 October 2005; WHO Regional Office for Europe: Copenhagen, Denmark, 2005. [Google Scholar]
- Young, B.N.; Clark, M.L.; Rajkumar, S.; Benka-Coker, M.L.; Bachand, A.; Brook, R.D.; Nelson, T.L.; Volckens, J.; Reynolds, S.J.; L’Orange, C.; et al. Exposure to household air pollution from biomass cookstoves and blood pressure among women in rural Honduras: A cross-sectional study. Indoor Air 2019, 29, 130–142. [Google Scholar] [CrossRef] [PubMed]
- Cal/OSHA. Worker Protection from Wildfire Smoke. 2023. Available online: https://www.dir.ca.gov/dosh/doshreg/Protection-from-Wildfire-Smoke/Wildfire-smoke-emergency-standard.html (accessed on 10 June 2024).
- Oregon OSHA. Key Requirements: Oregon OSHA’s Permanent Rules for Protection from Wildfire Smoke—Revised May 2024. 2024. Available online: https://osha.oregon.gov/OSHAPubs/factsheets/fs92.pdf (accessed on 6 September 2024).
- Garcia-Trabanino, R.; Jarquin, E.; Wesseling, C.; Johnson, R.J.; Gonzalez-Quiroz, M.; Weiss, I.; Glaser, J.; Vindell, J.J.; Stockfelt, L.; Roncal, C.; et al. Heat stress, dehydration, and kidney function in sugarcane cutters in EI Salvador—A cross-shift study of workers at risk of Mesoamerican nephropathy. Environ. Res. 2015, 142, 746–755. [Google Scholar] [CrossRef]
- OSHA. Section III: Chapter 4. Heat Stress. In OSHA Technical Manual; Occupational Safety and Health Administration: Washington, DC, USA, 2017. [Google Scholar]
- ACGIH. Heat Stress. “Strain: TLV® Physical Agents”; American Conference of Governmental Industrial Hygienists: Cincinnati, OH, USA, 2009. [Google Scholar]
- Sorensen, C.J.; Krisher, L.; Butler-Dawson, J.; Dally, M.; Dexter, L.; Asensio, C.; Cruz, A.; Newman, L.S. Workplace Screening Identifies Clinically Significant and Potentially Reversible Kidney Injury in Heat-Exposed Sugarcane Workers. Int. J. Environ. Res. Public Health 2020, 17, 8552. [Google Scholar] [CrossRef] [PubMed]
- Gordon, C.J.; Johnstone, A.F.M.; Aydin, C. Thermal Stress and Toxicity. Compr. Physiol. 2014, 4, 995–1016. [Google Scholar] [CrossRef] [PubMed]
- Leon, L.R. Thermoregulatory responses to environmental toxicants: The interaction of thermal stress and toxicant exposure. Toxicol. Appl. Pharmacol. 2008, 233, 146–161. [Google Scholar] [CrossRef] [PubMed]
- Pourvakhshoori, N.; Poursadeghiyan, M.; Khankeh, H.R.; Harouni, G.G.; Farrokhi, M. The simultaneous effects of thermal stress and air pollution on body temperature of Tehran traffic officers. J. Environ. Health Sci. Eng. 2020, 18, 279–284. [Google Scholar] [CrossRef]
Disclaimer/Publisher’s Note: The statements, opinions and data contained in all publications are solely those of the individual author(s) and contributor(s) and not of MDPI and/or the editor(s). MDPI and/or the editor(s) disclaim responsibility for any injury to people or property resulting from any ideas, methods, instructions or products referred to in the content. |
© 2024 by the authors. Licensee MDPI, Basel, Switzerland. This article is an open access article distributed under the terms and conditions of the Creative Commons Attribution (CC BY) license (https://creativecommons.org/licenses/by/4.0/).