Abstract
Volatile organic compounds (VOCs), with their ubiquitous presence across numerous global industries, pose multifaceted challenges, influencing air pollution and health outcomes. In response, countries such as the United States and Canada have implemented fenceline monitoring systems, enabling real-time tracking of organic solvents, including benzene. Initially, this focus was predominantly placed on the petroleum refining industry, but it has gradually been broadening. This investigation seeks to identify and analyze the specific VOCs produced in the tire manufacturing sector by utilizing both active and passive monitoring methodologies. The findings of the present study aim to recommend prioritized reduction strategies for specific VOCs. Percentage means the ratio of VOCs detected at the research site. At research target facility A, active monitoring demonstrated the presence of Methylene chloride (20.7%) and Carbon tetrachloride (15.3%), whereas passive monitoring identified Carbon tetrachloride (43.4%) and m,p-Xylene (20.8%). After converting these substances to their equivalent concentrations, we found a noteworthy correlation between the active and passive methodologies. At research target facility B, active monitoring detected n-Pentane (45.5%) and Isoprene (11.4%), while passive monitoring revealed Toluene (21.3%) and iso-Hexane (15.8%). Interestingly, even at sites like warehouses and test tracks where VOC concentrations were projected to be low, we observed VOC levels comparable to those in process areas. This underlines the fact that the dispersal of VOCs is considerably influenced by wind direction and speed. Specifically, in the tire manufacturing industry, emissions of Xylene and 3-Methylhexane, both having high photochemical ozone creation potential (POCP), contribute significantly to air pollution. However, the overall detection concentration in the tire manufacturing industry was detected at a low concentration of less than 2 μg/m3. This is less than 9 μg/m3, which is the standard for benzene, which has strong carcinogenicity regulations. This suggests that additional research is needed on synthetic rubber manufacturing rather than tire manufacturing.
1. Introduction
Air pollution, with its intricate linkage to public health, has been a focal point of global concern, prompting diverse studies aimed at reducing pollutant levels across various nations [1,2].
In the past, particulate matter (PM10), sulfur oxides (SOx), and nitrogen oxides (NOx) have been viewed as conventional air pollutants. However, the mechanisms leading to air pollution are multifaceted and intertwined with an array of complex factors, rather than resulting from a singular process [3].
Recent research has unveiled the fact that volatile organic compounds (VOCs) can trigger photochemical reactions within the atmosphere, culminating in the formation of secondary pollutants such as ozone, a key contributor to smog [4]. This has intensified the call for mitigation measures against VOCs, given their role as precursors for fine dust (PM10) and ozone (O3). From a long-term perspective, it has become crucial to identify VOCs that are emitted in substantial quantities, specifically those with high carcinogenicity or photochemical ozone creation potential (POCP), in order to devise efficient policies for atmospheric ozone reduction [5].
In 2011, in the United States, strategies such as the VOC total emissions cap have been initiated, commencing limitations on emissions from large-scale sources that emit over 100 tons of VOCs annually, and reinforcing regulations by categorizing high emission areas into five stages. Notably, in 2011, the US Environmental Protection Agency (EPA) implemented the Cross-State Air Pollution Rule (CSAPR) with the aim to curtail air pollutants originating from coal-fired power plants and bolster public health. Based on the “good neighbor” clause under the Federal Clean Air Act, the CSAPR serves as a federal plan to mitigate the impact of interstate air pollutant transport from each state’s emissions on air quality targets and the designation of non-attainment areas in other states [6].
The European Union (EU) adopted the Ambient Air Quality Directive in May 2008, thereby establishing air quality standards for pollutants across Europe. Individual member nations further instituted the National Emission Ceiling Directive, defining an annual total emission limit for SO2, NOx, VOCs, and NH3, with compliance demanded by 2010 [7]. In the wake of this, the EU Commission launched the Clean Air Policy Package for Europe in 2013, and in December 2016, the National Emission Ceiling Directive was revised to incorporate reduction targets for particulate matter (PM2.5). As a result, member nations are required to report their annual emission levels of five pollutants every February, provide their estimated pollutant emissions biennially, and create and implement a National Air Pollution Control Program (NAPCP) [8,9,10].
Simultaneously in the United States and Canada, in addition to overall VOC management, concentration regulations have been introduced at fencelines for large-scale establishments, such as oil refineries. These facilities emit potentially health-impacting, carcinogenic VOCs like benzene [11]. In the case of benzene, should the level exceed the defined action level of 9 µg/m3, a reduction plan must be implemented. Furthermore, it is mandatory to disclose to the local community the concentrations of other VOCs, including toluene, xylene, and ethylbenzene [12].
Therefore, the impacts of VOCs are multifaceted, affecting not just a single domain, but both air pollution and public health. For example, VOCs such as benzene are highly carcinogenic, so even low concentrations can cause health effects such as cancer and leukemia in local residents [13]. In diverse industrial contexts, a variety of VOCs exist. Their high volatility makes the formulation of mitigation strategies challenging. Some VOCs have high POCP. There are previous studies that establish priorities for VOCs with high POCP and establish reduction measures [14]. However, there exist certain VOCs that necessitate priority reduction measures, and this varies by industry [15].
In particular, according to a preliminary study, the concentration of benzene, which has health effects on local residents in the oil refining industry, was measured, and the emission ratio of xylene, which causes air pollution due to its high POCP and strong ozone creation ability, was studied. The results suggested the need for reduction measures in the BTX manufacturing process [16].
Given these considerations, this study seeks to measure and analyze 88 types of VOCs at the fencelines of tire manufacturing facilities. The goal is to identify which VOCs are being emitted and suggest those that require urgent reduction.
2. Materials and Methods
2.1. Overview of the Tire Manufacturing Process
A tire is a circular apparatus fitted onto the wheel cylinder of vehicles such as automobiles and bicycles. It was developed by Thomas Hancock of Germany in 1846, leading to the introduction of various rubber models for transportation. Tires are typically classified according to the type of vehicle and its purpose: they are used for passenger cars, light trucks, buses or large trucks, industrial vehicles, agricultural machinery, aircraft, motorcycles, bicycles, and so forth. Notably, the tire industry, excluding natural rubber, employs petrochemical products and solvents, constituting approximately 70% of raw materials such as synthetic rubber, carbon black, tire cords, and rubber chemicals. This results in substantial emission of malodorous substances and VOCs [17]. The detailed processes of tire manufacturing can be categorized as shown in Table 1.

Table 1.
Manufacturing Steps and Procedures in the Tire Manufacturing Industry.
In the tire manufacturing process overall, the rubber is generally subjected to heat and pressure, resulting in numerous high-temperature reactions. Various solvents and auxiliary materials, including sulfur and carbon black, are utilized. A substantial amount of malodorous substances and VOCs is expected to be produced, particularly during parts of the refining process and the curing process.
2.2. Status of the Research Target Facilities
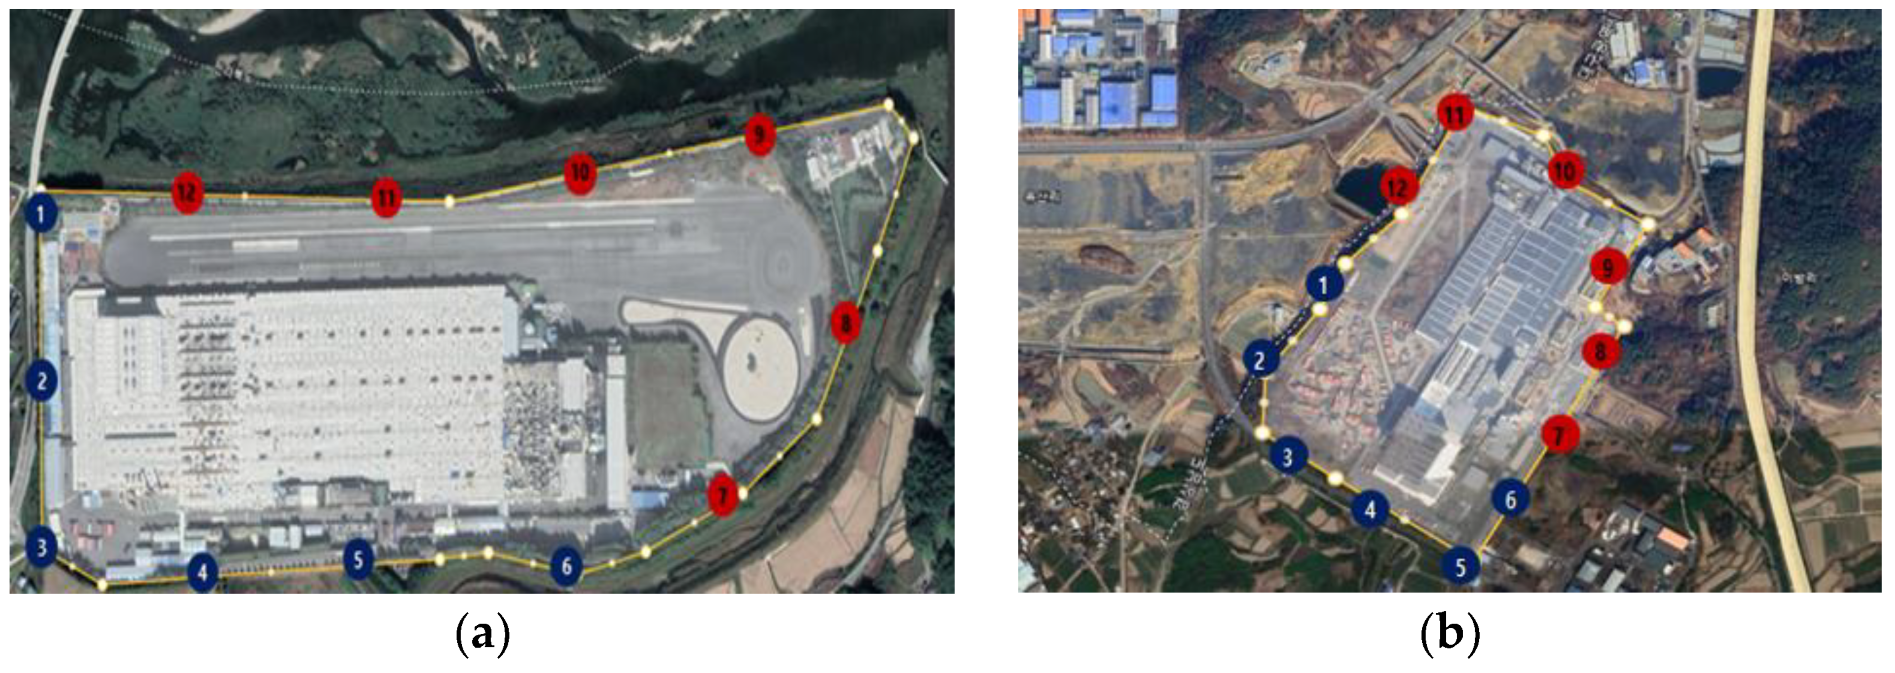
This study was conducted on two targeted tire manufacturing companies. Both companies, each operating independent factories, were selected, as they are located outside industrial zones, thus significantly minimizing any influence from neighboring businesses. Measurement locations were chosen following the EPA fenceline monitoring guidelines, with 12 points selected for each facility. According to EPA guidelines, for floor areas less than 750 acres, 12 points must be measured [18] (Figure 1).

Figure 1.
Locations and measurement points of the target tire manufacturing facilities: (a) research target facility A, (b) research target facility B.
The size of the research target facilities’ sites and their production output are as follows (Table 2). Both facilities are of comparable scale and dimensions.
Table 2.
Characteristics of the Research Target Facilities.
2.3. Collection and Analytical Methods for Targeted VOC Samples
For monitoring the targeted facility, samples are collected through both passive and active methods following EPA Method 325A (Volatile Organic Compounds from Fugitive and Area Sources—Sampler Deployment and VOC Sample Collection). The sample collection sorbent tube is selected in line with the Guidelines for Sorbent Selection of EPA Method TO-17, deploying a Carbotrap 300 (1/4 in. × 3 1/2 in, Sigma, Tokyo, Japan) filled with Carbopack C + Carbopack B + Carbosieve SIII. The monitoring height is secured such that the diffusive sampling cap is placed 1.5–3 m above ground level, utilizing a pole or a stable structure [19].
Notably, out of the six fenceline monitoring methods described by the EPA, both passive and active analyses were performed concurrently. As a pilot study, this study measured one cycle at two facilities using passive and active techniques. Details are shown in Table 3. Active sampling incorporated a suction pump to gather a total of 5 samples at a rate of 100 mL/min for 60 min, twice in the morning and thrice in the afternoon, thereby collecting a cumulative volume of 6 L of samples. Passive sampling was undertaken by orienting the sampler vertically to avoid particle intrusion, ensuring that the end of the sampling tube was facing downwards, and sampling continued over a 14-day period [20] (Figure 2).
Table 3.
Advantages and Disadvantages of Passive and Active Samples.
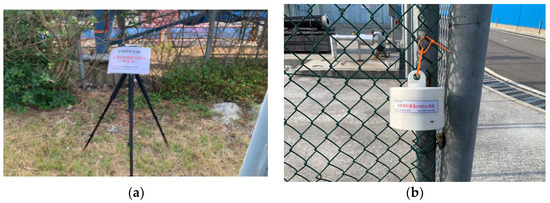
Figure 2.
VOC Capture Methods: (a) Active Sampling (b) Passive Sampling. The meaning of the phrase in the figure is ‘Measuring VOCs’.
The analyzed VOCs encompassed 57 types of ozone precursor VOCs and 31 substances listed under the TO-14A standard, totaling 88 types. In the case of active sampling, due to the presence of flow, the concentration of VOCs can be determined. However, in passive sampling, calculating the concentration by utilizing the uptake rate is a necessity. The uptake rates of VOCs that can be converted to concentration among the 88 types are provided [21] (Table 4).
Table 4.
Uptake Rates of VOCs.
The adopted analytical method involves assessing samples collected through a solid adsorption tube with a gas chromatograph/mass spectrometer (GC/MS). The procedure entails collecting samples in an adsorption tube filled with a designated quantity of adsorbent, followed by thermal desorption, concentration in a low-temperature trap, and another round of thermal desorption. Subsequently, the analytes are segregated through a gas chromatograph (GC) using a high-resolution column and measured with a mass spectrometer (MS) [22] (Table 5).
Table 5.
Sample Analysis Conditions.
To confirm breakthrough, double samples were installed at points 6 and 12, and a blank sample was installed at point 1 as a control. The analytical center had additional laboratory standards and blanks as defined in the quality assurance practices mentioned below. Field blanks and standards sent from the central preparation center to each facility were kept in an unexposed state so that contamination due to sample storage and transportation could be checked. Manual diffusion tubes were sent from the analysis center along with three independent quality control samples.
In addition, the EPA stipulates that the atmospheric concentration of benzene detected in the nearby clean-air monitoring network (areas other than industrial complexes) be subtracted from the detected concentration. However, VOCs other than benzene are not disclosed in detail (toluene, etc.), and according to the guidelines, if there are no relevant data, the measurement results must be submitted as they are, so they were not applied separately. Currently, Korea’s atmospheric measurement network discloses SOx, NOx, ozone, PM10, etc.
3. Results
3.1. Results for Research Target Facility A
In this research, an analysis of a total of 88 VOC substances was conducted, excluding duplicative items from 57 types of ozone precursors and 31 types capable of TO-14 analysis, including 1,3-butadiene. For these 88 substances, the compositional ratio was evaluated using the concentration at each facilities’ measurement locations and the concentration of each item relative to the total concentration of 57 PAM (Photochemical Assessment Monitoring Station) species and 31 types that can be analyzed using TO-14.
This study is a pilot study in accordance with EPA guidelines, and continuous measurement and analysis is necessary. The purpose is to analyze various VOCs occurring in the relevant industry, and for the substances that accounted for a large percentage in the initial study a secondary study is required to evaluate the feasibility by sampling for two consecutive weeks for one year.
Importantly, this study implemented two methodologies: the traditional active technique and the passive technique derived from the U.S. EPA’s fenceline monitoring, conducted over 14 days. However, in the passive technique, only 18 substances could be converted to concentration using diffusion coefficients [22].
The weather conditions at the study research target facility A are an average temperature of 19.8 °C for active sampling and 23.0 °C for passive sampling. The average relative humidity of active sampling is 58.2%, and the average relative humidity of passive sampling is 73.6%. As for precipitation, there was no rain in the case of active sampling, and the total precipitation during the passive sampling period was 108.5 mm [23].
Thus, the research included an analysis of the benzene detection at each facility, a comparison between potential VOC emissions from nearby processes at each location, the actual emission results (active and passive results), and an examination of the similarity of concentration results obtained using the two techniques.
In research target facility A, which was the subject of this research, the results from the active technique revealed methylene chloride at 20.7%, carbon tetrachloride at 15.3%, etc. Meanwhile, the passive technique showed carbon tetrachloride at 43.4%, m,p-Xylene at 20.8%, etc. Percentage refers to the ratio of the 88 individual samples detected to the sum of the total sample amount at each point.
In comparing the VOCs that can be converted to concentration in the passive technique with the active technique, toluene, xylene, carbon tetrachloride, and 1,2-dichloropropane were detected.
The average concentration at each point exhibited toluene at 0.10 μg/m3 in active results and 0.26 μg/m3 in passive results. Xylene was 0.65 μg/m3 in active results and 0.43 μg/m3 in passive results. Carbon tetrachloride was 1.38 μg/m3 in active results and 0.81 μg/m3 in passive results. 2-Dichloropropane was 0.75 μg/m3 in active results and 0.51 μg/m3 in passive results (Table 6).
Table 6.
Research Target Facility A: comparison of active and passive concentrations of substances that can be converted into chemicals (unit: μg/m3).
All four substances showed similar concentration values across all facility points in both active and passive techniques. Table 7 illustrates the composition ratio of VOCs detected at each point using the active technique. Table 8 shows the composition ratio of VOCs detected using the passive technique. Among the 88 types, no other substances were detected.
Table 7.
Results of Active Analysis (in % composition) for Research Target Facility A.
Table 8.
Results of Passive Analysis (in % composition) for Research Target Facility A.
The analysis focused primarily on sampling site 6, located near the rubber processing operation. This process mixes over 20 ingredients, including Styrene-Butadiene Rubber (SBR) and Nitrile Rubber (NBR) for tires, and rubber processing adhesives. The mixture is then subjected to kneading under heat and pressure. Given the high operating temperatures of 150–190 °C, the occurrence of rubber smoke is typical. In addition, the emission of polycyclic aromatic hydrocarbons and synthetic rubber precursors, such as styrene and butadiene, was anticipated.
The composition of VOCs in this area, as revealed by active analysis, comprised 26% isopentane, 26% methylene chloride, and 19% carbon tetrachloride. Notably, xylene, a type of solvent, constituted 7% of the detected VOCs.
Passive analysis showed congruent findings, with carbon tetrachloride accounting for 47%, dichlorodifluoromethane for 31%, and Xylene for 22%.
According to previous research, the highly toxic carbon tetrachloride is associated with risk in the rubber industry, especially in tire manufacturing in the United States. There are warnings regarding a potential link between exposure to carbon tetrachloride and carbon disulfide, and an increased incidence of lymphoid leukemia in workers [24].
However, due to the exceptionally low detected concentration of 1.41 μg/m3, asserting a tangible impact from this substance may be challenging, despite its detection rate. The long-term exposure standard for Carbon Tetrachloride, as per the local industrial safety and health law, is a threshold limit value (TLV) of 30 μg/m3. The TLV is calculated by the American Conference of Governmental Industrial Hygienists (ACGIH), based on a typical 8 h workday over a 5-day workweek. The long-term exposure standard indicates a concentration that, if exposed to under regular working conditions, would not result in any adverse effects. Given that the detected concentration at the site boundary is approximately 1/20 of the standard concentration, it does not warrant significant concern [25].
Methylene chloride and xylene, present in minor quantities in the organic solvents utilized in the refining process, display low concentration levels, at 1.91 μg/m3 and 0.48 μg/m3, respectively. The time-weighted average (TWA) for methylene chloride is 50 μg/m3, while for Xylene it is 100 μg/m3, suggesting that the concentration standards are minimal [26]. Furthermore, VOCs are notably affected by wind, attributed to their high volatility and rapid diffusion in the atmosphere. However, in the active analysis, points 8 and 9 showed slightly higher concentrations, showing similar results to wind roses, but in the passive analysis the concentration was evenly distributed at all points, rather than the dominant southerly winds (Figure 3).
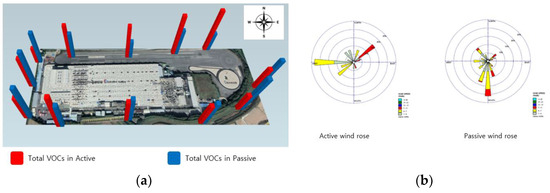
Figure 3.
Total VOCs in active and passive modes at research target facility A. (a) Total VOCs, (b) wind rose diagram.
3.2. Findings from Research Target Facility B
The weather conditions at the study research target facility B are an average temperature of 29.5 °C for active sampling and 26.7 °C for passive sampling. The average relative humidity of active sampling is 66.7%, and the average relative humidity of passive sampling is 74.0%. As for precipitation, there was no rain in the case of active sampling, and the total precipitation during the passive sampling period was 56.6 mm [23].
The results from the research target facility B indicate that in the active analysis, n-Pentane (45.5%) and Isoprene (11.4%) were the most prevalent compounds.
On the other hand, the passive analysis technique identified toluene (21.3%) and iso-hexane (15.8%) as the major constituents. Upon comparing the VOCs from both techniques, toluene emerged as the only common compound.
The average concentrations showed a minor discrepancy for toluene, with the active technique recording 0.75 μg/m3 and the passive technique noting 1.29 μg/m3 in Table 9. However, the overall concentrations were low (none of the individual VOC concentrations exceeded 2 μg/m3 at any point). The limited detection of VOCs may be attributed to the nature of tire manufacturing processes, which do not extensively involve organic solvents, unlike the chemical or petroleum-refining industries. Notably, toluene was only detected at point 10 using the active technique in minor quantities, rendering a holistic comparison unfeasible.
Table 9.
Research Target Facility B: comparison of active and passive concentrations of substances that can be converted into chemicals (unit: μg/m3).
Table 10 displays the composition of VOCs detected across individual points using the active technique. Table 11 showcases the VOC composition identified using the passive technique. Out of the 88 types analyzed, no detection was made for substances other than those specified.
Table 10.
Results of Active Analysis (in % composition) for Research Target Facility B.
Table 11.
Results of Passive Analysis (in % composition) for Research Target Facility B.
On analyzing the area corresponding to point 11, which represents the refining process, the VOCs at this location were primarily n-heptane (59%) and 3-methylhexane (41%), as per the active results. The passive analysis revealed concentrations of n-heptane (43%), 3-methylhexane (19%), and toluene (18%). In addition, styrene was detected at this point, at 8%. At point 2, corresponding to the rubber processing operation where heat and pressure are applied, sulfur and other chemicals instigate a cross-linking reaction with rubber. Owing to the use of isoprene-based products as adhesives, only isoprene was detected in the active analysis. In contrast, the passive analysis detected toluene (19%), iso-hexane (16%), and ethylbenzene (10%).
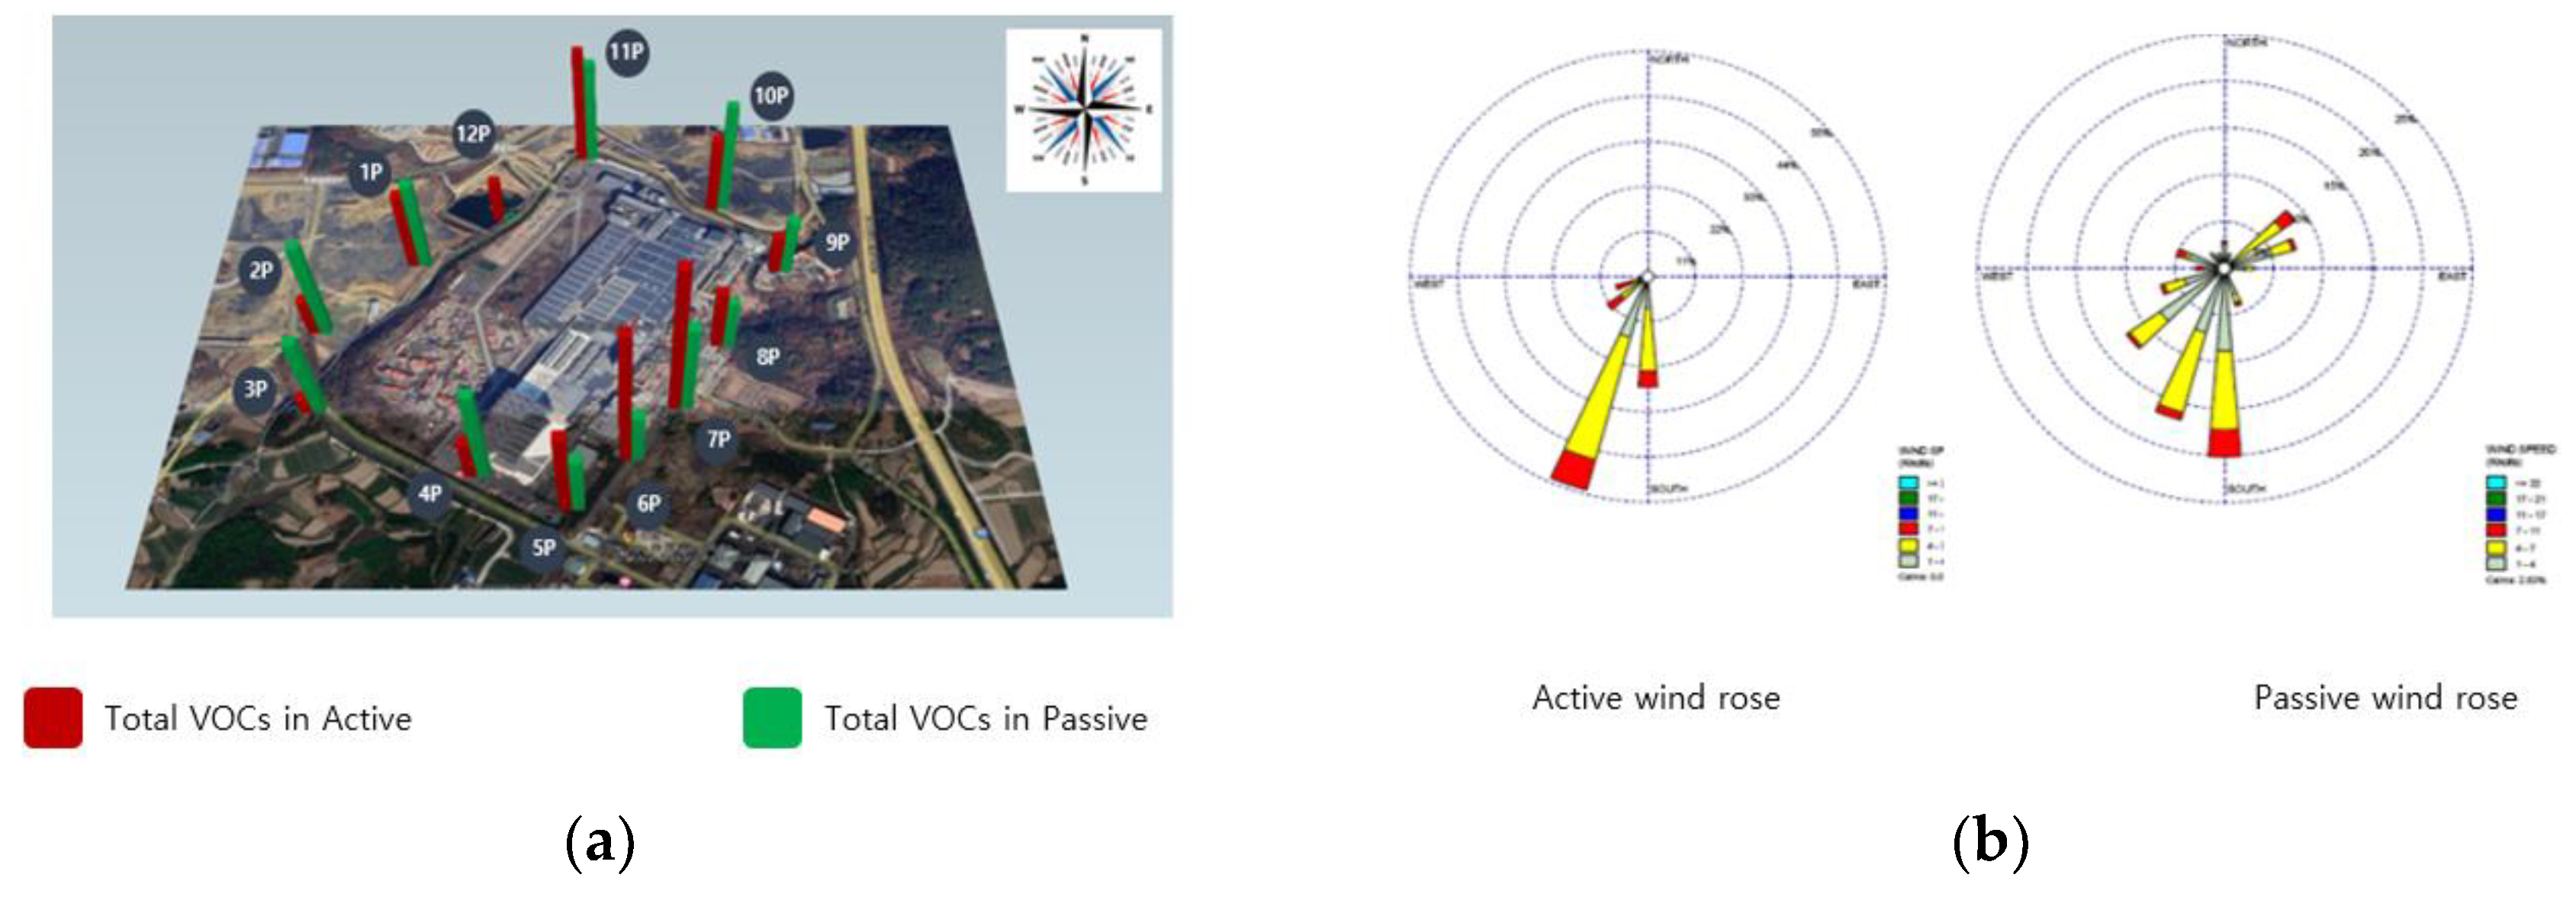
Comparing the climatic conditions during the measurement phase at site B, it was evident that atmospheric VOCs are heavily influenced by weather patterns. The wind during the measurements at site B blew between points 10 and 11 at speeds of 4–7 m/s. The operation closest to these points involved unloading and storing raw materials in a warehouse. The results indicated the highest VOC concentrations at points 10 and 11. Despite the proximity of the manufacturing process to points 8, 9, and 10, wind effects led to elevated concentrations at points 10 and 11. This underscores the significant influence of both production processes and weather conditions on VOC distribution (Figure 4).

Figure 4.
Total VOCs in active and passive modes at research target facility B. (a) Total VOCs, (b) wind rose diagram.
3.3. Prioritization of Reduction Measures Based on VOCs with High POCP
VOCs serve as key precursors in the photochemical reactions that lead to ozone (O3) creation, acting as catalysts, and are thus regulated as photochemical pollutants. This study identified the top ten substances with high POCP values, as reported by the EU [27].
At research target facility A, xylene, which holds the fourth-highest POCP value, exhibited a high emission rate. Minor emissions of ethylbenzene and toluene were also detected. However, upon assessing the emission concentrations, they were found to be generally low, at less than 1 μg/m3.
In the case of research target facility B, active sampling identified the presence of toluene and 3-methylhexane, while passive sampling detected ethylbenzene and toluene. The overall emission concentrations were also observed to be low, at less than 1 μg/m3. Although 3-methylhexane is a compound that can occur in tire manufacturing, its absence of a diffusion coefficient in passive sampling means it cannot be converted into a concentration measure, presenting a limitation (Table 12).
Table 12.
VOCs with High POCP in Tire Manufacturing.
Based on these study findings, there is a need for prioritized mitigation measures concerning solvents containing substances such as xylene and 3-methylhexane.
4. Discussion
The present study aimed to analyze the types and emission rates of VOCs associated with tire manufacturing operations. It was initially anticipated that a considerable amount of styrene, a substance notorious for causing malodors, would be detected. Interestingly, no traces of styrene were found at the fenceline [28]. This unexpected result is significant because styrene, while not utilized as a solvent, was hypothesized to be generated during the thermal decomposition of raw materials, such as SBR rubber. However, styrene remained undetected even when the company conducted internal measurements within the workspace.
In the context of Facility A, VOCs such as carbon tetrachloride, dichloromethane, dichlorodifluoromethane, xylene, chloroform, and isoprene were identified, as predicted. Notwithstanding, the overall detected concentrations did not exceed an instantaneous maximum of 4 μg/m3, with most values ranging between 0 and 2 μg/m3. Given that these levels are below the action level of 9 μg/m3 set for benzene, a compound known for its carcinogenic properties, they reflect a stable environmental status. Facility A, interestingly, contains a test track. Despite the theoretical anticipation of lower detection concentrations at measurement points 7 to 9, the compositional ratios exhibited similar patterns to other areas. Active sampling demonstrated that dichloromethane and dichlorodifluoromethane constituted 21% and 15% of the total detections, respectively. Notably, isoprene represented a substantial 19% of the total. Isoprene was only detected from points 7 to 12, showing higher concentrations at points 9 and 10 (4 μg/m3). As an organic solvent used in tire adhesives, it is hypothesized that the elevated isoprene concentrations at points 9 and 10 could be attributed to the diffusion of isoprene and other compounds from an adhesive sprayer situated north of the extrusion process, channeled through the air emission facilities. These findings underscore the necessity of considering the influences of environmental conditions such as wind, alongside location-specific substance analyses within the context of VOCs.
For Facility B, passive sampling indicated that n-pentane was the most frequently detected compound across all sites. However, the average detected concentration was low, at 2 μg/m3. The highest concentration was recorded at point 6, but it was only a modest 5.24 μg/m3. Given the threshold limit value (TLV) for n-pentane set by the ACGIH is 1000 ppm, equivalent to around 3000 μg/m3, it suggests a very low level of toxicity. This concentration is exceedingly low when compared to the 350 μg/m3 reference exposure levels (RELs) indicated in fenceline monitoring protocols. In particular, this facility is uniquely situated, with no proximate industrial complexes, and its surroundings primarily comprise wastelands and vacant lots, eliminating potential interferences from neighboring facilities. n-Pentane was once a component of organic solvents used for dissolving rubber in the early 2000s, but by 2022 it was detected only at very low concentrations. N-Pentane can also be emitted from automobile exhausts, along with benzene and toluene. This concentration appears to have been influenced by automobile exhaust gases, because the research site B is located near a highway.
Upon reviewing occupational environmental measurements from the tire manufacturing industry in the early 2000s, it was found that substances such as n-pentane, n-hexane, benzene, toluene, and methyl cyclopentane were prevalent. However, the industry has increasingly been substituting these with other materials, and the development of organic solvents with reduced toxicity is underway [29].
Notably, a substantial quantity of substances like toluene, ethylbenzene, xylene, and styrene was detected in the passive results, all of which are also utilized as organic solvents in tire manufacturing plants. Nevertheless, the concentration of the majority of organic solvents was below 2 µg/m3. Compared to the reference value of 9 µg/m3 for benzene, which is highly toxic, these concentrations can be considered low.
When analyzing VOCs with high POCP, research target business A saw large quantities of xylene and ethylbenzene, while research target business B had a significant presence of toluene and 3-Methylhexane. This study has demonstrated that diverse VOCs are emitted across different sectors within the industry. The VOCs’ distribution in the atmosphere is notably influenced by the wind, suggesting that the influence extends not only to the specific business site but also to neighboring businesses, highlighting the importance of considering dispersion ranges. Consequently, it is more beneficial to establish reduction plans at the level of industrial complexes or between businesses with analogous processes rather than focusing solely on individual workplaces.
A limitation of the study is the number of measurements. Currently, EPA uses data measured every two weeks and measured 26 times per year. VOCs are greatly affected by the weather, so more may be emitted during seasons with higher temperatures. This suggests that continuous measurement and analysis is necessary.
5. Conclusions
Overall, the research results revealed that the VOCs projected theoretically were indeed detected. However, styrene and butene, expected to decompose at elevated temperatures in SBR rubber and BR rubber, were not identified [30]. This finding suggests that mitigation measures might be more necessary in solvent handling processes than in rubber thermal decomposition processes. When using products with relatively high POCP such as xylene or 3-Methylhexane, which could contribute to air pollution, it is advisable to contemplate the use of alternative products.
This study aimed to analyze the VOCs in each workplace and to compare the results derived from both passive and active detection methods.
In the case of the tire manufacturing industry, substances like carbon disulfide, dichloromethane, dichlorodifluoromethane, and xylene, used as solvents, as well as isoprene, used in tire adhesives, were detected more frequently than the anticipated styrene or butadiene, byproducts of rubber. However, the maximum momentary concentration did not surpass 4 µg/m3, while most measurements ranged between 0 and 2 µg/m3.
According to previous research, more VOCs and harmful factors are generated in the synthetic rubber manufacturing industry (SBR, NBR, EPDM rubber) than in the tire manufacturing industry. Accordingly, this suggests that more research is needed in the rubber-related manufacturing industry than in the tire manufacturing industry [31].
Author Contributions
Conceptualization, H.E.L. and J.H.K.; formal analysis, H.E.L.; investigation, D.S.; data curation, S.J.Y. writing—original draft preparation, H.E.L.; writing—review and editing, J.H.K.; supervision, S.J.Y. All authors have read and agreed to the published version of the manuscript.
Funding
This research was supported by a grant from the National Institute of 404 Environment Research (NIER), funded by the Ministry of Environment (MOE) of the Republic of 405 Korea (NIER-2024-01-01-008). A study on advanced technologies to monitor PM precursors using optical remote sensing (V).
Institutional Review Board Statement
Not applicable.
Informed Consent Statement
Not applicable.
Data Availability Statement
Data are contained within the article.
Conflicts of Interest
The authors declare no conflicts of interest.
References
- Sueyoshi, T.; Goto, M. Should the US clean air act include CO2 emission control? Examination by data envelopment analysis. Energy Policy 2010, 38, 5902–5911. [Google Scholar] [CrossRef]
- Wiederkehr, P. Emission reduction programmes for VOC in some OECD countries. In Studies in Environmental Science; Elsevier: Amsterdam, The Netherlands, 1994; Volume 61, pp. 11–28. [Google Scholar]
- Amoatey, P.; Omidvarborna, H.; Baawain, M.S.; Al-Mamun, A. Emissions and exposure assessments of SOX, NOX, PM10/2.5 and trace metals from oil industries: A review study (2000–2018). Process Saf. Environ. Prot. 2019, 123, 215–228. [Google Scholar] [CrossRef]
- Expert Group on Techno-Economic Issues. Guidance Document on Control Techniques for Emissions of Sulphur, NOX, VOC, Dust (Including PM10, PM2.5 and Black Carbon) from Stationary Sources; United Nations Economic Commission for Europe: New York, NY, USA, 2012. [Google Scholar]
- Jenkin, M.E.; Hayman, G.D. Photochemical ozone creation potentials for oxygenated volatile organic compounds: Sensitivity to variations in kinetic and mechanistic parameters. Atmos. Environ. 1999, 33, 1275–1293. [Google Scholar] [CrossRef]
- Jazil, M.O.; Brown, J.A. The Cross-State Air Pollution Rule: Will EPA Learn from Experience. Trends 2012, 44, 24. [Google Scholar]
- Bondarouk, E.; Liefferink, D.; Mastenbroek, E. Politics or management? Analysing differences in local implementation performance of the EU Ambient Air Quality directive. J. Public Policy 2020, 40, 449–472. [Google Scholar] [CrossRef]
- Amann, M.; Borken-Kleefeld, J.; Cofala, J.; Hettelingh, J.P.; Heyes, C.; Höglund-Isaksson, L.; Holland, M.; Kiesewetter, G.; Klimont, Z.; Rafaj, P.; et al. The Final Policy Scenarios of the EU Clean Air Policy Package; DG-Environment of the European Commission: Brussels, Belgium, 2014. [Google Scholar]
- Knoepfel, P.; Weidner, H. Implementing air quality control programs in Europe: Some results of a comparative study. Policy Stud. J. 1982, 11, 103. [Google Scholar] [CrossRef]
- De Marco, A.; Proietti, C.; Anav, A.; Ciancarella, L.; D’Elia, I.; Fares, S.; Fornasier, M.F.; Fusaro, L.; Gualtieri, M.; Manes, F.; et al. Impacts of air pollution on human and ecosystem health, and implications for the National Emission Ceilings Directive: Insights from Italy. Environ. Int. 2019, 125, 320–333. [Google Scholar] [CrossRef] [PubMed]
- Cangialosi, F.; Bruno, E.; De Santis, G. Application of machine learning for fenceline monitoring of odor classes and concentrations at a wastewater treatment plant. Sensors 2021, 21, 4716. [Google Scholar] [CrossRef]
- Thoma, E.D.; Miller, M.C.; Chung, K.C.; Parsons, N.L.; Shine, B.C. Facility fence-line monitoring using passive samplers. J. Air Waste Manag. Assoc. 2011, 61, 834–842. [Google Scholar] [CrossRef]
- North, C.M.; Rooseboom, M.; Kocabas, N.A.; Schnatter, A.R.; Faulhammer, F.; Williams, S.D. Modes of action considerations in threshold expectations for health effects of benzene. Toxicol. Lett. 2020, 334, 78–86. [Google Scholar] [CrossRef]
- Derwent, R.; Jenkin, M.; Passant, N.; Pilling, M. Photochemical ozone creation potentials (POCPs) for different emission sources of organic compounds under European conditions estimated with a Master Chemical Mechanism. Atmos. Environ. 2007, 41, 2570–2579. [Google Scholar] [CrossRef]
- Hong, S.-H.; Shin, D.-C.; Lee, Y.-J.; Kim, S.-H.; Lim, Y.-W. Health risk assessment of volatile organic compounds in urban areas. Hum. Ecol. Risk Assess. Int. J. 2017, 23, 1454–1465. [Google Scholar] [CrossRef]
- Kim, M.-G.; Kim, J.H.; Yoon, S.J.; Cho, S.H.; Yu, J.U.; Kang, C.W.; Moon, K.W.; Lee, H.E. Evaluating the feasibility of air environment management system for VOCs through ‘VOCs specification’ of petroleum refining industry. J. Air Waste Manag. Assoc. 2023, 73, 362–373. [Google Scholar] [CrossRef] [PubMed]
- Gupta, V.; Jain, R.; Meena, M.L.; Dangayach, G.S. Six-sigma application in tire-manufacturing company: A case study. J. Ind. Eng. Int. 2018, 14, 511–520. [Google Scholar] [CrossRef]
- Daves, G. Refinery fence-line monitoring to impact petrochemical operators. Oil Gas J. 2017, 115, 68–73. [Google Scholar]
- Eisele, A.P.; Mukerjee, S.; Smith, L.A.; Thoma, E.D.; Whitaker, D.A.; Oliver, K.D.; Wu, T.; Colon, M.; Alston, L.; Cousett, T.A.; et al. Volatile organic compounds at two oil and natural gas production well pads in Colorado and Texas using passive samplers. J. Air Waste Manag. Assoc. 2016, 66, 412–419. [Google Scholar] [CrossRef]
- Mukerjee, S.; Smith, L.; Caudill, M.P.; Oliver, K.D.; Whipple, W.; Whitaker, D.; Cousett, T. Application of passive sorbent tube and canister samplers for volatile organic compounds at refinery fenceline locations in Whiting, Indiana. J. Air Waste Manag. Assoc. 2018, 68, 170–175. [Google Scholar] [CrossRef] [PubMed]
- Ouyang, G.; Pawliszyn, J. Configurations and calibration methods for passive sampling techniques. J. Chromatogr. A 2007, 1168, 226–235. [Google Scholar] [CrossRef]
- Kim, M.-G.; Lee, J.Y.; Kim, J.H.; Lee, H.E.; Cho, S.H.; Yu, J.U.; Kang, C.W.; Moon, K.W. Study of Chemical Substances Emitted during Paint Manufacturing through VOC Speciation. Atmosphere 2022, 13, 1245. [Google Scholar] [CrossRef]
- The Meteorological Administration Weather Service. Available online: https://www.kma.go.kr/ (accessed on 12 January 2024).
- Thompson, R.N.; Nau, C.A.; Lawrence, C.H. Identification of vehicle tire rubber in roadway dust. Am. Ind. Hyg. Assoc. J. 1966, 27, 488–495. [Google Scholar] [CrossRef]
- Schwetz, B.A.; Leong, B.K.J.; Gehring, P.J. Embryo-and fetotoxicity of inhaled carbon tetrachloride, 1, 1-dichloroethane and methyl ethyl ketone in rats. Toxicol. Appl. Pharmacol. 1974, 28, 452–464. [Google Scholar] [CrossRef]
- Ghittori, S.; Marraccini, P.; Franco, G. Methylene chloride exposure in industrial workers. Am. Ind. Hyg. Assoc. J. 1993, 54, 27–31. [Google Scholar] [CrossRef] [PubMed]
- Kim, J.-H.; Lee, H.E.; Yoon, S.J. Study on the Speciation of VOCs at Oil Refining Plant Fenceline through Active Sampling. Atmosphere 2023, 14, 485. [Google Scholar] [CrossRef]
- Nazarparvar-Noshadi, M.; Yadegari, M.; Mohammadian, Y.; Fakhri, Y. The exposure to BTEX/Styrene and their health risk in the tire manufacturing. Toxin Rev. 2022, 41, 437–445. [Google Scholar] [CrossRef]
- de Vocht, F.; Sobala, W.; Wilczynska, U.; Kromhout, H.; Szeszenia-Dabrowska, N.; Peplonska, B. Cancer mortality and occupational exposure to aromatic amines and inhalable aerosols in rubber tire manufacturing in Poland. Cancer Epidemiol. 2009, 33, 94–102. [Google Scholar] [CrossRef]
- Khasraghi, S.S.; Momenilandi, M.; Shojaei, A. Tire tread performance of silica-filled SBR/BR rubber composites incorporated with nanodiamond and nanodiamond/nano-SiO2 hybrid nanoparticle. Diam. Relat. Mater. 2022, 126, 109068. [Google Scholar] [CrossRef]
- Forrest, M. The Composition and Nature of Vulcanisation Fumes in the Rubber Industry—A Technical Review. Prog. Rubber Plast. Recycl. Technol. 2015, 31, 219–264. [Google Scholar] [CrossRef]


Disclaimer/Publisher’s Note: The statements, opinions and data contained in all publications are solely those of the individual author(s) and contributor(s) and not of MDPI and/or the editor(s). MDPI and/or the editor(s) disclaim responsibility for any injury to people or property resulting from any ideas, methods, instructions or products referred to in the content. |
© 2024 by the authors. Licensee MDPI, Basel, Switzerland. This article is an open access article distributed under the terms and conditions of the Creative Commons Attribution (CC BY) license (https://creativecommons.org/licenses/by/4.0/).