Abstract
Most Penman-Monteith-Leuning (PML) evapotranspiration (ET) modeling studies are dominated by consideration of meteorological, energy, and land use information, etc., but the dynamic coupling of soil moisture content (SM), especially in terms of improving accuracy through assimilation, lacks sufficient attention. This paper proposes a research framework for the dynamic coupling simulation of PML model and SM based on data assimilation, i.e., the remote sensing monitored SM is combined with soil evaporation of PML to obtain high-precision time-continuous SM data through data assimilation; simultaneously, dynamical soil evaporation coefficients are generated based on the assimilated SM to improve the simulation accuracy of the PML model. The new scheme was validated at a typical irrigation zone in north China and showed obvious improvements in both SM and ET simulations. Moreover, the effect of the assimilation of SM on the simulation accuracy of ET for different crop growth periods is further analyzed. This research provides a new idea for the coupling simulation of the SM and PML models.
1. Introduction
Evapotranspiration (ET) is an important component of the regional water cycle [1], and obtaining ET with high spatial and temporal resolution is of great significance for agricultural water management research [2]. ET monitoring based on remote sensing technology is an effective way to obtain ET [3], while soil moisture content (SM) affects the heat exchange between the surface and the atmosphere [4]. So ET monitoring by remote sensing needs to be tightly coupled with the dynamic changes of SM [5]. However, spatially and temporally continuous SM at the field scale (better than 30 m) is not easily accessible [6], which limits the high-resolution coupled simulations of ET with SM.
Data assimilation has been widely used in ET simulation because it can integrate different model results [7] and couple multi-source data. Researchers have carried out different types of studies to improve the simulation accuracy of ET based on data assimilation. Models driving assimilation processes include land surface process models [8,9], water balance models [10], and hydrologic process models [11]. In general, the data assimilation studies of ET are mostly focused on the coupling with hydrological processes, where the focus was on the key parameters and important variables of the model. Moreover, the spatial resolution of ET obtained from hydrological models was not fine enough. In terms of coupling with SM from the perspective of the ET mechanism, Cui and Jia [6] proposed an assimilation scheme of SM in the framework of SVET (soil-vegetation EvapoTranspiration). However, the spatial resolution of SM data using ASCAT (advanced scatterometer) is low, and the ET simulation results need to be further optimized for field-scale ET monitoring.
In order to realize the coupled simulation of time-continuous SM and ET at the field scale, based on SM (spatial resolution of 10 m) inverted from Sentinel-2 images and driven by an SM change model, we achieve temporal continuity of remote sensing-based SM through data assimilation, which was then coupled with an ET model. The remote sensing-based Penman-Monteith model (PML) was selected for ET simulation, which can fully utilize the remote sensing information, and the parameterization process had a clear biophysical basis [12]. The PML model also can simulate canopy interception evaporation (Ei) [13], soil evaporation (Es), and vegetation transpiration (Ec) separately, and has achieved good simulation results in a variety of climate zones and at a variety of scales [14,15]. In this paper, we coupled the Es output of the PML model with the process of SM assimilation and fed the assimilated SM results back to the PML model to update the calculation of ET. The approach used in this study not only strengthens the dynamic coupling with SM during the ET simulation and improves the simulation accuracy, but also creates conditions for obtaining high spatial and temporal resolution SM. The study can provide a reference for realizing the coupled simulation of the PML model with SM data derived from discrete remote sensing images.
2. Methods
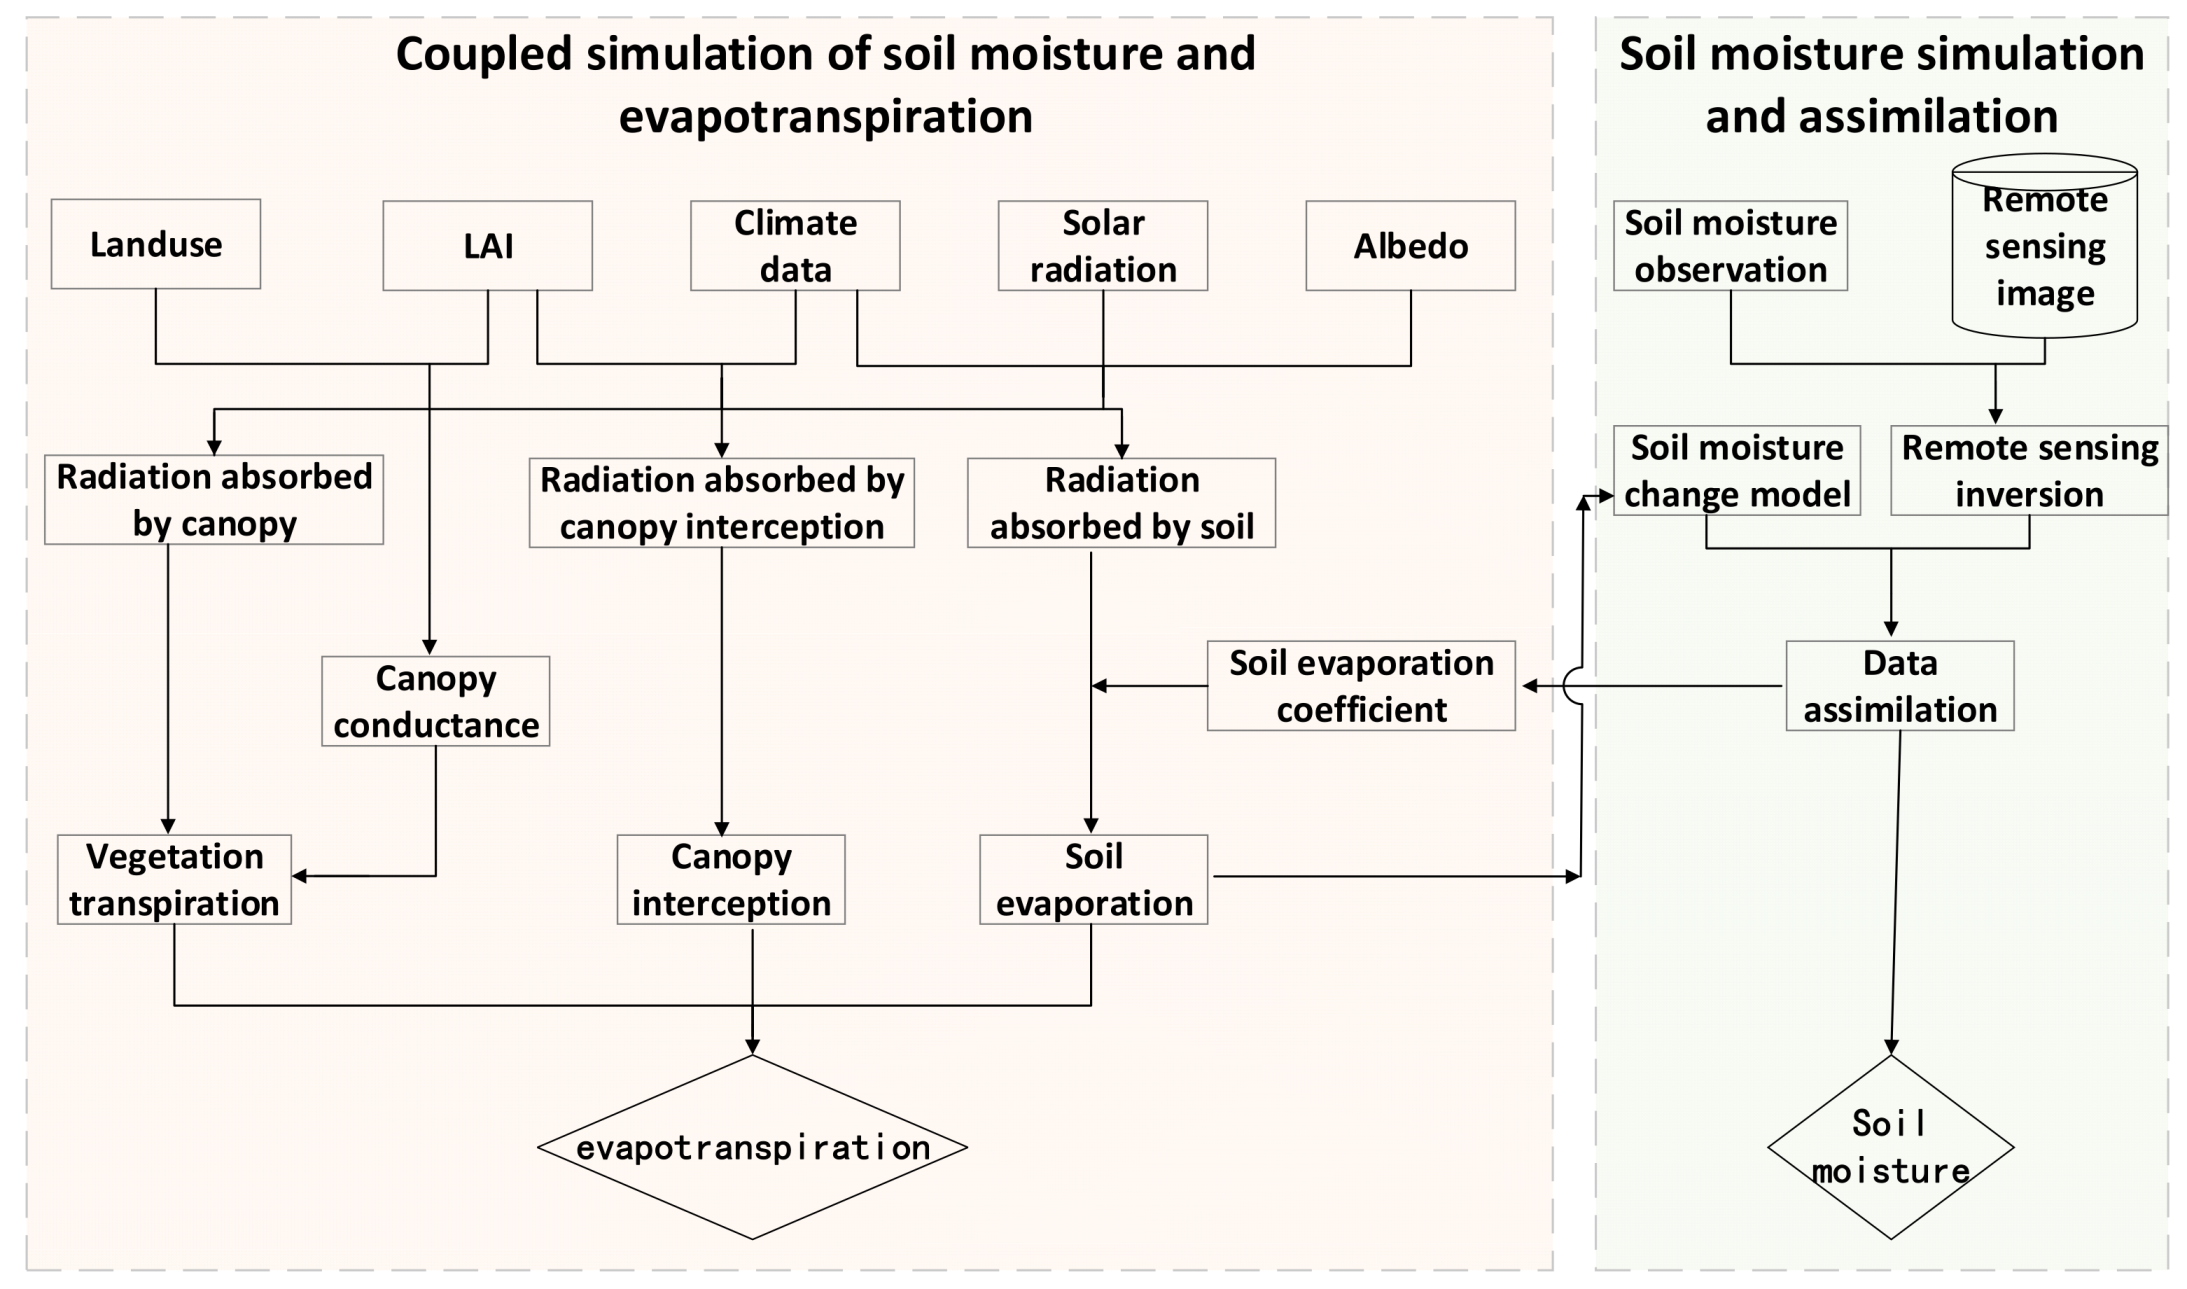
This paper extends the coupled simulation with SM and the assimilation framework based on the PML ET model. The overall research flowchart is shown in Figure 1. There are two important parts of the research framework: (1) SM inversion with remote sensing data and assimilation with the SM change model, which can provide time-continuous SM data; (2) improvement of ET simulation by introducing a dynamic soil evaporation coefficient () parameterization scheme. The overall objective of this research framework is to obtain high-precision surface SM series through data assimilation and to improve the simulation accuracy of ET by coupling the SM data with the PML model.
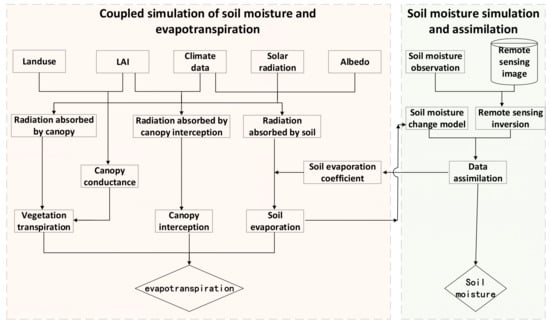
Figure 1.
The flowchart of the method used in this study.
2.1. PML Model
In this paper, we use the PML model, which considers canopy interception evaporation and divides surface ET into Ei, Es, and Ec. The main calculation form of the model is as follows:
in which is latent heat of vaporization; is ET; is retention capacity [13]; is calibration coefficient, both of which are functions of LAI; is daily precipitation; is the slope of temperature-saturated water pressure curve; is the energy absorbed by the canopy; is the density of air; is specific heat of air at constant pressure; is the wet and dry table constants; is vapor pressure deficit of air; is aerodynamic conductance; is canopy conductance; is soil evaporation coefficient; is the energy absorbed by soil. The calculation of theses variables can be found in the work of reference [13].
Considering the effect of SM on Es, this paper parameterizes according to the following equation [16]:
in which is SM; is the maximum SM for the study period; is the minimum SM for the study period. Overall, we used the PML model to calculate total daily ET and Es. The output of Es was used in the simulation process of SM.
2.2. SM Change Model
This study focuses on coupling the surface SM based on remote sensing inversion with for the PML model. However, the model structure of PML does not stratify the soil. Therefore, it is not appropriate to set for soil layers of different depths. For the convenience of calculation, the soil is divided into two parts, namely, the surface layer and the subsurface layer. Among them, the depth of the surface soil was taken as 50 mm [17], and the inversion of the Sentinel-2 images was used as the observation values of the surface SM. The variation of SM in the topsoil layer can be described by the following equation [6]:
where is the SM at the surface layer at the beginning of the tth day; is the water flows into the first layer; is the water flow from the surface layer to the subsurface layer; is the Es at the beginning of (t − 1)th day; is the depth of the surface soil layer. The specific calculation methods for each parameter can be found in the work of Cui and Jia [6]. Based on the SM change model, we obtained the daily SM data, which were called by the PML model to update the calculation of .
2.3. Data Assimilation Model
In order to improve the simulation accuracy of SM, this paper introduces the Ensemble Kalman Filter (EnKF) algorithm to assimilate the process of SM change, which has been widely used in the simulation of water cycle elements [18,19,20,21]. The EnKF includes two steps: (1) forecast: all ensembles at moment t are brought into the SM change model, and the predicted values of all state variables at moment t + 1 are obtained by propagating forward the model; (2) update: if remote sensing observations are available at moment t + 1, the observations are used to update the state for each ensemble.
In this paper, the coupled model of SM and PML is denoted as PML_SM. The model forecast can be described as:
where is the analyzed value of the state of the ith set at time t − 1; a is the predicted value of the state at moment t; is the coupled model; is the model error, which obeys a normal distribution with a mean of 0 and a variance of .
The model update can be described as follows:
where is the gain matrix; is the remote sensing-based SM observation at moment t; is the observation operator. The specific calculation methods for each variable can be found in the work of reference [22]. In the PML_SM model, the EnKF assimilation algorithm is mainly used in the simulation of SM. The state of the SM change model is corrected by assimilating the data on remote sensing monitoring days to improve the accuracy of SM simulation.
2.4. Evaluation of the Assimilation Results
The performance of assimilation for estimating SM and ET were evaluated by comparing the outputs of the model against observations. Two statistics, namely the Pearson correlation coefficient (r), and the root mean square error (RMSE), were used to evaluate the simulated outputs. The indices can be calculated as follows:
3. Study Area and Data
3.1. Study Area
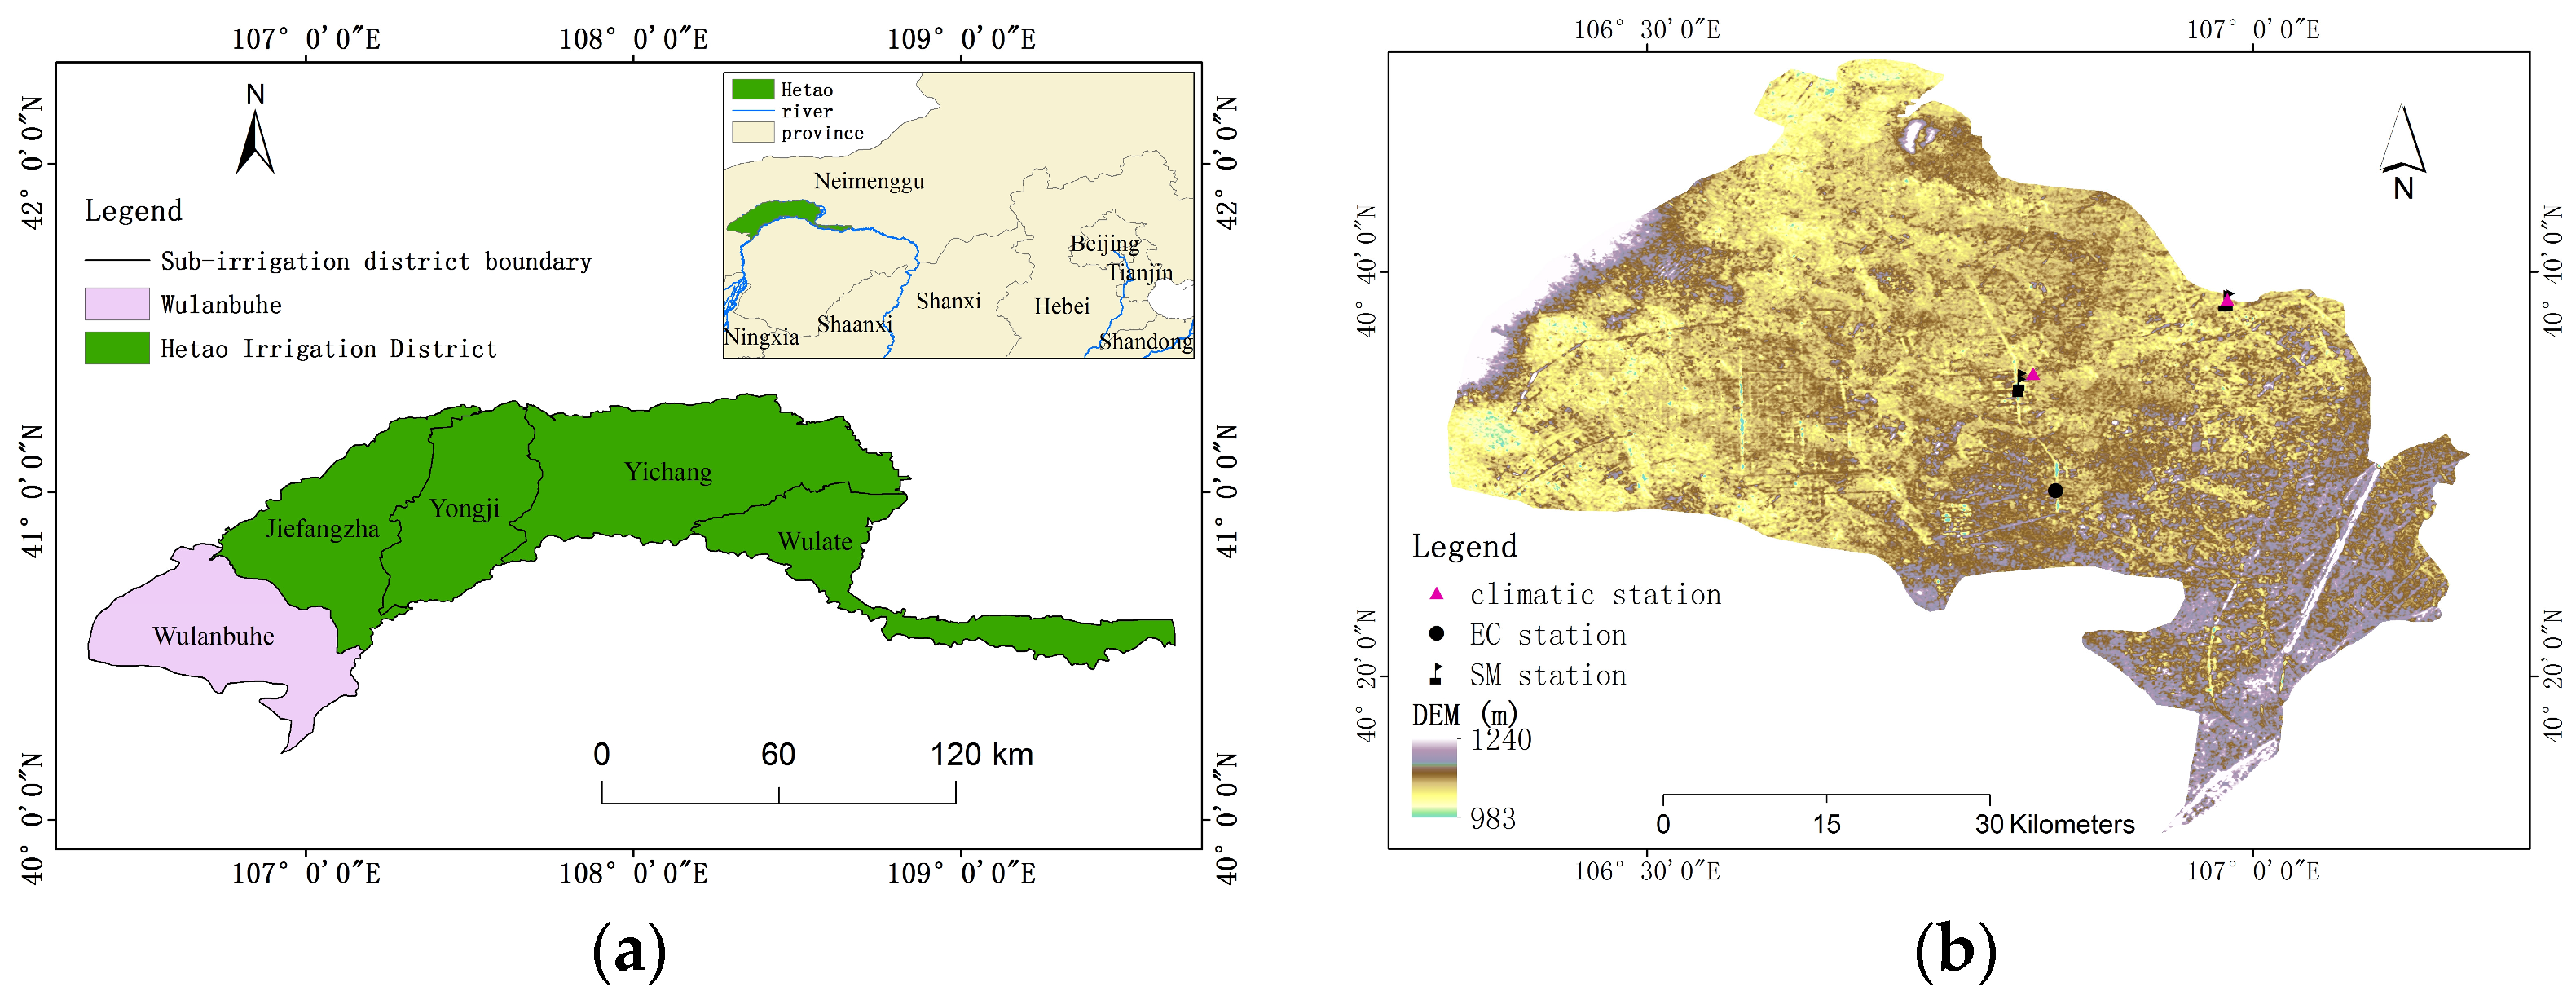
The eddy covariance (EC) observation station used in this paper is located in the Hetao irrigation district (Figure 2), which belongs to Bayannur City. The measurement station is located in the irrigation area with sufficient heat and more than 3000 h of sunshine throughout the year. The frost-free period in this area is 120–150 days, and the cropping system is annual. The study area is located in an arid and semi-arid region, with annual precipitation ranging from 130 to 250 mm and annual ET of 2000 to 2400 mm. The soil type near the station is mainly sandy loam, and the main crops include cucurbit and corn.
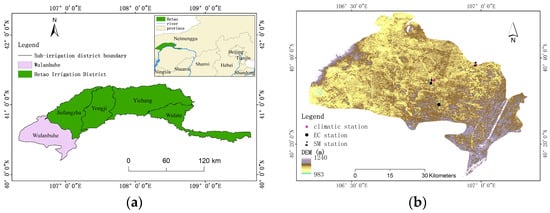
Figure 2.
The overview of the study area. (a) Location of the Hetao irrigation district in Northern China. (b) Overview of the Wulanbuhe sub-irrigation district and the distribution of monitoring stations.
3.2. Gound Monitoring Data
Meteorological data were obtained from the TRM-ZS3 small weather station deployed in the study area, including temperature, precipitation, humidity, wind speed, and other elements. The monitoring frequency of meteorological elements was 15 min, and the average data for each day were obtained after statistics. Surface SM data were obtained from automatic moisture stations deployed in the irrigation area, and the data were collected at a frequency of 1 h. In this study, the monitoring results of the first layer were selected to characterize the surface SM, and remote sensing inversions were performed accordingly. The flux data were obtained from the SCIRGA open-circuit EC system observations deployed in the irrigation area, and the data were collected at a frequency of 30 min. A test of the energy balance showed that the energy closure of the observations was above 80% [23]. The check of the energy closure of the monitoring data at this site can be found in the work of reference [24].
3.3. Remote Sensing Data
ET calculations based on the PML model mainly use MODIS data for LAI (MCD15A2H) and surface albedo (MCD43A3) (https://www.earthdata.nasa.gov/ (accessed on 7 January 2022)). The surface albedo was quality-controlled and interpolated to obtain daily scale data. The Sentinel-2 images (https://dataspace.copernicus.eu/ (accessed on 26 November 2021)) were used to invert the surface SM. Since time-continuous SM monitoring is not carried out at the location of the EC system, in this paper, the surface SM on the transit day of the Sentinel-2 was obtained by constructing the relationship between the modified perpendicular drought index (MPDI) and the measured surface SM at the ground station [25]. Then, the simulated values of surface SM at the image where the EC system was located were extracted as input data for coupling and assimilating with the PML model.
4. Results
4.1. Performance of the SM Model Driven by Remote Sensing Observations
The coupled model PML_SM and EnKF algorithm are integrated (denoted as PML_SM_DA) to realize the time-continuous simulation of surface SM and ET at the EC station. For the assimilation scheme, the process noise variance is taken as 0.005, and the observation noise variance is taken as 0.03. Meanwhile, this paper utilizes the original SM change model for the surface SM calculation (denoted as PML_SM_noDA) to analyze the influence of the two schemes on the SM results. Considering the temporal completeness of the observation data from the SM station, EC system, and meteorological station in the irrigation area, the time period of the day of the year (DOY) for 2021, namely, from 199 to 275, was selected for simulation and assimilation. In the assimilation process, in the SM change model was calculated by the original PML model. The SM at the new step was called by PML and the was updated according to Equation (2).
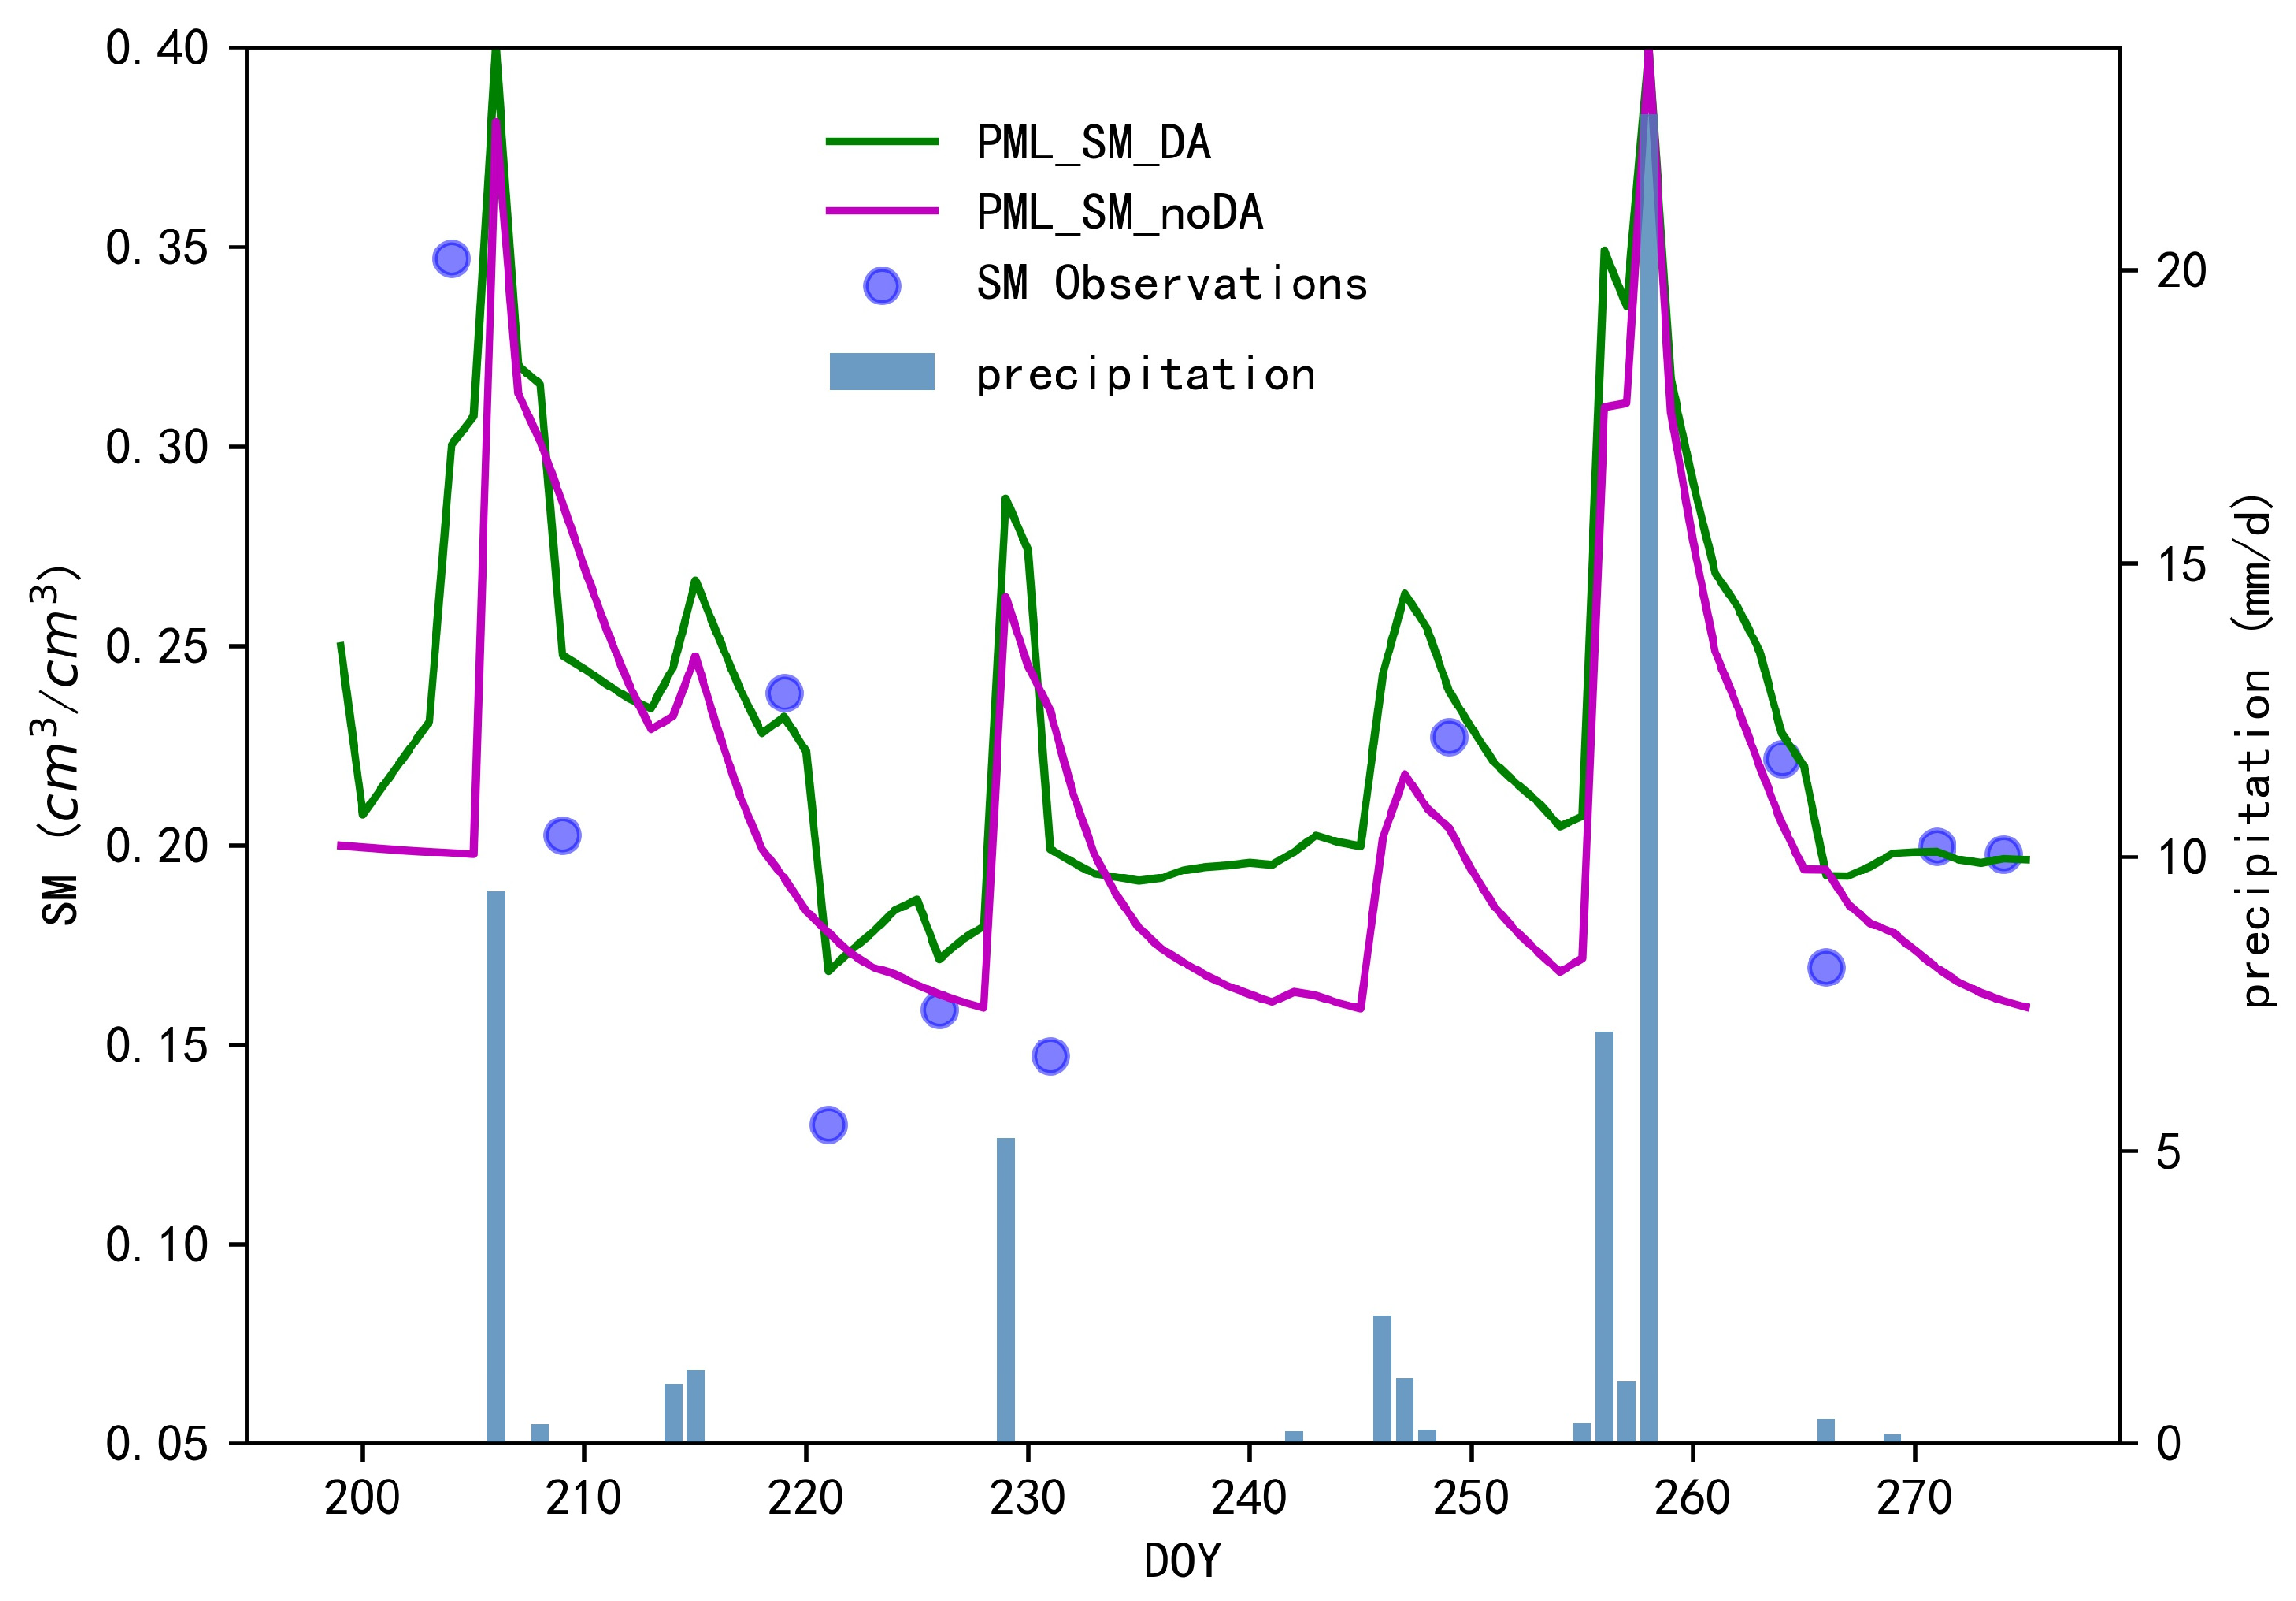
A comparison of the results of SM before and after assimilation is shown in Figure 3. The comparison of the SM simulation process with rainfall shows that the surface SM change model responds significantly to precipitation. For example, on dates with significant rainfall such as days 206 and 258 in 2021, the SM increased significantly under both scenarios. However, data assimilation further improved the simulation accuracy of surface SM. The r of the simulated values of SM after assimilation to the observation values was 0.89, the RMSE was 0.02 cm3/cm3. Correspondingly, the r of the PML_SM_noDA scenario was 0.06, the RMSE was 0.05 cm3/cm3. The results showed that the simulation process of SM was closer to the remote sensing inversion values after data assimilation.
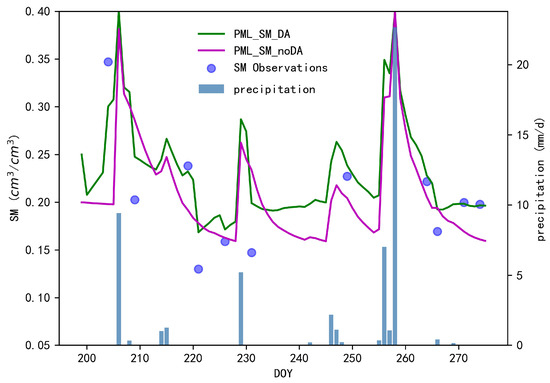
Figure 3.
The time series of simulated SM of PML_SM_DA and PML_SM_noDA against remote sensing monitoring values.
4.2. ET Simulations Coupling with Different
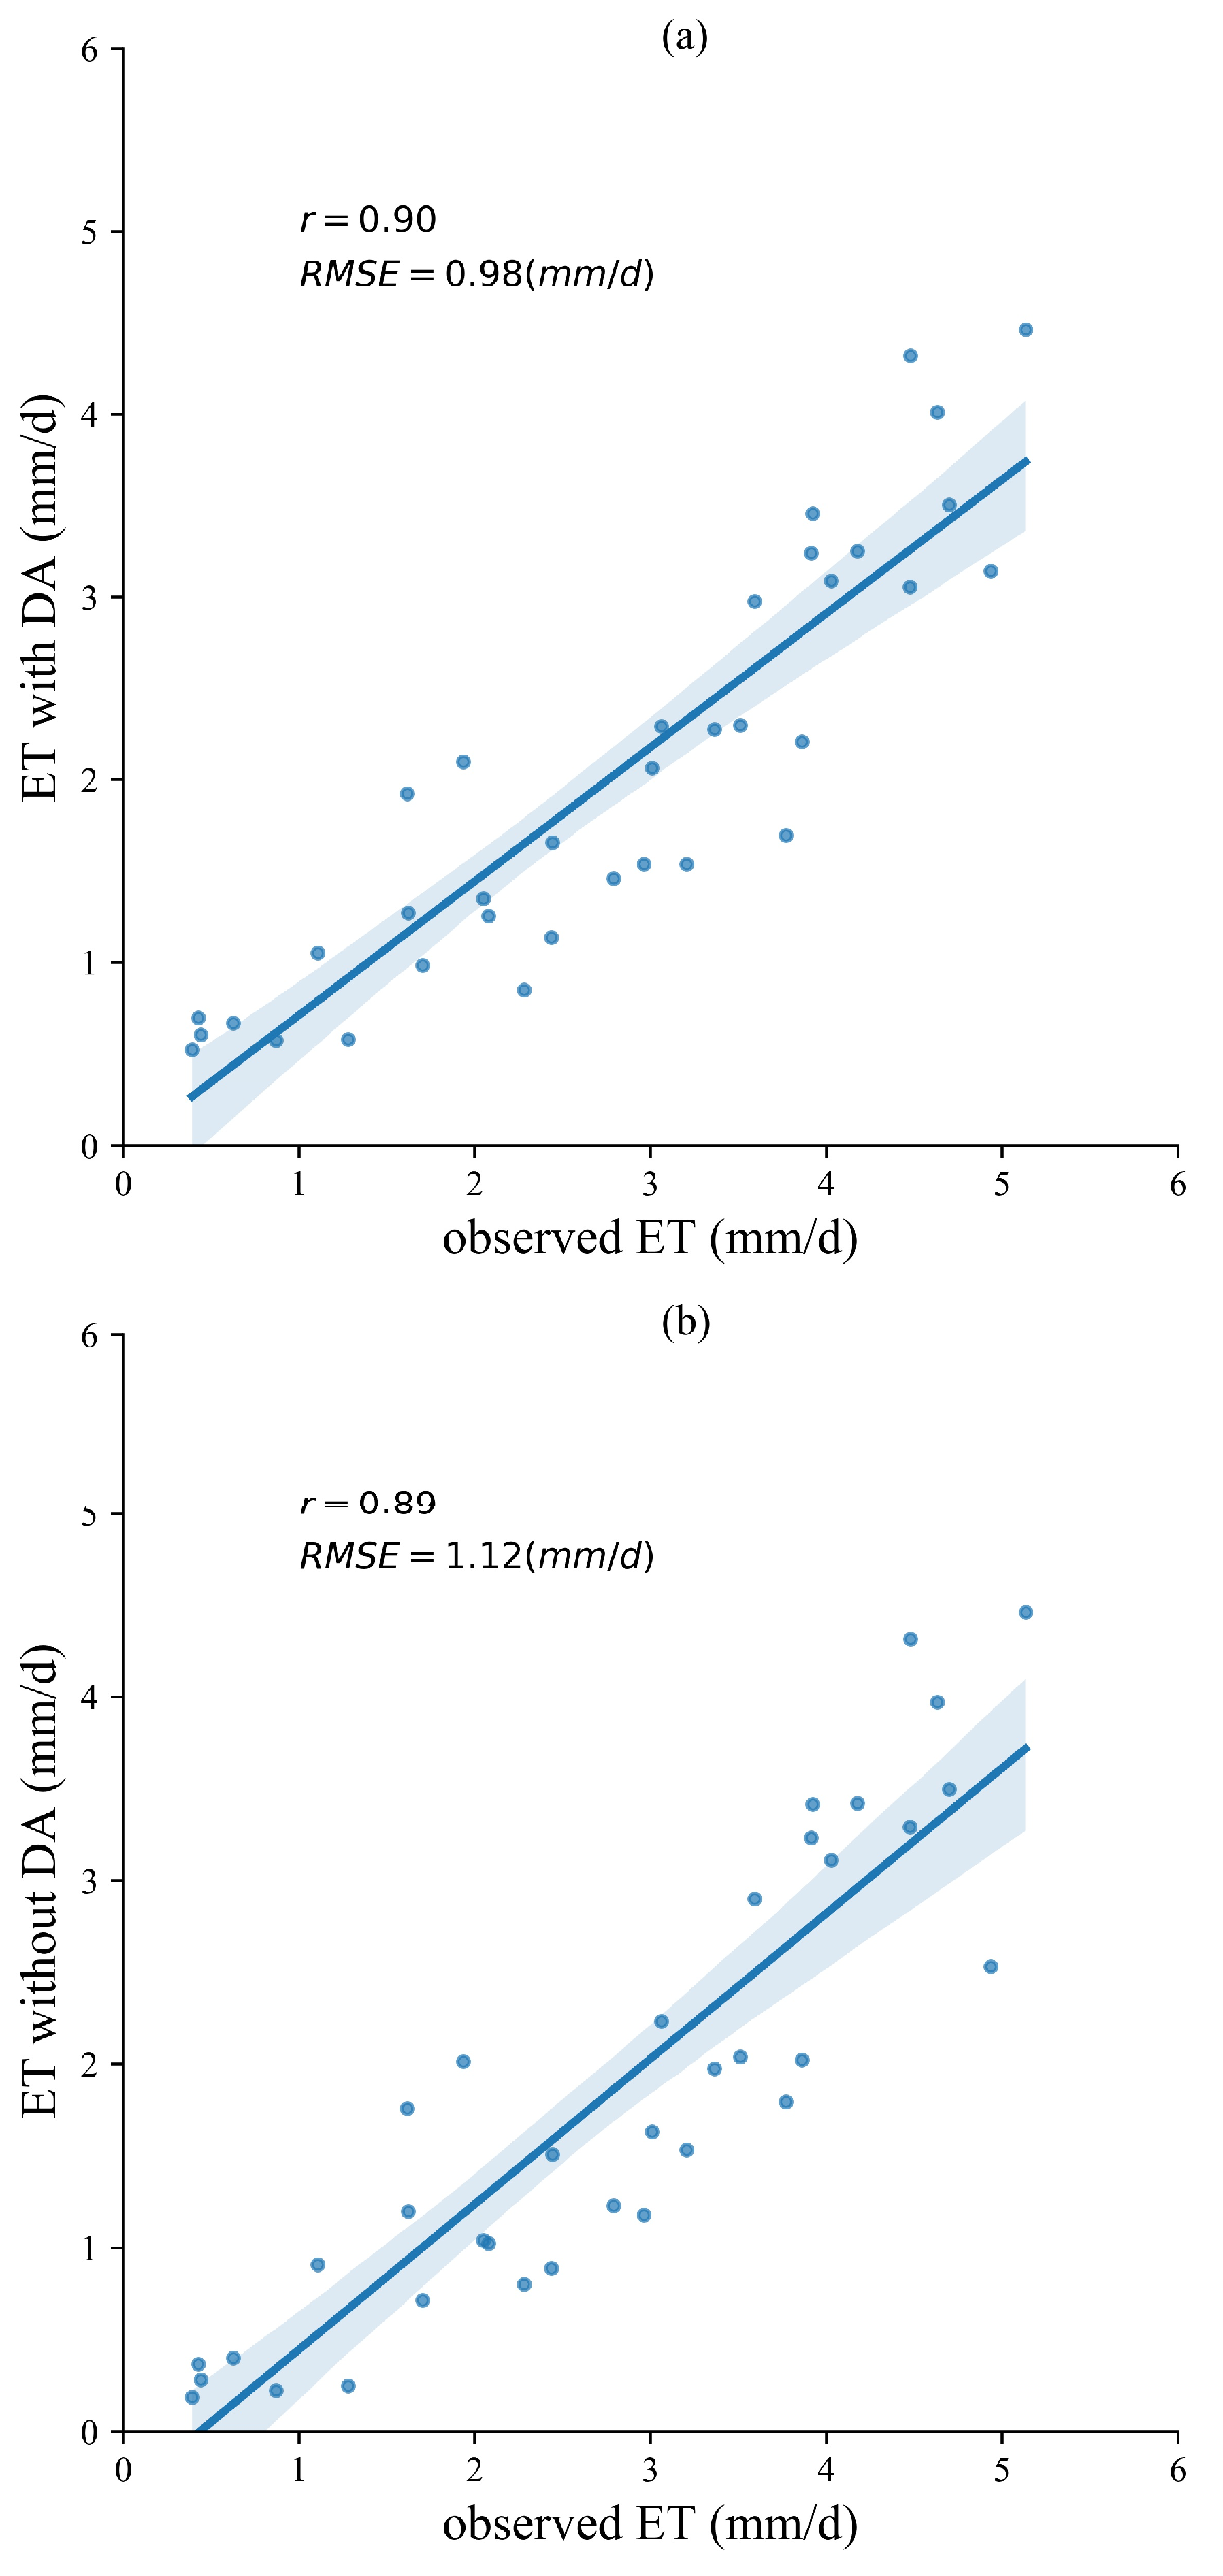
Figure 4 shows the ET estimates from the PML with a constant , PML_SM_DA, and the PML_SM_noDA models against the observed ET at the EC station. The overall r and RSME of the PML_SM_DA are 0.90 and 0.98 mm/d, respectively (Figure 4a). The PML_SM_DA scheme showed better accuracy than the PML_SM_noDA, which has r and RMSE of 0.89 and 1.12 mm/d (Figure 4b). This is because, after data assimilation, the assimilated values of SM are closer to the observed values. The SM becomes larger, the higher obtained based on the coupling method in this paper, and the higher the Es. Therefore, although the r between simulated and observed values of ET does not change significantly, the RMSE decreases by 0.14 mm/d. The PML model with a constant showed the worst performance with r 0.87 (Figure 4c). Although this scheme has a good RMSE, the plots simulated and observed are more off the 1:1 line, especially on the dates with low ET. Overall, the ET obtained by the PML_SM_DA scheme has the best accuracy among all the three schemes.
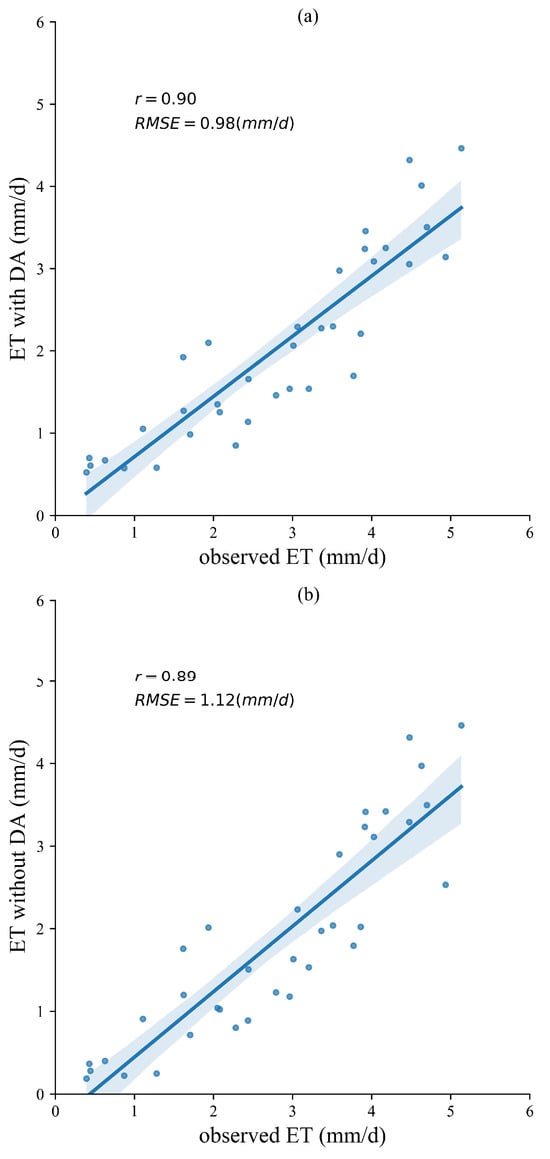
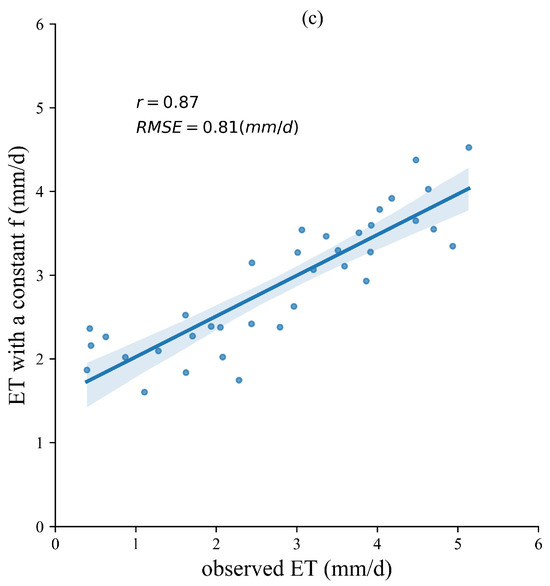
Figure 4.
The time series of simulated ET of PML_SM_DA (a), PML_SM_noDA (b), and PML with constant (c) against observed values.
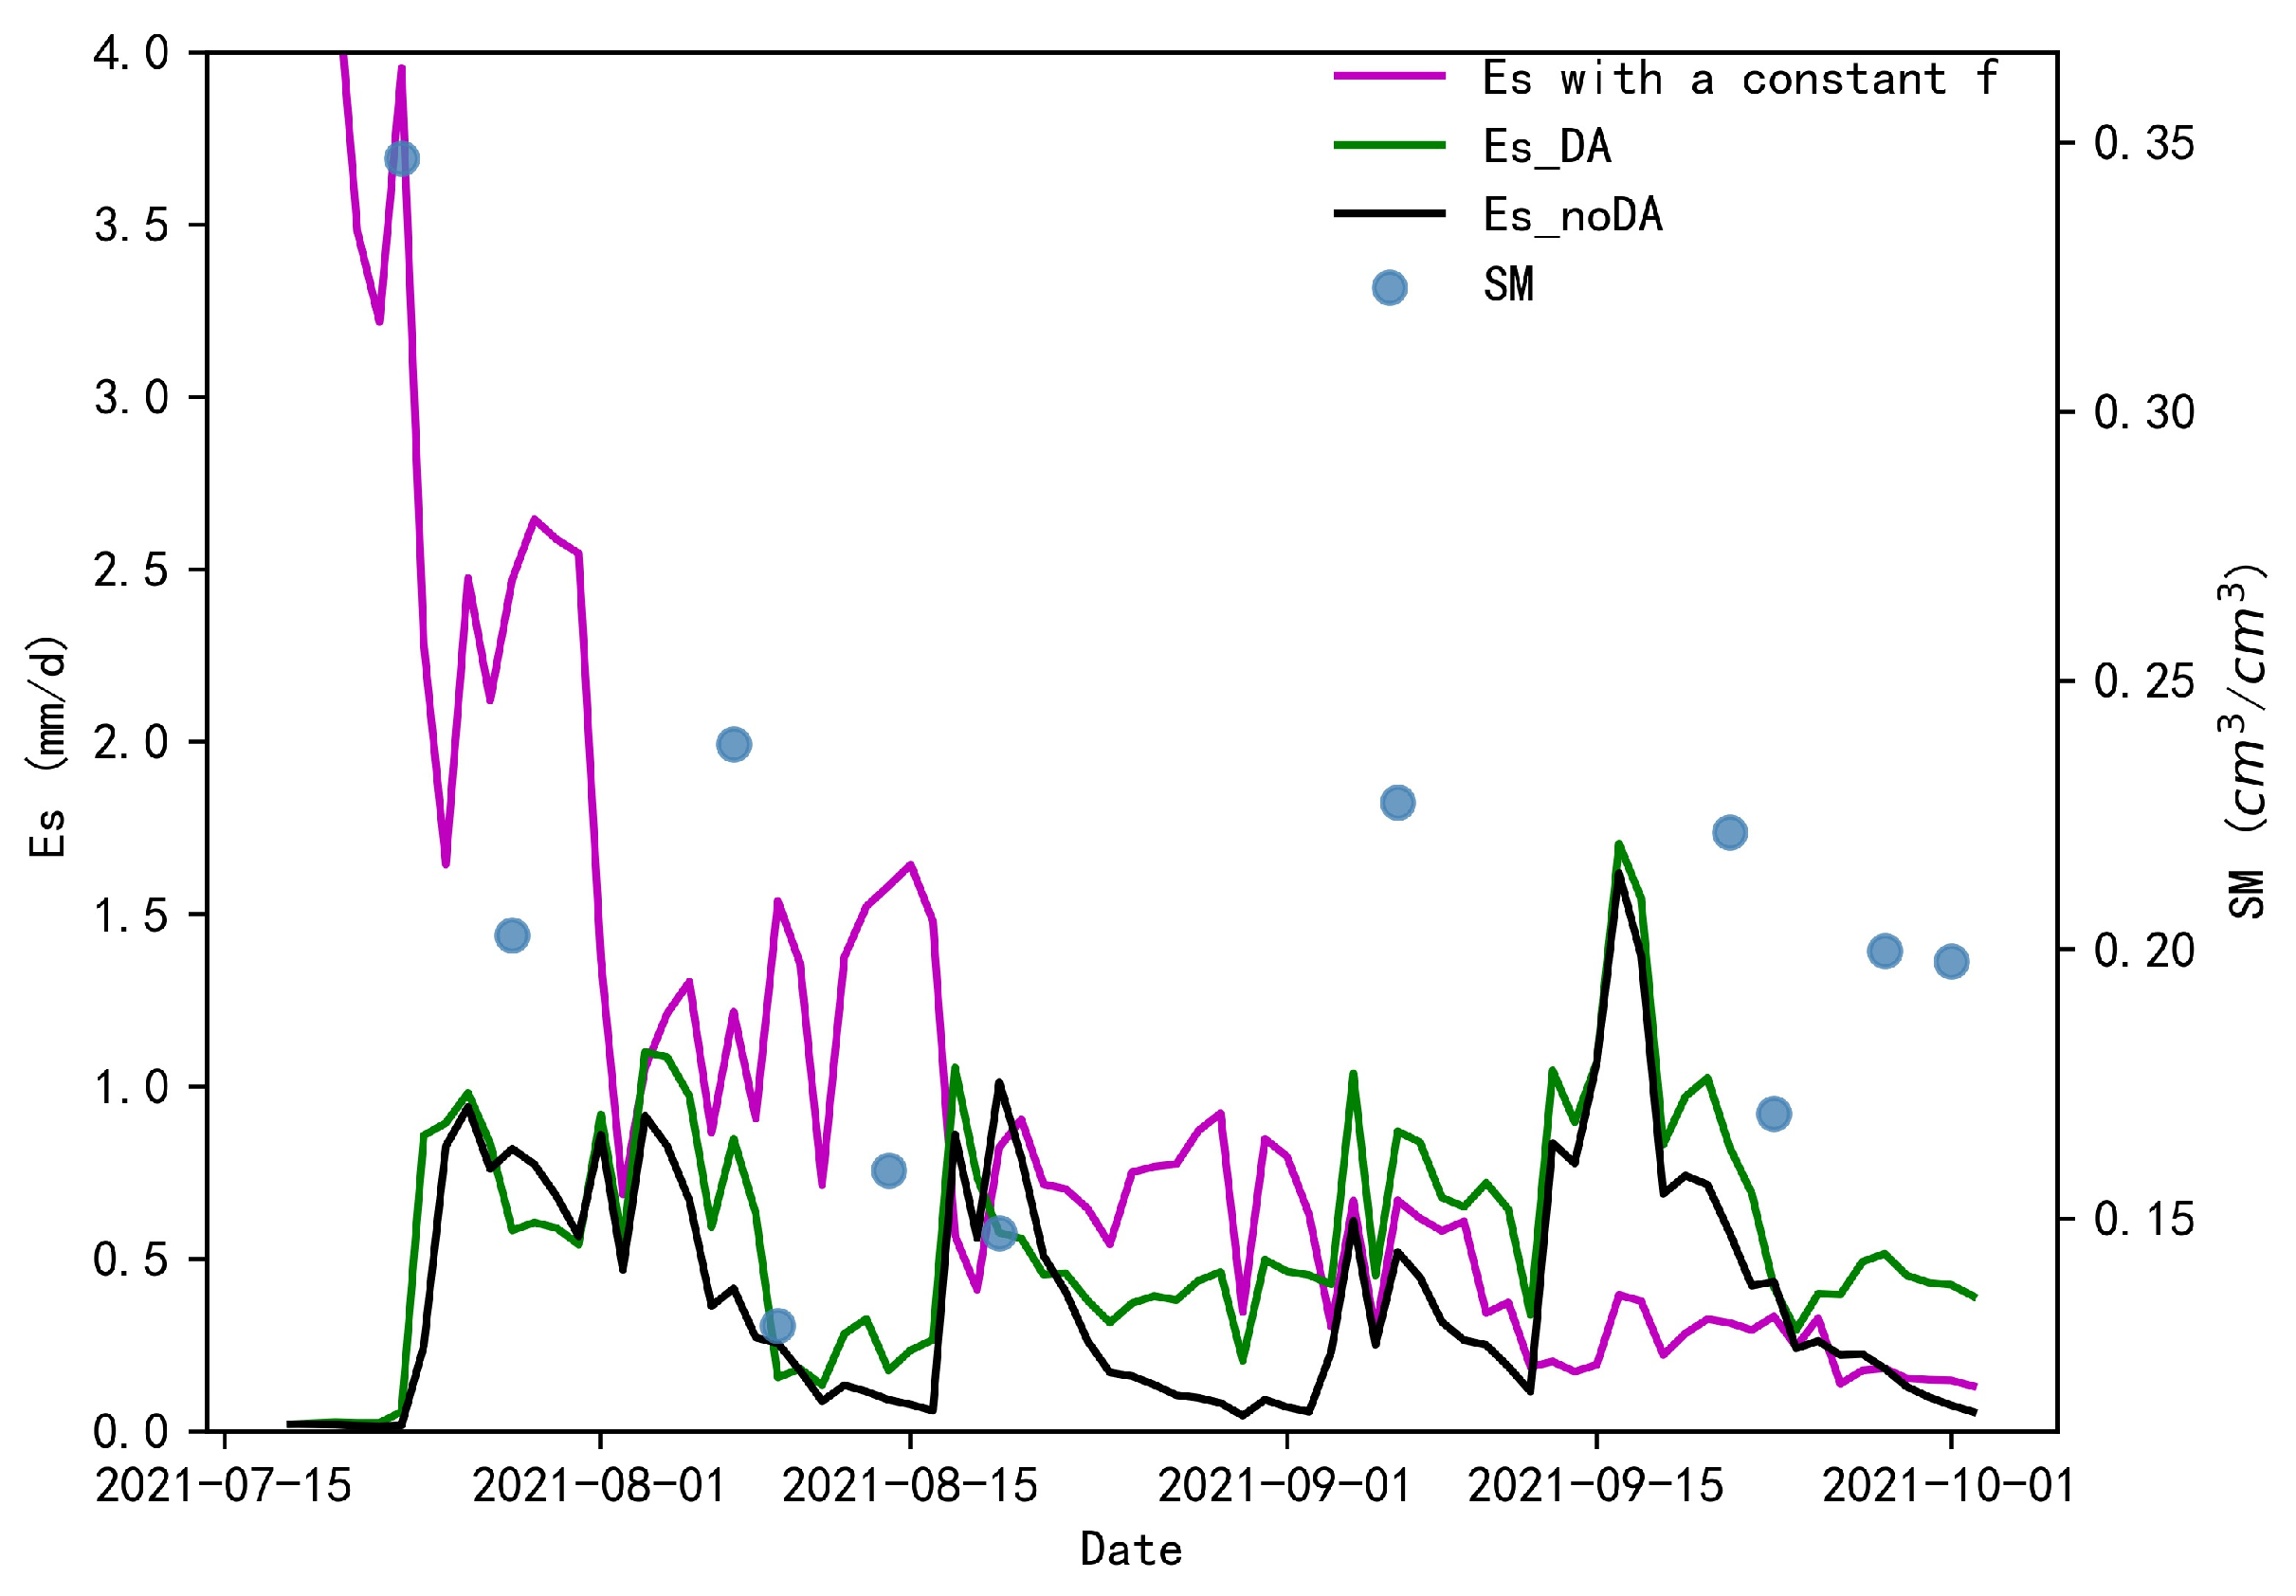
From the basic architecture of the PML model, it is clear that the calculation of each component of ET is relatively independent. The coupling of SM and ET in this paper is mainly used to improve the and therefore mainly affects the results of Es calculations. To ensure the accuracy of the simulation of ET on an annual scale, the optimal value of tends to be close to the upper bound of its physical meaning [26,27]. In this sense, if the is always large, the soil will always have a high evaporation capacity, and the simulation results of ET will be biased high (Figure 4c). Es is obviously large for most of the growing season (Figure 5) and correlated poorly with changes in SM, which is also inconsistent with the physical mechanism of ET. Figure 4 suggests that dynamically coupling SM information with the ET simulation process can improve the accuracy of ET simulation more than assigning a constant value. Further, the correction of the SM change process by data assimilation can further reduce the uncertainty of the ET simulations while improving the accuracy of SM. Overall, the PML_SM_DA model improved the total ET for the study area compared to the PML_SM_noDA and PML model.
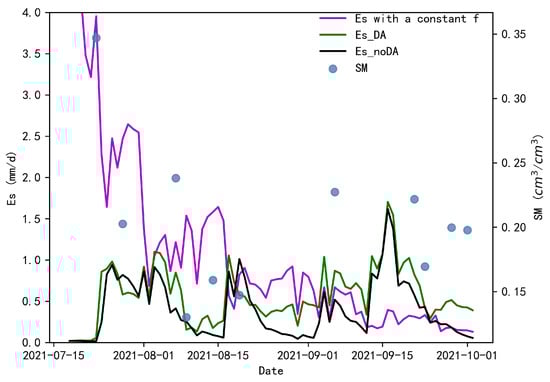
Figure 5.
The time series of simulated Es of the different schemes against remote sensing-based SM.
4.3. Temporal Variability of ET Estimation
The seasonal variation of ET for the EC site is significant, as shown in Figure 6. During the simulation and assimilation period of this paper, crops around the EC site were dominated by corn and cucurbits. Cucurbits began to mature in late July, and in mid-to-late September, both crops were gradually harvested. As a result, the ET around the EC station showed a gradually decreasing trend during the study period. As can be seen in Figure 6, the ET obtained from both scenarios (with or without SM assimilation) were both able to portray the decreasing trend for ET.
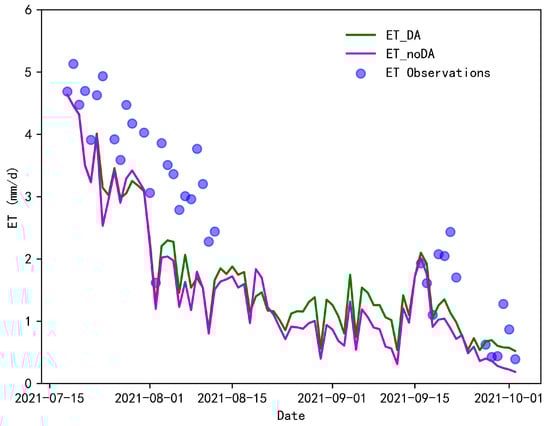
Figure 6.
Trends of different ET simulations and observations for this research.
However, in general, the ET obtained from the simulation of both scenarios were lower than the observed values, especially in August. As far as the observations are concerned, the maximum value for August observations is 3.86 mm/d. However, the maximum value for ET obtained by the PML_SM_DA scheme is 2.29 mm/d and the maximum value obtained by the PML_SM_noDA scheme is 2.23 mm/d. The comparison of the simulations of the two scenarios shows that the results of PML_SM_DA are generally larger than those of PML_SM_noDA, and this phenomenon is more evident in the months from August to September. Between August and September, the simulated results of PML_SM_DA were on average 0.2 mm/d larger than those of the PML_SM_noDA scheme. The former scheme was also closer to the observed values in terms of overall simulation accuracy.
5. Discussion
5.1. The Influence of SM Assimilation on Es
In this paper, we dynamically update the of the PML model by coupling the results of SM assimilation to achieve the optimized ET performance. Therefore, by assimilating SM, the main objective is to optimize the Es component of the PML model. In order to evaluate the effect of SM assimilation on Es, this paper simultaneously analyzed the scheme of parameterizing by using the simulation results of the PML_SM_noDA scheme. The comparison of the calculated under two schemes is shown in Figure 7. According to the figure, it can be seen that under the PML_SM_noDA scheme, has lower values on more dates as the SM decays, whereas by assimilating the SM, the change of under the PML_SM_DA scheme is more consistent with the results of the remote sensing monitored SM. Considering that is used to represent the degree of wetness of the soil [28], the series obtained by assimilation scheme better reflect the physical meaning. It should be noted that the obtained here are not all within 1 [26] due to the parameterization scheme of based on the maximum and minimum value of remote sensing monitored SM used in this paper.
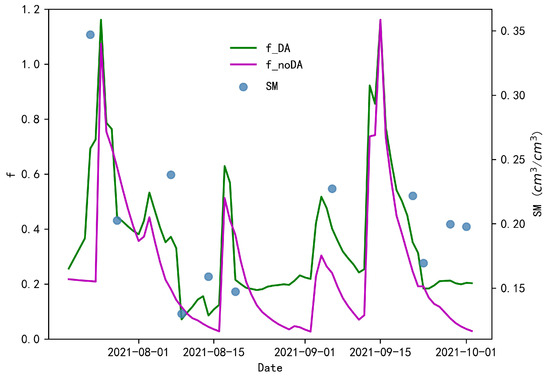
Figure 7.
The variation of with two simulation schemes for this research.
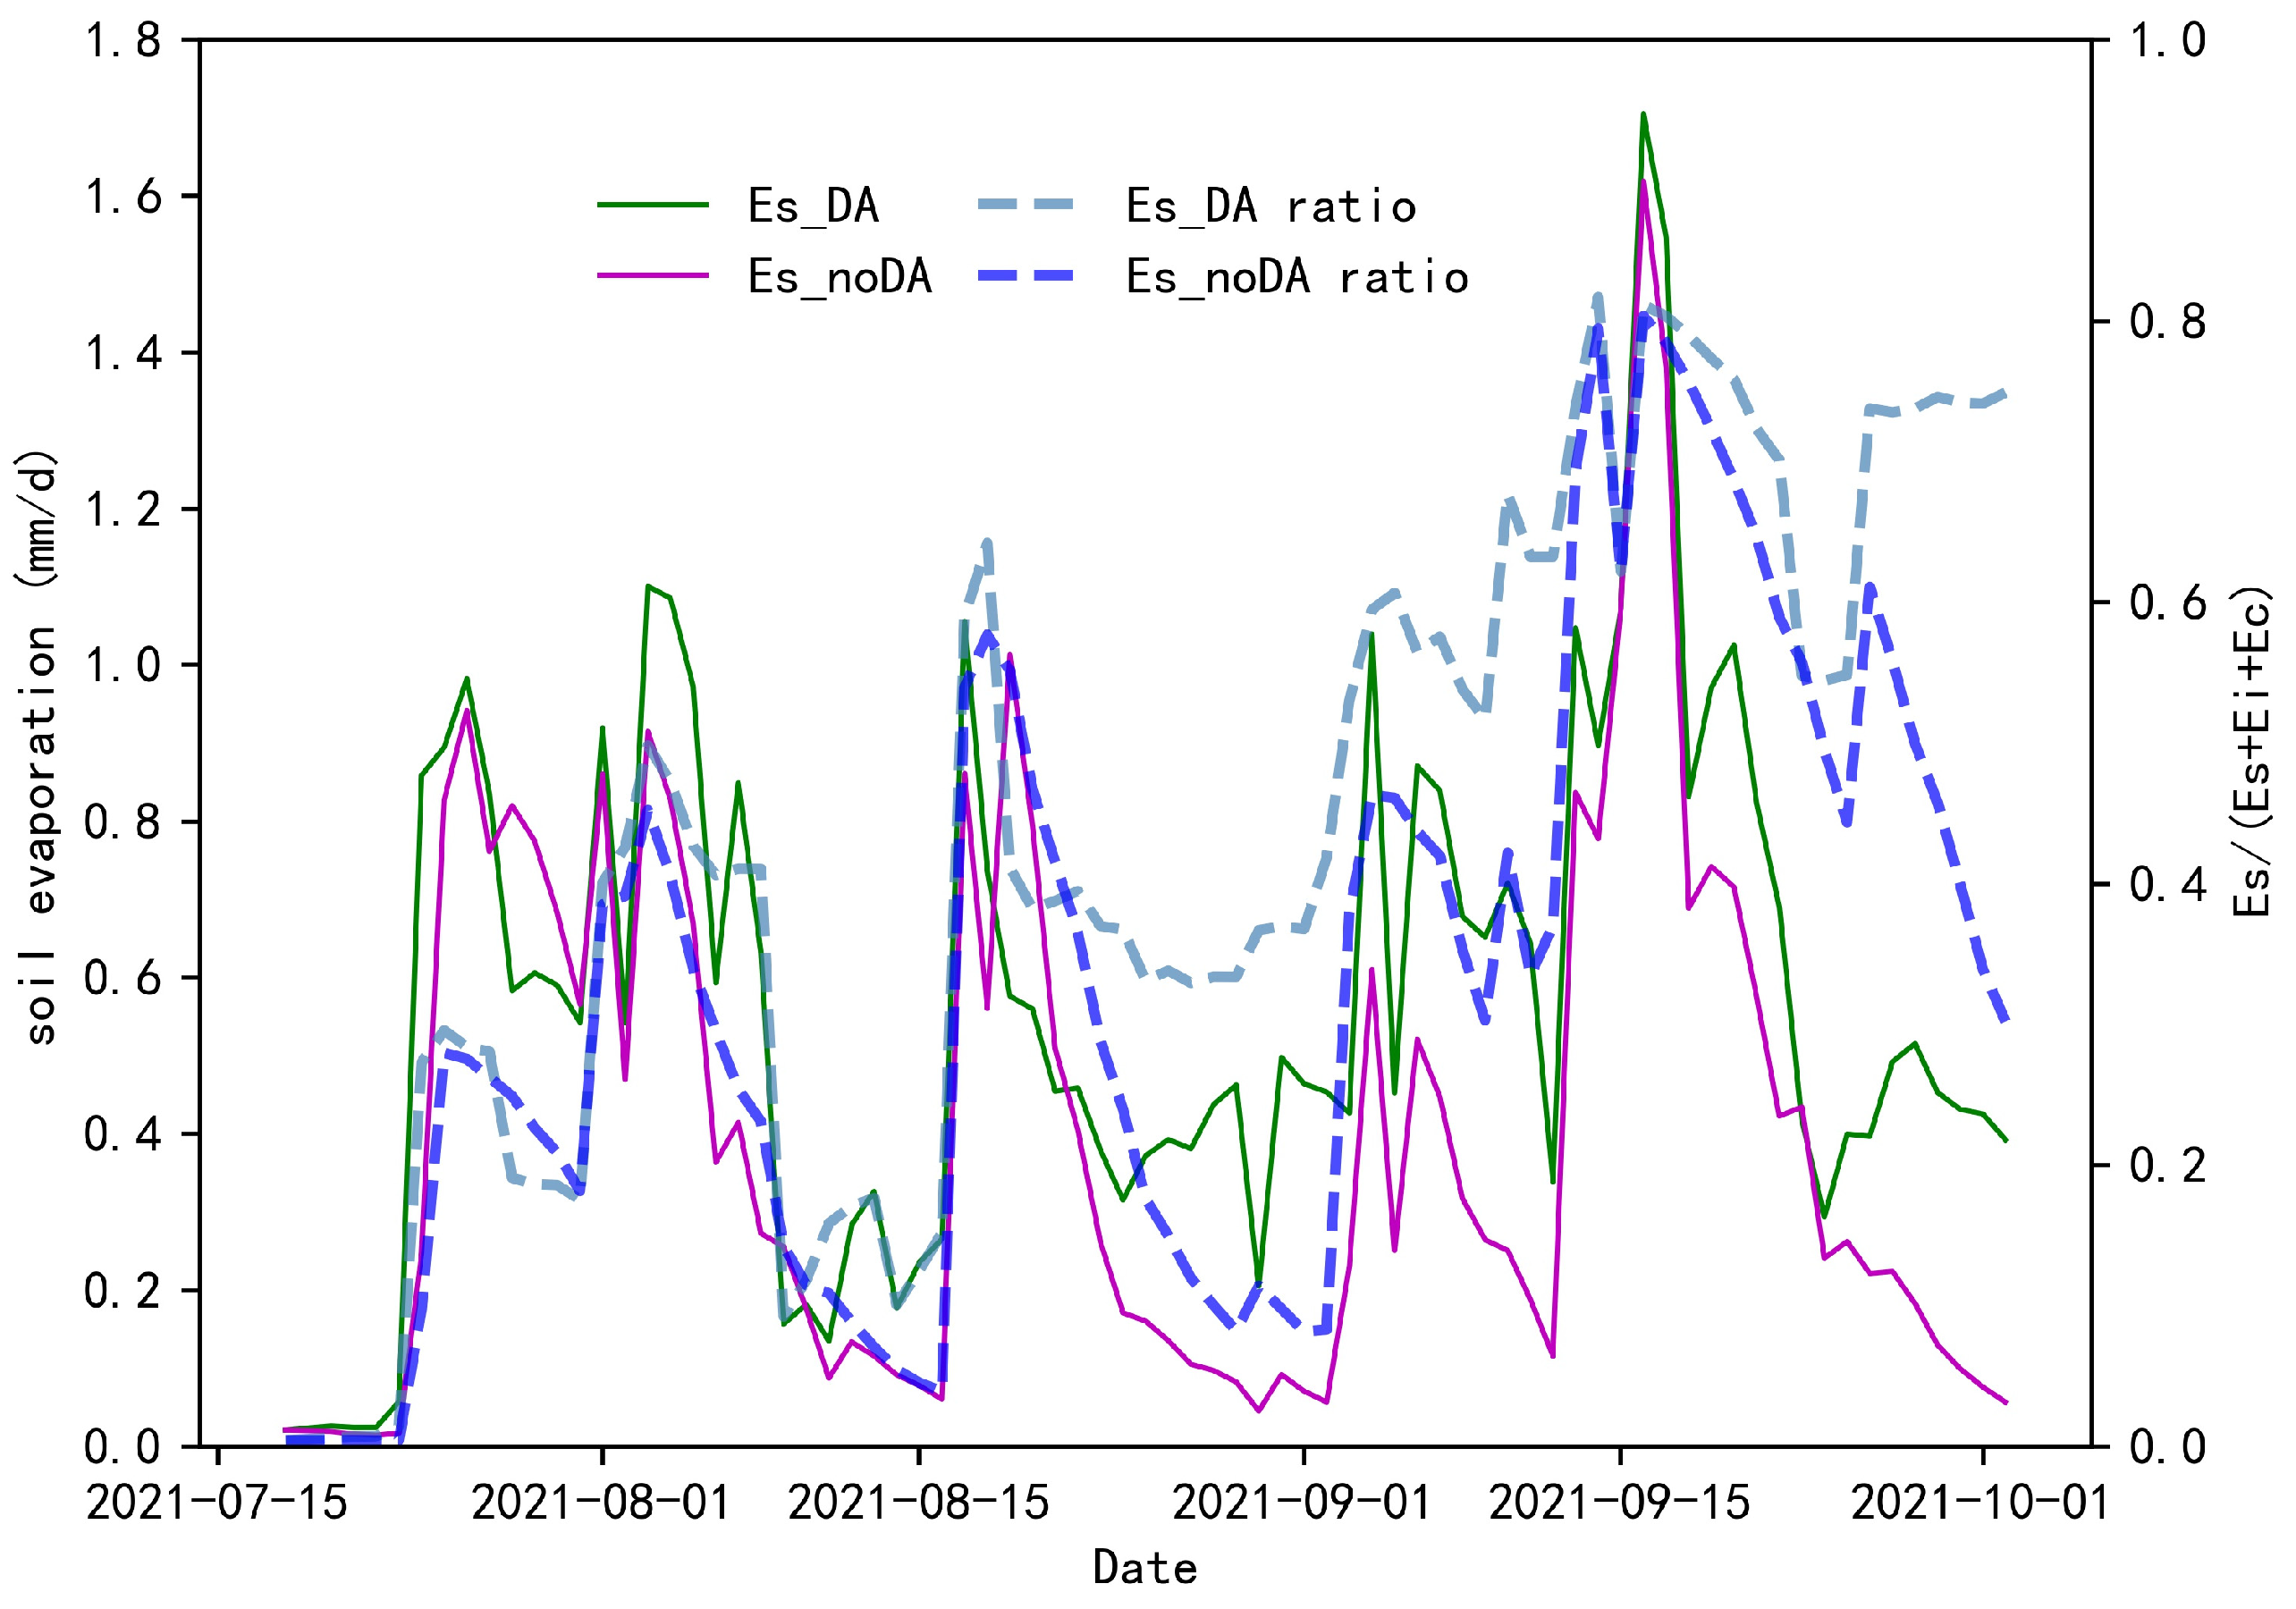
Considering that the change in SM in the simulation framework of this paper mainly affects the Es component of ET, this paper further analyzes the change in Es under different simulation scenarios. Overall, Es obtained from both schemes increased with increasing SM. However, Es under the PML_SM_DA scheme is higher than PML_SM_noDA, reflecting the fact that the simulation of Es is enhanced with assimilation (Figure 8). At the same time, changes in crop growth also have an impact on the amount and percentage of Es [24]. During the month of July, crop growth is dense and surface ET is dominated by crop transpiration. The ratio of Es to total ET averaged 0.13 and 0.14 for the PML_SM_noDA and PML_SM_DA schemes, respectively. However, from August to September, these indicators changed to 0.37 and 0.49, respectively. This indicates that the ratio of Es gradually increases as the crop reaches maturity. After data assimilation, the simulated values of SM were closer to the observed values, and thus the proportion of Es became larger.
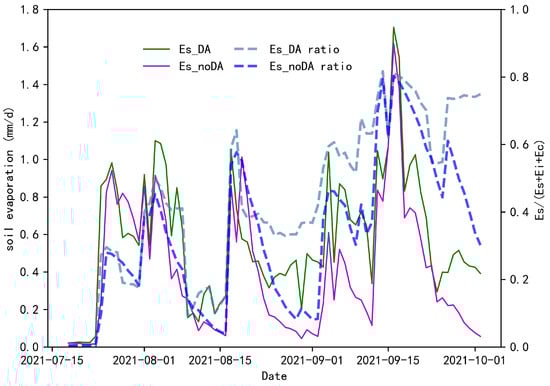
Figure 8.
The process of Es and proportion of ET under different simulation schemes.
5.2. Comparison with Other Studies in Hetao Irrigation District
Several approaches have been implemented to estimate ET in the Hetao district, including the PML model [24], the SEBS model [29,30], the SEBAL model [31,32,33], and so on. The correlation coefficient between ET and observations obtained under the PML_SM_DA scheme in this paper is 0.9, which is generally better than or close to the previous studies. For example, ref. [24] performed ET inversion only for satellite transit days with a r of 0.81, which was slightly lower than the accuracy of this paper. Reference [34] used the SEBAL model to obtain a relative error of 14.6% for ET, and the RMSE was 0.53 mm/d, which was slightly higher than the RMSE in this paper. However, the SEBAL model, as a single-source model, can only simulate the total amount of ET and is unable to resolve the various components of ET.
The features of this paper are more evident in the joint simulation of SM and ET. Both the SEBAL and SEBS models mentioned above are based on energy balance for ET inversion and lack dynamic interaction with SM in their calculations. The study in ref. [24] considered the coupled simulation of remote sensing-based SM with the PML model, but it could only be simulated for the satellite transit days because the model of SM change and data assimilation were not introduced. Therefore, its simulation results were discontinuous in time. The PML_SM_DA scheme constructed in this paper not only obtains high-precision time-continuous SM and ET data but also strengthens the physical mechanism of the ET simulation process through the joint simulation of the two water cycle elements.
5.3. Limitations of the Study
Because the structure of the PML model does not take into account the effect of SM on ET, this paper only divides the soil layer into two layers when coupling vertical changes in SM. In fact, SM changes in the root zone layer also can affect the process of crop transpiration [35]. Due to data limitations, the interaction between root zone SM and Ec was not considered for the time being in this paper when coupling SM for ET inversion. Meanwhile, the resolution of MODIS used in this paper is coarser than that of remote sensing monitoring, and this spatial heterogeneity limits the simulation accuracy of ET to some extent [36].
In this paper, the coupled simulation and assimilation mechanism of the SM and PML models are investigated by combining station monitoring data. The results show that the coupled simulation and assimilation can further improve the accuracy and scientific validity of the ET simulation. However, the method presented in this paper has only been applied at the site scale. In the near future, we will further test the feasibility of the present method on a regional scale in conjunction with remote sensing data.
6. Conclusions
By introducing land surface SM remote sensing inversion and assimilation into the PML ET model, this research drove a coupled simulation of ET and SM in the Hetao irrigation district for 2021. The comparison of EC sites and simulations showed that the SM accuracy was improved with data assimilation (r = 0.89, RMSE = 0.02 cm3/cm3). Setting dynamic based on SM data showed further improvement in the simulation accuracy of ET (r = 0.90, RMSE = 0.98 mm/d). This study may provide references for the coupled and continuous estimation of the PML model and SM.
The effect of data assimilation of SM on Es also has a distinct seasonal character. Assimilation of SM has little effect on the ratio of Es in the total ET during the peak crop growing season, but this effect increased significantly after crop maturity. The analysis of the assimilation response of ET to SM can help us to improve the understanding of the role of the data assimilation technique in the coupled simulation of ET and SM.
Subsequent studies will further enhance the dynamic coupling between root zone SM and Ec and further refine the SM movement model. On the other hand, more refined remote sensing data will also be introduced into the research framework of this paper, and the effectiveness of the present method will be further validated at a regional scale.
Author Contributions
Conceptualization, H.D.; methodology, H.D.; resources, H.X. and L.C.; data curation, Q.L.; writing—original draft, H.D.; writing—review and editing, H.D. and Q.L. All authors have read and agreed to the published version of the manuscript.
Funding
This research is founded by the National Key Research and Development Program of China (2021YFB3900602), the National Natural Science Foundation of China (52130907).
Institutional Review Board Statement
Not applicable.
Informed Consent Statement
Not applicable.
Data Availability Statement
The MODIS LAI and albedo product are available from Earth Data (https://www.earthdata.nasa.gov/ (accessed on 7 January 2022)). The Sentinel-2 image are available from https://dataspace.copernicus.eu/ (accessed on 26 November 2021).
Conflicts of Interest
The authors declare no conflict of interest.
References
- Xing, W.; Wang, W.; Shao, Q.; Song, L.; Cao, M. Estimation of Evapotranspiration and Its Components across China Based on a Modified Priestley–Taylor Algorithm Using Monthly Multi-Layer Soil Moisture Data. Remote Sens. 2021, 13, 3118. [Google Scholar] [CrossRef]
- Ling, M.; Yang, Y.; Xu, C.; Yu, L.; Xia, Q.; Guo, X. Temporal and spatial variation characteristics of actual evapotranspiration in the Yiluo river basin based on the Priestley-Taylor jet propulsion laboratory model. Appl. Sci. 2022, 12, 9784. [Google Scholar] [CrossRef]
- Purdy, A.J.; Fisher, J.B.; Goulden, M.L.; Colliander, A.; Halverson, G.; Tu, K.; Famiglietti, J.S. SMAP soil moisture improves global evapotranspiration. Remote Sens. Environ. 2018, 219, 1–14. [Google Scholar] [CrossRef]
- Li, M.; Ma, Z. Sensible and Latent Heat Flux Variability and Response to Dry–Wet Soil Moisture Zones across China. Bound. Layer Meteorol. 2014, 154, 157–170. [Google Scholar] [CrossRef]
- Meza, F.J.; Montes, C.; Bravo-Martinez, F.; Serrano-Ortiz, P.; Kowalski, A.S. Soil water content effects on net ecosystmen CO2 exchange and actual evapotranspiration in a Mediterranean semiarid savanna of Central Chile. Sci. Rep. 2018, 8, 8570. [Google Scholar] [CrossRef]
- Cui, Y.; Jia, L. Estimation of evapotranspiration of “soil-vegetation” system with a scheme combing a dual-source model and satellite data assimilation. J. Hydrol. 2021, 603, 127145. [Google Scholar] [CrossRef]
- Narayan, A.; Marzouk, Y.; Xiu, D. Sequential data assimilation with multiple models. J. Comput. Phys. 2012, 231, 6401–6418. [Google Scholar] [CrossRef]
- Chen, S. A generalized Gaussian distribution based uncertainty smapling approach and its application in actual evapotranspiration assimilation. J. Hydrol. 2017, 552, 745–764. [Google Scholar] [CrossRef]
- Meng, C.; Li, Z.; Zhan, X.; Shi, J.; Liu, C. Land surface temperature data assimilation and its impact on evapotranspiration estimates from the Common Land Model. Water Resour. Res. 2009, 45, W02421. [Google Scholar] [CrossRef]
- Xiong, M.; Liu, P.; Cheng, L.; Deng, C.; Gui, Z.; Zhang, X.; Liu, Y. Identifying the time-varying hydrological model parameters to improve simulation efficiency by the ensemble Kalman filter: A joint assimilation of streamflow and actual evapotranspiration. J. Hydrol. 2019, 568, 758–768. [Google Scholar] [CrossRef]
- Yin, J.; Zhan, C.; Ye, W. An experimental study on evapotranspiration data assimilation based on the hydrological model. Water Resour. Manag. 2016, 30, 5263–5279. [Google Scholar] [CrossRef]
- Zhang, Y.; Leuning, R.; Hutley, L.B.; Beringer, J.; McHugh, I.; Walker, J.P. Using long-term water balances to parameterize surface conductances and calculate evaporation at 0.05° spatial resolution. Water Resour. Res. 2010, 46, 5. [Google Scholar] [CrossRef]
- Duan, H.; Lu, S. The influence of canopy interception on evapotranspiration and energy distribution of PML model. China Rural. Water Hydropower 2021, 9, 80–84. [Google Scholar]
- Zhang, Y.; Chiew, F.H.S.; Pena-Arancibia, J.; Sun, F.; Li, H.; Leuning, R. Global variation of transpiration and soil evaporation and the role of their major climate drivers. J. Geophys. Res. Atmos. 2017, 122, 6868–6881. [Google Scholar] [CrossRef]
- Zhang, Y.; Peña-Arancibia, J.L.; McVicar, T.R.; Chiew, F.H.; Vaze, J.; Liu, C.; Lu, X.; Zheng, H.; Wang, Y.; Liu, Y.Y.; et al. Multi-decadal trends in global terrestrial evapotranspiration and its components. Sci. Rep. 2016, 6, 19124. [Google Scholar] [CrossRef] [PubMed]
- Feng, J.; Zhang, K.; Zhan, H.; Chao, L. Improved soil evaporation remote sensing retrieval algorithms and associated uncertainty analysis on the Tibetan Plateau. Hydrol. Earth Syst. Sci. 2023, 27, 363–383. [Google Scholar] [CrossRef]
- Miralles, D.G.; Holmes, T.R.H.; De Jeu, R.A.M.; Gash, J.H.; Meesters, A.G.C.A.; Dolman, A.J. Global land-surface evaporation estimated from satellite-based observations. Hydrol. Earth Syst. Sci. 2011, 15, 454–469. [Google Scholar] [CrossRef]
- Eicker, A.; Schumacher, M.; Kusche, J.; Döll, P.; Schmied, H.M. Calibration/Data Assimilation Approach for Integrating GRACE Data into the WaterGAP Global Hydrology Model (WGHM) Using an Ensemble Kalman Filter: First Results. Surv. Geophys. 2014, 35, 1285–1309. [Google Scholar] [CrossRef]
- Pathiraja, S.; Moradkhani, H.; Marshall, L.; Sharma, A.; Geenens, G. Data—Driven Model Uncertainty Estimation in Hydrologic Data Assimilation. Water Resour. Res. 2018, 54, 1252–1280. [Google Scholar] [CrossRef]
- Trudel, M.; Leconte, R.; Paniconi, C. Analysis of the hydrological response of a distributed physically-based model using post-assimilation (EnKF) diagnostics of streamflow and in situ soil moisture observations. J. Hydrol. 2014, 514, 192–201. [Google Scholar] [CrossRef]
- Zhang, Y.; Hou, J.; Gu, J.; Huang, C.; Li, X. SWAT-Based Hydrological Data Assimilation System (SWAT—HDAS): Description and Case Application to River Basin—Scale Hydrological Predictions. J. Adv. Model. Earth Syst. 2017, 9, 2863–2882. [Google Scholar] [CrossRef]
- Ma, J.; Qin, S.; Wang, H.; Zhang, H.; Bi, H.; Bu, R.; You, H.; Wang, S. Data Assimilation Algorithm Development and Experimentation, 1st ed.; Science Publishing Press: Beijing, China, 2013. [Google Scholar]
- Gan, R.; Zhang, Y.; Shi, H.; Yang, Y.; Eamus, D.; Cheng, L.; Chiew, F.H.; Yu, Q. Use of satellite leaf area index estimating evapotranspiration and gross assimilation for Australian ecosystems. Ecohydrology 2018, 11, 5. [Google Scholar] [CrossRef]
- Xu, H.; Duan, H.; Zhao, H.; Hao, Z.; Fan, Y. Inversion of evapotranspiration in irrigation area using Penman-Monteith-Leuning model and Sentinel-2 data. Remote Sens. Inf. 2023, 38, 79–86. [Google Scholar]
- Song, C.; Jia, L.; Menenti, M. Retrieving High-Resolution Surface Soil Moisture by Downscaling AMSR-E Brightness Temperature Using MODIS LST and NDVI Data. IEEE J. Sel. Top. Appl. Earth Obs. Remote Sens. 2014, 7, 935–942. [Google Scholar] [CrossRef]
- Li, H.; Zhang, Y.; Zhang, X.; Li, X.; Ao, T. Estimation of regional transpiration and evaporation using Penman-Monteith equation. Eng. J. Wuhan Univ. 2011, 44, 457–461. [Google Scholar]
- Wang, H.; Ma, M. Estimation of transpiration and evaporation of different ecosystems in an inland river basin using remote sensing data and the Penman-Monteith equation. Acta Ecol. Sin. 2014, 34, 5617–5626. [Google Scholar]
- Li, F.; Cao, R.; Zhao, Y.; Mu, D.; Fu, C.; Ping, F. Remote sensing Penman–Monteith model to estimate catchment evapotranspiration considering the vegetation diversity. Theor. Appl. Climatol. 2015, 127, 111–121. [Google Scholar] [CrossRef]
- Liaqat, U.W.; Choi, M. Surface energy fluxes in the Northeast Asia ecosystem: SEBS and METRIC models using Landsat satellite images. Agric. For. Meteorol. 2015, 214–215, 60–79. [Google Scholar] [CrossRef]
- Zhan, C.; Yin, J.; Wang, F.; Dong, Q. Regional estimation and validation of remotely sensed evapotranspiration in China. Catena 2015, 133, 35–42. [Google Scholar] [CrossRef]
- Kiptala, J.K.; Mohamed, Y.; Mul, M.L.; Van der Zaag, P. Mapping evapotranspiration trends using MODIS and SEBAL model in a data scarce and heterogeneous landscape in Eastern Africa. Water Resour. Res. 2013, 49, 8495–8510. [Google Scholar] [CrossRef]
- Papadavid, G.; Hadjimitsis, D.G.; Toulios, L.; Michaelides, S. A Modified SEBAL Modeling Approach for Estimating Crop Evapotranspiration in Semi-arid Conditions. Water Resour. Manag. 2013, 27, 3493–3506. [Google Scholar] [CrossRef]
- Sun, Z.; Wei, B.; Su, W.; Shen, W.; Wang, C.; You, D.; Liu, Z. Evapotranspiration estimation based on the SEBAL model in the Nansi Lake Wetland of China. Math. Comput. Model. 2011, 54, 1086–1092. [Google Scholar] [CrossRef]
- Yang, Y.; Shang, S.; Jiang, L. Remote sensing temporal and spatial patterns of evapotranspiration and the response to water management in a large irrigation district of North China. Agric. For. Meteorol. 2012, 164, 112–122. [Google Scholar] [CrossRef]
- Duan, H.; Zhao, H.; Li, Q.; Xu, H.; Han, C. Estimation of evapotranspiration based on a modified Penman-Monteith-Leuning model using surface and root zone soil moisture. Water 2023, 15, 1418. [Google Scholar] [CrossRef]
- Gebremichael, M.; Wang, J.M.; Sammis, T.W. Dependence of remote sensing evapotranspiration algorithm on spatial resolution. Atmos. Res. 2010, 96, 489–495. [Google Scholar] [CrossRef]


Disclaimer/Publisher’s Note: The statements, opinions and data contained in all publications are solely those of the individual author(s) and contributor(s) and not of MDPI and/or the editor(s). MDPI and/or the editor(s) disclaim responsibility for any injury to people or property resulting from any ideas, methods, instructions or products referred to in the content. |
© 2024 by the authors. Licensee MDPI, Basel, Switzerland. This article is an open access article distributed under the terms and conditions of the Creative Commons Attribution (CC BY) license (https://creativecommons.org/licenses/by/4.0/).