Abstract
The study of the effect of vegetation cover on water and sediment content is of great significance for the in-depth understanding of ecological and environmental effects in river basins and the formulation of corresponding management measures. Based on the monitoring data of rainfall and runoff of Panjiazhuang and Dangchengwan Hydrologic Stations in Shule River Basin from 2000 to 2020 and the sediment discharge of Changmabao, methods such as geographic information technology (GIS), landscape pattern analysis, land use transfer matrix, correlation analysis, principal component analysis, and linear regression analysis were used to study water and sediment change, land use pattern, vegetation change characteristics, and local water and sediment change in Shule River Basin and construct vegetation–topographic landscape factors. The main research results are as follows: (1) Vegetation coverage in the Shule River Basin increased year by year from 2000 to 2020, with a cumulative increase of 0.064 in 20 years. Vegetation cover has a significant effect on water and sediment content, and the correlation is −0.966. (2) The cultivated land area of the Shule River Basin increased by 604 km2 from 2000 to 2020, and the conversion rate was 67%. From 2000 to 2020, the water area increased by 442 km2, and the conversion rate was 51%. The area of grassland and forest increased by 198 km2 and 12 km2, respectively, and the conversion rate was 68% and 33%, respectively. Forest had the highest transfer rate (0.67). The lowest conversion rate was 0.32 for grassland. (3) The variation coefficient of water and sediment content in Shule River Basin during 1971–2020 was 45.21%, and the highest variation coefficient during 2001–2010 was 49.15%. The lowest variation coefficient was 39.73% during 2011–2020. The annual sediment transport in the Shule River Basin fluctuates greatly and has a high degree of dispersion during 1971–2020. (4) The results of the landscape index in Shule River Basin during 2000–2020 had a small difference, with a difference of less than 0.5. According to the principal component analysis of landscape index and water and sediment content, the maximum patch index (LPI) had the strongest positive correlation with water and sediment content (0.958). The diversity index SHDI had the strongest negative correlation with water and sediment content (−0.995).
1. Research Background
On a global scale, the problems of water resources, the water environment, and human development have become increasingly prominent, have become a prominent problem to be solved urgently, and have also seriously threatened human health and the safety of the living environment. At present, governments and environmental protection agencies around the world have begun to attach great importance to water resource protection and water environment issues and gradually incorporate them into the core status of national environmental protection strategies. In arid and semi-arid areas, the irrational use of water resources leads to an increase in surface runoff and the aggravation of soil loss.
Shule River Basin is the second largest inland river basin in the Hexi area, and its importance to the future prosperity and progress of some Hexi areas is closely related to its social development [1,2]. China began to implement the Shule River Basin comprehensive treatment project in the 1950s, aiming at realizing the key projects of soil and water conservation, forestry ecological construction, and other ecological measures and projects in the middle reaches of Shule River through a series of vegetation restoration and other ecological environment construction so as to achieve the goal of soil and water loss control in this area. At the end of the 20th century, the state implemented a large-scale ecological construction project to return farmland to forest (grass), which promoted the improvement of the ecological environment in the Shule River area, significantly increased the vegetation coverage rate in the area, and also had a profound impact on the land use and cover structure of the Shule River Basin. Due to the complex response relationship between precipitation and the runoff process in the Shule River Basin, rainfall intensity, rainfall, and initial soil moisture content all have an impact on the runoff process. At present, some experts and scholars have analyzed the spatial and temporal distribution of sediment and the relationship between water and sediment in Shule River Basin by measuring the long series of hydrological data using the methods of hydrological statistics, difference product curve, trend test, mutation test, and nonlinear multiple correlation model [3,4].
Runoff and sediment transport are important hydrological phenomena that have concerned the whole world [5]. As an important surface water resource, runoff is the key to the sustainable development of the arid areas in the northwest. Sediment transport is an important indicator to objectively reflect the intensity of soil erosion in the basin and is an important factor affecting river health and the water environment. Runoff and sediment transport are mainly affected by factors such as basin climate conditions, underlying surface types, and human activity intensity. In recent years, under the background of regional climate change and human activity, the hydrological and meteorological conditions of the basin and the underlying surface conditions have undergone drastic changes, resulting in a significant reduction in the runoff and sediment transport of some rivers, but the runoff and sediment transport of inland river basins show a slightly increasing trend [6,7]. The Shule River is the second largest inland river system in the Hexi Corridor, which has a very important strategic position in ecological security and economic development in the west of China. The research on the Shule River mainly focuses on the change of the upstream runoff and its impact on climate change, and there is little systematic research on the change law of runoff and sediment transport in the Shule River Basin, especially on the impact of vegetation–topographic landscape and water and sediment in the Shule River Basin [8,9].
Based on the above research background, Shule River, a typical basin in the northwest inland region, is selected as the research area to fill the gap in the research on the influence of vegetation cover and topographic landscape on water and sediment content in Shule River Basin. The relationship and influence between the evolution trend of the multi-year vegetation coverage index and the evolution trend of water and sediment in Shule River Basin are comprehensively analyzed, and the landscape pattern and ecological process are connected. Data analysis based on the normalized vegetation index and land use state transfer matrix was established to obtain the impact of landscape pattern and land use on water and sediment content, which could provide an important basis for landscape spatial pattern optimization and vegetation restoration pattern design in the Shule River area. This study analyzes the vegetation–topographic landscape and the influence of water and sediment in the Shule River Basin, which is of great significance for the restoration and management of the regional ecological environment and the implementation of ecological security strategies in the west.
2. Overview of the Study Area
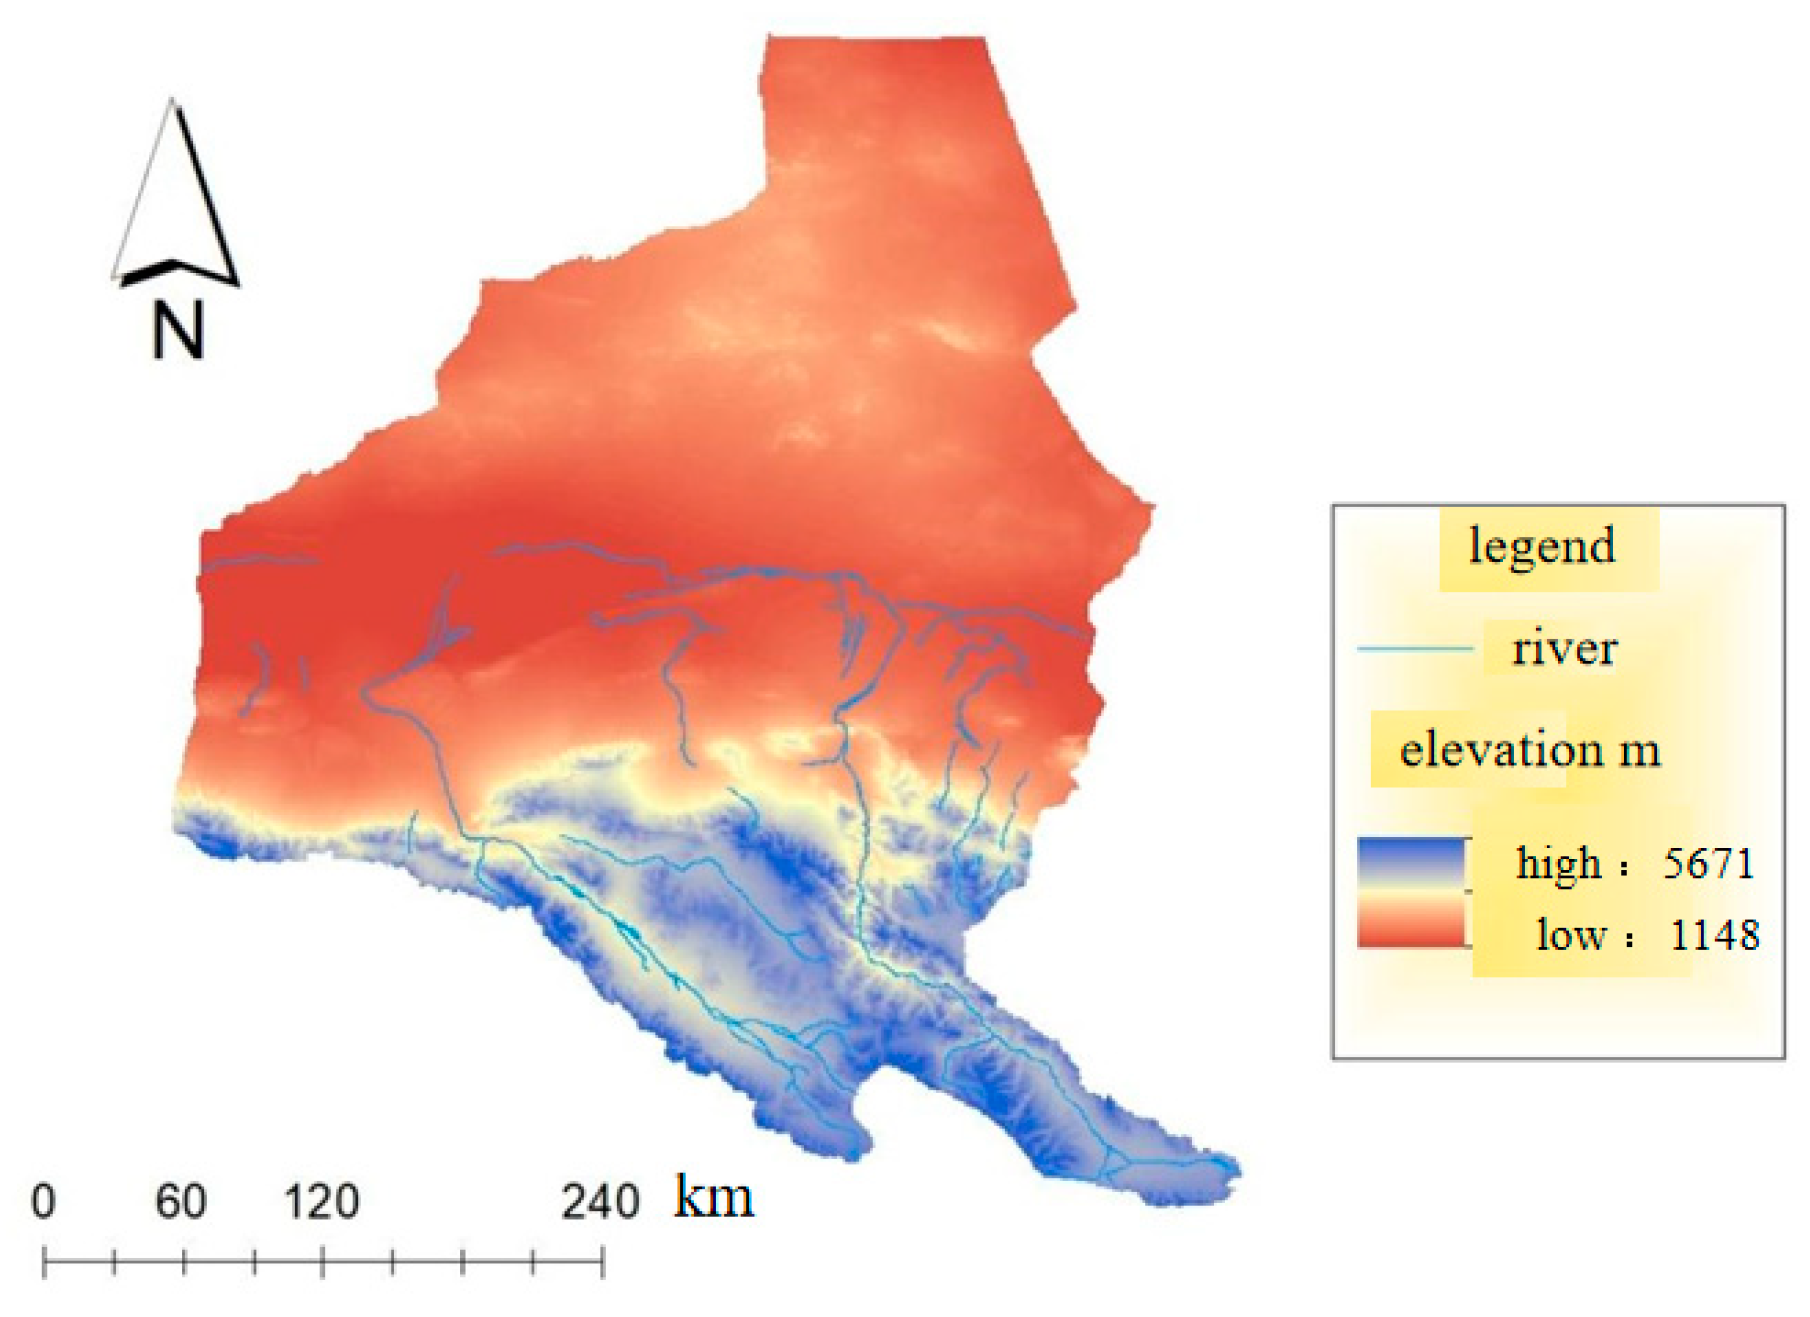
The Shule River Basin, located in the northwest of Gansu Province and in the western section of the Hexi Corridor, is the second largest river in the inland river basin of Gansu Province, with a total length of 945 km and a watershed area of 101,884 square kilometers (Figure 1). The basin originates from Shulenan Mountain in the Qilian Mountain area to the Taorinan Mountain area, flows northwest through marshland, is affected by alpine snow, glacial meltwater, mountain precipitation, and other factors, and finally turns north into Changma Basin to form the Changma River. The river runs northeast-southwest, widening from southeast to west. The terrain in the area is high in the north and low in the south, low in the middle, connected with the Altun Mountain and Qilian Mountains in the south and Ma Mane Mountain and Ma Mane Mountain in the north, but the central area is relatively flat. The climate type of this basin is continental arid desert, with a large area of desertified land, grassland, desert Gobi, and other natural vegetation, and the overall terrain gradually rises from north to south. Shule River Basin administrative areas include Yumen City, Dunhuang District, Guazhou District, Subei Mongolian Autonomous County, Aksai Kazakh Autonomous County, Qinghai Province, Delingha City, and Tianjun County. Yumen City is known as the oil city; Dunhuang is known as the tourism city; and Subei District, Guazhou County, and Aksai County are known as the agriculture and animal husbandry counties [10,11,12].

Figure 1.
Geographical location map of the Shule River Basin.
3. Analysis of Water and Sediment Change Characteristics in the Shule River Basin
3.1. Data Sources
The hydrologic data were collected from Dangchengwan Hydrologic Station and Panjiazhuang Hydrologic Station in the Shule River Basin from 2000 to 2020. Data on sediment transport were obtained from Changmabao Hydrologic Station (data from the Gansu Provincial Water Resources Department). The land use data were 30 m × 30 m in three periods in 2000, 2010, and 2020. The data are from the Data Center for Resources and Environmental Sciences, Chinese Academy of Sciences (https://www.resdc.cn, accessed on 2 March 2023).
3.2. Mathematical Methods
3.2.1. Correlation Analysis Method
The Pearson correlation coefficient, also known as the Pearson product moment correlation coefficient, is an index used to measure the linear correlation between X and Y variables, with values ranging from −1 to 1. When you estimate the covariance and standard deviation of the sample, you receive the Pearson correlation coefficient, which is defined by the quotient of the covariance between the two variables and the standard deviation. This coefficient is usually denoted by the lowercase letter r as follows:
In the above formula, the sample values of the two elements are respectively represented. Namely, the following:
The Pearson correlation coefficient fluctuates between −1 and 1. When the coefficient is 1, the relationship between x and y can be expressed as a linear equation, with all data points falling precisely on the same line. The value of the coefficient is −1, indicating that all data points are straight lines, and y decreases as x increases. When the coefficient between two variables is zero, there is no linear relationship between them.
3.2.2. Linear Regression Analysis
Linear regression is a regression analysis that models the relationship between one or more independent and dependent variables using a least squares function called a linear regression equation. The equation of general linear regression can be obtained by the least squares method. Regression analysis requires the establishment of regression equations to describe the correlation between variables. If the regression function is linear, it is called a linear correlation between variables. Unary linear regression analysis consists of two variables, with one independent variable represented by x. The other is the dependent variable (predictor), which is represented by y [8].
3.2.3. Land Use Transfer Matrix
The transition probability matrix proposed by Markov reveals that in the transition process of some factors in a system, the results of the NTH order are only affected by the results of the n − 1 order. By analyzing the transfer matrix obtained, we can reveal the law of mutual transformation among different land classes. This method can be used to calculate the distribution of different land use properties in a certain area at a certain time in different periods. It is of great significance to apply this method to study the distribution, dynamic change, and spatial evolution of different types of land use in urban interiors [8,9].
3.2.4. Vegetation Coverage
Fractional Vegetation Cover (FVC) is an indicator used to study the ecological environment, soil and water conservation, and climate change. It refers to the percentage of the vertical projected area of the plant body on the ground in the total area of the statistical area. Normalized Difference Vegetation Index (NDVI) has become a widely used and highly accurate approximate estimation method for vegetation coverage. The formula is as follows:
where NIR is a near-infrared band and R is an infrared band. By using NDVI technology, the background influence of the plant canopy can be detected, and the growth state, coverage, and partial radiation error of vegetation can be effectively eliminated.
3.2.5. Principal Component Analysis
Principal component analysis (PCA) is a commonly used multivariate analysis method that converts a group of possibly correlated variables into a group of linearly independent variables through orthogonal transformation and then gets the principal component. With the support of SPSS 27 software, this study adopts the method of principal component analysis.
4. Spatial–Temporal Changes of Land Use/Vegetation Cover in the Shule River Basin
4.1. Analysis of Watershed Land Use Change
4.1.1. Research on Spatial–Temporal Change Characteristics of Land Use
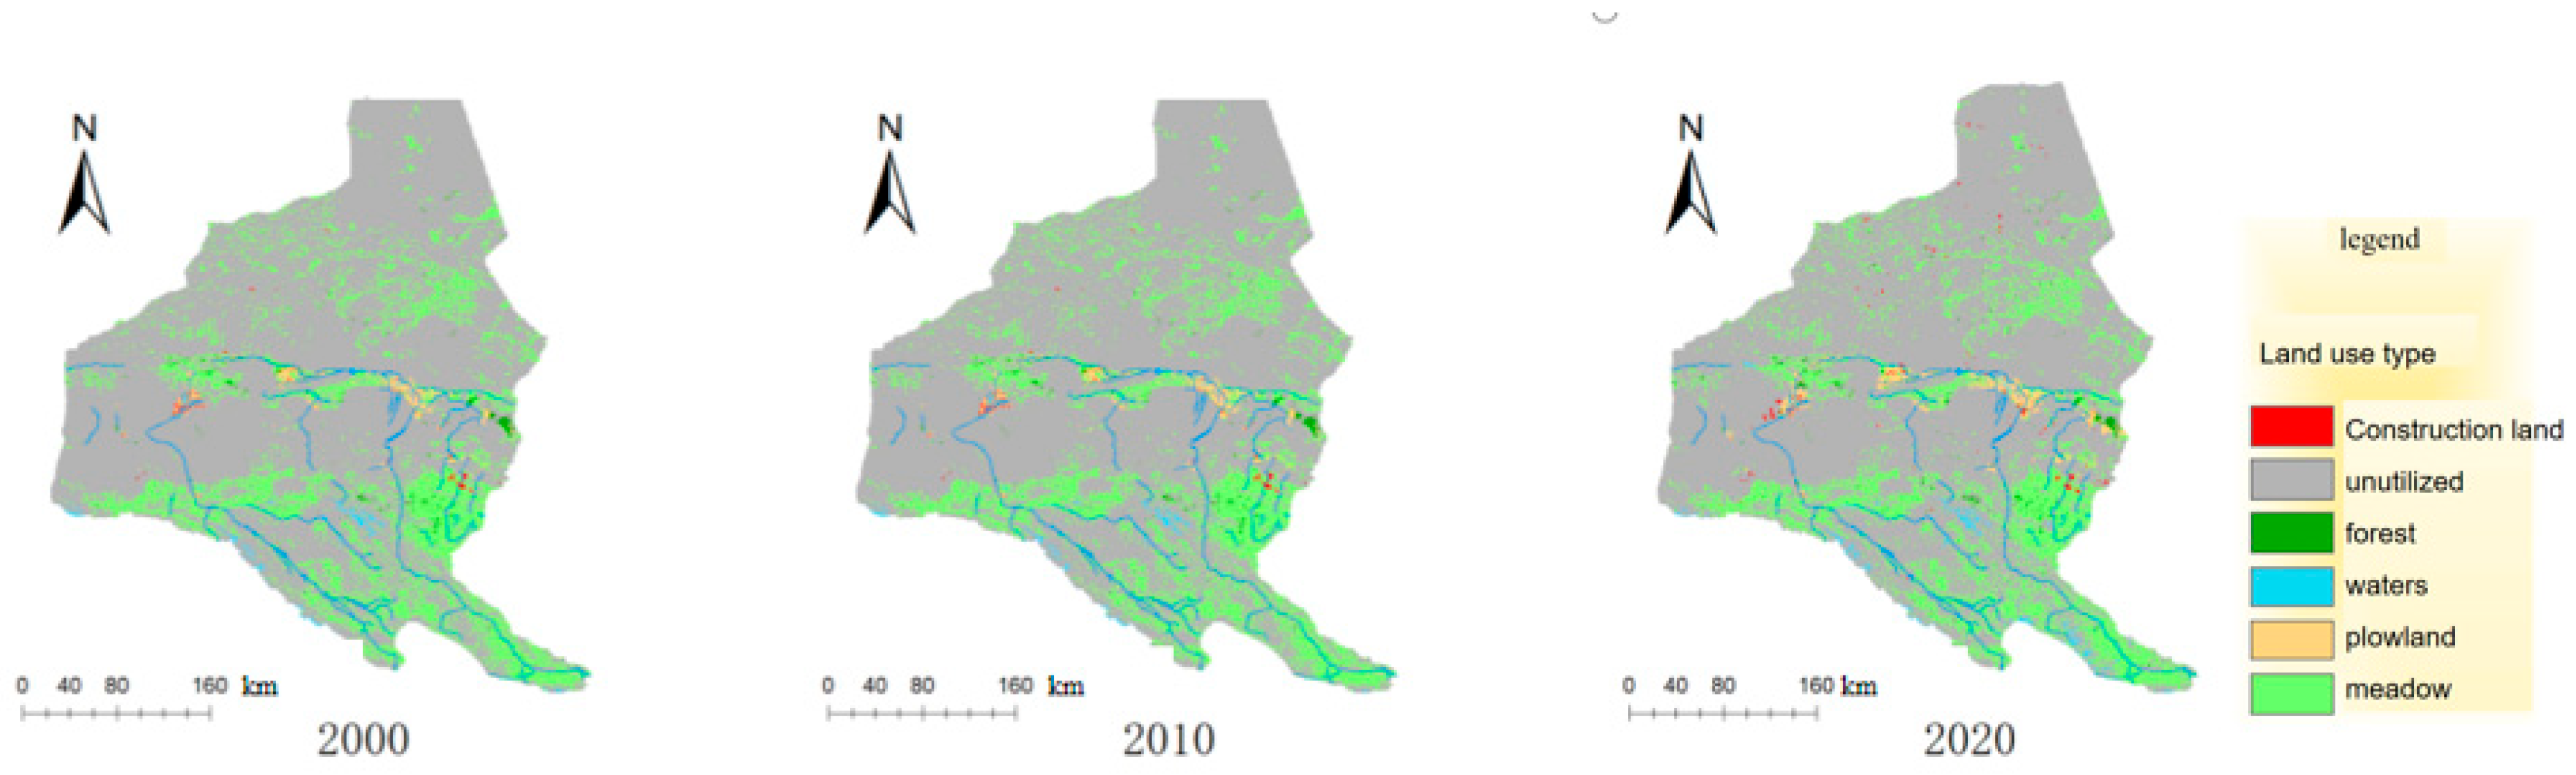
Using ArcGIS10.2 software, the distribution maps of land use types in Shule River Basin in 2000, 2010, and 2020 were drawn (Figure 2). As can be seen from Table 1, from 2000 to 2020, the area of each landscape type in Shule River Basin, from the largest to the smallest, is as follows: unused land, grassland, cultivated land, water area, forest land, and construction land. The cultivated land area of the study area increased from 1203 km2 in 2000 to 1807 km2 in 2020, with a growth rate of 50.2%, indicating the rapid development of agriculture and its scale in the past 20 years. The area of grassland, water area, and forest increased by 198 km2, 442 km2, and 12 km2, respectively, with growth rates of 0.7%, 60.6%, and 0.2%, which may be due to the policy of returning farmland to forest and grassland implemented at the end of 1999. The decrease of unused land and the increase of construction land indicate that with the economic development in the past 20 years, the urbanization of Shule River Basin has accelerated, the scale of construction land has increased, and the population has increased. Urbanization and population growth may have a negative impact on the ecological environment and agricultural production land, and relevant countermeasures should be taken to achieve ecological stability.

Figure 2.
Land use map during 2000–2020.

Table 1.
Land use in Shule River Basin during 1980–2000.
4.1.2. Research on Spatial Conversion of Land Use Types
Using the spatial analysis tool ArcGIS10.2, the chart of land use transfer in Shule River Basin from 2000 to 2020 was drawn (Table 2), and the result of land use type conversion from 2000 to 2020 was obtained by analyzing the transfer direction and transfer area of different classes in different years.
Table 2.
Land use type conversion from 2000 to 2020.
As shown in the table above, the highest conversion rate of land use type in Shule River Basin from 2000 to 2020 is the conversion of construction land to cultivated land, and the conversion rate is 0.44. The conversion rate is lower for other types of conversions to construction land. In summary, the highest transfer rate was for forest, which was 0.67. The lowest transfer rate was 0.32 for grassland.
4.2. Analysis of Temporal and Spatial Changes in Vegetation Cover
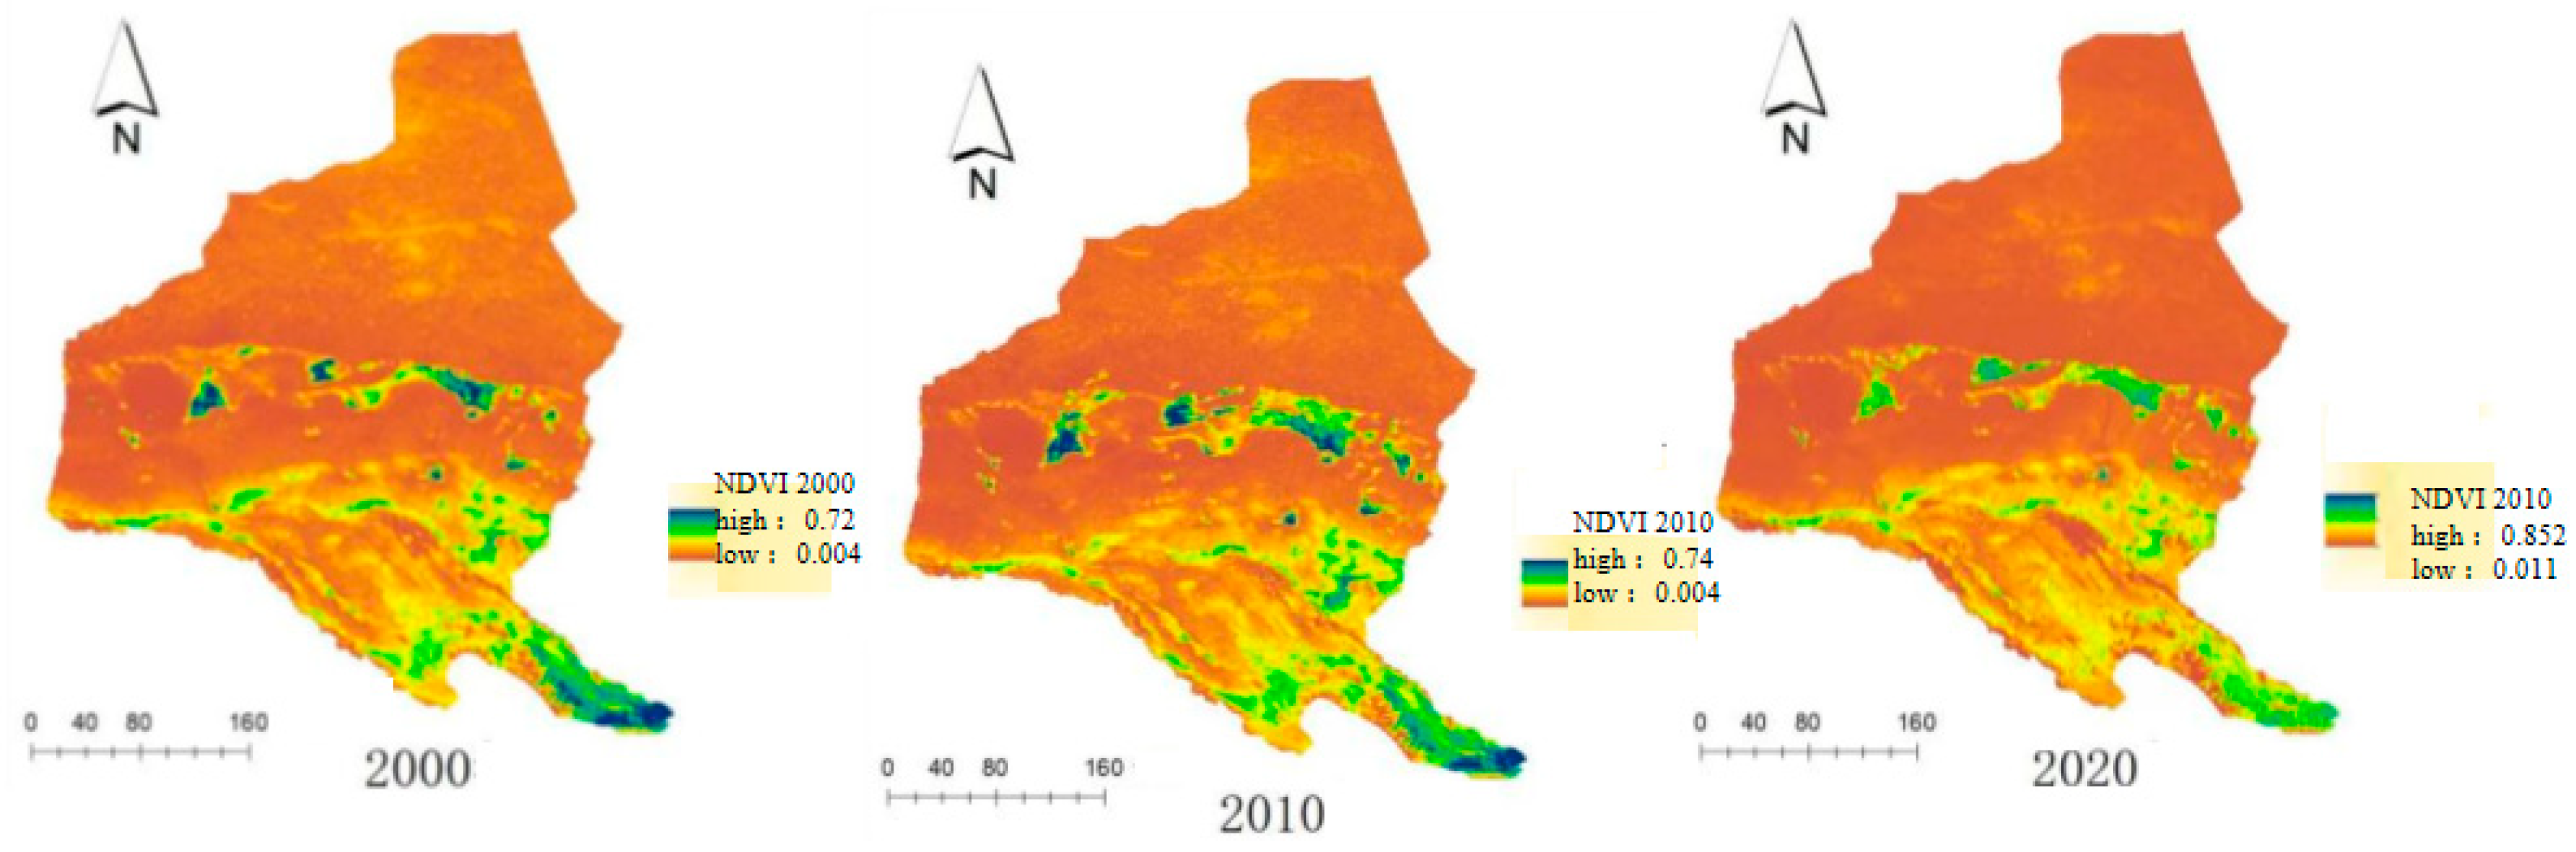
Due to the floating-point classification, the NDVI value is between [−1, 1]. A negative value means that the ground has cloud, snow, water, and other cover forms, while a positive value means that there is no ground cover. Moreover, 0 indicates rock or exposed soil, and a negative number indicates no land cover. With the increase in coverage, vegetation cover showed a trend of gradual expansion, showing positive characteristics. The negative index indicates the absence of vegetation. For all non-vegetated areas that do not exceed 0, the NDVI value is classified as 0, and the NDVI is graded (Table 3). When the NDVI value is above 0.3, the vegetation growth condition is good. The NDVI value of Shule River Basin during 2000–2020 is replaced by the mean of the maximum and minimum values. The NDVI classification during 2000–2020 is shown in Figure 3.
Table 3.
Vegetation cover classification table.
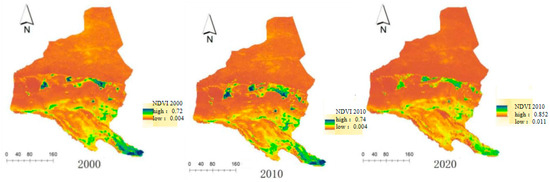
Figure 3.
Changes in vegetation coverage during 2000–2020.
The vegetation coverage of the Shule River Basin from 2000 to 2020 is shown in the table. This paper selected indicators at intervals of 10a for analysis. As can be seen from Figure 3, the vegetation coverage from 2000 to 2020 shows an overall upward trend, indicating that the increase in vegetation coverage also increases the effect on soil and water conservation.
5. Variation Characteristics of Water and Sediment in the Basin
5.1. Analysis of the Precipitation Change Process
According to Table 4, the average annual precipitation of Shule River Basin during 1971–2020 is 61.58 mm, of which the highest annual average precipitation during 1971–1980 is 81.39 mm and the lowest annual average precipitation during 1991–2020 is 51.41 mm. During the whole study period, the average annual precipitation showed a trend of decreasing first and then increasing. During the 1971–2020 period, the annual precipitation in 1979 reached a maximum of 143.351 mm. The annual precipitation of 18.429 mm in 1986 was the lowest in the period 1971–2020. In Shule River Basin, the inter-annual fluctuation of annual precipitation reached its highest peak during 1981–1990, and the coefficient of variation was as high as 41.44%. The annual mean variation coefficient of precipitation during 2011–2020 is the lowest at 33.04%, and the annual precipitation changes the least during this period [13]. The annual mean variation coefficient of annual precipitation in Shule River Basin during 1971–2020 is 42.06%. The variation of annual precipitation in Shule River Basin basically conforms to the trend of “high–low–high”. The vegetation coverage is generally on the rise during 2000–2020, indicating that the increase in vegetation coverage may also be due to the increase in precipitation during this period. The change between precipitation and vegetation is basically the same trend, but it may also be related to other climatic factors such as temperature and sunshine.
Table 4.
Annual precipitation scale 1971–2020.
5.2. Analysis of the Runoff Change Process
As can be seen from Table 5, the annual average runoff of the Shule River Basin during 1971–2020 was 1.109 billion m3. The average annual runoff during 1991–2000 was 1.238 billion m3, which was the highest. The average annual runoff from 1971 to 1980 was the lowest, at 1.01 billion m3. In each study period, the average runoff showed a trend of fluctuation and increase, which was reflected in the whole. Runoff in the Shule River Basin was 1.29 billion m3 in 2012, the largest runoff in the 1971–2020 period. In 2016, the runoff was 928 million m3, which was the smallest runoff from 1971 to 2020. From 1991 to 2000, the inter-annual runoff fluctuated the most in the Shule River Basin, and the coefficient of variation was as high as 11.68%, which was considered to be the most volatile period in the hydrological cycle of this basin. During 1971–1980, the annual mean variation coefficient of runoff reached 7.81%, which indicates that the fluctuation range of runoff is relatively small. From 1971 to 2020, the annual average variation coefficient of runoff in Shule River Basin shows a trend of 10.82% [14,15,16]. The variation of annual runoff in Shule River Basin basically conforms to the trend of “low–high–low”.Runoff and precipitation do not increase or decrease simultaneously, which indicates that precipitation has little influence on runoff in the Shule River Basin.
Table 5.
Annual runoff changes from 2000 to 2010.
5.3. Analysis of the Sediment Transport Change Process
As shown in Table 6, the average annual sediment transport of Shule River Basin during 1971–2020 was 9.76 × 10⁴ t, while during 2001–2010 and 1991–2000, the average annual sediment transport of this basin reached 10.67 × 10⁴ t and 8.29 × 10⁴ t, respectively. This indicates that soil erosion in this area has been increasing over time. In different study periods, the average sediment transport volume showed obvious fluctuation, and this fluctuation had remarkable regularity. In 1989, the sediment transport in the Shule River Basin was 20.3 × 10⁴ t, which was the highest value from 1971 to 2020. The sediment transport in 2013 was 3.41 × 10⁴ t, which was the lowest sediment transport from 1971 to 2020. In the Shule River Basin from 2001 to 2010, the inter-annual fluctuation of sediment transport reached its peak, and the coefficient of variation was as high as 49.15%, which became the most significant fluctuation period in this region. During this period from 2011 to 2020, the average annual variation coefficient of sediment transport is surprisingly 39.73%, which indicates that the fluctuation range of sediment transport is relatively small, showing a stable trend. In the Shule River Basin from 1971 to 2020, the annual mean variation coefficient of sediment transport shows a significant upward trend, reaching an astonishing level of 45.21%. Overall, the variation of annual sediment transport in Shule River Basin fluctuates greatly and has a high degree of dispersion during the study period [17,18,19,20]. The variation of sediment transport may be affected by land use change, runoff, and other factors, but the relationship between sediment transport and runoff is closer in the Shule River Basin.
Table 6.
Annual sediment transport changes in the Shule River Basin from 2000 to 2010.
6. Process-Based Water–Sand Landscape Pattern Index
6.1. Landscape Index Factor
6.1.1. Land Use Factors
The reclassification function in the spatial analysis module of ArcGIS10.2 software was used to reclassify the elevation, slope, and slope direction of Shule River Basin. The overlay analysis of the masked normalized vegetation index map was carried out, and the Arc GIS tool was used to analyze the overlay data. Finally, the relationship between vegetation distribution and topographic factors in the Shule River Basin is explored by mathematical statistics [21,22].
- (1)
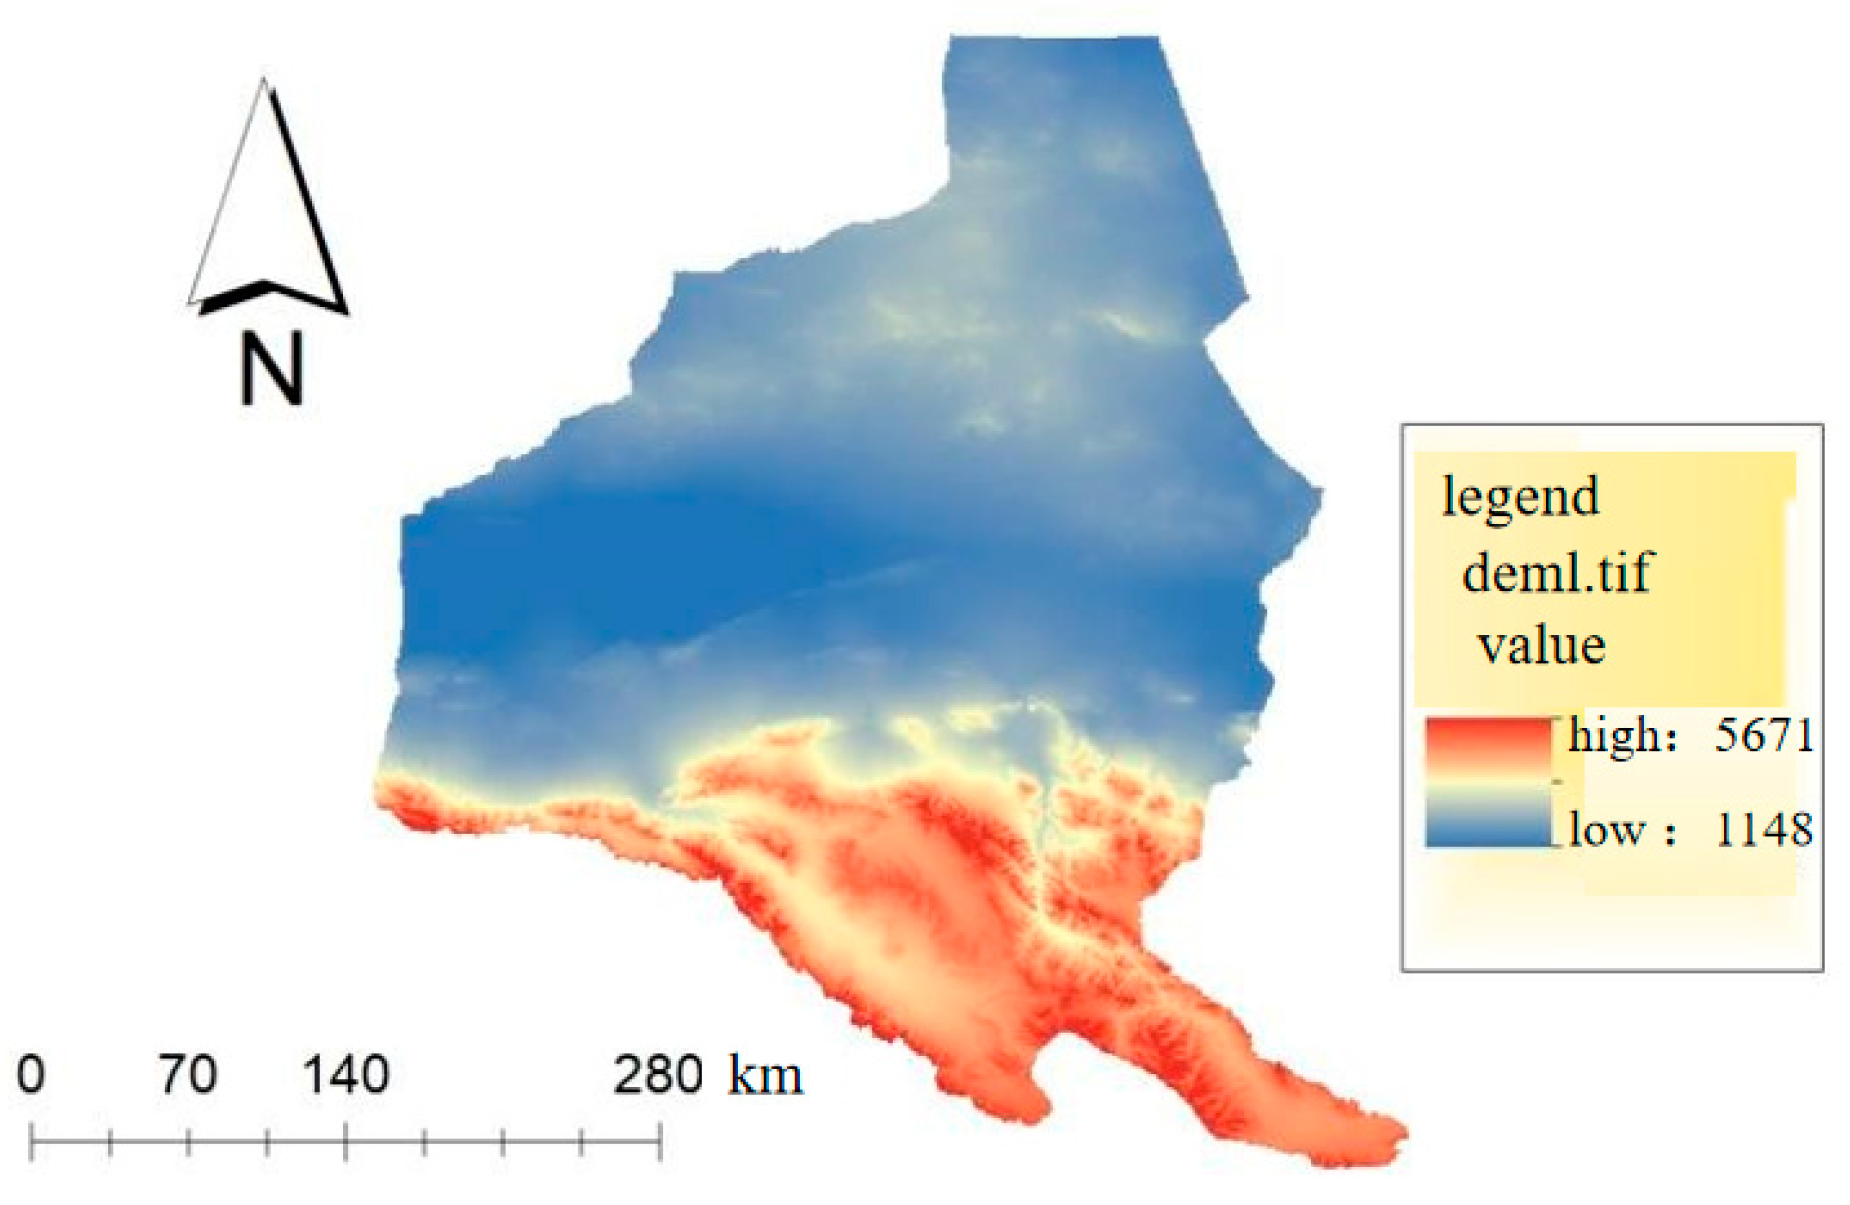
- With every 100 m elevation rise, the average temperature drops by 0.56 °C, rainfall and relative humidity increase with elevation within a certain height range, and the received radiation intensity, air flow, soil properties, etc. also change with elevation. With the rise in altitude, the disturbance of human activities gradually decreases, causing the vegetation coverage to gradually increase and reach a peak. However, with the further rise in altitude, the terrain becomes steeper and steeper, and with the relatively poor hydrothermal conditions, the vegetation coverage will also gradually decrease (Figure 4).
 Figure 4. Elevation map of the Shule River Basin.
- (2)
- Slope represents the degree of local surface tilt; it is an important factor in surface material flow; and it directly affects the way and degree of material exchange and energy conversion. The water-holding capacity of different slopes is also different. The smaller the slope, the easier the water is to be absorbed by the soil. The higher the slope, the easier the loss of natural precipitation and surface runoff (Figure 5).
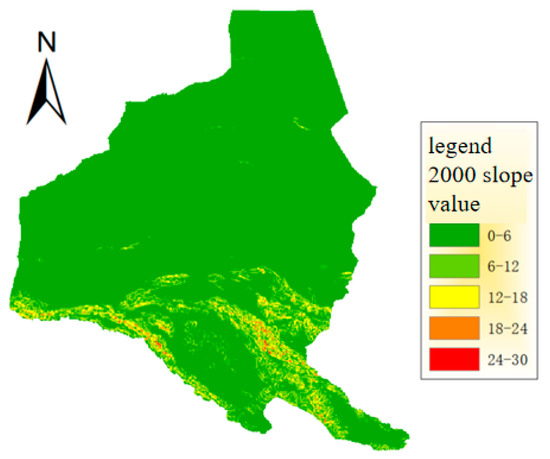 Figure 5. Slope map of the Shule River Basin.
- (3)
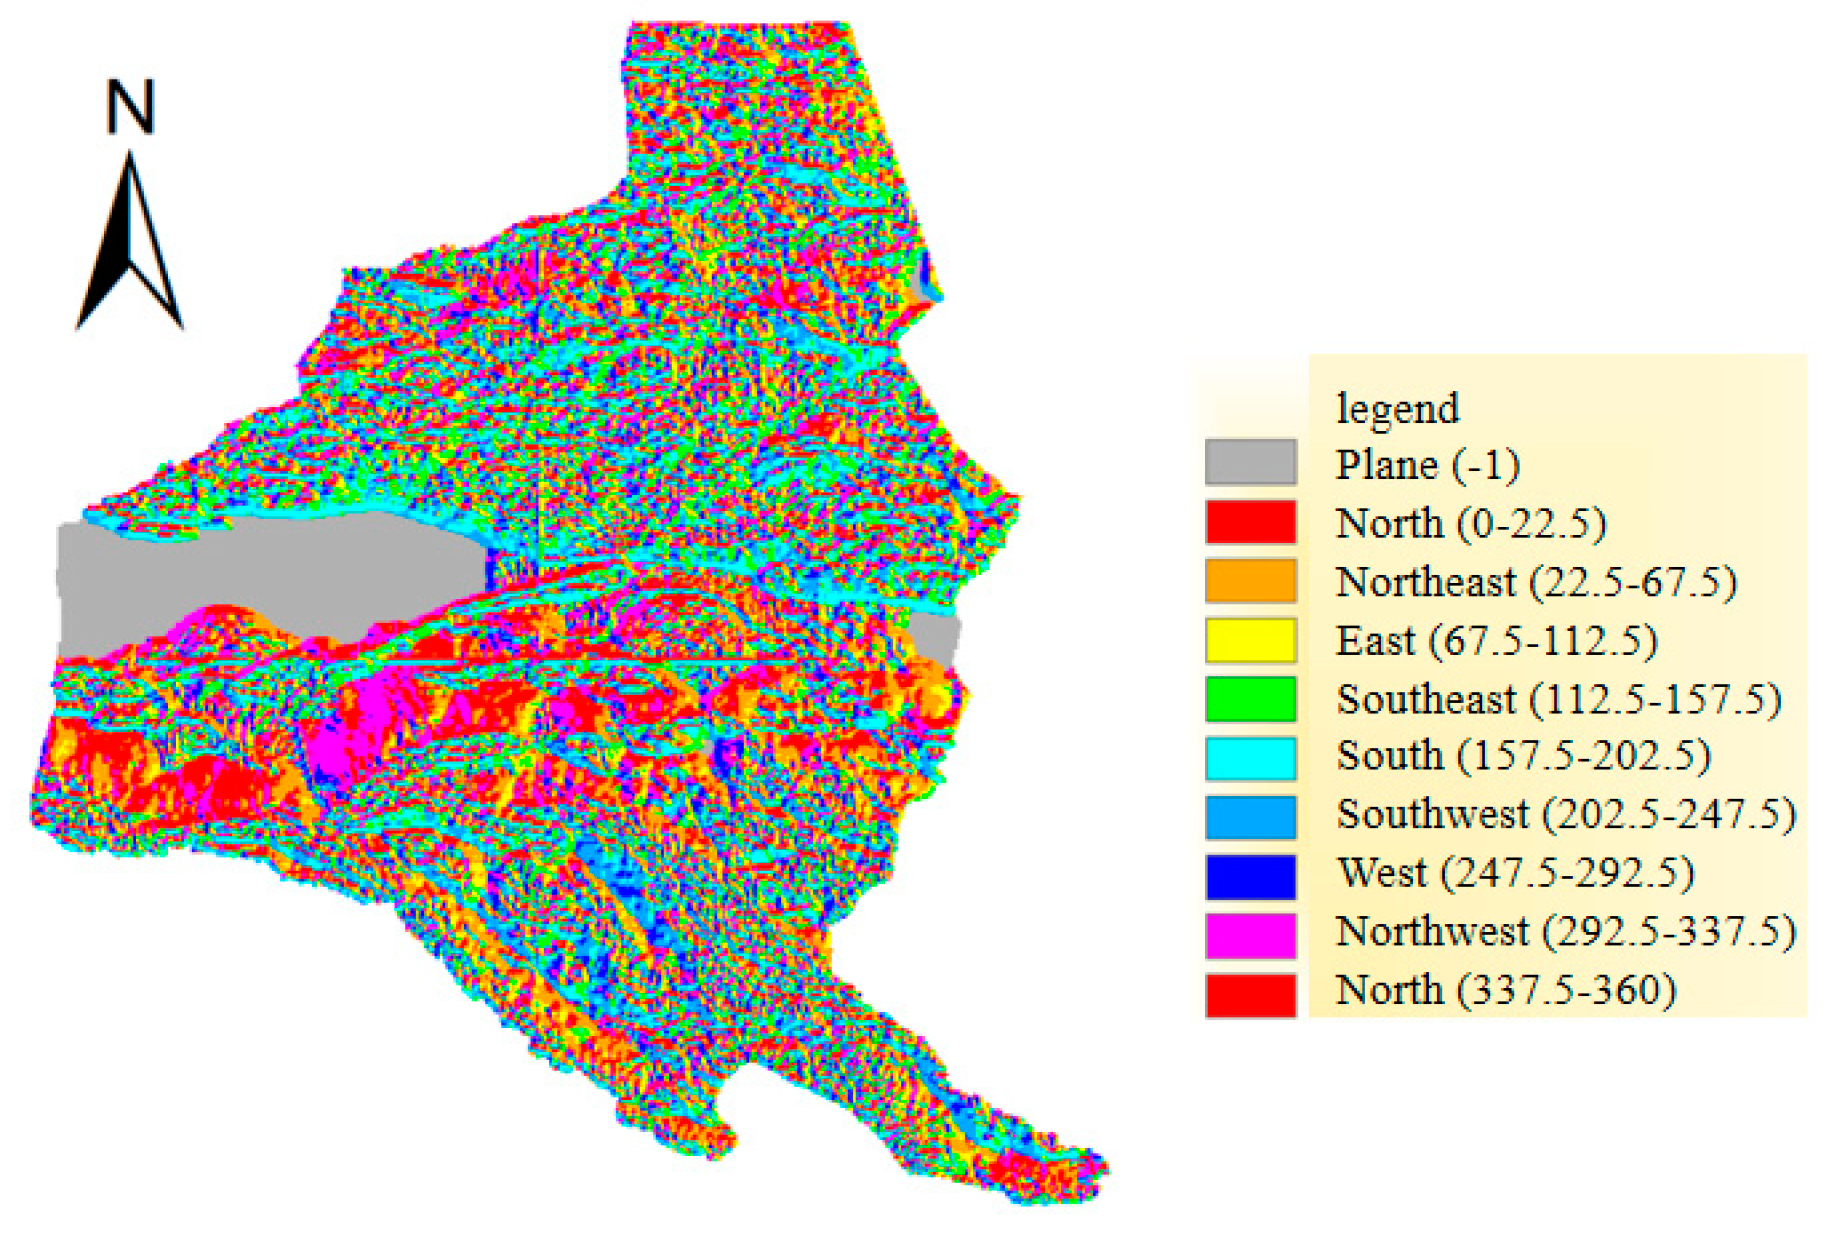
- Slope direction is the direction of change in elevation value of each grid point. More intense human activities are mainly distributed on the sunny slope at lower elevation, which makes the medium vegetation cover on the lower shade slope slightly higher than that on the sunny slope, and the surface runoff and water and sediment content are affected (Figure 6).
 Figure 6. Slope diagram of the Shule River Basin.
6.1.2. Landscape Index
In order to ensure the consistency of vegetation–topographic landscape index and land use landscape index, this study selected landscape index from aspects of landscape pattern, such as area characteristics, density characteristics, shape characteristics, convergence and dispersion characteristics, and diversity characteristics. It includes but is not limited to maximum patch index (LPI), patch density (PD), edge density (ED), landscape shape index (LSI), and diversity index (SHDI). The specific formulas and their ecological significance are shown in the Table 7 [23,24,25,26].
Table 7.
Landscape index formula and significance table.
Based on vegetation coverage data and topographic features of each grid point, a vegetation–topographic factor was constructed, including vegetation index and slope. By analyzing the main factors that affect the soil erosion intensity of grid points, the relationship between each factor and erosion intensity is determined. It is assumed that the vegetation index of the grid points is inversely proportional to the slope. During the pretreatment of factor layers, NDVI and slope are reclassified, and the contribution of each factor to the soil and water conservation ability of the grid is assumed to be uniform, and the initial weight of each factor is set to 1:1, which can improve the soil and water conservation ability of the grid points. Finally, the weight of each factor is determined by calculating the contribution rate of each factor after normalization. The following is the construction formula for the index calculation:
According to Table 8, NDVI is classified and reclassified into five levels, namely, low, medium-low, medium, medium-high, and high coverage. The vegetation coverage at all levels was expressed by a grid map. In the ArcGIS10.2 process of slope extraction and reclassification, DEM elevation images are used for data processing.
Table 8.
Grading map of terrain factors.
Several topographic factors are divided into appropriate grades to describe the relationship between topographic factors and water and sediment, as shown in the following table:
6.2. Dynamic Analysis of Landscape Pattern
The six landscape indexes were obtained according to the land use type in Fragstats 4.2 software.
According to Table 8, patch density (PD) in the Shule River Basin showed an overall trend of fluctuating increase during 2000–2020, and PD increased from 0.0708 in 2000 to 0.0719 in 2020, with an increase of 0.011. It is worth paying special attention to the fact that from 2000 to 2010, the inter-annual change of PD showed a sharp fluctuation and showed a rapid upward trend, so it can be considered that the land use pattern in this region has undergone obvious changes. In the process of implementing the policy of returning farmland to forest and grassland, a large number of cultivated lands were transformed into woodland and grassland, and the grassland was also transformed into arable land and woodland, which resulted in a large number of small landscape patches in the study area, thus increasing the patch density of the basin. As time goes by from 2000 to 2020, the change trend of edge density (ED) and landscape shape index (LSI) presents a trend of gradually rising first and then gradually flattening. In 2010, the index reaches its maximum value, and ED increases from 7.1630 in 2000 to 7.2012 in 2010, with an increase of 0.0382. LSI increased by 0.3357 from 64.6138 in 2000 to 64.9495 in 2010. Between 2000 and 2010, the landscape presented by the study area suffered more severe damage. From the perspective of space, the landscape changes in this period were mainly concentrated in the western region, and the eastern region was less disturbed. In 2020, the maximum patch index (LPI) showed a gradually decreasing trend and finally reached the lowest point. In the study area, there was mutual transformation among cultivated land, grassland, and forest land, resulting in an overall increase in connectivity among patches within the landscape, and the process of matter and energy migration within the system was also enhanced, showing a landscape evenness index (E) that first decreased sharply and then increased. With the passage of time from 2000 to 2020, the basin diversity index (SHDI), driven by economic development and human activities, presents a trend of increasing year by year, from 1.8881 in 2000 to 1.8917 in 2010, which is more and more significant. Over the past few years, SHDI has shown a clear upward trend, while the basin’s landscape types have increased by 0.6 during 2010–2020, indicating that it is moving towards normalization, connectivity, and aggregation.
As can be seen from Table 9, the patch density in the topographic landscape gradually increased, with an increase of about 0.001, indicating that the number of patches in the region changed little. The maximum patch index decreased gradually by about 0.35, indicating that the patch size was more balanced in the region. The edge density did not change obviously, and the length and area of the regional edge changed little. In general, the landscape index changes little in the Shule River Basin, indicating that the landscape index has little effect on the relationship between the landscape index and topographic factors.
Table 9.
Landscape index change table.
6.3. Fitting Land Use with Water and Sediment
SPSS 27 software was used to conduct factor analysis on land use data, vegetation coverage data, and sediment content data of the Shule River Basin, and then dimensionalization reduction processing was carried out to obtain the correlation matrix and component matrix, as shown in the figure below.
The results of the principal component analysis on sediment transport and land use are shown in the figure above. As can be seen from Table 10 and Table 11, the correlation between land use type and water and sediment content is high due to the change in transfer of land use type. The change in NDVI in land use type from 2000 to 2020 has the greatest impact on water and sediment content, and the strongest correlation was 0.975. The correlation between cultivated land, water, and sediment content was 0.909. The correlation between forest area changes and water and sediment content changes was 0.813. The influence of grassland change on water and sediment content was the least, and the correlation was the weakest, at 0.529. From the relationship between land use and water and sediment quantity, it can be seen that the basin’s erosion resistance and control ability are enhanced under ecological and hydrological projects such as converting farmland to forest and water resource protection, which makes the water and sediment reduction effect obvious.
Table 10.
Correlation matrix between land use and sediment discharge.
Table 11.
Principal component matrix of land use, water, and sediment.
On the basis of the research results, comprehensive consideration was given to the influencing factors and occurrence processes of soil and water loss, as well as the effects of land use, landform, soil texture, and vegetation coverage properties on production and runoff in the study area. A principal component analysis of sediment transport and land use type was constructed to clearly express the effect of land use type on water and sediment content change.
6.4. Response Relationship between Landscape Index, Water, and Sediment
SPSS 27 was used to conduct principal component analysis of landscape index and water and sediment content data, and the following results were obtained (Table 12 and Table 13):
Table 12.
Correlation matrix between landscape index and water and sediment content.
Table 13.
Landscape index and composition matrix of water and sediment content.
According to the results, among the six landscape indices selected in Shule River Basin, PD, ED, LSI, and SHDI showed a trend of positive correlation with sediment transport, indicating that PD, ED, LSI, and SHDI had a good correlation with sediment transport. However, LPI and E showed a negative correlation with sediment transport, indicating that LPI and E had little correlation with sediment transport. The increase of PD, ED, LSI, and SHDI indicates that patch density, edge density, landscape shape index, and type patch are more evenly distributed in area, and the correlation is enhanced, thus affecting the change of water and sediment. The results indicate that patch density, edge density, landscape shape index, and type patch should be uniformly increased to prevent the occurrence of erosion linkage. This indicates that there are obvious differences in the effect of each index on sediment deposition in different types of rivers. Specifically, LPI showed the highest positive correlation with a correlation coefficient of 0.958, indicating that there was a significant positive correlation between LSI and LPI. There is a significant negative correlation between sediment transport and SHDI, with the coefficient as high as −0.995, which indicates that there is a significant negative correlation between LPI and sediment transport. The other four indexes showed a significant or extremely significant negative correlation with the sediment transport, and the first component value had a greater impact on the sediment transport, so it could be considered that the region was mainly affected by aeolian sand activities. The correlation between sediment transport and ED and E is similar, and the correlation coefficients are −0.743 and 0.797, respectively, indicating that there is a close interaction between them. Through the analysis of the above results, it can be found that different types of rivers have great differences in the characteristics of water and sediment and their changing processes, which lead to differences in the evolution of ecological environments in different regions. It is noteworthy that in the six landscape indices selected in the Shule River Basin, the component matrix values of LPI, LSI, SHDI, and sediment transport are all greater than 0.9, while the second component value is only ED and E values greater than 0.6. This result deserves special attention.
The process of soil and water loss in the Shule River is affected by many factors, and the content of water and sediment is a good reflection of soil and water loss. There are many factors affecting water and sediment content. When vegetation cover is coupled with water and sediment content and runoff, there are many uncertain factors, among which land use type and topography change little in a short time. The results of this study evaluated the relationship between vegetation coverage, land use type, and water and sediment content under the assumption that these influencing factors remain unchanged and obtained the law of the interaction between vegetation, topographic landscape, water, and sediment change in Shule River Basin. Under different landscape patterns, different types of rivers have great differences in their water and sediment characteristics and their changing processes, which lead to differences in the evolution of ecological environments in different regions [8,9].
In the study of the relationship between landscape pattern and water and sediment quality in the Shule River Basin, landscape factors can be included in a more detailed manner, except for topographic factors such as slope and elevation. Soil types on the underlying surface of the study area also have a certain impact on flow and sediment production. Therefore, elements of the landscape pattern should be enriched to expand the landscape in terms of connotation and data quantity. At the same time, the analysis of water quality and landscape index is still at the surface level. How to determine the effective landscape range corresponding to the sampling data is urgent to think about and solve.
7. Conclusions
Guided by the theory of pattern and process, this study first collected remote sensing images, vegetation coverage, and hydrological data of the Shule River to build a basic database of the study area, thoroughly analyzed the multi-year evolution trend, abrupt year, and phased change of water and sediment in the Shule River Basin, so as to further explore the spatio-temporal change characteristics of land use and vegetation cover in the basin, and then carried out follow-up studies. Based on the process, water–sand landscape pattern index, land use, soil attributes, landform, and vegetation coverage were combined with the landscape index to analyze and discuss the spatial and temporal distribution characteristics of landscape pattern in Shule River Basin in detail. Finally, the evolution of landscape patterns and the interaction between water and sand in the basin were studied. The main conclusions are as follows:
- (1)
- From 2000 to 2020, the vegetation coverage rate increased from 0.72 to 0.852, the land use type changed greatly, the cultivated land area and water area increased, and the cultivated land area increased from 1203 km2 in 2000 to 1807 km2 in 2020. The water area increased from 729 km2 in 2000 to 1171 km2 in 2020, and the water area increased from 729 km2 in 2000 to 1171 km2 in 2020. The area of grassland, water area, and forest increased by 198 km2, 442 km2, and 12 km2, respectively.
- (2)
- The annual variation coefficient of water and sediment content in Shule River Basin was 45.21% from 1971 to 2020, and the highest variation coefficient was 49.15% from 2001 to 2010. The lowest variation coefficient was 39.73% during 2011–2020. During the study period, the variation of annual sediment transport in the Shule River Basin fluctuated greatly and had a high degree of dispersion.
- (3)
- The change of NDVI in land use type during 2000–2020 had the greatest impact on water and sediment content, and the strongest correlation was 0.975. The correlation between cultivated land, water, and sediment content was 0.909. The correlation between forest area changes and water and sediment content changes was 0.813. The influence of grassland change on water and sediment content was the least, and the correlation was the weakest, at 0.529.
- (4)
- The results of the landscape index in Shule River Basin during 2000–2020 had a small difference, with a difference of less than 0.5. According to the principal component analysis of landscape index and water and sediment content, the maximum patch index (LPI) had the strongest positive correlation with water and sediment content (0.958). The diversity index (i.e., SHDI) had the strongest negative correlation with water and sediment content (−0.995).
Author Contributions
Conceptualization, J.Z.; data curation, J.Z.; funding acquisition, J.Z.; investigation, J.Z.; methodology, J.Z. and Y.C.; resources, J.Z.; software, Y.C.; validation, J.Z. and Y.C.; writing—review and editing, J.Z. All authors have read and agreed to the published version of the manuscript.
Funding
The Key Research and Development Program of Gansu Province (23YFFA0056); The 2022 Longyuan Youth Innovation and Entrepreneurship Talent (Team) Project (2022LQTD39); The Gansu Youth Science and Technology Fund Project (21JR7RA547); The Higher Education Innovation Fund Project of Gansu Province (2021A-136); and The Higher Education Institutions Research Projects of Gansu Province (2023B-152).
Institutional Review Board Statement
Not applicable.
Informed Consent Statement
Not applicable.
Data Availability Statement
The data presented in this study are available on request from the corresponding author. The data are not publicly available due to internal policy of State Key Laboratory of Eco-Hydraulics in Northwest Arid Region of China.
Conflicts of Interest
The authors declare no conflict of interest.
References
- Li, J.; Hu, X.; Huang, W.; Wang, J.; Jiang, J. Variation and trend prediction of the mountain runoffs of the trunk streams of the Shule River Basin, Hexi Corridor. J. Glaciol. Geocryol. 2015, 37, 803–810. [Google Scholar]
- Li, H.; Zhao, Q.; Wu, J.; Ding, Y.; Qin, J.; Wei, H.; Zeng, D. Quantitative simulation of the run-off components and its variation characteristics in the upstream of the Shule River. J. Glaciol. Geocryol. 2019, 41, 907–917. [Google Scholar]
- Li, H.; Shen, B.; Fan, E. Relationship between sediment and runoff in Heihe Basin and its application. J. Soil Eros. Soil Water Conserv. 1999, 5, 62–65. [Google Scholar]
- Zheng, M.; Cai, Q.; Cheng, Q. One new sediment yield model for single storm events and its application at annual time scale. Geogr. Res. 2007, 26, 745–754. [Google Scholar]
- Braud, I.; Vich, A.I.J.; Zuluaga, J.; Fornero, L.; Pedrani, A. Vegetation influence on runoff and sediment yield in the Andes region: Observation and modelling. J. Hydrol. 2001, 254, 124–144. [Google Scholar] [CrossRef]
- Zhao, X.; Chen, X.; Huang, J.; Wu, P.; Helmers, M.J. Effects of vegetation cover of natural grassland on runoff and sediment yield in loess hilly region of China. J. Sci. Food Agric. 2014, 94, 497–503. [Google Scholar] [CrossRef]
- El-Hassanin, A.S.; Labib, T.M.; Gaber, E.I. Effects of vegetation cover and land slope on runoff and soil losses from the watersheds of Burundi. Agric. Ecosyst. Environ. 1993, 43, 301–308. [Google Scholar] [CrossRef]
- Sun, X.; Li, S.; Wang, Y. Spatiotemporal change of oasis in Shule River Basin during 1975–2020. Acta Ecol. Sin. 2022, 42, 9111–9120. [Google Scholar]
- Zhou, T.; Wen, X.; Feng, Q.; Yin, Z.; Yang, L. Study on runoff prediction of Shule River based on BMA multi-model combination. J. Glaciol. Geocryol. 2022, 44, 1606–1619. [Google Scholar]
- Zhang, X.; Yu, Z. Changes of annual runoff distribution on the upper reaches of the Shule River. Yellow River 2014, 36, 58–60. [Google Scholar]
- Lan, Y.; Hu, X.L.; Din, H.W.; La, C.F.; Song, J. Variation of water cycle factors in the western Qilian Mountain Area under climate warming-taking the mountain watershed of the main stream of Shule River Basin for example. J. Mt. Sci. 2012, 30, 675–680. [Google Scholar]
- Jia, L.; Sun, D.; Niu, Z.; Yan, J.; Wu, L.; Wang, X.; Xiao, F.; Ma, Y. Pattern of maximum and minimum temperature variation in Shule River Basin. Res. Soil Water Conserv. 2022, 29, 281–287. [Google Scholar]
- Yan, Q.; Yuan, C.; Lei, T.; Lei, Q.; Zhang, M.; Su, G. Effects of precipitation and erosion control practices on the rainfall-runoff-sediment delivery relationships of typical watersheds in the hilly-gully region on the Loess Plateau. Sci. Soil Water Conserv. 2013, 11, 9–16. [Google Scholar]
- Niu, Z.R.; Zhao, W.Z.; Liu, J.Q.; Chen, X.L. Study on change characteristics and tendency of temperature, precipitation and runoff in Weihe River Basin in Gansu. J. Glaciol. Geocryol. 2012, 32, 73–83. [Google Scholar]
- Cao, Z. Variation regularity of intra-annual runoff distribution in the upstream of the Muling River Basin. Water Resour. Power 2019, 37, 21–25. [Google Scholar]
- Yue, S.; Li, D. Features and response to climate-driven factors of the runoff in the upper reaches of the Weihe River during 1975–2011. J. Glaciol. Geocryol. 2014, 36, 413–423. [Google Scholar]
- Shi, H.L.; Hu, C.H.; Wang, Y.G.; Hu, J. Analysis on variation trends of runoff and sediment of the Yellow River Basin and reasons discussion. Yellow River 2014, 36, 1–5. [Google Scholar]
- Cui, L.; Chen, X.L.; An, D.; Guo, X. Change characteristics of runoff and sediment runoff in upper and middle reaches of eastern Heihe River Basin in 60 years. Hydrology 2015, 35, 82–87. [Google Scholar]
- Shi, C.; Shao, W.; Fan, X.; Zhou, Y.; He, L. A study on characteristics and sediment rating curves of floods in the Inner Mongolian reach of the Yellow River. Prog. Geogr. 2012, 31, 1124–1132. [Google Scholar]
- Liu, S.Y.; Yu, X.X.; Xin, Z.B.; Li, Q.Y.; Li, H.G.; Lei, F.Y. Effects of land use change on runoff-sediment relationship at watershed in the loess hilly region. Prog. Geogr. 2010, 29, 565–571. [Google Scholar]
- Li, C.B.; Wang, S.B.; Yang, L.S.; Yang, W.J.; Li, W.Y. Spatial and temporal variation of main hydrologic meteorological elements in the Taohe River Basin from 1951 to 2010. J. Glaciol. Geocryol. 2013, 35, 1259–1266. [Google Scholar]
- Zhang, W. Study on the change trend of runoff in the middle and upper reaches of the main stream of Shule River. Ground Water 2019, 41, 155–156. [Google Scholar]
- Yang, C.; Lan, Y.; Wang, N.; Wang, Q.; Li, Y. Mountainous runoff changes and climate factors analysis of the Shule River Basin in 1958–2015. Sci. Geogr. Sin. 2017, 37, 1894–1899. [Google Scholar]
- Sun, D.; Qi, G.; Ma, Y.; Yan, J.; Wu, L.; Kan, Y. Variation characteristics of runoff in the mainstream of Shule River. Arid Land Geogr. 2020, 43, 557–567. [Google Scholar]
- Chang, J.; Niu, Z. The Yellow River Basin in Gansu Province and characteristic analysis of Shule River Basin rainfall runoff change. J. China Hydrol. 2014, 34, 94–96. [Google Scholar]
- Li, X.; Bu, R.; Chang, Y.; Hu, Y.; Wen, Q.; Wang, X.; Xu, C.; Li, Y.; He, H. The response of landscape metrics against pattern scenarios. Acta Ecol. Sin. 2004, 24, 123–134. [Google Scholar]

Disclaimer/Publisher’s Note: The statements, opinions and data contained in all publications are solely those of the individual author(s) and contributor(s) and not of MDPI and/or the editor(s). MDPI and/or the editor(s) disclaim responsibility for any injury to people or property resulting from any ideas, methods, instructions or products referred to in the content. |
© 2024 by the authors. Licensee MDPI, Basel, Switzerland. This article is an open access article distributed under the terms and conditions of the Creative Commons Attribution (CC BY) license (https://creativecommons.org/licenses/by/4.0/).