
An Intermittent Exposure Regime Did Not Alter the Crop Yield and Biomass Responses to an Elevated Ozone Concentration

 ,
,
Abstract
1. Introduction
2. Materials and Methods
2.1. Experimental Site
2.2. O3 Exposure Facility
2.3. Experimental Design
2.4. Crops and Management
2.5. Harvest and Yield Measurements
2.6. Statistical Analyses
3. Results
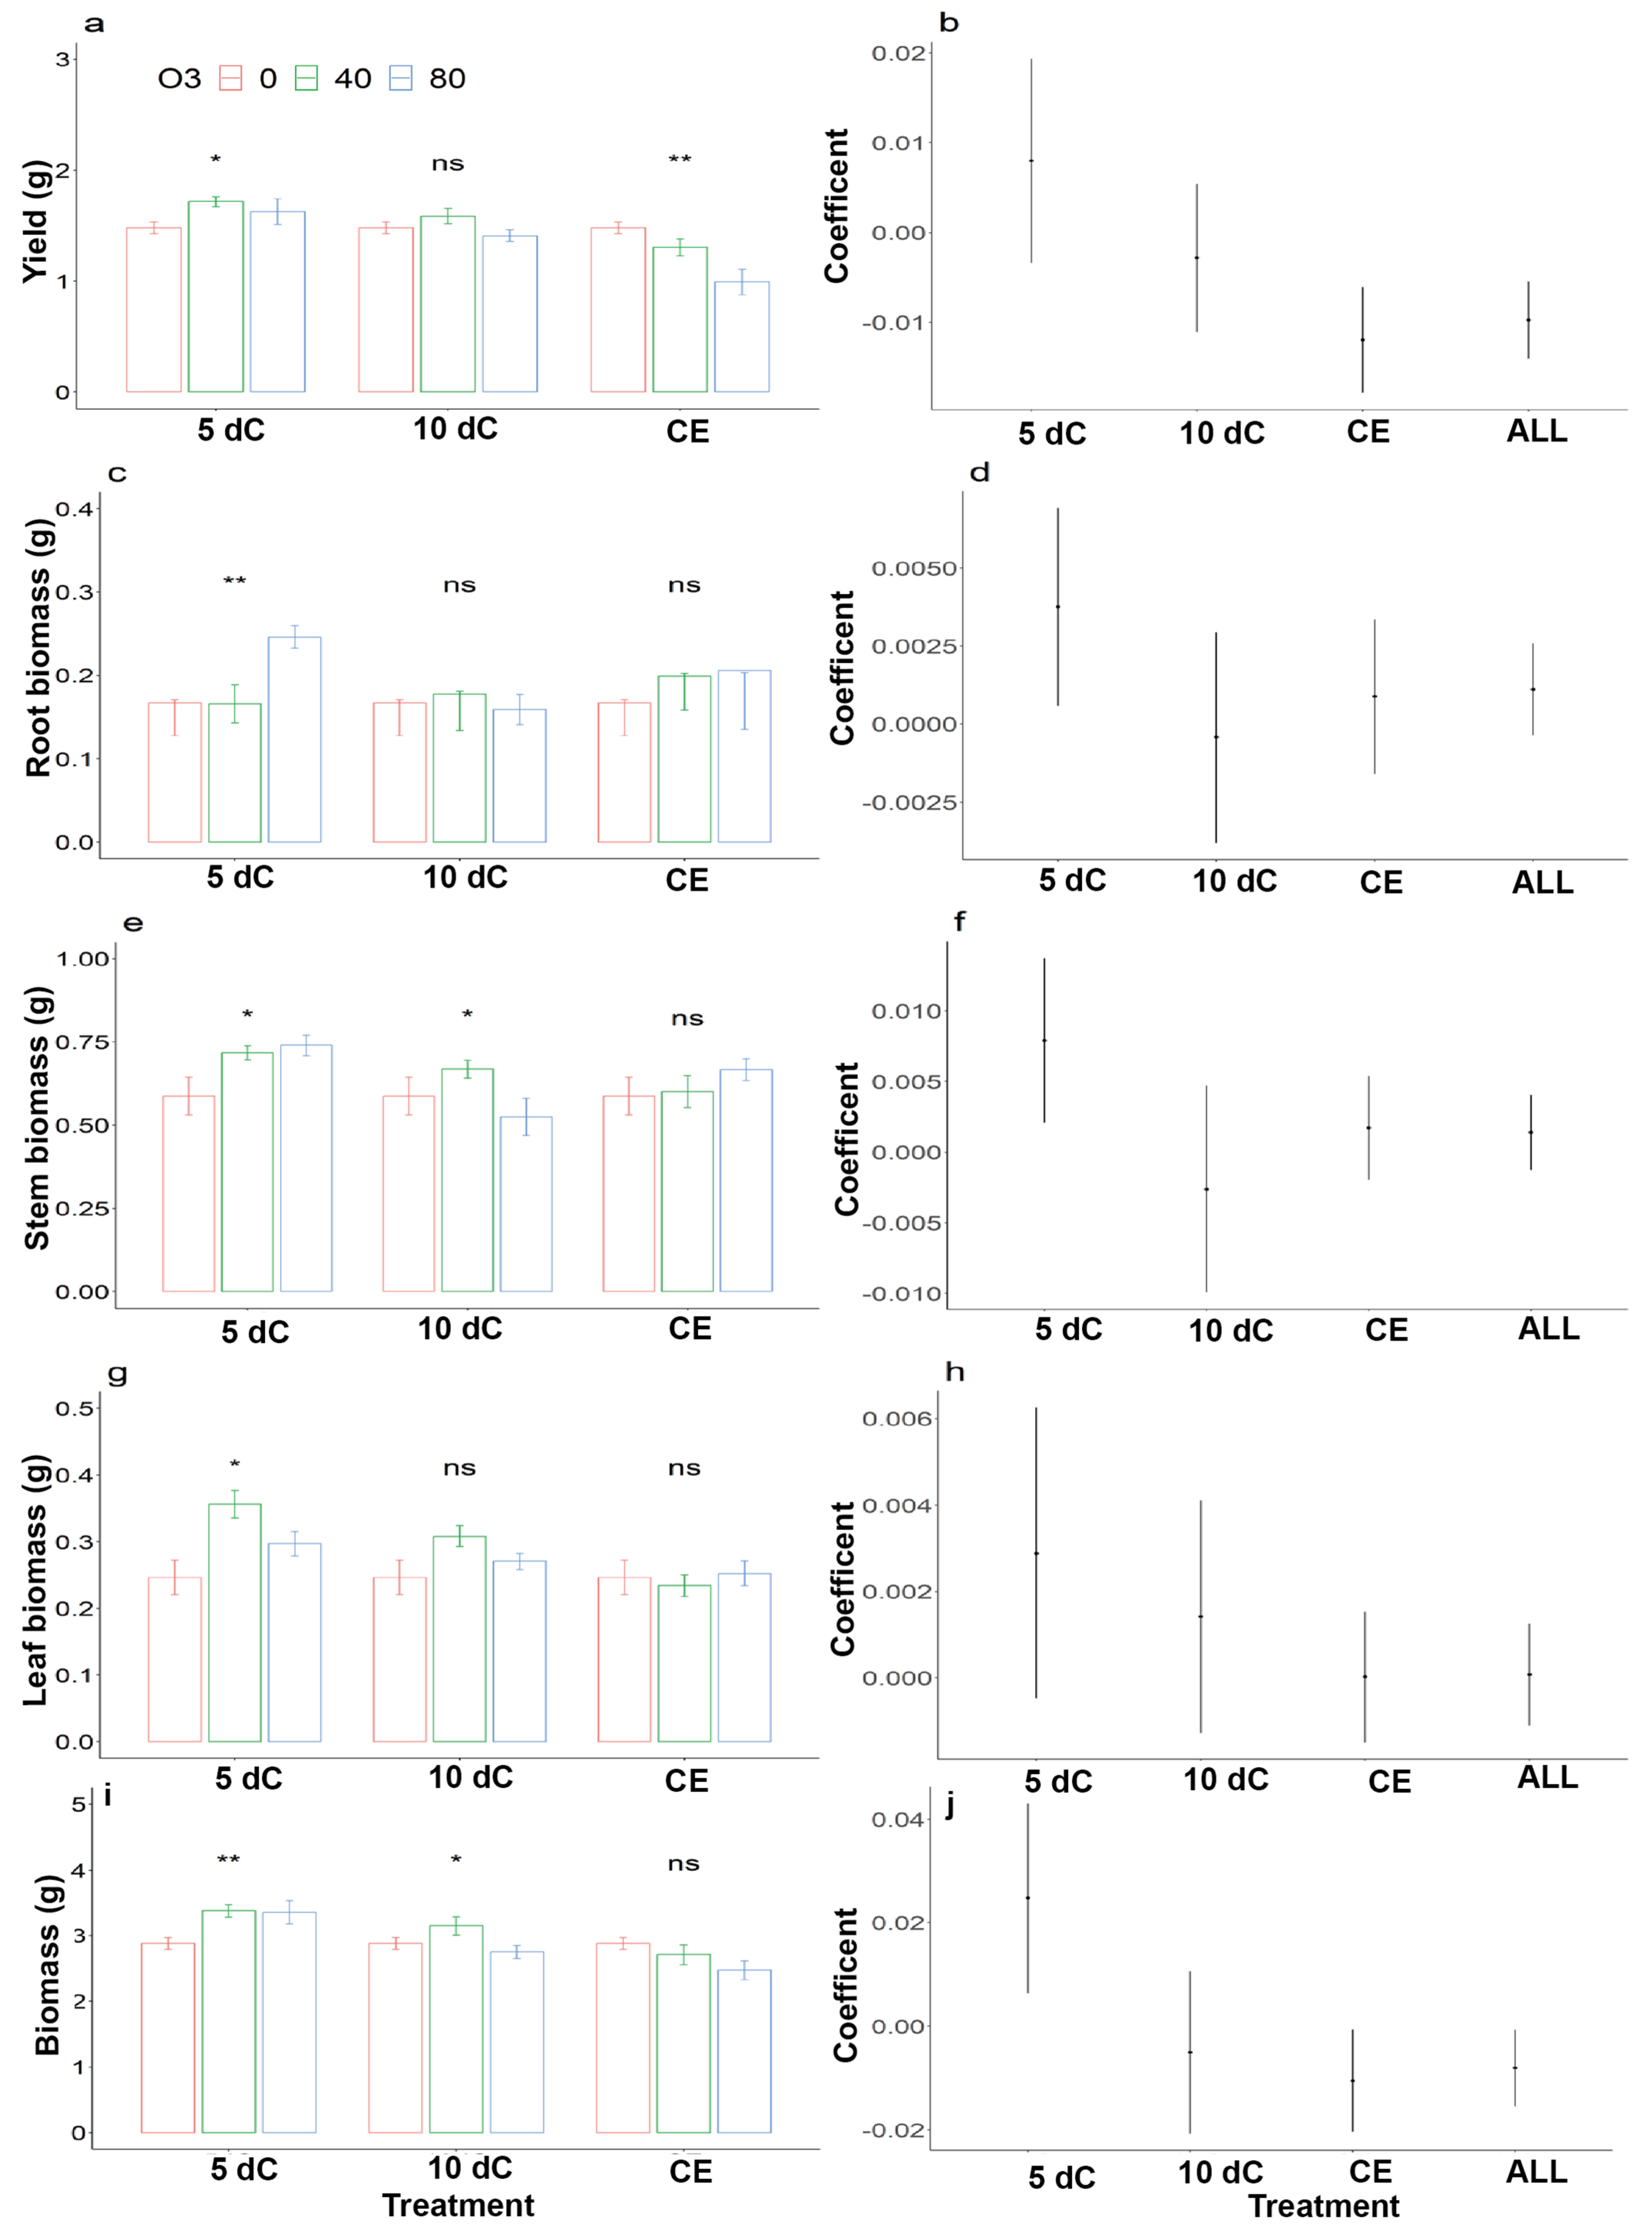
3.1. Winter Wheat
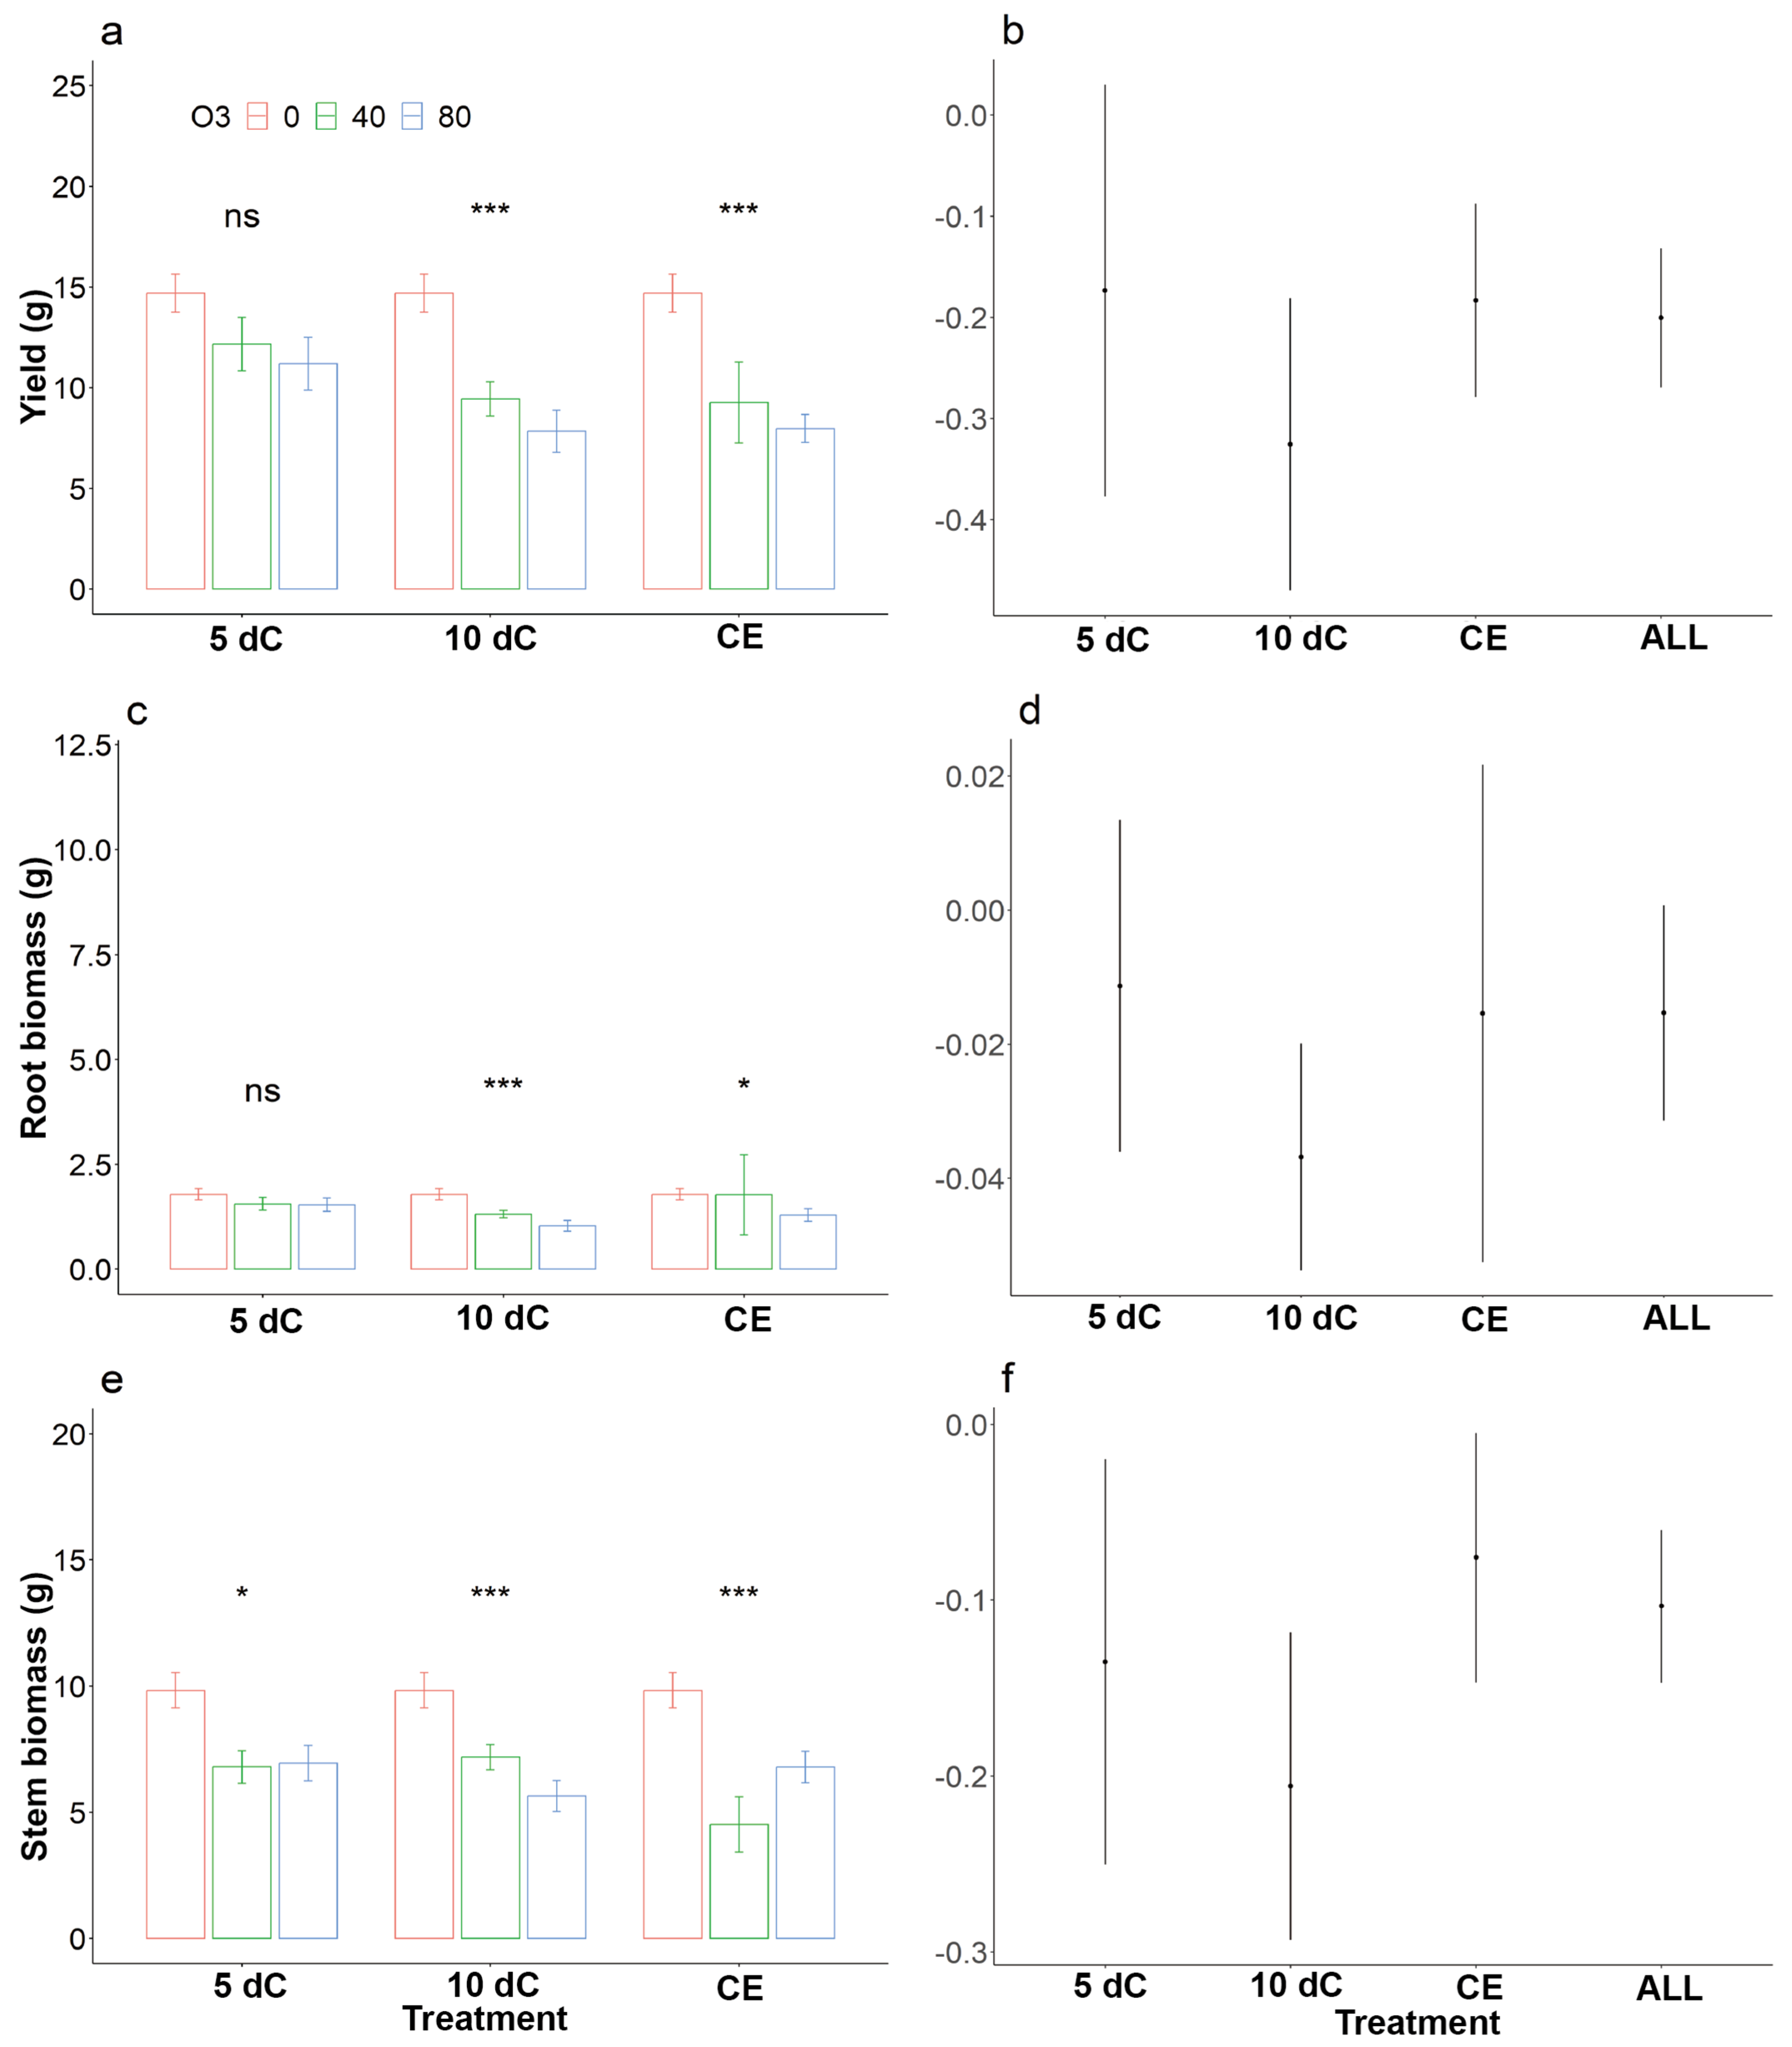
3.2. Soybean
4. Discussion
5. Conclusions
Author Contributions
Funding
Institutional Review Board Statement
Informed Consent Statement
Data Availability Statement
Acknowledgments
Conflicts of Interest
References
- Cooper, O.R.; Gao, R.-S.; Tarasick, D.; Leblanc, T.; Sweeney, C. Long-term ozone trends at rural ozone monitoring sites across the United States, 1990–2010. J. Geophys. Res. Atmos. 2012, 117, D22. [Google Scholar] [CrossRef]
- Cristofanelli, P.; Scheel, H.E.; Steinbacher, M.; Saliba, M.; Azzopardi, F.; Ellul, R.; Fröhlich, M.; Tositti, L.; Brattich, E.; Maione, M.; et al. Long-term surface ozone variability at Mt. Cimone WMO/GAW global station (2165 m a.s.l., Italy). Atmos. Environ. 2015, 101, 23–33. [Google Scholar] [CrossRef]
- Chang, K.-L.; Petropavlovskikh, I.; Cooper, O.R.; Schultz, M.G.; Wang, T. Regional trend analysis of surface ozone observations from monitoring networks in eastern North America, Europe and East Asia. Elem. Sci. Anthr. 2017, 5, 50. [Google Scholar] [CrossRef]
- Derwent, R.G.; Manning, A.J.; Simmonds, P.G.; Spain, T.G.; O’Doherty, S. Long-term trends in ozone in baseline and European regionally-polluted air at Mace Head, Ireland over a 30-year period. Atmos. Environ. 2018, 179, 279–287. [Google Scholar] [CrossRef]
- Yan, Y.; Pozzer, A.; Ojha, N.; Lin, J.; Lelieveld, J. Analysis of European ozone trends in the period 1995–2014. Atmos. Chem. Phys. 2018, 18, 5589–5605. [Google Scholar] [CrossRef]
- Wang, T.; Dai, J.; Lam, K.S.; Nan Poon, C.; Brasseur, G.P. Twenty-Five Years of Lower Tropospheric Ozone Observations in Tropical East Asia: The Influence of Emissions and Weather Patterns. Geophys. Res. Lett. 2019, 46, 11463–11470. [Google Scholar] [CrossRef]
- Lu, X.; Hong, J.; Zhang, L.; Cooper, O.R.; Schultz, M.G.; Xu, X.; Wang, T.; Gao, M.; Zhao, Y.; Zhang, Y. Severe Surface Ozone Pollution in China: A Global Perspective. Environ. Sci. Technol. Lett. 2018, 5, 487–494. [Google Scholar] [CrossRef]
- Sun, L.; Xue, L.; Wang, Y.; Li, L.; Lin, J.; Ni, R.; Yan, Y.; Chen, L.; Li, J.; Zhang, Q.; et al. Impacts of meteorology and emissions on summertime surface ozone increases over central eastern China between 2003 and 2015. Atmos. Chem. Phys. 2019, 19, 1455–1469. [Google Scholar] [CrossRef]
- Xu, X.; Lin, W.; Xu, W.; Jin, J.; Wang, Y.; Zhang, G.; Zhang, X.; Ma, Z.; Dong, Y.; Ma, Q.; et al. Long-term changes of regional ozone in China: Implications for human health and ecosystem impacts. Elem. Sci. Anthr. 2020, 8, 13. [Google Scholar] [CrossRef]
- Wang, X.; Manning, W.; Feng, Z.; Zhu, Y. Ground-level ozone in China: Distribution and effects on crop yields. Environ. Pollut. 2007, 147, 394–400. [Google Scholar] [CrossRef]
- Zhang, W.; Feng, Z.; Wang, X.; Niu, J. Elevated ozone negatively affects photosynthesis of current-year leaves but not previous-year leaves in evergreen Cyclobalanopsis glauca seedlings. Environ. Pollut. 2014, 184, 676–681. [Google Scholar] [CrossRef] [PubMed]
- Feng, Z.; Büker, P.; Pleijel, H.; Emberson, L.; Karlsson, P.E.; Uddling, J. A unifying explanation for variation in ozone sensitivity among woody plants. Glob. Chang. Biol. 2018, 24, 78–84. [Google Scholar] [CrossRef] [PubMed]
- Osborne, S.A.; Mills, G.; Hayes, F.; Ainsworth, E.A.; Büker, P.; Emberson, L. Has the sensitivity of soybean cultivars to ozone pollution increased with time? An analysis of published dose–response data. Glob. Chang. Biol. 2016, 22, 3097–3111. [Google Scholar] [CrossRef]
- Mills, G.; Sharps, K.; Simpson, D.; Pleijel, H.; Frei, M.; Burkey, K.; Emberson, L.; Uddling, J.; Broberg, M.; Feng, Z.; et al. Closing the global ozone yield gap: Quantification and cobenefits for multistress tolerance. Glob. Chang. Biol. 2018, 24, 4869–4893. [Google Scholar] [CrossRef] [PubMed]
- Broberg, M.C.; Daun, S.; Pleijel, H. Ozone Induced Loss of Seed Protein Accumulation Is Larger in Soybean than in Wheat and Rice. Agronomy 2020, 10, 357. [Google Scholar] [CrossRef]
- Li, D.; Shindell, D.; Ding, D.; Lu, X.; Zhang, L.; Zhang, Y. Surface ozone impacts on major crop production in China from 2010 to 2017. Atmos. Chem. Phys. 2022, 22, 2625–2638. [Google Scholar] [CrossRef]
- Emberson, L.D.; Büker, P.; Ashmore, M.R.; Mills, G.; Jackson, L.S.; Agrawal, M.; Atikuzzaman, M.D.; Cinderby, S.; Engardt, M.; Jamir, C.; et al. A comparison of North American and Asian exposure–response data for ozone effects on crop yields. Atmos. Environ. 2009, 43, 1945–1953. [Google Scholar] [CrossRef]
- Sicard, P.; Serra, R.; Rossello, P. Spatiotemporal trends in ground-level ozone concentrations and metrics in France over the time period 1999–2012. Environ. Res. 2016, 149, 122–144. [Google Scholar] [CrossRef] [PubMed]
- Zhu, Z.; Sun, X.; Zhao, F.; Meixner, F.X. Ozone concentrations, flux and potential effect on yield during wheat growth in the Northwest-Shandong Plain of China. J. Environ. Sci. 2015, 34, 1–9. [Google Scholar] [CrossRef]
- Liu, C.; Shi, K. A review on methodology in O3-NOx-VOC sensitivity study. Environ. Pollut. 2021, 291, 118249. [Google Scholar] [CrossRef]
- Zhao, S.; Yu, Y.; Yin, D.; He, J.; Liu, N.; Qu, J.; Xiao, J. Annual and diurnal variations of gaseous and particulate pollutants in 31 provincial capital cities based on in situ air quality monitoring data from China National Environmental Monitoring Center. Environ. Int. 2016, 86, 92–106. [Google Scholar] [CrossRef] [PubMed]
- Xu, J.; Zhang, Y.; Fu, J.S.; Zheng, S.; Wang, W. Process analysis of typical summertime ozone episodes over the Beijing area. Sci. Total Environ. 2008, 399, 147–157. [Google Scholar] [CrossRef] [PubMed]
- Tan, Z.; Ma, X.; Lu, K.; Jiang, M.; Zou, Q.; Wang, H.; Zeng, L.; Zhang, Y. Direct evidence of local photochemical production driven ozone episode in Beijing: A case study. Sci. Total Environ. 2021, 800, 148868. [Google Scholar] [CrossRef] [PubMed]
- Wang, X.; Zheng, Q.; Feng, Z.; Xie, J.; Feng, Z.; Ouyang, Z.; Manning, W.J. Comparison of a diurnal vs. steady-state ozone exposure profile on growth and yield of oilseed rape (Brassica napus L.) in open-top chambers in the Yangtze Delta, China. Environ. Pollut. 2008, 156, 449–453. [Google Scholar] [CrossRef] [PubMed]
- Rivas, R.; Frosi, G.; Ramos, D.G.; Pereira, S.; Benko-Iseppon, A.M.; Santos, M.G. Photosynthetic limitation and mechanisms of photoprotection under drought and recovery of Calotropis procera, an evergreen C3 from arid regions. Plant Physiol. Biochem. 2017, 118, 589–599. [Google Scholar] [CrossRef] [PubMed]
- Yeung, E.; van Veen, H.; Vashisht, D.; Sobral Paiva, A.L.; Hummel, M.; Rankenberg, T.; Steffens, B.; Steffen-Heins, A.; Sauter, M.; de Vries, M.; et al. A stress recovery signaling network for enhanced flooding tolerance in Arabidopsis thaliana. Proc. Natl. Acad. Sci. USA 2018, 115, E6085–E6094. [Google Scholar] [CrossRef] [PubMed]
- Chmielowska-Bąk, J.; Deckert, J. Plant Recovery after Metal Stress—A Review. Plants 2021, 10, 450. [Google Scholar] [CrossRef] [PubMed]
- Agathokleous, E.; Araminiene, V.; Belz, R.G.; Calatayud, V.; De Marco, A.; Domingos, M.; Feng, Z.; Hoshika, Y.; Kitao, M.; Koike, T.; et al. A quantitative assessment of hormetic responses of plants to ozone. Environ. Res. 2019, 176, 108527. [Google Scholar] [CrossRef]
- Jianhui, B. Study on surface O3 chemistry and photochemistry by UV energy conservation. Atmos. Pollut. Res. 2010, 1, 118–127. [Google Scholar] [CrossRef]
- Akagi, S.K.; Yokelson, R.J.; Burling, I.R.; Meinardi, S.; Simpson, I.; Blake, D.R.; McMeeking, G.R.; Sullivan, A.; Lee, T.; Kreidenweis, S.; et al. Measurements of reactive trace gases and variable O3 formation rates in some South Carolina biomass burning plumes. Atmos. Chem. Phys. 2013, 13, 1141–1165. [Google Scholar] [CrossRef]
- Tong, L.; Sudebilige, F.Z.; Qiong, W.; Chunmei, G.; Fei, L.; Wei, W.; Baohui, Y.; Xiaoke, W. Stomatal ozone uptake modeling and comparative analysis of flux response relationships of winter wheat. Acta Ecol. Sin. 2012, 32, 2890–2899. [Google Scholar] [CrossRef]
- Zheng, F.; Wang, X.; Lu, F.E.I.; Hou, P.; Zhang, W.; Duan, X.; Zhou, X.; Ai, Y.; Zheng, H.U.A.; Ouyang, Z.; et al. Effects of elevated ozone concentration on methane emission from a rice paddy in Yangtze River Delta, China. Glob. Chang. Biol. 2011, 17, 898–910. [Google Scholar] [CrossRef]
- Li, L.; Manning, W.J.; Tong, L.; Wang, X. Chronic drought stress reduced but not protected Shantung maple (Acer truncatum Bunge) from adverse effects of ozone (O3) on growth and physiology in the suburb of Beijing, China. Environ. Pollut. 2015, 201, 34–41. [Google Scholar] [CrossRef] [PubMed]
- Zhang, Q. Chinese Wheat Improvement and Pedigree Analysis; China Agriculture Press: Beijing, China, 2003; pp. 88–89. (In Chinese) [Google Scholar]
- Yang, C.Y.; Zhang, M.C.; Zhao, S.J.; Wang, W.X. Study on breeding methods of a new soybean variety-Jidou12 with high protein and high yield. J. Hebei Agric. Univ. 2004, 27, 8–11. [Google Scholar]
- Wang, X.; Zhang, Q.; Zheng, F.; Zheng, Q.; Yao, F.; Chen, Z.; Zhang, W.; Hou, P.; Feng, Z.; Song, W.; et al. Effects of elevated O3 concentration on winter wheat and rice yields in the Yangtze River Delta, China. Environ. Pollut. 2012, 171, 118–125. [Google Scholar] [CrossRef] [PubMed]
- Zhang, W.; Feng, Z.; Wang, X.; Liu, X.; Hu, E. Quantification of ozone exposure- and stomatal uptake-yield response relationships for soybean in Northeast China. Sci. Total Environ. 2017, 599–600, 710–720. [Google Scholar] [CrossRef] [PubMed]
- Feng, Z.; Kobayashi, K.; Ainsworth, E.A. Impact of elevated ozone concentration on growth, physiology, and yield of wheat (Triticum aestivum L.): A meta-analysis. Glob. Chang. Biol. 2008, 14, 2696–2708. [Google Scholar] [CrossRef]
- Morgan, P.B.; Ainsworth, E.A.; Long, S.P. How does elevated ozone impact soybean? A meta-analysis of photosynthesis, growth and yield. Plant Cell Environ. 2003, 26, 1317–1328. [Google Scholar] [CrossRef]
- Agyei, T.; Juráň, S.; Edwards-Jonášová, M.; Fischer, M.; Švik, M.; Komínková, K.; Ofori-Amanfo, K.K.; Marek, M.V.; Grace, J.; Urban, O. The Influence of Ozone on Net Ecosystem Production of a Ryegrass–Clover Mixture under Field Conditions. Atmosphere 2021, 12, 1629. [Google Scholar] [CrossRef]
- Jurán, S.; Edwards-Jonásová, M.; Cudlín, P.; Zapletal, M.; Sigut, L.; Grace, J.; Urban, O. Prediction of ozone effects on net ecosystem production of Norway spruce forest. Iforest 2018, 11, 743–750. [Google Scholar] [CrossRef]
- Chmielowska, J.; Veloso, J.; Gutiérrez, J.; Silvar, C.; Díaz, J. Cross-protection of pepper plants stressed by copper against a vascular pathogen is accompanied by the induction of a defence response. Plant Sci. 2010, 178, 176–182. [Google Scholar] [CrossRef]
- Muszyńska, E.; Labudda, M. Dual Role of Metallic Trace Elements in Stress Biology—From Negative to Beneficial Impact on Plants. Int. J. Mol. Sci. 2019, 20, 3117. [Google Scholar] [CrossRef]
- Rozpądek, P.; Ślesak, I.; Cebula, S.; Waligórski, P.; Dziurka, M.; Skoczowski, A.; Miszalski, Z. Ozone fumigation results in accelerated growth and persistent changes in the antioxidant system of Brassica oleracea L. var. capitata f. alba. J. Plant Physiol. 2013, 170, 1259–1266. [Google Scholar] [CrossRef]
- Feng, Z.; Tang, H.; Uddling, J.; Pleijel, H.; Kobayashi, K.; Zhu, J.; Oue, H.; Guo, W. A stomatal ozone flux–response relationship to assess ozone-induced yield loss of winter wheat in subtropical China. Environ. Pollut. 2012, 164, 16–23. [Google Scholar] [CrossRef] [PubMed]
- Holder, A.J.; Hayes, F. Substantial yield reduction in sweet potato due to tropospheric ozone, the dose-response function. Environ. Pollut. 2022, 304, 119209. [Google Scholar] [CrossRef] [PubMed]
- Xu, Y.; Feng, Z.; Shang, B.; Dai, L.; Uddling, J.; Tarvainen, L. Mesophyll conductance limitation of photosynthesis in poplar under elevated ozone. Sci. Total Environ. 2019, 657, 136–145. [Google Scholar] [CrossRef]
- Reinert, K.H.; Giddings, J.M.; Judd, L. Effects analysis of time-varying or repeated exposures in aquatic ecological risk assessment of agrochemicals. Environ. Toxicol. Chem. 2002, 21, 1977–1992. [Google Scholar] [CrossRef]
- Sawada, H.; Kohno, Y. Differential ozone sensitivity of rice cultivars as indicated by visible injury and grain yield. Plant Biol. 2009, 11, 70–75. [Google Scholar] [CrossRef] [PubMed]
- Gillespie, K.M.; Rogers, A.; Ainsworth, E.A. Growth at elevated ozone or elevated carbon dioxide concentration alters antioxidant capacity and response to acute oxidative stress in soybean (Glycine max). J. Exp. Bot. 2011, 62, 2667–2678. [Google Scholar] [CrossRef]
- Singh, A.A.; Fatima, A.; Mishra, A.K.; Chaudhary, N.; Mukherjee, A.; Agrawal, M.; Agrawal, S.B. Assessment of ozone toxicity among 14 Indian wheat cultivars under field conditions: Growth and productivity. Environ. Monit. Assess. 2018, 190, 190. [Google Scholar] [CrossRef]


| Crop | Control | 40 ppb | 80 ppb | ||||
|---|---|---|---|---|---|---|---|
| 5 dC | 10 dC | CE | 5 dC | 10 dC | CE | ||
| Winter wheat | 3.60 | 14.44 | 15.05 | 25.51 | 23.43 | 23.42 | 43.60 |
| Soybean | 3.71 | 11.61 | 13.25 | 19.94 | 21.77 | 23.65 | 38.68 |
Disclaimer/Publisher’s Note: The statements, opinions and data contained in all publications are solely those of the individual author(s) and contributor(s) and not of MDPI and/or the editor(s). MDPI and/or the editor(s) disclaim responsibility for any injury to people or property resulting from any ideas, methods, instructions or products referred to in the content. |
© 2024 by the authors. Licensee MDPI, Basel, Switzerland. This article is an open access article distributed under the terms and conditions of the Creative Commons Attribution (CC BY) license (https://creativecommons.org/licenses/by/4.0/).
Share and Cite
Wang, X.; Zhang, D.; Tong, S.; Huang, B.; Zhang, S.; Sun, X.; Zhang, H.; Wan, W.; Zheng, F. An Intermittent Exposure Regime Did Not Alter the Crop Yield and Biomass Responses to an Elevated Ozone Concentration. Atmosphere 2024, 15, 464. https://doi.org/10.3390/atmos15040464
Wang X, Zhang D, Tong S, Huang B, Zhang S, Sun X, Zhang H, Wan W, Zheng F. An Intermittent Exposure Regime Did Not Alter the Crop Yield and Biomass Responses to an Elevated Ozone Concentration. Atmosphere. 2024; 15(4):464. https://doi.org/10.3390/atmos15040464
Chicago/Turabian StyleWang, Xiaoke, Danhong Zhang, Sisi Tong, Binbin Huang, Shuai Zhang, Xu Sun, Hongxing Zhang, Wuxing Wan, and Feixiang Zheng. 2024. "An Intermittent Exposure Regime Did Not Alter the Crop Yield and Biomass Responses to an Elevated Ozone Concentration" Atmosphere 15, no. 4: 464. https://doi.org/10.3390/atmos15040464
APA StyleWang, X., Zhang, D., Tong, S., Huang, B., Zhang, S., Sun, X., Zhang, H., Wan, W., & Zheng, F. (2024). An Intermittent Exposure Regime Did Not Alter the Crop Yield and Biomass Responses to an Elevated Ozone Concentration. Atmosphere, 15(4), 464. https://doi.org/10.3390/atmos15040464