Review

State-of-the-Art Low-Cost Air Quality Sensors, Assemblies, Calibration and Evaluation for Respiration-Associated Diseases: A Systematic Review

by
Hasan Tariq
1,*,
Farid Touati
1,
Damiano Crescini
2 and
Adel Ben Mnaouer
3
1
Department of Electrical Engineering, College of Engineering, Qatar University, Doha 2713, Qatar
2
Dipartimento di Ingegneria delI’Informazione, Brescia University, 25121 Brescia, Italy
3
Department of Computer Science, College of Computer & Information Sciences, Prince Sultan University, Riyadh 11586, Saudi Arabia
*
Author to whom correspondence should be addressed.
Atmosphere 2024, 15(4), 471; https://doi.org/10.3390/atmos15040471
Submission received: 26 December 2023 / Revised: 5 March 2024 / Accepted: 11 March 2024 / Published: 11 April 2024
(This article belongs to the Special Issue Air Pollution Exposure and Health Impact Assessment (2nd Edition))

Abstract

:
Indoor air quality and respiratory health have always been an area of prime interest across the globe. The significance of low-cost air quality sensing and indoor public health practices spiked during the pandemic when indoor air pollution became a threat to living beings, especially human beings. Problem Definition: Indoor respiration-associated diseases are hard to diagnose if they are due to indoor environmental conditions. A major challenge was observed in establishing a baseline between indoor air quality sensors and associated respiratory diseases. Methods: In this work, 10,000+ articles from top literature databases were reviewed using six bibliometric analysis methods (Lorenz Curve of Citations, Hirch’s H-Index, Kosmulski’s H2-Index, Harzing’s Hl-Norm-Index, Sidoropolous’s HC-Index, and Schrieber’s HM-index) to formulate indoor air quality sensor and disease correlation publication rubrics to critically review 482 articles. Results: A set of 152 articles was found based on systematic review parameters in six bibliometric indices for publications that used WHO, NIH, US EPA, CDC, and FDA-defined principles. Five major respiratory diseases were found to be causing major death toll (up to 32%) due to five key pollutants, measured by 30+ low-cost sensors and further optimized by seven calibration systems for seven practical parameters tailored to respiratory disease baselines evaluated through 10 cost parameters. Impact: This review was conducted to assist end-users, public health facilities, state agencies, researchers, scientists, and air quality protection agencies.

1. Introduction

It is widely accepted that air pollution leads to major health problems, costing economies billions of dollars per year in terms of health care costs and loss of productivity. Various studies around the world have linked many chronic diseases to air pollution. The recent WHO (24 February 2024) respiratory disease mortality statistic of 129,308 deaths for those aged 75 and above (only in America [1]) were alarming. Additionally, in work [2], it was anticipated that household air pollution caused 3.2 million fatalities annually, including approximately 237,000 deaths of children under the age of 5. Each year, 6.7 million premature deaths are attributed to the consequences of ambient and home air pollution. Living with chronic obstructive pulmonary disease (COPD), lung cancer, ischemic heart disease, stroke, and other non-communicable illnesses is made worse by household air pollution [3]. The term “Air Quality” refers to a gas assessment mechanism that can be used as a standard unit variable to govern acceptable pollution reciprocally as defined by the World Health Organization (WHO), the U.S. Environmental Protection Agency (US-EPA), and the United Nations Environment Programme (UNEP) [4].
Air quality is monitored using low-cost mobile sensors and reference instrumentation, which face many challenges. An air quality gas sensor is an electronic or electrochemical instrument that can measure the ratio of gas particles in a given volume of air, usually in units of part per million (ppm), through some sensing element. Air quality gas sensors may also have a variety of other applications [4,5,6]. Indoor pollutants’ detection threshold or resolution, range, and linearity are critical challenges in atmospheric sensor systems. The pollutant sensor’s resolution becomes critical when detecting low-concentration pollutants like VOCs and Radon. In 1815, the first gas detector system, known as the Davy lamp, was invented by Sir Humphry Davy (of England) to detect the presence of methane (firedamp) in underground coal mines [7]. The first gas sensor was invented by Dr. Oliver Johnson that originated from the catalytic combustion (LEL) sensor [8]. Clark and Lyons utilized the strategy of the electrochemical detection of oxygen or hydrogen peroxide to measure glucose in biological samples [9]. The ubiquity of impedance is mainly leveraged to realize gas transducers [10]. Optical sensors are passive, i.e., require an external field excitation source to inject some energy into the observation specimen for measurement [11,12,13]. The feedback of this energy can have many numerical relationships with the induced signal, termed as the working response (refractive coupling) [14]. In this work, we focus on surveying sensors and instrumentation used in air quality measurement as well as associated diseases. The research hierarchy of this work is presented in Figure 1.
The existing practices lead to a lack of transparency and conceptual challenges that can make it difficult to recognize the similarities and differences between indoor diseases and existing gas sensing systems and the contributions of new techniques. The contributions of this paper are chronologically comprehended as being indoor epidemiology-focused: (1) bibliometric analysis of IAQ and indoor epidemiology correlation; (2) air quality assessment (AQA) frameworks; (3) AQ sensor types and technologies; (4) AQ sensors, configurations, and topologies; (5) AQ sensor calibration and testing systems; (6) AQ measurement systems; (7) indoor epidemiology and diseases; (8) practical considerations in the real-world deployment of low-cost AQ Sensors for indoor respiratory conditions and disease diagnosis; and (9) future recommendations and research directions. The articles selected and the exclusion workflow is presented in Figure 2 below.
Since low-cost AQ is a huge domain and has a plethora of terminologies, Table 1 presents the key acronyms and abbreviations used in this research.

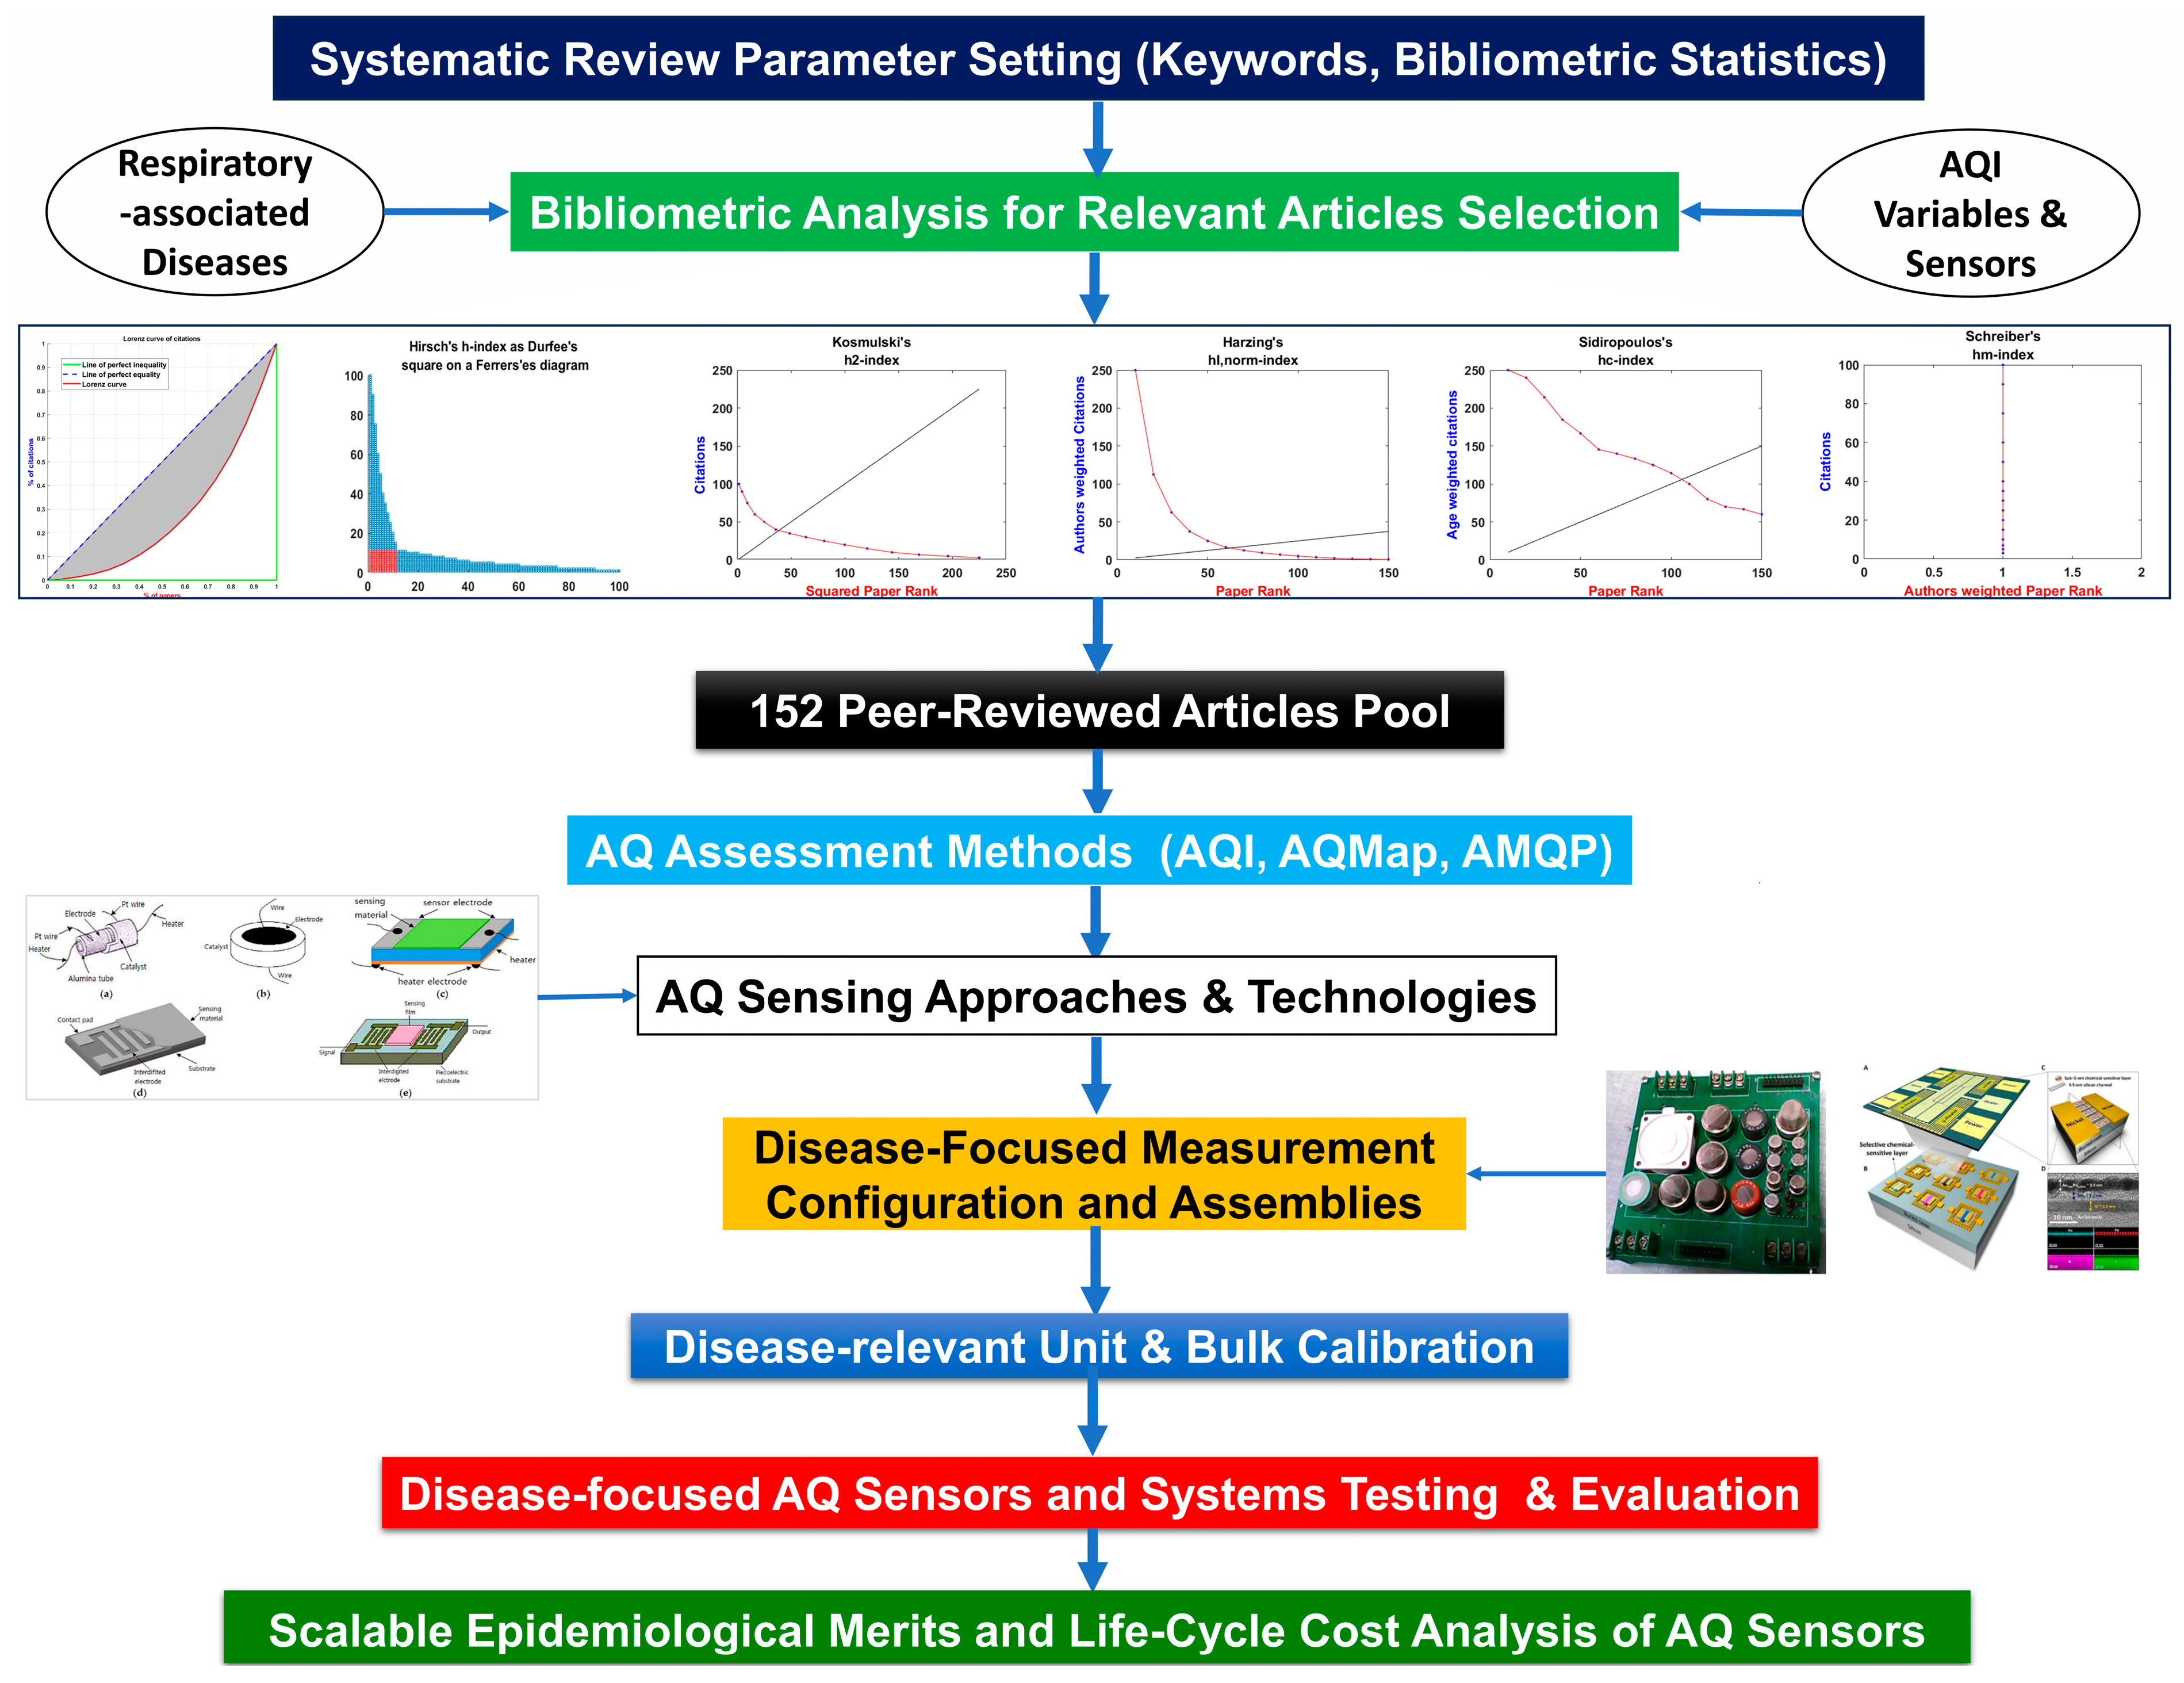
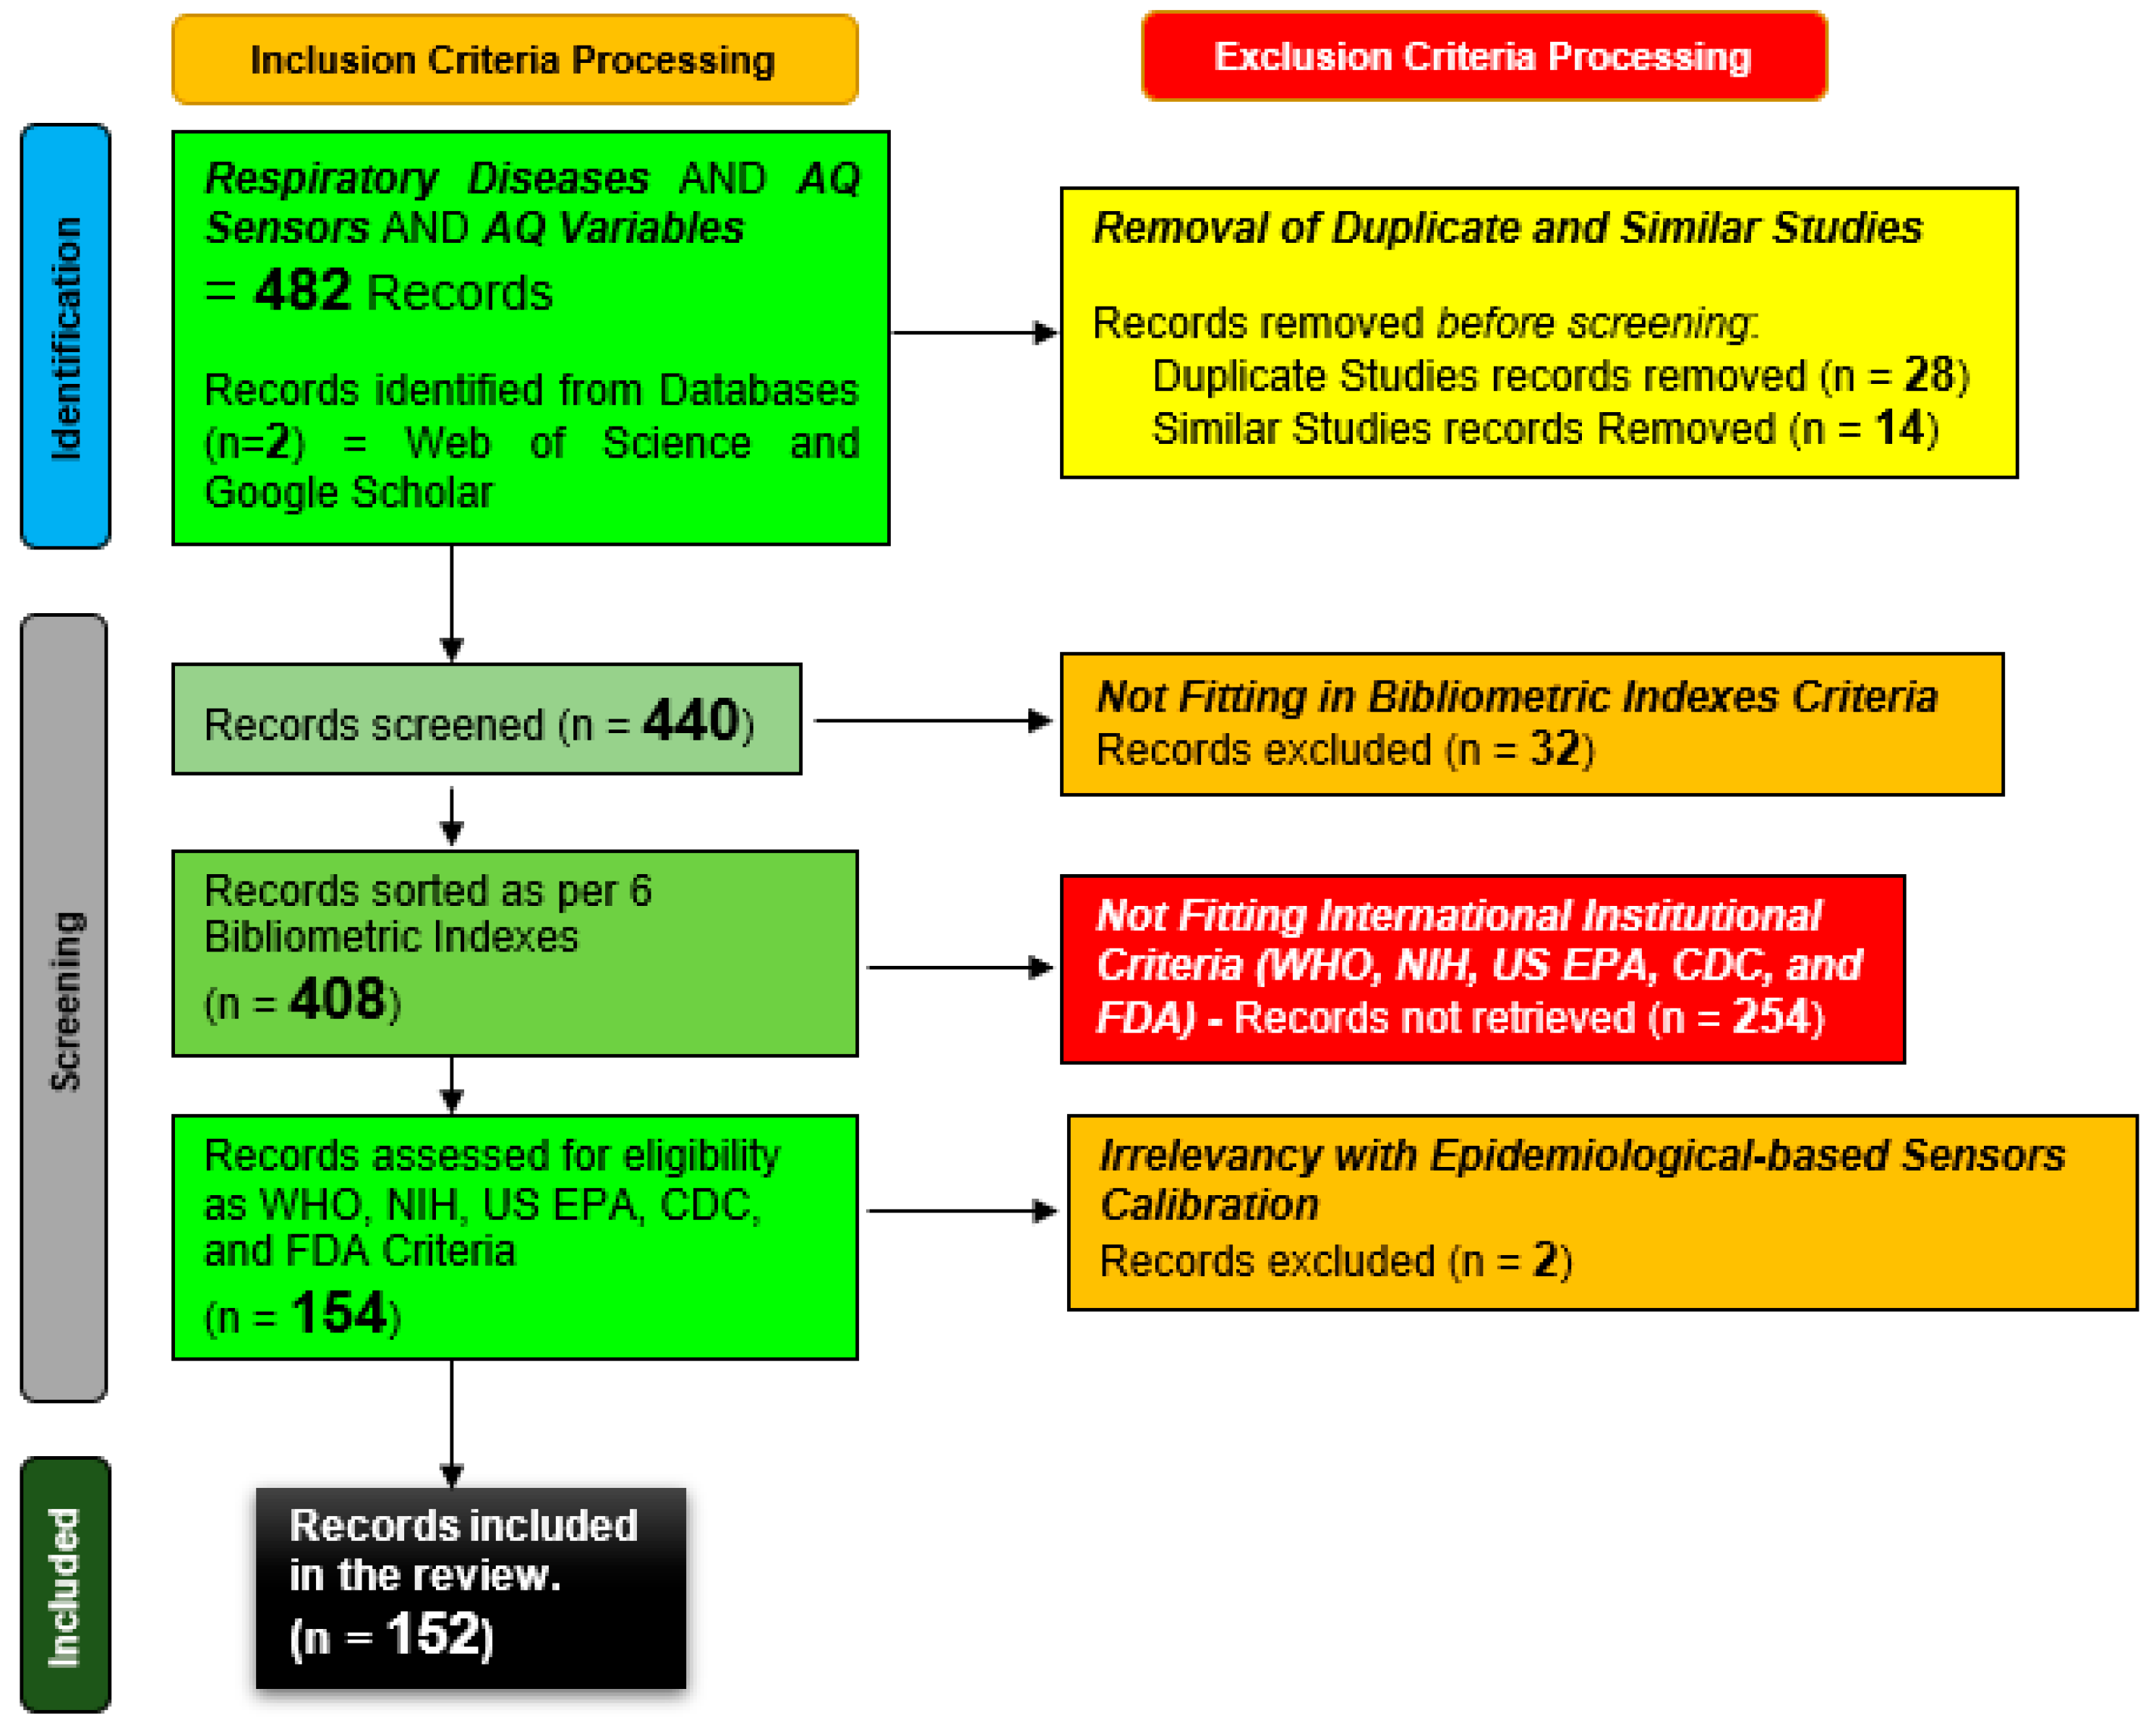
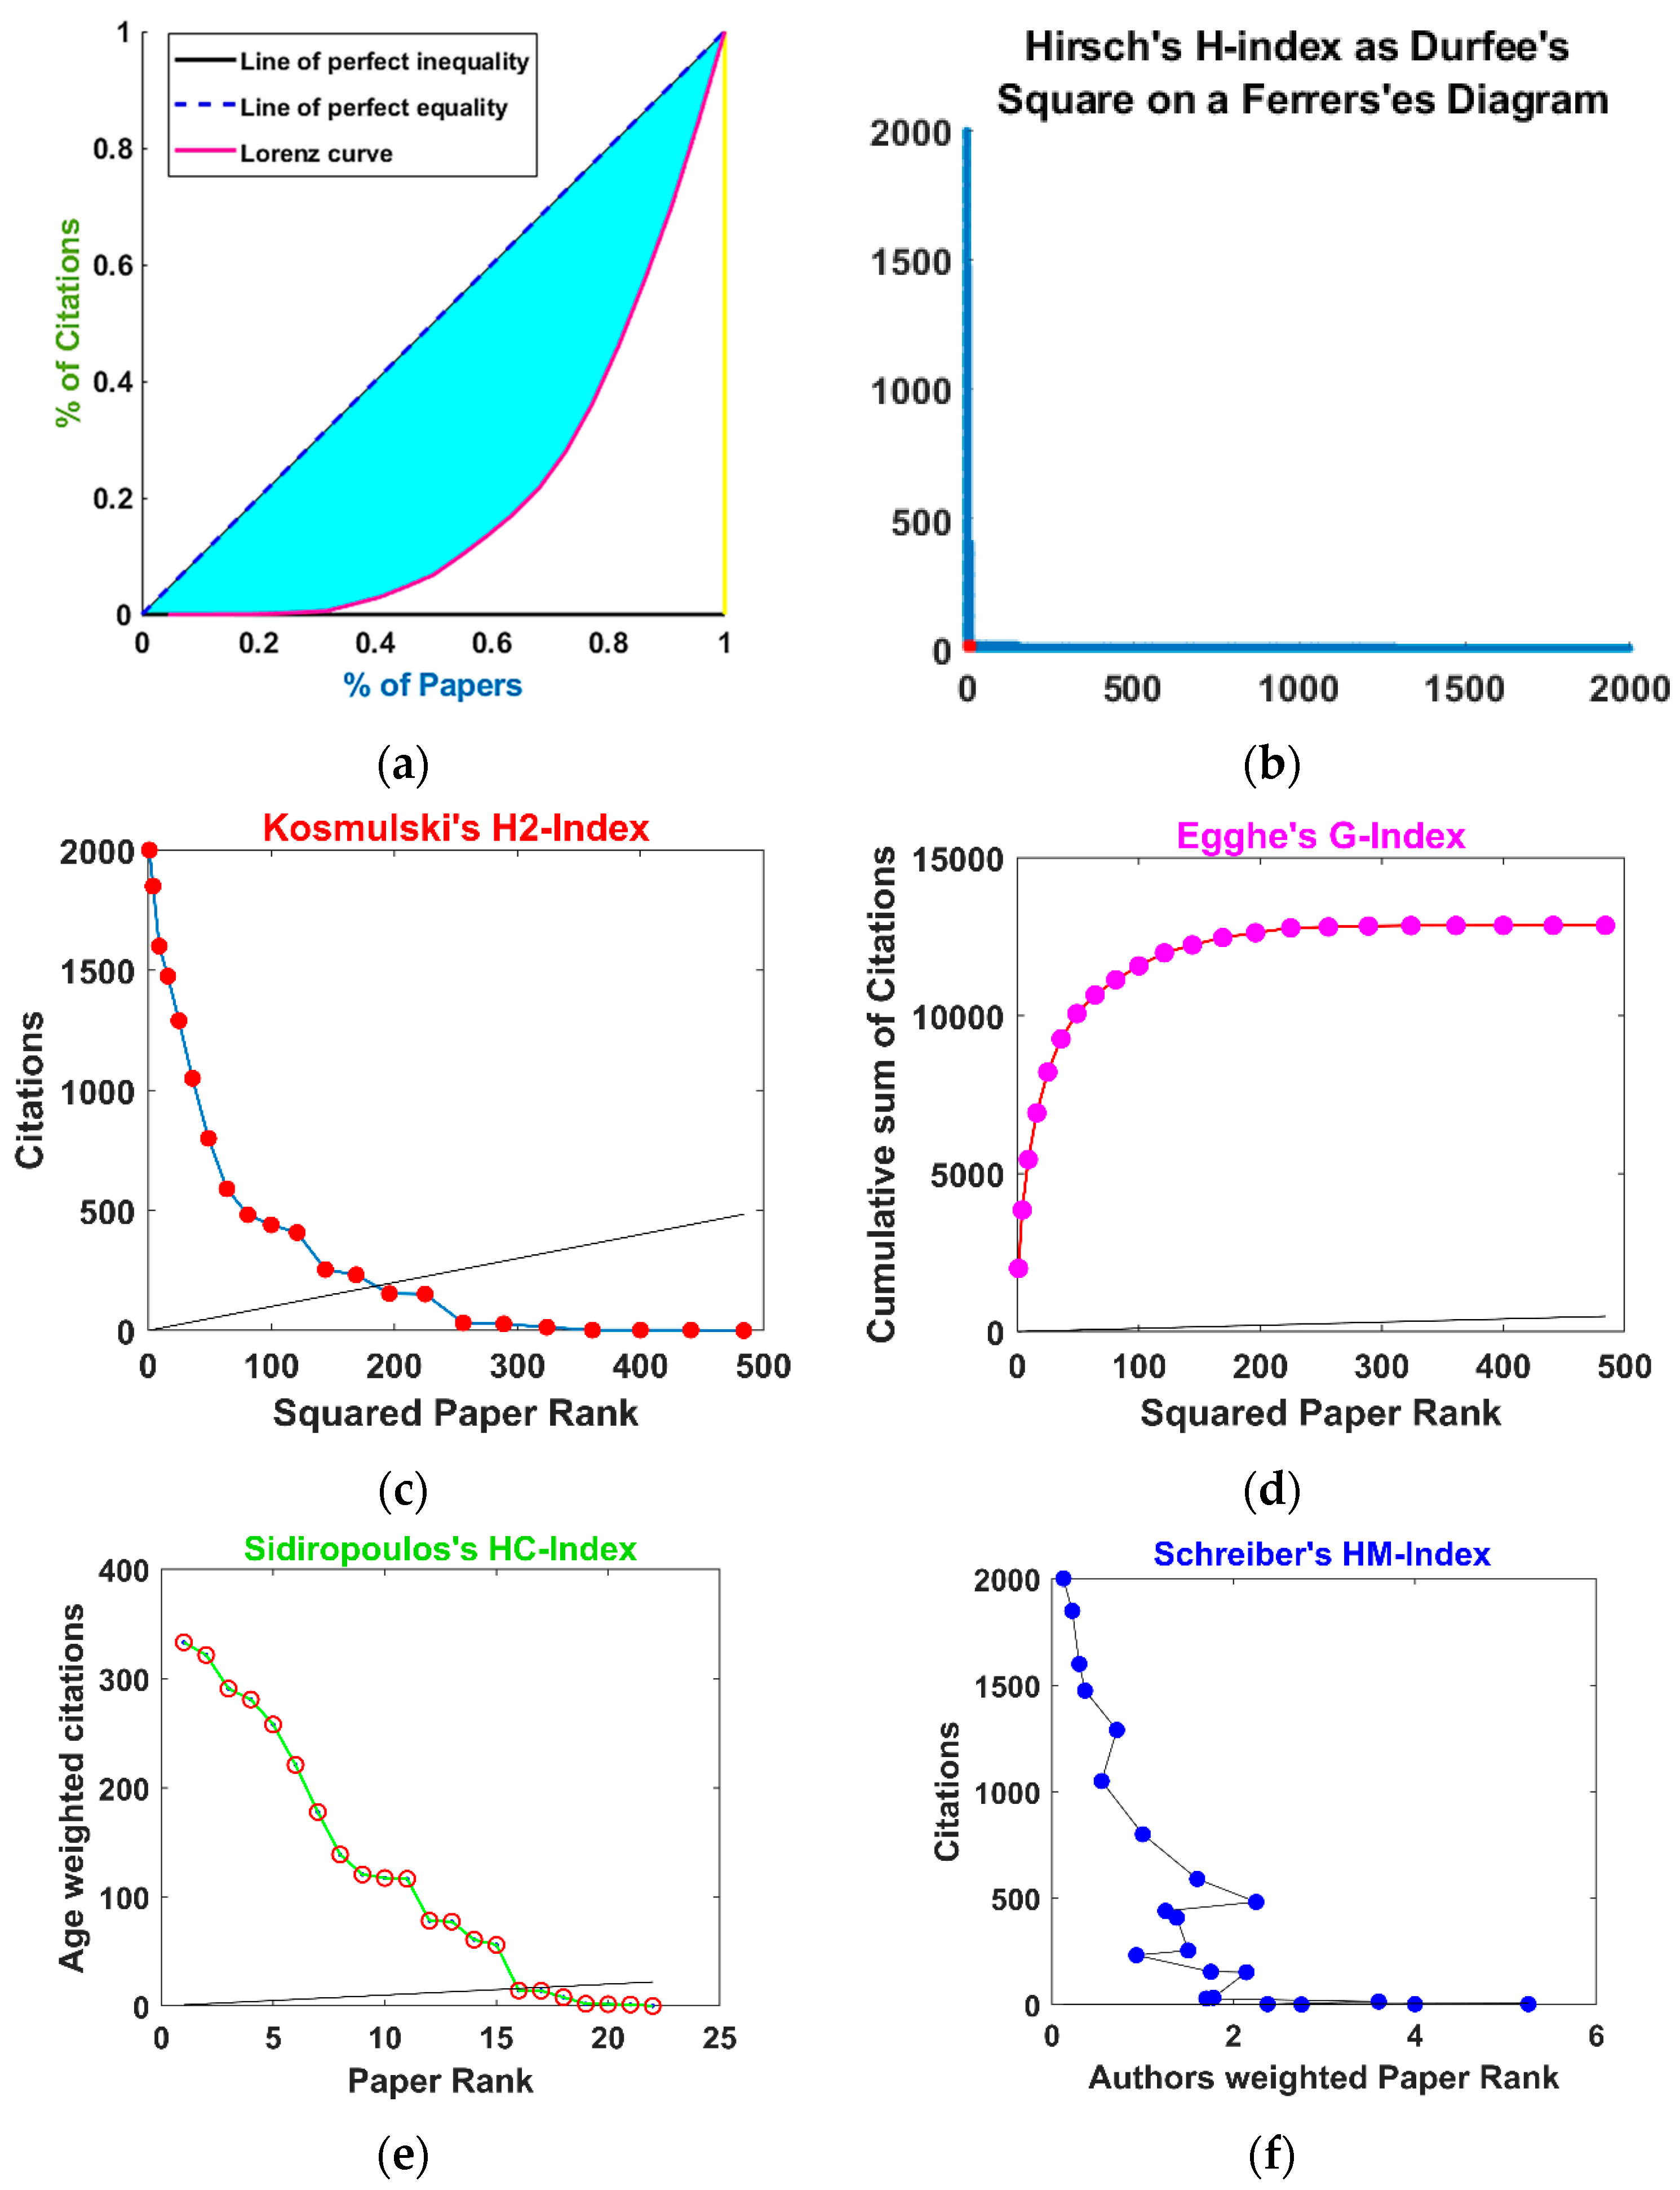
2. Bibliometric Analysis of IAQ and Indoor Epidemiology Correlation

For this analysis, 10,000+ articles from the past 50 years were selected from the Web of Science (WoS), Google Scholar, SCOPUS, CrossRef, and Dimensions research databases. The bibliometric analysis was performed in MATLAB using six statistical indices: (a) Lorenz Curve of Citations; (b) Hirch’s H-Index; (c) Kosmulski’s H2-Index; (d) Harzing’s Hl-Norm-Index; (e) Sidoropolous’s HC-Index; and (f) Schrieber’s HM-index. The biblio-statistical parameter settings are presented in Table 2 below.
The BibTex files for each search were segregated as a single file from all four databases and that resulted in 8 unique files from four unique databases and 32 files in total, with 38,019 articles. The repeated articles were filtered using BibTex Script processor and the resulting archive contained 18,971 articles. The maximum number of citations selected was 2000 and above, with the minimum as 5 citations. Figure 3 presents a detailed summary.
These indices resolved the 482-article pool for this study, of which 152 articles are referred to in this work that define respiratory disease-focused indoor air quality assessments, sensors, and calibration practices based on Figure 2’s workflow.

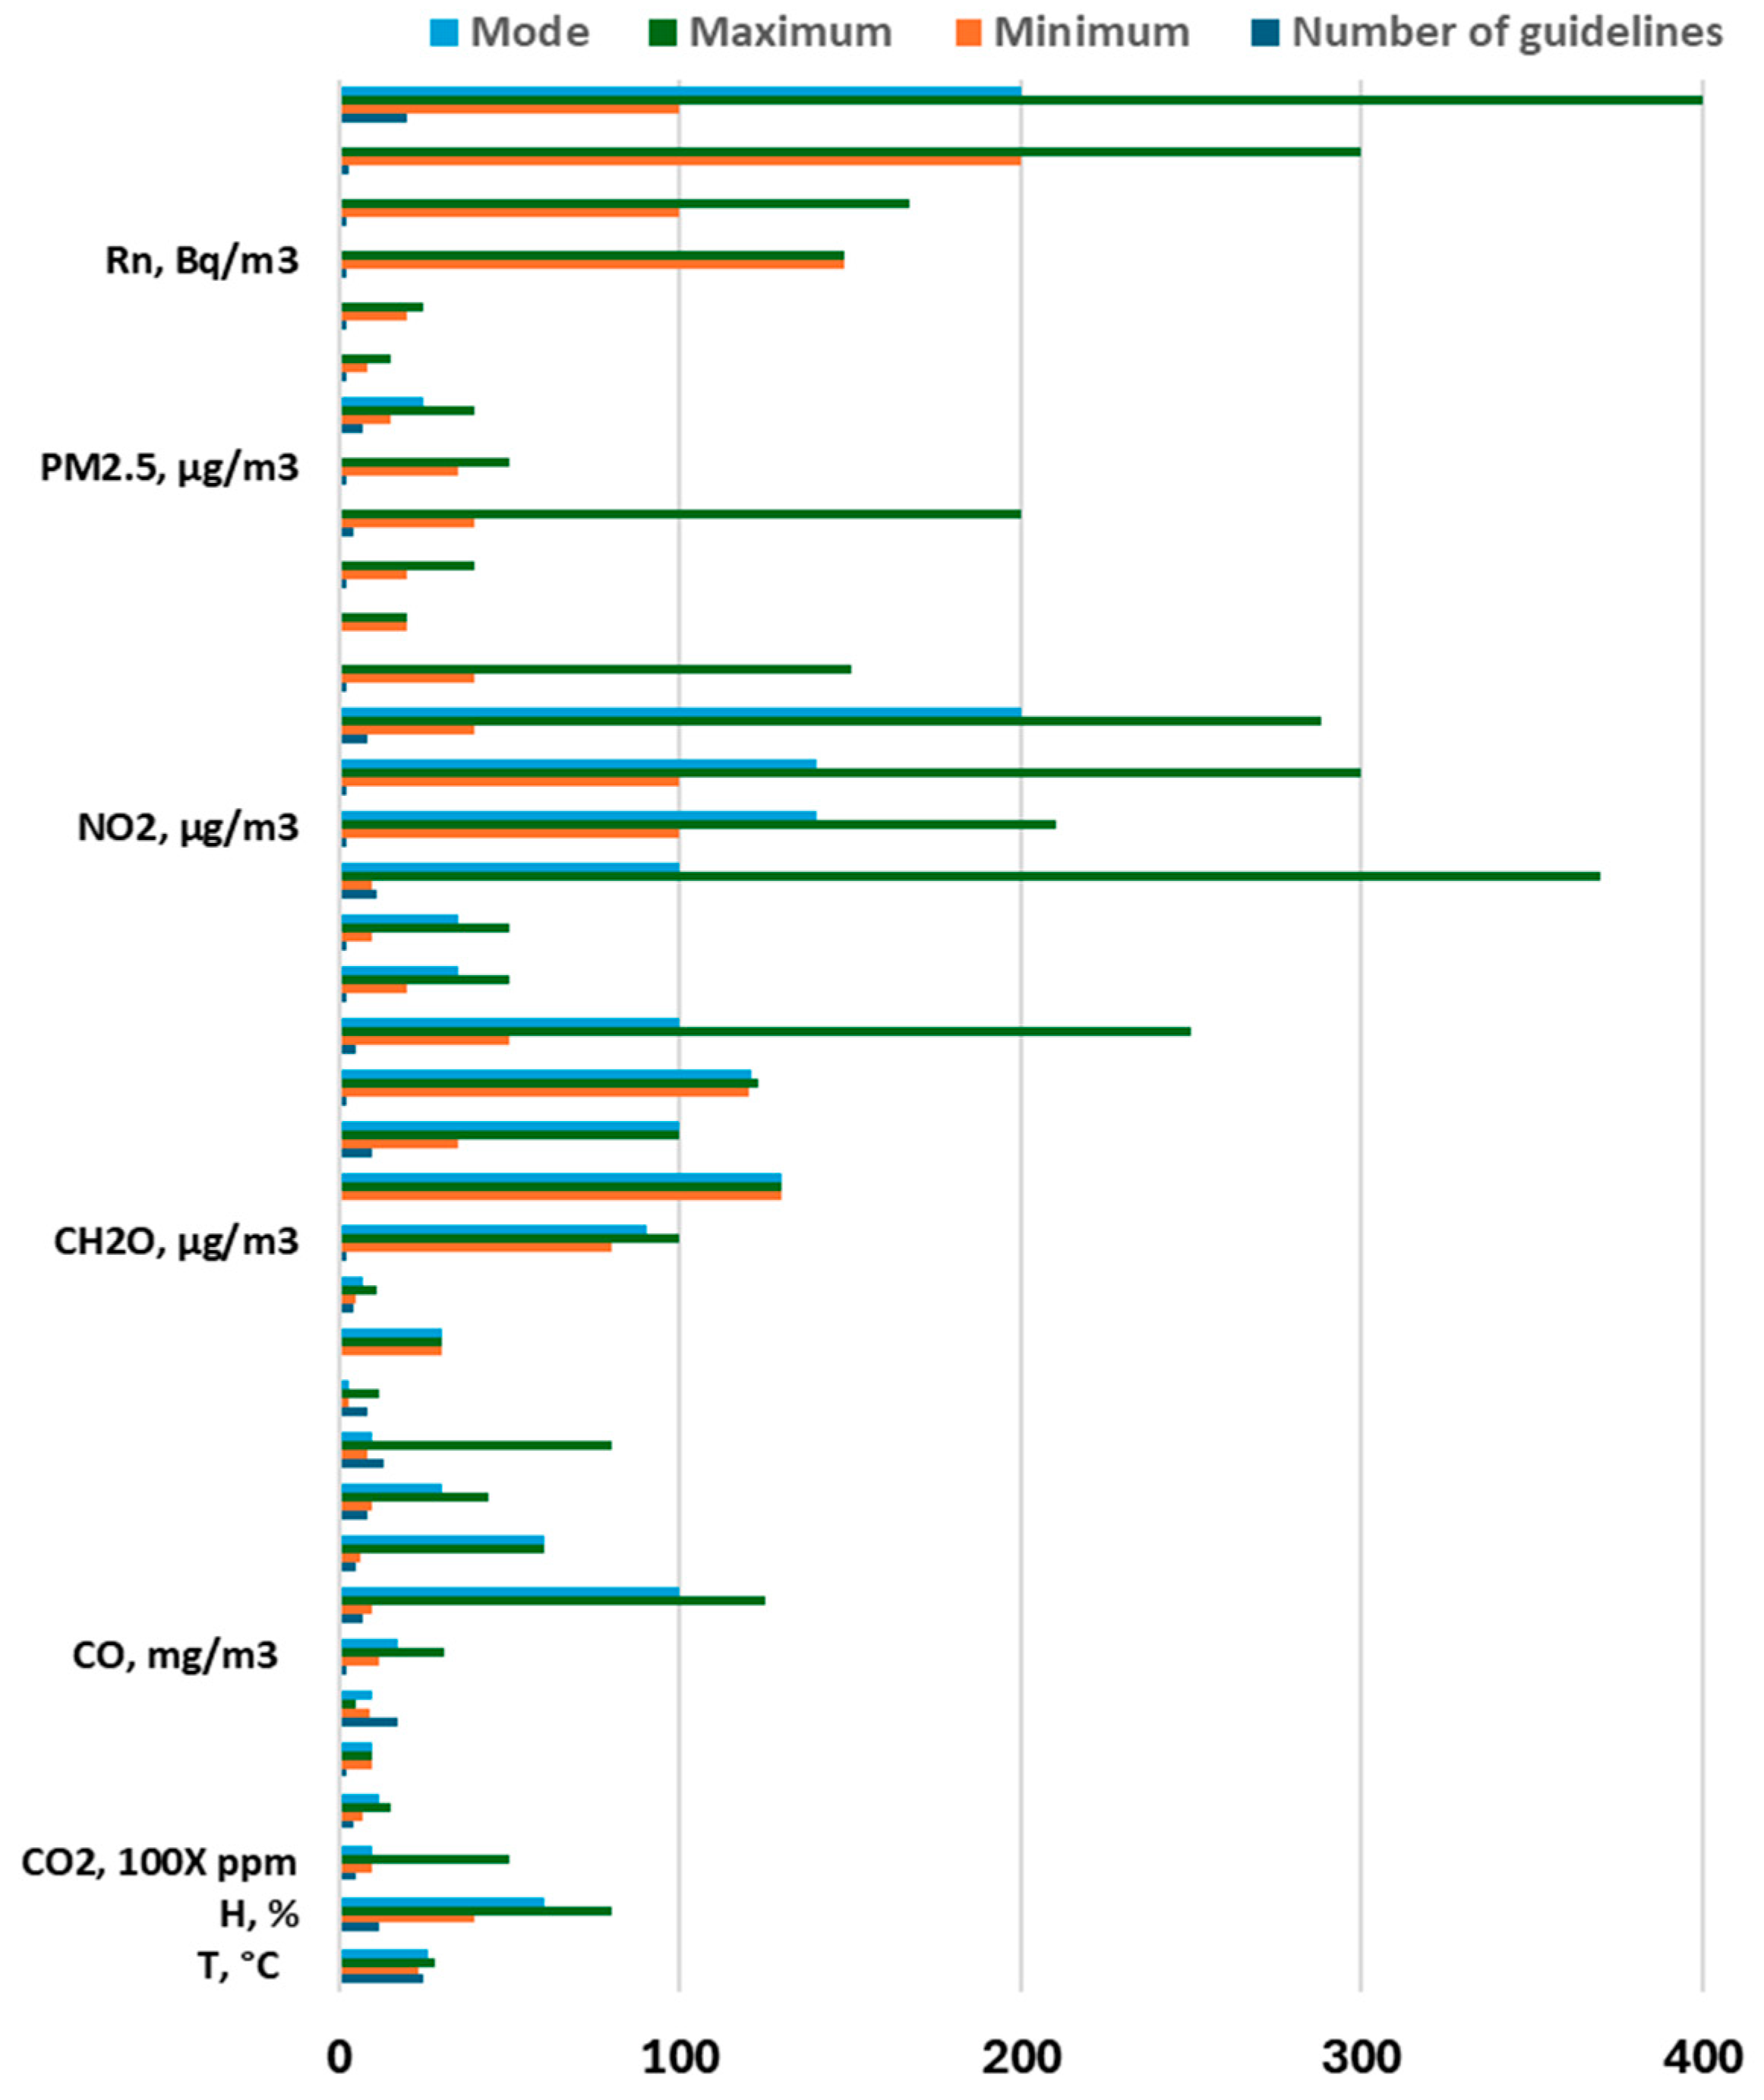
3. Indoor Air Quality Assessment for Indoor Epidemiology

In light of the indoor epidemiological guidance documented by the core environmental protection agencies, the WHO, NIH, CDC, US-EPA, EEA, and UNEP, air quality terminology refers to the entire legislative body of knowledge that involves analysis, methods, and criteria based on air quality [15,16,17,18]. The real-time AQA information from AQ sensors is used for environmental health and public safety. The major real-time methods used in this context are as follows:
  • Indoor air pollutant exposure limits;
  • Air Quality Standards;
  • Air quality mapping (AQMap);
  • Air Quality Management Plan (AQMP).
Each phase has its own clear and precise significance and contribution to the next phase. AQA and ACR involve the estimation of bio-tolerable gas thresholds [19,20] such as hazardous gas magnitudes and pollutant ratios in atmospheric volume; geospatial AQA to orchestrate regional AQM [21,22,23]; and the design of a model of regional air volume with effective and contributory variables to provide a mitigation plan [24].

3.1. Indoor Air Pollutant Exposure Limits

A very recent work by Sani et al. [25] based on the ISIAQ STC34 database covers all major global institutional guidelines (WHO IAQ 2010, US EPA, ASHRAE, etc.). Summing up the NIH, CEN Indoor Air Quality Standards, and Standards for IAQ GB/T 18883-2022, a comprehensive summary based on four parameters from the mentioned guidelines is presented below in Figure 4, also including indoor temperature and humidity limits.
In Figure 4, the CO2 levels are at 100X to fit to the ranges of the chart (i.e., maximum = 50 means 5000 ppm and minimum = 10 means 1000 ppm) for better readability. Benzene is also mentioned in some standards but as a weak candidate. Indoor atmospheric chemistry is becoming more complex day by day, and additional pollutants like asbestos, lead, and PM1.0 need to be included in new IAQ standards globally, especially considering the pandemic strains.

3.2. Indoor Air Quality Standards

A set of 31 global standards for CO2, NO2, CH2O, CO, SO2, PM2.5, PM10, O3, and TVOCs was reviewed in the work [26] by Sabah et al. that covered Australia (NHMRC, National Occupational Health and Safety Commission), Belgium (AIVC), Canada (Health Canada), China (AQSIQ, SEPA), Hong Kong (HKEPD, HKIAQO, HKSAR), Denmark (DSIC), Europe (EC), Finland (iSIAQ), Germany (DFG/MAK), Japan (MHLW), Kuwait (Kuwait EPA), Korea (KEITI), Malaysia (DOSH), Singapore (SIAQG, Institute of Environmental Epidemiology), and the US (ACGIH, ASHRAE, IDPH, OSHA, OEHHA, TDH, NIOS, U.S. EPA), as well as global coverage (WHO). AQI refers to a real-time structured chart with a bio-tolerable threshold of specific pollutants and bio-hazardous gases recommended by the EPA in the area under a specified border agency [19,20,21,22,23,24,25,26,27]. In a work [28] by Guanqiong Wei et al., 26 IAQ-relevant worldwide building standards and certifications were reviewed and classified into three levels (basic, green, health). The standards covered country-wise were China’s (Hygienic standard series (GB/T series-1995-2001) Indoor Air Quality Standard (GB/T 18883-2002), Standard for Indoor Environmental Pollution Control of Civil Building Engineering (GB 50325-2020), Assessment Standard for Green Building (GB/T 50378-2019), Assessment Standard for Healthy Building (T/ASC 02-2016), and Assessment Standard for Healthy Building (T/ASC 02-2021); the US’s Ventilation for Acceptable Indoor Air Quality (ANSI/ASHRAE Standard 62.1-2016), Ventilation for Acceptable Indoor Air Quality (ANSI/ASHRAE Standard 62.1-2019), Leadership in Energy and Environmental Design (LEED v4-2019), WELL Building Standard v2.2022.Q2, and the Building Research Establishment Environmental Assessment Method (BREEAM); France (Haute Qualité Environnementale (HQE)-2016); Germany (Deutsche Gesellschaft für Nachhaltiges Bauen (DGNB)-2020); Japan (Guide from MHLW-2000, Comprehensive Assessment System for Built Environment Efficiency (CASBEE)-2014); and the globe (Air quality guidelines global update 2005 (AQG 2005), WHO global air quality guidelines (AQG 2021), and WHO guidelines for indoor air quality: selected pollutants 2010). This work reviewed organic, non-organic, and particulate pollutants separately and concluded that Chinese standards were progressively stricter from the basic to health levels. A major gap of gradation or sorting the standards based on their strictness was found.
After a detailed study and review of the mentioned indoor AQ standards and building standards and certifications, the following gaps were found:
  • IAQ sensors must have range tables, magnitude specifications, and IAQ standard- and building certification-focused sampling rates to cover the respiratory disease exposure thresholds and probabilities.
  • Indoor pollutants in IAQ standards are not enough to cover indoor respiratory diseases. The toxins, allergens, and poisonous VOC exo-metabolites must be also measured with a dispersion probability for pollen, spores, molds, etc.
Another multi-parametric AQI innovation in assessment is the environmental performance index (EPI) by the Yale Center for Environmental Law and Policy [29], which can impact the exposure concerns in indoor AQ standards.

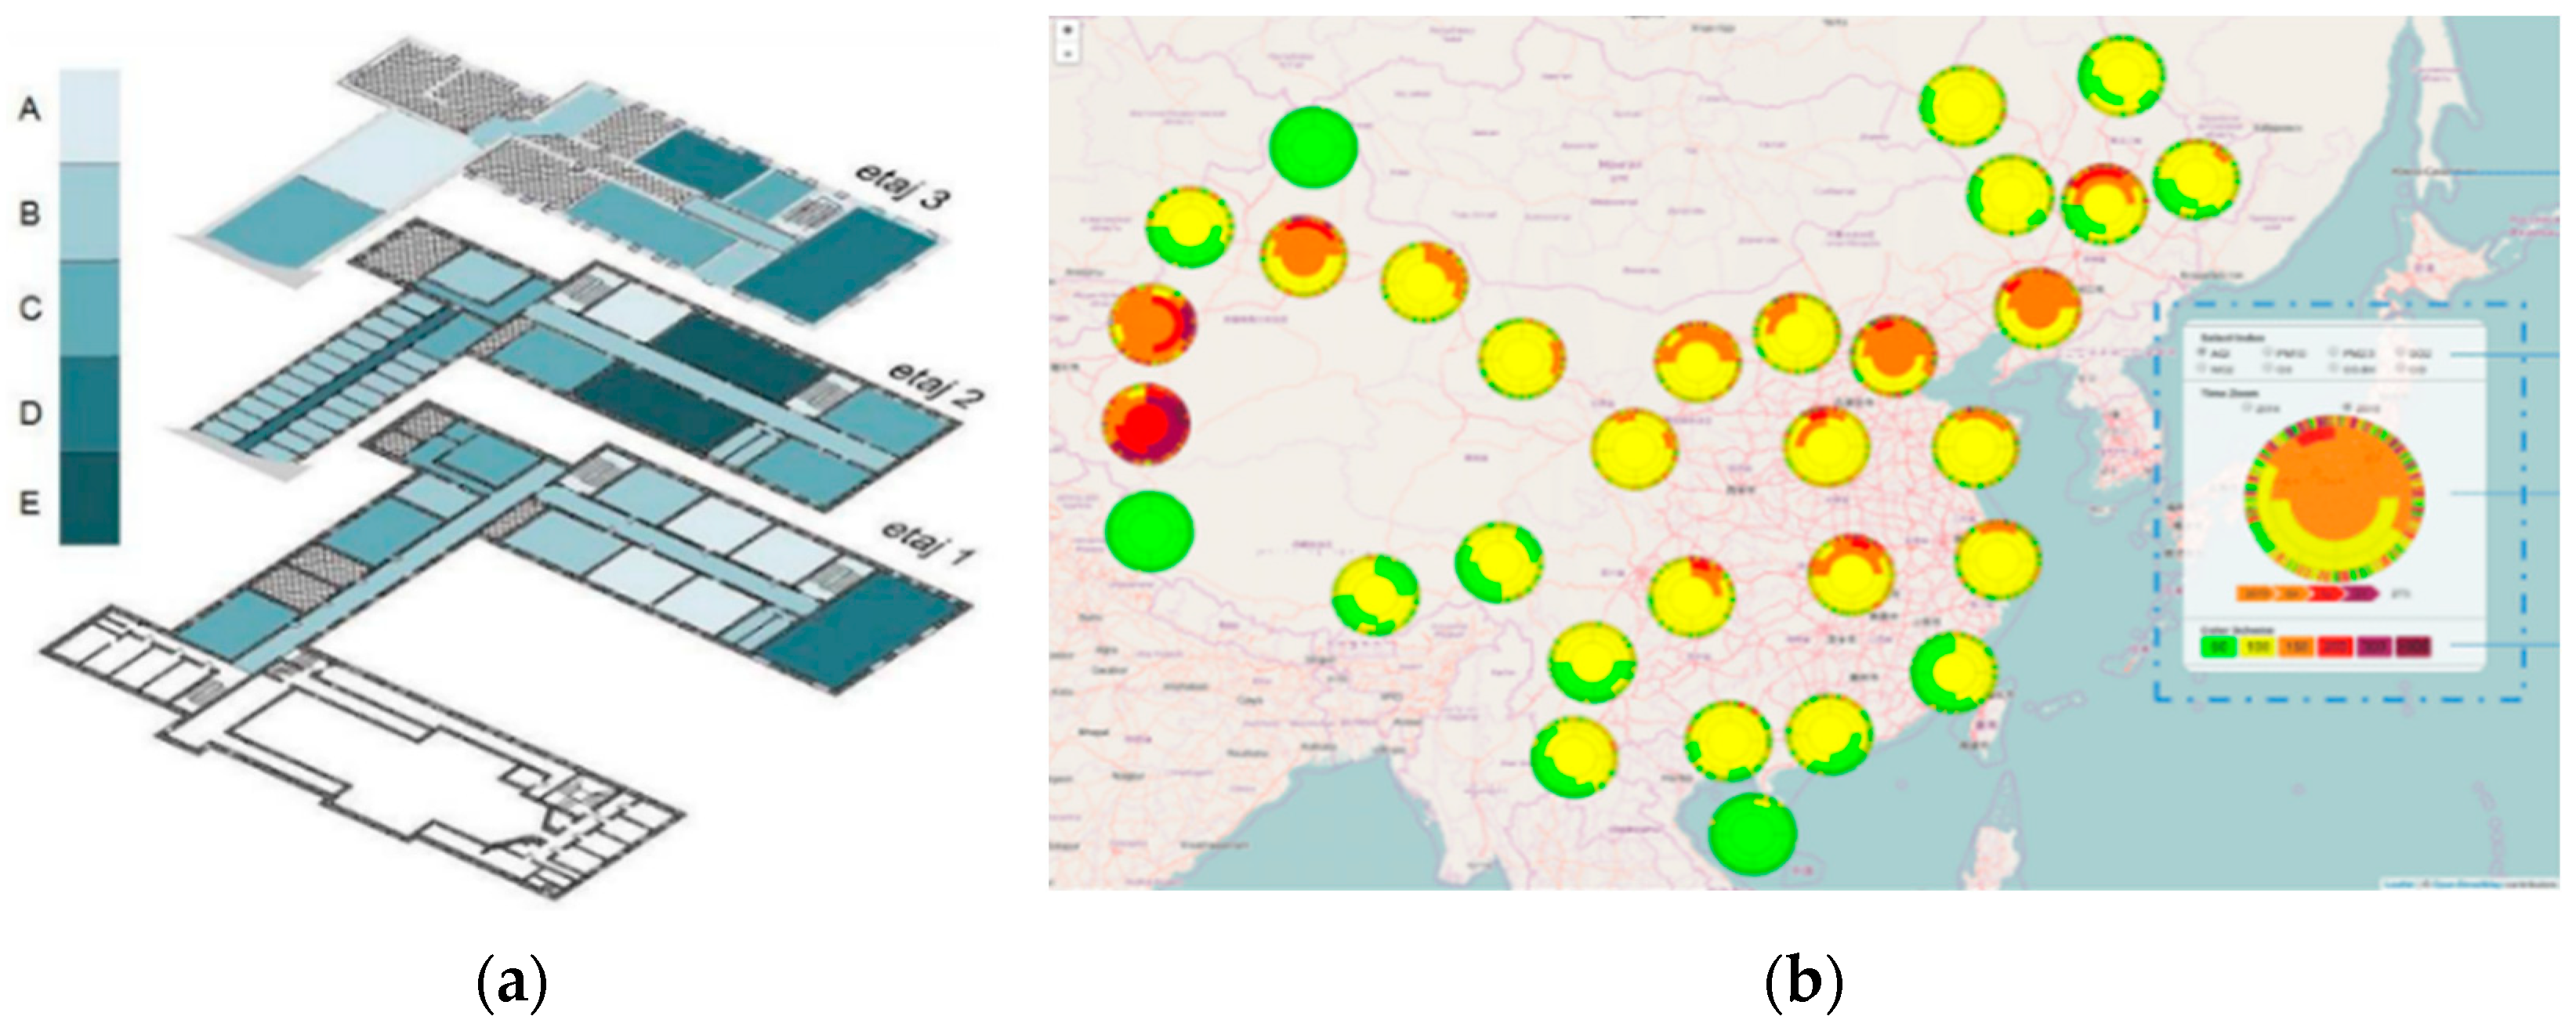
3.3. Air Quality Mapping (AQMap)

The geo-locations in the vicinity of AQ measurement using collective averaging and mean estimation procedures derive a real-time air quality map with an additional parameter: geographical positioning system (GPS) value [30,31]. The process of collection of all such points and orientating them geo-spatially is called AQMap [26,27,28,29,30,31,32]. There are two types of AQMap: (i) indoor air quality mapping (I-AQMap) and (ii) outdoor air quality mapping (O-AQMap) [33] (Figure 5).
Figure 5 shows that I-AQMap is building-wise and O-AQMap is region-wise. Different sets of gases and ratios of pollutants with different molecular sizes [34] use both approaches. The charting and graphing, as well as the typo-graphic presentation schemes available and their standardization process for AQMap based on their relative effectiveness, are mentioned in this work [35]. New studies must be introduced to fill the gaps of respiratory strain areas spatially. Additionally, extended research is needed that mathematically connects the indoor–ventilation–outdoor impact.

3.4. Air Quality Management Plan (AMQP)

The AQMP is based on the Brownian motion (Robert Brown), and the Brownian motion is defined as the random nature of particle dynamics in the air, presented in Figure 6 [36]. In the entire assessment of AQ, the most challenging and attention criteria is AQMP, especially air quality modeling [37,38]. Key work was accomplished by Dr. Gary Haq and Dr. Dieter Schwela in 2008 while modeling the toughest regions in Asia [39,40].
Relating to the IAQ sections covered in the Clean Air Act Advisory Committee Meeting [41], Claudia et al. presented a very appreciable work on virtual pollution modeling using Bayesian network theory [42]. The AQMP (2012) presented by Dr. Bjarne Sivertsen and Alena Bartonova holds a landmark value in regional-level AQMP [43]. The INDAIR model and clean energy focused on bounded value models for a clear interpretation of decision-making AQMP parameters [44]. Future works are needed to cover the respiratory disease set of challenges that were not covered in these works.

3.5. Impact of Outdoor Air Quality on Indoor Air Quality and Associated AQIs

Indoor AQI is governed by outdoor AQI, as ventilation and human activities keep the air exchange process intact. The housing and ventilation procedures in every region are governed by outdoor AQI [45,46] and presented in Table 3.
A recent review by Murtaza et al. [46] surveyed several factors that affect the transfer of pollutants from outdoors to the inside environment. This work covered both experimental and modeling investigations and critically assessed several studies looking into the inter-environment variability and transmission; the findings are summarized in Table 4.
The study [48] concluded that long-term exposure evaluations can be better understood through experimental observations, and short-term spatial and temporal pollution transmission can be better visualized using CFD models. The review found that there was a lack of clarity regarding the relationship between determinant changes and the effects they have on transmission.

4. Indoor Epidemiology-Focused Air Quality Gas Sensor (AQ-GS) Technologies

In recent epidemiological studies focusing on key respiratory diseases as per the WHO [1,15] (ischemic heart disease, stroke, pneumonia, lower respiratory infections (LRIs), chronic obstructive pulmonary disease (COPD), and lung cancer), five sensing technologies were found to be relevant in the non-invasive diagnosis of these diseases and are presented in Figure 7 [49,50].
There are five unique technologies in low-cost air quality gas sensors (AQGSs): (a) optical gas sensors (OGSs); (b) electrochemical gas sensors (ECSs); (c) capacitive gas sensors (CGSs); (d) calorimetric gas sensors (CMGSs); and (e) acoustic gas sensors (AGSs) [49,50,51,52,53,54,55,56,57,58,59,60,61,62,63,64,65,66,67,68,69,70,71,72,73,74,75,76,77,78,79,80,81,82,83]. Nevertheless, their architectural and working principles are explained in detail in the respective sections, but in future developments, OEMs should consider incorporating the sensing features that are useful for respiratory disease occurrence probabilities.

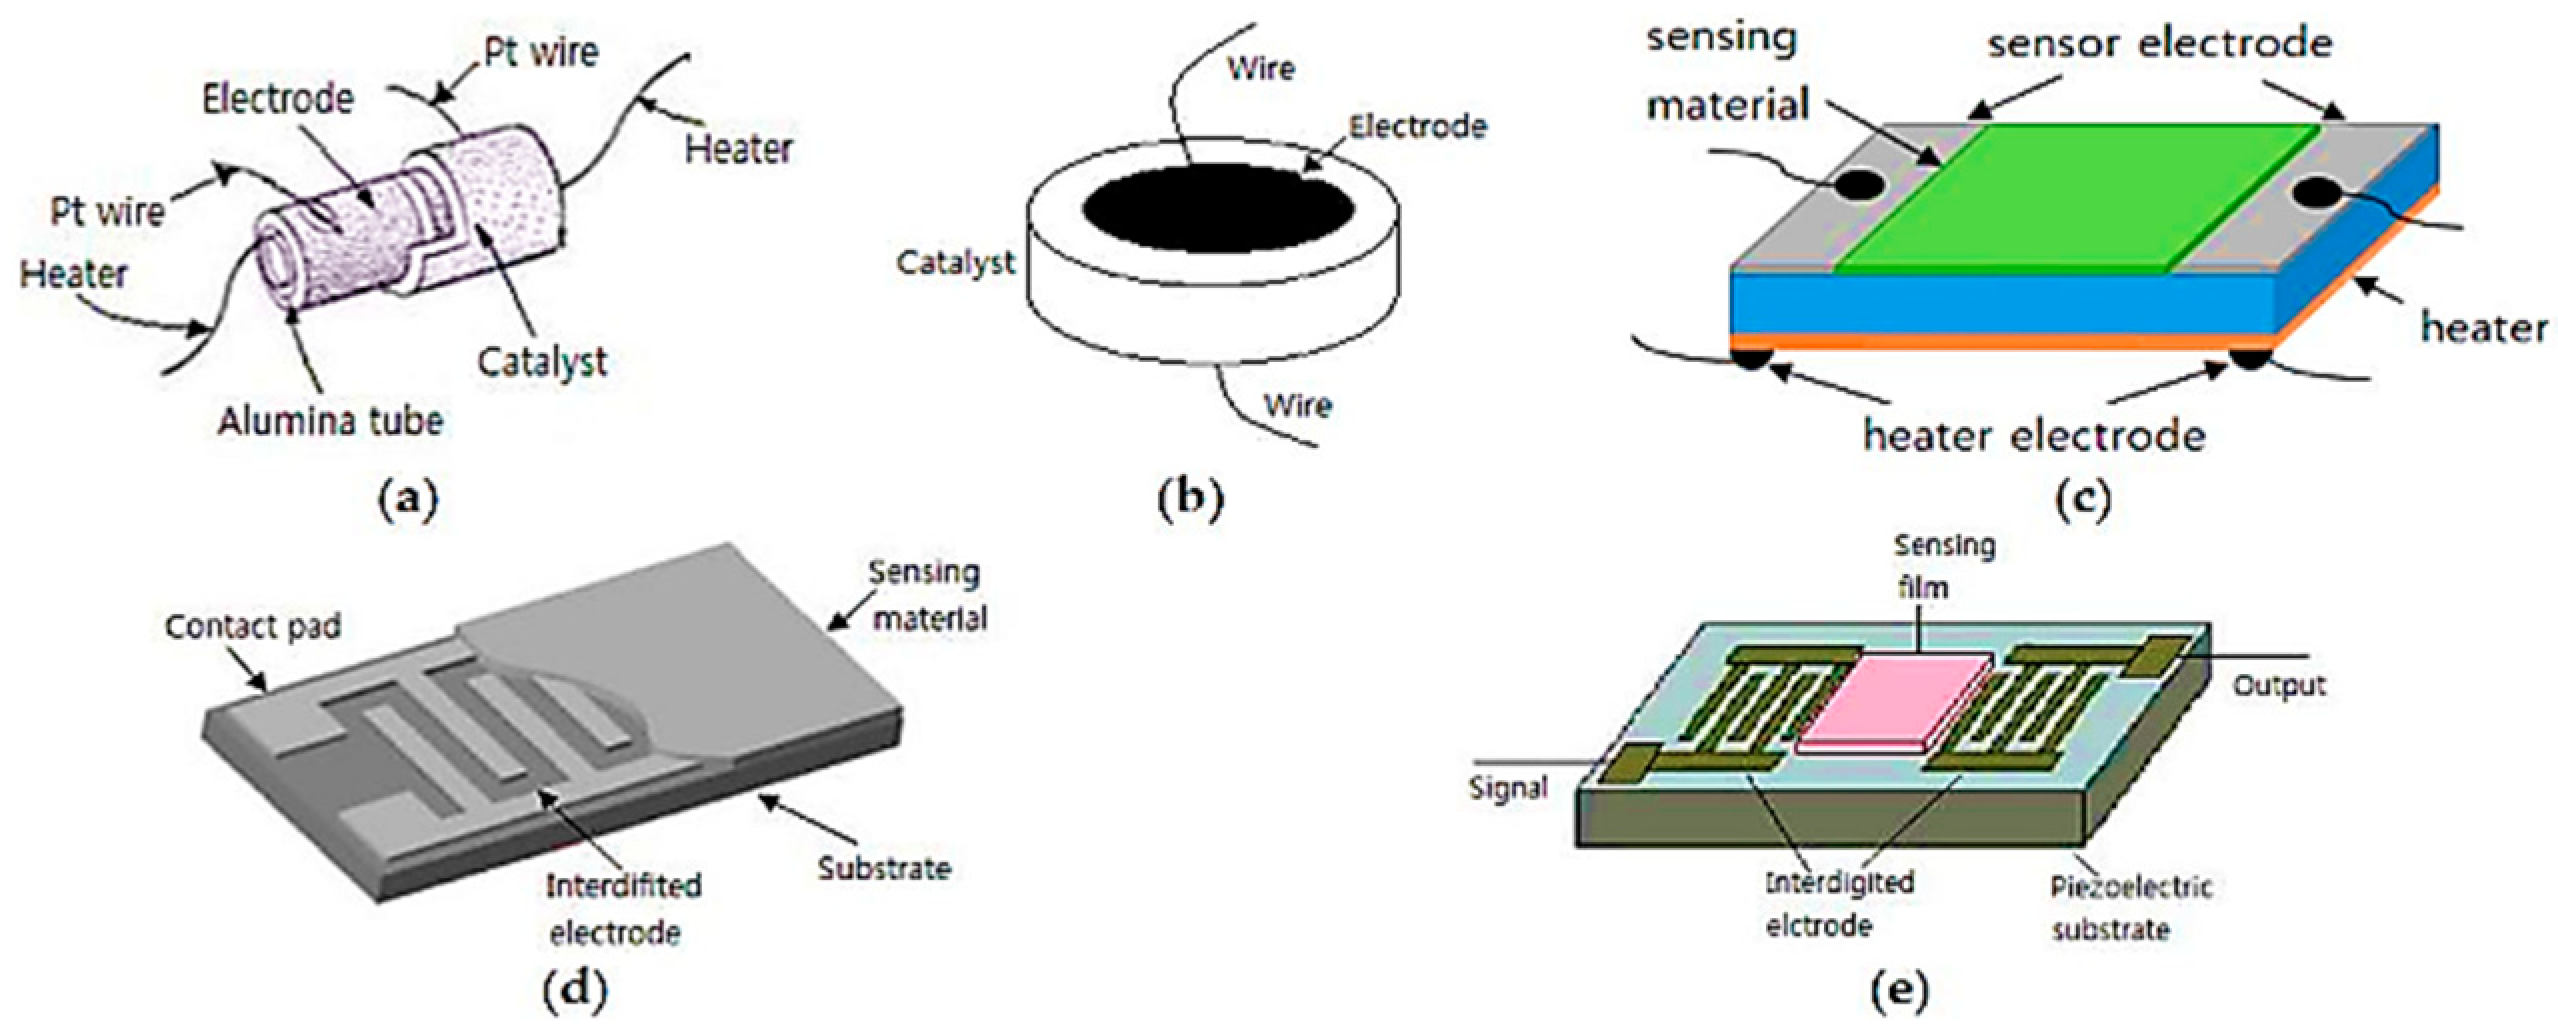
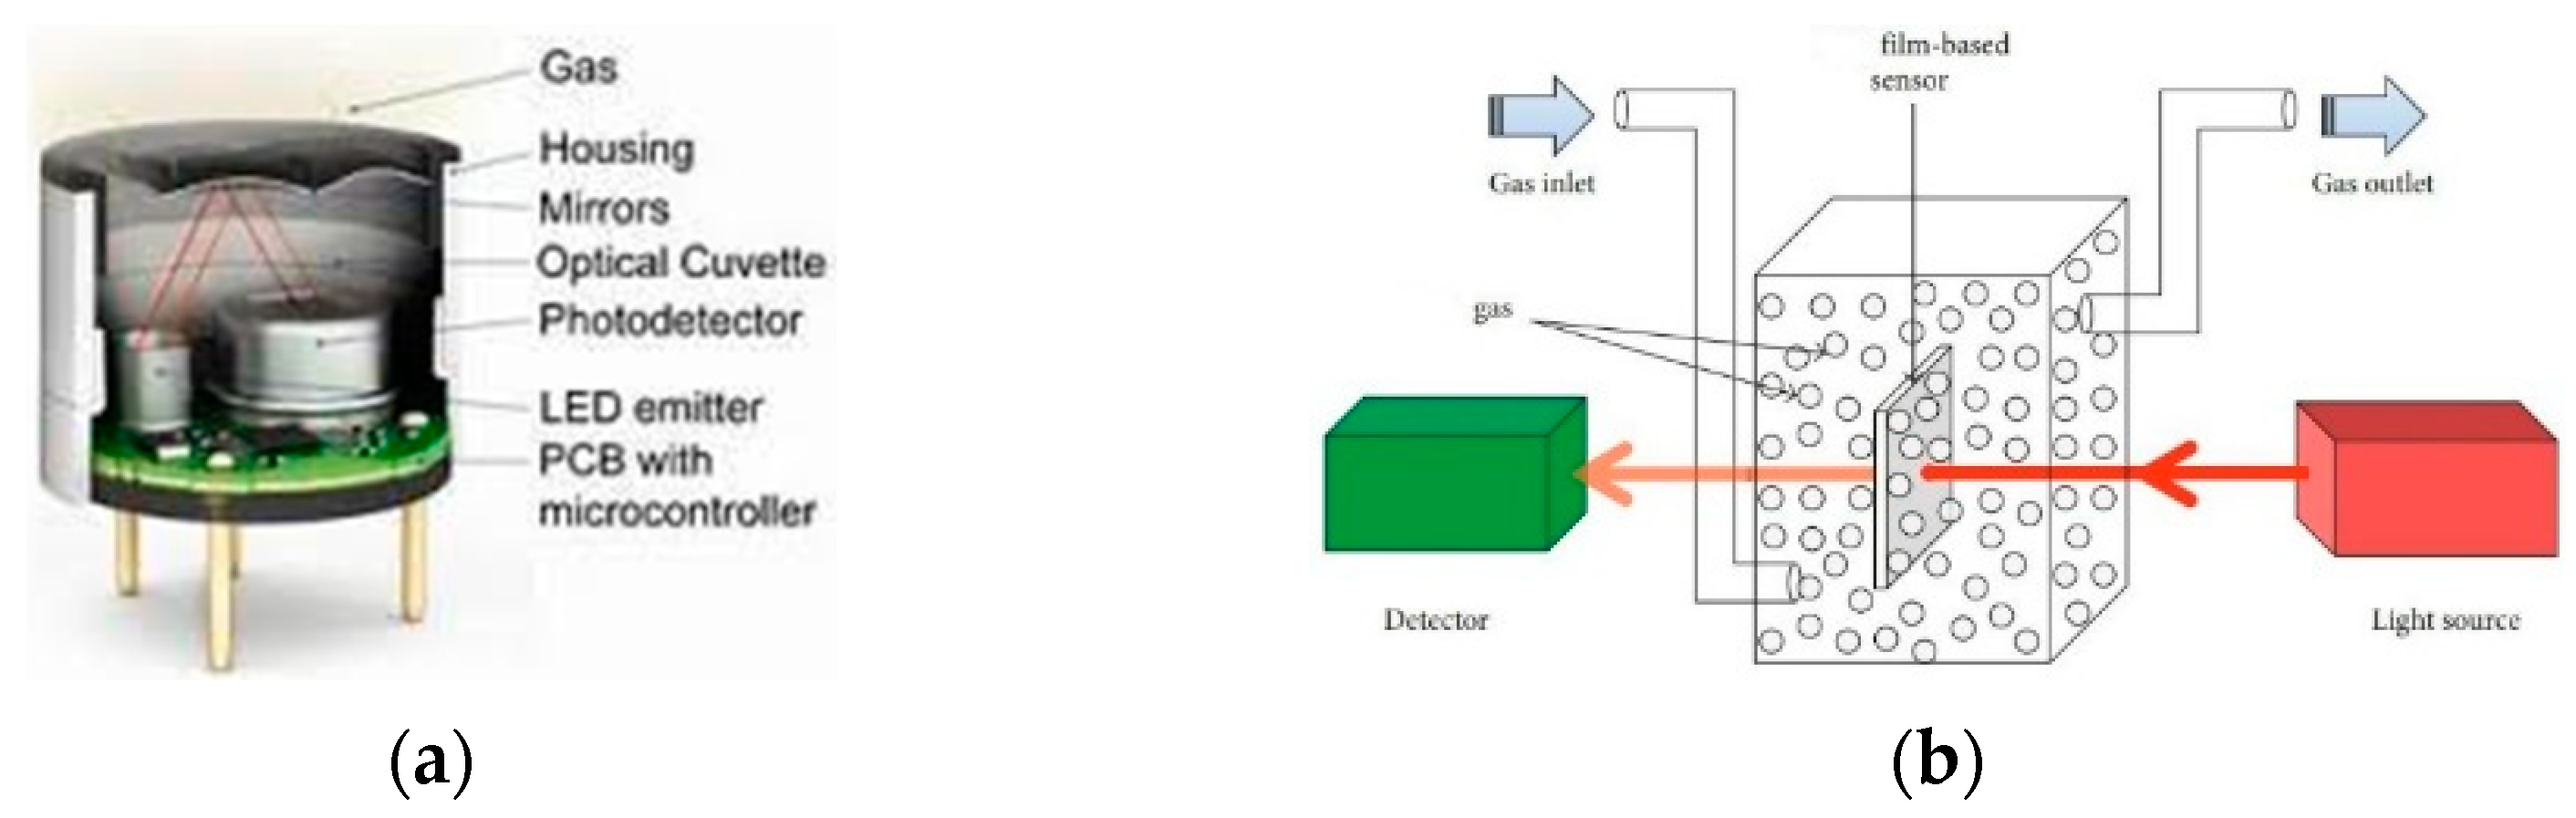
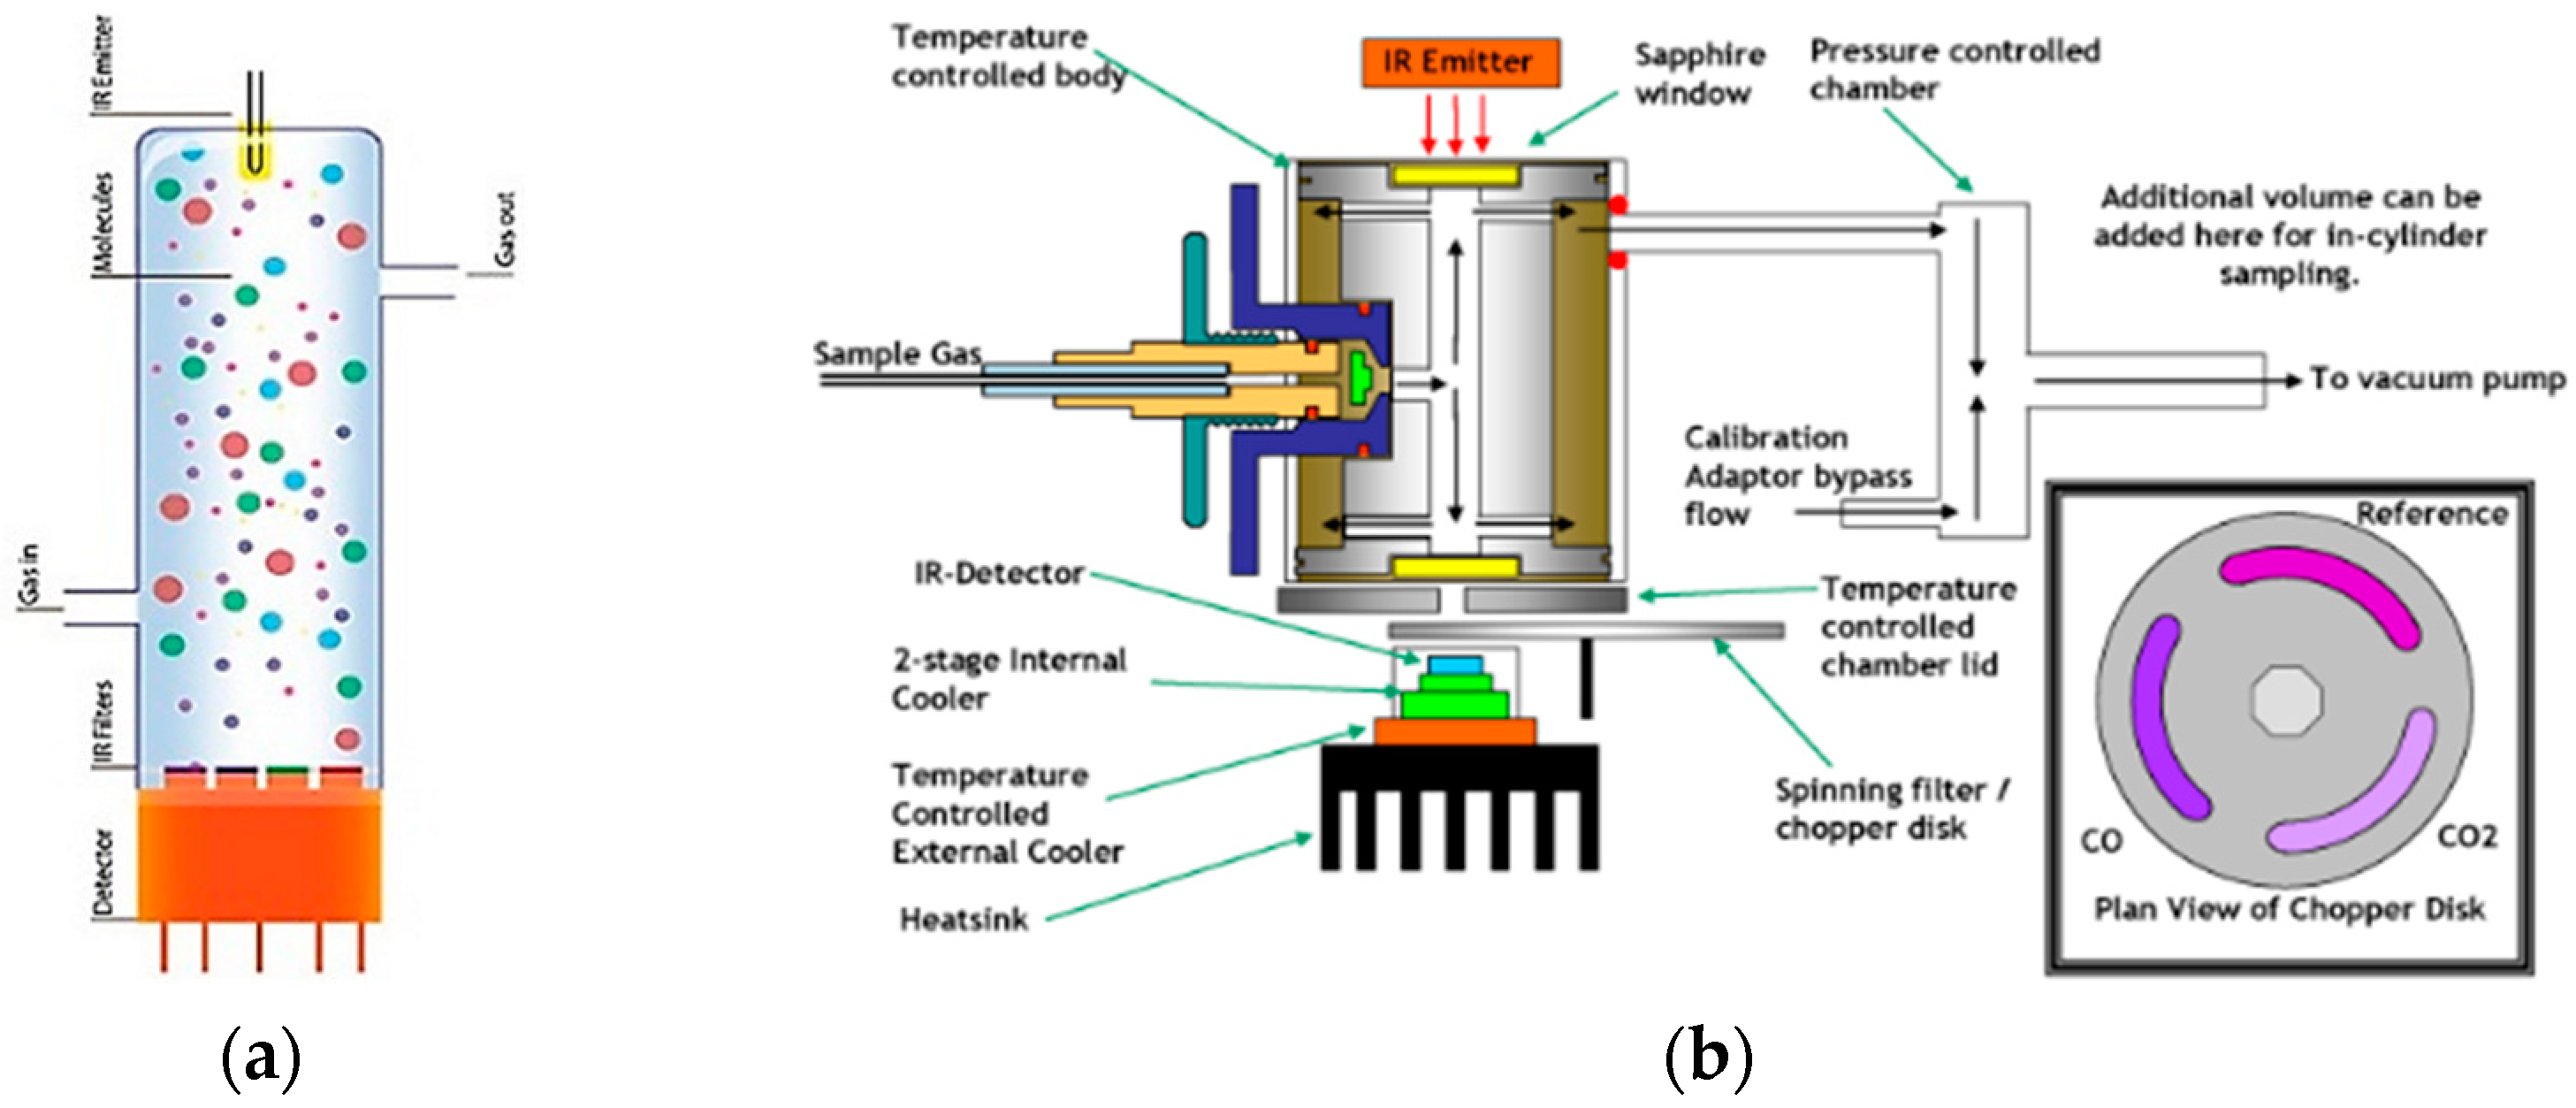
4.1. Optical Gas Sensors (OGSs)

In OGSs, the entire identical or isometric coupling of optical diodes (transmitter (TX) and receiver (RX)) is a combination of transmitting and receiving modes [50]. In this case, a variable dielectric, like the human body, is introduced as exhibited in Figure 8 [51,52,53,54].
In Figure 8, a light source transmits a light array through a file-based sensor that measures the impact of light on air particles and returns an analog voltage value for every unique gas which cycles through the micro-OGS chamber. The widely used OGS is a non-dispersive infra-red (NDIR) gas sensor that has a swift response and long lifetime, as this type does not use any consumables. The NDIR-GS is presented in Figure 9 below [55,56].
In the NDIR-GS presented in Figure 9, the same principle is used, i.e., light emission and reservation; the only difference is the IR nature of light that can sense up to 0.1 μm particles and needs air flow regulation by smart PWM fans for accuracy.

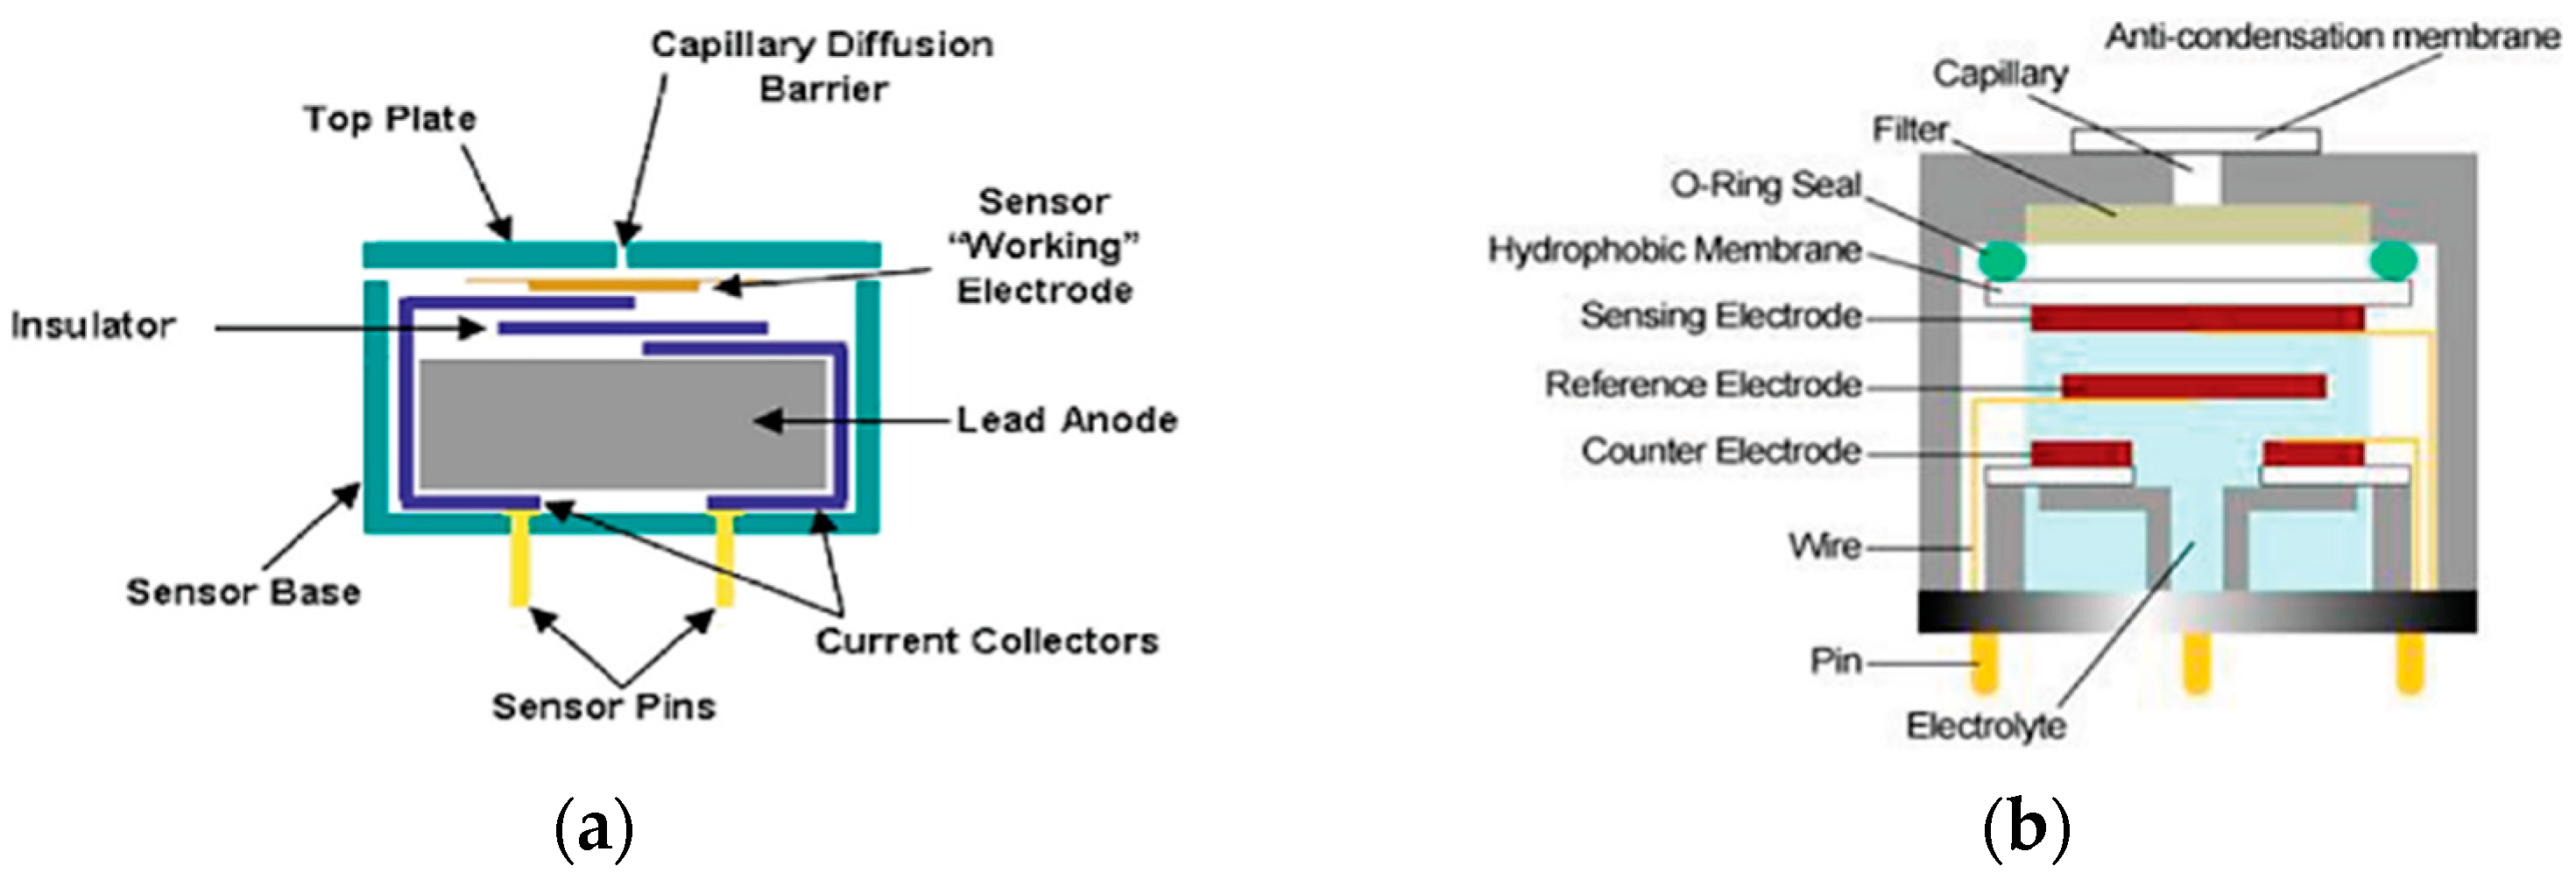
4.2. Electrochemical Gas Sensors (ECSs)

In ECSs, the receiver mode can possibly be made by making the working electrode a sensing element and the counter electrode an extension of the transmitting electrode to pick transmitted electrons through the electrolyte [52,53,54]. In this case, the working electrode acts as a multi-channel receiver for multi-variable sensing, as exhibited in Figure 10 below [57].
The ECS-GS presented in Figure 10 is a generic ECS architecture used by leading vendors in the gas sensor industry, i.e., FIGARO, SGX, and Honeywell. The faster response rates and solid-state architectures presented in [58,59] needed fabrication tendering to assess their mass production feasibility over existing technologies.

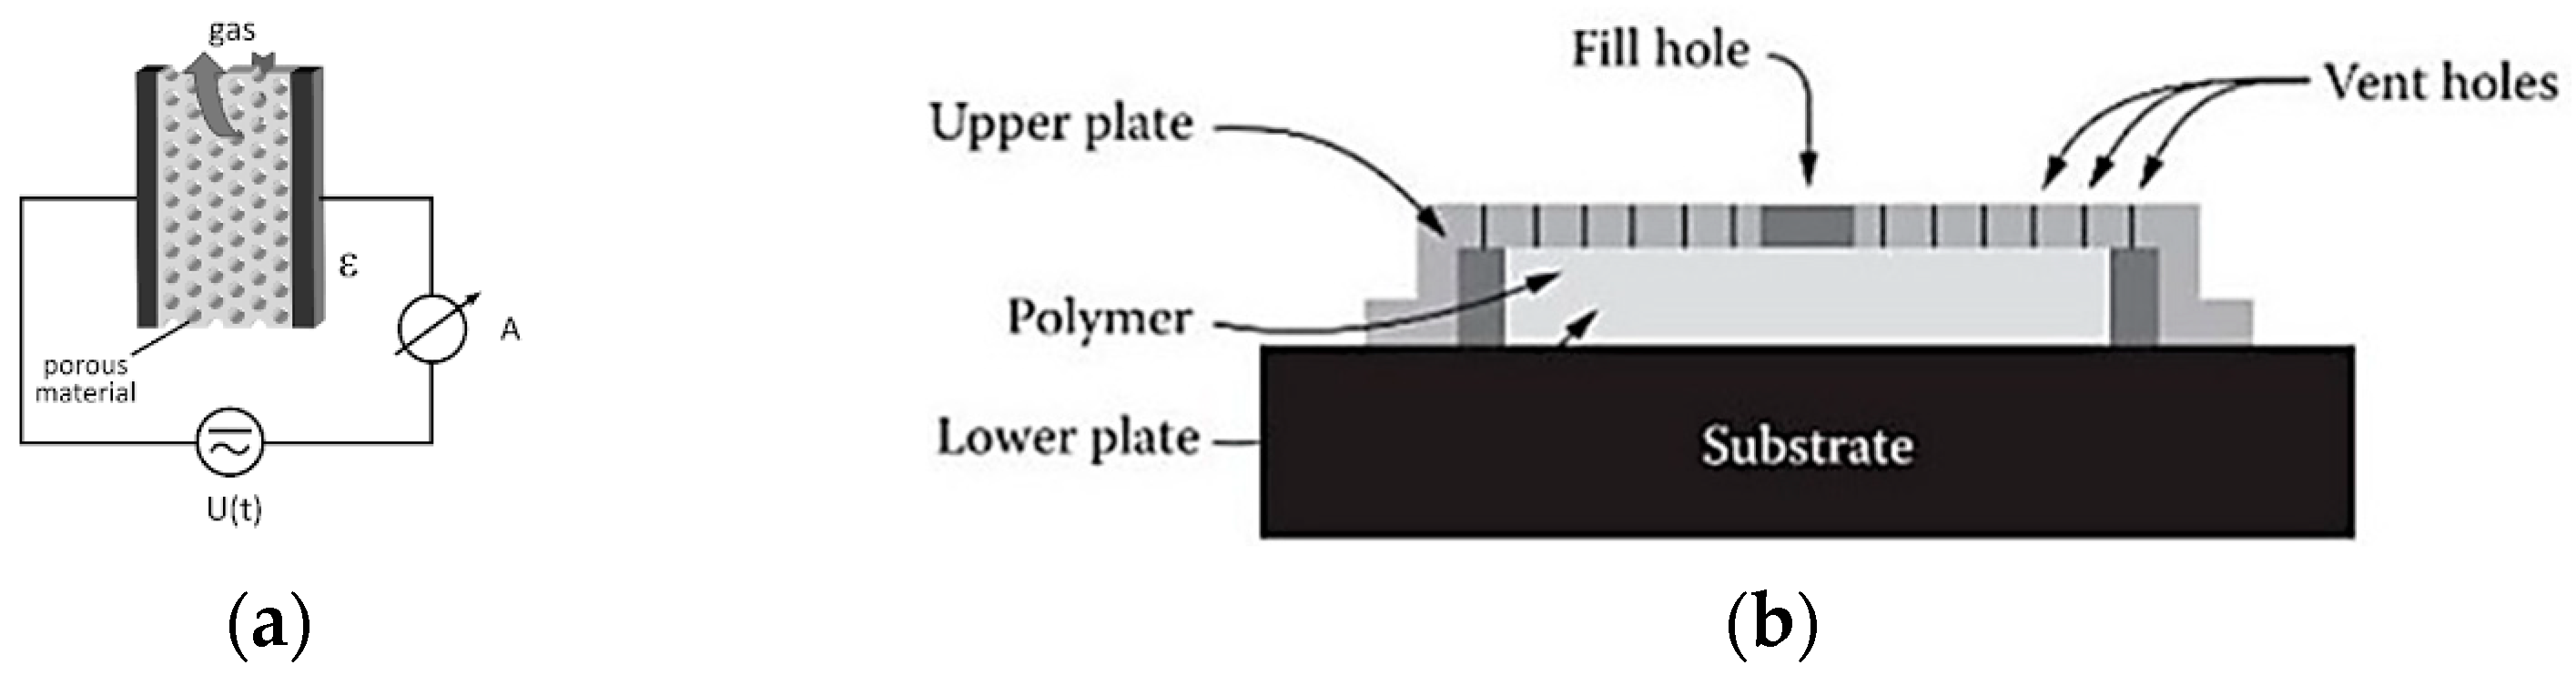
4.3. Capacitive Gas Sensors (CGSs)

In CGSs, the transmitter mode is made possible by making the sensor body an extension of the transmit electrode (or capacitor) to improvise the nearest transmitter-created electric fields [60,61]. In this case, a gap volume acts as a multi-impedance transmitter for multi-variable sensing receivers, as presented in Figure 11a below [62].
In Figure 11b, it is shown that the CGS is merely a capacitor in an isolated circuit where the electric flux between the plates is derived from the volume for gas measurement. The fill hole allows the air to enter the sensing zone and cycle back to the atmosphere through vents, and from a respiratory disease perspective, it should have a retention time for accurate pollutant chemistry assessment.

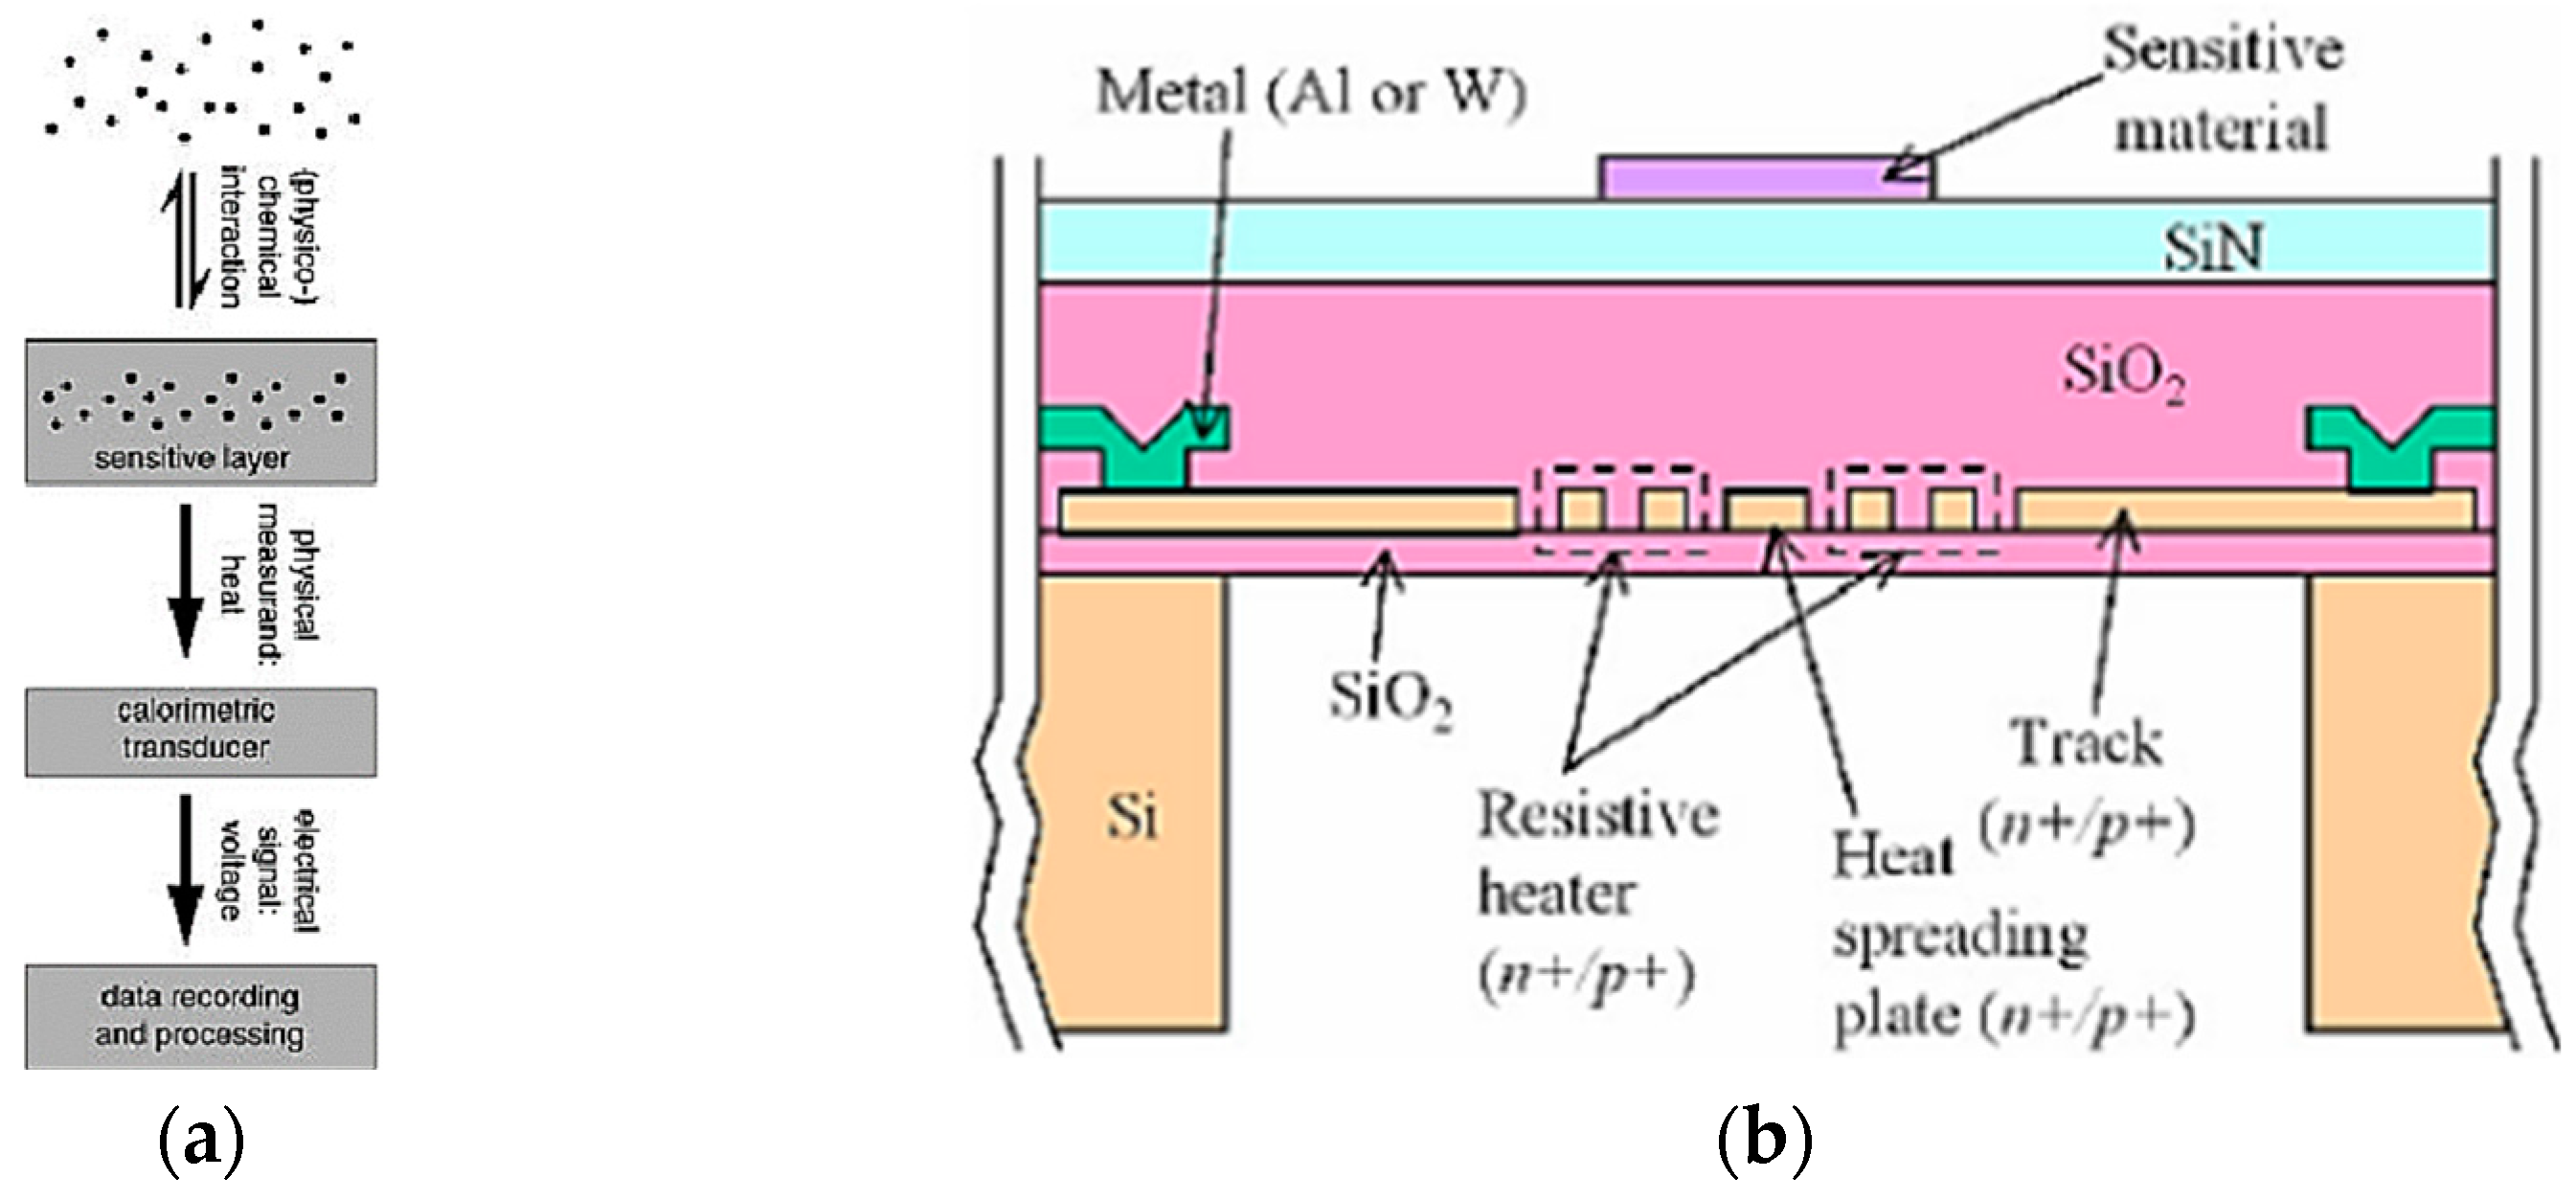
4.4. Low-Cost Calorimetric Gas Sensors (CMGSs)

In CMGSs, a displacement current flows through the body to the ground through a catalyst-loaded electrode gap [63]. A single electrode is utilized as a transmitter and receiver of flux as exhibited in Figure 12 below [63,64,65].
The finite element method (FEM) used by Mohamed Serry et al. [64] was a successful demonstration of a unique signal at different heater temperatures, which could be increased more than 23 times by increasing the heater voltage from 3.5 to 5.0 V. Also, selectivity for acetone vapors needed respiratory disease-mapped readouts in [66].

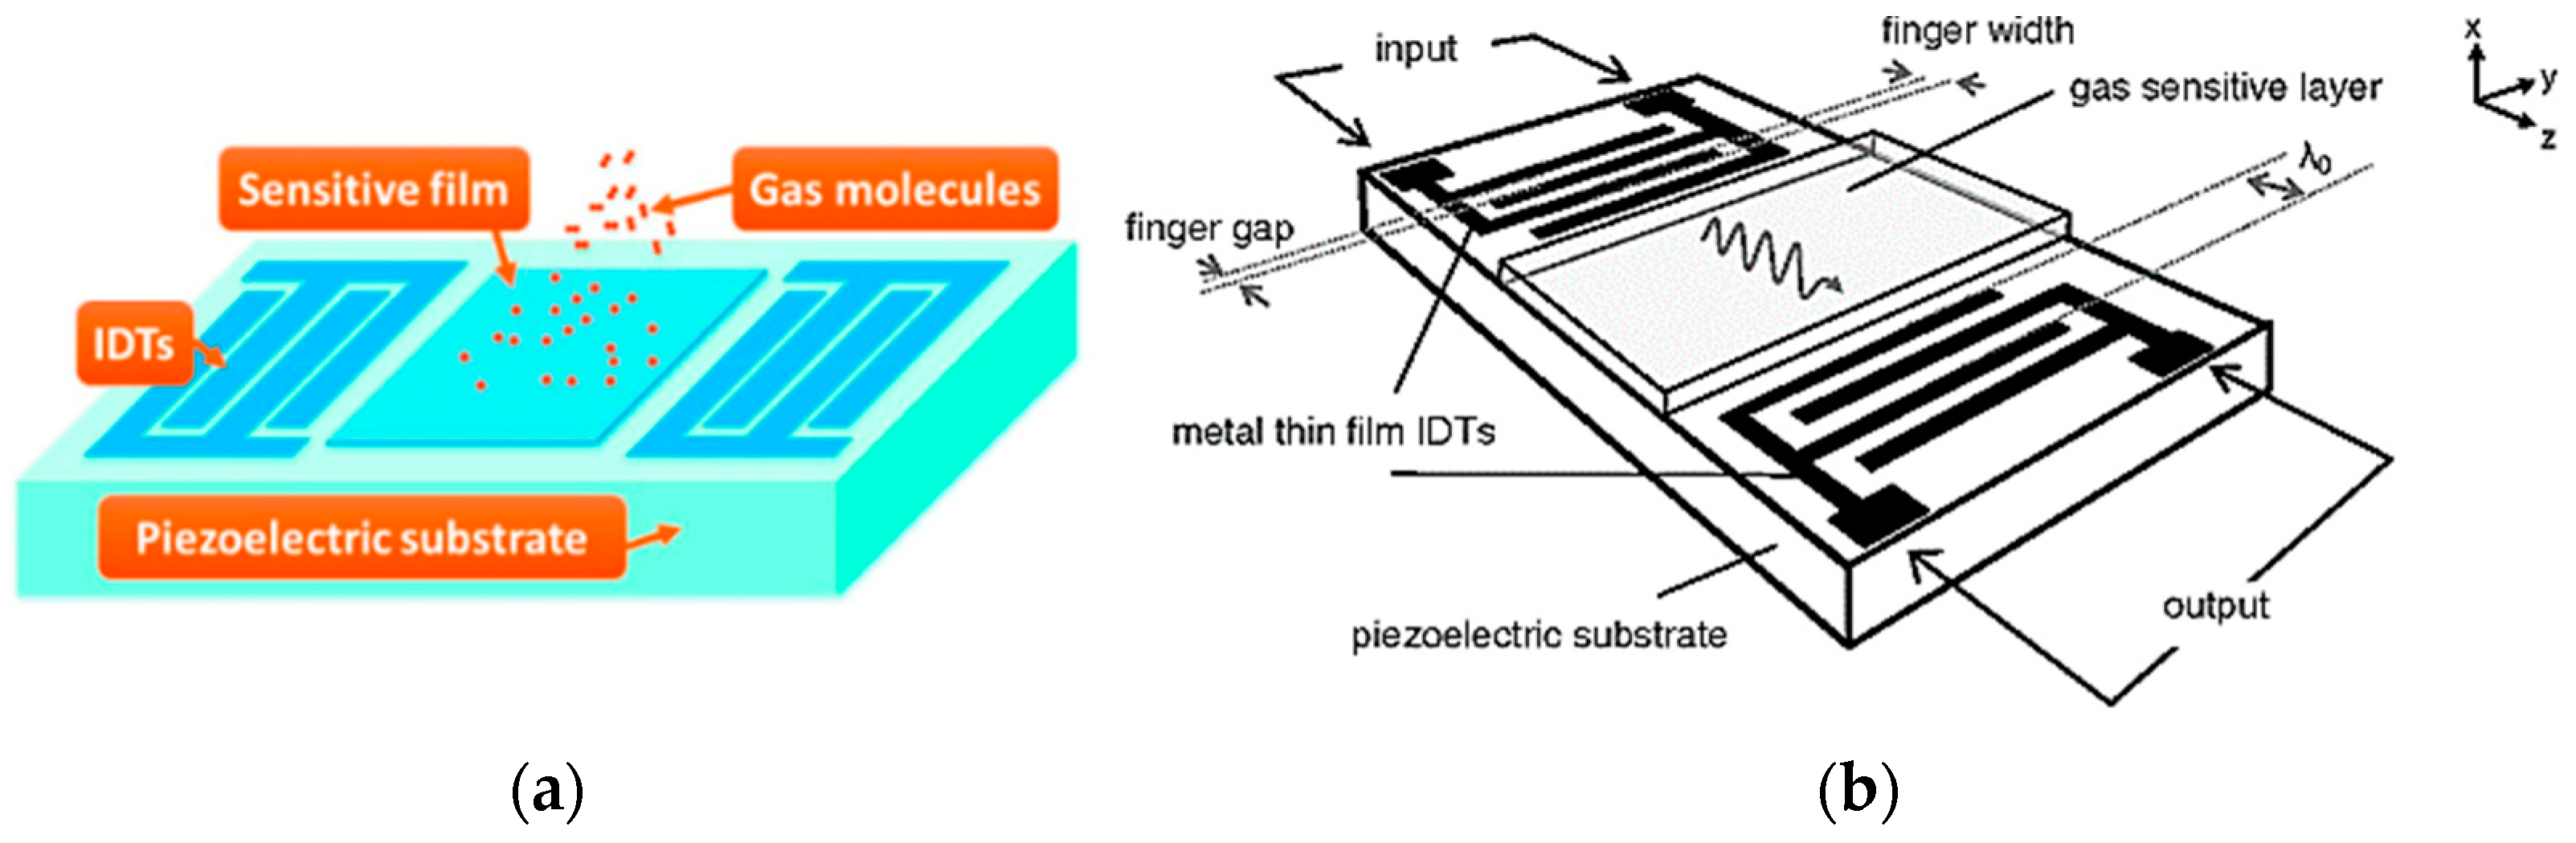
4.5. Low-Cost Acoustic Gas Sensors (AGSs)

In AGSs, a displacement or acoustic wave is transmitted through the gas, and the difference in the characteristics of the received wave from the original wave is converted into an equivalent AGS value [67]. A single electrode is utilized as a transmitter and receiver of flux, as exhibited in Figure 13 below.
A new dimension of AGSs was explored in 2018 by Xueli Liu et al. [31,68]. According to Xueli et al., a typical surface acoustic wave (SAW) gas sensor, described in Figure 13, has a core element of thin-film coating along the SAW propagation path between the two interdigital transducers (IDTs). The absorption of the sensitive thin film modulates the SAW propagation by so-called mass loading; viscoelastic or acoustic–electric effects need to be optimized for respiratory disease-focused innovations.

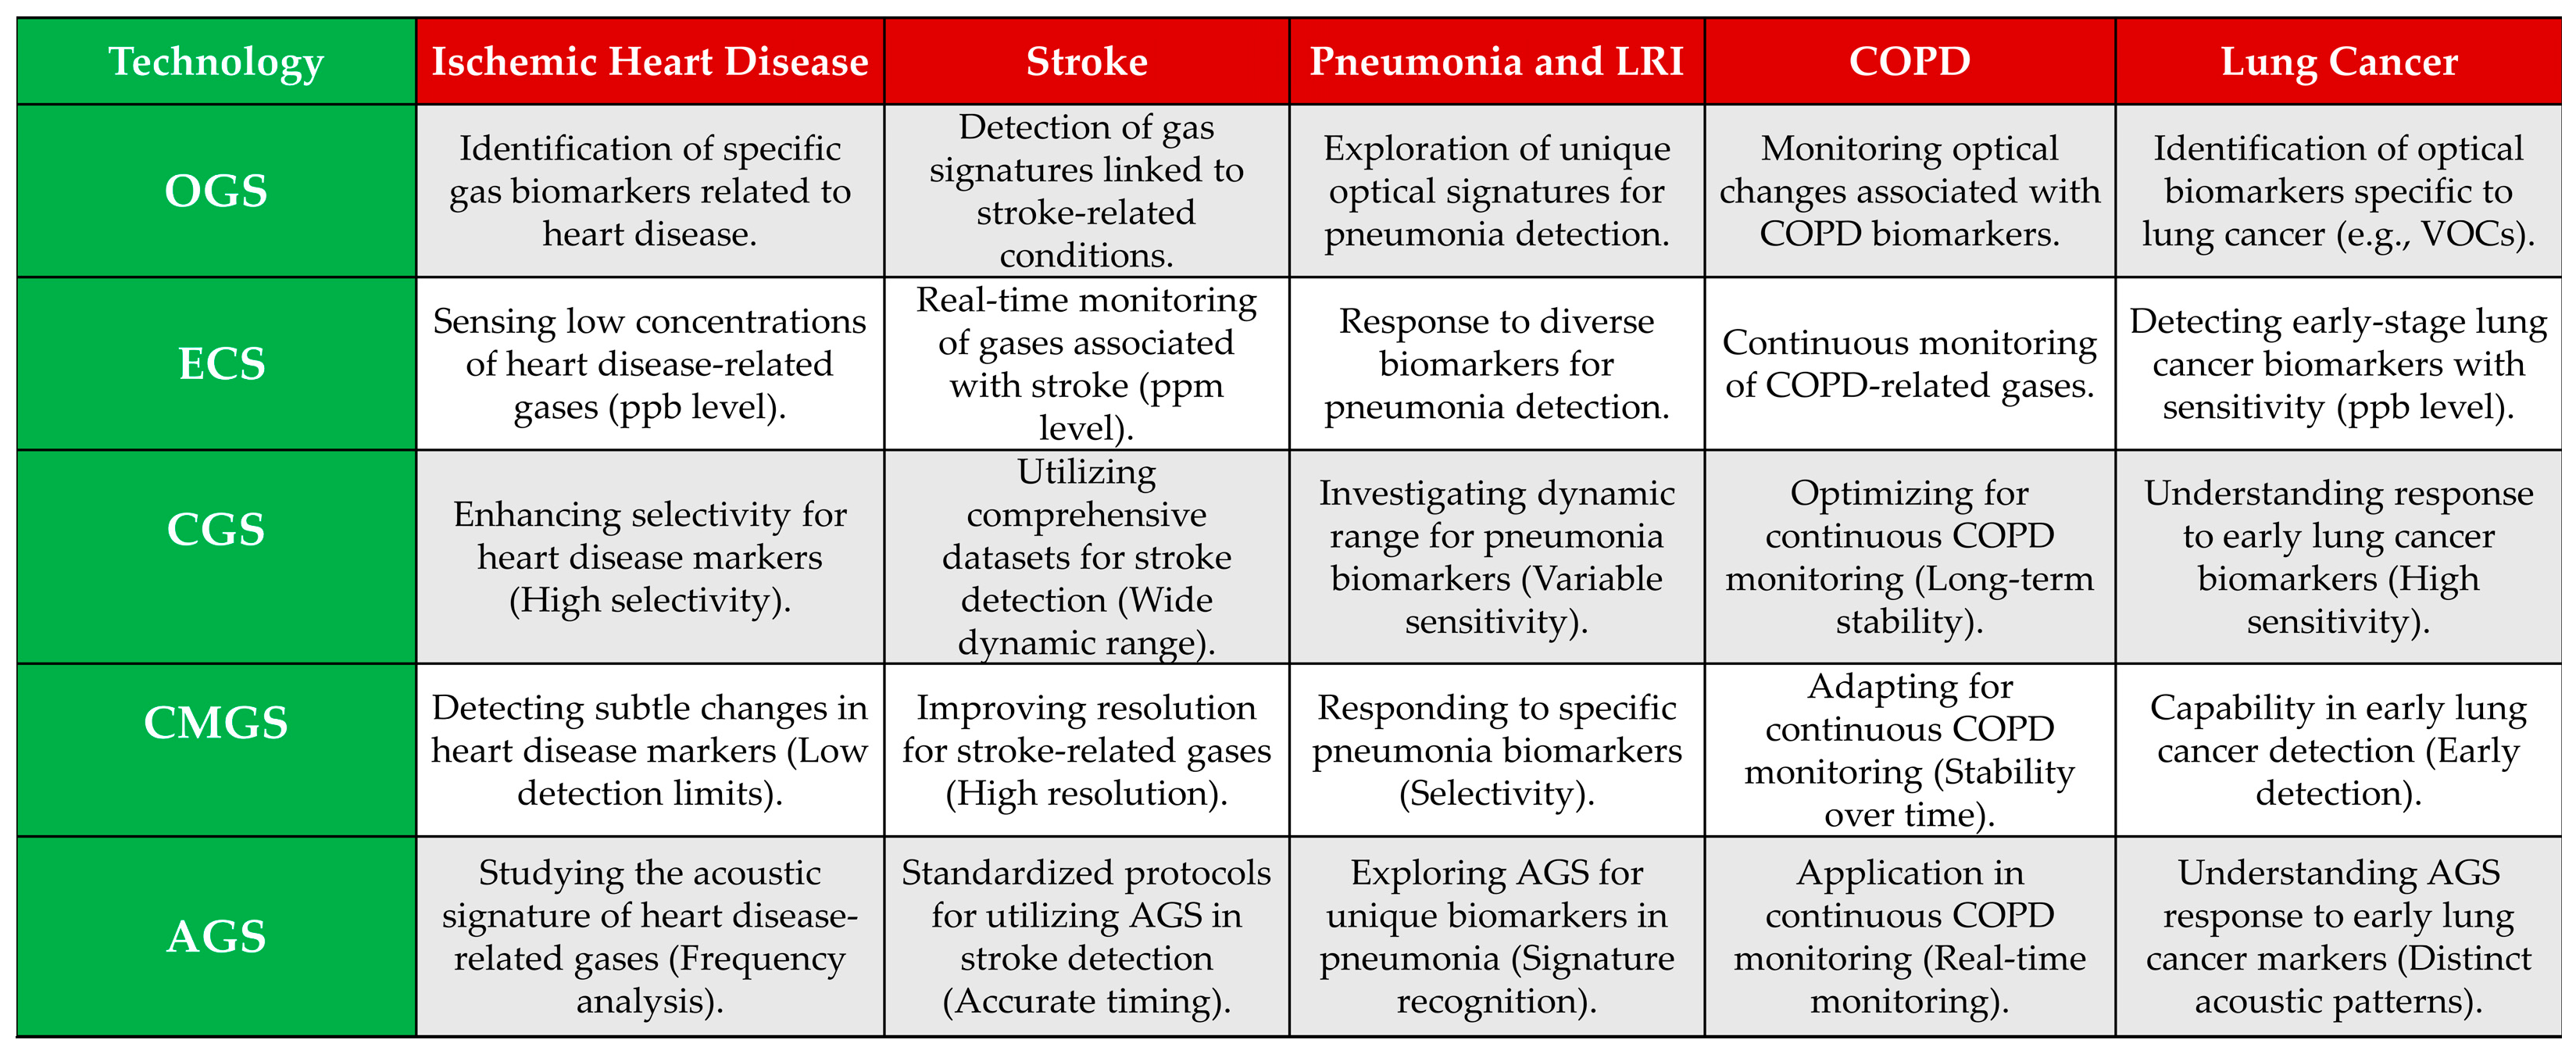
4.6. Effectiveness of Gas Sensing Technologies and Respiratory Disease Approximation

The role of gas sensing technologies in respiratory disease approximation is a plethora of associated health condition proxies summarized in Figure 14 as a synopsis of works [49,50,51,52,53,54,55,56,57,58,59,60,61,62,63,64,65,66].
In Figure 14, the mentioned merits and capabilities can be enhanced by the fabrication approaches to exploit the material attributes and atmospheric chemistry resolution discussed in the next section.

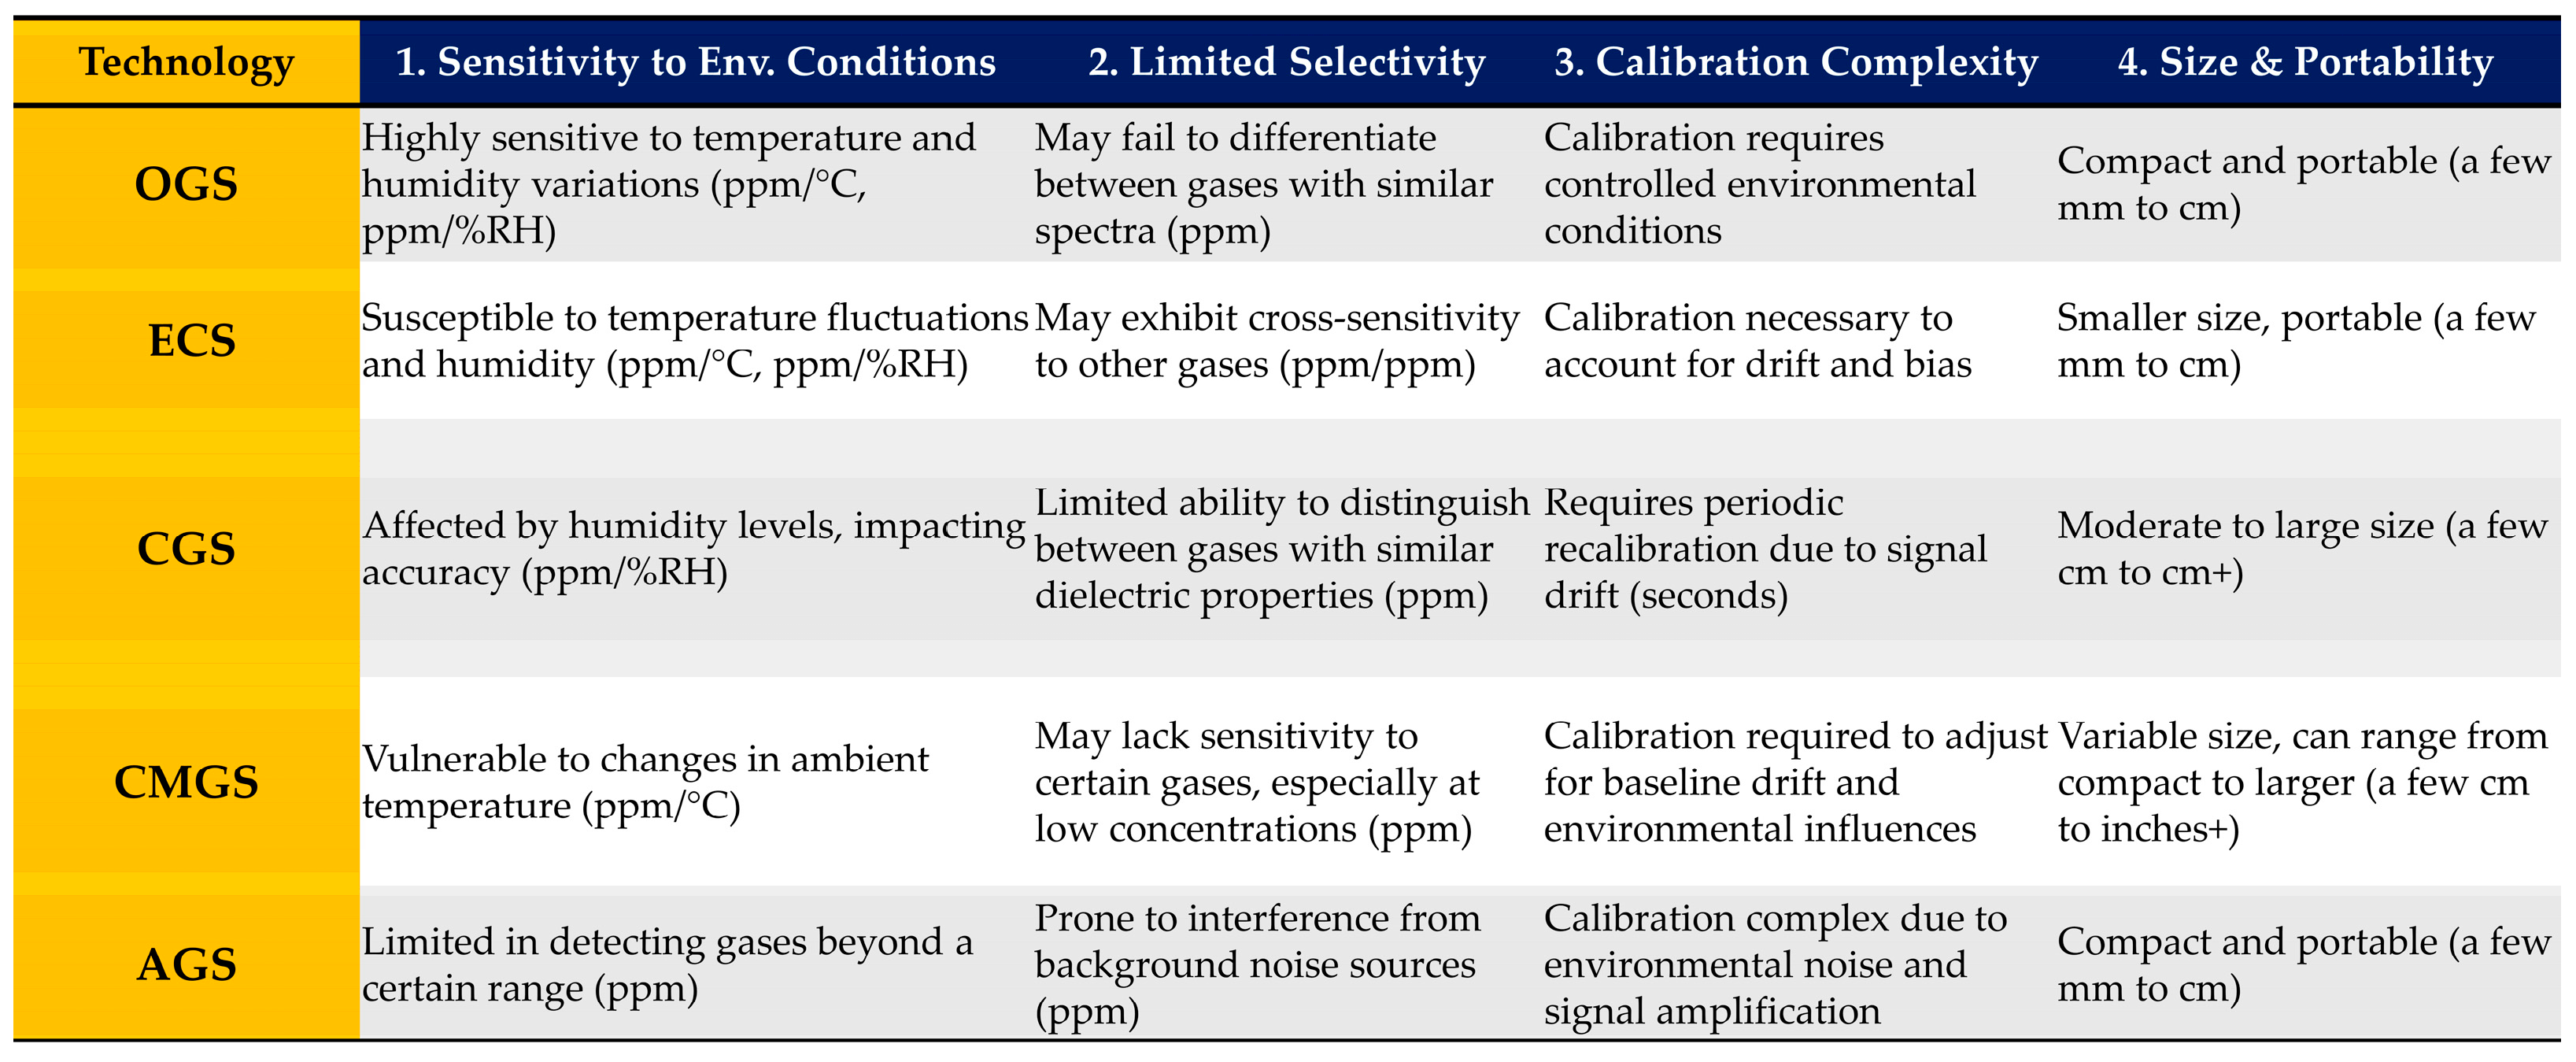
4.7. Limitations of Gas Sensing Technologies Based on Different Parameters

The limitations of current sensor technologies encompass various factors that can impact their performance and reliability arising from systematic errors or inaccuracies in measurements, which may introduce uncertainties into the data obtained. Additionally, the scope of detection, or the range of gases that sensors can effectively detect, may be limited, affecting their applicability to different environmental conditions or gas mixtures. These technologies were reviewed further based on four parameters given below in Figure 15.
Furthermore, environmental interferences such as temperature fluctuations, humidity levels, and the presence of other gases can introduce noise or interference into sensor readings, potentially compromising their accuracy and consistency. Addressing these limitations is crucial for ensuring the effectiveness and utility of gas sensing technologies in critical applications like respiratory health.

5. Indoor Epidemiology-Focused AQ Measurement Configurations and Assemblies

Smart methods like machine learning and data analysis for AQA processes require gas sensors to be in a specific format or topology for accuracy, effectiveness, and trustable measurements [67,68,69,70,71]. There are two core multi-gas sensing or sensor topology (also called electronic nose) arrays and grids, further elaborated as (a) gas sensor arrays and grids based on the System-on-Module (SoM) approach and (b) gas sensor array-on-chip-based SOI.

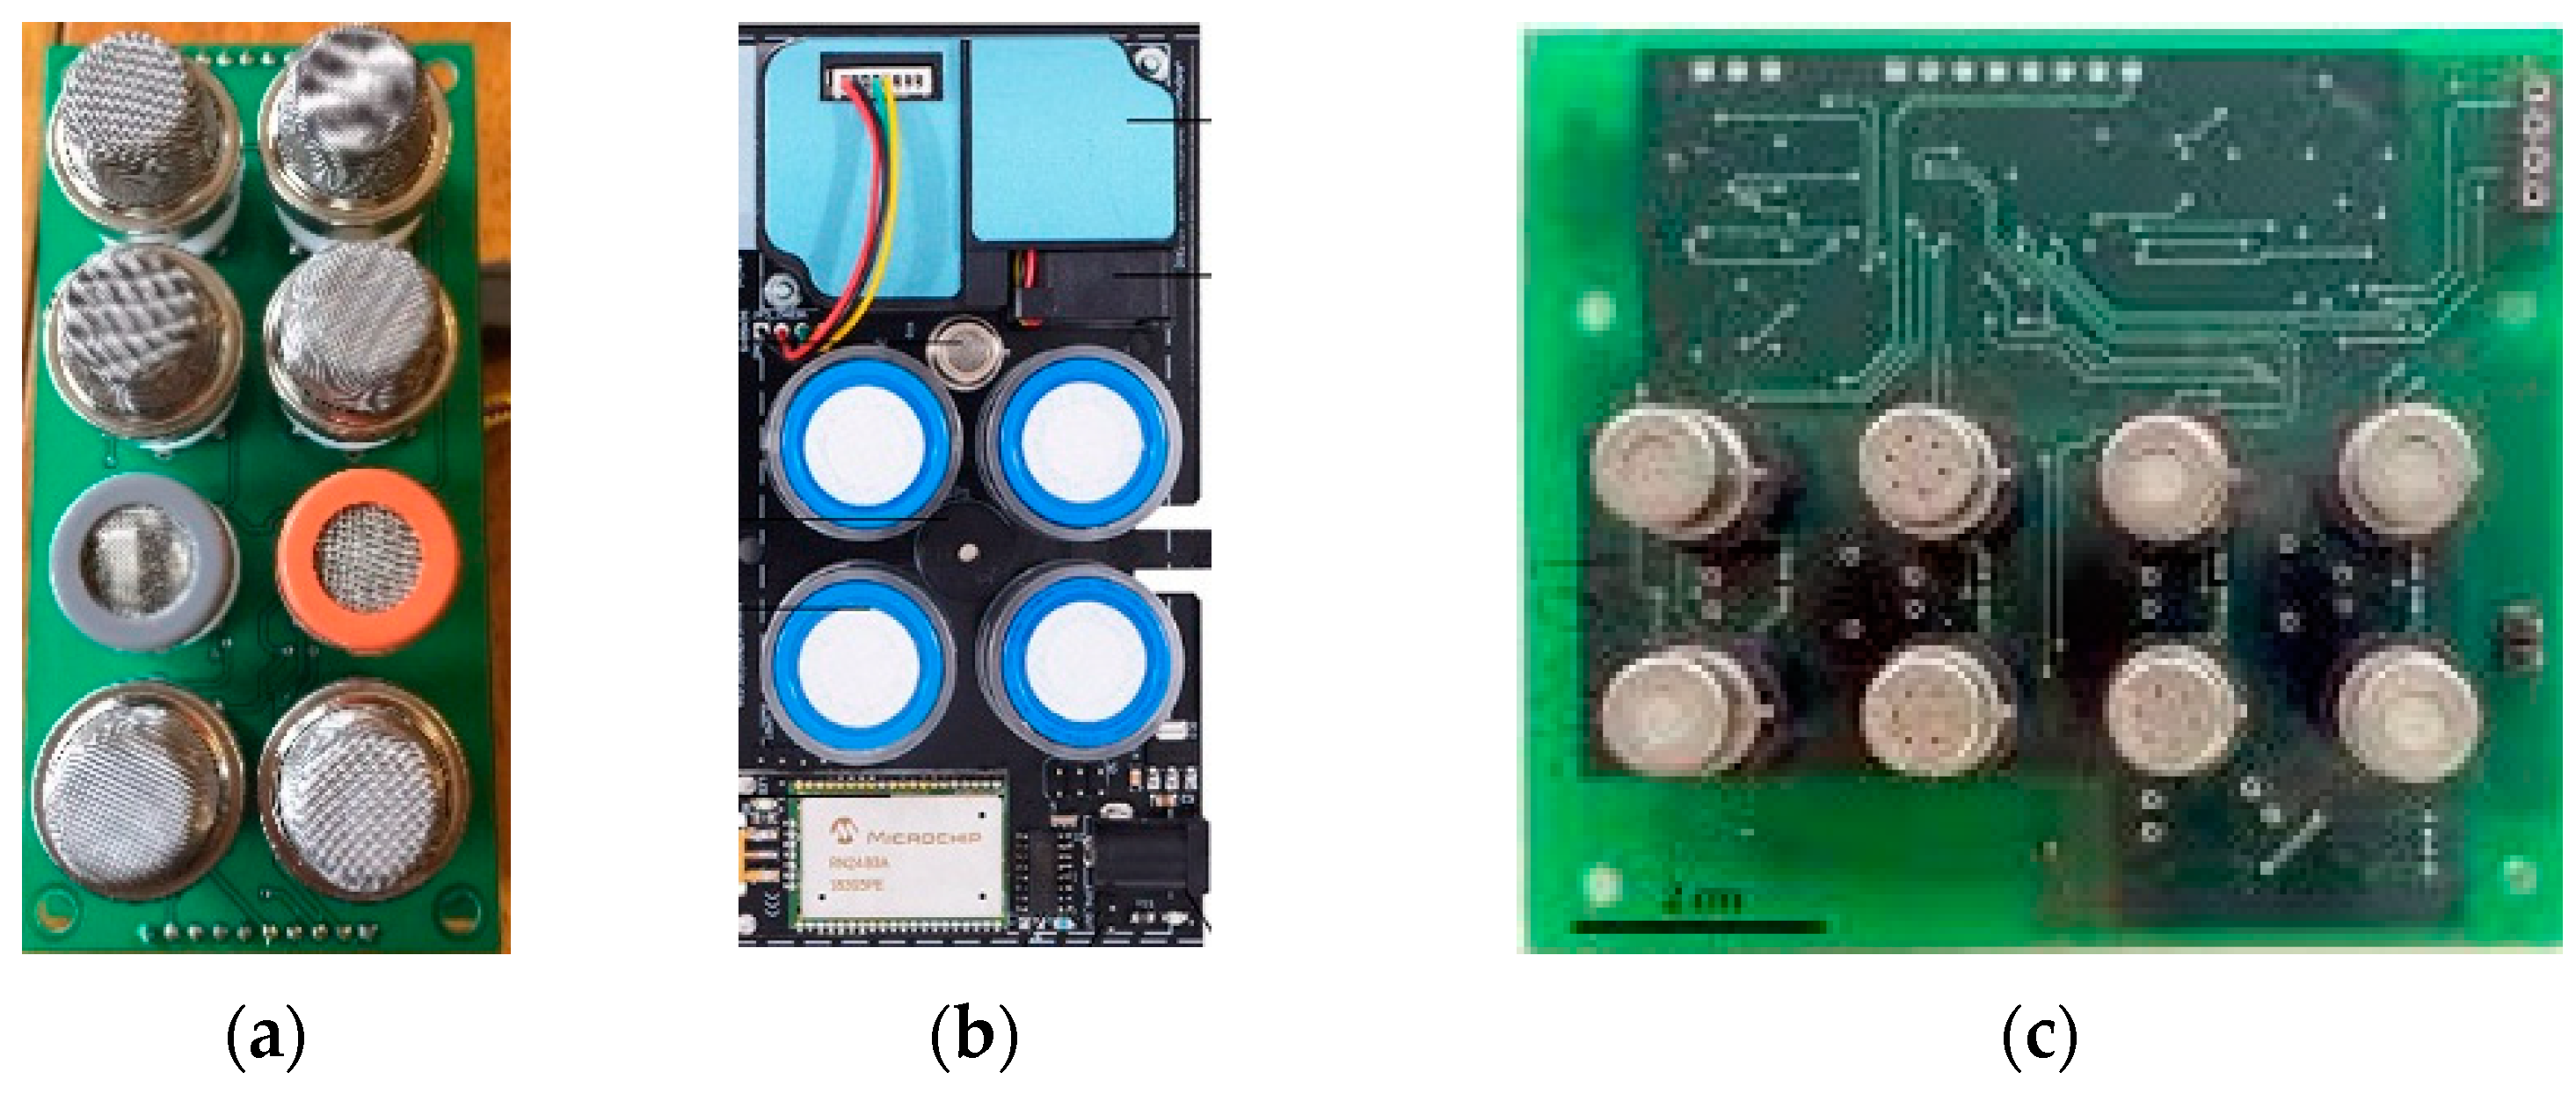
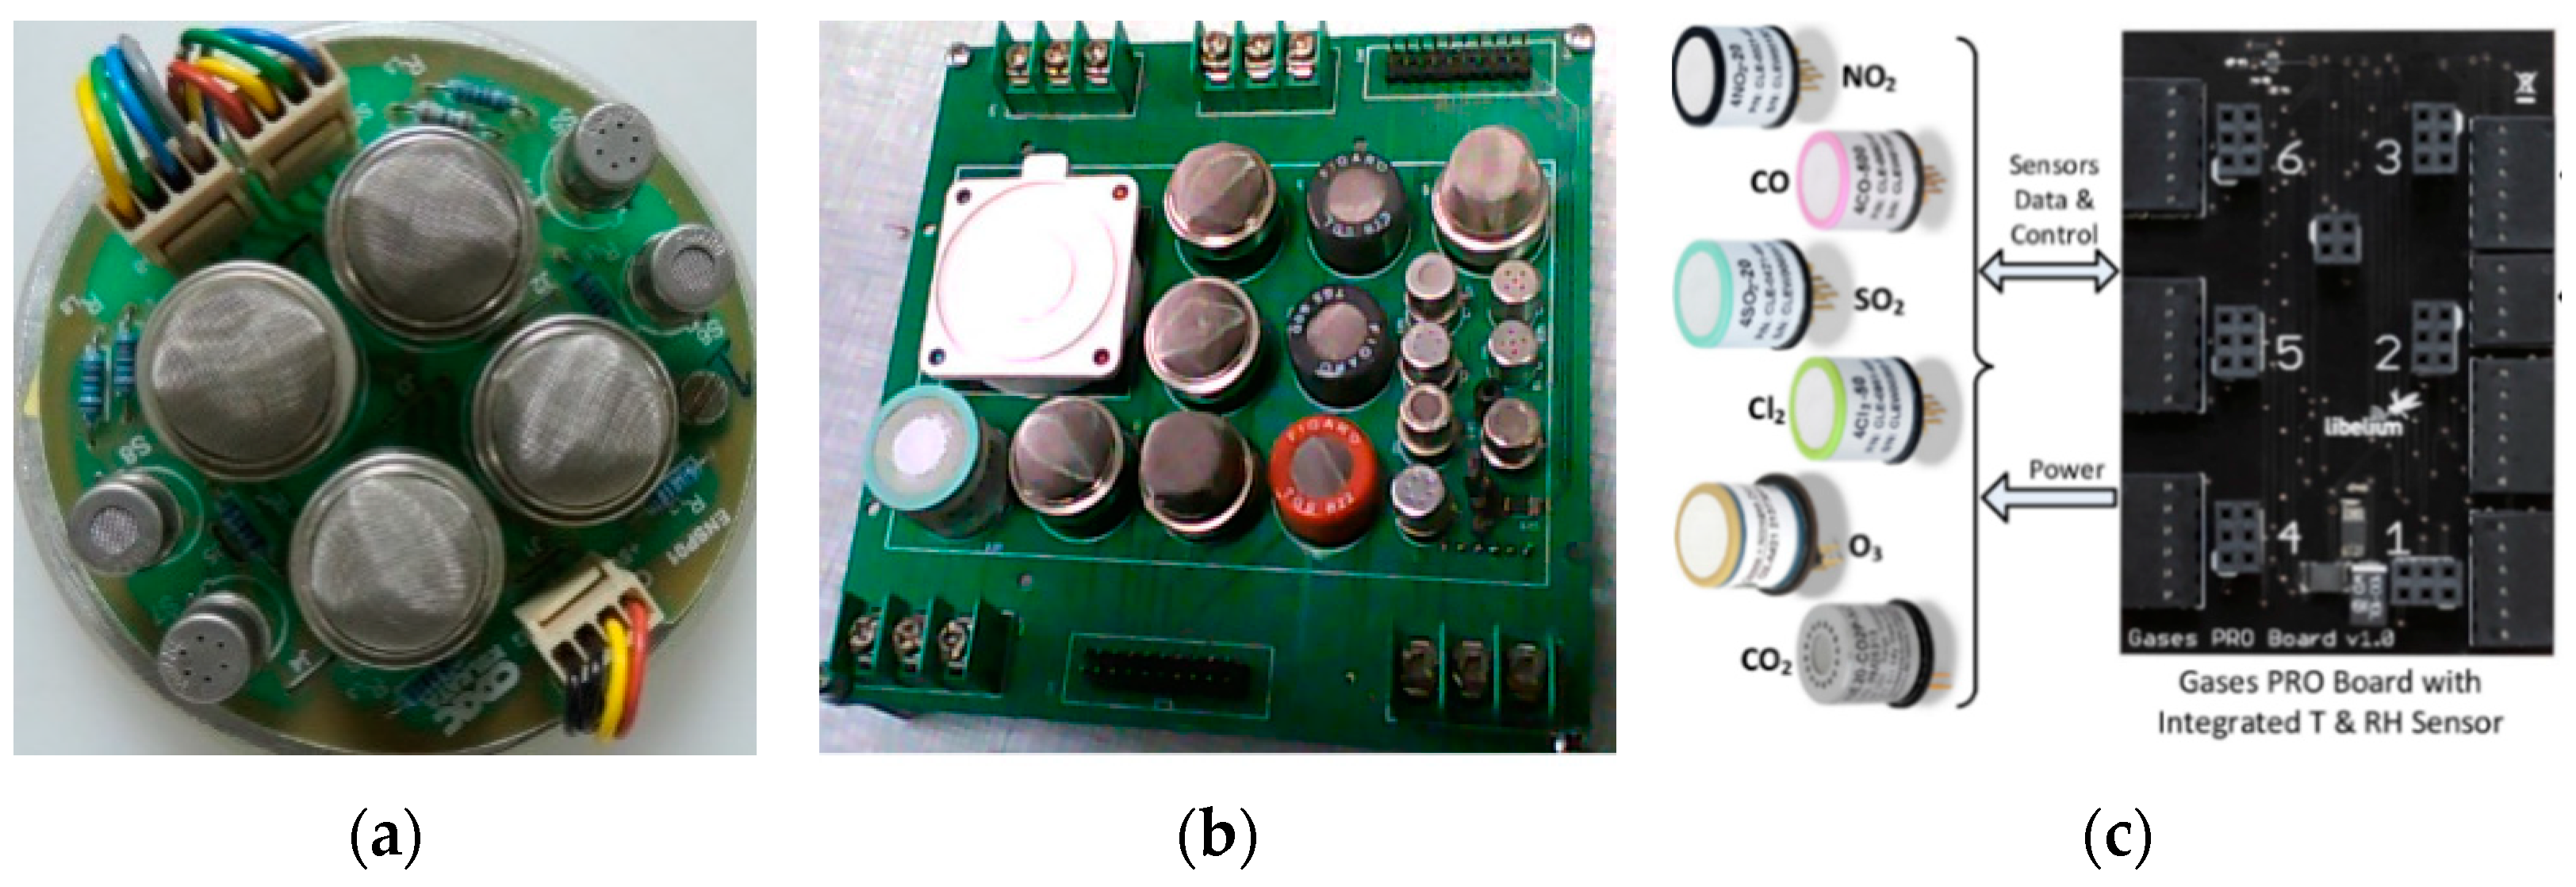
5.1. Gas Sensor Arrays and Grids Based on System-on-Module (SoM) Approach

The term electronic nose board (ENB) is used by various researchers around the world for a specific multi-sensor heterogeneous instrumentation PCB (Figure 16 and Figure 17) from [67]. The orientation of ENBs for a typical sensing application is called a gas sensing array (GSA) or GS grid (GSG) [68]. The multiple GSAs send data to a central data acquisition collector or gateway, called the GSG [69]. Different GSAs and GSGs from novel works are objectively discussed in [69,70].
The gradient descent method was used to detect food ripening by a GSA interfaced with STM32 in Figure 16a [67]. A later indoor air quality assessment was forecasted by a GSA in Figure 16b. Similarly, a water filtration assessment was performed using particle swarm optimization (PSO) by eight MOX GSA boards forming a GSG interfaced with the MSP430F247 board, as presented in Figure 16c [69,70].
A GSG test was performed in a hospital using least-square estimation for HVAC testing using Trio GSG [70]; i.e., the eight indoor gases were assessed (Figure 17a). In Figure 17b, the SVM was used to assess wound infection by an ENB based on four types of sensors [71]. In April 2020, the most recent ENB was used for the assessment of MFCs in a gas sensor calibration test bench [72], presented in Figure 17c. All of these had a major gap in sensor fusion to mine respiratory health-relevant derivatives.

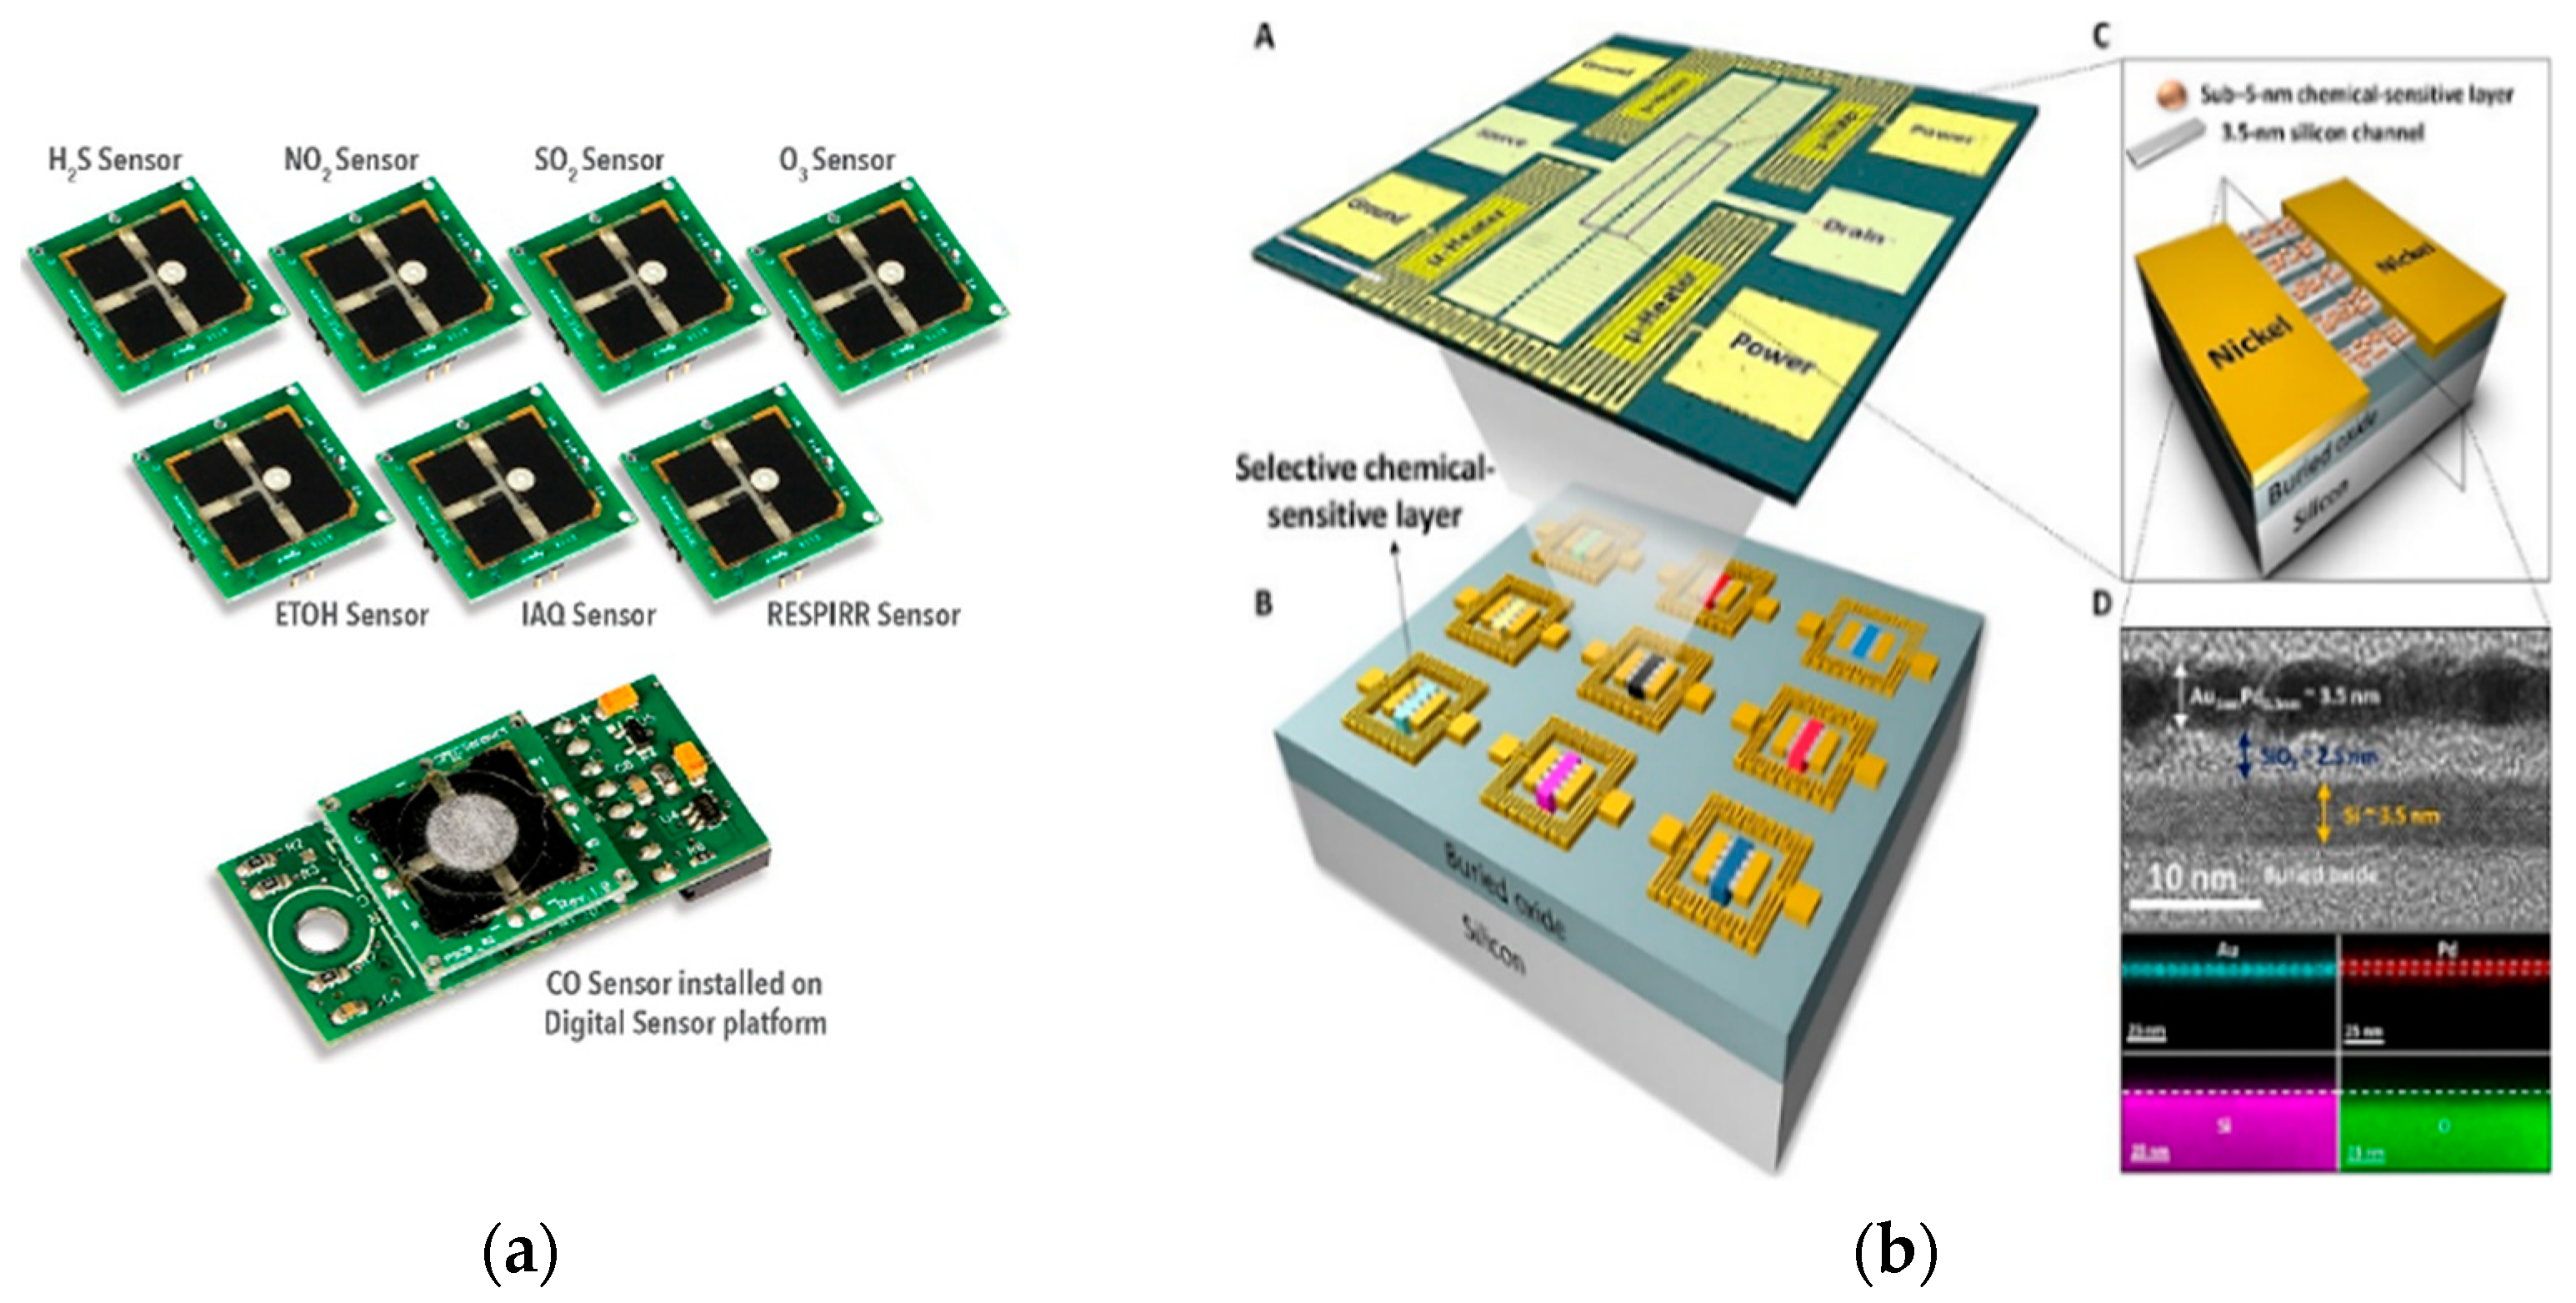
5.2. Gas Sensor Array-on-Chip-Based SOI

In 2019–2020, a state-of-the-art technology appeared in the market as a GSA on chip, the next step in sensor-on-chip prepositions [73,74,75,76]. These arrays delivered accuracy in details of ppb. In 2016, screen-printed electrochemical (SPEC) sensors shrank this gas sensing technology down to a size appropriate for consumer devices that can be made at the volumes and costs suitable to the mass market [73] (Figure 18a). The multi-sensor chip was developed as Digital Sensor Platform on Chip (DSPoC) and the overall ENB was called Open Source DSPoC Kit.
In Figure 18, the novel GSoC was developed in 2017 to sense H2S, H2, and NO2 gases with 3.5 nm wires [73,74,75,76]. The most recent work was a Single-Chip Gas Sensor Array (SC-GSA) in which a set of four micro-heaters was used to access a single suspended SiO2 diaphragm [81] using thermal proximity and achieved low power consumption (~10 mW for 300 °C). Plasma-optimized thin films of ZnO, BaTiO3-CuO doped with 1% Ag, WO3, and V2O5 were employed for the selective sensing of CO, CO2, NO2, and SO2. The four sensors were controlled independently and detected CO (~78.3% for 4.75 ppm) at 330 °C, CO2 (~65% for 900 ppm) at 298 °C, NO2 (~1948.8% for 0.9 ppm) at 150 °C, and SO2 (~77% for 3 ppm) at 405 °C operating temperatures. The complete implementation of GSAoC is the current state of the art [77].
These works needed improvement by exploring a more exhaustive characterization of the respiratory disease-projected IAQ features through ENB, GSA, and GSoC materials and operating conditions, including surface morphology, chemical composition, and environmental stability. This will provide valuable insights into the sensing mechanisms and potential areas of optimization for respiratory disease IAQ proxies.

6. Indoor Epidemiology-Based Calibration and Testing of AQ Gas Sensors

Readings from sensors, especially chemical sensors, shift with temperature and aging, affecting the accuracy of the measured data. Therefore, regular calibration should be conducted. Four major types of automated calibration approaches have been developed and tested to date: (a) Uni-Gas Uni-Sensor Calibration; (b) Uni-Gas Multi-sensor ENB Calibration; (c) IoT-based Networked Multi-Gas ENB Calibration; and (d) Climate Smart Heterogeneous ENB Calibration. Recent work has realized a plethora of efforts made in gas sensor calibration [73,74,75,76,77,78,79,80,81,82], presented in Figure 19, Figure 20 and Figure 21.

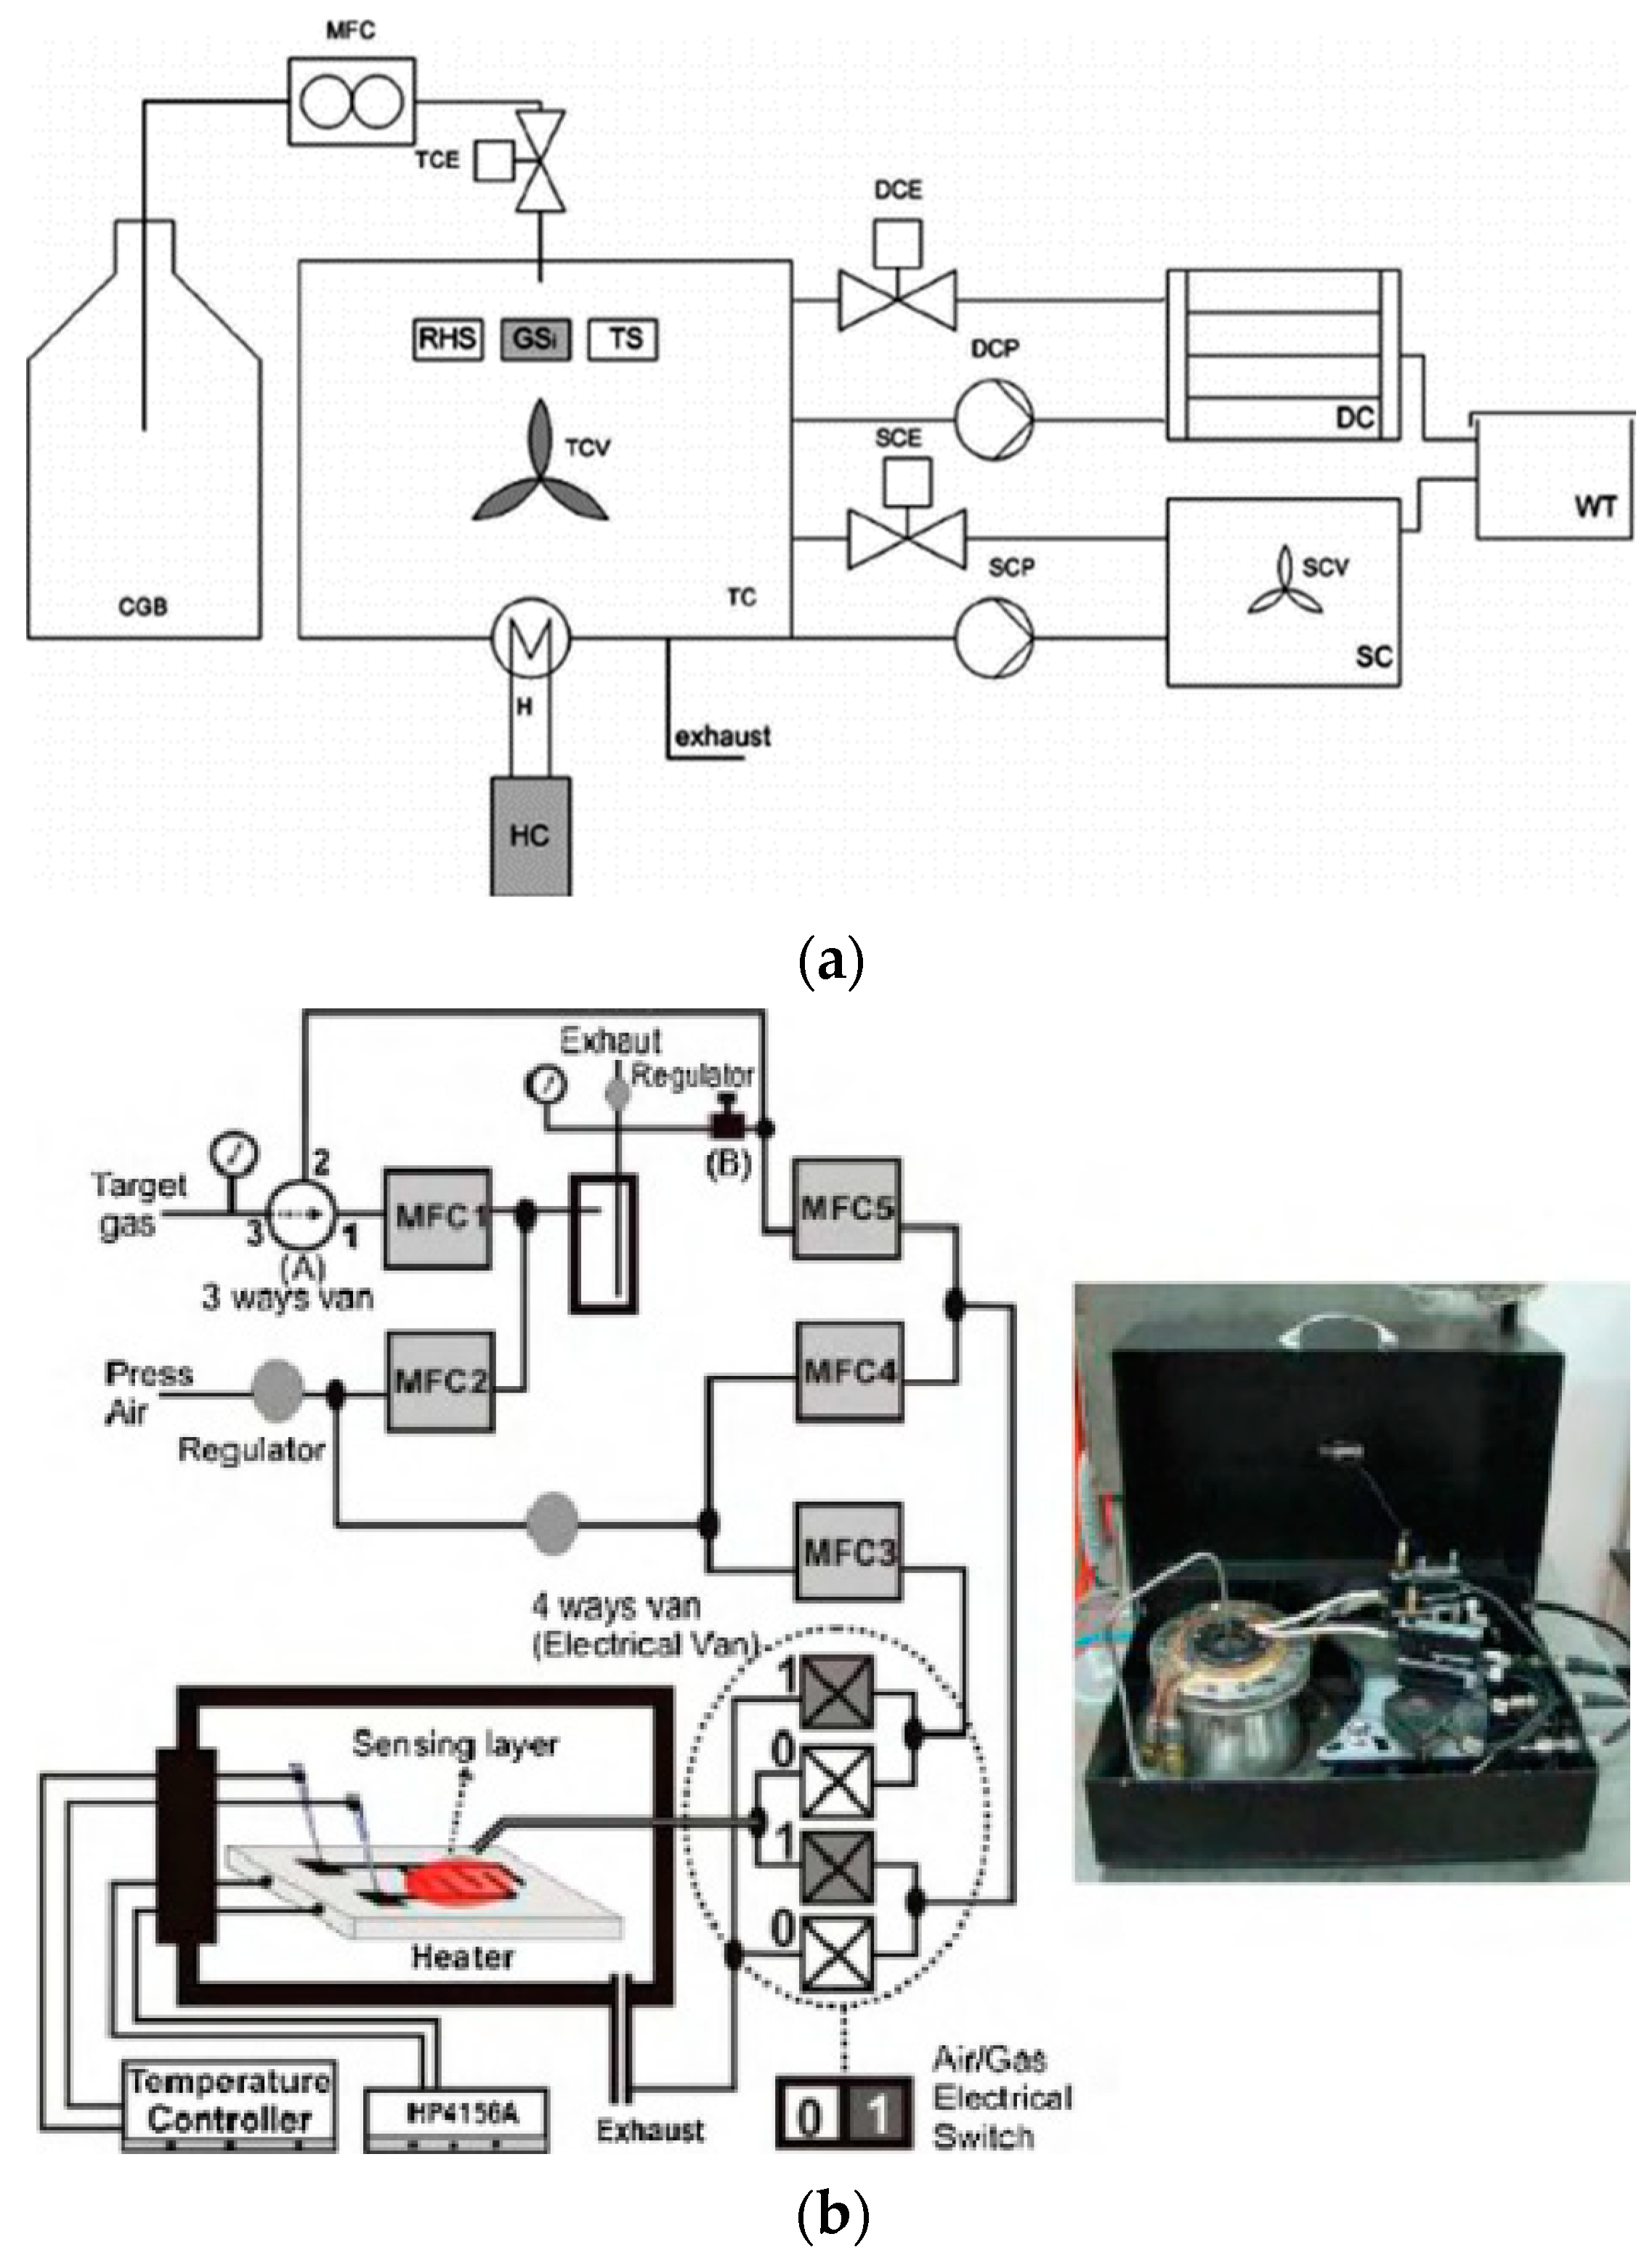
6.1. Uni-Gas Uni-Sensor Calibration

In 2009, the first structured gas sensor calibration system was designed and implemented by a measurement calibration system that was developed by Casey, J.G. et al. [74], presented in Figure 19a.
A standard AQS calibration follows a [75] schematic as follows: (a) an air-sealed chamber with inflow and outflow valves; (b) mass flow controllers (MFCs) for the desired concentration of gas from a cylinder or a PID controller gas flow loop; (c) gas cylinders with different concentrations; (d) a temperature actuator (heater); (e) a humidity actuator (steam regulator); (f) gas collectors for the environmental model; and (g) measurement instruments other than gas sensors for comparison interfaced with a computer. In Figure 19a, an industry-standard instrumentation topology, i.e., a piping and instrumentation diagram (P&ID), is presented for an AQGS. It consists of 14 components: (1) CGB: calibration gas bottle; (2) MFC: mass flow control; (3) TCE: testing chamber electro-valve; (4) DCE: drying chamber electro-valve; (5) SC: saturation chamber electro-valve; (6) DCP: drying chamber pump; (7) SCP: saturation chamber pump; (8) DC: drying chamber; (9) SC: saturation chamber; (10) HC: heater control; (11) H: heater; (12) WT: water tank; (13) TCV: testing chamber ventilator; and (14) SCV: saturation chamber ventilator. The chamber ventilator’s internal architecture varies with the sensing technology detailed in a survey on gas sensing (Xiao Liu et al. [76]), and these studies needed improve in terms of the process alignment aspects of sensing and breathing conditions to cover respiratory features like inhaling and exhaling flowrates and concentrations. Two studies on testing the performance of field gas sensor calibration techniques were proposed by Joanna et al. [77] for Colorado.
The characterization study conducted by Leidinger et al. led to a new horizon in test gas generation systems [78]. In Figure 18b, an experimental gas sensor test and calibration system for SnO2 nanowire-based gas sensors are presented (Le Viet Thong et al. [79]). The test was performed by measuring all sensors with liquid petroleum gas (LPG, 500–2000 ppm) and NH3 (300–1000 ppm) at different temperatures (50–450 °C) using a setup with high-speed switching gas flow (from/to air to/from balance gas). Balance gases (0.1% in air) were purchased from Air Liquid Group, Singapore. The system employed a flow-through with a constant rate of 200 sccm.

6.2. Uni-Gas Multi-Sensor ENB Calibration

The miniaturized environmental control chambers presented in Figure 20 were introduced by Yi Chen et al. [80] and Jordi Follonosa et al. [81].
As seen in Figure 20a, the sensor array was placed in a test chamber with a volume of 20 L, composed of ten metal oxide semiconductor gas sensors (TGS 2620) by Joanna et al. [81]. The sensor array resistances were acquired by a half-bridge configuration and collected by a multifunction switch/measuring unit of 34,980 A via an electrical interface on the chamber. The gas mixture, based on a PID experiment by Jordi et al. [82] and using the dynamic response of each sensor, was recorded at a sample rate of 100 Hz. In this chamber, the RH (0~10%) was varied and captured using a 16-channel ADC. The time-series sequence for the entire dataset from the 16-channel acquisition system from sensors in the given order is as follows: (CH0-CH15): TGS2602; TGS2602; TGS2600; TGS2600; TGS2610; TGS2610; TGS2620; TGS2620; TGS2602; TGS2602; TGS2600; TGS2600; TGS2610; TGS2610; TGS2620; TGS2620 [83]. This discussion will follow sub-type capacitive sensors (the first type of gas sensor), further trimmed down to included gas sensors based on contactless capacitive electrodes to cover respiratory diseases and diagnosis.

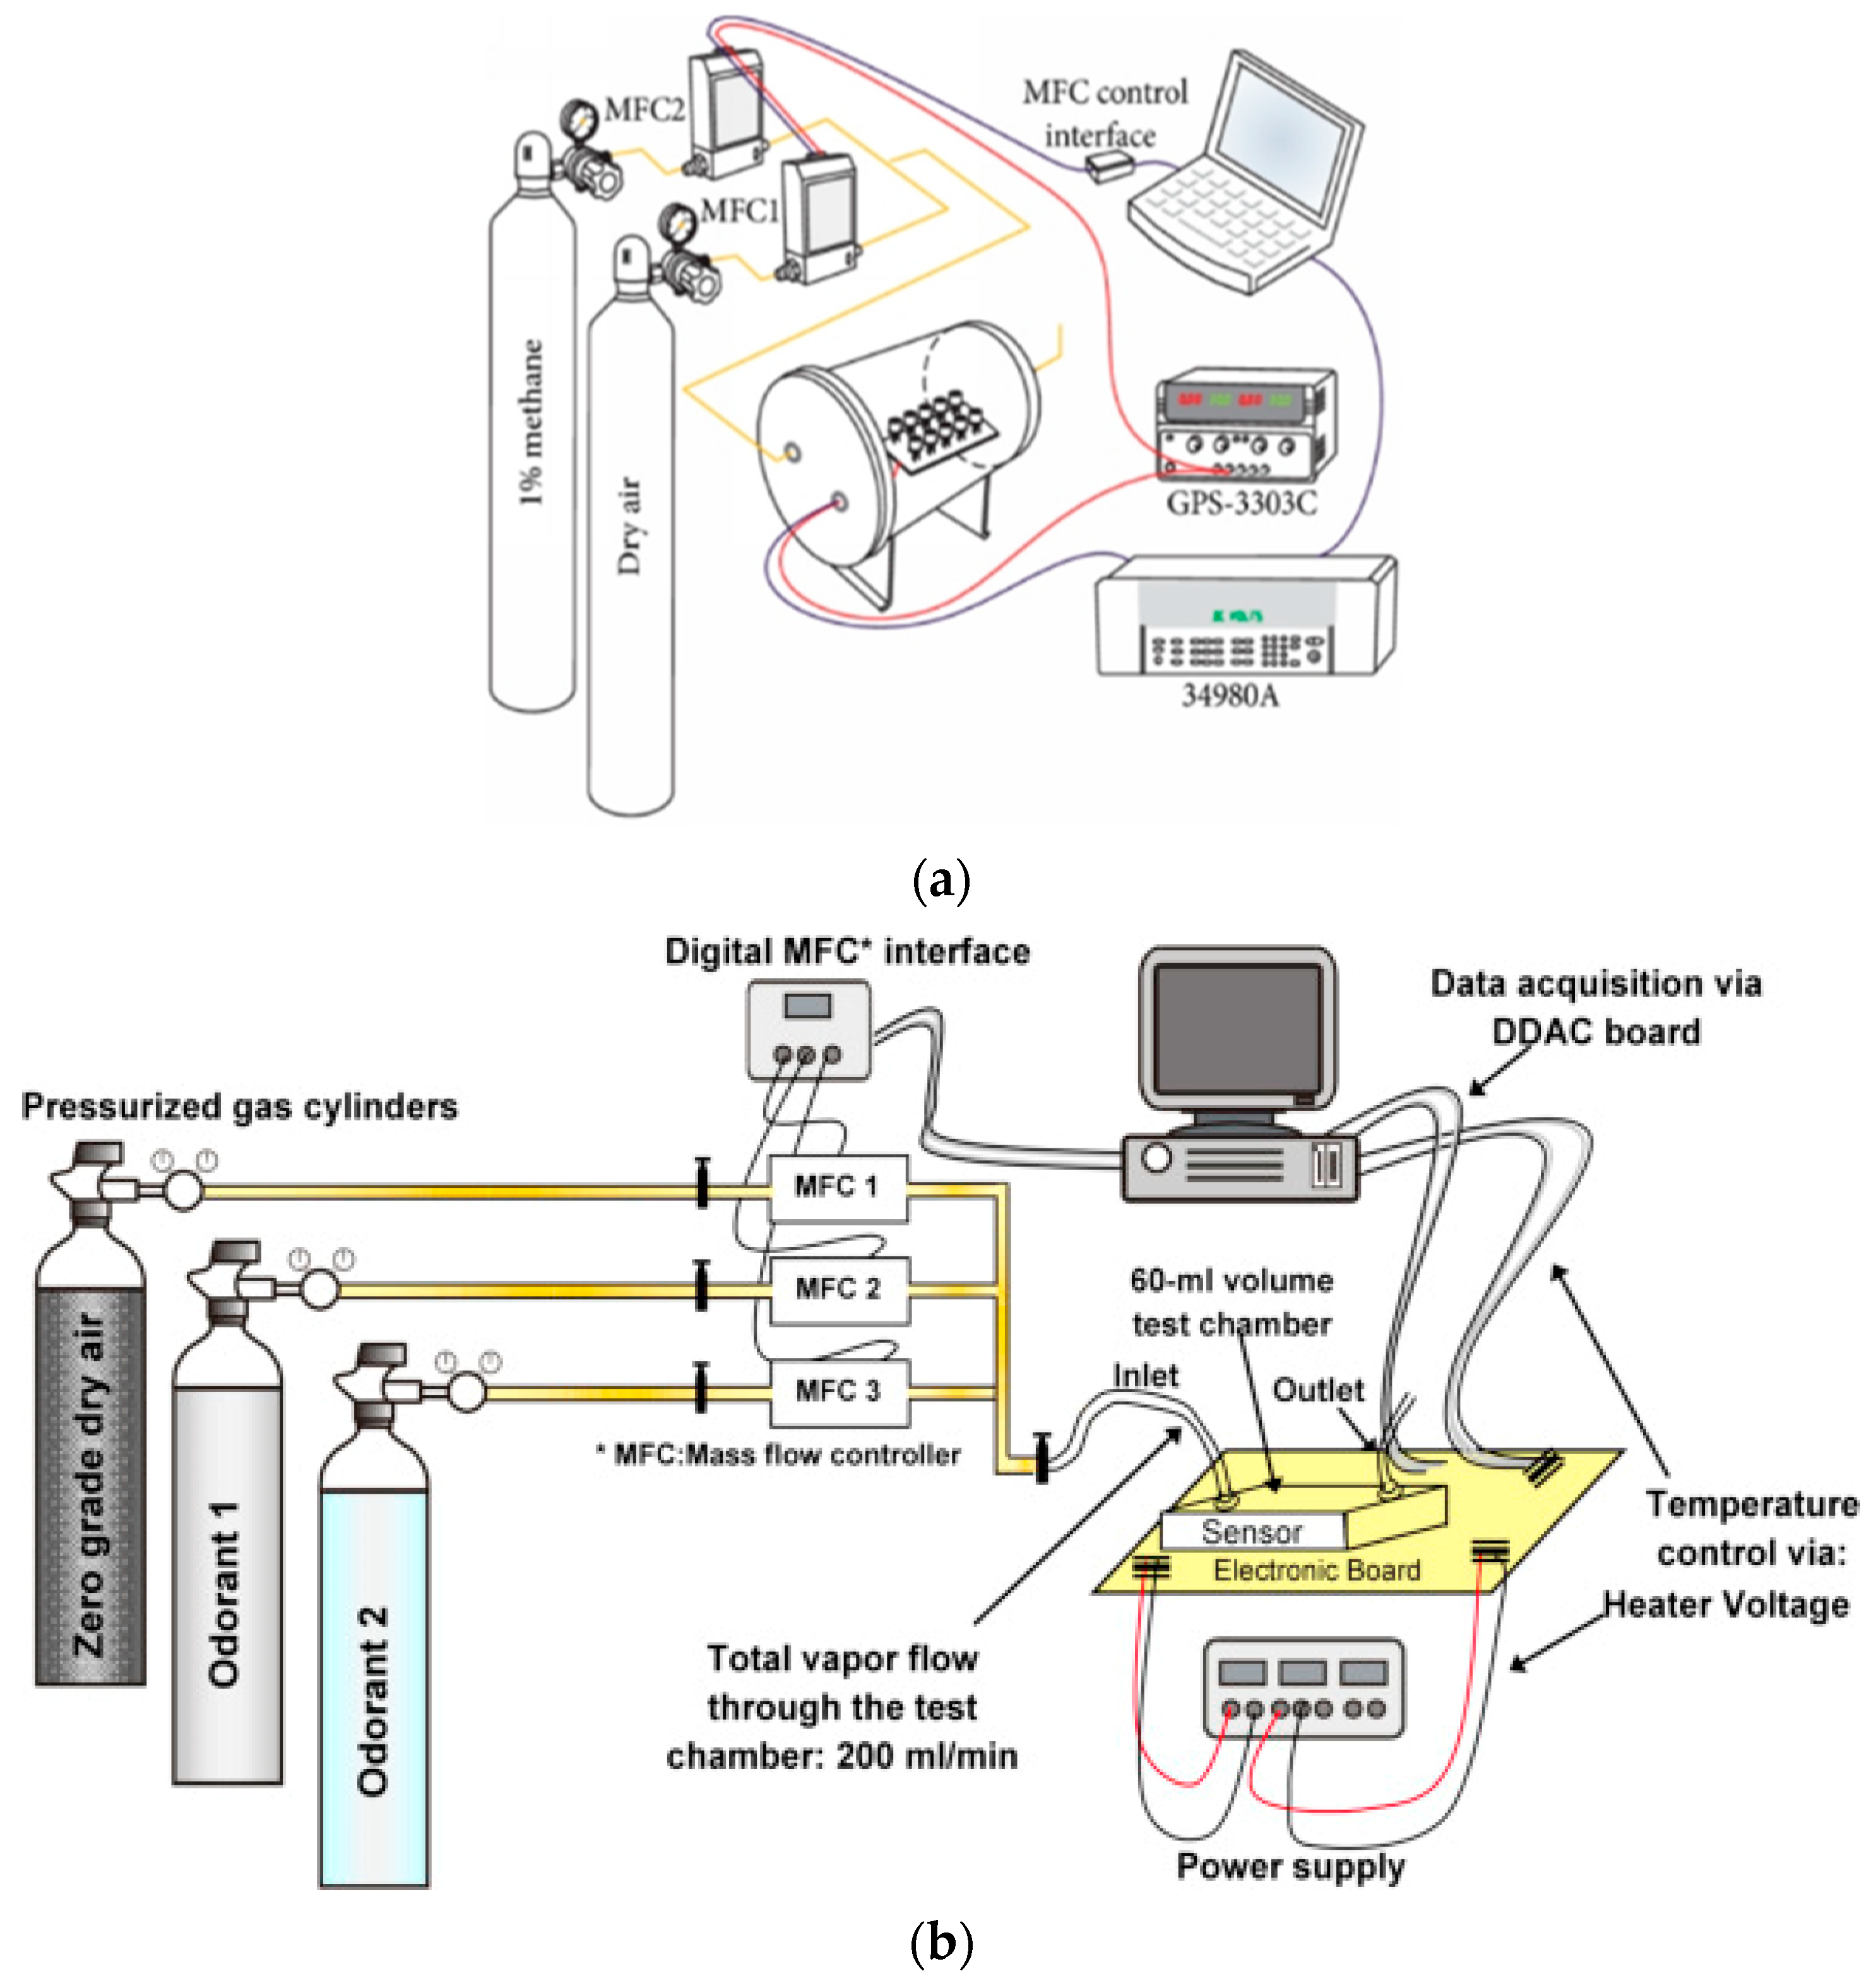
6.3. IoT-Based Networked Multi-Gas ENB Calibration

In 2020, the most recent smart gas sensor calibration test rig appeared in the literature from Mohieddine A. Benammar et al. [84], presented in Figure 21. In Figure 21, Smart TestRig took account of all major improvements recommended in studies by Maag, B. et al. [85] for gas sensor calibration in air monitoring deployments.
The Smart AQ GSA test rig by Mohieddine A. Benammar et al. [84] in Figure 20 was developed considering the gaps in the study by Spinelle, L. et al. [86] to present a field calibration of a cluster of low-cost available sensors for air quality monitoring using O3 and NO2. Mijling, B. et al. [87] worked on the field calibration of electrochemical NO2 sensors in a citizen science context. Hagan et al. [88] presented the calibration and assessment of electrochemical gas sensors by co-location with regulatory-grade instruments; Hasenfratz. D. et al. [89] presented the on-the-fly calibration of low-cost gas sensors; Yang, F. et al.’s work [90] introduced the dynamic calibration of electrochemical gas sensors for accelerated analytic quantification; and Tian, B. et al. [91] proposed an environment-adaptive calibration system for indoor low-cost electrochemical gas sensors.

6.4. Climate Smart Heterogeneous ENB Calibration

As shown in Figure 22, Sayahi et al. [92] performed the entire testing and calibration of several gas sensors using a custom sensing chamber (volume ~300 cm3), a PID controller electric heater.
The gases were individually mixed with dry synthetic air and introduced inside the test chamber at a controlled flow rate of 50 cm3/min. One of the core innovations in this work was an evacuation pump scheme with 8 × 10⁻¹ Torr using a rotary vacuum pump. In the next generation, testing calibration system curve fitting was performed and error proportionalities were calculated for porous silicon-filled Pd/SiC nano-cauliflower thin films for high-performance H2 gas sensors, for example, by Asghar et al. [93].

6.5. Epidemiological Scalability through Calibration Approaches in Non-Invasive Diagnosis

The population overshoots demanded a huge number of patients to be monitored and diagnosed in a short time, which mandated the scalability of calibration methods for multiple human subjects presented in Table 5.
In Table 5, the selected epidemiological merits play a pivotal role in the scalable diagnosis of respiratory health conditions (asthma, COPD, ischemic heart disease, stroke, pneumonia, LRIs, lung cancer, and sick building syndrome) as part of a bigger picture at institutional levels like the WHO, NIH, CDC, and US-EPA in the following manner:
  • A precise calibration Scale, such as a 24 h interval, ensures consistent accuracy, while the system setup cost for deploying 10 sensors directly influences the feasibility of widespread implementation;
  • Supporting multiple sensor types allows for a comprehensive assessment, facilitating a detailed understanding of specific respiratory health concerns related to diverse indoor air contaminants;
  • The combination of IoT support and remote calibration enables real-time adjustments, ensuring continuous accuracy;
  • The cost-effectiveness of calibration activities directly impacts operational expenses;
  • Real-time AQI-based climate-focused calibration tailors adjustments to specific climate conditions, enhancing the precision of health-related data;
  • ML/DL model-in-loop support integrates advanced learning models, contributing to the adaptability and diagnostic capabilities of the system.
Together, these calibration parameters collectively enhance the accuracy, efficiency, and applicability of sensor systems, crucial in the diagnosis and management of respiratory diseases.

7. Indoor Epidemiology and Respiratory Diseases

Acute respiratory infections, TB, asthma, chronic obstructive pulmonary disease, pneumoconiosis, head and neck malignancies, and lung cancer have all been linked to indoor pollution exposure [94]. The direct relationship presented in the relevant works is compiled in Table 6, given below.
The death statistics presented in different global studies and state agencies like the WHO and NIH associated with indoor pollutants, in order of intensity, are summarized in Table 7.

8. Practical Considerations in Real-World Deployment of Low-Cost AQ Sensors for Indoor Respiratory Conditions and Disease Diagnosis

Respiratory diseases are a scalable and long-term chronological health concern for both respiratory patients and healthy people. The existing studies need to be improved and reviewed based on practical considerations, such as decision-making challenges for public institutions. At the public health level, the major decisions to be made for regional institutions are (a) the cost of entire low-cost AQ sensor infrastructure; (b) the size of area being covered; (c) manufacturing setup, such as importing all sensors in quantities of millions, which can be a big shock to national revenue reserves that is practically not feasible; (d) their compatibility with existing low-cost sensor systems, and integration with publicly deployed reference grade instruments (GC-MS, PTR-ToF-MS, ICP-MS, and gas analyzers); (e) targeted sampling rates for the acquisition of maximum signatures; (f) operational lifecycles for entire public health campaigns (may lapse over years); (g) their calibration costs for such a huge setup; (h) sets of target variables, such as different configurations of ENBs, GSAs, and GSGs; (i) embedding this all into a single public respiratory health network to be monitored live by atmospheric health and respiratory condition medical specialists; and (j), for regional bodies, the mapping is the key requirement to have a holistic view of entire respiratory conditions. In addition to these decision-making challenges, the practicing ecosystem that involves respiratory and atmospheric health researchers, manufacturers, and EPA stakeholders in respiratory diagnosis centers’ adaptation is also relevant. To address all of these key decision-making parameters, seven factors are presented in Table 8.
From Table 8, it can assessed that the financial considerations associated with implementing gas sensor technologies play a crucial role in enhancing the diagnosis of respiratory diseases and addressing indoor air quality challenges. Firstly, the lifeline cost, representing the long-term financial commitment, influences the sustainability of sensor deployment across different health conditions, such as asthma, COPD, ischemic heart disease, strokes, pneumonia, lung cancer, and sick building syndrome (SBS). The works with co-respiratory-cardiological association hold a key life-saving capacity [149,150,151,152]. Secondly, the manufacturing setup cost, involving the initial investment and scalability for mass production, significantly impacts the feasibility of widespread sensor deployment for health monitoring. Calibration cost, an essential factor in maintaining sensor accuracy, contributes to effective diagnosis. Adaptation cost considers modifications needed to accommodate changing environmental conditions, while the sampling rate upgrade cost influences the precision of data collection, measured in ppm. Networked sensing cost, associated with collaborative monitoring and real-time data sharing, plays a vital role in comprehensive health analysis. Finally, real-time air quality index (AQI) mapping cost contributes to the mapping and visualization of air quality data, aiding in disease trigger prediction. Each of these factors plays a nuanced role in ensuring the effective utilization of gas sensor technologies for respiratory disease diagnosis.

9. Future Recommendations and Research Directions

After reviewing existing works and future vision for the current challenges in this body of knowledge, the following can be looked at discretely for each technology:
  • In OGSs, the exploration of advanced materials such as chalcogenide glasses, perovskite nanocrystals, and quantum dots to enhance sensing performance is needed along with the investigation of novel photonic crystal architectures and fiber optic configurations for improved sensitivity and selectivity. Likewise, innovation in standardized testing methodologies such as EPA Method TO-15 and ASTM D6348 to ensure consistent sensor performance across diverse environments can be a future promise while ensuring focus on miniaturization techniques and biocompatible materials, like graphene derivatives, for healthcare applications.
  • For ECSs, novel investigation in nanomaterial-enabled ECS platforms with tailored electrode configurations for enhanced selectivity through the development of advanced signal processing techniques, such as cyclic voltammetry (CV) and impedance spectroscopy (EIS) for improved analytical capabilities, can be new horizons to explore. Additionally, the standardization of calibration methodologies using EPA Method 325 and ASTM D6245 to address complex gas matrices should be looked at from the perspective of the integration of metal–organic frameworks (MOFs) and zeolitic imidazolate frameworks (ZIFs) to enhance long-term stability.
  • The future challenges in potential research on CGSs can be overcome by researching dielectric materials such as metal oxides, perovskites, and two-dimensional materials like graphene and transition metal dichalcogenides (TMDs). This can be matured using gas-specific calibration methods based on EPA Method 25A and ASTM D7419, alongside humidity compensation strategies, while investigating flexible substrate materials such as polydimethylsiloxane (PDMS) derivatives for wearable applications. Furthermore, novel standardization testing protocols using ASTM D7419 and ISO 10156 to ensure accuracy and reliability can be improved.
  • The potential for scientific investigation into CMGSs can be explored using sensitive calorimetric materials such as noble metal nanostructures and metal–organic frameworks (MOFs) for enhanced detection capabilities to develop dynamic response kinetics through advanced signal processing algorithms and thermodynamic modeling frameworks. From the standardization aspect, analytical techniques like isothermal titration calorimetry (ITC) and differential scanning calorimetry (DSC) for quantitative analysis along with energy-efficient designs and materials to improve overall sensor performance and efficiency can be very promising.
  • In the niche of AGSs, much potential in investigating piezoelectric materials like lead zirconate titanate (PZT) and aluminum nitride (AlN) for enhanced acoustic wave propagation exists to develop gas discrimination methodologies using advanced algorithms such as principal component analysis (PCA) and neural networks. This can further be harnessed by employing standardized testing protocols like ASTM E2079 and ISO 11095 to ensure robust sensor performance in various environments. In addition, interdisciplinary approaches integrating complex materials, like carbon nanotube (CNT) composites and graphene-based heterostructures for improved sensitivity and selectivity, should be explored.

10. Conclusions

This comprehensive study delved into the crucial intersection of indoor air quality and respiratory health and aimed to address the challenge of diagnosing diseases associated with indoor respiration by establishing robust correlations between indoor air quality sensors and pertinent health outcomes. For quality investigation, six bibliometric analysis techniques were employed, thereby augmenting the precision, caliber, and thematic focus of the research. Through bibliometric evaluation, this review distilled salient insights from 152 scholarly articles, discerningly identifying relevant publications from authoritative sources such as the WHO, NIH, CDC, and US-EPA; this research methodology helped in the inclusion of articles that focused the scholarly investigation of this study. The impact of this work is evident in shedding light on the significant role of low-cost sensors, calibrated through advanced calibration systems, in tackling major respiratory diseases. These discerned findings not only enrich the scholarly discourse but also furnish invaluable insights for stakeholders spanning atmospheric science, public health, and environmental policy-making arenas. From end-users to governmental entities, this corpus of work facilitates informed decision making in sensing technologies; their capabilities, limitations, and calibration; and their relevance to respiratory concerns along with practical considerations in field practices in indoor air quality monitoring and management, along with future recommendations.

Author Contributions

Conceptualization, H.T.; data curation, H.T.; formal analysis, H.T.; funding acquisition, F.T., D.C. and A.B.M.; investigation, H.T.; methodology, H.T.; project administration, F.T.; resources, F.T., D.C. and A.B.M.; software, H.T.; supervision, F.T.; validation, H.T.; visualization, H.T.; writing—original draft, H.T.; writing—review and editing, F.T., D.C. and A.B.M. All authors have read and agreed to the published version of the manuscript.

Funding

This publication was made possible by NPRP grant # 10-0102-170094 from the Qatar National Research Fund (a member of Qatar Foundation).

Institutional Review Board Statement

Not applicable.

Informed Consent Statement

Not applicable.

Data Availability Statement

Not applicable.

Acknowledgments

This publication was made possible by NPRP grant # 10-0102-170094 from the Qatar National Research Fund (a member of Qatar Foundation). The authors would like to acknowledge the support of Prince Sultan University for paying part of the Article Processing Charges (APC) of this publication.

Conflicts of Interest

The authors declare no conflict of interest.

References

  1. WHO. Available online: https://platform.who.int/mortality/themes/theme-details/topics/topic-details/MDB/respiratory-diseases (accessed on 29 February 2024).
  2. Bruce, N.; Perez Padilla, R.; Albalak, R. Indoor air pollution in developing countries: A major environmental and public health challenge. Bull. World Health Organ. 2000, 78, 1078–1092. [Google Scholar] [PubMed]
  3. Hasselback, P.; Taylor, E. Air Quality Health Index Variation across British Columbia; British Columbia Ministry of Environment: Victoria, BC, Canada, 2010.
  4. NC. EPA-456/F-14-002; A Guide to Air Quality and Your Health. U.S. Environmental Protection Agency, Office of Air Quality Planning and Standards, Outreach and Information Division. Research Triangle Park: Washington, DC, USA, 2014.
  5. EPA-456/K-07-001; The Plain English Guide to the Clean Air Act. United States Office of Air Quality Planning and Standards, Environmental Protection Agency. Research Triangle Park: Washington, DC, USA, 2007.
  6. Xie, X.; Semanjski, I.; Gautama, S.; Tsiligianni, E.; Deligiannis, N.; Rajan, R.T.; Pasveer, F.; Philips, W. A Review of Urban Air Pollution Monitoring and Exposure Assessment Methods. ISPRS Int. J. Geo-Inf. 2017, 6, 389. [Google Scholar] [CrossRef]
  7. Thomas, J.M. Sir Humphry Davy and the coal miners of the world: A commentary on Davy (1816), ‘An account of an invention for giving light in explosive mixtures of fire-damp in coal mines’. Philos. Trans. A 2014, 373, 20140288. [Google Scholar] [CrossRef] [PubMed]
  8. Setiawan, A.; Friggieri, J.; Kennedy, E.M.; Dlugogorski, B.Z.; Stockenhuber, M. Catalytic combustion of ventilation air methane (VAM)—Long term catalyst stability in the presence of water vapour and mine dust. Catal. Sci. Technol. 2014, 4, 1793–1802. [Google Scholar] [CrossRef]
  9. Tariq, H.; Touati, F.; Crescini, D.; Mnaouer, A.B. IoT-Based Bi-Cluster Forecasting Using Automated ML-Model Optimization for COVID-19. Atmosphere 2023, 14, 534. [Google Scholar] [CrossRef]
  10. Ferrer-Cid, P.; Garcia-Calvete, J.; Main-Nadal, A.; Ye, Z.; Barcelo-Ordinas, J.M.; Garcia-Vidal, J. Sampling Trade-Offs in Duty-Cycled Systems for Air Quality Low-Cost Sensors. Sensors 2022, 22, 3964. [Google Scholar] [CrossRef]
  11. Turner, A.P. Biosensors—Sense and sensitivity. Science 2000, 290, 1315–1317. [Google Scholar] [CrossRef] [PubMed]
  12. Lee, T.M. Over-the-Counter Biosensors: Past, Present, and Future. Sensors 2008, 8, 5535–5559. [Google Scholar] [CrossRef]
  13. Rodriguez-Mozaz, S.; de Alda, M.J.L.; Barceló, D. Biosensors as Useful Tools for Environmental Analysis and Monitoring. Anal. Bioanal. Chem. 2006, 386, 1025–1041. [Google Scholar] [CrossRef]
  14. Allsop, T.; Neal, R.; Davies, E.M.; Mou, C.; Bond, P.; Rehman, S.; Kalli, K.; Webb, D.J.; Calverhouse, P.; Bennion, I. Low refractive index gas sensing using a surface plasmon resonance fibre device. Meas. Sci. Technol. 2010, 21, 094029. [Google Scholar] [CrossRef]
  15. World Health Organization. World Health Organisation: Data and Statistics; World Health Organization: Geneva, Switzerland, 2017.
  16. Gillis, D.; Semanjski, I.; Lauwers, D. How to Monitor Sustainable Mobility in Cities? Literature Review in the Frame of Creating a Set of Sustainable Mobility Indicators. Sustainability 2016, 8, 29. [Google Scholar] [CrossRef]
  17. Kanaroglou, P.S.; Jerrett, M.; Morrison, J.; Beckerman, B.; Arain, M.A.; Gilbert, N.L.; Brook, J.R. Establishing an air pollution monitoring network for intra-urban population exposure assessment: A location-allocation approach. Atmos. Environ. 2005, 39, 2399–2409. [Google Scholar] [CrossRef]
  18. Wang, M.; Zhu, T.; Zheng, J.; Zhang, R.Y.; Zhang, S.Q.; Xie, X.X.; Han, Y.Q.; Li, Y. Use of a mobile laboratory to evaluate changes in on-road air pollutants during the Beijing 2008 Summer Olympics. Atmos. Chem. Phys. 2009, 9, 8247–8263. [Google Scholar] [CrossRef]
  19. Amit, K. A review on Air Quality Indexing system. Asian J. Atmos. Environ. 2015, 9-2, 101–113. [Google Scholar]
  20. Bezuglaya, E.Y. Air Pollution Index and Interpretation of Measurements of Toxic Pollutant Concentrations. Atmos. Environ. 1993, 27, 773–779. [Google Scholar] [CrossRef]
  21. Yao, J.; Stieb, D.M.; Taylor, E.; Henderson, S.B. Assessment of the Air Quality Health Index (AQHI) and four alternate AQHI-Plus amendments for wildfire seasons in British Columbia. Can. J. Public Health 2020, 111, 96–106. [Google Scholar] [CrossRef] [PubMed]
  22. Yerramilli, A.; Dodla, V.B.R.; Yerramilli, S. Air Pollution, Modeling and GIS based Decision Support Systems for Air Quality Risk Assessment. In Advanced Air Pollution; IntechOpen: London, UK, 2011. [Google Scholar]
  23. Bozyazi, E.; Incecik, S.; Mannaerts, C.; Brussel, M. Analysis and mapping of air pollution using a GIS approach: A case study of Istanbul. Air Pollut. 2000, 42, 10. [Google Scholar]
  24. Kumar, A.; Gupta, I.; Brandt, J.; Kumar, R.; Dikshit, A.K.; Patil, R.S. Air quality mapping using GIS and economic evaluation of health impact for Mumbai City, India. J. Air Waste Manag. Assoc. 2016, 66, 470–481. [Google Scholar] [CrossRef] [PubMed]
  25. Dimitroulopoulou, S.; Dudzińska, M.R.; Gunnarsen, L.; Hägerhed, L.; Maula, H.; Singh, R.; Toyinbo, O.; Haverinen-Shaughnessy, U. Indoor air quality guidelines from across the world: An appraisal considering energy saving, health, productivity, and comfort. Environ. Int. 2023, 178, 108127. [Google Scholar] [CrossRef]
  26. Abdul-Wahab, S.A.; En, S.C.F.; Elkamel, A.; Ahmadi, L.; Yetilmezsoy, K. A review of standards and guidelines set by international bodies for the parameters of indoor air quality. Atmos. Pollut. Res. 2015, 6, 751–767. [Google Scholar] [CrossRef]
  27. Wei, G.; Yu, X.; Fang, L.; Wang, Q.; Tanaka, T.; Amano, K.; Yang, X. A review and comparison of the indoor air quality requirements in selected building standards and certifications. Build. Environ. 2022, 226, 109709. [Google Scholar] [CrossRef]
  28. IEA; IRENA; UNSD; WB; WHO. Tracking SDG 7: The Energy Progress Report 2019; International Bank for Reconstruction and Development, The World Bank: Washington, DC, USA, 2019.
  29. Smith, K.R.; Samet, J.M.; Romieu, I.; Bruce, N. Indoor air pollution in developing countries and acute lower respiratory infections in children. Thorax 2000, 55, 518–532. [Google Scholar] [CrossRef]
  30. World Health Organization. Global Health Risks: Mortality and Burden of Diseases Attributable to Selected Major Risks; World Health Organization: Geneva, Switzerland, 2014.
  31. Parajuli, I.; Lee, H.; Shrestha, K.R. Indoor air quality and ventilation assessment of rural mountainous households of Nepal. Int. J. Sustain. Built Environ. 2016, 5, 301–311. [Google Scholar] [CrossRef]
  32. Wendling, Z.A.; Zomer, A. Environmental Performance Index; Yale Center for Environmental Law & Policy: New Haven, CT, USA, 2018. [Google Scholar]
  33. World Health Organization. Air Quality Guidelines for Particulate Matter, Ozone, Nitrogen Dioxide and Sulfur Dioxide: Global Update 2005. Summary of Risk Assessment; World Health Organization: Geneva, Switzerland, 2005.
  34. Lewis, A.; Edwards, P. Validate personal air-pollution sensors. Nature 2016, 535, 29–31. [Google Scholar] [CrossRef] [PubMed]
  35. Sicard, P.; Lesne, O.; Alexandre, N.; Mangin, A.; Collomp, R. Air quality trends and potential health effects—Development of an aggregate risk index. Atmos. Environ. 2011, 45, 1145–1153. [Google Scholar] [CrossRef]
  36. Elen, B.; Peters, J.; Van Poppel, M.; Bleux, N.; Theunis, J.; Reggente, M.; Standaert, A. The Aeroflex: A Bicycle for Mobile Air Quality Measurements. Sensors 2012, 13, 221–240. [Google Scholar] [CrossRef] [PubMed]
  37. Cannistraro, G.; Ponterio, L. Analysis of Air Quality in the Outdoor Environment of the City of Messina by an Application of the Pollution Index Method. Int. J. Civ. Environ. Eng. 2009, 3, 262–268. [Google Scholar]
  38. Cincinelli, A.; Martellini, T. Indoor air quality and health. Int. J. Environ. Res. Public Health 2017, 14, 1286. [Google Scholar] [CrossRef] [PubMed]
  39. Haq, G.; Schwela, D. (Eds.) A Strategic Framework for Air Quality Management in Asia; Technical Report; Stockholm Environment Institute: Stockholm, Sweden, 2004; ISBN 89-8464-095-6. [Google Scholar]
  40. Haq, G.; Schwela, D.; David, L. (Eds.) Foundation Course on Air Quality Management in Asia; SEI: Oaks, PA, USA, 2008. [Google Scholar]
  41. Naess, L. Clean Air Act Advisory Committee Meeting; OAQPS: Washington, DC, USA, 2008.
  42. Vitolo, C.; Scutari, M.; Ghalaieny, M.; Tucker, A.; Russell, A. Modeling Air Pollution, Climate, and Health Data Using Bayesian Networks: A Case Study of the English Regions. Earth Space Sci. 2018, 5, 76–88. [Google Scholar] [CrossRef]
  43. Sivertsen, B.; Bartonov, A. Air Quality Management Planning (AMQP). Chem. Ind. Chem. Eng. Q. 2012, 18, 667–674. [Google Scholar] [CrossRef]
  44. Larssen, S.; Gram, F.; Haugsbakk, I. URBAIR. Urban air quality management strategy in Asia. In Kathmandu Valley City Specific Report; NILU Kjeller: Kjeller, Norway, 1995. [Google Scholar]
  45. Dimitroulopoulou, C.; MAshmore, R.; Hill, M.T.R.; Byrne, M.A.; Kinnersley, R. INDAIR: A probabilistic model of indoor air pollution in UK homes. Atmos. Environ. 2006, 40, 6362–6379. [Google Scholar] [CrossRef]
  46. Mohammadi, M.; Calautit, J. Quantifying the Transmission of Outdoor Pollutants into the Indoor Environment and Vice Versa—Review of Influencing Factors, Methods, Challenges and Future Direction. Sustainability 2022, 14, 10880. [Google Scholar] [CrossRef]
  47. Karagulian, F.; Gerboles, M.; Barbiere, M.; Kotsev, A.; Lagler, F.; Borowiak, A. Review of Sensors for Air Quality Monitoring; Joint Research Centre (JRC) Technical Reports; JRC Publications Repository: Longitude, Belgium, 2019. [Google Scholar]
  48. Alexandre, M.; Gerboles, M. Review of small commercial sensors for indicative monitoring of ambient gas. Chem. Eng. Trans. 2012, 30, 169–174. [Google Scholar]
  49. Castell, N.; Dauge, F.R.; Schneider, P.; Vogt, M.; Lerner, U.; Fishbain, B.; Broday, D.; Bartonova, A. Can commercial low-cost sensor platforms contribute to air quality monitoring and exposure estimates? Environ. Int. 2017, 99, 293–302. [Google Scholar] [CrossRef] [PubMed]
  50. Jha, R.K. Non-Dispersive Infrared Gas Sensing Technology: A Review. IEEE Sens. J. 2022, 22, 6–15. [Google Scholar] [CrossRef]
  51. Yoo, K.S. Gas Sensors for Monitoring Air Pollution. In Monitoring, Control and Effects of Air Pollution; IntechOpen: London, UK, 2011. [Google Scholar] [CrossRef]
  52. Huang, C.M.; Liu, Y.-J.; Hsieh, Y.-J.; Lai, W.-L.; Juan, C.-Y.; Chen, S.-Y.; Yang, C.-C.; Wu, C.-M. A multi-gas sensing system for air quality monitoring. In Proceedings of the 2018 IEEE International Conference on Applied System Invention, Chiba, Japan, 13–17 April 2018. [Google Scholar]
  53. Nasir, Z.A. Environmental Health in Built Environments. In Aerosol Science: Technology and Applications; John Wiley & Sons, Ltd.: Hoboken, NJ, USA, 2013. [Google Scholar] [CrossRef]
  54. Kawasaki, H.; Ueda, T.; Suda, Y.; Ohshima, T. Optical Emission Spectroscopy of Low-Discharge-Power Magnetron Sputtering Plasmas Using Pure Tungsten Target. Sens. Actuators B 2004, 49, 08JF04. [Google Scholar]
  55. Yasmeen, R.; Ali, Z.; Tyrrel, S.; Nasir, Z.A. Assessment of Respiratory Problems in Workers Associated with Intensive Poultry Facilities in Pakistan. Saf. Health Work 2020, 11, 118–124. [Google Scholar] [CrossRef] [PubMed]
  56. Hodgkinson, J.; Tatam, R.P. Optical gas sensing: A review. Meas. Sci. Technol. 2013, 24, 012004. [Google Scholar] [CrossRef]
  57. Bakker, E.; Telting-Diaz, M. Electrochemical Sensors. Anal. Chem. 2004, 74, 2781–2800. [Google Scholar] [CrossRef]
  58. Cretescu, I.; Lutic, D.; Manea, L.R. Electrochemical Sensors for Monitoring of Indoor and Outdoor Air Pollution; IntechOpen: London, UK, 2017. [Google Scholar]
  59. Tierney, M.J.; Kim, H.O.L. Electrochemical gas sensor with extremely fast response times. Anal. Chem. 1993, 65, 3435–3440. [Google Scholar] [CrossRef]
  60. Park, C.O.; Fergus, J.W.; Miura, M.; Park, J.; Choi, A. Solid-state electrochemical gas sensors. Ionics 2009, 12, 107–119. [Google Scholar] [CrossRef]
  61. Ishihara, T.; Matsubara, S. Capacitive Type Gas Sensors. J. Electroceram. 1998, 2, 215–228. [Google Scholar] [CrossRef]
  62. Schoeneberg, U.; Hosticka, B.; Zimmer, G.; Maclay, G. A novel readout technique for capacitive gas sensors. Sens. Actuators B Chem. 1990, 1, 58–61. [Google Scholar] [CrossRef]
  63. Briand, D.; Colin, S.; Courbat, J.; Raible, S.; Kappler, J.; Derooij, N. Integration of MOX gas sensors on polyimide hotplates. Sens. Actuators B Chem. 2008, 130, 430–435. [Google Scholar] [CrossRef]
  64. Amirola, J.; Rodiguez, A.; Castaner, L. Design fabrication and test of micromachined-silicon capacitive gas sensors with integrated readout. Proc. Smart Sens. Actuators MEMS 2003, 5116, 92–99. [Google Scholar]
  65. Oberländer, J.; Kirchner, P.; Boyen, H.; Schöning, M.J. Detection of hydrogen peroxide vapor by use of manganese (IV) oxide as catalyst for calorimetric gas sensors. Phys. Status Solidi (A) Appl. Mater. 2014, 211, 1372–1376. [Google Scholar] [CrossRef]
  66. Riegel, J.; Härdt, K.H. Analysis of combustible gases in air with calorimetric gas sensors based on semiconducting BaTiO3 ceramics. Sens. Actuators B Chem. 1990, 1, 54–57. [Google Scholar] [CrossRef]
  67. Kirchner, P.; Oberländer, J.; Friedrich, P.; Berger, J.; Rysstad, G.; Keusgen, M.; Schöning, M.J. Realization of a calorimetric gas sensor on polyimide foil for applications in aseptic food industry. Sens. Actuators B Chem. 2012, 5, 264–267. [Google Scholar] [CrossRef]
  68. Liu, X.; Wang, W.; Zhang, Y.; Pan, Y.; Liang, Y.; Li, J. Enhanced Sensitivity of a Hydrogen Sulfide Sensor Based on Surface Acoustic Waves at Room Temperature. Sensors 2018, 18, 3796. [Google Scholar] [CrossRef]
  69. Macías, M.M.; Agudo, J.E.; Manso, A.G.; Orellana, C.J.G.; Velasco, H.M.G.; Caballero, R.G. A Compact and Low Cost Electronic Nose for Aroma Detection. Sensors 2013, 13, 5528–5541. [Google Scholar] [CrossRef]
  70. Shahid, A.; Choi, J.-H.; Rana, A.U.H.S.; Kim, H.-S. Least Squares Neural Network-Based Wireless E-Nose System Using an SnO2 Sensor Array. Sensors 2018, 18, 1446. [Google Scholar] [CrossRef] [PubMed]
  71. Fahad, H.M.; Shiraki, H.; Amani, M.; Zhang, C.; Hebbar, V.S.; Gao, W.; Javey, A. Room temperature multiplexed gas sensing using chemical-sensitive 3.5-nm-thin silicon transistors. Sci. Adv. 2017, 3, e1602557. [Google Scholar] [CrossRef]
  72. Prasad, P.; Raut, P.; Goel, S.; Barnwal, R.P.; Bodhe, G.L. Electronic nose and wireless sensor network for environmental monitoring application in pulp and paper industry: A review. Environ. Monit. Assess 2022, 194, 855. [Google Scholar] [CrossRef] [PubMed]
  73. Yan, J.; Tian, F.; Feng, J.; Jia, P.; He, Q.; Shen, Y. A PSO-SVM Method for Parameters and Sensor Array Optimization in Wound Infection Detection based on Electronic Nose. J. Comput. Phys. 2012, 7, 2663–2670. [Google Scholar] [CrossRef]
  74. Hung, C.M.; Le, D.T.T.; Van Hieu, N. On-chip growth of semiconductor metal oxide nanowires for gas sensors: A review. J. Sci. Adv. Mater. Devices 2017, 2, 263–285. [Google Scholar] [CrossRef]
  75. Gäbel, P.; Koller, C.; Hertig, E. Development of Air Quality Boxes Based on Low-Cost Sensor Technology for Ambient Air Quality Monitoring. Sensors 2022, 22, 3830. [Google Scholar] [CrossRef] [PubMed]
  76. Prajapati, C.S.; Soman, R.; Rudraswamy, S.B.; Nayak, M.; Bhat, N. Single Chip Gas Sensor Array for Air Quality Monitoring. IEEE J. Microelectromech. Syst. 2017, 26, 433–439. [Google Scholar] [CrossRef]
  77. Zhang, Y.-G.; Tian, Z.-B.; Zhang, X.-J.; Gu, Y.; Li, A.-Z.; Zhu, X.-R.; Zheng, Y.-L.; Liu, S. An Innovative Gas Sensor with On-Chip Reference Using Monolithic Twin Laser. Chin. Phys. Lett. 2017, 24, 2839. [Google Scholar]
  78. Zhang, G.; Zhang, S.; Yang, L.; Zou, Z.; Zeng, D.; Xie, C. La2O3-sensitized SnO2 nanocrystalline porous film gas sensors and sensing mechanism toward formaldehyde. Sens. Actuators B Chem. 2013, 188, 137–146. [Google Scholar] [CrossRef]
  79. Liu, X.; Cheng, S.; Liu, H.; Hu, S.; Zhang, D.; Ning, H. A Survey on Gas Sensing Technology. Sensors 2012, 12, 9635–9665. [Google Scholar] [CrossRef]
  80. Casey, J.G.; Hannigan, M.P. Testing the performance of field calibration techniques for low-cost gas sensors in new deployment locations: Across a county line and across Colorado. Atmos. Meas. Tech. 2018, 11, 6351–6378. [Google Scholar] [CrossRef]
  81. Leidinger, M.; Schultealbert, C.; Neu, J.; Schuetze, A.; Sauerwald, T. Characterization and calibration of gas sensor systems at ppb level—A versatile test gas generation system. Meas. Sci. Technol. 2017, 29, 015901. [Google Scholar] [CrossRef]
  82. Chen, Y.; Yu, J.; He, A.; Tang, Z.-A. A Method for Selecting Optimal Number of Sensors to Improve the Credibility. J. Sens. 2016, 2016, 8914769. [Google Scholar] [CrossRef]
  83. Fonollosa, J.; Rodríguez-Luján, I.; Huerta, R. Chemical gas sensor array dataset. Data Brief 2015, 3, 85–89. [Google Scholar] [CrossRef] [PubMed]
  84. Benammar, M.A.; Ahmad, S.H.M.; Abdaoui, A.; Tariq, H.; Touati, F.; Al-Hitmi, M.; Crescini, D. A Smart Rig for Calibration of Gas Sensor Nodes. Sensors 2020, 20, 2341. [Google Scholar] [CrossRef] [PubMed]
  85. Maag, B.; Zhou, Z.; Thiele, L. A Survey on Sensor Calibration in Air Pollution Monitoring Deployments. IEEE Internet Things J. 2018, 5, 4857–4870. [Google Scholar] [CrossRef]
  86. Spinelle, L.; Gerboles, M.; Villani, M.G.; Aleixandre, M.; Bonavitacola, F. Field calibration of a cluster of low-cost available sensors for air quality monitoring. Part A: Ozone and nitrogen dioxide. Sens. Actuators B Chem. 2015, 215, 249–257. [Google Scholar] [CrossRef]
  87. Mijling, B.; Jiang, Q.; de Jonge, D.; Bocconi, S. Field calibration of electrochemical NO2 sensors in a citizen science context. Atmos. Meas. Technol. 2018, 11, 1297–1312. [Google Scholar] [CrossRef]
  88. Hagan, D.H.; Isaacman-VanWertz, G.; Franklin, J.P.; Wallace, L.M.M.; Kocar, B.D.; Heald, C.L.; Kroll, J.H. Calibration and assessment of electrochemical air quality sensors by co-location with regulatory-grade instruments. J. Atmos. Meas. Technol. 2018, 11, 315–328. [Google Scholar] [CrossRef]
  89. Hasenfratz, D.; Saukh, O.; Thiele, L. On-the-fly calibration of low-cost gas sensors. In Proceedings of the 9th European Conference on Wireless Sensor Networks, Trento, Italy, 15–17 February 2012; pp. 228–244. [Google Scholar]
  90. Yang, F.; Geng, Z.; Koneru, A.; Zhi, M.; Li, H.; Wu, N. Dynamic calibration of electrochemical sensor for accelerated analytic quantification. IEEE Sens. J. 2012, 13, 1192–1199. [Google Scholar] [CrossRef]
  91. Tian, B.; Hou, K.M.; Diao, X.; Shi, H.; Zhou, H.; Wang, W. Environment-Adaptive Calibration System for Outdoor Low-Cost Electrochemical Gas Sensors. IEEE Access 2019, 7, 62592–62605. [Google Scholar] [CrossRef]
  92. Sayahi, T.; Kaufman, D.; Becnel, T.; Kaur, K.; Butterfield, A.; Collingwood, S.; Zhang, Y.; Gaillardon, P.-E.; Kelly, K. Development of a calibration chamber to evaluate the performance of low-cost particulate matter sensors. Environ. Pollut. 2019, 255, 113131. [Google Scholar] [CrossRef] [PubMed]
  93. Asghar, U.; Touati, F.; Crescini, D.; Galli, A.; Mnaouer, A.B. Development of Highly Efficient Multi-variable Wireless Sensor System Design for Energy Harvesting. arXiv 2018, arXiv:1802.05755. [Google Scholar]
  94. Luo, H.; Li, W.; Wu, X. Design of indoor air quality monitoring system based on wireless sensor network. Int. Wirel. Commun. Mob. Comput. Conf. 2019, 208, 012070. [Google Scholar] [CrossRef]
  95. Al-Ali, A.R.; Zualkernan, I.; Aloul, F. A Mobile GPRS-Sensors Array for Air Pollution Monitoring. IEEE Sens. J. 2010, 10, 1666–1671. [Google Scholar] [CrossRef]
  96. Penza, M.; Suriano, D.; Pfister, V.; Prato, M.; Cassano, G. Urban Air Quality Monitoring with Networked Low-Cost Sensor-Systems. Eurosensors 2017, 1, 573. [Google Scholar]
  97. Touati, F.; Legena, C.; Galli, A.; Crescini, D.; Crescini, P.; Mnaouer, A.B. Environmentally Powered Multiparametric Wireless Sensor Node for Air Quality Diagnostic. Sens. Mater. 2015, 27, 177–189. [Google Scholar]
  98. Kang, J.; Hwang, K.-I. A Comprehensive Real-Time Indoor Air-Quality Level Indicator. Sustainability 2016, 8, 881. [Google Scholar] [CrossRef]
  99. Abdaoui, A.; Touati, F.; Tariq, H.; Manouer, A.B. A Smart Rig for Calibration of Gas Sensor Nodes: Test and Deployment. In Proceedings of the 2020 IEEE International Conference on Design & Test of Integrated Micro & Nano-Systems (DTS), Hammamet, Tunisia, 7–10 June 2020; pp. 1–6. [Google Scholar] [CrossRef]
  100. Tariq, H.; Abdaoui, A.; Touati, F.; Al-Hitmi, M.A.; Crescini, D.; Mnaouer, A.B. An Autonomous Multi-Variable Outdoor Air Quality Mapping Wireless Sensors IoT Node for Qatar. In Proceedings of the 2020 International Wireless Communications and Mobile Computing (IWCMC), Limassol, Cyprus, 15–19 June 2020; pp. 2164–2169. [Google Scholar] [CrossRef]
  101. Tariq, H.; Abdaoui, A.; Touati, F.; Al-Hitmi, M.A.; Crescini, D.; Manouer, A.B. A Real-time Gradient Aware Multi-Variable Handheld Urban Scale Air Quality Mapping IoT System. In Proceedings of the 2020 IEEE International Conference on Design & Test of Integrated Micro & Nano-Systems (DTS), Hammamet, Tunisia, 7–10 June 2020; pp. 1–5. [Google Scholar] [CrossRef]
  102. Abdaoui, A.; Ahmad, S.H.; Tariq, H.; Touati, F.; Mnaouer, A.B.; Al-Hitmi, M. Energy Efficient Real-time Outdoor Air Quality Monitoring. In Proceedings of the 2020 International Wireless Communications and Mobile Computing (IWCMC), Limassol, Cyprus, 15–19 June 2020; pp. 2170–2176. [Google Scholar] [CrossRef]
  103. Allen, G. The Role of PM and Ozone Sensor Testing/Certification Programs. Available online: https://www.epa.gov/sites/production/files/session_07_b_allen.pdf (accessed on 12 March 2020).
  104. Smith, K.R.; Edwards, P.M.; Evans, M.J.; Lee, J.D.; Shaw, M.D.; Squires, F.; Wilde, S.; Lewis, A.C. Clustering approaches to improve the performance of low cost air pollution sensors. Faraday Discuss. 2017, 200, 621–637. [Google Scholar] [CrossRef]
  105. Hvidtfeldt, U.A.; Ketzel, M.; Sørensen, M.; Hertel, O.; Khan, J.; Brandt, J.; Raaschou-Nielsen, O. Evaluation of the Danish AirGIS air pollution modeling system against measured concentrations of PM2.5, PM10, and black carbon. Environ. Epidemiol. 2018, 2, e014. [Google Scholar]
  106. The EPA Village Green. Available online: https://archive.epa.gov/epa/air-research/village-green-project.html (accessed on 6 October 2020).
  107. Jiao, W.; Hagler, G.S.W.; Williams, R.W.; Sharpe, R.N.; Weinstock, L.; Rice, J. Field assessment of the village green project: An autonomous community air quality monitoring system. Environ. Sci. Technol. 2015, 49, 6085–6092. [Google Scholar] [CrossRef] [PubMed]
  108. EC WG, Guide to the Demonstration of Equivalence of Ambient Air Monitoring Methods, Report by EC Working Group on Guidance. 2010. Available online: http://ec.europa.eu/environment/air/quality/legislation/pdf/equivalence.pdf (accessed on 6 October 2020).
  109. D’Amico, A.; Di Natale, C. A contribution on some basic definitions of sensors properties. IEEE Sens. J. 2001, 1, 183–190. [Google Scholar] [CrossRef]
  110. Heimann, I.; Bright, V.; McLeod, M.; Mead, M.; Popoola, O.; Stewart, G.; Jones, R. Source attribution of air pollution by spatial scale separation using high spatial density networks of low cost air quality sensors. Atmos. Environ. 2015, 113, 10–19. [Google Scholar] [CrossRef]
  111. Spinelle, L.; Aleixandre, M.; Gerboles, M. Protocol of Evaluation and Calibration of Low-Cost Gas Sensors for the Monitoring of Air Pollution; EUR 26112EN; Publications Office of the European Union: Luxembourg, 2013. [Google Scholar]
  112. Viana, M.; Rivas, I.; Reche, C.; Fonseca, A.; Pérez, N.; Querol, X.; Alastuey, A.; Álvarez-Pedrerol, M.; Sunyer, J. Field comparison of portable and stationary instruments for outdoor urban air exposure assessments. Atmos. Environ. 2013, 123, 220–228. [Google Scholar] [CrossRef]
  113. European Environment Agency. Air Quality in Europe 2013 Report; EEA Report. No. 9/2013; European Environment Agency: Copenhagen, Denmark, 2013; 112p.
  114. European Environment Agency. Air Quality in Europe 2014 Report; EEA Report. No. 5/2014; European Environment Agency: Copenhagen, Denmark, 2014; 80p.
  115. Zhu, W.; Wang, J.; Zhang, W.; Sun, D. Short-term effects of air pollution on lower respiratory diseases and forecasting by the group method of data handling. Atmos. Environ. 2012, 51, 29–38. [Google Scholar] [CrossRef]
  116. Zhang, X.; Wargocki, P.; Lian, Z.; Thyregod, C. Effects of exposure to carbon dioxide and bioeffluents on perceived air quality, self-assessed acute health symptoms and cognitive performance. Indoor Air 2017, 27, 47–64. [Google Scholar] [CrossRef]
  117. Smith, R.L.; Kolenikov, S.; Cox, L.H. Spatiotemporal modeling of PM2.5 data with missing values. J. Geophys. Res. Atmos. 2003, 108, 9004. [Google Scholar] [CrossRef]
  118. Persily, A.; de Jonge, L. Carbon dioxide generation rates for building occupants. Indoor Air 2017, 27, 868–879. [Google Scholar] [CrossRef]
  119. Ramalho, O.; Wyart, G.; Mandin, C.; Blondeau, P.; Cabanes, P.-A.; Leclerc, N.; Mullot, J.-U.; Boulanger, G.; Redaelli, M. Association of carbon dioxide with indoor air pollutants andexceedance of health guideline values. Build. Environ. 2015, 93, 115–124. [Google Scholar] [CrossRef]
  120. ANSI/ASHRAE Standard 62.1-2013; Ventilation for Acceptable Indoor Air Quality. American Society of Heating, Refrigerating and Air-Conditioning Engineers, Inc.: Atlanta, GA, USA, 2013.
  121. Azuma, K.; Kagi, N.; Yanagi, U.; Osawa, H. Effects of low-level inhalation exposure to carbon dioxide in indoor environments: A short review on human health and psychomotor performance. Environ. Int. 2018, 121, 51–56. [Google Scholar] [CrossRef]
  122. Ritter, M.; Müller, M.D.; Tsai, M.-Y.; Parlow, E. Air pollution modeling over very complex terrain: An evaluation of WRF-Chem over Switzerland for two 1-year periods. Atmos. Res. 2013, 132–133, 209–222. [Google Scholar] [CrossRef]
  123. Baklanov, A. Application of CFD Methods for Modelling in Air Pollution Problems: Possibilities and Gaps. Environ. Monit. Assess 2000, 65, 181–189. [Google Scholar] [CrossRef]
  124. Chen, J.; Chen, H.; Wu, Z.; Hu, D.; Pan, J.Z. Forecasting smog-related health hazard based on social media and physical sensor. Inf. Syst. 2017, 64, 281–291. [Google Scholar] [CrossRef] [PubMed]
  125. Shimadera, H.; Kojima, T.; Kondo, A. Evaluation of Air Quality Model Performance for Simulating Long-Range Transport and Local Pollution of PM2.5 in Japan. Adv. Meteorol. 2016, 2016, 5694251. [Google Scholar] [CrossRef]
  126. World Health Organization. International Programme on Chemical Safety. Carbon Monoxide; World Health Organization: Geneva, Switzerland, 1999.
  127. Nhung, N.T.T.; Amini, H.; Schindler, C.; Joss, M.K.; Dien, T.M.; Probst-Hensch, N.; Perez, L.; Künzli, N. Short-term association between ambient air pollution and pneumonia in children: A systematic review and meta-analysis of time-series and case-crossover studies. Environ. Pollut. 2017, 230, 1000–1008. [Google Scholar] [CrossRef] [PubMed]
  128. Martínez-España, R.; Bueno-Crespo, A.; Timon-Perez, I.M.; Soto, J.A.; Munoz, A.; Cecilia, J.M. Air-pollution prediction in smart cities through machine learning methods: A case of study in Murcia, Spain. J. Univ. Comput. Sci. 2018, 24, 261–276. [Google Scholar]
  129. Kleine Deters, J.; Zalakeviciute, R.; Gonzalez, M.; Rybarczyk, Y. Modeling PM2.5 Urban Pollution Using Machine Learning and Selected Meteorological Parameters. J. Electr. Comput. Eng. 2017, 2017, 5106045. [Google Scholar] [CrossRef]
  130. Carnevale, C.; Finzi, G.; Pederzoli, A.; Turrini, E.; Volta, M. Lazy Learning based surrogate models for air quality planning. Environ. Model. Softw. 2016, 83, 47–57. [Google Scholar] [CrossRef]
  131. Gacquer, D.; Delcroix, V.; Delmotte, F.; Piechowiak, S. Comparative study of supervised classification algorithms for the detection of atmospheric pollution. Eng. Appl. Artif. Intell. 2011, 24, 1070–1083. [Google Scholar] [CrossRef]
  132. Raub, J.A.; Mathieu-Nolf, M.; Hampson, N.B.; Thom, S.R. Carbon monoxide poisoning–A public health perspective. Toxicology 2000, 145, 1–14. [Google Scholar] [CrossRef]
  133. Rybarczyk, Y.; Zalakeviciute, R. Machine Learning Approaches for Outdoor Air Quality Modelling: A Systematic Review. Appl. Sci. 2018, 8, 2570. [Google Scholar] [CrossRef]
  134. Lu, W.Z.; Wang, W.J. Potential assessment of the ‘support vector’ machine method in forecasting ambient air pollution trends. Chemosphere 2015, 59, 693–701. [Google Scholar] [CrossRef]
  135. Luecken, D.; Hutzell, W.; Gipson, G. Development and analysis of air quality modeling simulations for hazardous air pollutants. Atmos. Environ. 2006, 40, 5087–5096. [Google Scholar] [CrossRef]
  136. Emmerich, S.J.; Persily, A.K. State-of-the-Art Review of CO2 Demand Controlled Ventilation Technology and Application; Diane Publishing: Darby, PA, USA, 2003; p. 43. [Google Scholar]
  137. Nguyen, D.L. A brief review of air quality models and their applications. Open J. Atmos. Clim. Chang. 2014, 1, 60–80. [Google Scholar]
  138. Nordiska, M. Interaction between Climate Change, Air Pollution and Related Impacts; Nordie Council of Ministers: Copenhagen, Denmark, 2014; ISBN 978-92-893-1791-7. [Google Scholar]
  139. R Foundation for Statistical Computing. R Development Core: A Language and Environment for Statistical Computing; R Foundation for Statistical Computing: Vienna, Austria, 2001; ISBN 3-900051-07-0. [Google Scholar]
  140. Roadknight, C.M.; Balls, G.R.; Mills, G.E.; Palmer-Brown, D. Modeling complex environmental data. IEEE Trans. Neural Netw. 1997, 8, 852–862. [Google Scholar] [CrossRef]
  141. Walter, A.; Denhard, M.; Schönwiese, C.D. Simulation of global and hemispheric temperature variations and signal detection studies using neural networks. Meteorol. Z. 1998, 7, 171–180. [Google Scholar] [CrossRef]
  142. Wang, W.; Xu, Z.; Lu, J.W. Three improved neural network models for air quality forecasting. Eng. Comput. 2003, 20, 192–210. [Google Scholar] [CrossRef]
  143. Thurston, G.D.; Spengler, J.D. A quantitative assessment of source contributions to inhalable particulate matter pollution in metropolitan Boston. Atmos. Environ. 1985, 19, 9–25. [Google Scholar] [CrossRef]
  144. Lary, D.J.; Lary, T.; Sattler, B. Using machine learning to estimate global PM2.5 for environmental health studies. Environ. Health Insights 2015, 9, EHI-S15664. [Google Scholar] [CrossRef]
  145. Jiang, W.; Wang, Y.; Tsou, M.H.; Fu, X. Using social media to detect outdoor air pollution and monitor air quality index (AQI): A geo-targeted spatiotemporal analysis framework with Sina Weibo (Chinese twitter). PLoS ONE 2015, 10, e0141185. [Google Scholar] [CrossRef]
  146. Ye, Y.; Squartini, S.; Piazza, F. Online sequential extreme learning machine in nonstationary environments. Neurocomputing 2013, 116, 94–101. [Google Scholar] [CrossRef]
  147. Simpson, R.W. A statistical analysis of particulate data sets in Brisbane, Australia. Atmos. Environ. Part B Urban Atmos. 1992, 26, 99–105. [Google Scholar] [CrossRef]
  148. Tariq, H.; Alsageer, M.; Khattab, T.; Touati, F. Autonomous SkyCube Testbench using UAV-Assisted Ka-Band OFDM Transceiver. In Proceedings of the International Wireless Communications and Mobile Computing (IWCMC), Marrakesh, Morocco, 19–23 June 2023; pp. 780–785. [Google Scholar] [CrossRef]
  149. Han, P.; Mei, H.; Liu, D.; Zeng, N.; Tang, X.; Wang, Y.; Pan, Y. Calibrations of Low-Cost Air Pollution Monitoring Sensors for CO, NO2, O3, and SO2. Sensors 2021, 21, 256. [Google Scholar] [CrossRef] [PubMed]
  150. Tariq, H.; Shafaq, S. Real-time Contactless Bio-Sensors and Systems for Smart Healthcare using IoT and E-Health Applications. WSEAS Trans. Biol. Biomed. 2022, 19, 91–106. [Google Scholar] [CrossRef]
  151. Bauerová, P.; Šindelářová, A.; Rychlík, Š.; Novák, Z.; Keder, J. Low-Cost Air Quality Sensors: One-Year Field Comparative Measurement of Different Gas Sensors and Particle Counters with Reference Monitors at Tušimice Observatory. Atmosphere 2020, 11, 492. [Google Scholar] [CrossRef]
  152. Tariq, H.; Abdaoui, A.; Touati, F.; Al-Hitmi, M.A.E.; Crescini, D.; Mnaouer, A.B. Real-time Gradient-Aware Indigenous AQI Estimation IoT Platform. Adv. Sci. Technol. Eng. Syst. J. 2020, 5, 1666–1673. [Google Scholar] [CrossRef]
Figure 1. Indoor respiration-assisted disease-focused systematic review hierarchy [1,2,3,4,5,6,7,8,9,10,11,12,13,14,15,16,17,18,19,20,21,22,23,24,25,26,27,28,29,30,31,32,33,34,35,36,37,38,39,40,41,42,43,44,45,46,47,48,49,50,51,52,53,54,55,56,57,58,59,60,61,62,63,64,65,66,67,68,69,70,71,72,73,74,75,76,77,78,79,80,81,82,83,84,85,86,87,88,89,90,91,92,93,94,95,96,97,98,99,100,101,102,103,104,105,106,107,108,109,110,111,112,113,114,115,116,117,118,119,120,121,122,123,124,125,126,127,128,129,130,131,132,133,134,135,136,137,138,139,140,141,142,143,144,145,146,147,148,149,150,151,152].
Atmosphere 15 00471 g001
Figure 2. PRISMA diagram of workflow for inclusion of articles based on literature search and their applied exclusion criteria to scope in the focus of sensors and respiratory diseases.
Atmosphere 15 00471 g002
Figure 3. Statistical bibliometric indices for IAQ and indoor epidemiological relationship and public health baseline: (a) Lorenz Curve of Citations; (b) Hirch’s H-Index; (c) Kosmulski’s H2-Index; (d) Harzing’s Hl-Norm-Index; (e) Sidoropolous’s HC-Index; and (f) Schrieber’s HM-index.
Atmosphere 15 00471 g003
Figure 4. Summary of global institutional guidelines for indoor pollutant exposure limits as per WHO IAQ 2010, US EPA, ASHRAE, NIH, and CEN Indoor Air Quality Standards, Standards for IAQ GB/T 18883-2022 and ISIAQ STC34 Data.
Atmosphere 15 00471 g004
Figure 5. Two fundamental approaches in real-time AQMap [26,27,28,29,30,31,32]. (a) Real-time indoor air quality mapping. (b) Real-time outdoor air quality mapping [33,34].
Atmosphere 15 00471 g005
Figure 6. Two-step AQMP methodology practices in AQM [36,37,38,39,40,41,42] (a) Air quality modelling [36]. (b) Air quality management implementation scheme [37,38].
Atmosphere 15 00471 g006
Figure 7. Five respiratory disease-relevant approaches in AQ gas sensor technologies [49].
Atmosphere 15 00471 g007
Figure 8. Overview of OGS [50,53]. (a) Architecture. (b) Working principle.
Atmosphere 15 00471 g008
Figure 9. Overview of NDIR-GS [55,56] (a) Architecture. (b) Working principle.
Atmosphere 15 00471 g009
Figure 10. Overview of ECS [56,57,58] (a) Architecture. (b) Working principle.
Atmosphere 15 00471 g010
Figure 11. Overview of CGS [62]. (a) Architecture. (b) Working principle.
Atmosphere 15 00471 g011
Figure 12. Overview of CMGS [63,64,65]. (a) Architecture. (b) Working principle.
Atmosphere 15 00471 g012
Figure 13. Overview of AGS [66,67]. (a) Architecture. (b) Working principle.
Atmosphere 15 00471 g013
Figure 14. Sensing approach capabilities in non-invasive respiratory disease approximation [49,50,51,52,53,54,55,56,57,58,59,60,61,62,63,64,65,66].
Atmosphere 15 00471 g014
Figure 15. Limitations of sensing technologies and impact on their performance under different conditions [49,50,51,52,53,54,55,56,57,58,59,60,61,62,63,64,65,66].
Atmosphere 15 00471 g015
Figure 16. Major contributions in applied GSGs and ENBs. (a) Trio GSG for I-AQA [67]. (b) Wound infection ENB [68]; (c) eight-parameter GSG [69].
Atmosphere 15 00471 g016
Figure 17. Major contributions in applied GSAs, GSGs, and ENBs. (a) Test GSG for I-AQA [70]. (b) Eighteen-parameter GSA [71]. (c) Smart rig test ENB [72].
Atmosphere 15 00471 g017
Figure 18. Major contributions in GSAoC-based SOI for applied GSGs and ENBs. (a) SPEC DSPoC with GSA on chip [73,74,75,76]. (b) Monolithic GSA on chip with 3.5 nm wires [77].
Atmosphere 15 00471 g018
Figure 19. The AQ gas sensor calibration chamber-based system [74]. (a) P&ID of a unit AQGS testing and calibration system. (b) System assembly and architecture.
Atmosphere 15 00471 g019
Figure 20. The computer-supervised AQGS testing systems [80,81]. (a) AQGS array testing and calibration system [80]. (b) The ENB testing and calibration system [81].
Atmosphere 15 00471 g020
Figure 21. IoT-based Smart AQ GSA testing and calibration system [84].
Atmosphere 15 00471 g021
Figure 22. Air quality mesh network testing and calibration system [92].
Atmosphere 15 00471 g022
Table 1. Key terms used in this Work.
AcronymsDescriptionReferences
IAQIndoor Air Quality[1,2,3,4,5,6,7,8,9,10,11,12,13,14,15,16,17,18,19,20,21,22,23,24,25,26,27,28,29,30,31,32,33,34,35,36,37,38,39,40,41,42,43,44,45,46,47,48,49,50,51,52,53,54,55,56,57,58,59,60,61,62,63,64,65,66,67,68,69,70,71,72,73,74,75,76,77,78,79,80,81,82,83,84,85,86,87,88,89,90,91,92,93,94,95,96,97,98,99,100,101,102,103,104,105,106,107,108,109,110,111,112,113,114,115,116,117,118,119,120,121,122,123,124,125,126,127,128,129,130,131,132,133,134,135,136,137,138,139,140,141,142,143,144,145,146,147,148,149,150,151,152]
AQAAir Quality Assessment[14,15,16,17,18,19,20,21,22,23,24,25,26,27,28,29,30,31,32,33,34,35,36,37,38,39,40,41,42,43]
AQMapAir Quality Mapping[29,30,31,32,33,132,133]
AQMPAir Quality Management Plan[30,31,32,33,34,35,36,37,38,39,40,41]
APIAir Pollution Index[21,27]
AQ-GSAir Quality Gas Sensor[6,7,8,9,10,11,12,13,18,19,20,21,22,23,24,25,26,27,28,29,30,31,32,33,34,35,36,37,38,39,40,41,42,43,44,45,46,47,48,49,50,51,52,53,54,55,56,57,58,59,60,61,62,63,64,65,66,67,68,69,70,71,72,73,74,75,76,77,78,79,80,81,82,83,84,85,86,87,88,89,90,91,92,93,94,95,96,97,98,99,100,101,102,103,104,105,106,107,108,109,110,111,112,113]
OGSOptical Gas Sensor[44,49,50,51]
ECSElectrochemical Gas Sensor[44,52,53,54,55]
AGSAcoustic Gas Sensor[44,64,65,66,67]
CGSCapacitive Gas Sensor[44,56,57]
NDIRNon-dispersion Infra-red[49,50,51]
CMGSCalorimeter Gas Sensor[44,58]
SOISilicon on Insulator[86,87,88,89,90,91,92,93,94,109,110,111]
SoMSystem on Module[35,56,80,81,82,83,84,85,86,101,102,103,104,105,106,107,108,109,110,111,112]
LoCElectrode on Chip[35,56,57,58,80,81,82,83,84,85,86,87,88,89,90,91,92,93,94,95]
GSAsGas Sensing Arrays[102,103,104,105,106,107,108,109,110,111,112,113]
GSGsGas Sensing Grids[106,107,108,109,110,111]
MFCsMass-Flow Controllers[109,110,111,112,113,114,115,116,117]
Table 2. Biblio-statistical parameters settings for 10,000+ articles.
#DescriptionReferences
1KeywordsIndoor air quality, indoor respiratory diseases, indoor pollutants, indoor epidemiology, epidemiology-focused sensors, epidemiology-focused air quality methods, epidemiology-focused systems.
2Citations (5–2000)[2000 1850 1475 1290 1050 800 590 482 440 408 254 232 5]
3Years (50)2000 + [1 3 6 9 12 15 18 21 22]
4Authors per paper (1–15)[1 3 4 5 6 7 8 9 10 11 12 13 14 15]
5OperatorsWHO, NIH, CDC, US EPA, Methods, Policies, Rules, Approaches, Cases, Reports
6Respiratory DiseasesAsthma, Chronic Obstructive Pulmonary Disease (COPD), Ischemic heart disease, Stroke, Pneumonia and Lower Respiratory Infections (LRIs), Lung Cancer, Sick Building Syndrome (SBS).
Table 3. Global outdoor AQI limits.
Global
Regulations
PM2.5
(µg/m3)
PM10
(µg/m3)
O₃
(ppb)
CO
(ppm)
SO₂
(µg/m3)
NO₂
(µg/m3)
NAAQS [4]12.0150.070.09.075.053.0
US EPA [23]12.0150.070.09.075.053.0
EEA [21]25.050.0180.010.0125.040.0
WHO [13,15]10.020.0100.04.020.040.0
CAQI [28]25.050.0180.010.0125.040.0
Table 4. Impact of outdoor pollutants on indoor pollution [47,48].
Outdoor PollutantsStatusIndoor Atmosphere Impact
PM2.5Varied concentrations based on locationInfiltration of PM may degrade indoor air quality, influencing the overall atmosphere.
NO2Variable levels near traffic and industryNO2 infiltration can alter indoor chemical composition, impacting the atmospheric milieu.
SO2Common near industrial sourcesInfiltration introduces sulfur compounds, modifying indoor atmospheric conditions.
O3Variable levels of sunlight and pollutantsOzone infiltration may lead to oxidative reactions, influencing indoor atmospheric chemistry.
VOCsEmitted from various sourcesVOC infiltration contributes to the overall composition, affecting odor and atmospheric makeup.
Table 5. Indoor epidemiological scalability of and calibration approaches at institutional level.
Institutional-Level Indoor Epidemiological MeritsUni-Gas Uni-Sensor CalibrationUni-Gas Multi-Sensor ENB CalibrationIoT-Based Networked Multi-Gas ENB CalibrationClimate Smart Heterogeneous ENB Calibration
Calibration Scale (per 24 h)1–2410–12010–184010–144
System Setup Cost (per 10 sensors)USD 2~5.1 MUSD 0.4~2 MUSD 1~1.8 MUSD 4~7 M
Types of Sensors Supported4455
IoT Support and Remote CalibrationNoNoYesNo
Calibration Cost (per 10 sensors)USD 3–10USD 12–19USD 2–8USD 35–120
Real-time AQI-based Climate-Focused CalibrationNoNoNoYes
ML/DL Model-in-Loop SupportNoNoYesNo
Table 6. Epidemiological relationship between IAQ and respiratory health issues [94,95,96,97,98,99,100,101,102,103,104,105,106,107,108].
#Indoor PollutantsIndoor Diseases and Health Problems
1PM2.5 and PM10
[94,95,96,97,98,99,100,101,102,103,104,105]
Heart or lung illness, nonfatal heart attacks, irregular heartbeats, worsened asthma, impaired lung function, and a rise in respiratory symptoms including coughing or trouble breathing.
2NO2 [97,98,99,100]At high quantities, it shortens breath and irritates the mucous membranes of the nose, throat, and eyes. Long-term inhalation of nitrogen dioxide can cause lung damage. It could result in persistent bronchitis. Those who have asthma and chronic obstructive lung disease may experience worsening symptoms from exposure to low levels (COPD). Also, it could make other respiratory illnesses worse.
3CO [98,99,100,101,102]Chronic headaches, nausea, stomach pain, vomiting, weakness, dizziness, fainting, confused mental neural response, exhaustion, loss of consciousness, seizure, and irreversible brain damage are some of the symptoms. In the worst scenarios, death is also conceivable.
4CO2 [103,104,105,106]Respiratory tract infections, chronic obstructive pulmonary disease (COPD), asthma, and rhinosinusitis.
5VoCs [105,106,107,108]Some VOCs are known or suspected carcinogens. Inflammation, including irritation of the eyes, nose, and throat; headaches and lack of coordination; nausea; liver, renal, or central nervous system damage.
Table 7. Annual fatality statistics for indoor pollutants’ induced diseases [107,108,109,110,111,112,113,114,115,116,117,118,119,120,121].
%Respiratory DiseasesFatalities Details
32%Ischemic heart disease
[108,109,110,111]
Affects 32% of people. Exposure to home air pollution is responsible for 12% of all fatalities from ischemic heart disease, or more than a million premature deaths yearly.
23%Stroke [112,113,114,115]Accounts for 23% of deaths, with the usage of solid fuels and kerosene in the home contributing to household air pollution regularly, accounting for around 12% of all stroke deaths.
21%Pneumonia and Lower Respiratory Infections (LRIs) [116,117,118,119,120,121]LRIs account for 21% of fatalities, and exposure to indoor air pollution nearly doubles the risk of childhood LRI and accounts for 44% of all pneumonia-related deaths in children under the age of five. Adults who have acute LRIs are in danger from household air pollution, which also causes 22% of all adult fatalities from pneumonia.
19%Chronic obstructive pulmonary disease (COPD) [122,123,124,125]Accounts for 19% of cases. In low- and middle-income nations, exposure to home air pollution is the reason for 23% of all fatalities from COPD in adults.
6%Lung Cancer
[126,127,128,129,130,131]
A total of 6% of lung cancer-related fatalities in adults are linked to exposure to carcinogens from home air pollution brought on by the use of kerosene or solid fuels like wood, charcoal, or coal. This exposure accounts for around 11% of lung cancer deaths in adults.
Table 8. Real-time operational capabilities and lifecycle cost evaluation [132,133,134,135,136,137,138,139,140,141,142,143,144,145,146,147,148,149,150,151,152].
USD ($)Rooms Monitored (>100)GSA/GSG Assemblies (>10X)
Cost ElementsOGSECSCGSMOSOGS ENBECS
ENB
CGS
ENB
MOS
ENB
Lifeline Cost (K) [132,133,134,135]101.517.13.73.50.71.30.4
Manufacturing Setup Cost (M)
[69,70,71,72,73,74,75,76,77,78,79,80,81,82,83,84,85,86,87,88,89,90,91,92,93,94,95,136]
23~4018~297~1333~8013~178~119~103~5
Calibration Cost (K)
[137,138,139,140]
171219429159.51.4
Adaptation Cost (K)
[19,141,142,143,144]
307521231.10.3
Sampling Rate Upgrade Cost (K)
[45,46,47,48,49,50,51,52,53,54,55,56,57,58,145,146,147]
31191.20.20.90.30.12
Networked Sensing Cost (K) [148,150]11111.70.10.10.1
Real-time AQI Mapping Cost (K)
[144,151,152]
0.72.33.71.30.51.69.50.09
Disclaimer/Publisher’s Note: The statements, opinions and data contained in all publications are solely those of the individual author(s) and contributor(s) and not of MDPI and/or the editor(s). MDPI and/or the editor(s) disclaim responsibility for any injury to people or property resulting from any ideas, methods, instructions or products referred to in the content.

