Article

A Comparative Investigation of the Characteristics of Nocturnal Ozone Enhancement Events and Their Effects on Ground-Level Ozone and PM2.5 in the Central City of the Yellow River Delta, China, in 2022 and 2023

1
State Key Laboratory of Environmental Criteria and Risk Assessment, Chinese Research Academy of Environmental Sciences, Beijing 100012, China
2
College of Earth Sciences, Jilin University, Changchun 130061, China
3
Dongying Ecological and Environmental Bureau, Dongying 257091, China
4
Ltd. of Shandong Environmental Protection Industry Corp., Jinan 250061, China
*
Author to whom correspondence should be addressed.
Atmosphere 2024, 15(4), 475; https://doi.org/10.3390/atmos15040475
Submission received: 31 January 2024 / Revised: 15 March 2024 / Accepted: 2 April 2024 / Published: 11 April 2024
(This article belongs to the Special Issue Mechanisms of Urban Ozone Pollution)

Abstract

:
In recent years, nocturnal ozone enhancement (NOE) events have emerged as a prominent research focus in the field of the atmospheric environment. By using statistical analysis methods, we conducted a comparative investigation of nocturnal ozone concentrations and NOE events in Dongying, the central city of the Yellow River Delta, China, in 2022 and 2023, and further explored the effects of NOE events on O3 and PM2.5 on the same night and the subsequent day. The results showed that from 2022 to 2023, in Dongying, the annual average nocturnal ozone concentrations increased from 51 μg/m3 to 59 μg/m3, and the frequency of NOE events was higher in the spring, summer, and autumn, and lower in the winter. The NOE events not only exhibited promoting effects on nocturnal O3 and Ox, and on the daily maximum 8 h average concentration of O3 (MDA8-O3) on the same day (comparatively noticeable in summer and autumn), but also demonstrated a clear impact on nocturnal PM2.5 and PM2.5-bounded NO3 and SO42− (especially in winter). Additionally, the NOE events also led to higher concentrations of O3 and Ox, as well as higher MDA8-O3 levels during the subsequent day, with more observable impacts in the summer. The results could strengthen our understanding about NOE events and provide a scientific basis for the collaborative control of PM2.5 and O3 in urban areas in the Yellow River Delta in China.

1. Introduction

Ground-level ozone (O3) is mainly produced by precursors such as nitrogen oxides (NOx) and volatile organic compounds (VOCs) under light conditions [1,2,3,4,5]. Due to the synthetic effects of photochemical generation, dry depositions, and boundary layer entrainment, the diurnal variation in ozone concentration usually presents a unimodal distribution; that is, the concentration is higher during the daytime and lower at nighttime, which has been confirmed by a large number of field observations [6,7,8,9,10,11]. However, in recent years, many studies have demonstrated that nocturnal ozone concentrations are surging and that a nocturnal ozone peak occurs, which has been widely observed in the United States, Europe, and China [12,13,14,15,16,17,18,19]. Studies have reported that higher nocturnal ozone concentrations may have an impact on atmospheric chemical processes, human health, and vegetation growth [15,20,21,22]. Wang et al. suggested that the increase in nocturnal ozone concentrations in China in recent years has led to an increase in the nocturnal atmospheric oxidation capacity in China [21]. Agathokleous et al. believed that nocturnal ozone enhancement may adversely affect plant and animal growth [18,23]. Therefore, it becomes imperative to conduct comprehensive research elucidating the phenomenon of nocturnal ozone enhancement (NOE).
Currently, numerous studies have been conducted to investigate the characteristics and underlying causes of NOE. He et al. [14] found that the average annual frequency of NOE events ranged from 28% to 41% in China, the United States, and the European Union, and that the frequency of NOE events in China is significantly higher than that in the United States and the European Union. Wu et al. [24] studied the NOE events and their causes in the Pearl River Delta, China and found that the annual average frequency of NOE events is 53 days per year and the average nocturnal ozone peak is 58 μg/m3. The low-level jet stream is the main meteorological process that triggers the NOE events, accounting for an average of 61%, and convective storms account for about 11%. In addition, sea–land breezes and mountain–valley circulation, typhoons, and stratospheric ozone intrusions also contribute to NOE events [25,26,27,28,29]. Few studies have speculated on the chemical effects of NOE events. Wu et al. preliminarily explored the relationship between nocturnal ozone concentration and the daily maximum 8 h average concentration of O3 (MDA8-O3) of the following day and found that there was a good correlation between them [24]. He et al. [30] suggested that the NOE would lead to a persistently high value of 8 h average ozone concentration from night to the early next morning. He et al. [31] found that nocturnal PM2.5 concentrations and odd oxygens (Ox = NO2 + O3) are obviously higher during NOE events in the Pearl River Delta region of China than during non-nocturnal ozone enhancement (NNOE) events. Currently, a dearth of investigations exists concerning the effects of NOE on secondary pollutants. Furthermore, there is a notable paucity of detailed analyses, particularly in discerning the interannual and monthly scale influences of NOE on secondary pollutants. Most of the current studies focus on the developed regions of China, such as the North China Plain and the Pearl River Delta, with limited research attention directed towards the Yellow River Delta.
Dongying is a central city of China’s Yellow River Delta, bordered by the Bohai Sea to the east and north. In recent years, the air quality in Dongying has improved significantly, but the problem of ozone pollution is still prominent [32,33,34]. An et al. found that the nocturnal ozone concentration increased in Dongying from 2017 to 2022, and the average nocturnal ozone concentration in the ozone pollution season in 2022 increased by 12 μg/m3 compared with 2017, which was greater than the increase during the daytime, suggesting an increase in the nocturnal atmospheric oxidation capacity in this region [35]. Furthermore, the Yellow River Delta in China has experienced frequent NOE events, exemplified by the night of 17 June 2022. During this specific event, despite the presence of thundershowers, the ozone concentration persisted at elevated levels, characterized by three distinct increases. Nevertheless, a comprehensive and systematic analysis of the characteristics of NOE events in Dongying is currently absent. Hence, it is imperative to examine the characteristics of the NOE events and their influence on O3 and PM2.5 in Dongying.
Based on the data of normal pollutants and PM2.5 components concentrations in Dongying, a central city of the Yellow River Delta, China, this study analyzed the characteristics of nocturnal ozone concentration and NOE events in Dongying and further explored the effects of NOE events on the concentrations of O3, Ox, PM2.5, nitrate (NO3), sulfate (SO42−), and secondary organic carbons (SOC) at night and the following day. The research findings are helpful to understand the characteristics of nocturnal ozone concentration and the NOE events in the Yellow River Delta and to clarify the impact of NOE events on secondary pollutants. This research contributes to a strengthened understanding of NOE events and provides a scientific foundation for the collaborative control of PM2.5 and O3 in urban areas in the Yellow River Delta, China.

2. Materials and Methods

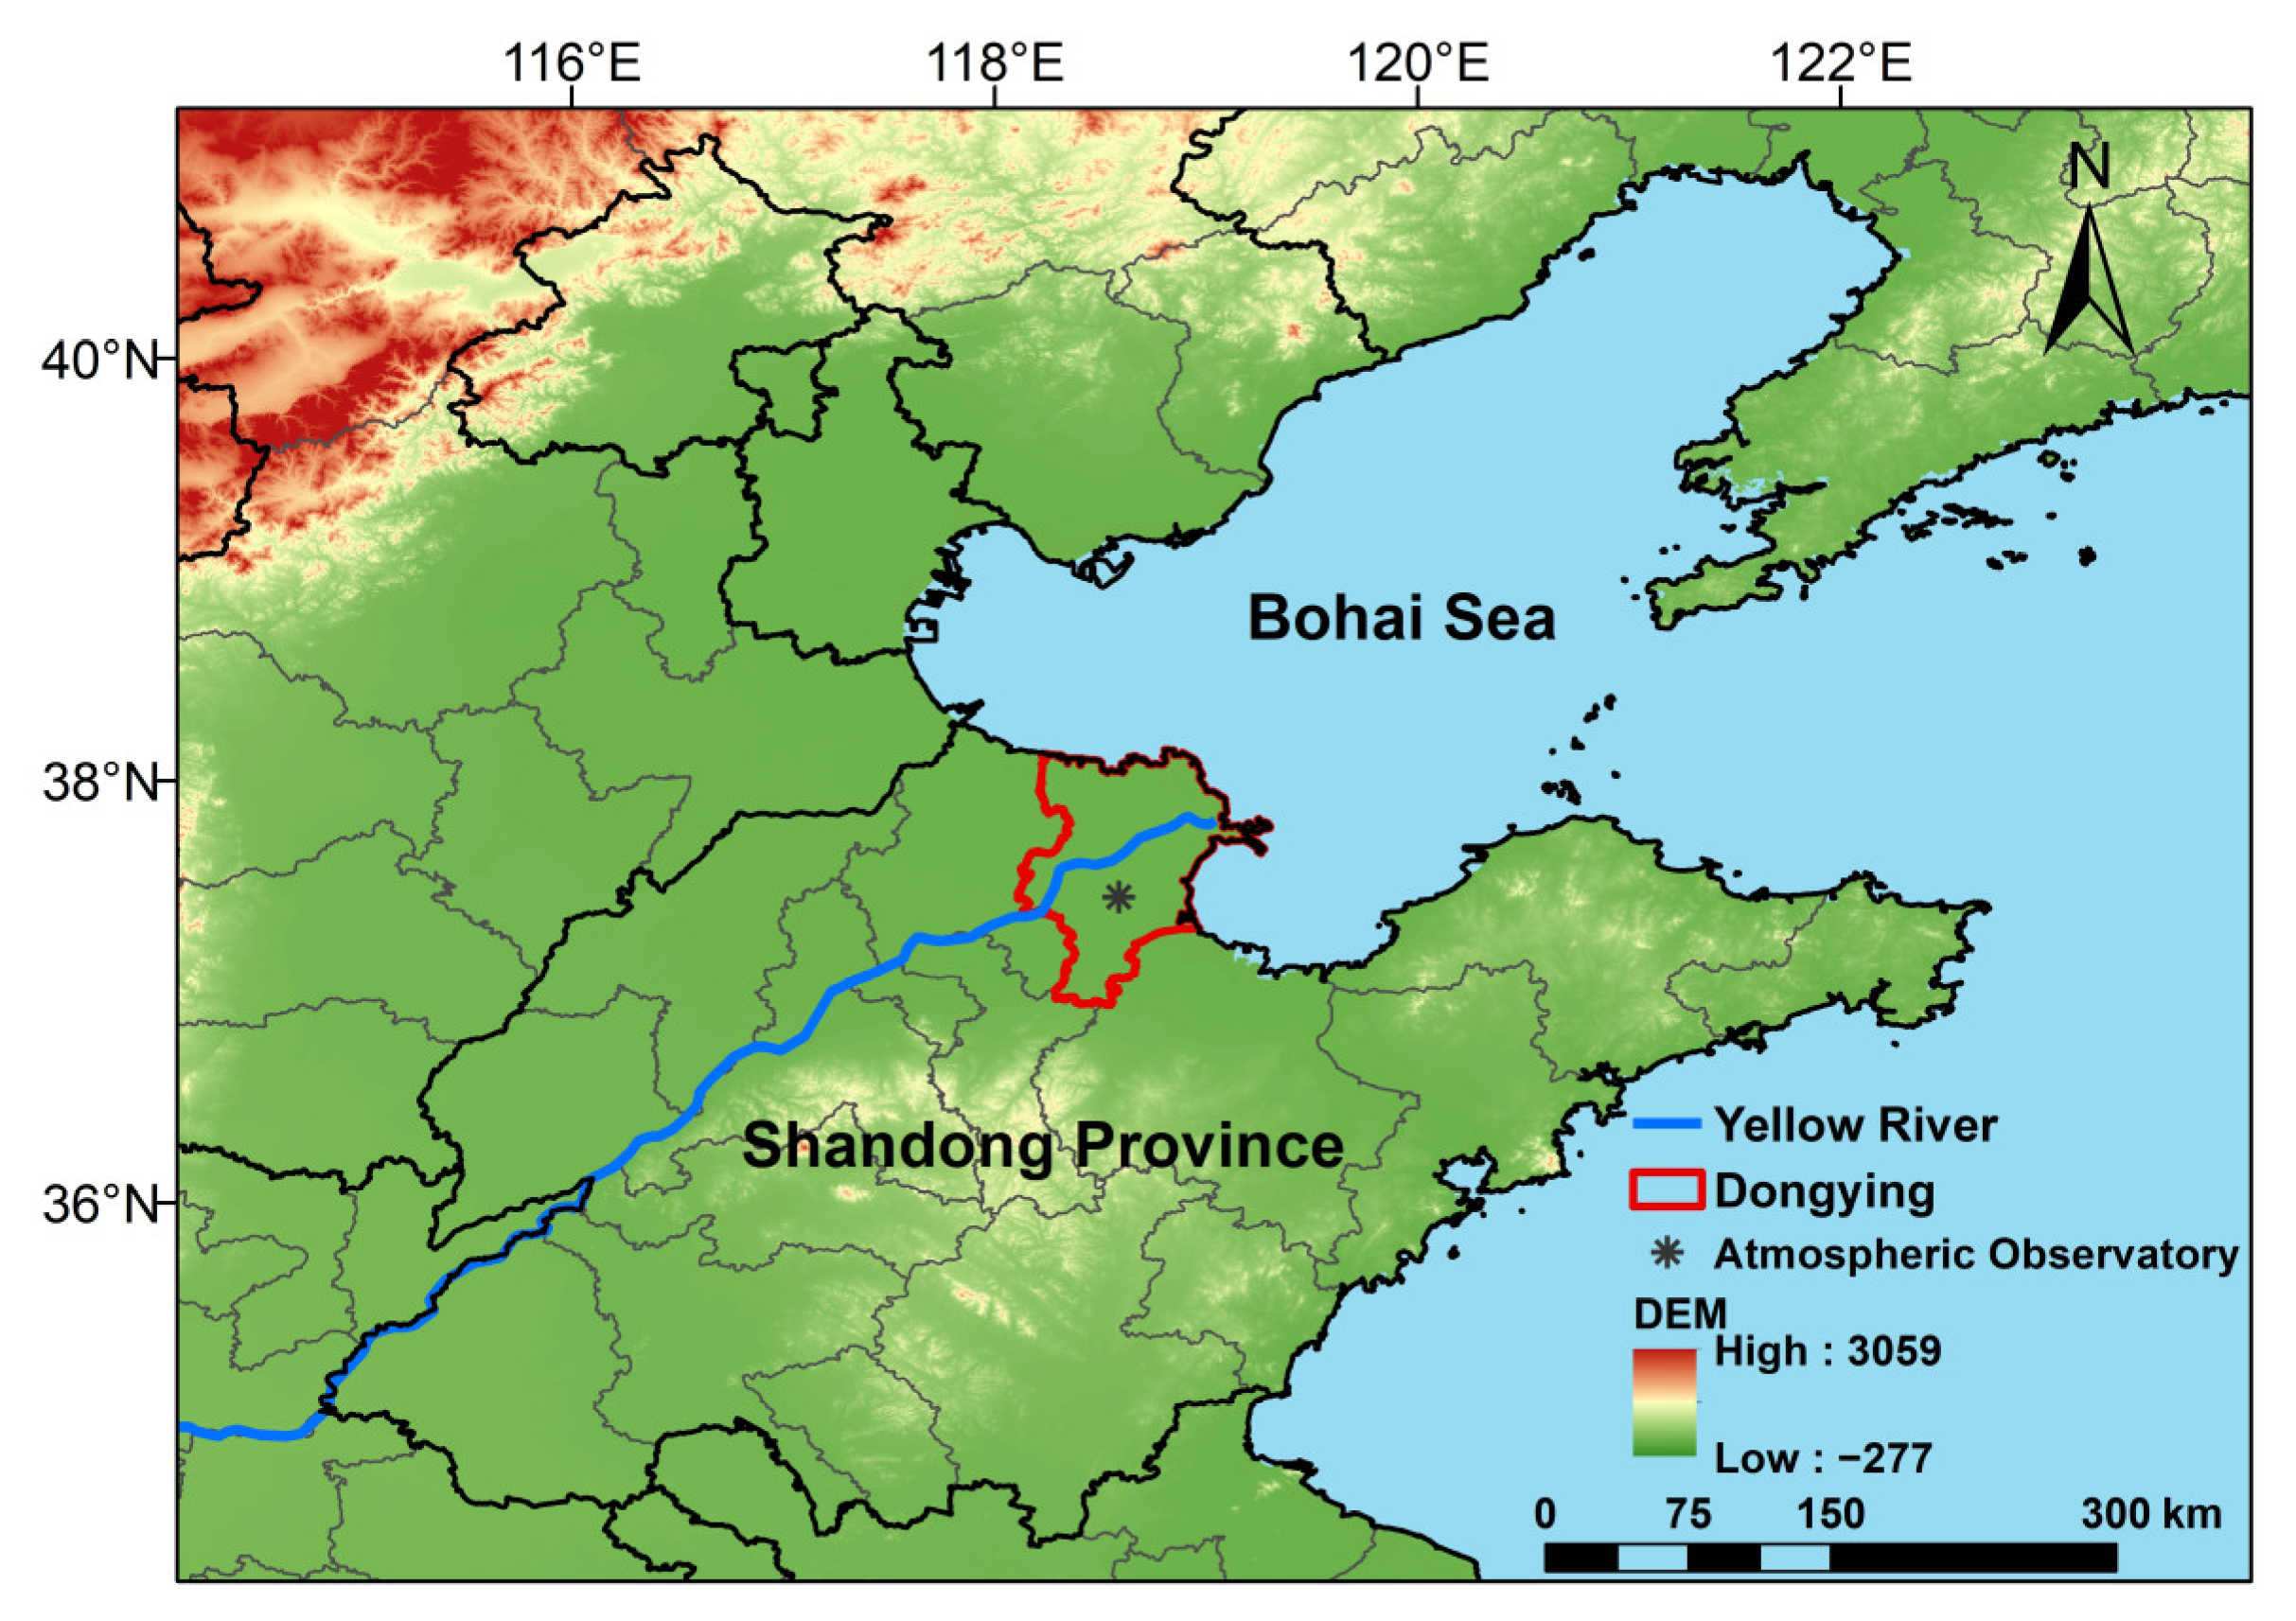
2.1. Observation Period and Location

Dongying, located in the northern part of Shandong Province in China and bordered by the Bohai Sea to the east and north, is an important passage to the sea in the Yellow River Basin and a central city of the Yellow River Delta, China [36]. The hourly concentration data of normal pollutants (O3, SO2, NO2, and PM2.5), PM2.5-bounded ionic components, organic carbon (OC), and elemental carbon (EC) used in this study were obtained from the Dongying Atmospheric Observatory (“Atmospheric Observatory”, Figure 1) (http://117.78.41.74:9830/, (accessed on 10 March 2024)). The investigation spanned from 1 January 2022 to 31 December 2023. The Atmospheric Observatory is mainly surrounded by residential areas and commercial office areas, with convenient transportation and no obvious industrial pollution sources, which can accurately reflect the air pollution situation in Dongying (Figure 1). All the observation items were continuously monitored using automatic monitoring devices, among which the SO2, NO-NO2-NOx, and O3 were monitored with 43i, 42i, and 49i (Thermo Fisher Scientific Inc., Waltham, MA, USA), respectively. Particulate matters were monitored online with BAM1020 (Met One Instruments Inc., Washington, DC, USA). The ion component analyzer model was S−611EG (Zhang Jia Ltd., Taiwan, China) and the OC and EC analyzer model was OCEC-100 (Focused Photonics Inc., Hangzhou, Zhejiang, China).

2.2. Relevant Definitions

Daytime and nighttime are generally defined based on the characteristic variations in solar radiation. Numerous studies have utilized methods such as machine learning and regression models to estimate the features of solar radiation in China and globally [37,38,39,40,41,42,43], with solar radiation characteristics potentially varying across different regions. Consequently, the ultraviolet radiation characteristics in Dongying were analyzed. Negligible ultraviolet radiation levels were observed from 0:00 to 6:00 and from 20:00 to 23:00 (Figure 2). Therefore, the period from 20:00 to 6:00 of the next day is considered to be the nighttime of Dongying [14,35].
Nocturnal ozone enhancement events (NOE events): Based on the definitions of NOE events in previous studies [14,24,31], NOE events are defined as the ozone concentration increases by more than 10 μg/m3 in two successive hours of a given night (20:00 to 06:00 of the next day), and the corresponding nocturnal maximum O3 concentration is called the nocturnal ozone peak.
Non-nocturnal ozone enhancement events (NNOE events): NNOE events are defined as no increases in nocturnal ozone or increases of less than 10 μg/m3 in two successive hours of a given night (20:00 to 06:00 of the next day).

2.3. Data Processing

2.3.1. Annual Frequency of NOE Events

The annual frequency of NOE events is calculated as the proportion of nights with NOE events occurring relative to the total number of nights in a year. Mathematically, it can be expressed as follows:
Annual   frequency   of   NOE   events = Number   of   nights   with   NOE   events Total   number   of   nights   in   a   year 100 % ,
The monthly frequency of NOE events is calculated as the proportion of nights with NOE events occurring relative to the total number of nights in a month. Mathematically, it can be expressed as follows:
Monthly   frequency   of   NOE   events = Number   of   nights   with   NOE   events Total   number   of   nights   in   a   month 100 % ,

2.3.2. Transformation Rate of Nitrates and Sulfates

In this study, the transformation rate of nitrates (NOR) and the transformation rate of sulfates (SOR) were used to determine the transformation status of gaseous precursors such as NO2 and SO2 to form secondary inorganic ions [34,44]. The higher the values of NOR and SOR, the higher the degree of secondary transformation of NO2 and SO2 in the atmosphere. The equations are as follows:
NOR = N1/(N1 + N2),
SOR = S1/(S1 + S2),
where N1 and N2 represent the concentration of NO3 and NO2, respectively, in mol/m3; and S1 and S2 represent the concentration of SO42− and SO2, respectively, in mol/m3.

2.3.3. Calculation of Secondary Organic Carbon

In this study, the OC/EC ratio method was used to calculate the mass concentration of SOC [34,44]. The formula is as follows:
SOC = OC EC × OC / EC min ,
where SOC represents secondary organic carbon in μg/m3, OC and EC represent organic carbon and elemental carbon, respectively, and (OC/EC)min is the minimum value of OC/EC during the observation period.

3. Results and Discussion

3.1. Characteristics of Nocturnal Ozone Concentration in Dongying

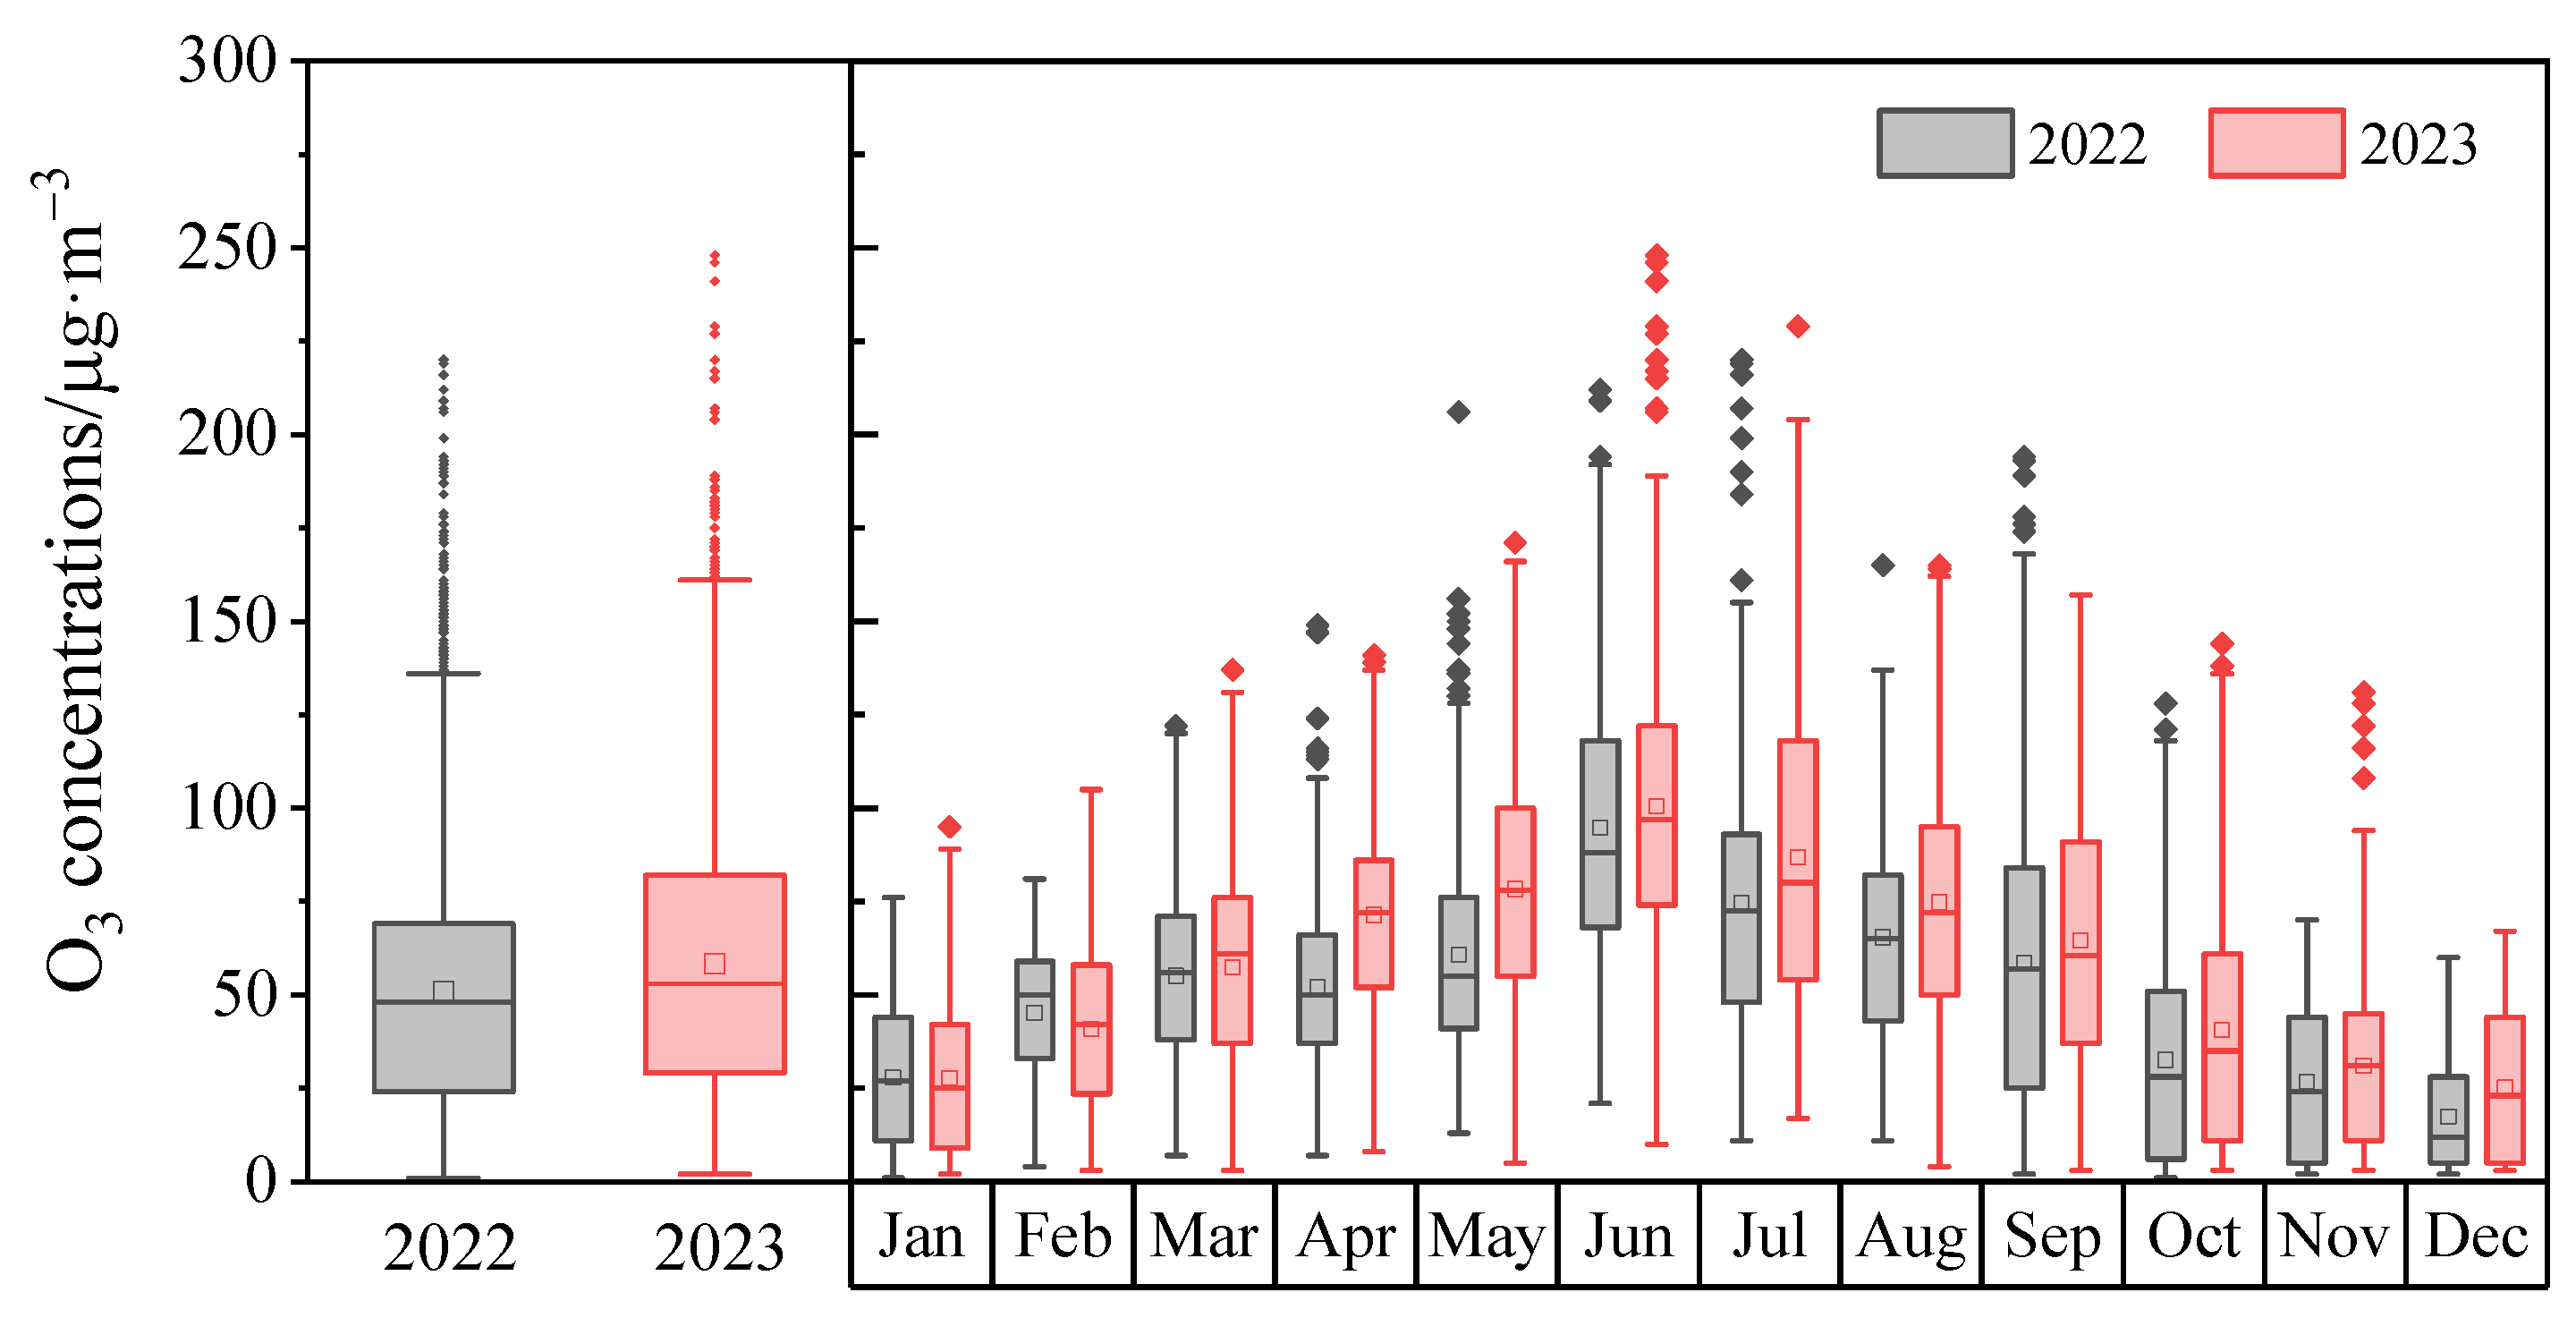
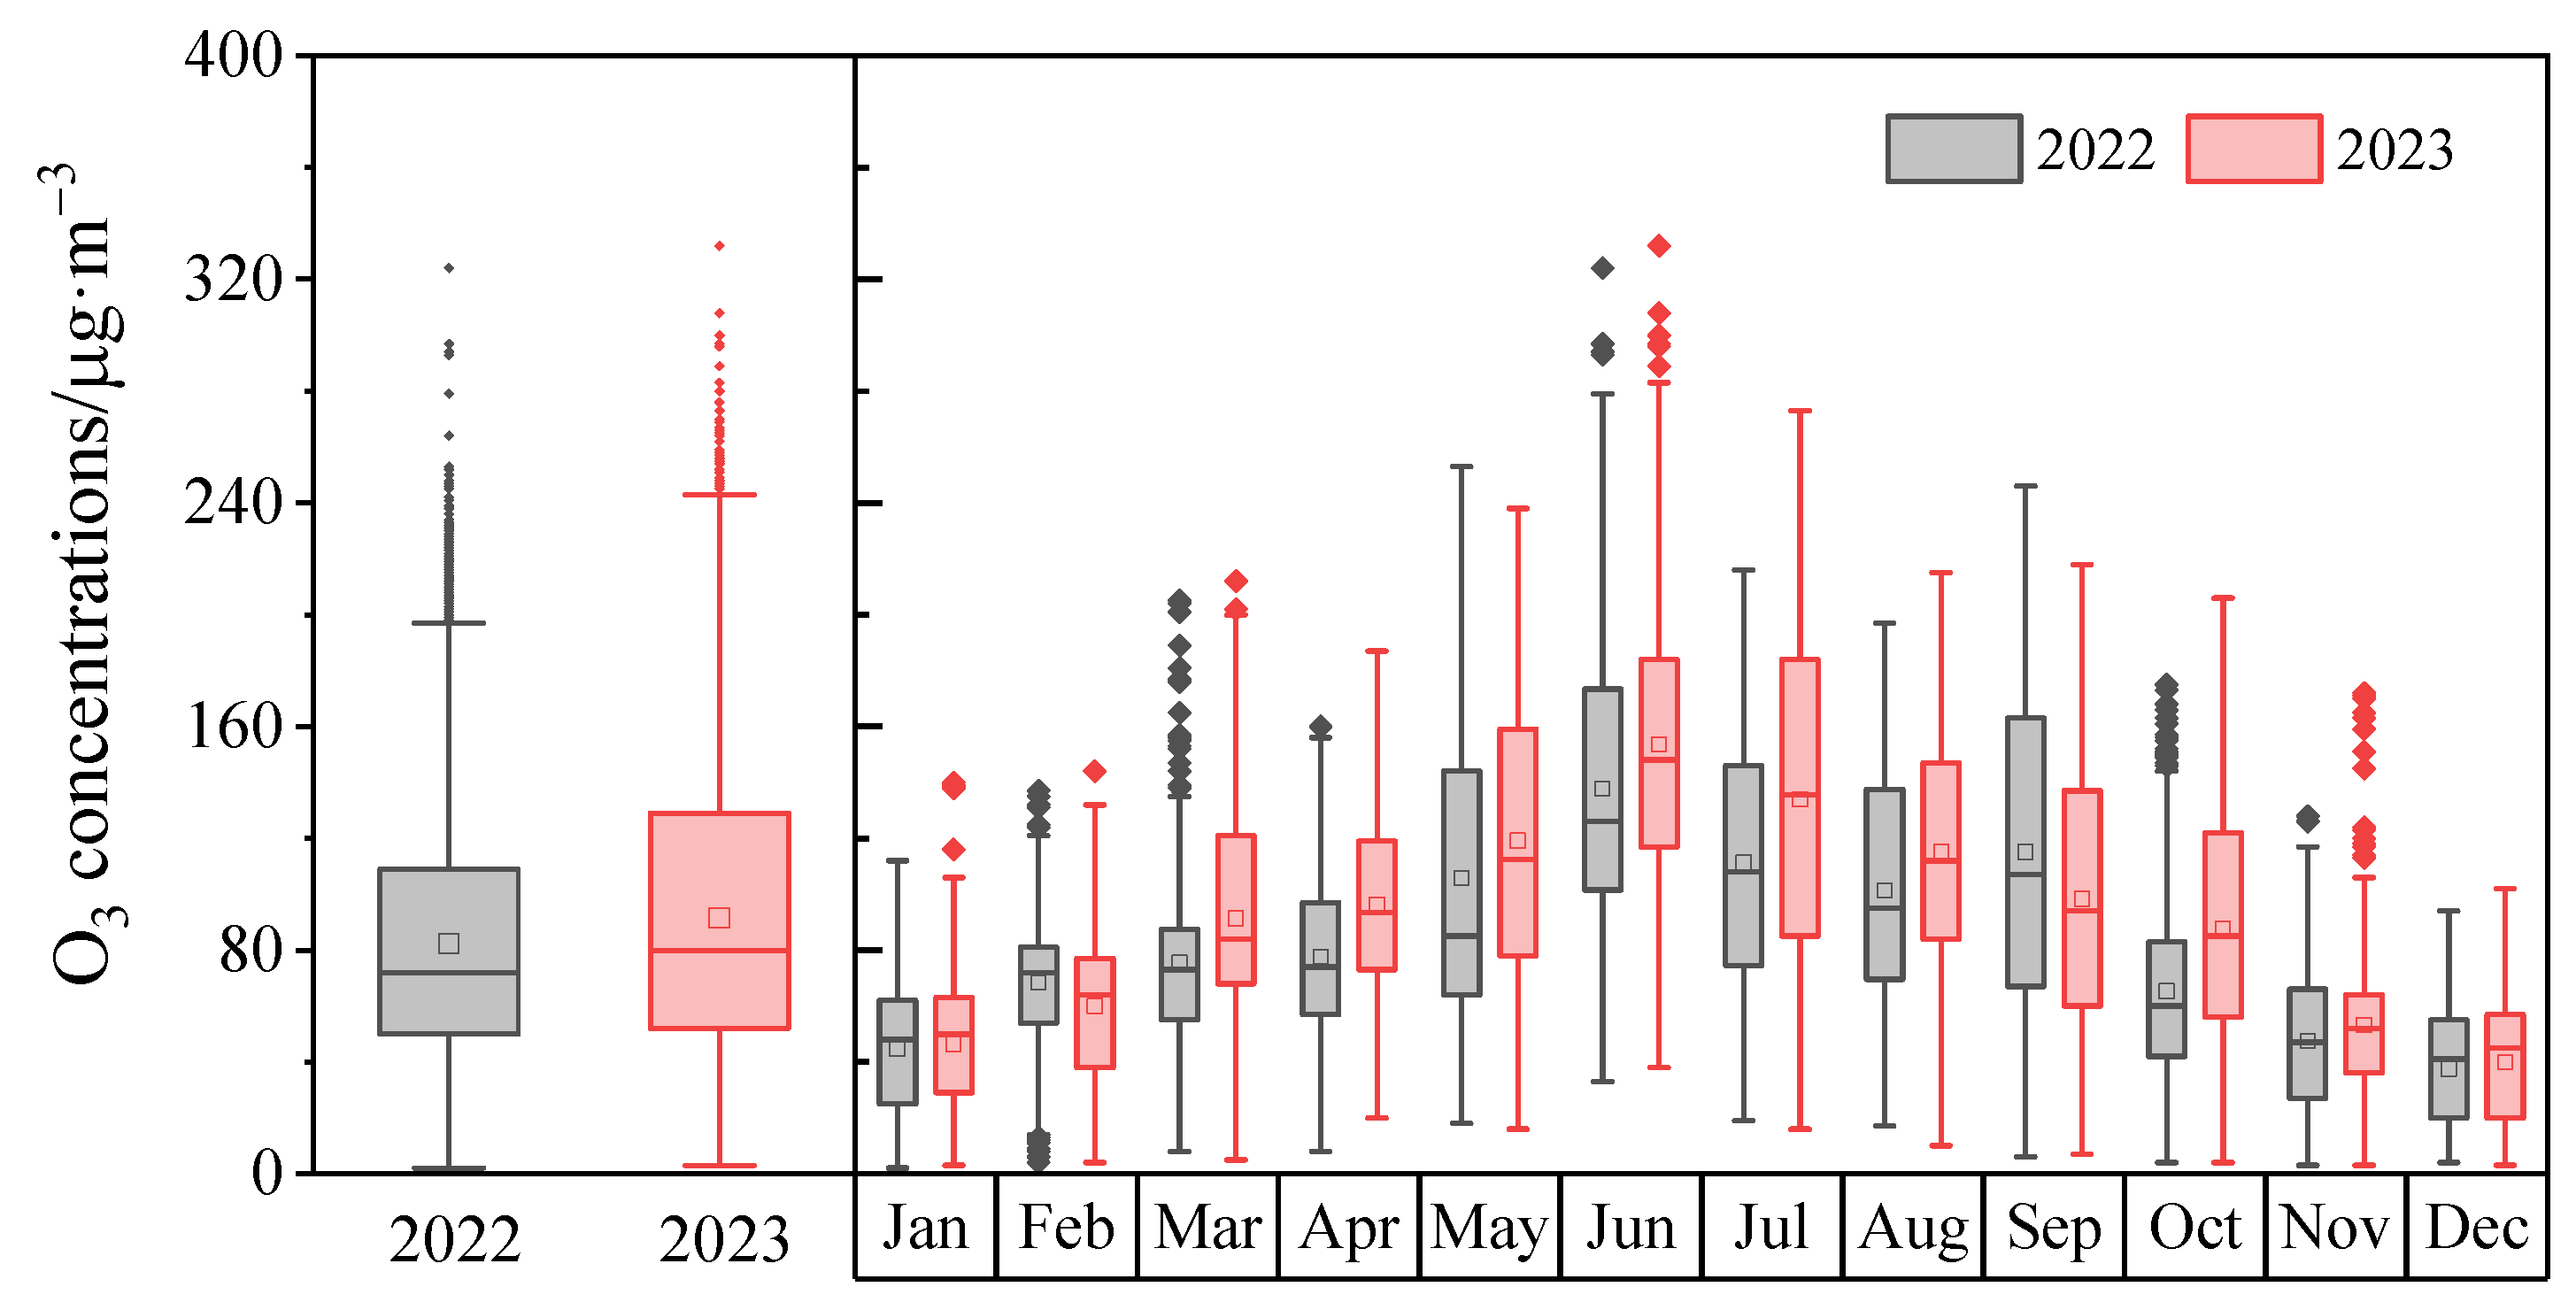
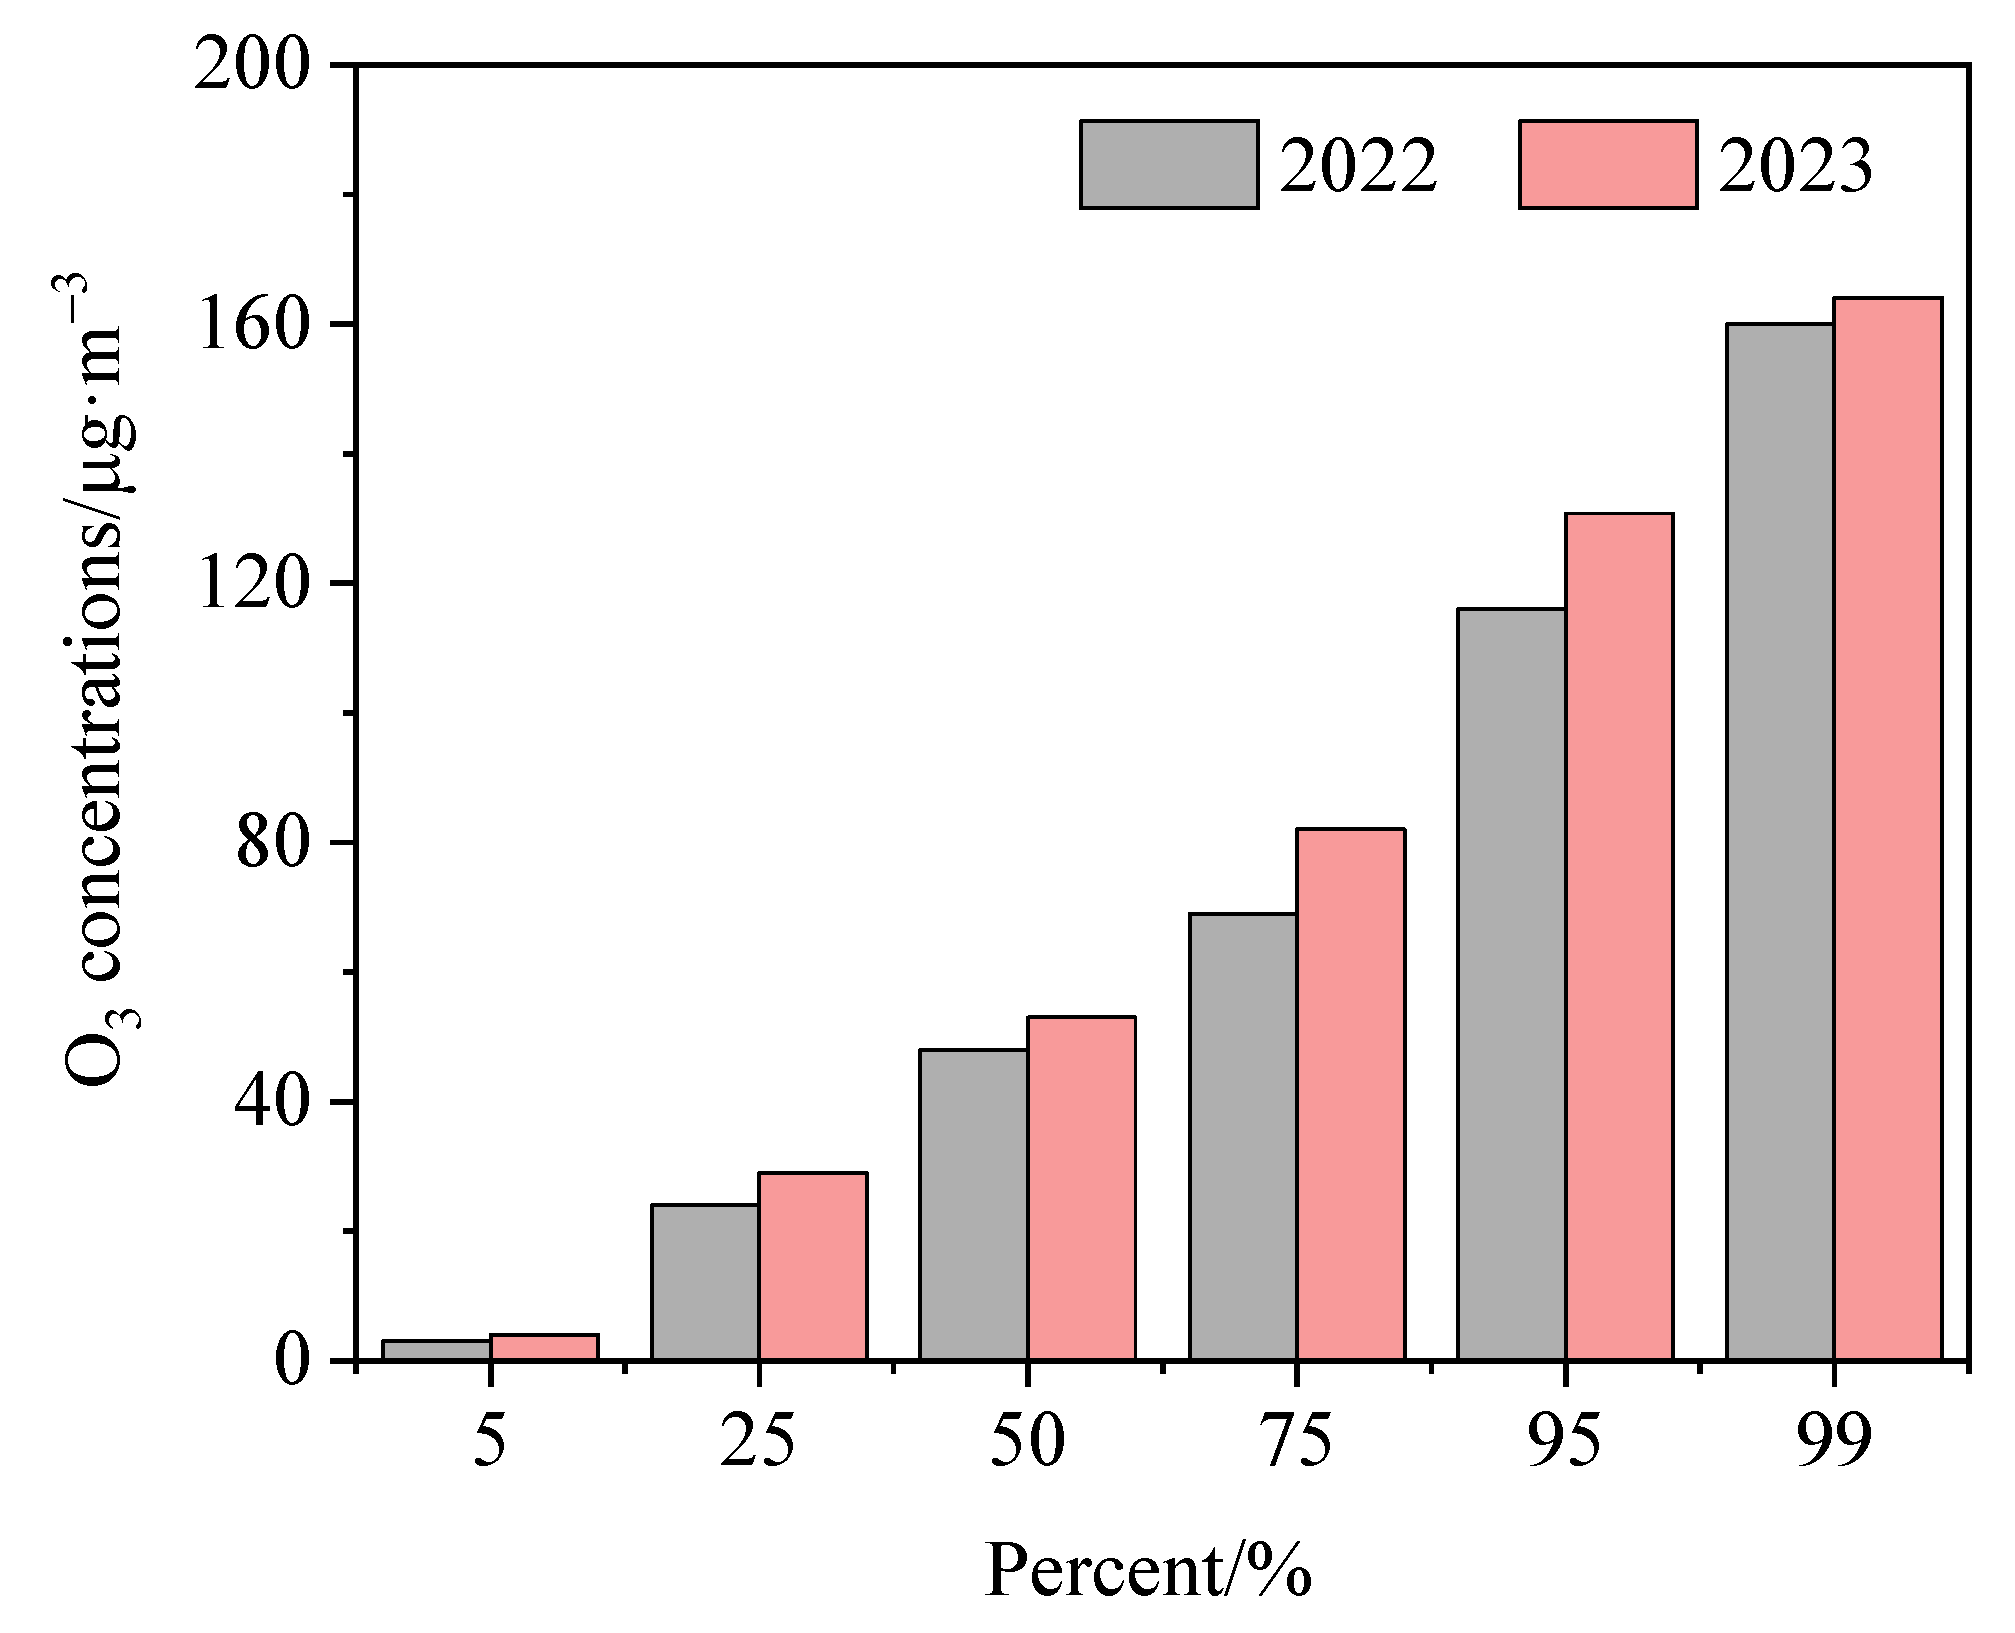
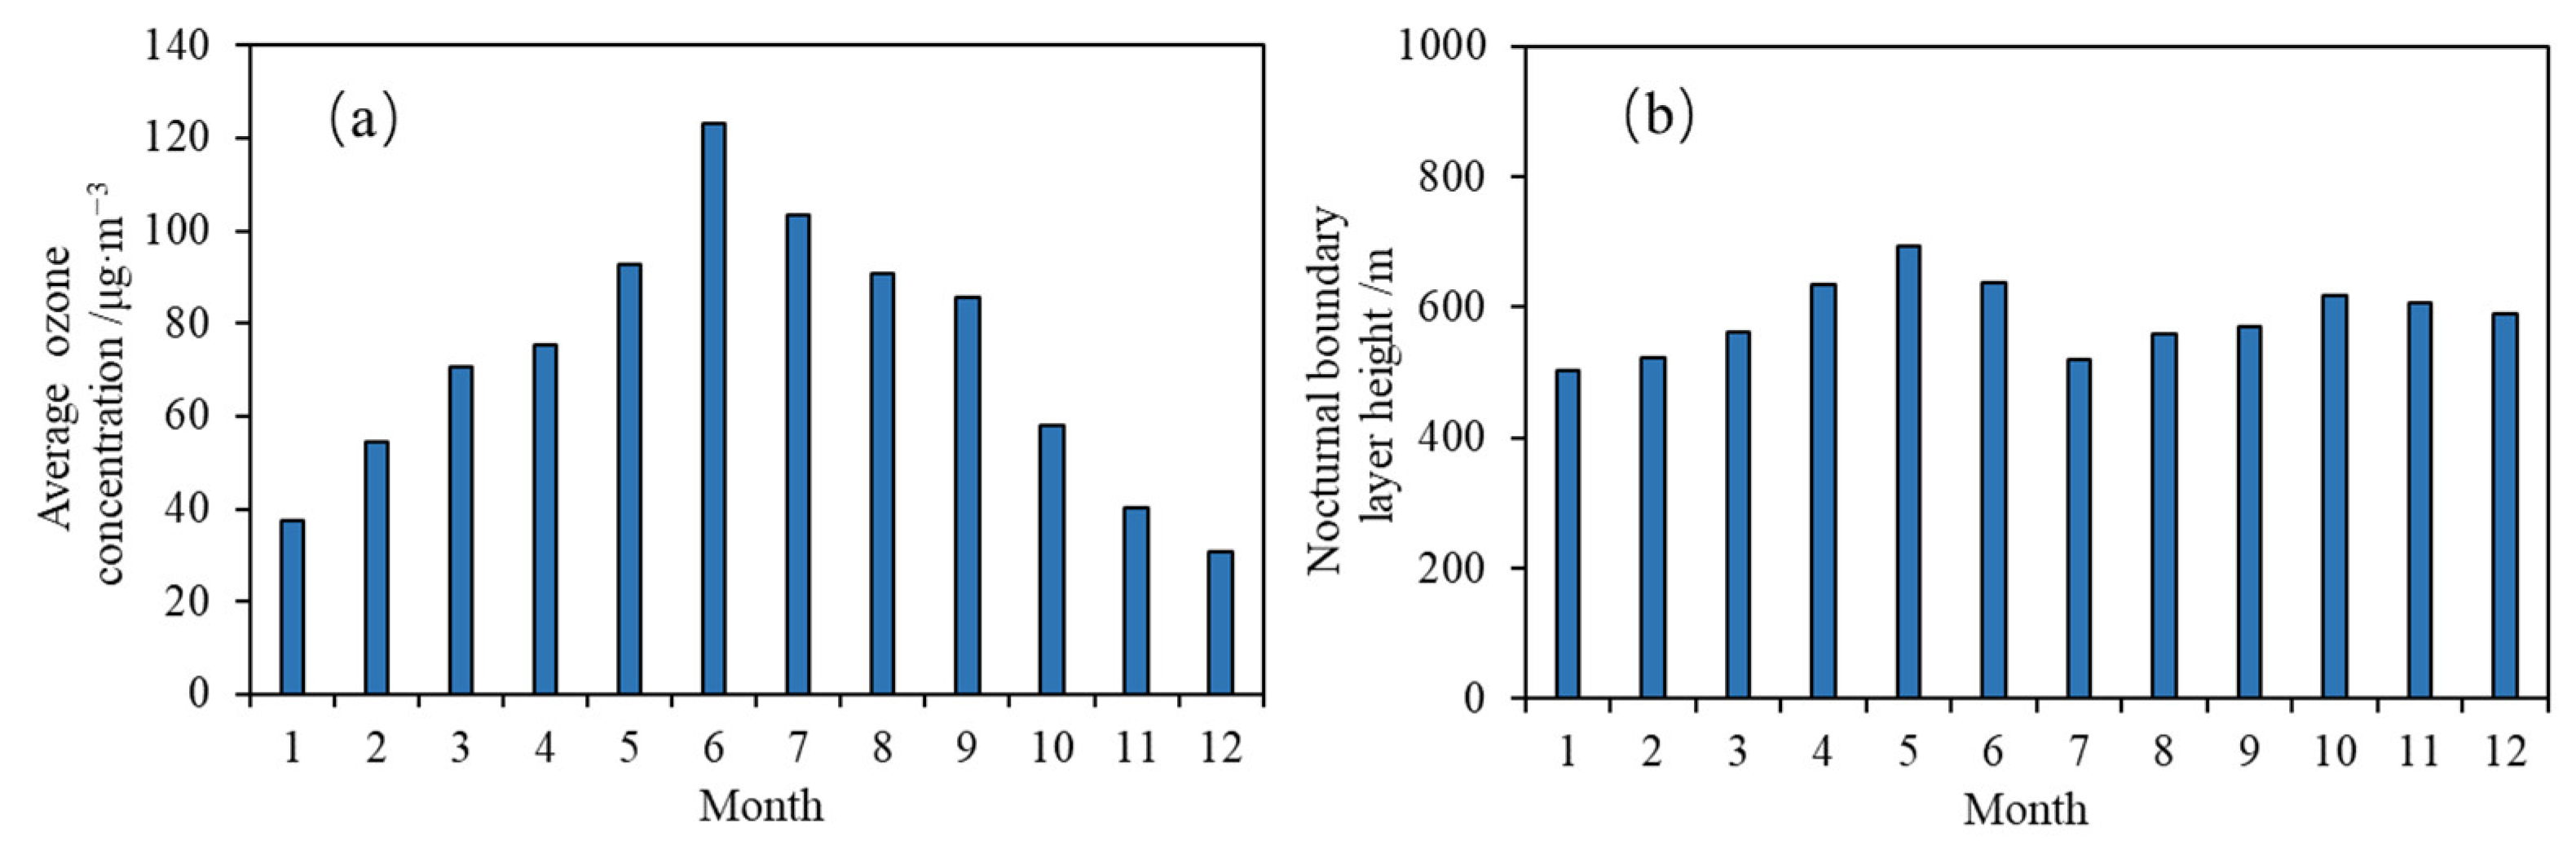
3.1.1. Inter-Annual and Inter-Monthly Variations

From 2022 to 2023, the annual average nocturnal ozone concentration increased from 51 μg/m3 to 59 μg/m3 in Dongying (Figure 3). In addition, the results of the non-parametric test (Wilcoxon signed rank test) showed the statistics Z = −12.75009, p < 0.05, indicating that the nocturnal ozone concentration in 2023 was significantly higher than that in 2022.
From 2022 to 2023, the monthly variation in nocturnal ozone concentration in Dongying showed a unimodal distribution, with the peak occurring in June (Figure 3). During January, February, October, and December, nocturnal ozone concentrations were relatively low, with monthly averages ranging from 17 to 45 μg/m3. In contrast, from March to September, the nocturnal ozone concentrations were higher, with monthly averages ranging from 52 to 100 μg/m3. This was consistent with the monthly variations in MDA8-O3 in Dongying, which showed that the ozone concentration was higher in the ozone pollution season (from April to September), while the ozone concentration was lower in the non-ozone pollution season (other months) [35]. It can also be observed that the ozone levels in Dongying during nighttime and daytime exhibit relatively similar monthly variations (Figure 3, Figure 4 and Figure 5). This finding is also supported by research by He et al. (2022). The nocturnal ozone concentration was higher in the ozone pollution season and lower in the non-ozone pollution season, indicating that the nocturnal ozone concentration was closely related to the daytime ozone pollution.
The nocturnal ozone concentrations from February to December 2023 were higher than those in 2022, and the most obvious increases were in April to May and July, with an increase of 12–19 μg/m3 (Figure 3). The increase in nocturnal ozone concentration in Dongying in the past two years suggests that attention should be paid to the increase in nocturnal ozone concentration in the Yellow River Delta, which may alter the nighttime atmospheric oxidation capacity and further affect atmospheric chemical reactions.
The different percentiles of the nocturnal ozone hourly concentrations increased in Dongying from 2022 to 2023 (Figure 6). Compared to 2022, the nocturnal ozone concentrations increased at different percentiles in 2023 from high to low as follows: 15 μg/m3 (95th percentile), 13 μg/m3 (75th percentile), 5 μg/m3 (50th and 25th percentiles), 4 μg/m3 (99th percentile), and 1 μg/m3 (5th percentile). It can be seen that the high and middle percentiles of the nocturnal ozone concentration increased most obviously in Dongying from 2022 to 2023. The increase in nocturnal ozone concentrations in Dongying is similar to the results of Li et al. (2023), who found that nocturnal ozone concentrations increased in most regions of China in the summer of 2019 compared to 2015, which was mainly caused by a reduction in both the ambient NO2 concentration and wet scavenging in recent years [15].

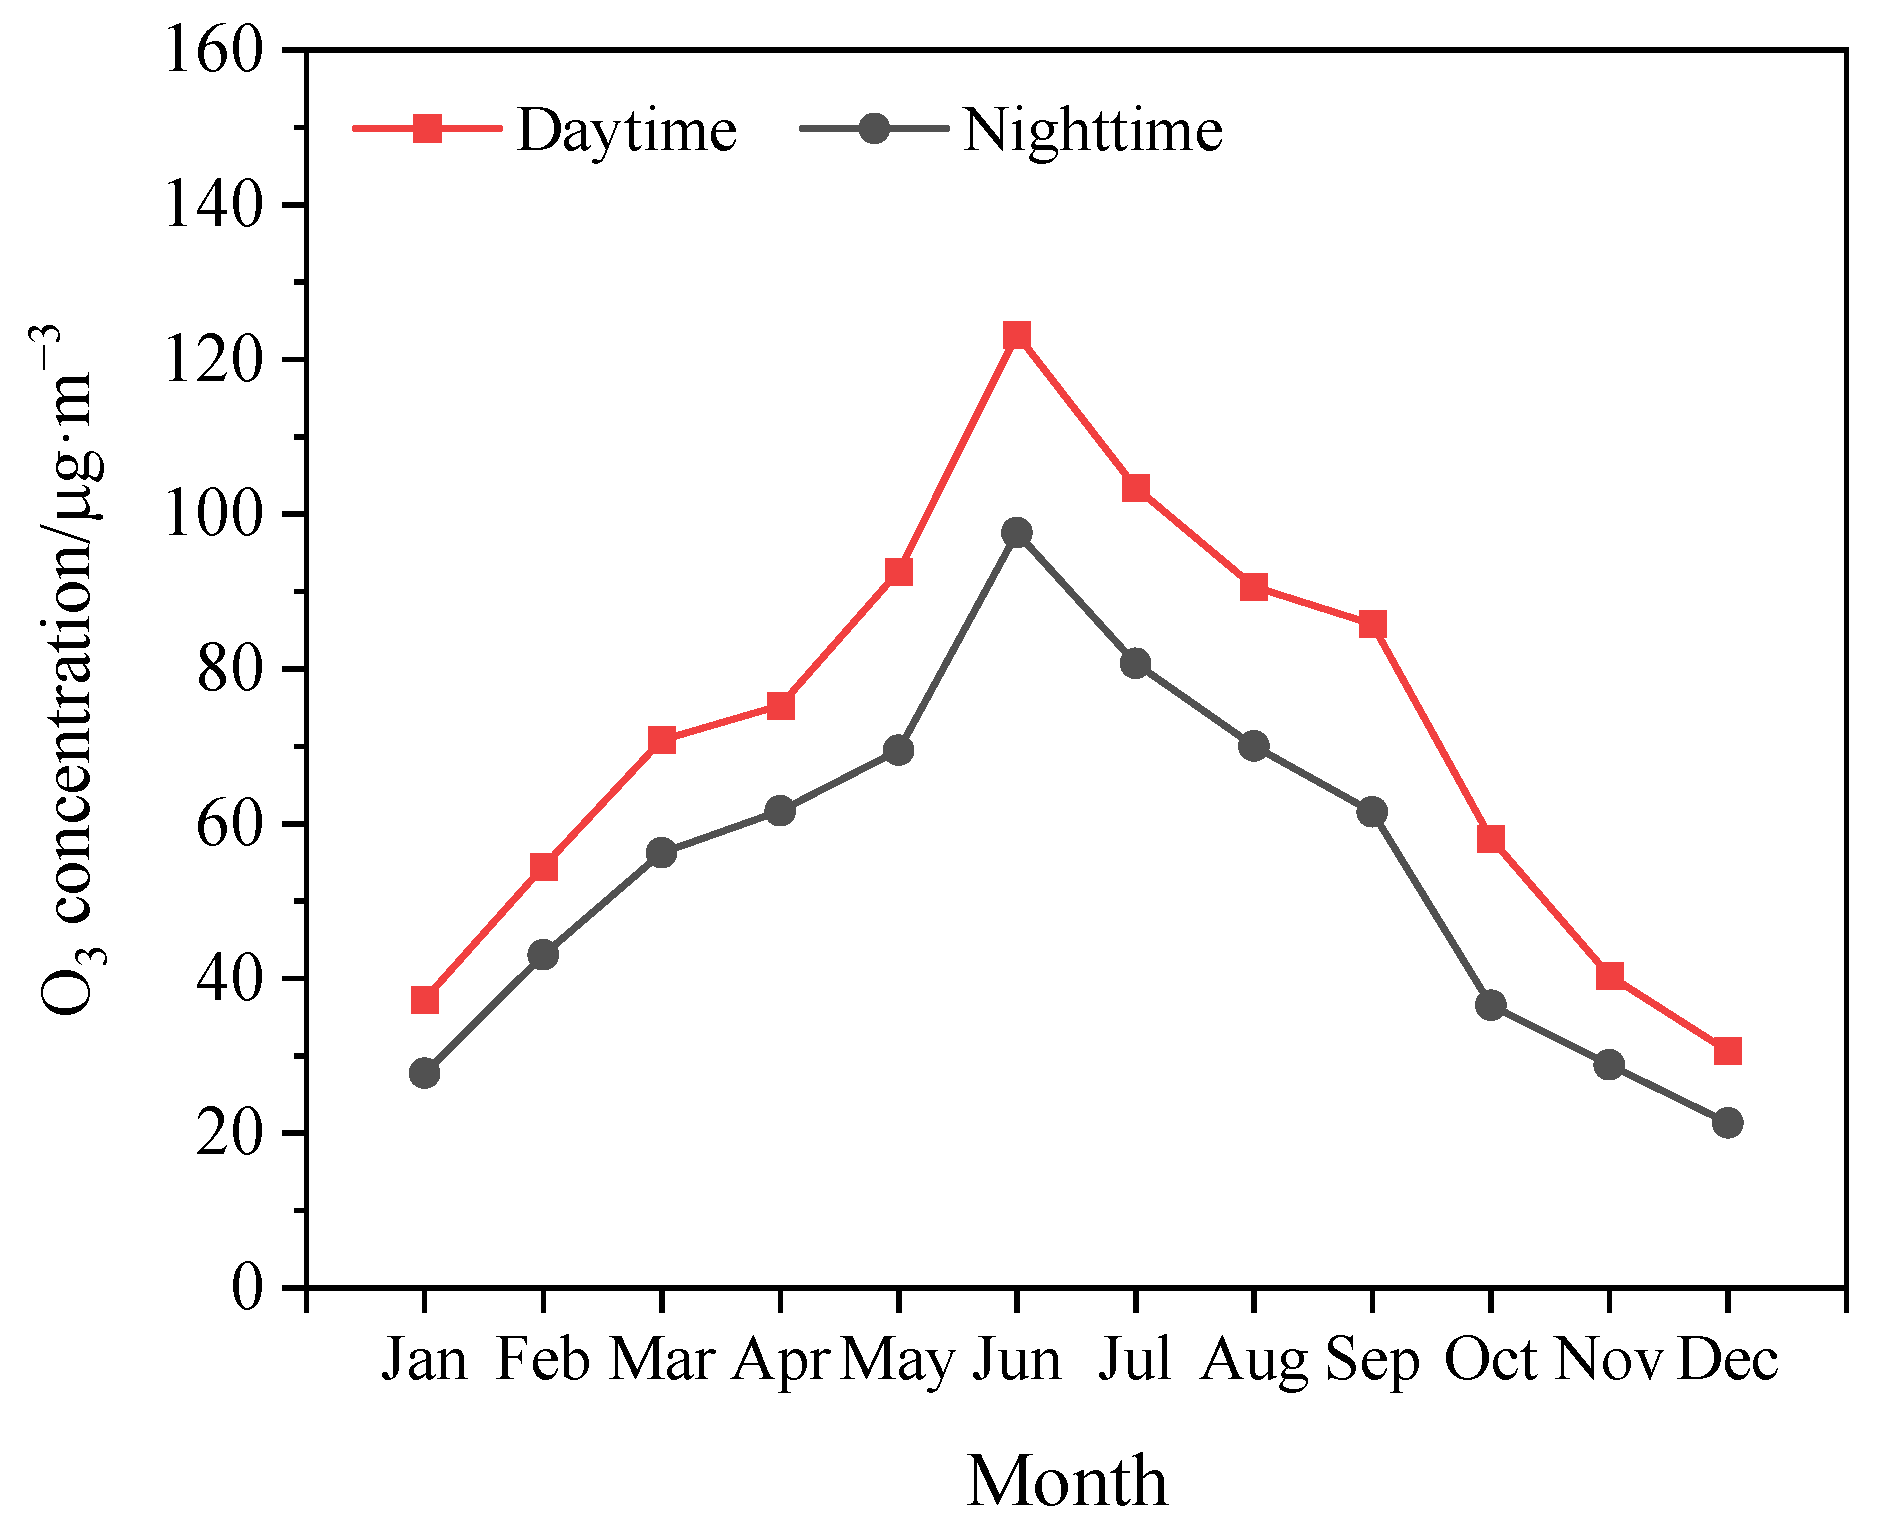
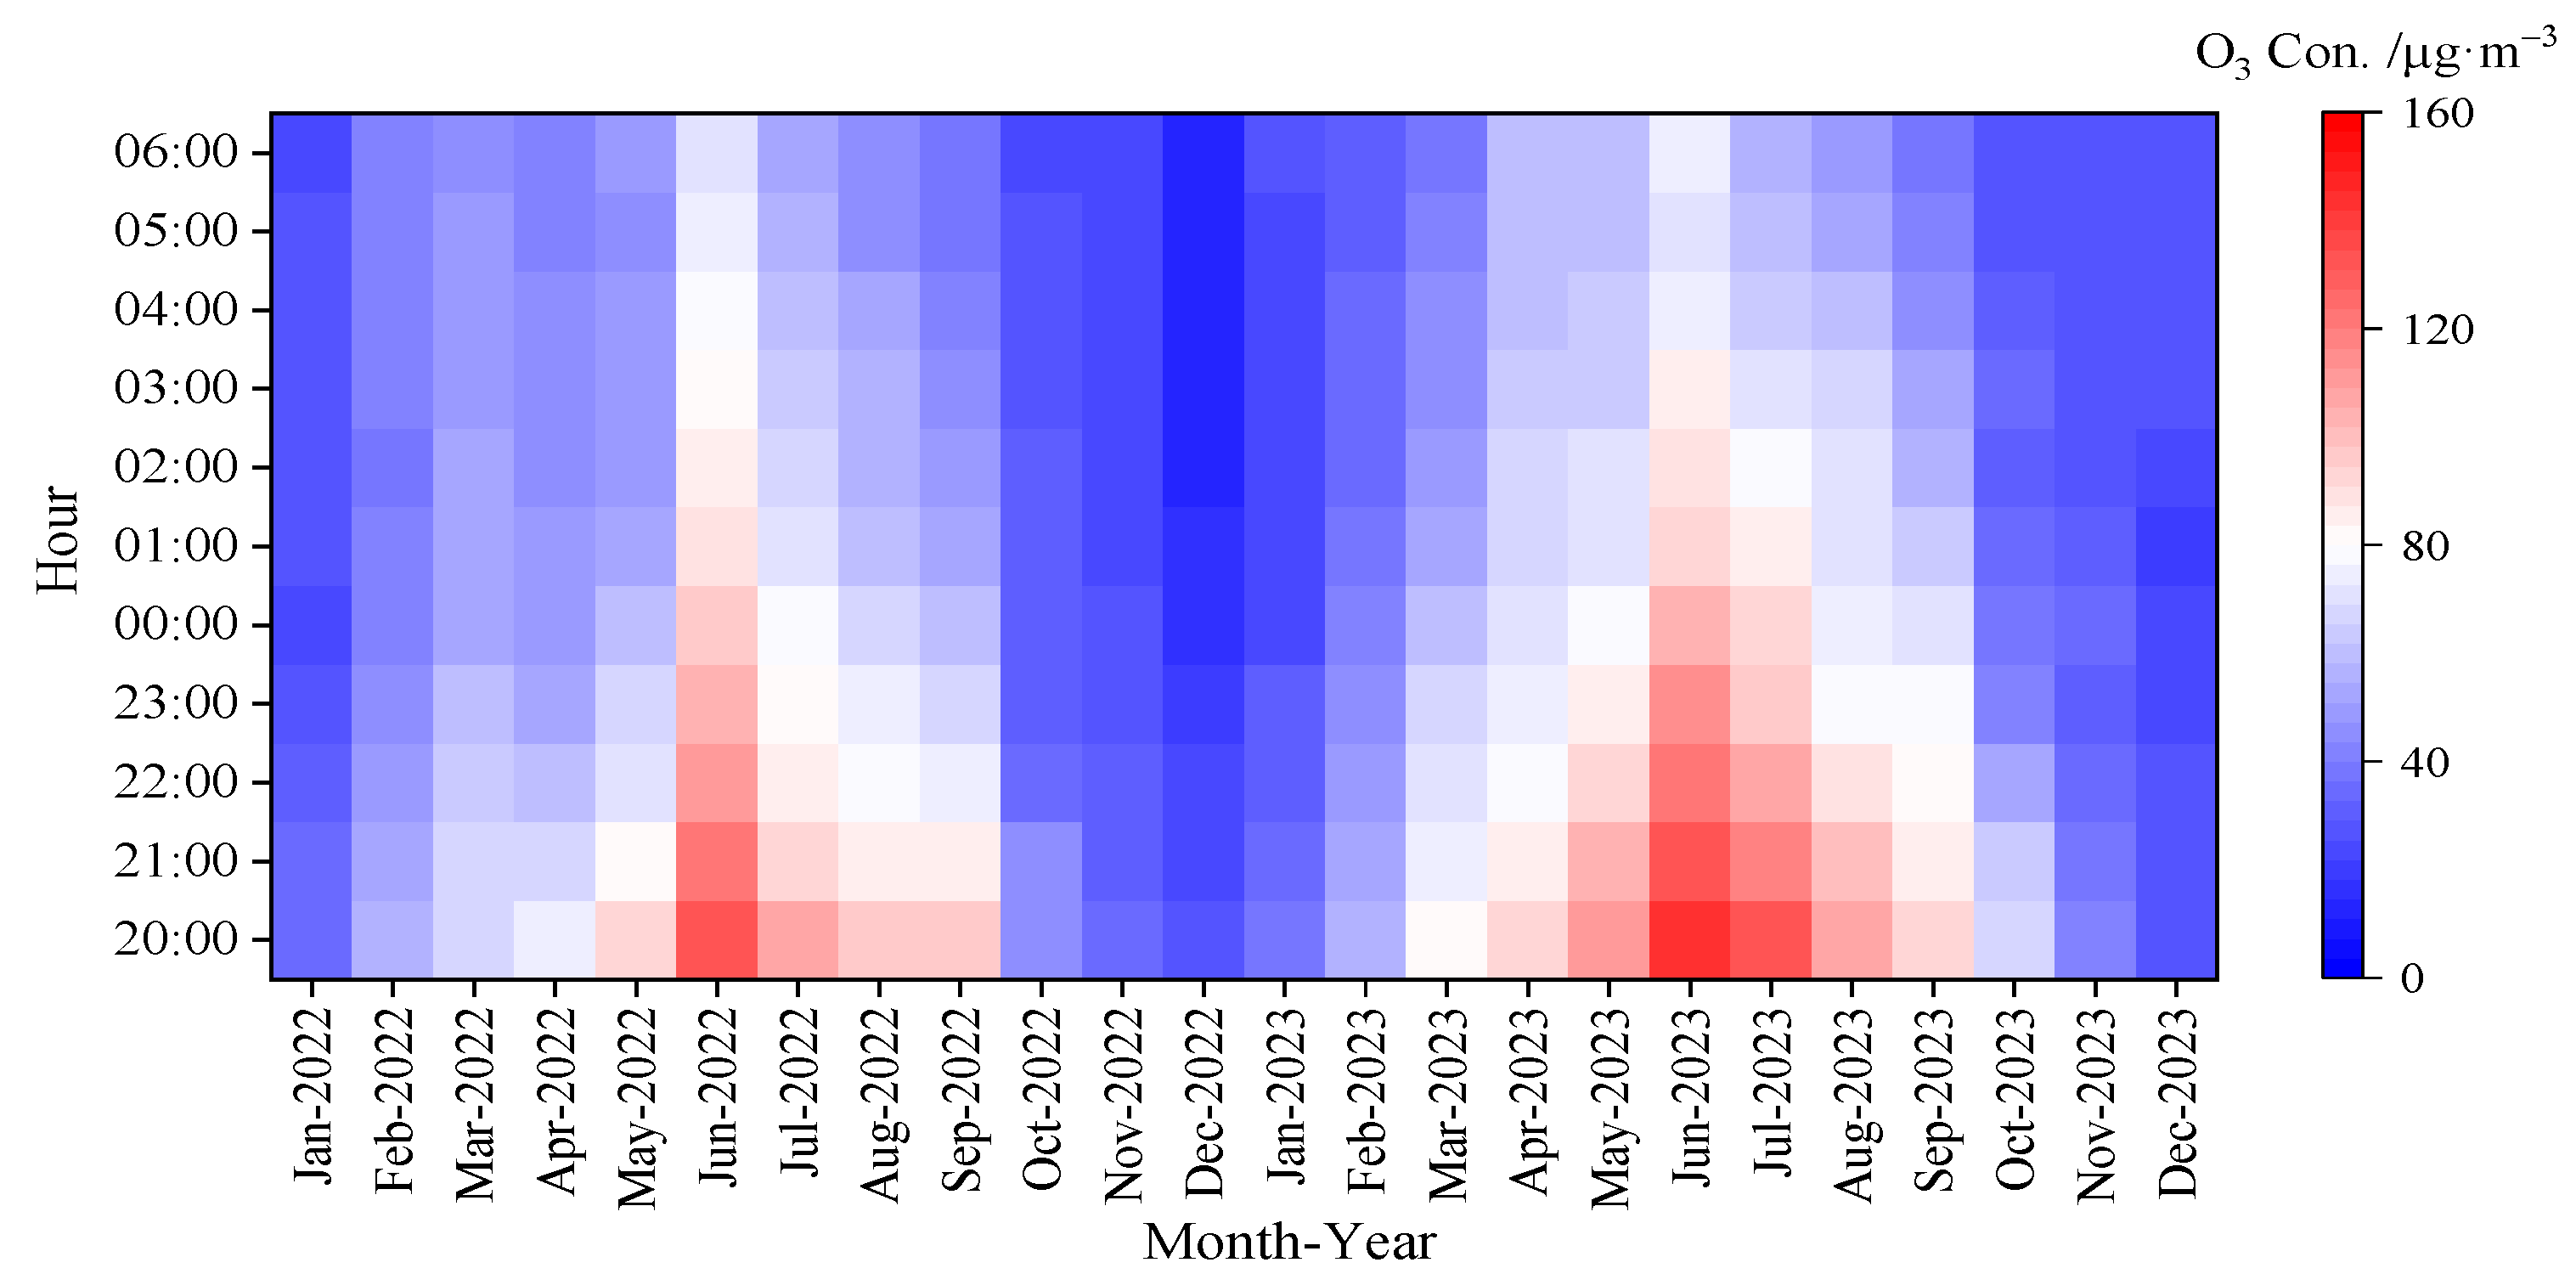
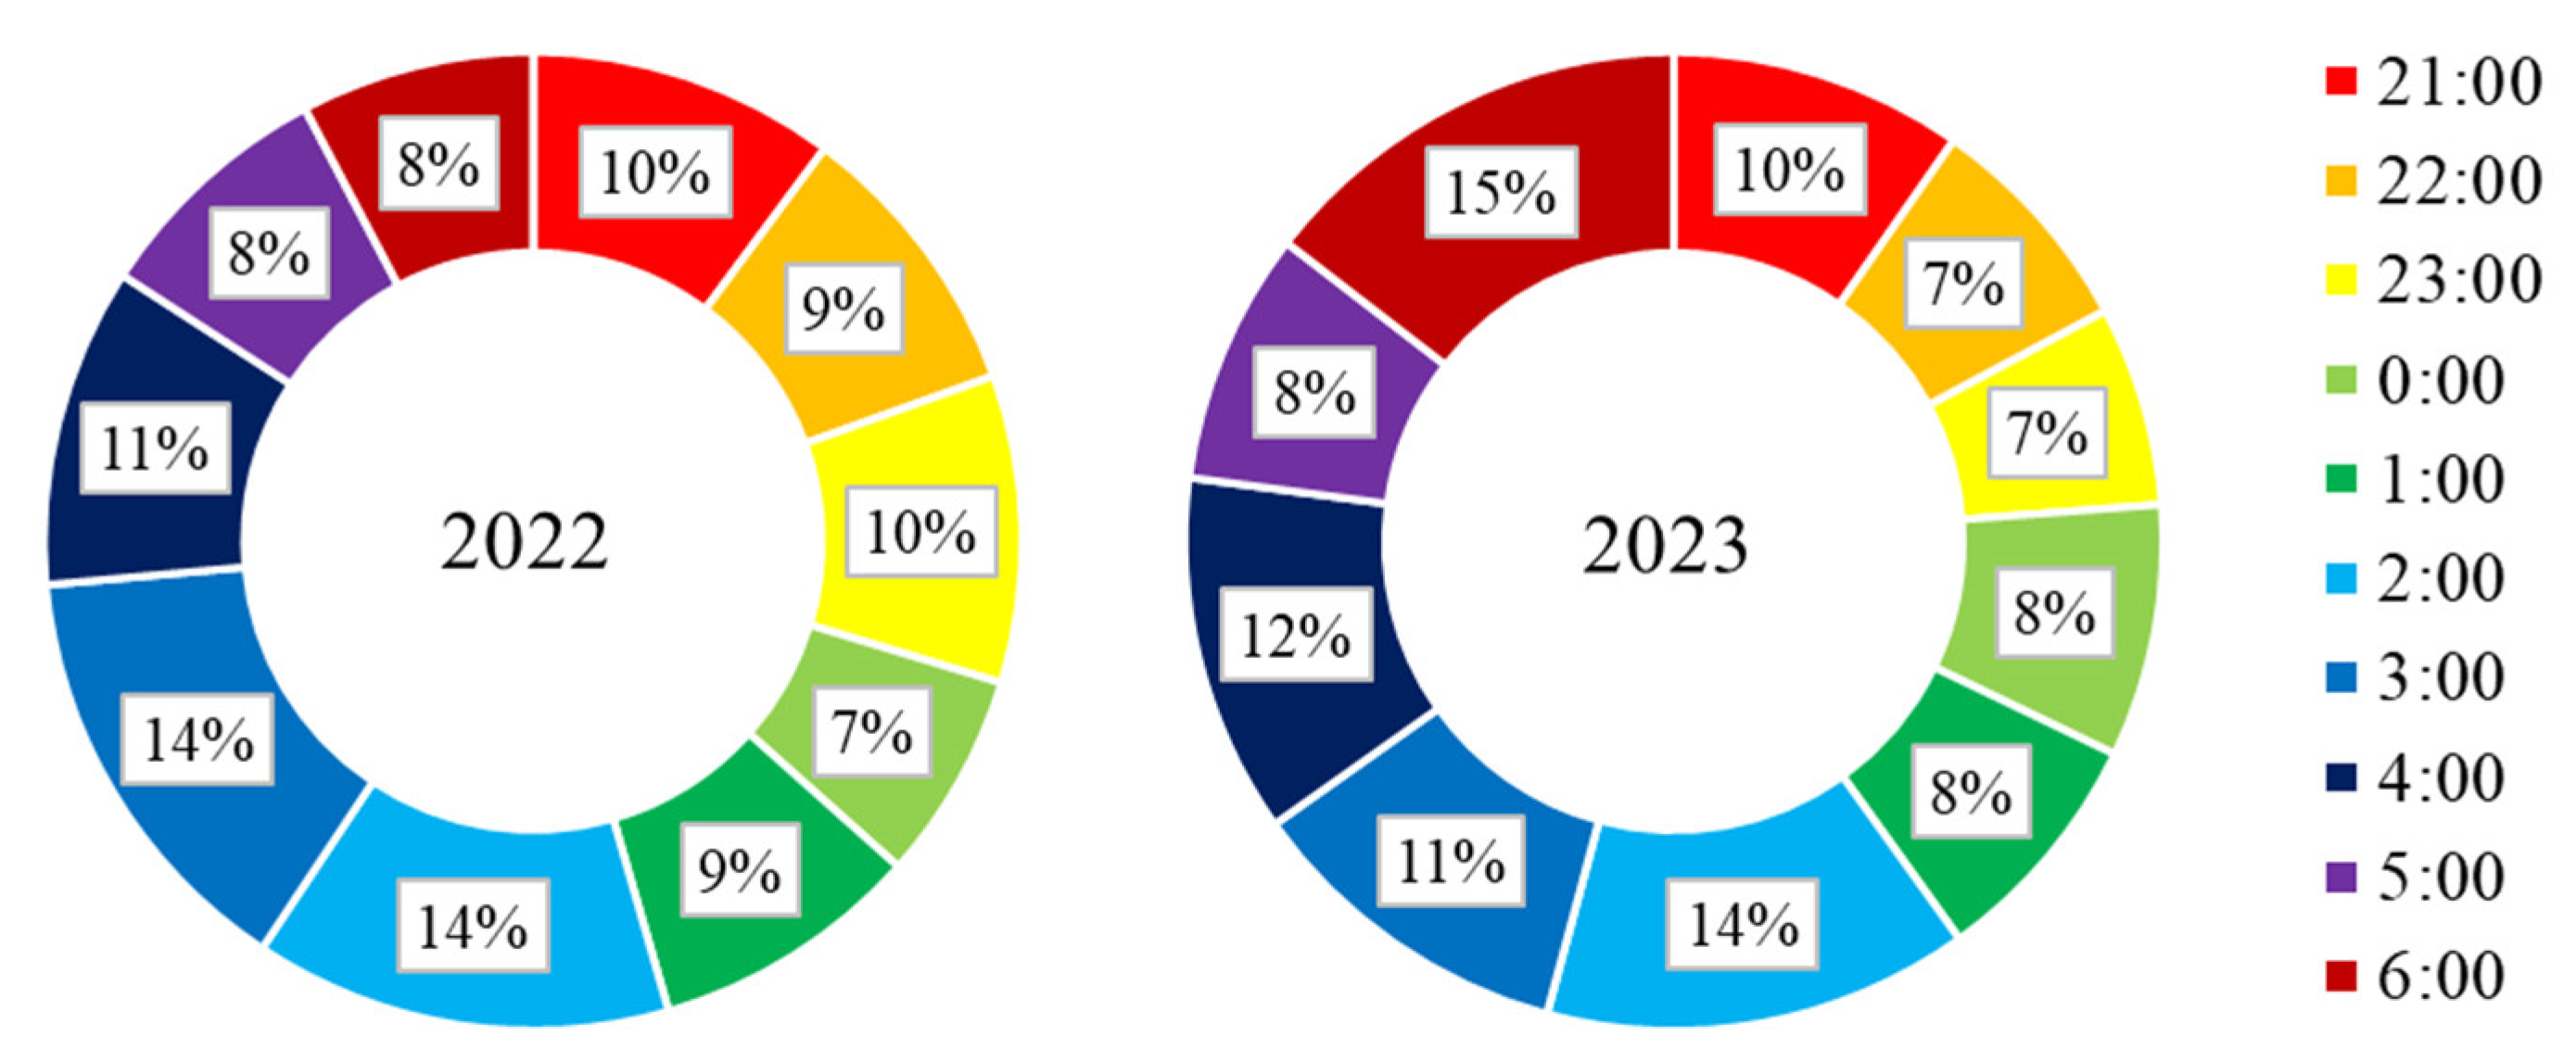
3.1.2. Diurnal Variation

From 2022 to 2023, the diurnal variation in nocturnal ozone concentration showed a decreasing trend or weak unimodal distribution in Dongying (Figure 7). The diurnal variation s in nocturnal ozone concentration during the ozone pollution season (April to September) showed a noticeable decreasing trend, while the diurnal variations from January to February and November to December showed a weak, unimodal distribution. Most of the nocturnal ozone concentrations increased slightly from 1:00 to 6:00. Compared with 2022, the nocturnal ozone concentration in Dongying increased from April to November in 2023. The most notable escalation was observed in July, characterized by an average elevation of 25 μg/m3 from 20:00 to 21:00. Subsequently, a discernible rise was documented from 21:00 to 1:00 of the subsequent day in April, exhibiting an average increase of 21 μg/m3. In May, a notable increase was noted from 20:00 to 0:00, demonstrating an average elevation of 20 μg/m3. Following this, December’s 2:00 to 6:00 timeframe showed an average increase of 20 μg/m3, while October’s 20:00 to 22:00 timeframe manifested an average rise of 19 μg/m3. This may be due to the higher daytime ozone concentration in Dongying in 2023. The 90th percentile of MDA8-O3 was 221 μg/m3 in Dongying in July 2023, with an increase of 30 μg/m3 compared with 2022. Higher ozone concentrations during the day in July 2023 may lead to higher ozone concentrations at night.

3.2. Characteristics of Nocturnal Ozone Enhancement Events in Dongying

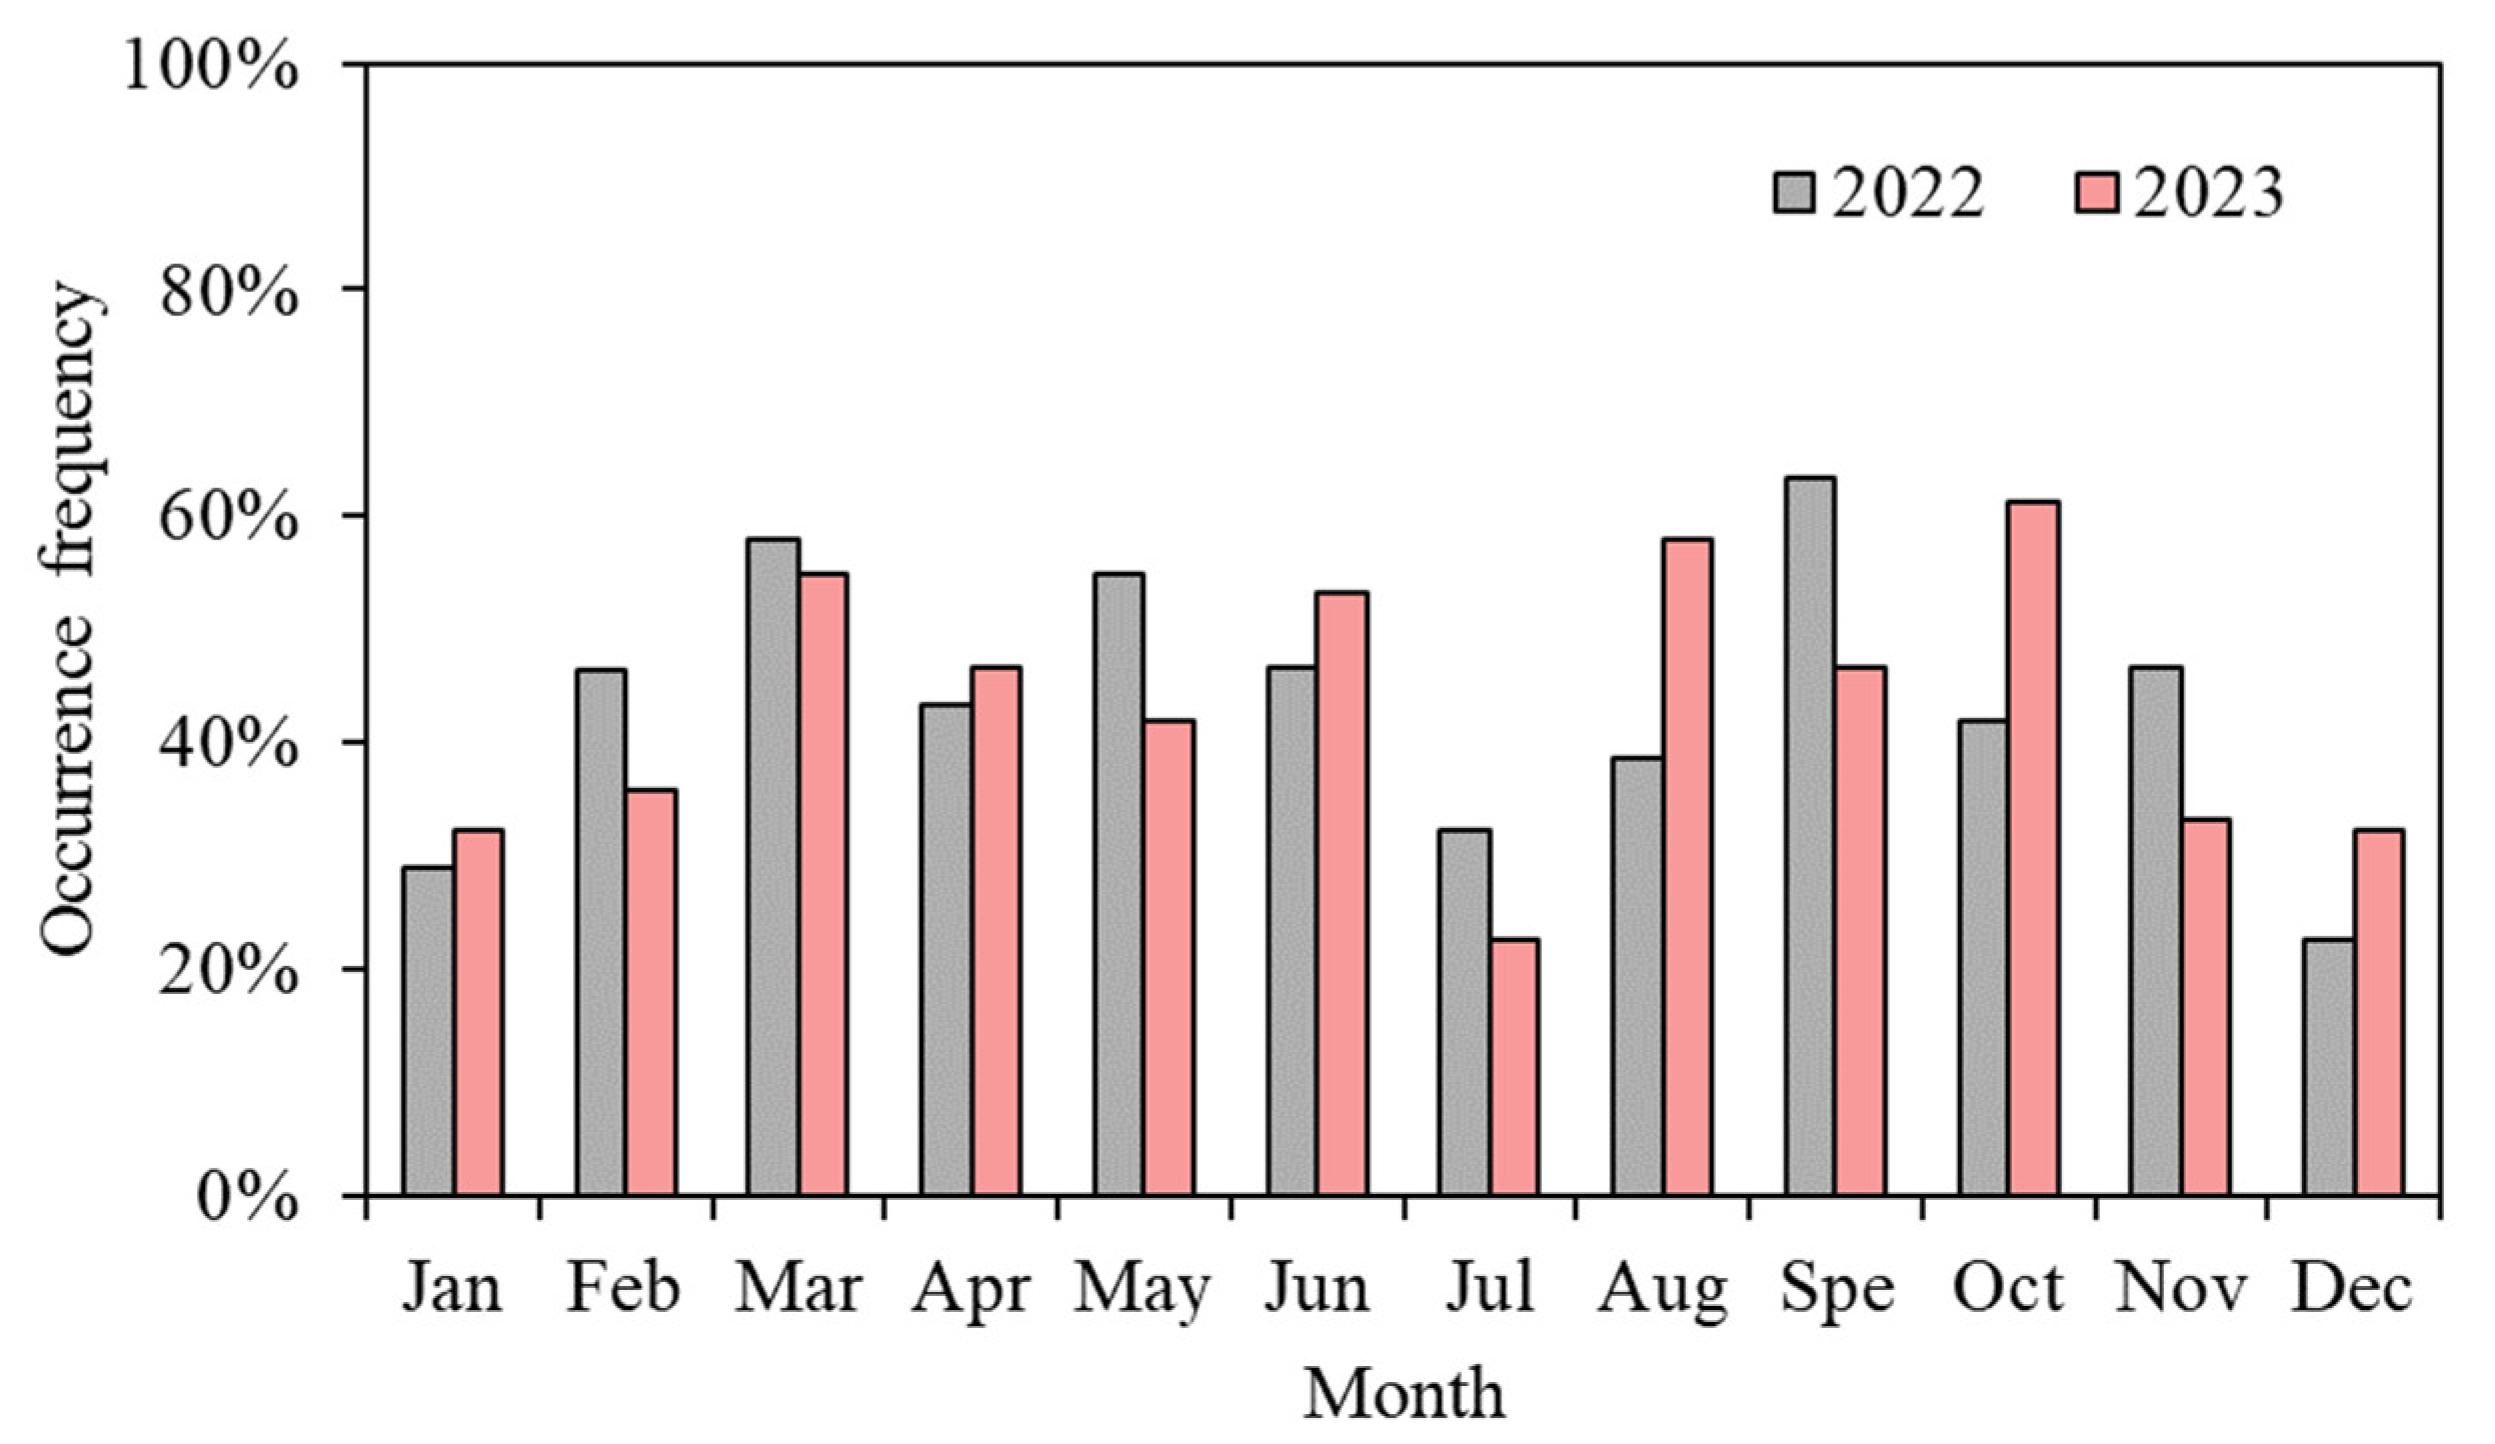
3.2.1. Frequency Characteristics

NOE events in Dongying from January 1, 2022 to December 31, 2023 were selected. The results showed that the annual average frequency of NOE events was 44% and 43% in Dongying in 2022 and 2023, respectively. This is comparable to the results of He et al.’s research on the frequency of NOE events in China [14]. The NOE events may be attributed to the nocturnal transport of high ozone concentrations from upwind cities, the downward transport of ozone from the night residual layer, and some specific meteorological processes, such as low-level jet streams, convective storms, and local circulation [14,24,25,26,27,45,46]. Overall, the frequency of NOE events in Dongying was higher in spring, summer, and autumn and lower in winter from 2022 to 2023 (Table 1 and Figure 8). The frequency of NOE events from February to March, May, July, September, and November in 2023 decreased compared with 2022, while the frequency in January, April, June, August, October, and December in 2023 increased compared with 2022, and the largest increase was in August and October. This might be related to changes in pollutant emissions and meteorological conditions in Dongying.
In particular, the frequency of NOE events in both July and December was relatively low. He et al. (2022) found that in the North China Plain, China, the frequency of NOE events is higher in the warm season and lower in the cold season, consistent with the seasonal variation characteristics of daytime ozone concentrations [14]. Hence, the daytime ozone concentration appears to influence the frequency of NOE events to a certain extent. The ozone concentration in Dongying is relatively low in December (Figure 3 and Figure 4), corresponding to a lower frequency of NOE events, aligning with findings from He et al. (2022). However, in July, despite higher ozone concentrations (Figure 3 and Figure 4), the frequency of NOE events is lower, which may be influenced not only by the daytime ozone concentration but also by factors such as transport and atmospheric stability [47]. Atmospheric stability is typically influenced by various factors such as seasonality, geographical location, and meteorological conditions. The nocturnal boundary layer height serves as a robust indicator of the nocturnal atmospheric vertical mixing capability. Thus, the average ozone concentrations and nocturnal boundary layer heights in Dongying for different months were analyzed to ascertain the reasons behind the lower occurrence frequency of NOE events in July and December. A higher nocturnal boundary layer height indicates more vigorous vertical mixing processes, which are conducive to ozone vertical transport. Conversely, a lower nocturnal boundary layer height implies relatively stable atmospheric conditions [48]. During the study period, the average ozone concentrations were higher in July (103.5 μg·m−3) and lowest in December (30.6 μg·m−3) (Figure 9a). The lowest nocturnal boundary layer height was recorded in July (519.8 m), with December exhibiting relatively lower boundary layer heights (589.0 m), indicating relatively stable atmospheric conditions in both July and December (Figure 9b). Therefore, the lower nocturnal boundary layer heights and higher ozone concentrations in July contributed to the lower frequency of NOE events in July, while the lower nocturnal boundary layer heights and lower ozone concentrations in December led to the reduced frequency of NOE events in December. This suggests that, compared to ozone concentrations, the nocturnal boundary layer height may play a more crucial role in the occurrence of NOE events in Dongying.
Compared with 2022, the frequency of NOE events at 22:00, 23:00, 1:00, and 3:00 in 2023 decreased, while the frequency at 0:00, 4:00, and 6:00 increased (Figure 10). Overall, the frequency of NOE events was the highest at 2:00 in Dongying, with a total of 66 events during the two years, followed by 3:00, 4:00, and 6:00. The distribution characteristics of NOE events in Dongying at different times in 2022 and 2023 were generally similar. The frequency of NOE events was higher between 2:00 and 4:00, while it was lower between 21:00 and 1:00 the next day. The NOE events exhibited a higher frequency around midnight and a lower frequency in the early night hours. This pattern may be attributed to the stronger NOx titration effects shortly after sunset, making NOE events less likely to occur during the early night hours [14,24,46].

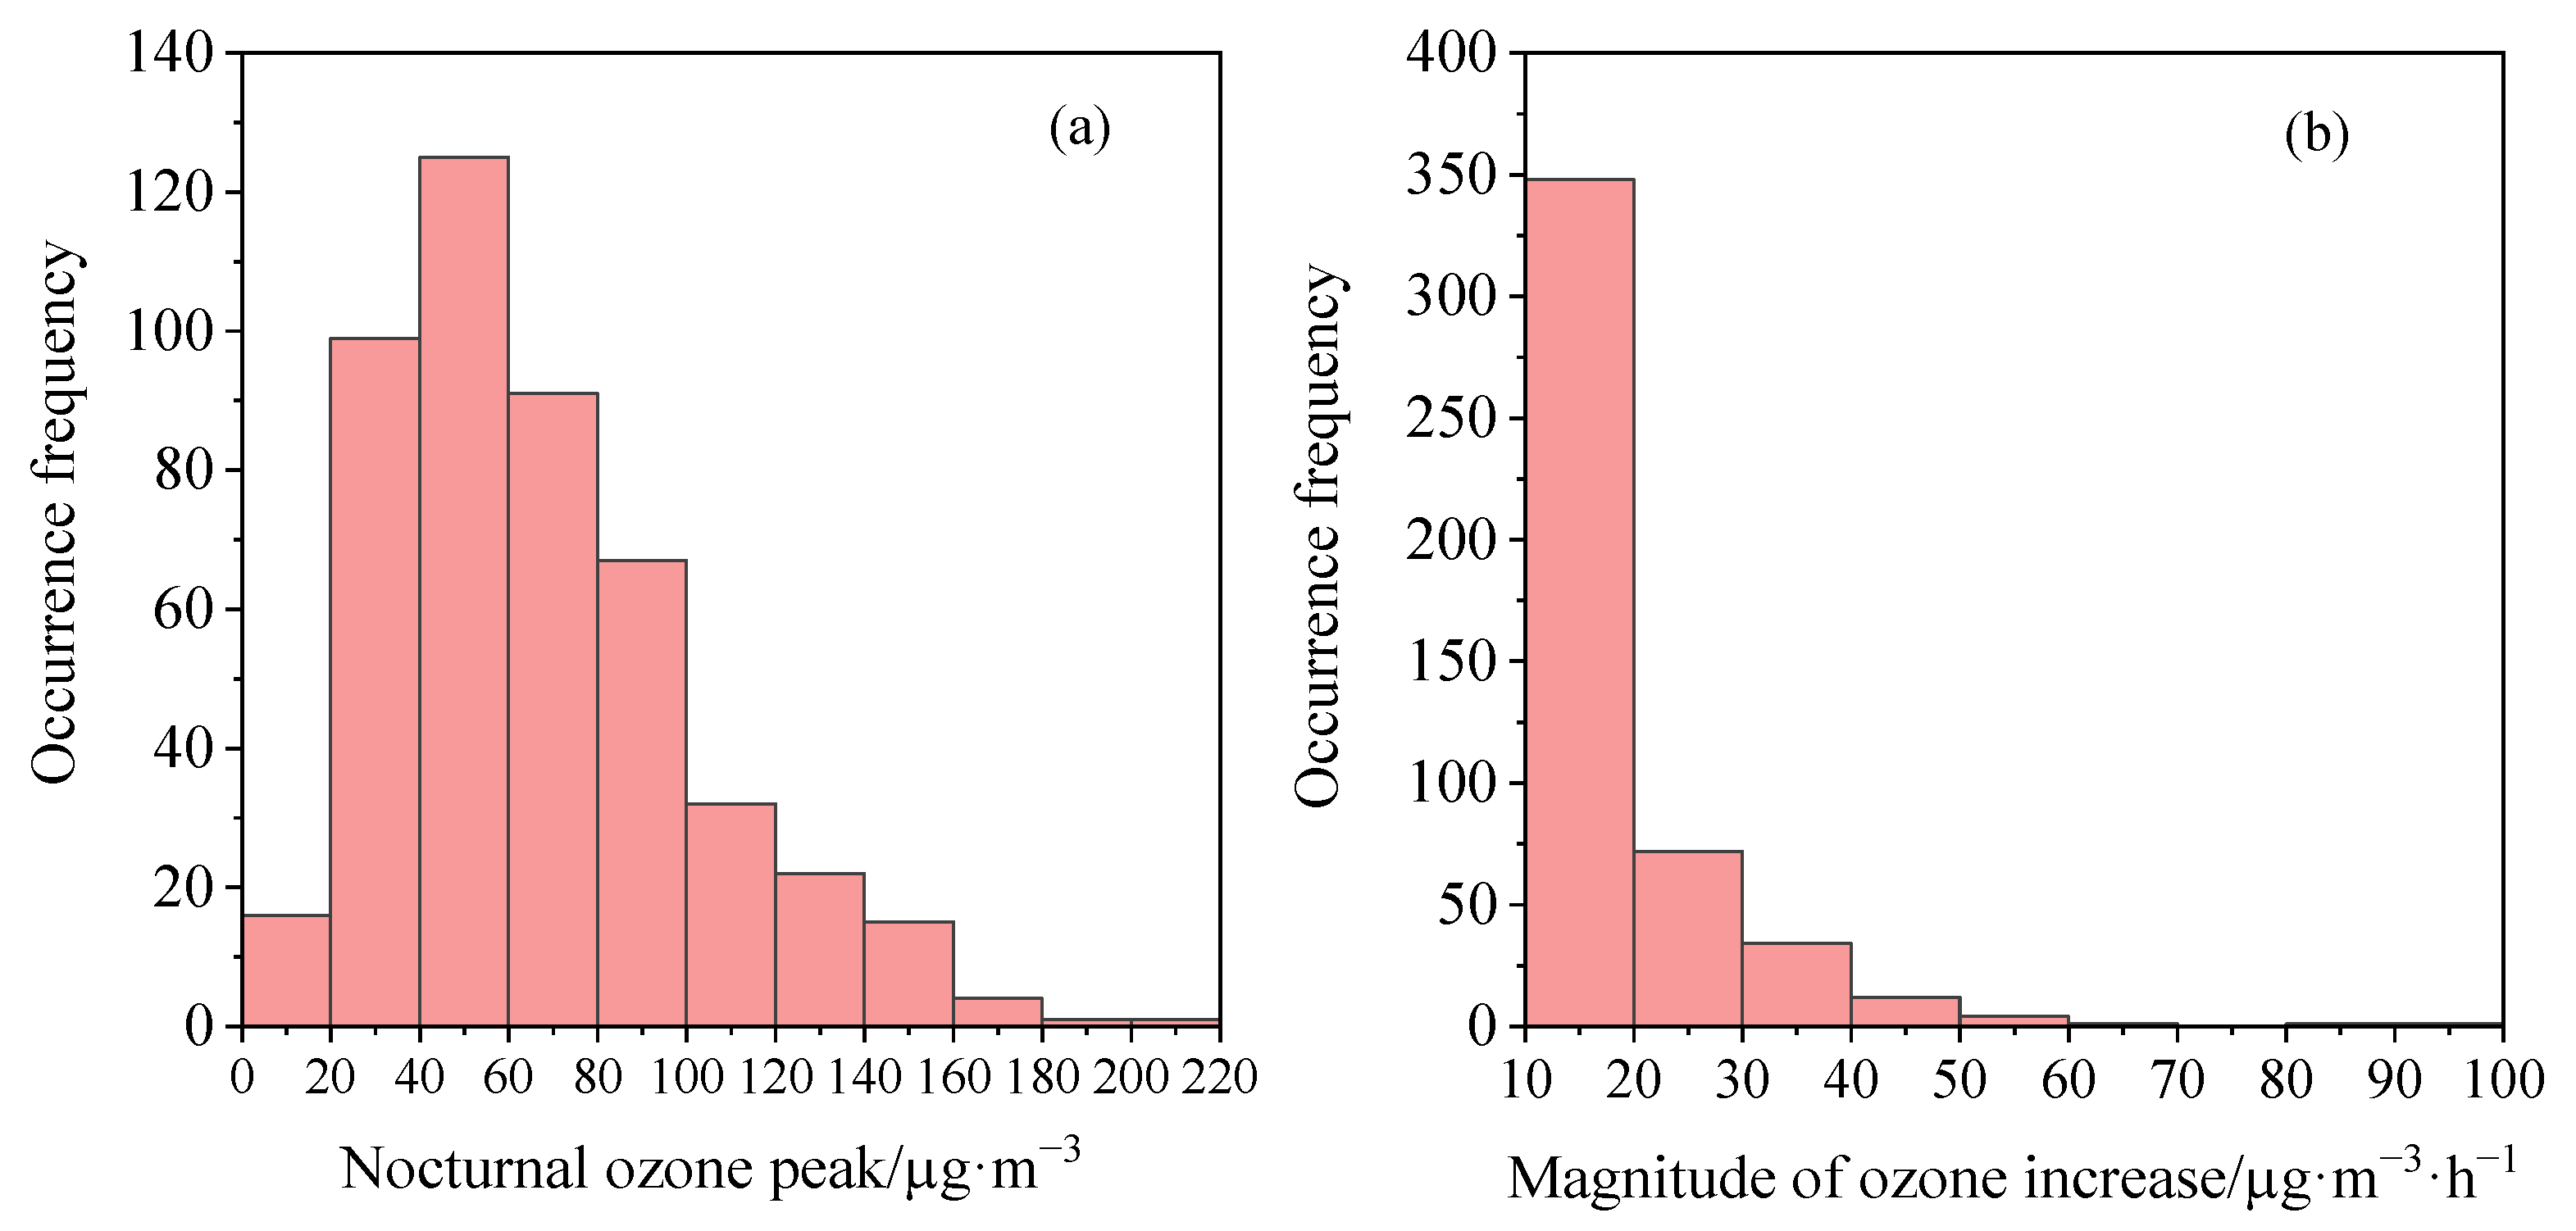
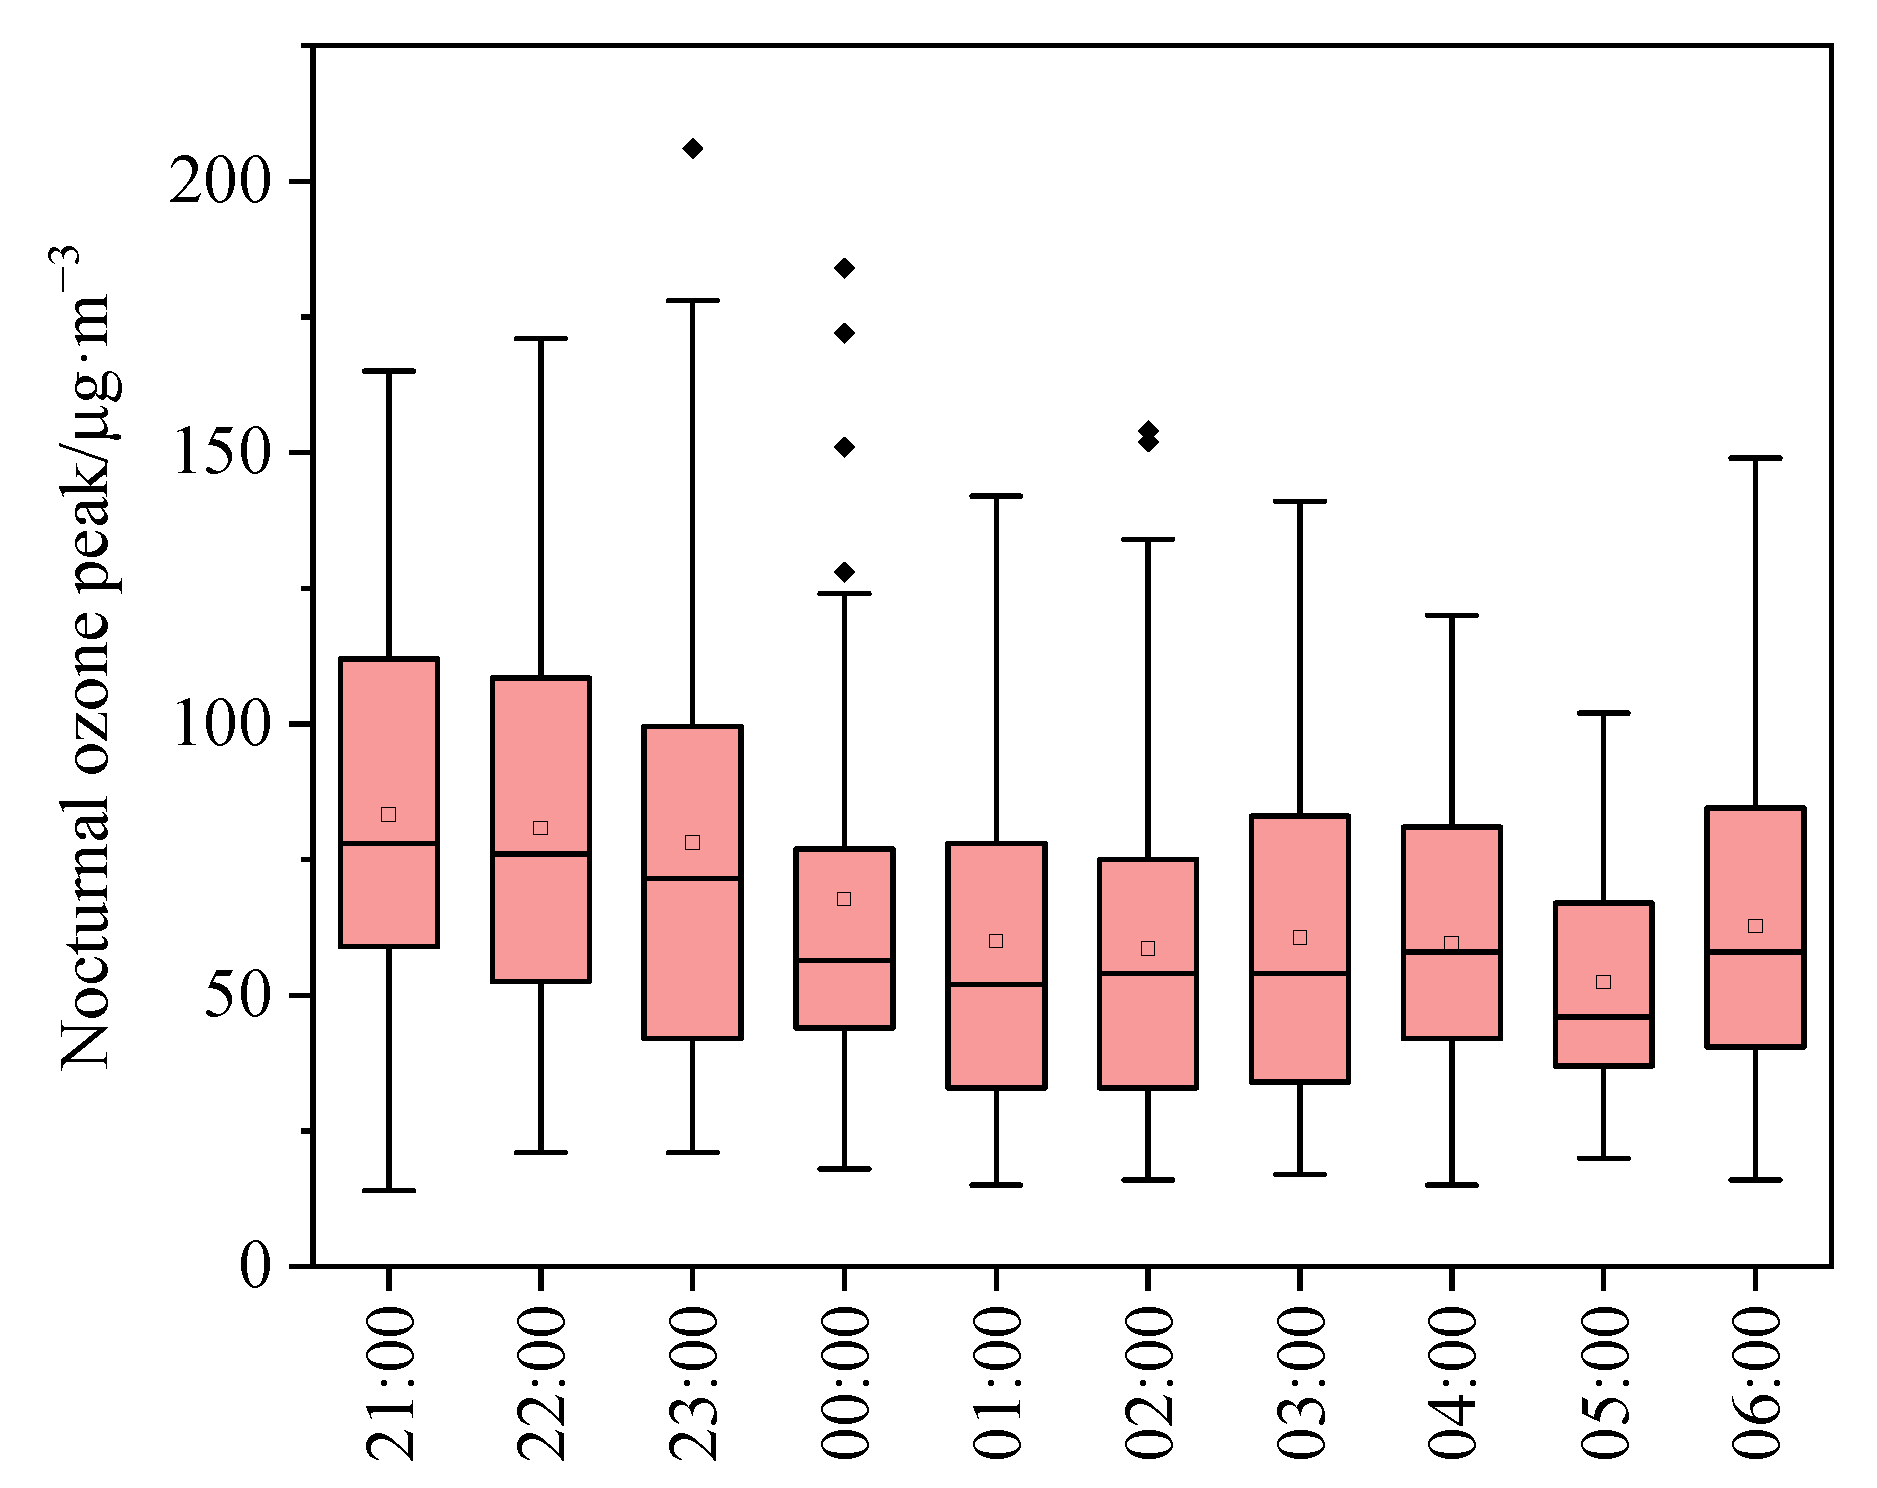
3.2.2. Characteristics of Nocturnal Ozone Peak and Ozone Increase Magnitude

The nocturnal ozone peak is most frequently distributed in the range of 40–60 μg/m3 (occurring 125 times), followed by 20–40 μg/m3 (occurring 99 times), 60–80 μg/m3 (occurring 91 times), and 80–100 μg/m3 (occurring 67 times) (Figure 11a). During the study period, the nocturnal ozone peak exceeded 160 μg/m3 on six occasions, and the maximum nocturnal ozone peak was 210 μg/m3. This is comparable to the maximum of nocturnal ozone peaks in Jinan, China, Shenzhen, China, and Malaysia [45,46,47,49,50]. It could be seen that Dongying, a central city of the Yellow River Delta, had extremely high nocturnal ozone peaks when NOE events occurred, which might have adverse effects on human health.
In the majority of NOE events in Dongying from 2022 to 2023, the ozone increase magnitude (ΔO3/Δt) was distributed in the range of 10 to 20 μg/m3, followed by 20 to 30 μg/m3, 30 to 40 μg/m3, and 40 to 50 μg/m3 (Figure 11b). This is consistent with the results of He et al. [14], which showed that the majority of nocturnal ozone that increased in magnitude in China ranged from 10 to 20 μg/m3. The maximum increase in nocturnal ozone concentration in Dongying can reach up to 95 μg/m3. Currently, most studies generally believe that NOE events are caused by horizontal advection and vertical transport. When extreme weather conditions occur, such as typhoons and strong convective weather, nocturnal ozone concentrations may experience significant increases [26,51,52]. Therefore, the magnitude of nocturnal ozone increase is primarily distributed in the low concentration range, with fewer occurrences in the high concentration range, possibly due to the infrequency of extreme weather events under normal circumstances.
From 2022 to 2023, the nocturnal ozone peak in Dongying gradually decreased from 21:00 to 6:00 of the next day (Figure 12). During the study period, the nocturnal ozone peak was higher from 21:00 to 23:00, with an average value of 81 μg/m3. From 0:00 to 6:00, the nocturnal ozone peak changed slightly, and the average nocturnal ozone peak was 60 μg/m3. This is consistent with the results of Wu et al.’s research in the Pearl River Delta in China, which showed a gradual decreasing trend in nocturnal ozone peak from 21:00 to 6:00 of the next day [24].

3.3. Effects of Nocturnal Ozone Enhancement Events on Ozone and PM2.5 Concentrations in Dongying

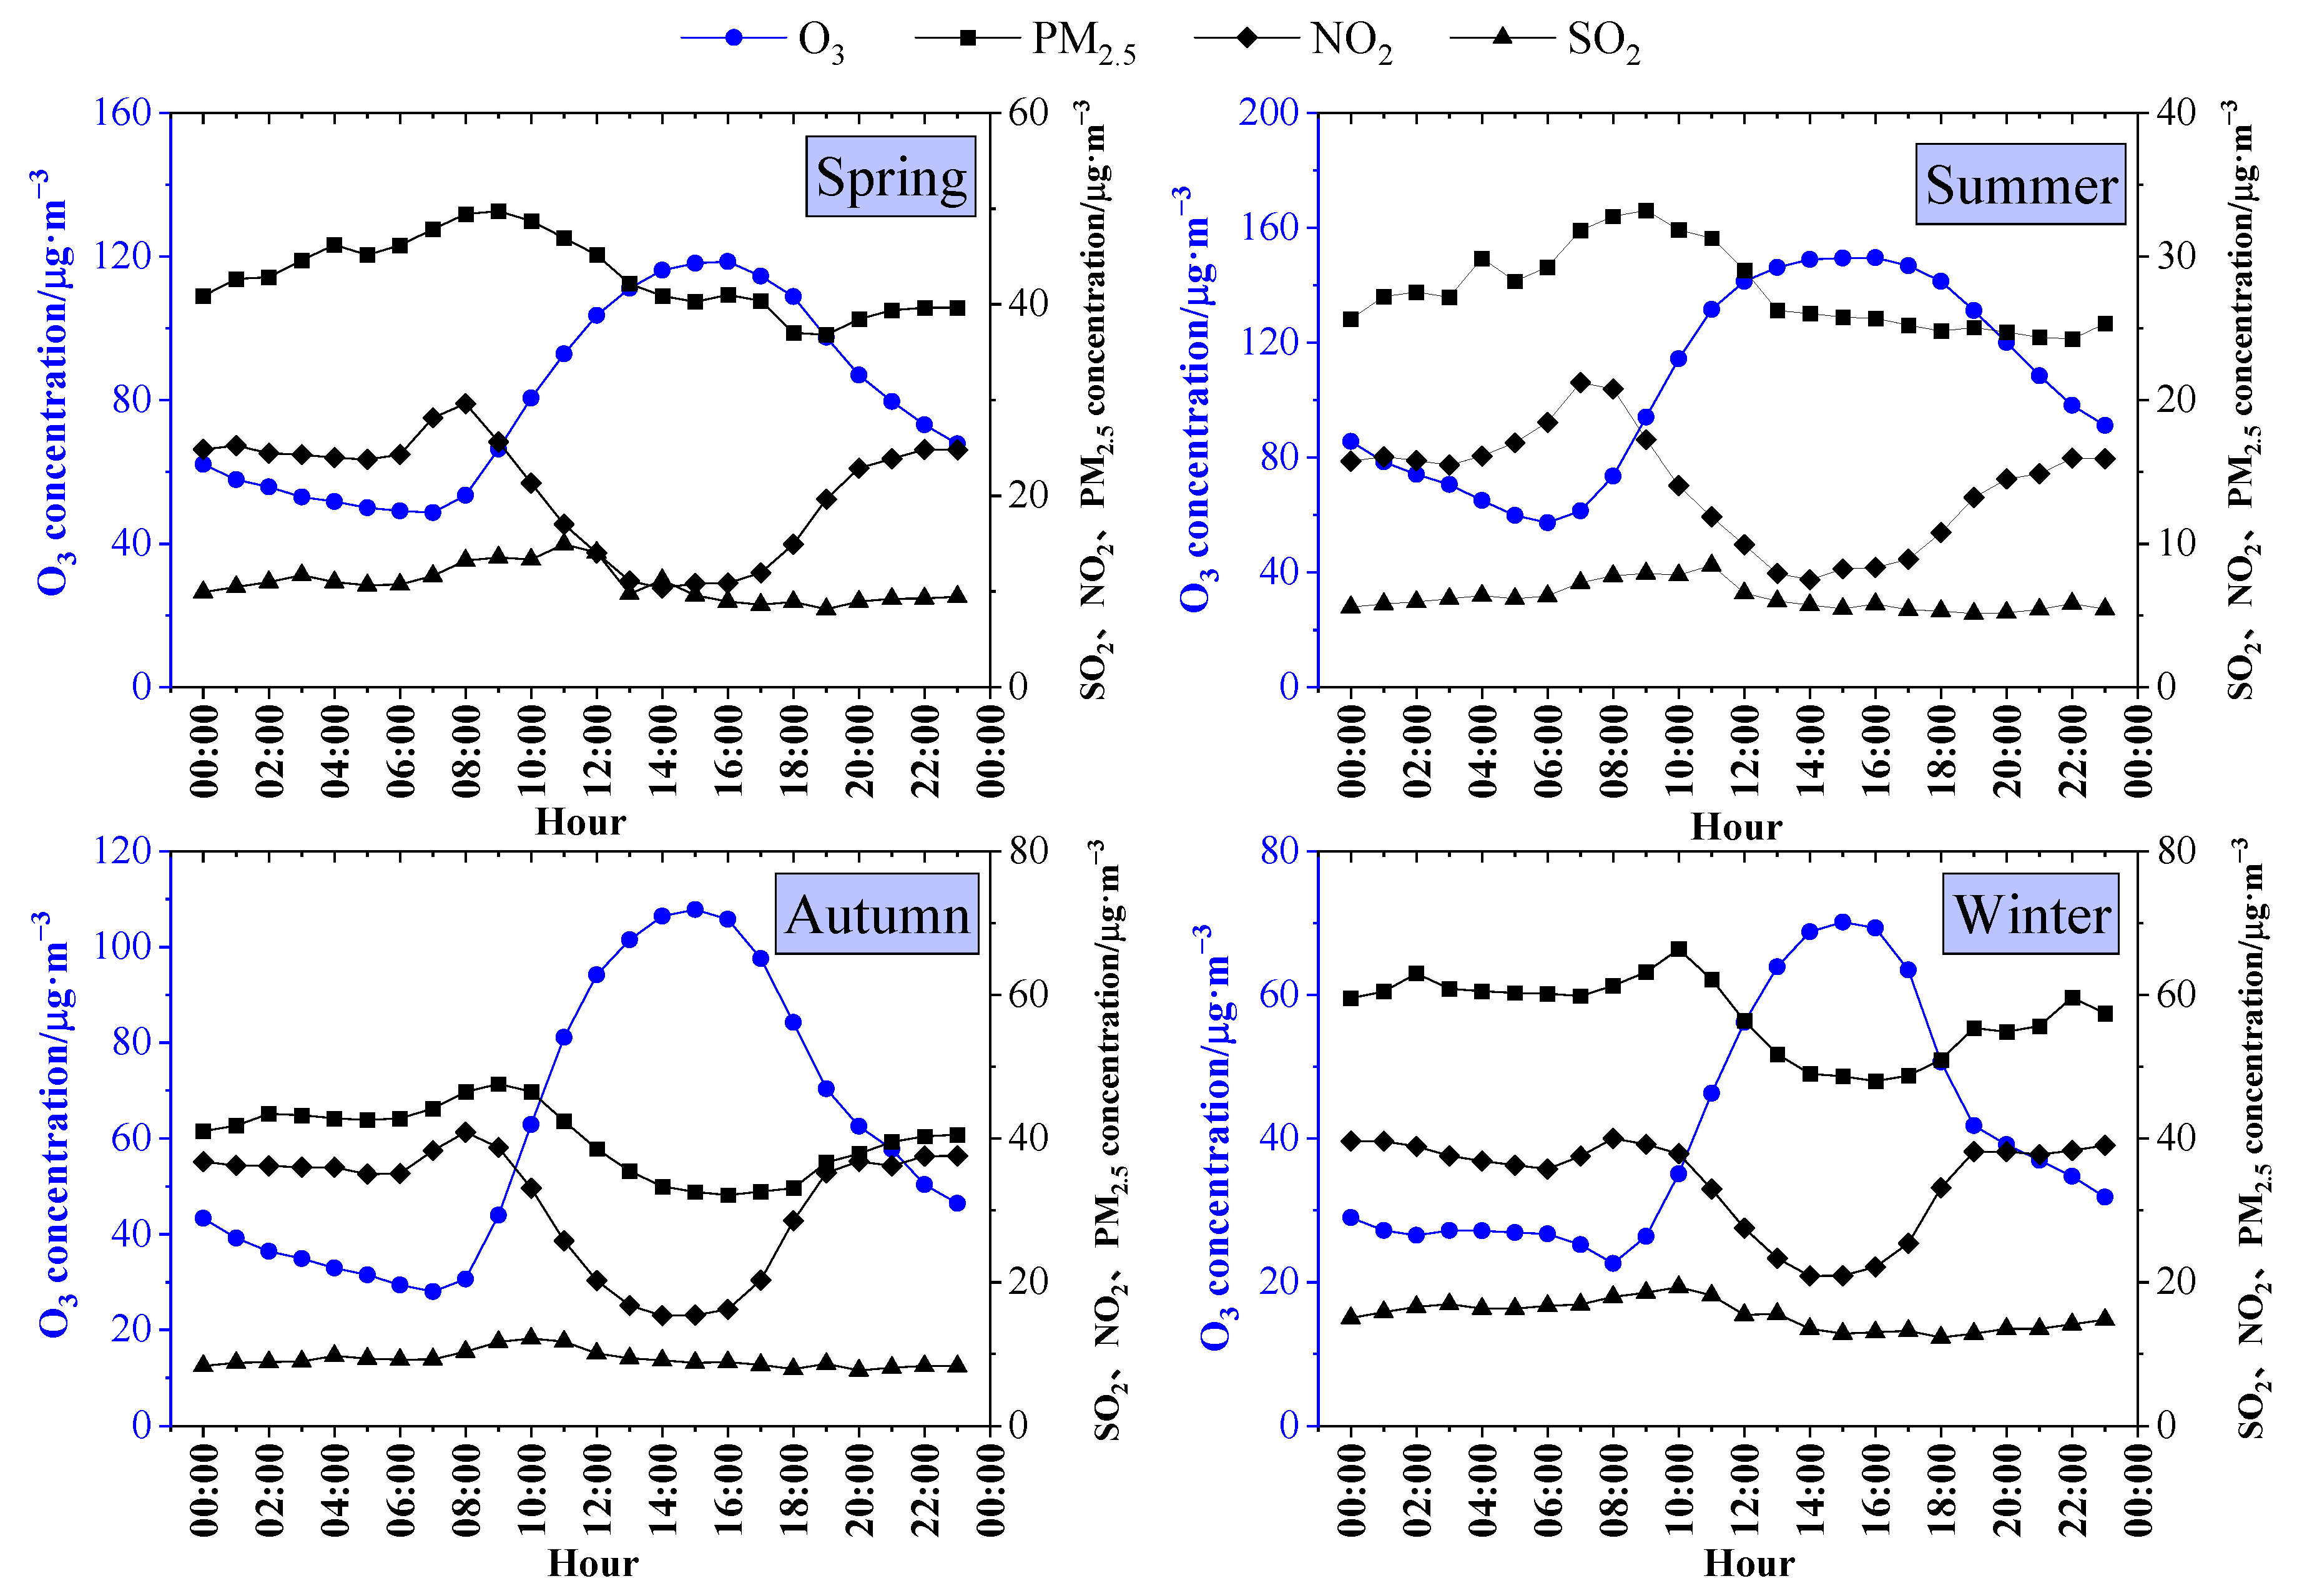
3.3.1. Diurnal Variations in Ozone and Other Air Pollutants during Different Seasons

The gas and aerosol component concentrations in Dongying during different seasons from 2022 to 2023 are shown in Figure 13 and Figure 14. The daily variations in O3 concentrations in different seasons exhibited a single-peak distribution, with peak values of 119 μg/m3 (at 16:00), 150 μg/m3 (at 16:00), 108 μg/m3 (at 15:00), and 70 μg/m3 (at 15:00) during the different seasons. The daily variation in PM2.5 concentrations showed a fluctuating trend, with higher concentrations in the morning and night, reaching maximum values of 50 μg/m3 (at 9:00), 33 μg/m3 (at 9:00), 48 μg/m3 (at 9:00), and 66 μg/m3 (at 10:00) in different seasons. The daily variations in NO2 concentrations followed a U-shaped pattern, with higher concentrations in the morning and night, reaching maximum values of 30 μg/m3 (at 8:00), 21 μg/m3 (at 8:00), 41 μg/m3 (at 8:00), and 40 μg/m3 (at 8:00) during the different seasons. The SO2 concentrations exhibited relatively gentle daily variation characteristics, with a weak peak around noon, reaching maximum values of 15 μg/m3 (at 11:00), 8 μg/m3 (at 11:00), 12 μg/m3 (at 10:00), and 19 μg/m3 (at 10:00) during the different seasons.
The daily variations in Ox concentrations also showed a single-peak distribution, with peak values of 129 μg/m3 (at 16:00), 156 μg/m3 (at 16:00), 121 μg/m3 (at 16:00), and 90 μg/m3 (at 16:00) during the different seasons. The PM2.5-bounded NO3 concentrations in the spring, summer, and autumn exhibited distinct daily variations, with higher concentrations in the early morning and night and lower concentrations in the afternoon, reaching peak values of 15 μg/m3 (at 8:00), 9 μg/m3 (at 7:00), and 15 μg/m3 (at 9:00). In winter, the NO3 concentrations showed a relatively gradual daily variation, with a peak value of 16 μg/m3 (at 11:00). The PM2.5-bounded SO42− concentrations exhibited a relatively gentle daily variation, with maximum values of 7 μg/m3 (at 9:00), 8 μg/m3 (at 12:00), 6 μg/m3 (at 12:00), and 9 μg/m3 (at 11:00) during the different seasons. The SOC concentrations showed a relatively gentle daily variation, with maximum values of 7 μg/m3 (at 7:00), 7 μg/m3 (at 11:00), 8 μg/m3 (at 11:00), and 12 μg/m3 (at 9:00).

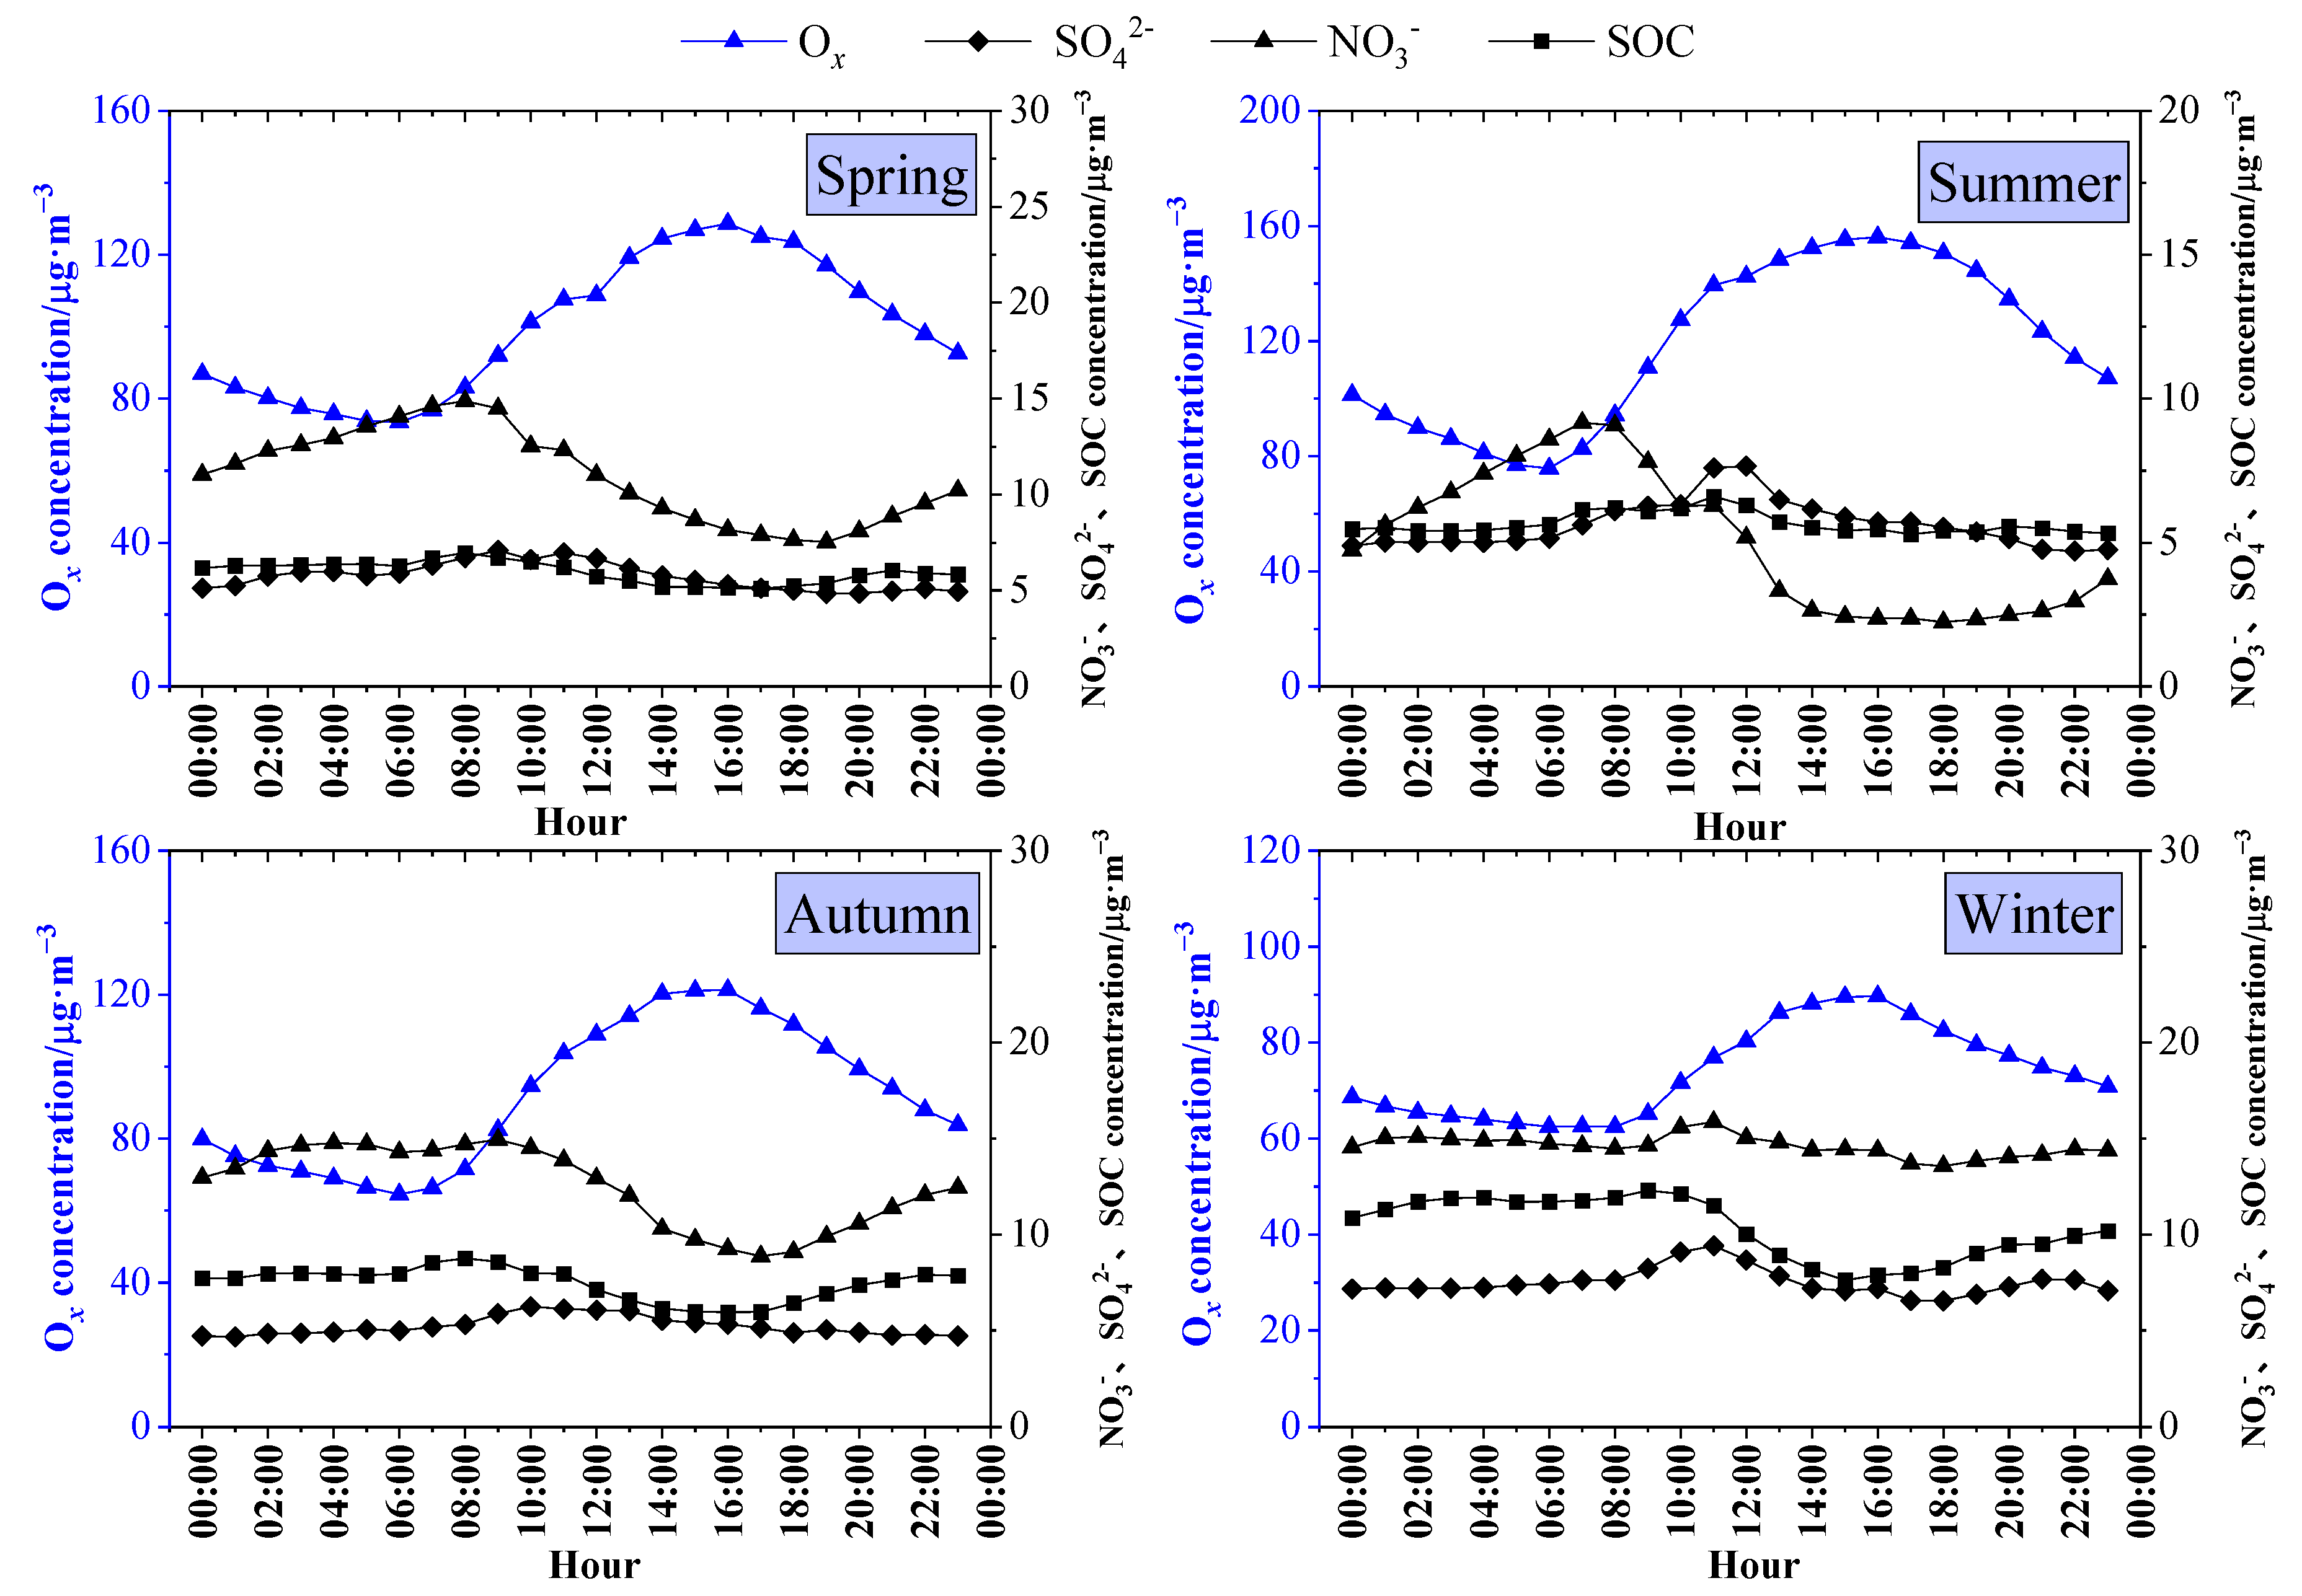
3.3.2. Effects on Ozone and Atmospheric Oxidation at Night and the Next Day

In 2022 and 2023, the average nocturnal O3 concentrations during NOE events in Dongying were 2 μg/m3 and 1 μg/m3 higher than the overall average nocturnal O3 concentrations in 2022 and 2023, respectively. Conversely, the average nocturnal O3 concentrations during NNOE events in Dongying in 2022 and 2023 were both 1 μg/m3 lower than the overall average nocturnal O3 concentrations in the same years. In 2022 and 2023, the average nocturnal ozone concentrations during NOE events in Dongying were 4 μg/m3 and 2 μg/m3 higher than those during NNOE events, respectively (Figure 15). The average nocturnal ozone concentrations during NOE events in January and June to October were higher than those during NNOE events. Compared to the NNOE events, the greater impact of the NOE events on the nocturnal ozone concentrations during the summer months may be attributed to more severe ozone pollution during the daytime in the summer. It is generally believed that NOE events are primarily influenced by atmospheric physical processes such as transport. From the perspective of horizontal transport, ozone concentrations in air masses are higher in the summer than in the winter; thus, upwind transport contributes to a greater increase in local ozone concentrations. From the perspective of vertical transport, higher residual layer ozone concentrations during the summer nights led to a more significant increase in the surface ozone concentrations. In January, the differences in ozone concentrations between NOE events and NNOE events may be attributed to the influence of other meteorological factors.
The average nocturnal Ox concentrations during the NOE events in Dongying in 2022 and 2023 were both 3 μg/m3 higher than the overall average nocturnal Ox concentrations in the corresponding years. Conversely, the average nocturnal Ox concentrations during the NNOE events in Dongying in 2022 and 2023 were 3 μg/m3 and 2 μg/m3 lower than the overall average nocturnal Ox concentrations in the same years, respectively. In 2022 and 2023, the average nocturnal Ox concentrations during the NOE events in Dongying were 6 μg/m3 and 5 μg/m3 higher than those during NNOE events, respectively (Figure 15). The average nocturnal Ox concentrations during the NOE events in the summer, autumn, and winter were higher than those observed during the NNOE events. The differences in the average nocturnal Ox concentrations were higher in January and June, with a difference of 8 μg/m3.
In 2022 and 2023, the average MDA8-O3 concentrations on days with NOE events in Dongying were 11 μg/m3 and 6 μg/m3 higher than those during NNOE events, respectively (Figure 15). The average MDA8-O3 concentrations on days with NOE events in January, April, June, August, October, and November were higher than those observed during NNOE events. The variations were observable in January (11 μg/m3) and August (17 μg/m3).
Consequently, in 2022 and 2023, the average nocturnal O3 and Ox concentrations during the NOE events in Dongying were higher than the overall average nocturnal concentrations for the same years. Conversely, the average nocturnal O3 and Ox concentrations during the NNOE events in Dongying were lower than the average nocturnal concentrations in 2022 and 2023. This indicates that NOE events contribute to an increase in nocturnal O3 concentration and the atmospheric oxidizing capacity represented by Ox. The NOE events in Dongying from 2022 to 2023 exhibited enhancing effect on the nocturnal concentrations of O3, Ox, and MDA8-O3 on the same day, with increases of 3 μg/m3, 6 μg/m3, and 8 μg/m3, respectively. This effect was observable during the summer and autumn.
In Dongying, during 2022 and 2023, the average ozone concentrations of the next day of NOE events were 10 μg/m3 and 9 μg/m3 higher than those during NNOE events, respectively (Figure 16). The average ozone concentrations on the next day of NOE events were distinctly higher than those during the NNOE events in every month except February and May. The differences were higher in June and July, both showing a variance of 13 μg/m3. An increase in nocturnal ozone concentration may contribute to higher ozone levels on the following day [14,31,45,53]. This is primarily due to the elevated surface ozone concentrations during the night, resulting in a higher ozone background concentration and increasing the initial ozone concentration on the next day. Based on the observational data from 2022 to 2023 in Dongying, it was observed that the nighttime concentration of NO2 in Dongying was lower in summer compared to the other seasons. The lower NO2 concentration resulted in reduced nighttime ozone titration, leading to less ozone consumption during the night. Therefore, during the NOE events in the summer in Dongying, the ozone concentration on the next day was higher.
In 2022 and 2023, the average Ox concentrations on the next day of NOE events were 8 μg/m3 and 9 μg/m3 higher than those during the NNOE events in Dongying, respectively (Figure 16). The average Ox concentrations on the next day of NOE events were higher than those during NNOE events in every month except for February and May. The differences were higher in June, July, and August, with differences of 14 μg/m3, 15 μg/m3, and 10 μg/m3, respectively.
In 2022 and 2023, the average MDA8-O3 concentrations of the next day of NOE events in Dongying were 12 μg/m3 and 14 μg/m3 higher than those during the NNOE events, respectively (Figure 16). The average MDA8-O3 concentrations of the next day of NOE events were higher than those during the NNOE events in every month except March and May. The differences were higher from June to August, with differences of 15 μg/m3, 17 μg/m3, and 13 μg/m3, respectively.
Overall, the NOE events in Dongying from 2022 to 2023 also exhibited a promoting effect on the O3, Ox, and MDA8-O3 of the next day, resulting in increases of 9 μg/m3, 8 μg/m3, and 13 μg/m3, respectively. This effect was most obvious during the summer.

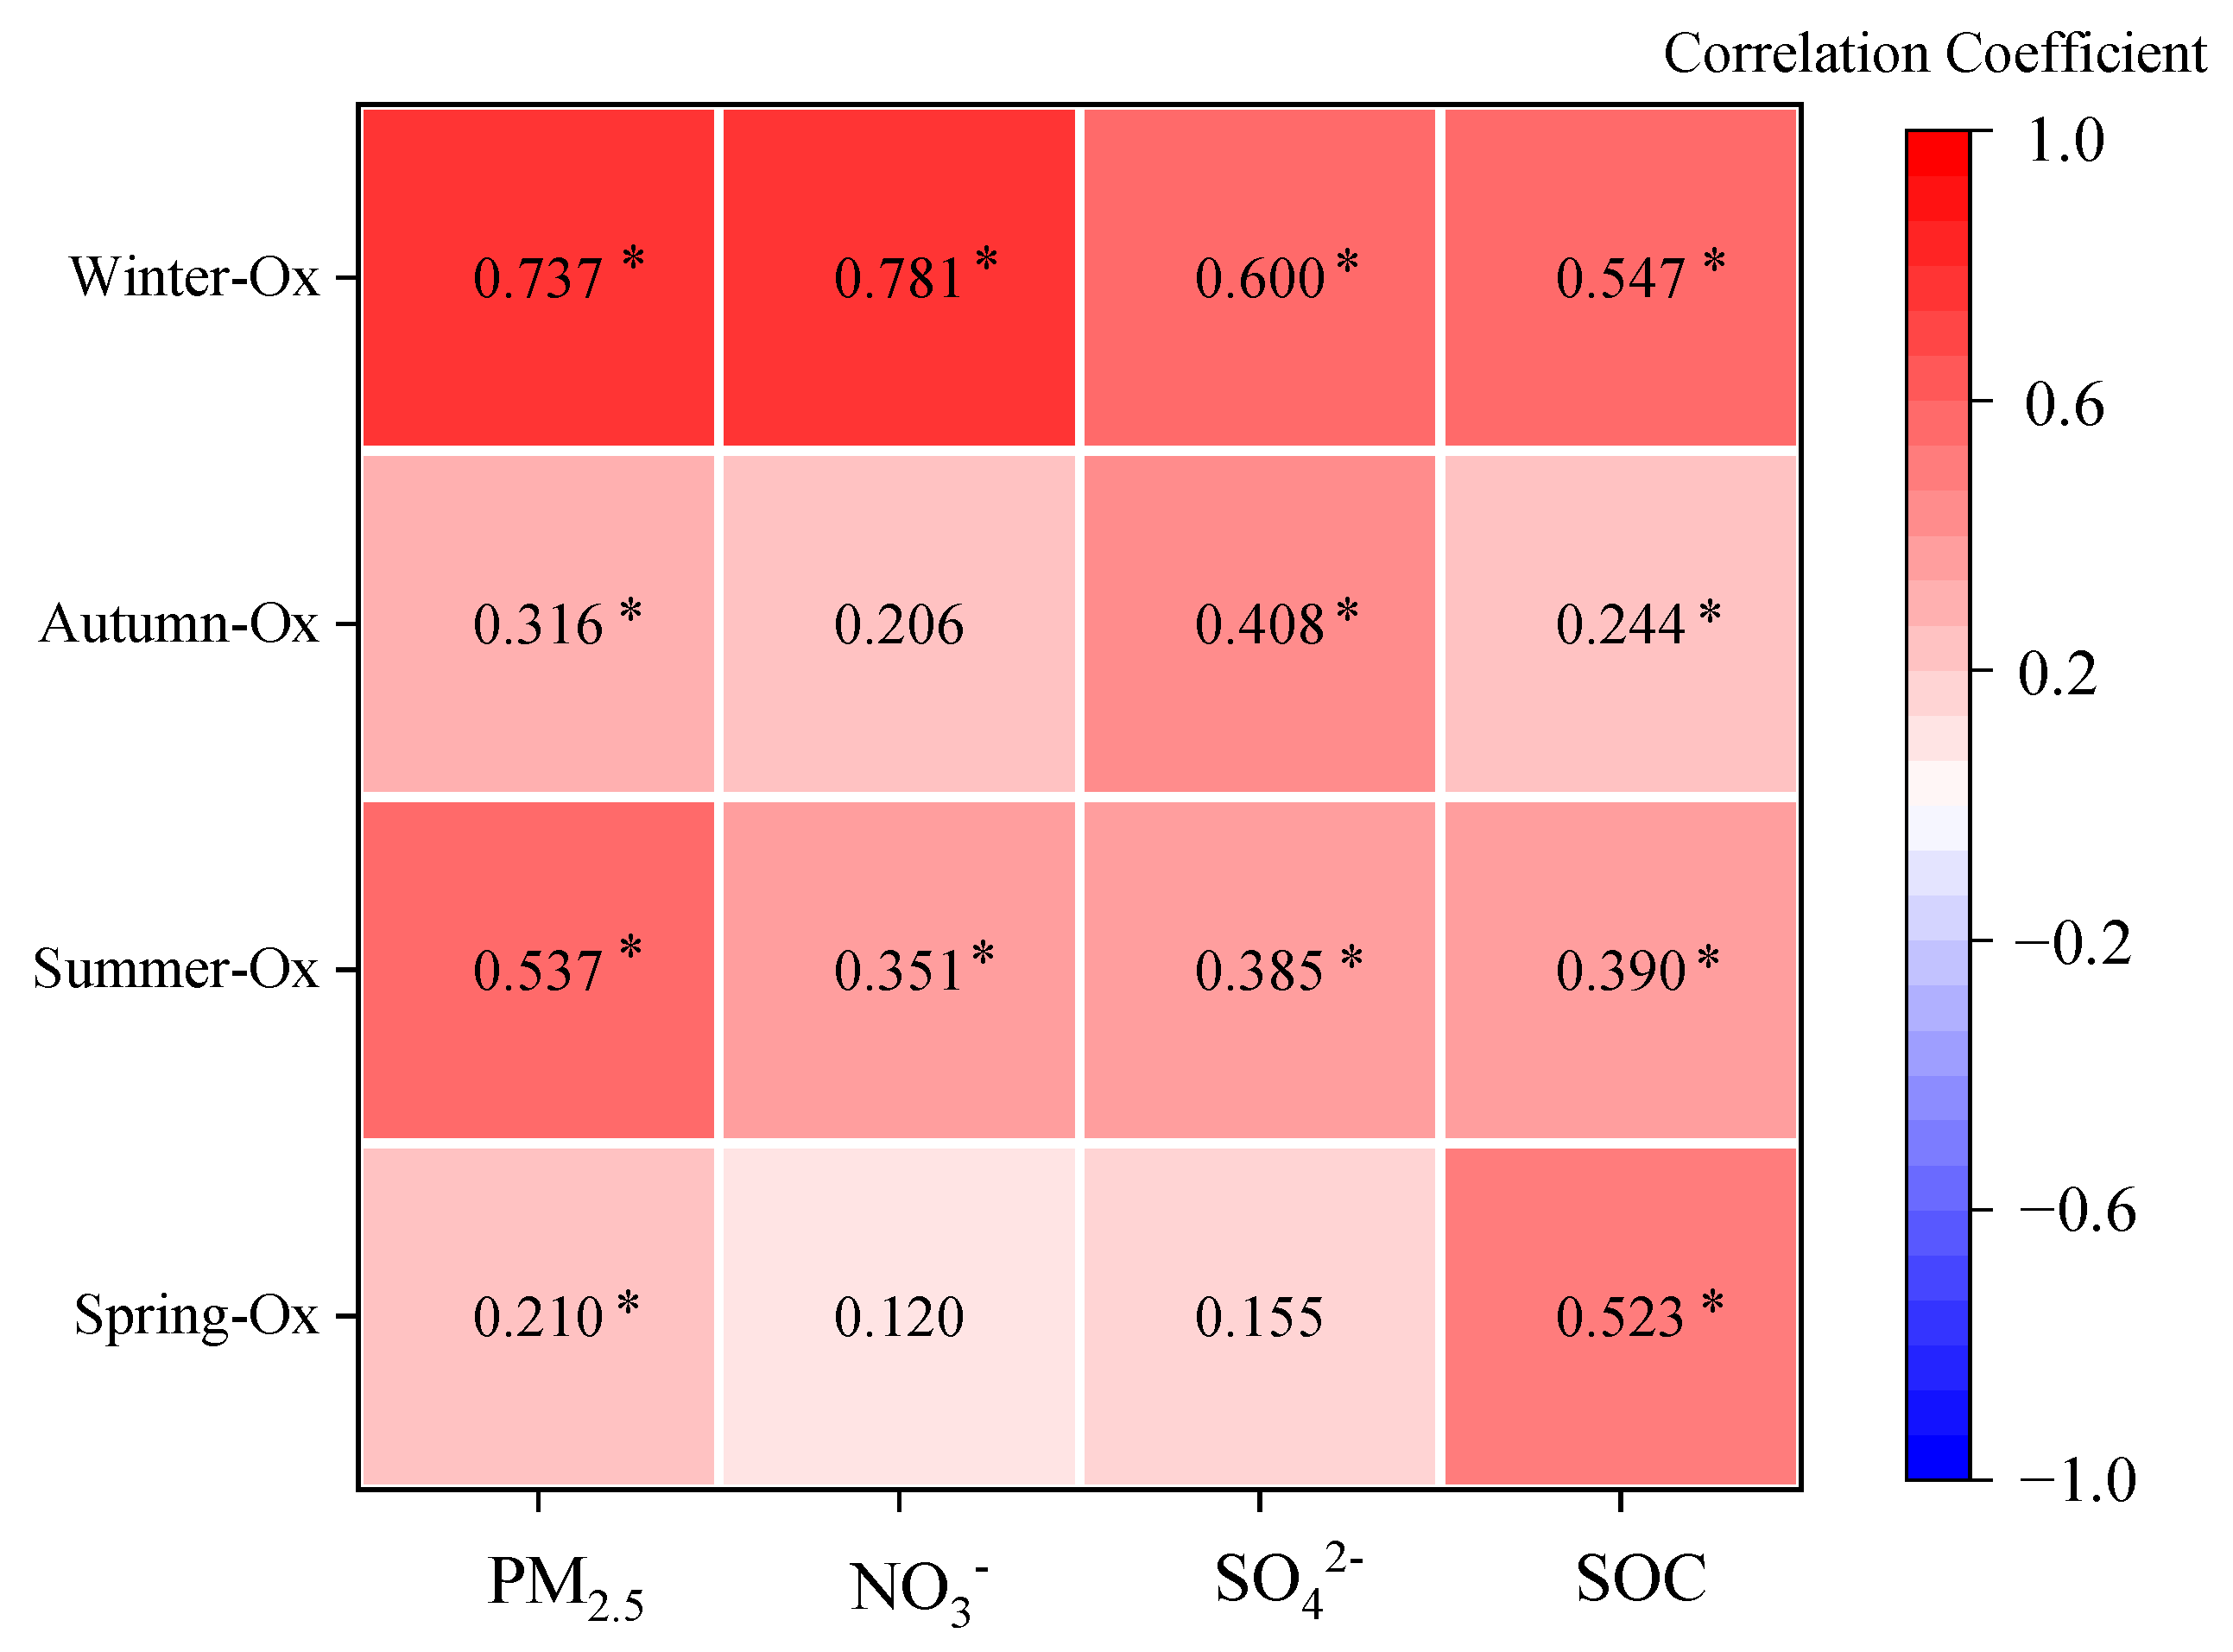
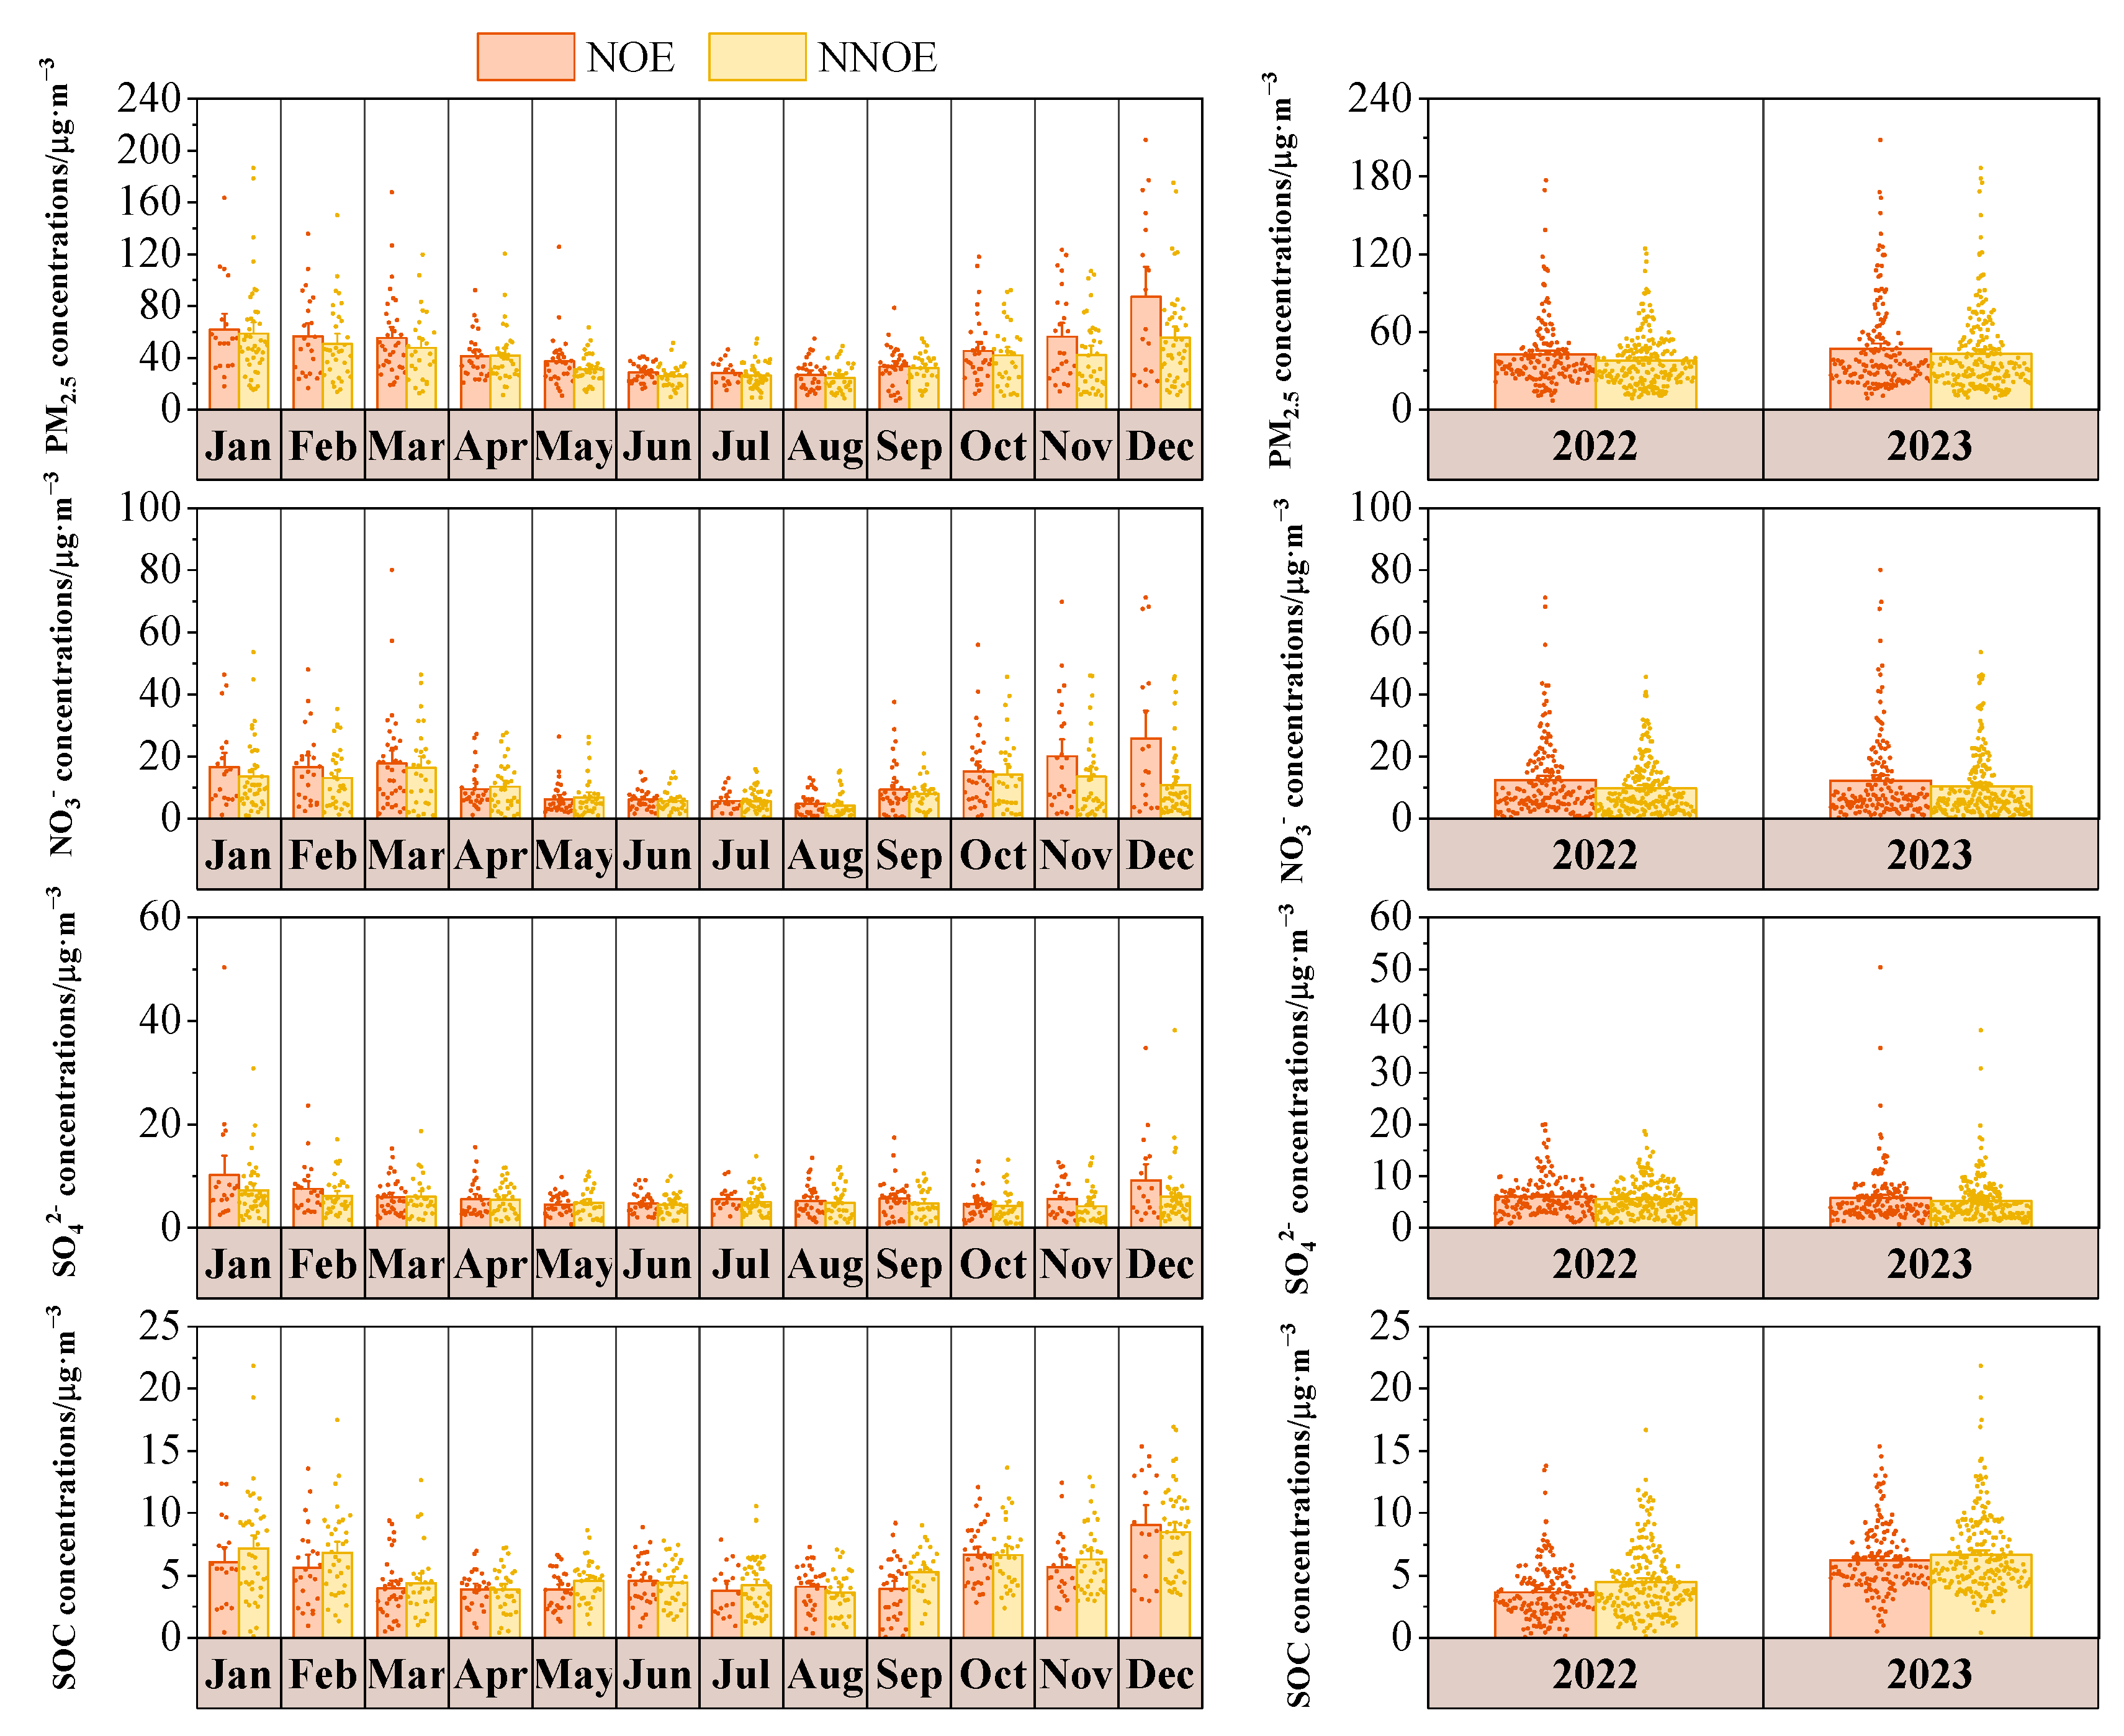
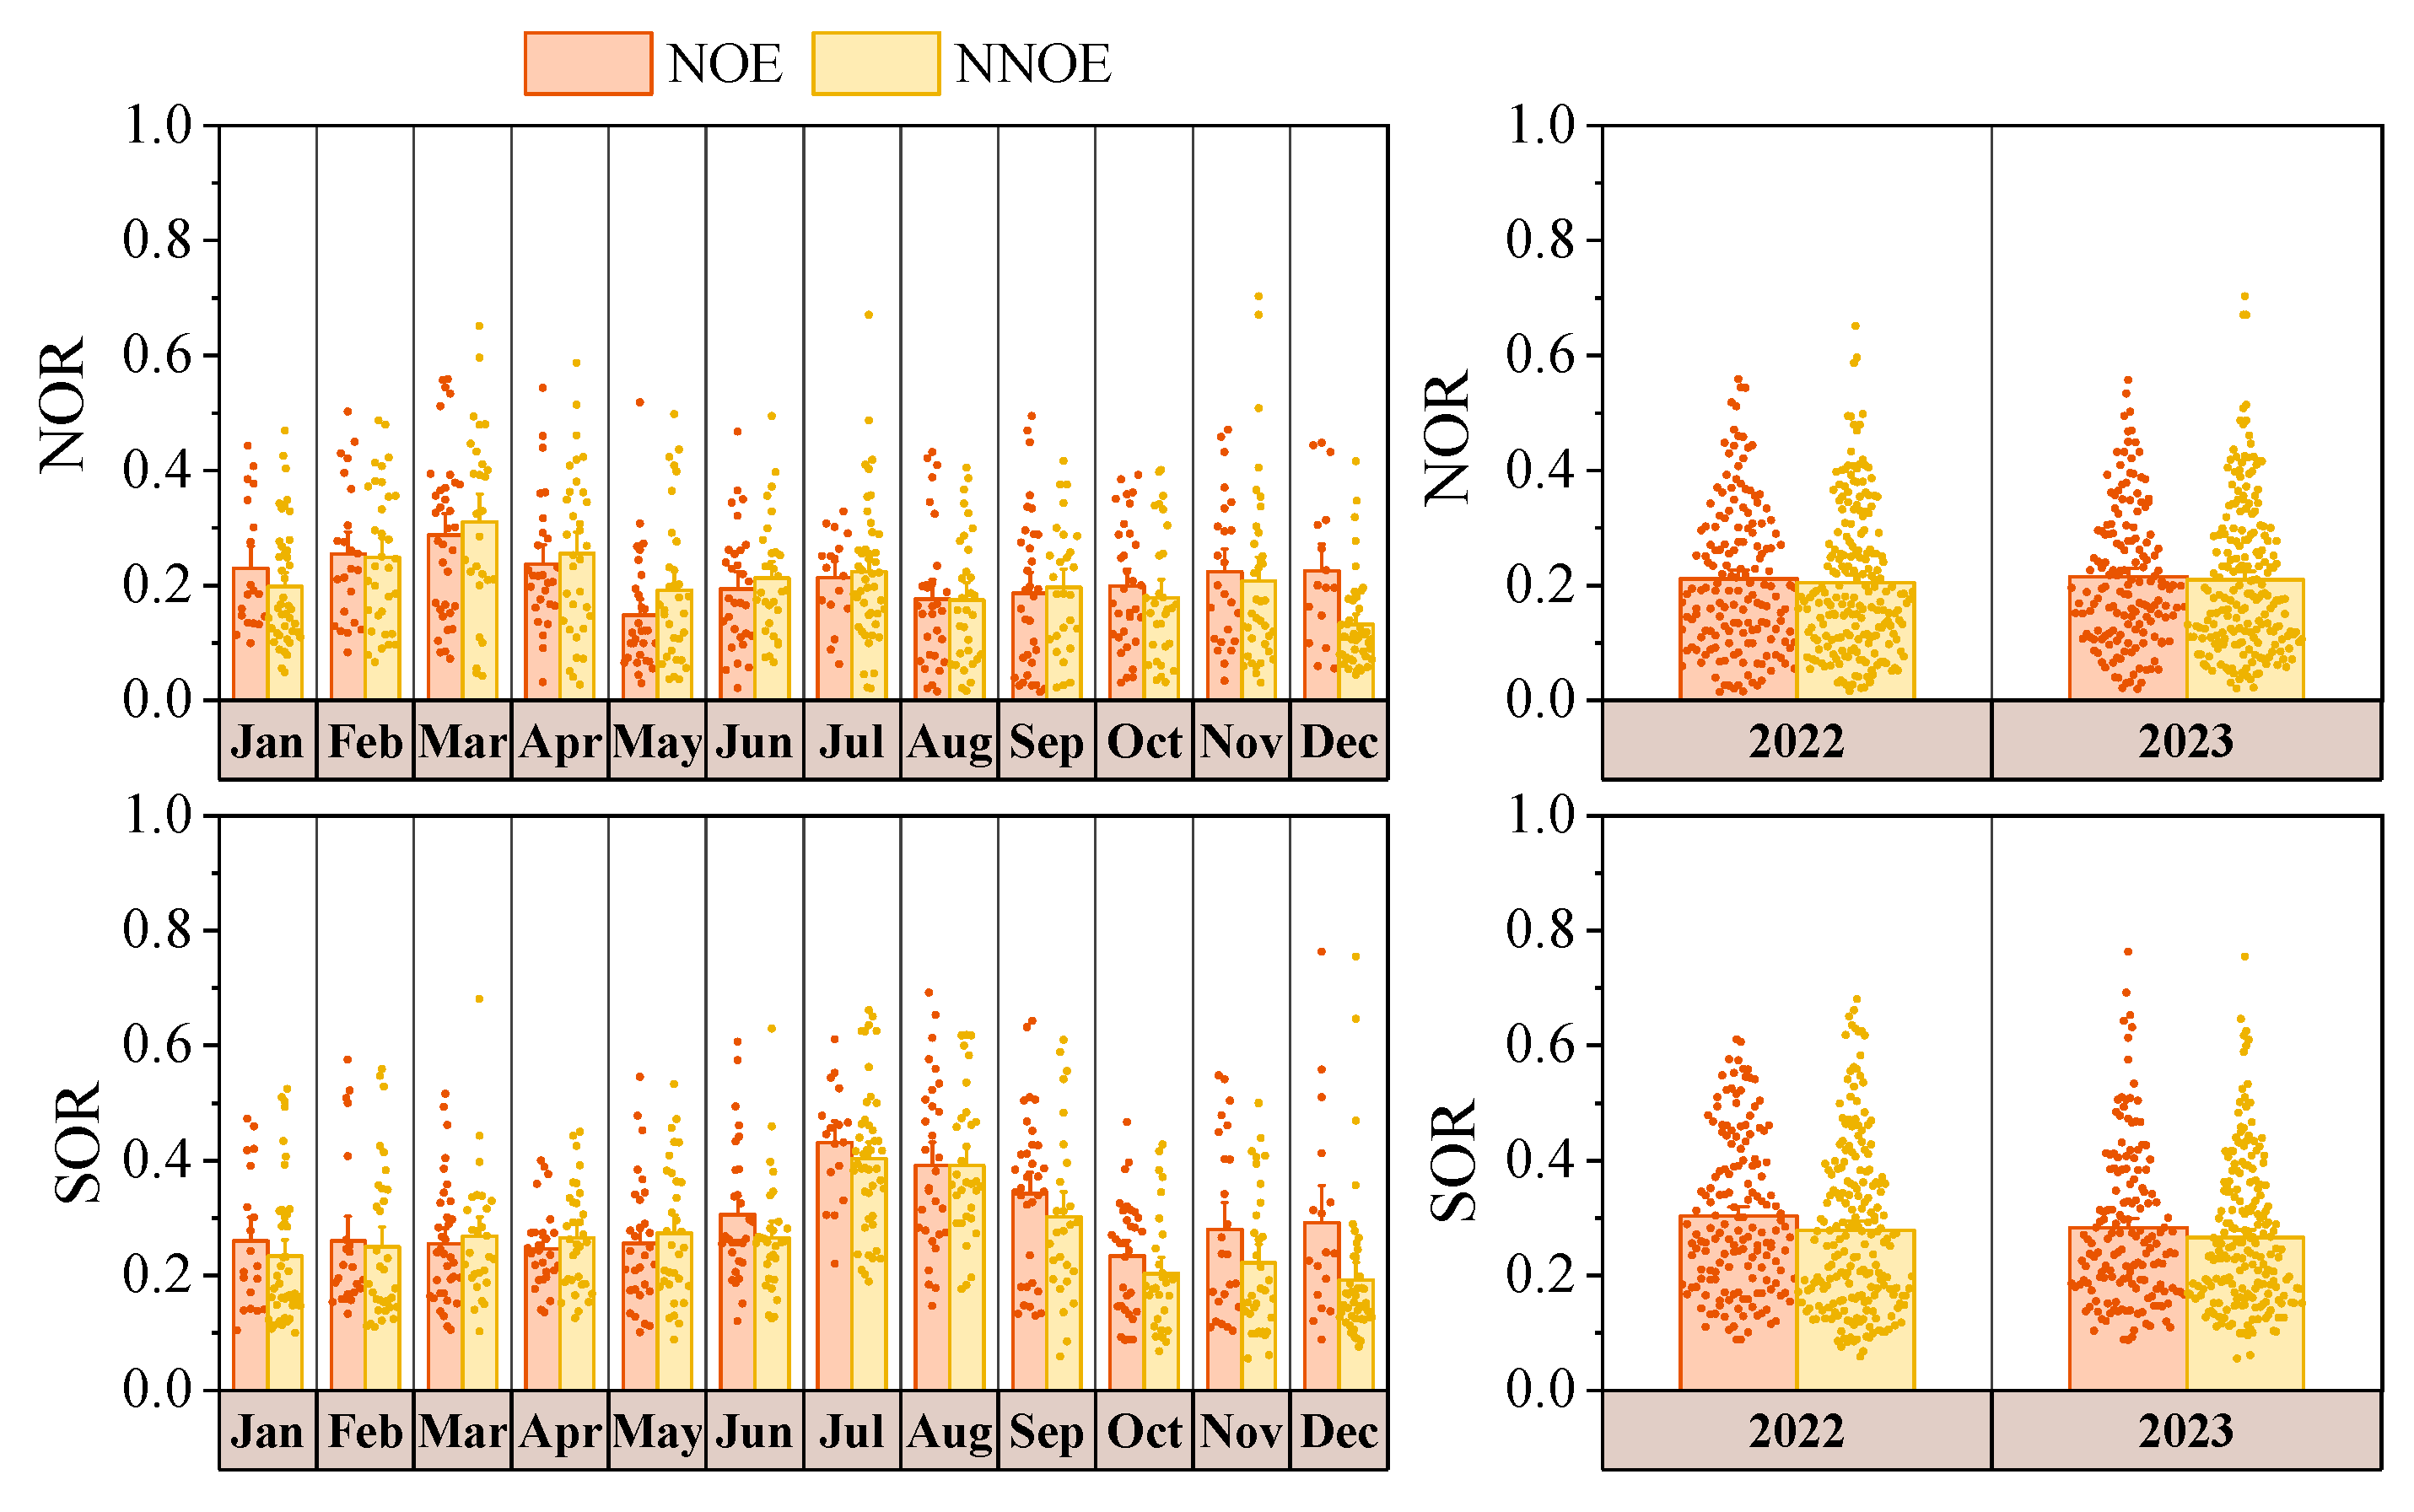
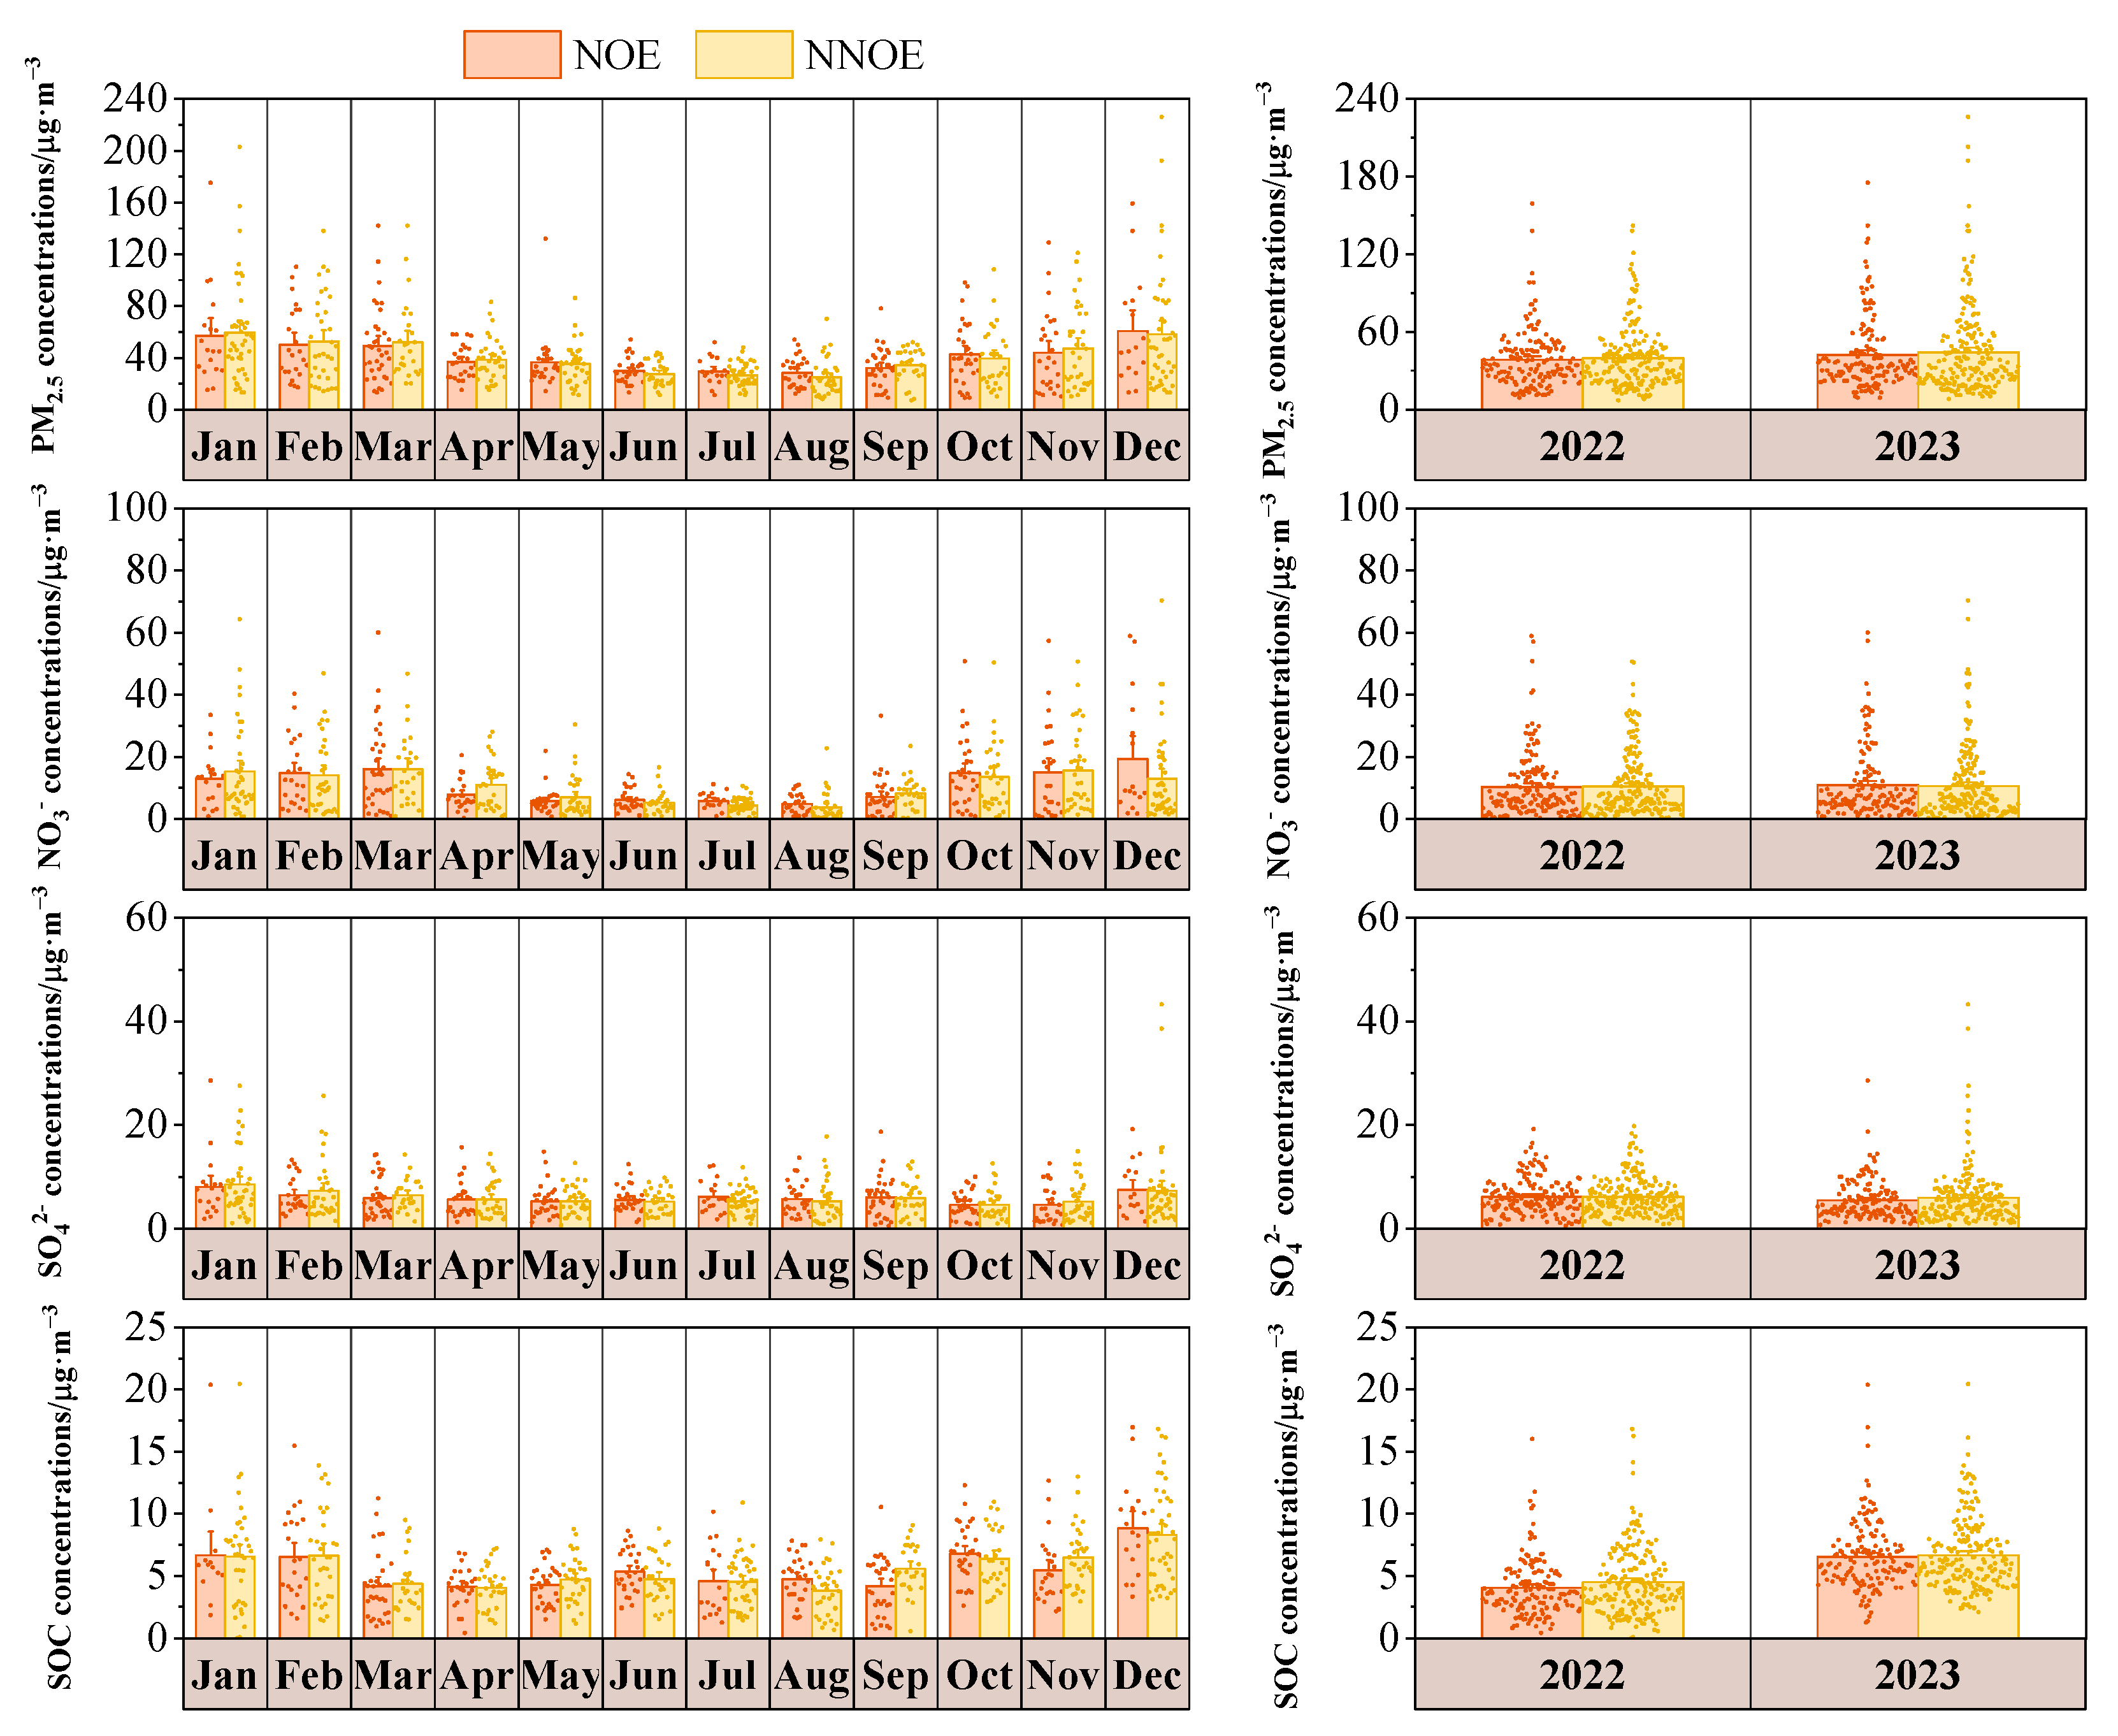
3.3.3. Effects on PM2.5 Concentration and Secondary Components at Night and the Next Day

From 2022 to 2023, the correlations between the nocturnal Ox, PM2.5, PM2.5-bounded NO3, SO42−, and SOC during the different seasons in Dongying were analyzed (Figure 17). Significant correlations were observed between the nocturnal Ox and PM2.5 as well as the SOC during different seasons in Dongying, with correlation coefficients ranging from 0.210 to 0.737. The correlation between the nocturnal Ox and PM2.5-bounded NO3 was significant in both the summer and winter, with correlation coefficients of 0.351 and 0.781, respectively. Additionally, the correlation between nocturnal Ox and PM2.5-bounded SO42− was significant in the summer, autumn, and winter, with correlation coefficients of 0.385, 0.408, and 0.600, respectively. Thus, it can be observed that the increase in the nocturnal atmospheric oxidation capacity in Dongying had a certain impact on the PM2.5 concentration and its secondary components. Based on the analysis in Section 3.3.2, the NOE events were found to increase the concentration of Ox, thereby enhancing the oxidation capacity of the atmosphere. Consequently, NOE events may have a certain impact on PM2.5 concentrations and their secondary components. Hence, the effects of the NOE events on the concentrations of PM2.5, PM2.5-bounded NO3, PM2.5-bounded SO42−, and SOC in Dongying from 2022 to 2023 were further analyzed in this study.
In 2022 and 2023, the average nocturnal PM2.5 concentrations during the NOE events in Dongying exceeded the average nocturnal PM2.5 concentrations for the respective years by 3 μg/m3. Conversely, during the NNOE events in Dongying in 2022 and 2023, the average nocturnal PM2.5 concentrations were 2 μg/m3 and 1 μg/m3 lower than the average nocturnal PM2.5 concentrations for the same years, respectively. In 2022 and 2023, the average nocturnal PM2.5 concentrations during the NOE events in Dongying were 5 μg/m3 and 4 μg/m3 higher than those during the NNOE events, respectively (Figure 18). The average nocturnal PM2.5 concentrations during the NOE events were higher than those during the NNOE events in all months except for April and September. The differences were higher in November and December, with differences of 14 μg/m3 and 32 μg/m3, respectively.
The average nocturnal PM2.5-bounded NO3 concentrations during the NOE events in Dongying in 2022 and 2023 exceeded the average nocturnal NO3 concentrations for the respective years by 1 μg/m3. Conversely, during the NNOE events in Dongying in 2022 and 2023, the average nocturnal NO3 concentrations were both 1 μg/m3 lower than the average nocturnal NO3 concentrations for the same years. In 2022 and 2023, the average nocturnal NO3 concentrations during the NOE events in Dongying were 3 μg/m3 and 2 μg/m3 higher than those during the NNOE events, respectively (Figure 18). The average nocturnal NO3 concentrations during the NOE events from January to March, November, and December were higher than those during the NNOE events. The differences were higher in November and December, with differences of 7 μg/m3 and 15 μg/m3, respectively.
The nocturnal PM2.5-bounded SO42− concentrations during the NOE events in Dongying in 2022 and 2023 were comparable to those during the NNOE events (Figure 18). The nocturnal SO42− concentrations during the NOE events in January, February, November, and December were 3 μg/m3, 1 μg/m3, 1 μg/m3, and 3 μg/m3 higher than those during the NNOE events, respectively.
In 2022 and 2023, the average nocturnal SOC concentration during the NOE events in Dongying was comparable to those during the NNOE events, and sometimes even slightly lower than those during the NNOE events (Figure 18). This might be due to the complexity of the impact of nocturnal atmospheric oxidation on SOC, which could not be simply reflected by the average concentration of SOC. Further detailed research on the impact of NOE events on the secondary organic components in PM2.5 is needed in the future.
In summary, the average nocturnal PM2.5 and PM2.5-bounded NO3 concentrations during the NOE events in Dongying were higher than the overall average nocturnal PM2.5 and PM2.5-bounded NO3 concentrations for the respective years. Conversely, the average nocturnal PM2.5 and NO3 concentrations during the NNOE events in Dongying were lower than the overall average nocturnal PM2.5 and NO3 for the respective years. This indicates that NOE events contribute to an increase in nocturnal PM2.5 concentrations and PM2.5-bounded NO3 concentrations. The NOE events exhibited a clear promoting effect on the nocturnal PM2.5, PM2.5-bounded NO3, and SO42− in Dongying from 2022 to 2023, with the most distinct impact during the winter. The NOE events did not demonstrate an obvious effect on the average nocturnal SOC concentration.
NOE events are more likely to increase PM2.5 concentrations. He et al. (2023) observed a significant enhancement in nocturnal atmospheric oxidizing capacity and a notably higher PM2.5 concentration during NOE events in Guangzhou, China. The increased oxidative capacity during NOE events promotes and accelerates nighttime chemical reactions, enhancing the generation of secondary pollutants such as PM2.5 [31]. Additionally, Li et al. (2023) also observed that the increased nighttime ozone may enhance the conversion of PM2.5-bounded NO3 through the promotion of heterogeneous hydrolysis of dinitrogen pentoxide, thereby influencing the long-term trend in nighttime NO3 concentrations [15].
The primary pathway for nocturnal PM2.5-bounded NO3 formation is through the heterogeneous hydrolysis of dinitrogen pentoxide. Dinitrogen pentoxide is generated through the titration of NOx with ozone (NO2 + O3—NO3 + O2, NO3 + NO2—N2O5), which has a direct relationship with NOE events [54,55]. The formation pathway of nocturnal PM2.5-bounded SO42− is mainly through S(IV) + NO2, SO2 + aerosol, SO2 + O2 (metal ion catalysis). Nocturnal NO2 and O3 can generate O2, facilitating the pathway of SO2 + O2 to produce SO42−. However, the contribution of the SO2 + O2 pathway to SO42− generation is relatively low (about 2%) [56,57]. Therefore, compared to PM2.5-bounded NO3, the impact of NOE events on SO42− generation is relatively small. SOC species are more complex and primarily formed through reactions between nocturnal oxidants such as O3, NO3 radicals, and VOCs. An increase in nighttime ozone concentration elevates nighttime atmospheric oxidants, but further exploration is needed regarding its interaction with VOCs.
The NOE events had obvious effects on nocturnal PM2.5, PM2.5-bounded NO3 and SO42−. Therefore, the differences between nocturnal NOR and SOR during NOE events and NNOE events were further analyzed in this study (Figure 19).
The nocturnal NOR values during the NOE events in 2022 and 2023 were 0.006 and 0.005 higher than those during the NNOE events in Dongying, respectively (Figure 19). The nocturnal NOR values during the NOE events in January, February, October, November and December were 0.03, 0.006, 0.02, 0.01, and 0.09 higher than those during the NNOE events, respectively. This was consistent with the effects of NOE events on PM2.5-bounded NO3 concentrations, indicating that NOE events may affect the concentration of NO3 by affecting the oxidation of nocturnal NO2.
The nocturnal SOR during the NOE events in 2022 and 2023 were 0.02 higher than those during the NNOE events in Dongying (Figure 19). Specifically, the nocturnal SOR during the NOE events in January, February, June, July, September, October, November, and December were 0.03, 0.01, 0.04, 0.02, 0.04, 0.03, 0.06, and 0.10 higher than those during the NNOE events, respectively. This pattern aligns with the observed impact of NOE events on SO42− concentrations, indicating that NOE events may affect the concentration of SO42− by affecting the oxidation of nocturnal SO2.
In 2022 and 2023, the average PM2.5 concentration on the next day of NOE events in Dongying was generally comparable to those during the NNOE events (Figure 20). The average PM2.5 concentration of the next day of NOE events was slightly higher than those of the NNOE events in May, June, July, August, October, and December, with a difference of about 3 μg/m3.
In 2022 and 2023, the average PM2.5-bounded NO3 concentration on the next day of NOE events in Dongying was generally comparable to those during NNOE events (Figure 20). The average concentration of NO3 on the next day of the NOE events in December was 6 μg/m3 higher than that during the NNOE event, and there were no significant differences in the other months. Hence, the NOE events had a noticeable impact on the average concentration of PM2.5-bounded NO3 on the following day in December but did not conspicuously affect the other months.
Regarding the annual and monthly average concentrations of PM2.5-bounded SO42− and SOC on the next day after the NOE and NNOE events, the differences in concentrations were relatively small (all less than 1 μg/m3) (Figure 20). Furthermore, a non-parametric test (Mann–Whitney test) was employed for verification, and the results indicated no significant differences in the PM2.5-bounded SO42− concentrations between the second day after the NOE and NNOE events (statistical value Z = −0.07678, p > 0.05). Similarly, there was no significant difference in the SOC concentrations between the second day after the NOE and NNOE events (statistical value Z = −1.33106, p > 0.05).
In summary, the NOE events showed no obvious effects on the PM2.5, PM2.5-bounded NO3, PM2.5-bounded SO42−, and SOC concentrations of the following day in Dongying from 2022 to 2023. On the following day after NOE events, O3 undergoes a series of complex atmospheric physical and chemical processes (such as deposition, transport, and photochemical reactions), resulting in significant concentration changes. Therefore, the impact of NOE events on the concentrations of PM2.5, PM2.5-bounded NO3, PM2.5-bounded SO42−, and SOC on the following day may be smaller. Further quantitative research is needed to determine the influence of NOE events on the generation of secondary pollutants on the following day.

4. Conclusions

(1)
From 2022 to 2023, the annual average nocturnal ozone concentration in Dongying increased from 51 μg/m3 to 59 μg/m3. The different percentile values of the nocturnal ozone concentrations also showed an increase in these two years, with the most notable increases observed in the high and middle percentiles. The nocturnal ozone concentrations were higher during the ozone pollution seasons and lower during the non-ozone pollution seasons. Compared with 2022, the nocturnal ozone concentration increased most apparently in the spring and summer of 2023.
(2)
For 2022 and 2023, the annual average frequencies of NOE events in Dongying were 44% and 43%, respectively. The frequency of NOE events was higher in the spring, summer, and autumn and lower in the winter. The diurnal variation characteristics of the frequency of NOE events were generally similar in both 2022 and 2023, featuring a higher frequency from 2:00 to 4:00 and a lower frequency from 21:00 to 1:00 the next day.
(3)
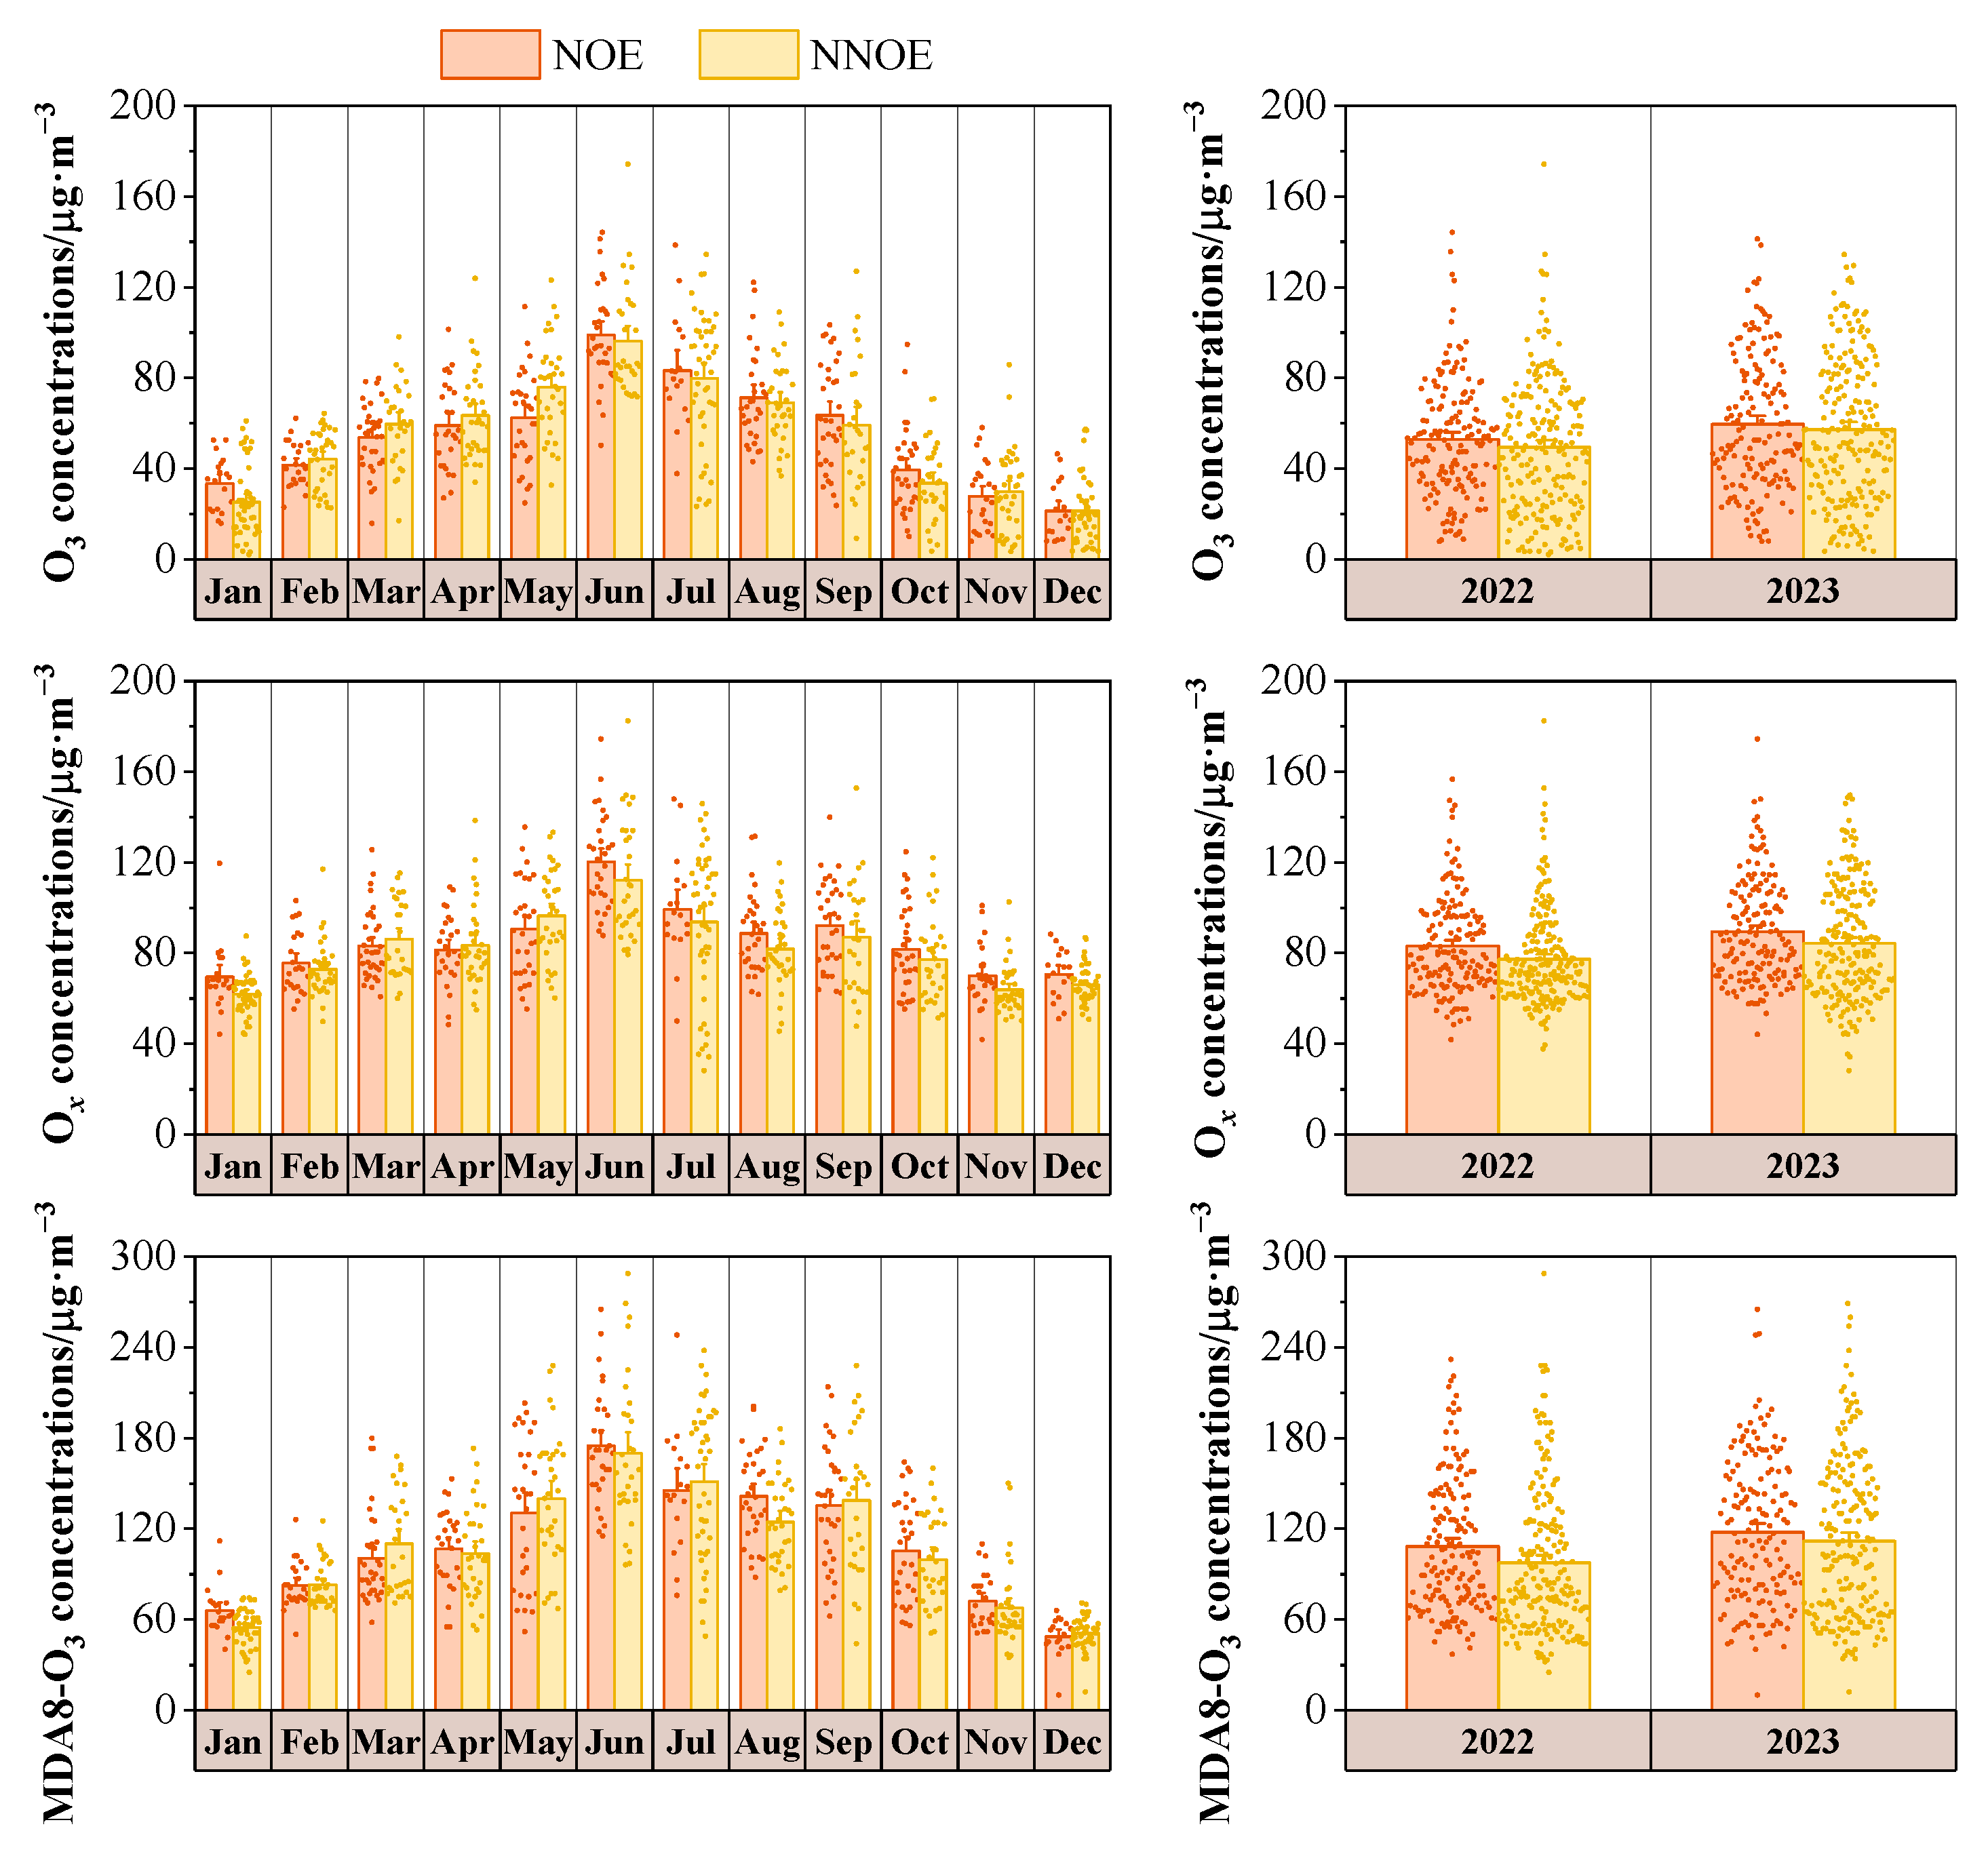
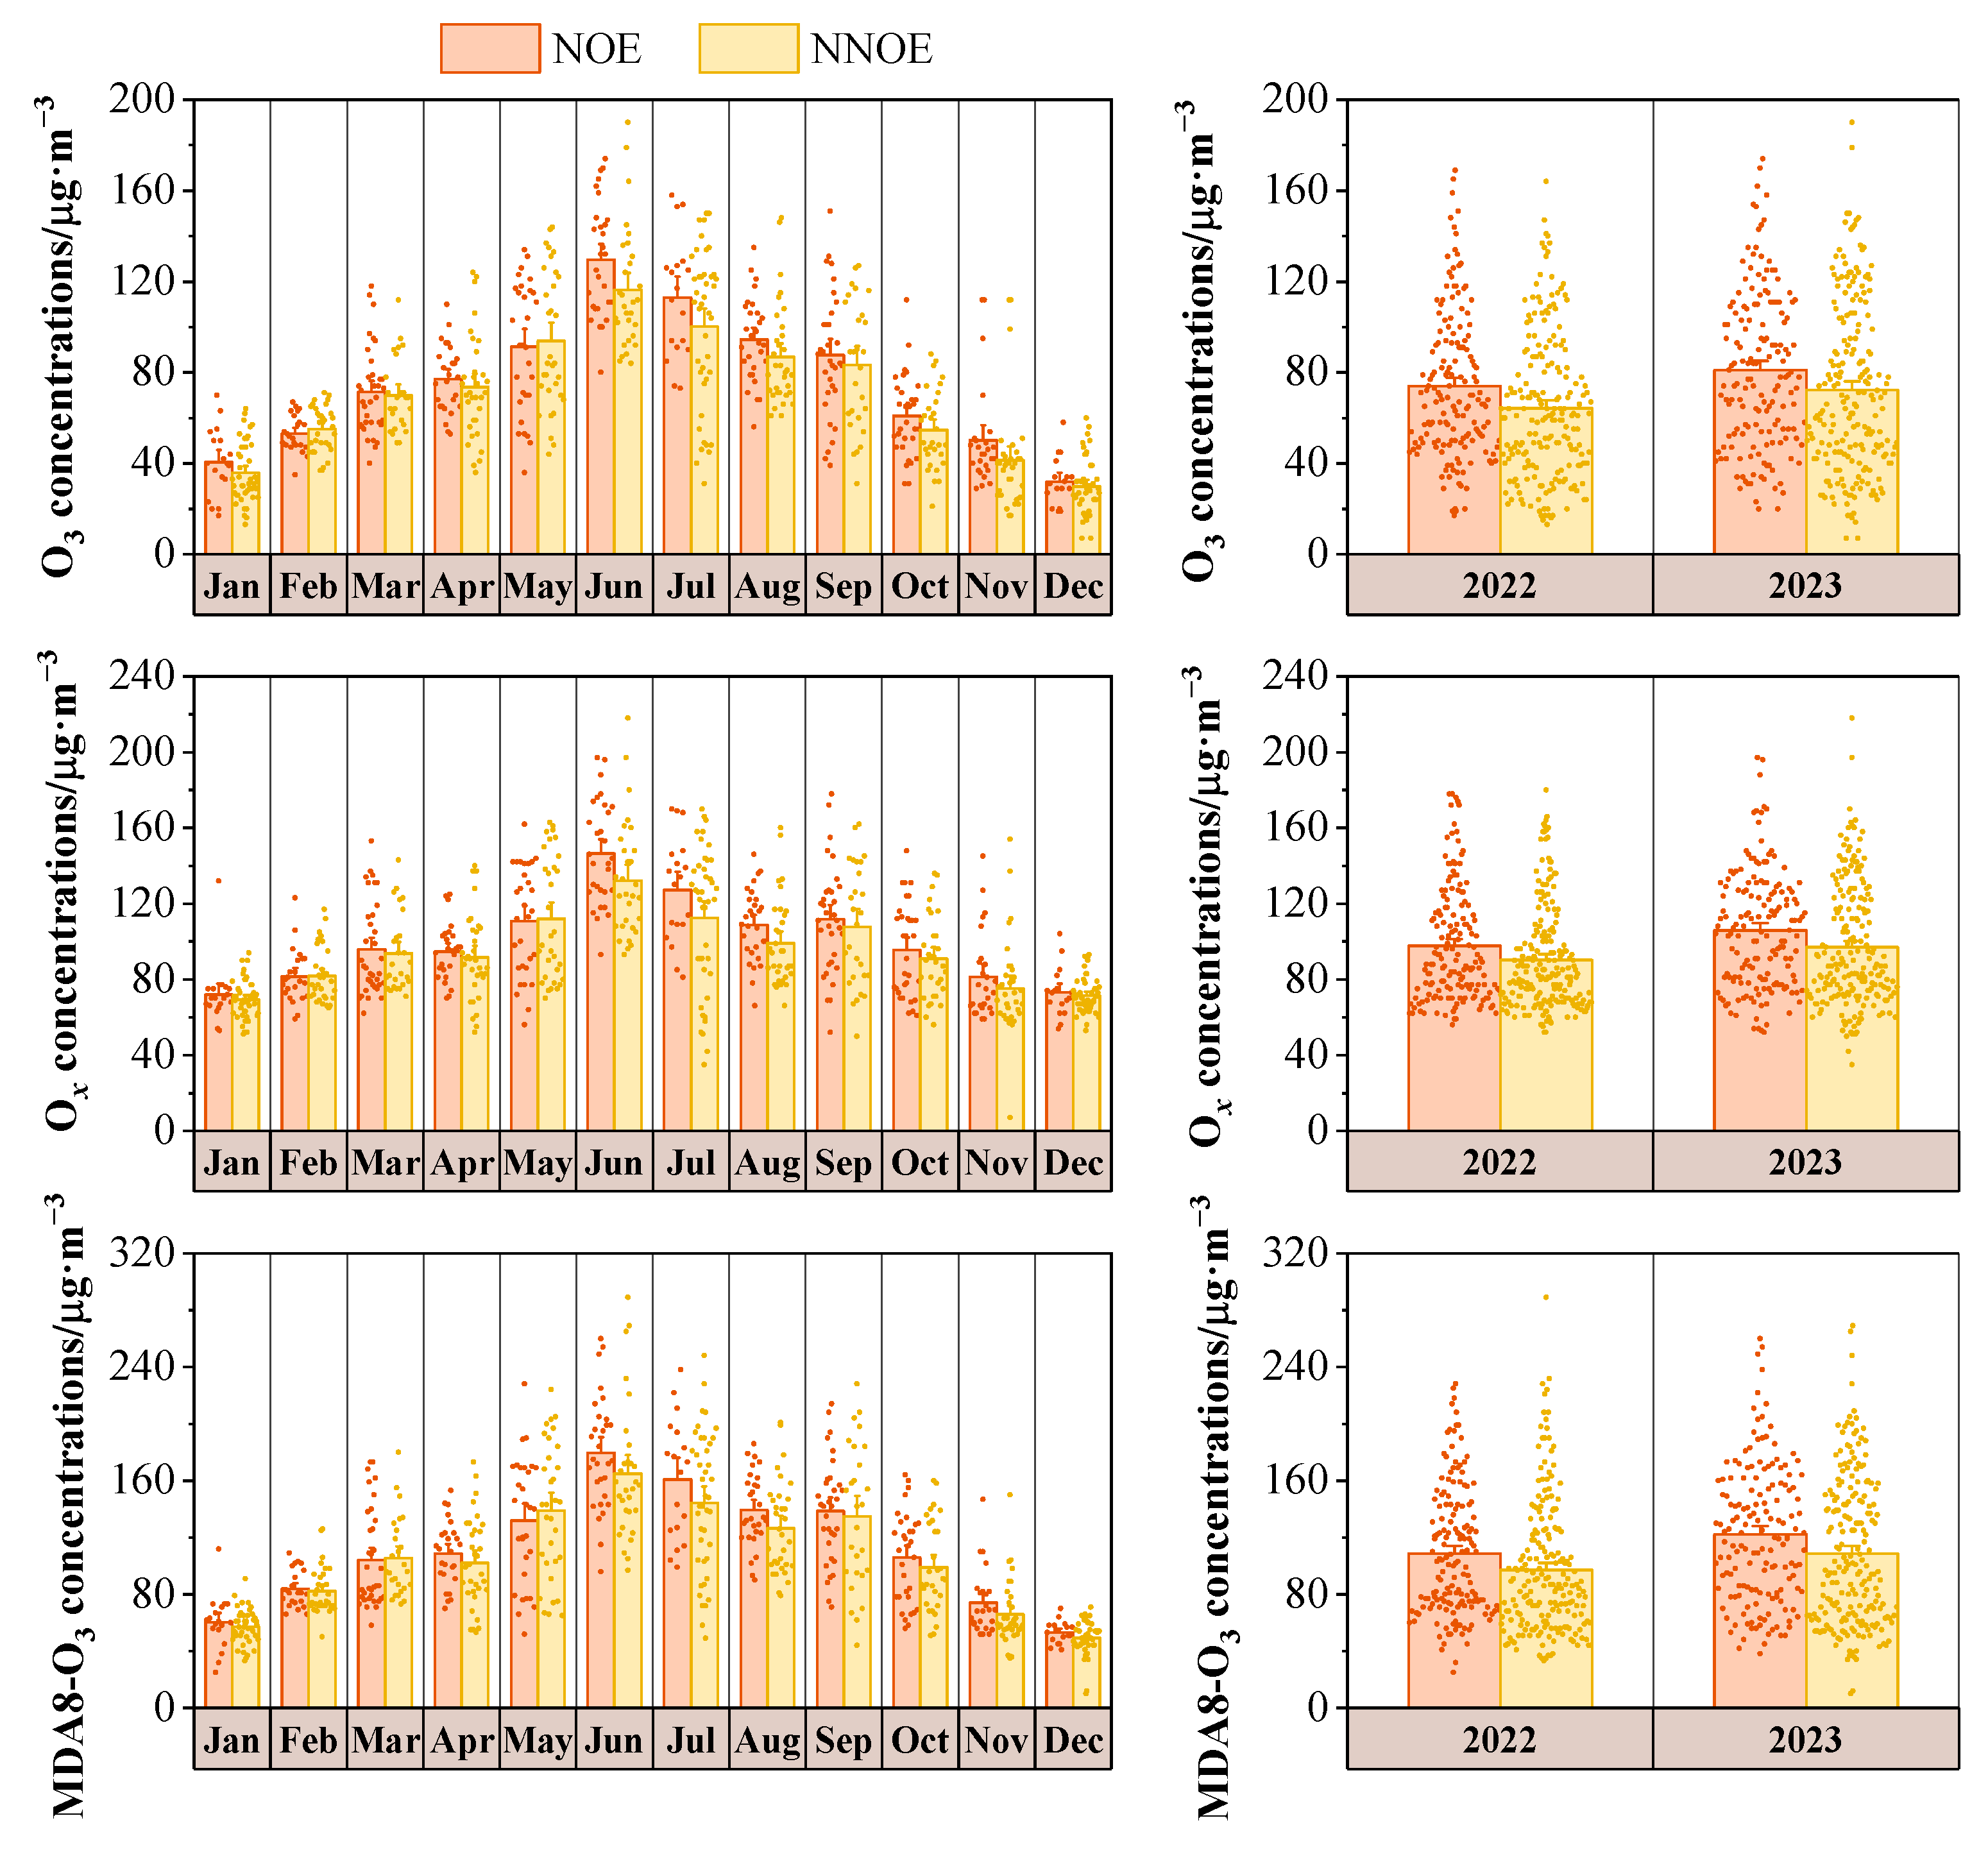
The NOE events exhibited an obvious promoting effect on nocturnal O3, Ox, and MDA8-O3 on the same day in Dongying from 2022 to 2023, with a more noticeable increase observed during the summer and autumn. The NOE events also had a distinct effect on the O3, Ox, and MDA8-O3 of the next day, with the most conspicuous effect observed in summer. In terms of government control, it is essential to assess the ozone pollution status of the next day based on the characteristics of nocturnal ozone changes. Moreover, the NOE events had evident effects on the nocturnal concentrations of PM2.5 and PM2.5-bounded NO3 and SO42−, with the impact being most apparent in the winter. However, the NOE events had no conspicuous impact on the concentrations of PM2.5, PM2.5-bounded NO3, PM2.5-bounded SO42−, and SOC on the next day.
(4)
NOE events have distinct effects on the concentrations of O3, Ox, MDA8-O3, PM2.5, and PM2.5-bounded NO3 and SO42−. This implies that NOE events can improve atmospheric oxidation capacity and promote the formation of PM2.5 and its secondary components, which have a certain impact on air quality. Consequently, increased attention should be given to the occurrence of NOE events and the challenges brought by NOE to the coordinated control of PM2.5 and O3. More sophisticated methods should be employed to investigate the impact of NOE on atmospheric oxidation capacity and PM2.5, along with its secondary components in the future. Additionally, given the increasing prevalence of human nocturnal activities, it is imperative to delve into the repercussions of NOE on human health and biological growth.

Author Contributions

Conceptualization, C.A. and H.L.; data curation, F.S., J.L. and L.T.; formal analysis, Y.Y., X.G., X.Y. and Y.J.; funding acquisition, R.G. and H.L.; methodology, C.A., Y.Y. and H.L.; project administration, Y.J. and F.B.; supervision, H.L.; writing—original draft, C.A.; writing—review and editing, C.A. and H.L. All authors have read and agreed to the published version of the manuscript.

Funding

This work was supported by the Ministry of Ecology and Environment of China under the project (DQGG202121) and the Dongying Ecological and Environmental Bureau (2021DFKY-0779).

Institutional Review Board Statement

Not applicable.

Informed Consent Statement

Not applicable.

Data Availability Statement

The data presented in this study are available on request from the corresponding author. The data are not publicly available due to privacy.

Conflicts of Interest

The author Luyao Tan was employed by the company Ltd. of Shandong Environmental Protection Industry Corp. The paper reflects the views of the scientists, and not the company. The remaining authors declare that the research was conducted in the absence of any commercial or financial relationships that could be construed as potential conflicts of interest.

References

  1. Wang, T.; Xue, L.; Brimblecombe, P.; Lam, Y.F.; Li, L.; Zhang, L. Ozone pollution in China: A review of concentrations, meteorological influences, chemical precursors, and effects. Sci. Total Environ. 2017, 575, 1582–1596. [Google Scholar] [CrossRef]
  2. Tan, Z.; Ma, X.; Lu, K.; Jiang, M.; Zou, Q.; Wang, H.; Zeng, L.; Zhang, Y. Direct evidence of local photochemical production driven ozone episode in Beijing: A case study. Sci. Total Environ. 2021, 800, 148868. [Google Scholar] [CrossRef]
  3. Zeren, Y.; Zhou, B.; Zheng, Y.; Jiang, F.; Lyu, X.; Xue, L.; Wang, H.; Liu, X.; Guo, H. Does ozone pollution share the same formation mechanisms in the bay areas of China? Environ. Sci. Technol. 2022, 56, 14326–14337. [Google Scholar] [CrossRef]
  4. Liu, Y.; Geng, G.; Cheng, J.; Liu, Y.; Xiao, Q.; Liu, L.; Shi, Q.; Tong, D.; He, K.; Zhang, Q. Drivers of increasing ozone during the two phases of Clean Air Actions in China 2013–2020. Environ. Sci. Technol. 2023, 57, 8954–8964. [Google Scholar] [CrossRef]
  5. Lu, X.; Hong, J.; Zhang, L.; Cooper, O.R.; Schultz, M.G.; Xu, X.; Wang, T.; Gao, M.; Zhao, Y.; Zhang, Y. Severe surface ozone pollution in China: A global perspective. Environ. Sci. Technol. Lett. 2018, 5, 487–494. [Google Scholar] [CrossRef]
  6. Strode, S.A.; Ziemke, J.R.; Oman, L.D.; Lamsal, L.N.; Olsen, M.A.; Liu, J. Global changes in the diurnal cycle of surface ozone. Atmos. Environ. 2019, 199, 323–333. [Google Scholar] [CrossRef]
  7. Bernier, C.; Wang, Y.; Estes, M.; Lei, R.; Jia, B.; Wang, S.C.; Sun, J. Clustering surface ozone diurnal cycles to understand the impact of circulation patterns in Houston, TX. J. Geophys. Res. Atmos. 2019, 124, 13457–13474. [Google Scholar] [CrossRef]
  8. Lin, J.; Youn, D.; Liang, X.; Wuebbles, D. Global model simulation of summertime U.S. ozone diurnal cycle and its sensitivity to PBL mixing, spatial resolution, and emissions. Atmos. Environ. 2008, 42, 8470–8483. [Google Scholar] [CrossRef]
  9. Xia, N.; Du, E.; Guo, Z.; Vries, W.D. The diurnal cycle of summer tropospheric ozone concentrations across Chinese cities: Spatial patterns and main drivers. Environ. Pollut. 2021, 286, 117547. [Google Scholar] [CrossRef]
  10. Xu, J.; Huang, X.; Wang, N.; Li, Y.; Ding, A. Understanding ozone pollution in the Yangtze River Delta of eastern China from the perspective of diurnal cycles. Sci. Total Environ. 2021, 752, 141928. [Google Scholar] [CrossRef]
  11. Talbot, R.; Mao, H.; Sive, B. Diurnal characteristics of surface level O3 and other important trace gases in New England. J. Geophys. Res. Atmos. 2005, 110, D09307. [Google Scholar] [CrossRef]
  12. Zhu, X.; Ma, Z.; Li, Z.; Wu, J.; Guo, H.; Yin, X.; Ma, X.; Qiao, L. Impacts of meteorological conditions on nocturnal surface ozone enhancement during the summertime in Beijing. Atmos. Environ. 2020, 225, 117368. [Google Scholar] [CrossRef]
  13. He, Y.; Wang, H.; Wang, H.; Xu, X.; Li, Y.; Fan, S. Meteorology and topographic influences on nocturnal ozone increase during the summertime over Shaoguan, China. Atmos. Environ. 2021, 256, 118459. [Google Scholar] [CrossRef]
  14. He, C.; Lu, X.; Wang, H.; Wang, H.; Li, Y.; He, G.; He, Y.; Wang, Y.; Zhang, Y.; Liu, Y.; et al. The unexpected high frequency of nocturnal surface ozone enhancement events over China: Characteristics and mechanisms. Atmos. Chem. Phys. 2022, 22, 15243–15261. [Google Scholar] [CrossRef]
  15. Li, X.; Ren, J.; Huang, R.; Chen, L.; Li, Y.; Qiao, X.; Cheng, Y.; Zhao, B.; Yin, D.; Gao, D.; et al. The aggravation of summertime nocturnal ozone pollution in China and its potential impact on the trend of nitrate aerosols. Geophys. Res. Lett. 2023, 50, e2023GL103242. [Google Scholar] [CrossRef]
  16. Eliasson, I.; Thorsson, S.; Andersson-Sköld, Y. Summer nocturnal ozone maxima in Göteborg, Sweden. Atmos. Environ. 2003, 37, 2615–2627. [Google Scholar] [CrossRef]
  17. Salmond, J.A.; McKendry, I.G. Secondary ozone maxima in a very stable nocturnal boundary layer: Observations from the Lower Fraser Valley, BC. Atmos. Environ. 2002, 36, 5771–5782. [Google Scholar] [CrossRef]
  18. Agathokleous, E.; Feng, Z.; Sicard, P. Surge in nocturnal ozone pollution. Science 2023, 382, 1131. [Google Scholar] [CrossRef]
  19. Alduwais, A.K.; Dasari, H.P.; Karumuri, R.K.; Gandham, H.; Alharbi, B.H.; Ashok, K.; Hoteit, I. Transport mechanisms of nocturnal surface ozone over Riyadh, Kingdom of Saudi Arabia. Atmos. Environ. 2023, 313, 120069. [Google Scholar] [CrossRef]
  20. Wang, J.; Wang, D.; Ge, B.; Lin, W.; Ji, D.; Pan, X.; Li, J.; Wang, Z. Increase in daytime ozone exposure due to nighttime accumulation in a typical city in eastern China during 2014–2020. Atmos. Pollut. Res. 2022, 13, 101387. [Google Scholar] [CrossRef]
  21. Wang, H.; Wang, H.; Lu, X.; Lu, K.; Zhang, L.; Tham, Y.J.; Shi, Z.; Aikin, K.; Fan, S.; Brown, S.S.; et al. Increased night-time oxidation over China despite widespread decrease across the globe. Nat. Geosci. 2023, 16, 217–223. [Google Scholar] [CrossRef]
  22. Lloyd, K.L.; Davis, D.D.; Marini, R.P.; Decoteau, D.R. Effects of nighttime ozone treatment at ambient concentrations on sensitive and resistant snap bean genotypes. J. Am. Soc. Hortic. 2018, 143, 23–33. [Google Scholar] [CrossRef]
  23. Agathokleous, E.; Feng, Z.; Oksanen, E.; Sicard, P.; Wang, Q.; Saitanis, C.J.; Araminiene, V.; Blande, J.D.; Hayes, F.; Calatayud, V.; et al. Ozone affects plant, insect, and soil microbial communities: A threat to terrestrial ecosystems and biodiversity. Sci. Adv. 2020, 6, eabc1176. [Google Scholar] [CrossRef] [PubMed]
  24. Wu, Y.; Chen, W.; You, Y.; Xie, Q.; Jia, S.; Wang, X. Quantitative impacts of vertical transport on the long-term trend of nocturnal ozone increase over the Pearl River Delta region during 2006–2019. Atmos. Chem. Phys. 2023, 23, 453–469. [Google Scholar] [CrossRef]
  25. Meng, K.; Zhao, T.; Xu, X.; Hu, Y.; Zhao, Y.; Zhang, L.; Pang, Y.; Ma, X.; Bai, Y.; Zhao, Y.; et al. Anomalous surface O3 changes in North China Plain during the northwestward movement of a landing typhoon. Sci. Total Environ. 2022, 820, 153196. [Google Scholar] [CrossRef] [PubMed]
  26. Ouyang, S.; Deng, T.; Liu, R.; Chen, J.; He, G.; Leung, J.C.-H.; Wang, N.; Liu, S.C. Impact of a subtropical high and a typhoon on a severe ozone pollution episode in the Pearl River Delta, China. Atmos. Chem. Phys. 2022, 22, 10751–10767. [Google Scholar] [CrossRef]
  27. Zhao, D.; Xin, J.; Wang, W.; Jia, D.; Wang, Z.; Xiao, H.; Liu, C.; Zhou, J.; Tong, L.; Ma, Y.; et al. Effects of the sea-land breeze on coastal ozone pollution in the Yangtze River Delta, China. Sci. Total Environ. 2022, 807, 150306. [Google Scholar] [CrossRef]
  28. Wang, Y.; Wang, H.; Wang, W. A Stratospheric intrusion-influenced ozone pollution episode associated with an intense horizontal-trough event. Atmosphere 2020, 11, 164. [Google Scholar] [CrossRef]
  29. Ni, Z.-Z.; Luo, K.; Gao, X.; Gao, Y.; Fan, J.-R.; Fu, J.S.; Chen, C.-H. Exploring the stratospheric source of ozone pollution over China during the 2016 Group of Twenty summit. Atmos. Pollut. Res. 2019, 10, 1267–1275. [Google Scholar] [CrossRef]
  30. He, G.; He, C.; Wang, H.; Miao, S.; Liu, C.; Wang, Y.; Liu, N.; Cao, T.; Deng, T.; Wu, D.; et al. Nocturnal ground-level ozone enhancement over the Pearl River Estuary: Two case studies based on vertical observations. Acta Sci. Circumstantiae 2023, 43, 87–96. [Google Scholar] [CrossRef]
  31. He, C.; He, G.; Liu, C.; Wang, H.; Chen, X.; Liu, N.; Wang, H.; Lu, X.; Fan, S. Characteristics of nocturnal ozone enhancement events and a case study of horizontal transport in Guangzhou during warm season. Acta Sci. Circumstantiae 2023, 43, 76–86. [Google Scholar] [CrossRef]
  32. Zhao, M.; Shen, H.; Chen, T.; Li, J.; Sun, Z.; Ji, Y.; Xue, L.; Li, H.; Wang, W.; Shang, F. Characteristics and sensitivity analysis of ozone in the representative city of the Yellow River Delta in summer. Res. Environ. Sci. 2022, 35, 1351–1361. [Google Scholar] [CrossRef]
  33. Du, X.; Zhang, L.; Liang, H. Variation characteristics and correlation analysis of air quality index and acid rain in Dongying City. J. Environ. Eng. Technol. 2021, 11, 33–40. [Google Scholar] [CrossRef]
  34. Ji, Y.; An, C.; Tang, J.; Li, J.; Yan, X.; Gao, X.; Chu, W.; Zhong, X.; Shang, F.; Li, J.; et al. Causes investigation of PM2.5 and O3 complex pollution in a typical coastal city in the Bohai Bay Region of China in autumn: Based on one-month continuous intensive observation and model simulation. Atmosphere 2024, 15, 73. [Google Scholar] [CrossRef]
  35. An, C.; Ji, Y.; Chu, W.; Yan, X.; Bi, F.; Gao, Y.; Xue, L.; Shang, F.; Li, J.; Li, H. Spatiotemporal distribution characteristics of ground-level-ozone and its relationship with meteorological conditions in a representative city in the Bohai Rim from 2017 to 2022. Environ. Sci. 2024, 8. [Google Scholar] [CrossRef]
  36. Huang, B.; Huang, Y.; Bao, S. A new exploration on the strategic functions of central cities from the perspective of the rise of the Yellow River Delta. Truth Seek. 2013, S2, 141–143. [Google Scholar]
  37. Ismail, A.A.K.H. Prediction of global solar radiation from sunrise duration using regression functions. Kuwait J. Sci. 2022, 49, 1–8. [Google Scholar] [CrossRef]
  38. Zeng, Z.; Wang, Z.; Gui, K.; Yan, X.; Gao, M.; Luo, M.; Geng, H.; Liao, T.; Li, X.; An, J.; et al. Daily global solar radiation in China estimated from high-density meteorological observations: A random forest model framework. Earth Space Sci. 2020, 7, e2019EA001058. [Google Scholar] [CrossRef]
  39. Kaplanis, S.N. New methodologies to estimate the hourly global solar radiation; Comparisons with existing models. Renew. Energy 2006, 31, 781–790. [Google Scholar] [CrossRef]
  40. Ayodele, T.R.; Ogunjuyigbe, A.S.O.; Monyei, C.G. On the global solar radiation prediction methods. J. Renew. Sustain. Energy 2016, 8, 023702. [Google Scholar] [CrossRef]
  41. Mullen, R.; Marshall, L.; McGlynn, B. A beta regression model for improved solar radiation predictions. J. Appl. Meteorol. Clim. 2013, 52, 1938. [Google Scholar] [CrossRef]
  42. Jia, D.; Yang, L.; Lv, T.; Liu, W.; Gao, X.; Zhou, J. Evaluation of machine learning models for predicting daily global and diffuse solar radiation under different weather/pollution conditions. Renew. Energy 2022, 187, 896–906. [Google Scholar] [CrossRef]
  43. Mughal, S.N.; Sood, Y.R.; Jarial, R.K. A neural network-based time-series model for predicting global solar radiations. IETE J. Res. 2021, 69, 3418–3430. [Google Scholar] [CrossRef]
  44. Chu, W.; Li, L.; Li, H.; Zhang, Y.; Chen, Y.; Zhi, G.; Yang, X.; Ji, Y.; Chai, F. Atmospheric oxidation capacity and its impact on the secondary inorganic components of PM2.5 in recent years in Beijing: Enlightenment for PM2.5 pollution control in the Future. Atmosphere 2023, 14, 1252. [Google Scholar] [CrossRef]
  45. An, C.; Li, H.; Ji, Y.; Chu, W.; Yan, X.; Chai, F. A review on nocturnal surface ozone enhancement: Characterization, formation causes, and atmospheric chemical effects. Sci. Total Environ. 2024, 921, 170731. [Google Scholar] [CrossRef] [PubMed]
  46. He, G.; He, C.; Wang, H.; Lu, X.; Pei, C.; Qiu, X.; Liu, C.; Wang, Y.; Liu, N.; Zhang, J.; et al. Nighttime ozone in the lower boundary layer: Insights from 3-year tower-based measurements in South China and regional air quality modeling. Atmos. Chem. Phys. 2023, 23, 13107–13124. [Google Scholar] [CrossRef]
  47. Yang, H.; Lu, C.; Hu, Y.; Chan, P.-W.; Li, L.; Zhang, L. Effects of horizontal transport and vertical mixing on nocturnal ozone pollution in the Pearl River Delta. Atmosphere 2022, 13, 1318. [Google Scholar] [CrossRef]
  48. Shao, Y.; Zhang, J.; Ishizuka, M.; Mikami, M.; Leys, J.; Huang, N. Dependency of particle size distribution at dust emission on friction velocity and atmospheric boundarylayer stability. Atmos. Chem. Phys. 2020, 20, 12939–12953. [Google Scholar] [CrossRef]
  49. Shan, W.; Yin, Y.; Zhang, J.; Ding, Y. Observational study of surface ozone at an urban site in East China. Atmos. Res. 2008, 89, 252–261. [Google Scholar] [CrossRef]
  50. Yusoff, M.F.; Latif, M.T.; Juneng, L.; Khan, M.F.; Ahamad, F.; Chung, J.X.; Mohtar, A.A.A. Spatio-temporal assessment of nocturnal surface ozone in Malaysia. Atmos. Environ. 2019, 207, 105–116. [Google Scholar] [CrossRef]
  51. Jia, S.; Xu, X.; Lin, W.; Wang, Y.; He, X.; Zhang, H. Increased mixing ratio of surface ozone by nighttime convection process over the North China Plain. J. Appl. Meteor. Sci. 2015, 26, 280–290. [Google Scholar] [CrossRef]
  52. Chen, Z.; Liu, J.; Qie, X.; Cheng, X.; Shen, Y.; Yang, M.; Jiang, R.; Liu, X. Transport of substantial stratospheric ozone to the surface by a dying typhoon and shallow convection. Atmos. Chem. Phys. 2022, 22, 8221–8240. [Google Scholar] [CrossRef]
  53. Sullivan, J.; Rabenhorst, S.; Dreessen, J.; McGee, T.; Delgado, R.; Twigg, L.; Sumnicht, G. Lidar observations revealing transport of O3 in the presence of a nocturnal low-level jet: Regional implications for “next-day” pollution. Atmos. Environ. 2017, 158, 160–171. [Google Scholar] [CrossRef]
  54. Zhai, T.; Lu, K.; Wang, H.; Lou, S.; Chen, X.; Hu, R.; Zhang, Y. Elucidate the formation mechanism of particulate nitrate based on direct radical observations in the Yangtze River Delta summer 2019. Atmos. Chem. Phys. 2023, 23, 2379–2391. [Google Scholar] [CrossRef]
  55. Wang, H.; Lu, K.; Tan, Z.; Chen, X.; Liu, Y.; Zhang, Y. Formation mechanism and control strategy for particulate nitrate in China. J. Environ. Sci. 2023, 123, 476–486. [Google Scholar] [CrossRef]
  56. Xue, J.; Yuan, Z.; Griffith, S.; Yu, X.; Lau, A.; Yu, J. Sulfate formation enhanced by a cocktail of high NOx,SO2, particulate matter, and droplet pH during Haze-Fog events in megacities in China: An observation-based modeling investigation. Environ. Sci. Technol. 2023, 123, 476–486. [Google Scholar] [CrossRef]
  57. Ye, C.; Lu, K.; Song, H.; Mu, Y.; Chen, J.; Zhang, Y. A critical review of sulfate aerosol formation mechanisms during winter polluted periods. J. Environ. Sci. 2023, 123, 387–399. [Google Scholar] [CrossRef]
Figure 1. Geographic location of Dongying City.
Atmosphere 15 00475 g001
Figure 2. Dinunal variations in ultraviolet radiation in Dongying from 2022 to 2023.
Atmosphere 15 00475 g002
Figure 3. Inter-annual and inter-monthly changes in nocturnal ozone concentrations in Dongying from 2022 to 2023.
Atmosphere 15 00475 g003
Figure 4. Inter-annual and inter-monthly changes in daytime ozone concentrations in Dongying from 2022 to 2023.
Atmosphere 15 00475 g004
Figure 5. Monthly mean value changes in daytime and nighttime ozone concentrations in Dongying from 2022 to 2023.
Atmosphere 15 00475 g005
Figure 6. Characteristics of different percentiles of nocturnal ozone concentrations in Dongying from 2022 to 2023.
Atmosphere 15 00475 g006
Figure 7. Diurnal variations in nocturnal ozone concentrations in Dongying from 2022 to 2023.
Atmosphere 15 00475 g007
Figure 8. The frequency of NOE events in Dongying across different months from 2022 to 2023.
Atmosphere 15 00475 g008
Figure 9. Monthly distribution characteristics of (a) average ozone concentration and (b) nocturnal boundary layer height in Dongying from 2022 to 2023.
Atmosphere 15 00475 g009
Figure 10. The frequency of NOE events in Dongying at different times from 2022 to 2023.
Atmosphere 15 00475 g010
Figure 11. Distribution characteristics of (a) nocturnal ozone peak and (b) magnitude of ozone increase in Dongying from 2022 to 2023.
Atmosphere 15 00475 g011
Figure 12. Distribution characteristics of nocturnal ozone peaks at different times in Dongying from 2022 to 2023.
Atmosphere 15 00475 g012
Figure 13. Distribution characteristics of O3, PM2.5, NO2, and SO2 concentrations in Dongying during different seasons from 2022 to 2023.
Atmosphere 15 00475 g013
Figure 14. Distribution characteristics of Ox, PM2.5-bounded NO3, PM2.5-bounded SO42−, and SOC concentrations in Dongying during different seasons from 2022 to 2023.
Atmosphere 15 00475 g014
Figure 15. Difference in nocturnal O3, Ox, and MDA8-O3 of the same day during NOE events and NNOE events in Dongying from 2022 to 2023.
Atmosphere 15 00475 g015
Figure 16. Differences in O3, Ox, and MDA8-O3 on the next day during NOE events and NNOE events in Dongying from 2022 to 2023.
Atmosphere 15 00475 g016
Figure 17. Correlations between Ox concentrations, PM2.5, and PM2.5-bounded components during different seasons of NOE events in Dongying from 2022 to 2023 (* indicates p < 0.05).
Atmosphere 15 00475 g017
Figure 18. Differences in nocturnal PM2.5, PM2.5-bounded NO3, SO42−, and SOC during the NOE events and NNOE events in Dongying from 2022 to 2023.
Atmosphere 15 00475 g018
Figure 19. Differences in nocturnal NOR and SOR during the NOE events and NNOE events in Dongying from 2022 to 2023.
Atmosphere 15 00475 g019
Figure 20. Differences in PM2.5, PM2.5-bounded NO3, SO42−, and SOC concentrations of the next day during the NOE events and NNOE events in Dongying from 2022 to 2023.
Atmosphere 15 00475 g020
Table 1. Frequency of NOE events in different months in 2022 and 2023 in Dongying.
20222023
January29%32%
February46%36%
March58%55%
April43%47%
May55%42%
June47%53%
July32%23%
August39%58%
September63%47%
October42%61%
November47%33%
December23%32%
Disclaimer/Publisher’s Note: The statements, opinions and data contained in all publications are solely those of the individual author(s) and contributor(s) and not of MDPI and/or the editor(s). MDPI and/or the editor(s) disclaim responsibility for any injury to people or property resulting from any ideas, methods, instructions or products referred to in the content.

