Article

The Quantitative Reconstruction of Paleoclimate in the Huangling Region of the Chinese Loess Plateau during the Middle and Late Holocene

1
Institute of Hydrogeology and Environmental Geology, Chinese Academy of Geological Sciences, Shijiazhuang 050061, China
2
Key Laboratory of Quaternary Chronology and Hydrological Environment Evolution, China Geological Survey, Shijiazhuang 050061, China
3
Aero Geophysical Survey and Remote Sensing Center for Natural Resources, China Geological Survey, Beijing 100083, China
*
Author to whom correspondence should be addressed.
Atmosphere 2024, 15(4), 476; https://doi.org/10.3390/atmos15040476
Submission received: 20 March 2024 / Revised: 9 April 2024 / Accepted: 10 April 2024 / Published: 11 April 2024
(This article belongs to the Special Issue Paleoclimate Reconstruction (2nd Edition))

Abstract

:
The Huangling region is located in the central part of the Chinese Loess Plateau, which is sensitive to climate change due to the transitional characteristics of the natural environmental zone in which it is located. In this study, we utilized a spore–pollen analysis of the Tianjiahe (TJH) profile in Huangling to apply the pollen–climate factor conversion function method. This approach allowed us to quantitatively reconstruct the paleotemperature and paleoprecipitation of the Huangling area during the Middle and Late Holocene. The results show that the Huangling area experienced four climatic stages during the Middle and Late Holocene, including mild and slightly humid → warm and humid → warm and slightly humid → warm and humid. Except for the period of 5.3–4.72 kaBP, during which the climate was relatively cool and dry compared to the present, the climate in the remaining period (4.72–0.03 kaBP) was warmer and more humid than that of the present. The above results provide an important insight for further exploring the mechanism of paleoclimate change and predicting future climate change.

1. Introduction

Over the past 100 years (1906–2005), the global average surface temperature has increased by approximately 0.74 °C [1]. It has received widespread attention from the scientific community and the public due to global warming and its consequences, such as glacier melting and rising sea levels. Understanding the driving mechanisms of climate change is crucial to studying the causes of global warming and formulating corresponding policies. Recognizing past temperature changes, especially during warm periods, is important in understanding climate change mechanisms. Instrumental temperature data are limited to records starting from 1850 A.D. Prior temperature variations are primarily inferred from sedimentary proxies such as ice cores, stalagmites, and loess. Therefore, conducting quantitative research on paleoclimatic elements plays a vital role in understanding the pattern of past climate change and reducing the uncertainty of future climate change predictions [2].
As one of the three pillars of international paleo-global change research, along with deep-sea sedimentation and polar ice cores, the loess of China contains abundant paleoclimate information [3,4,5,6,7]. Considering the high population density in the Loess Plateau region and its direct influence by the East Asian monsoon climate system [1], reconstructing the paleoclimate changes in the loess region during the Late Quaternary period can provide crucial evidence for understanding the mechanisms of climate change, predicting future climate change, and facilitating human adaptation. Since the 1990s, numerous studies have been conducted by scholars to quantitatively reconstruct the paleoclimate of the Loess Plateau during the Late Quaternary period. These studies utilize various physicochemical and biological indicators found in the Quaternary loess in China, including magnetic susceptibility [8,9,10], spore–pollen [11], phytoliths [12,13], free and total iron [14,15], and microbial lipids [16,17], among others. Substantial progress has been made in quantitative paleoclimate research, with the results generally suggesting that the quantitative reconstruction using biological indicators is reliable [10]. As one of the bio-indicators, spore–pollen can be preserved continuously in large quantities in sediments due to its characteristics of corrosion resistance, easy dispersal, and high yield in the spores and pollen of plants. Therefore, it is commonly used to recover paleo-vegetation succession and reconstruct paleoclimate evolution as climate proxies [18].
The evolution of paleoclimatic reconstruction methods based on spore–pollen data has accelerated due to the widespread application of statistics and mathematics in biological research, advancements in computer technology, the enhancement in global vegetation and meteorological databases, and the ongoing development and expansion of modern spore–pollen databases. These factors have collectively propelled the transition towards more quantitative approaches in paleoclimate reconstruction. Numerous reliable quantitative reconstruction methods for paleoclimate have emerged. The widely used domestic and international methods include the spore–pollen-complexity–climate conversion function [19,20], pollen–climate factor conversion function [21,22,23], pollen–climate correspondence analysis [24,25,26], pollen–climate response surface modeling [27,28], coexistence factor analysis [29,30,31], and other factors. Kay [32] utilized the conversion function to study the change in summer temperature since the Middle Holocene in northern Canada. Andrews et al. [33] used 19 pollen types to establish the conversion function with five climate factors, quantitatively analyzing the climate change since the Middle Holocene in the eastern Arctic region of Canada. Adam et al. [34] used the pollen–climate transformation function method to investigate the temperature and precipitation changes in Clear Lake in California, the United States, since the last glacial cyclone. Seppa et al. [35] used 304 topsoil pollen samples from Finland, Norway, and Sweden to quantitatively reconstruct the July mean temperature and annual precipitation in northern Finland since 9900 years ago by using the transformation function established by Weighted-averaging Partial Least Squares Regression (WA-PLS). Seppa et al. [36] quantitatively reconstructed the paleotemperature and paleoprecipitation since the Holocene in the Toskljavri area, Finland, using the transformation function. Since the beginning of the 20th century, Chinese scholars have also achieved significant results in Quaternary paleoclimate research using the abovementioned methods. Tong Guobang et al. [37,38,39] quantitatively reconstructed the Quaternary paleoclimate of the Longguan Lake area, the Taibai Mountains, and the Heqing Basin in Yunnan Province. Song Changqing et al. [40] established a pollen–climate factor conversion function for northern China and quantitatively reconstructed the paleoclimate since the Holocene in the central part of Inner Mongolia using the function. Wang Fengyu et al. [41] restored the Holocene paleoclimate of the Chasuqi peat deposition profile using pollen–climate response surfaces. Xu Qinghai et al. [42,43] reconstructed the paleoclimate of the Daihai Basin and the Yanshan area in the past few thousand years. Cai Yongli et al. [44] reconstructed Shanghai’s mean annual temperature and precipitation series 8500 years ago.
The Huangling area is located in the central part of the Chinese Loess Plateau, a semi-arid and semi-humid region in the warm–temperate zone. Due to the transitional characteristics of the natural environment zone in this area, it is susceptible to climate change, especially the fluctuation of climate dryness and wetness, which directly impact the turnover of forests and grassland vegetation. This creates the primary conditions for using a spore–pollen analysis in reconstructing the paleoenvironmental and paleoclimate. Using the Tianjiahe (TJH) profile in the Huangling region of the Chinese Loess Plateau as a typical example (Figure 1), a high-resolution spore–pollen analysis and the pollen–climate factor conversion function are employed in this study to quantitatively reconstruct temperature and precipitation changes in the Huangling region during the Middle and Late Holocene. This study aims to explore the pattern of paleoclimatic change in the Loess Plateau during this period, providing essential evidence for further exploring the mechanism of paleoclimate change and predicting future climate change.

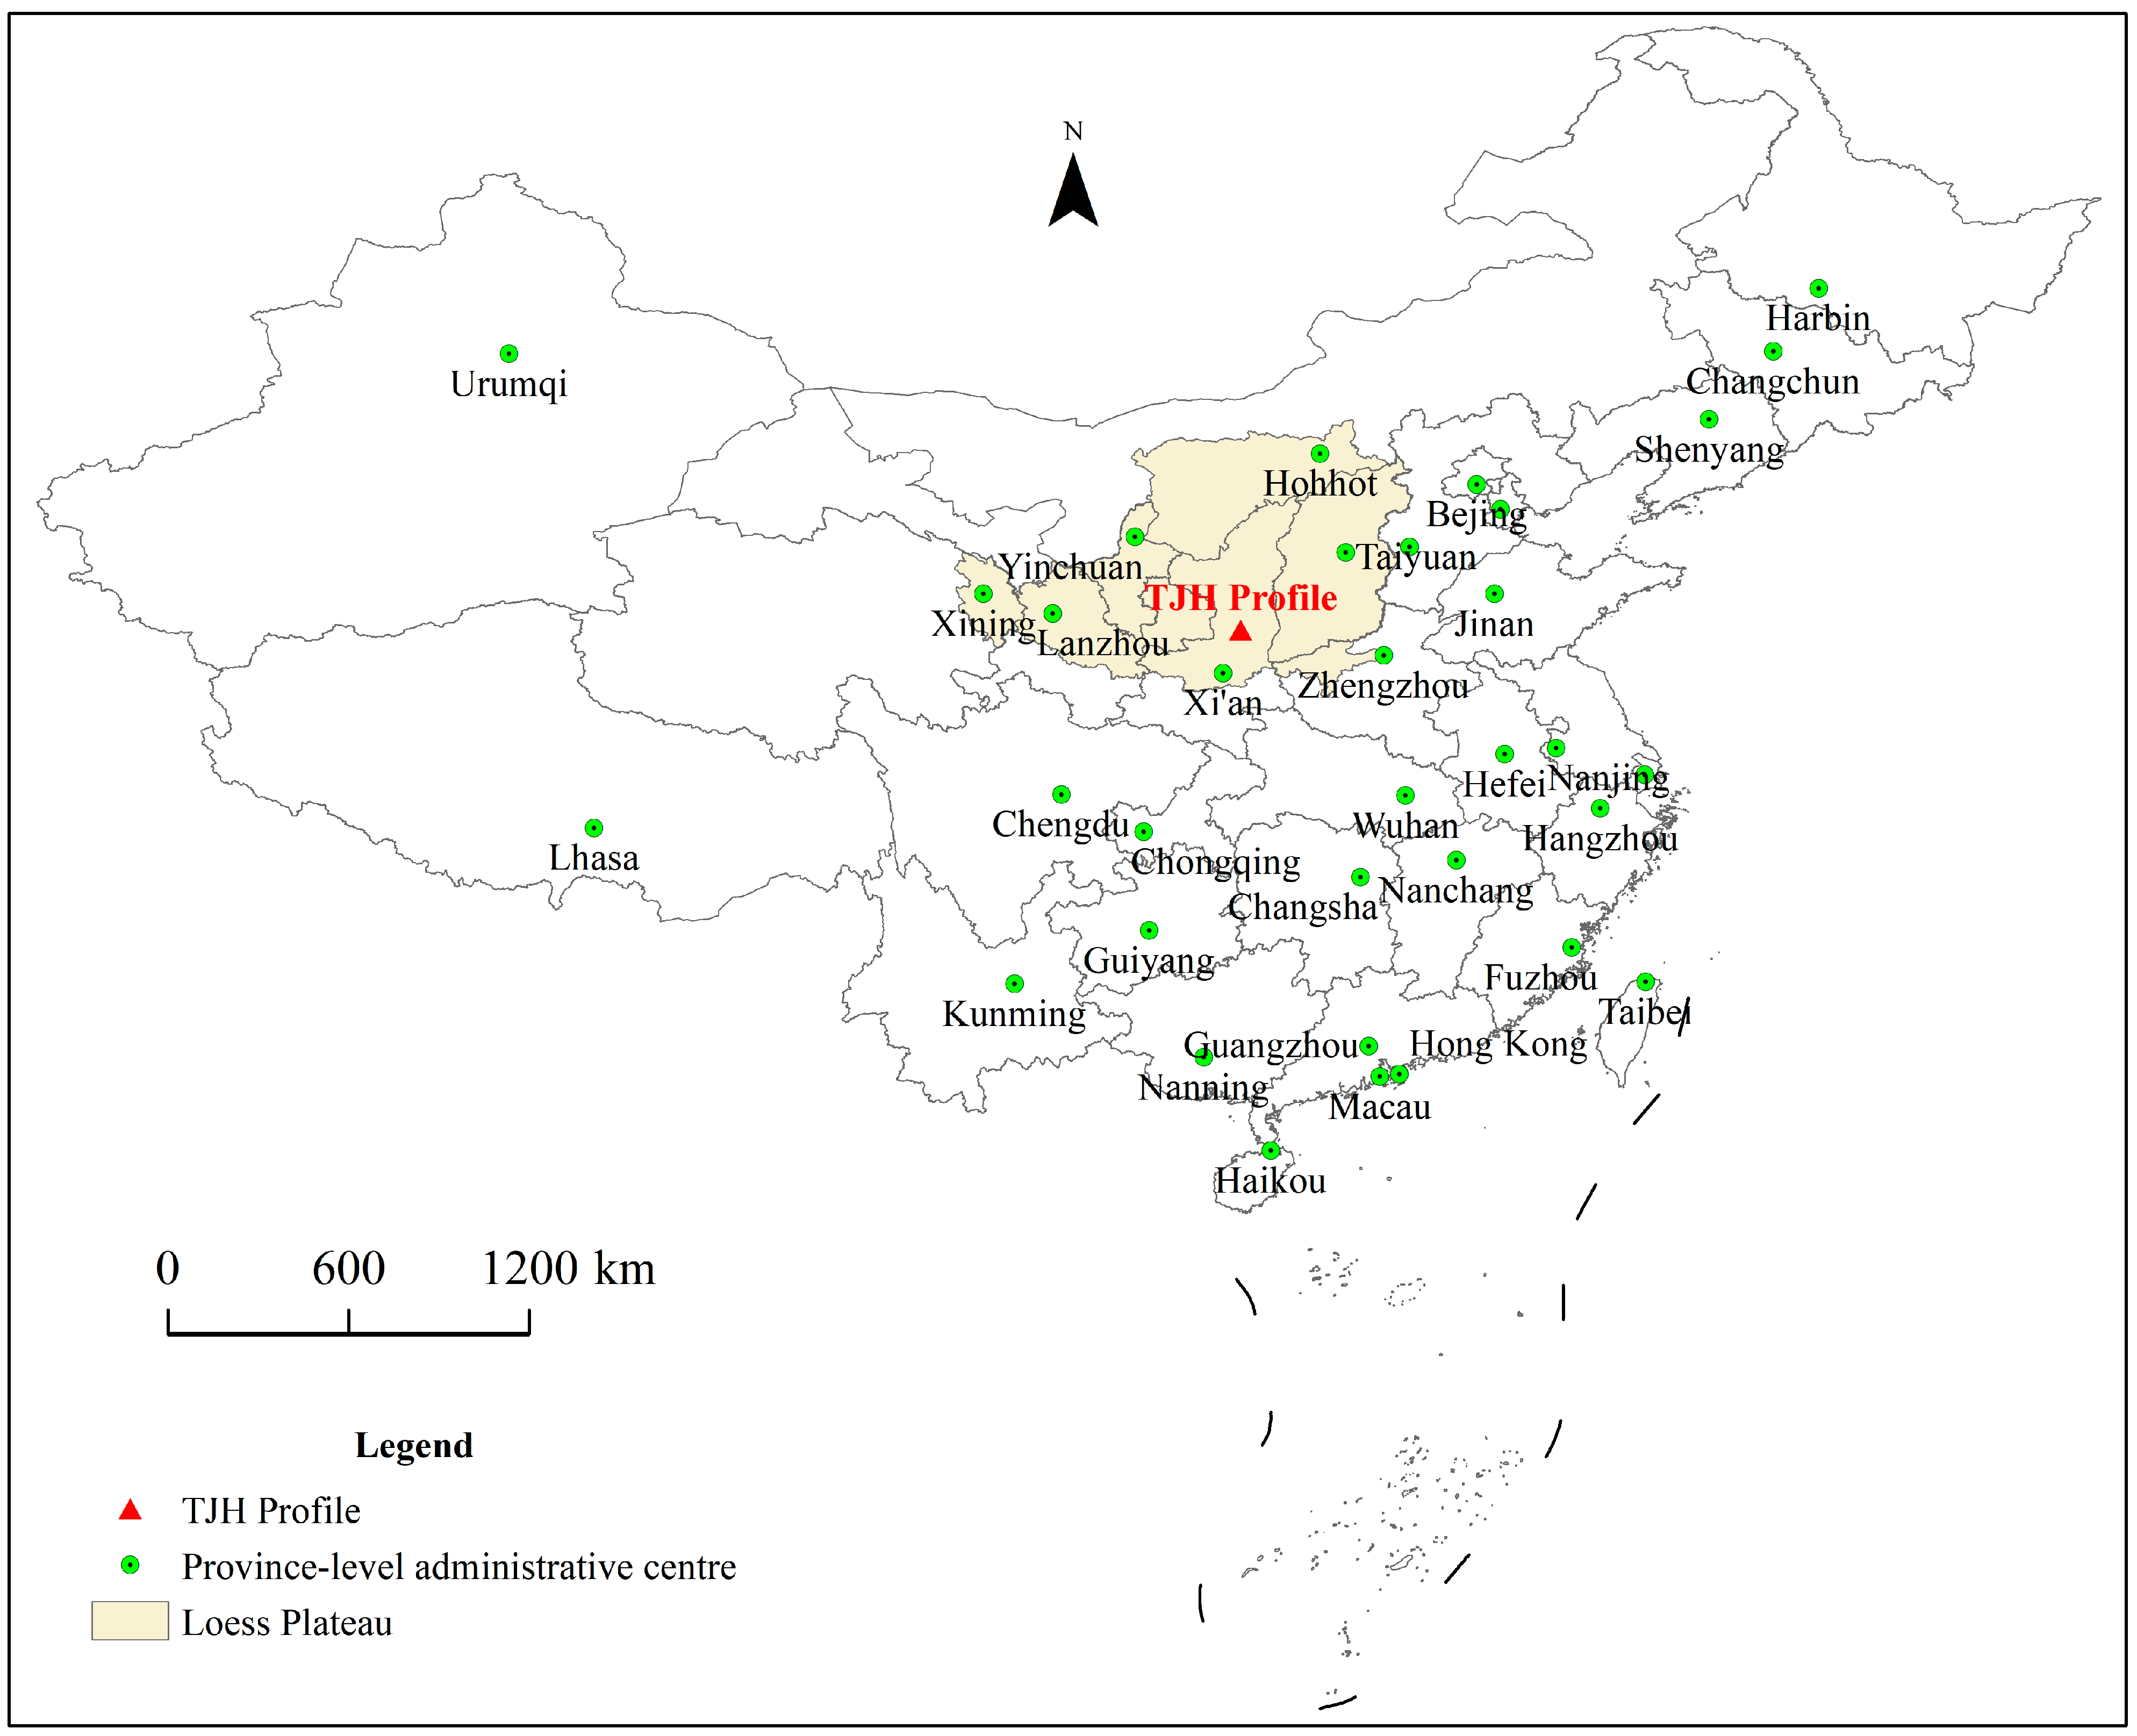
2. Overview of the Study Area
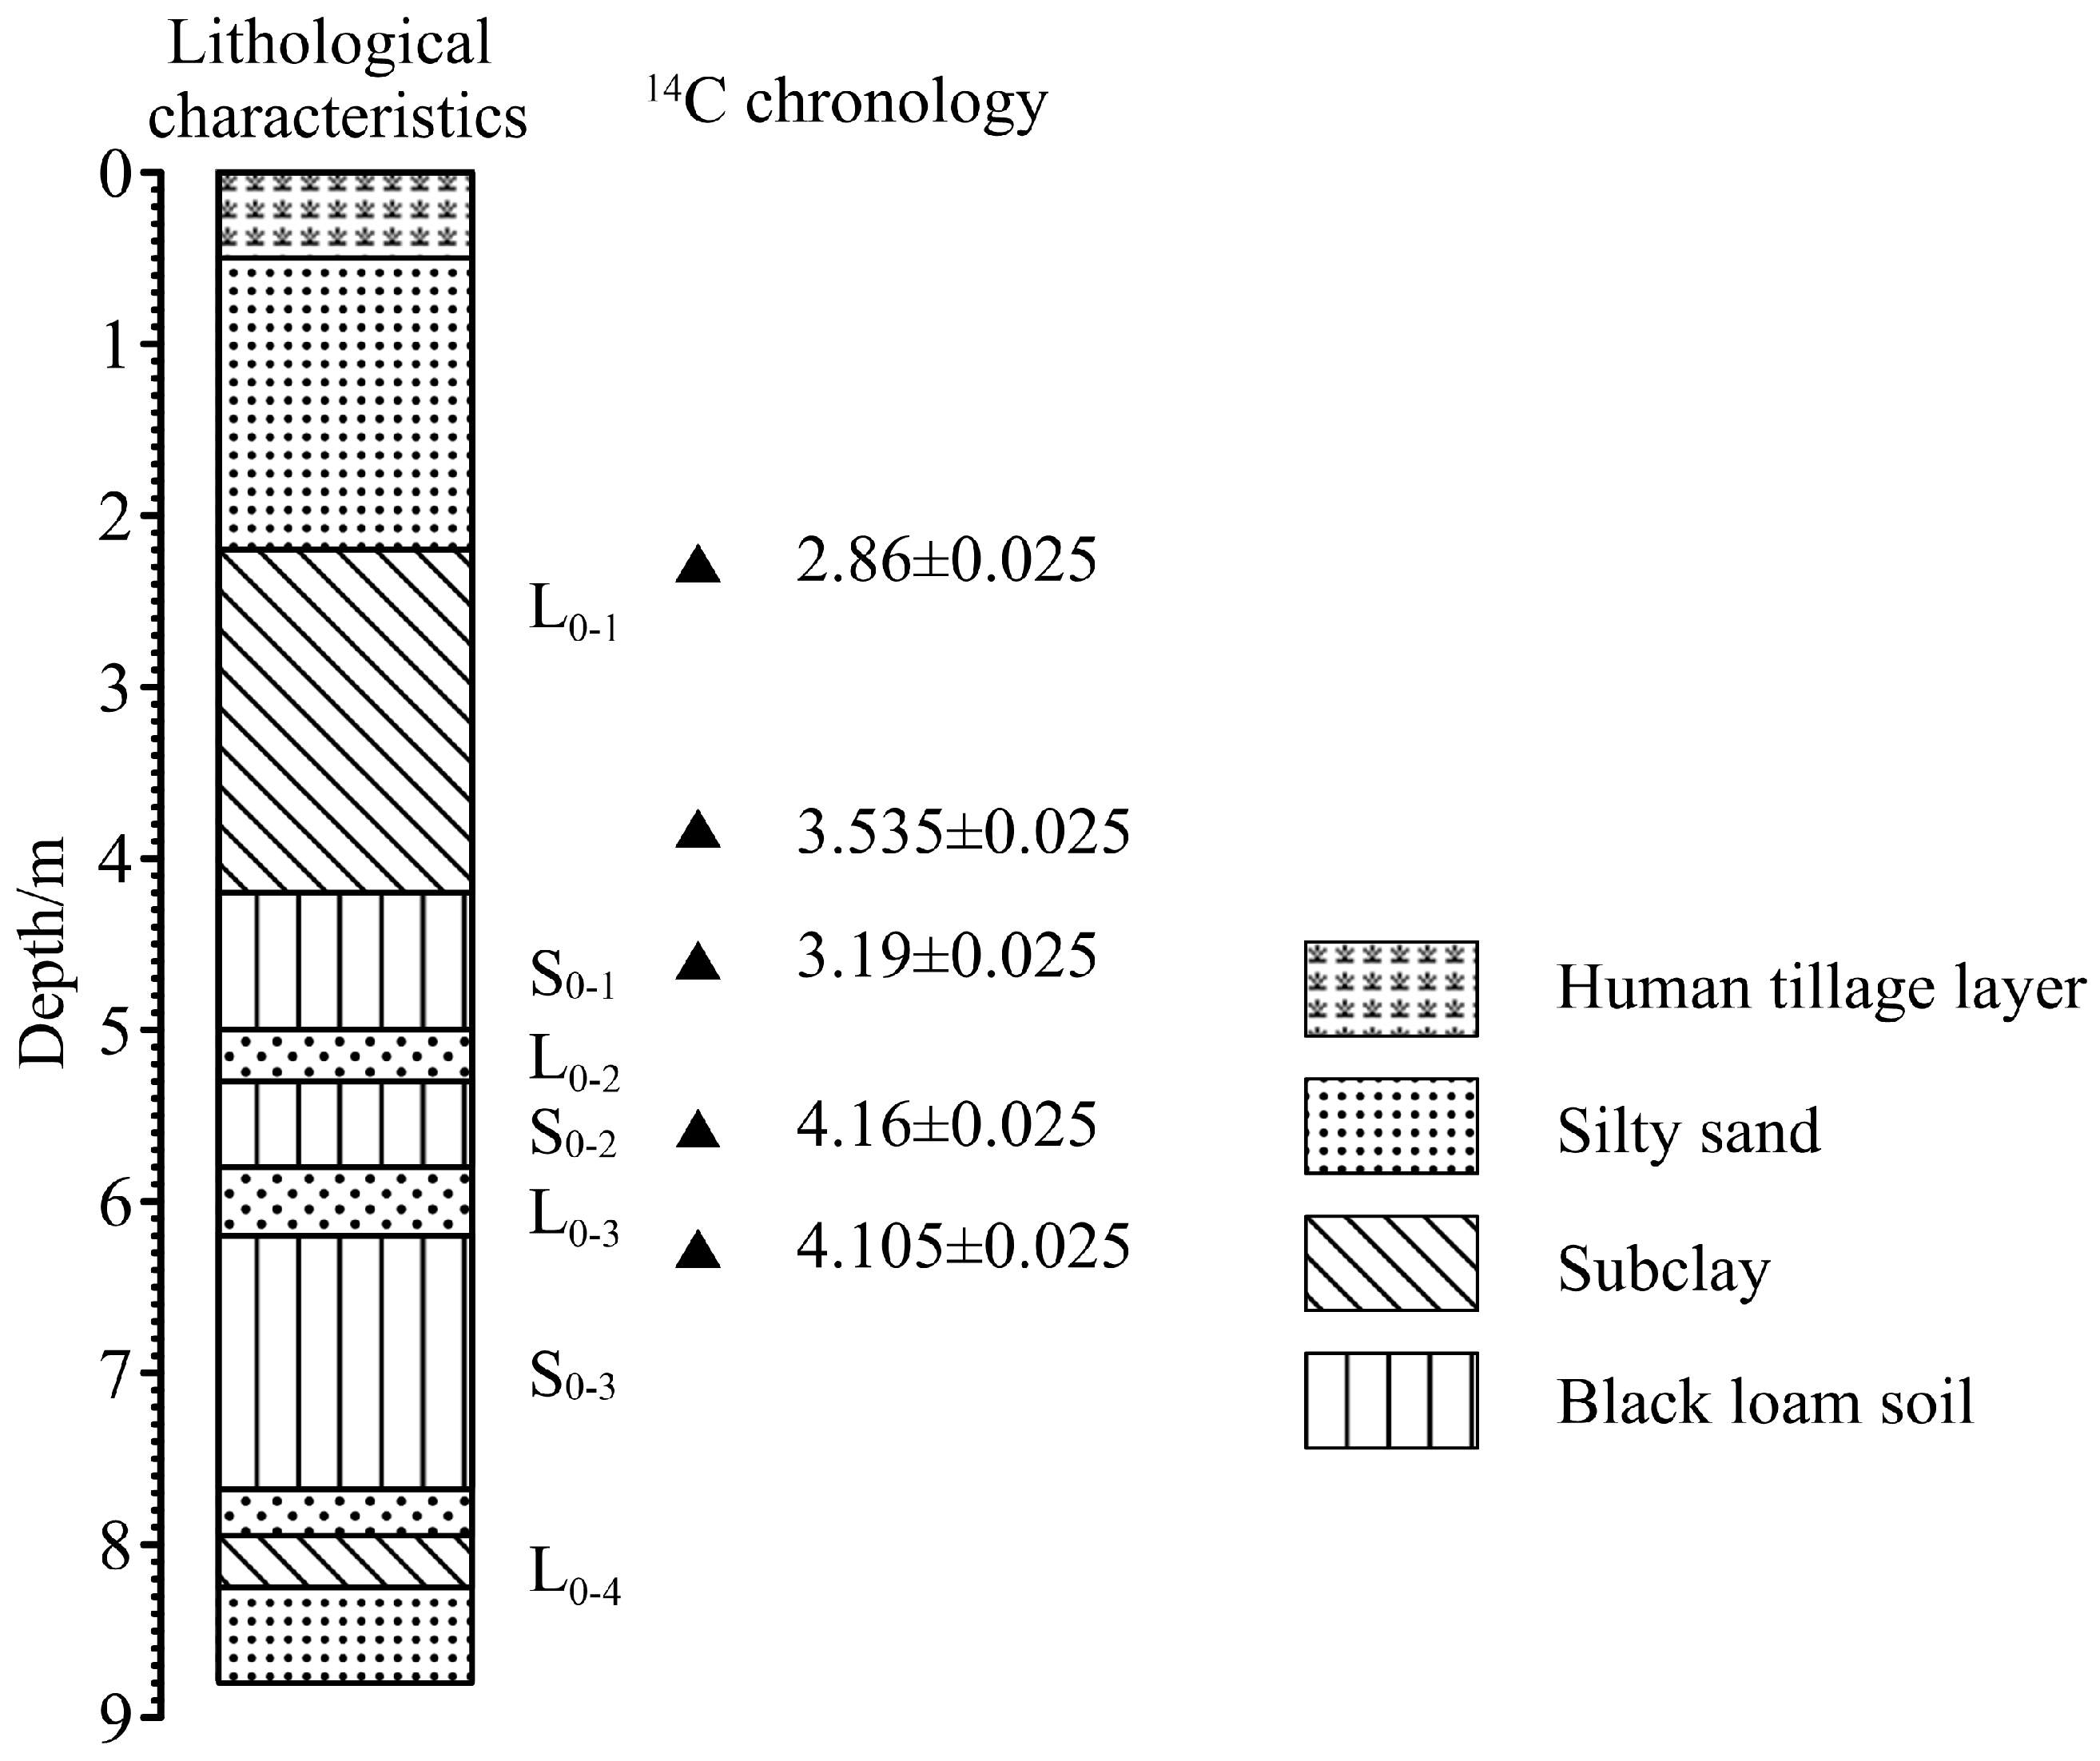
The Tianjiahe (TJH) profile is located on the second terrace of the Luohe River and is about 13 km southeast of Huangling County. The profile is 8.8 m high and contains three layers of black loam soils and four layers of loess units. The specific lithological characteristics of the profile are described as follows (Figure 2):
(1)
Loess Unit L0-1
0–0.50 m: Human tillage layer.
0.50–2.20 m: Gray-yellow muddy silty sand, loose and porous, and homogeneous texture, with developed root holes and wormholes.
2.20–4.10 m: From top to bottom, color ranges from light gray to gray, and lithology grades from silty sand to subclay, loose and porous, with abundant mycelium and occasional calcareous nodules (3–4 cm in size). Some wormholes are partially filled with clay.
4.10–4.20 m: Transitional junction layer, slightly lighter in color, with localized 1 cm sized calcium nodules.
(2)
Paleosol Unit S0-1
4.20–5.00 m: The first layer of black loam soil, gray-black, has abundant mycelium, a hard and dense structure, and many root holes and wormholes developed.
(3)
Loess Unit L0-2
5.00–5.30 m: Black loam soil with weak soil properties (or silty sand), light gray-black, with abundant mycelium, hard texture, dense structure, localized calcareous nuclei, and wormhole development.
(4)
Paleosol Unit S0-2
5.30–5.80 m: Second layer of black loam soil, dark gray-black, with abundant mycelium, a hard, dense structure, and 1–2 cm of calcium nodules visible at the top, with wormhole development.
(5)
Loess Unit L0-3
5.80–6.20 m: Gray-yellow silty sand with weak soil properties, local with wormhole development, loose and porous.
(6)
Paleosol Unit S0-3
6.20–7.68 m: Third layer of black loam soil, dark gray-black, with abundant mycelium, dense structure, and extensive wormhole development.
(7)
Loess Unit L0-4
7.68–7.95 m: Gray-yellow silty sand with a loose texture and root, wormhole development.
7.95–8.25 m: Gray-brown irregularly shaped clay, lenticular-like, and slightly reddish-brown, with mycelium development, locally containing clay grains (volume about 30 × 60 cm).
8.25–8.80 m: Grayish-yellow muddy silty sand, the upper layer of the binary structure.
Below 8.80 m: A binary structure of sand and gravel.

3. Materials and Methods

3.1. Spore–Pollen Analysis

In the Tianjiahe (TJH) profile, a total of 100 spore–pollen samples were analyzed. The samples underwent chemical treatment with acid and alkali in the laboratory, followed by neutralization through water exchange. Subsequently, centrifugation was performed, and flotation was carried out in the centrifuge using a heavy liquid with a specific gravity of 2.1 or higher. Subsequently, the samples were diluted with glacial acetic acid aqueous solution, concentrated, washed to neutrality with pure water, and transferred to test tubes. Finally, movable slides were prepared, observed, identified, and counted under a biological microscope. A total of 9062 pollen samples from terrestrial plants were counted. A total of 9062 pollen grains were counted, averaging 91 grains per sample. The total concentration of spore–pollen averaged 23 grains/g per sample. A total of 48 families and genera of plant pollen were found and identified, including tree plant pollen from 11 families and genera, shrub plant pollen from 5 families and genera, herb plant pollen from 25 families and genera, fern spores from 6 species and genera, and one concentricystis.

3.2. Chronological Analysis

Eight samples at depths of 2.40 m, 3.95 m, 4.28 m, 4.72 m, 5.40 m, 5.70 m, 6.40 m, and 7.52 m were selected for radiometric 14C chronology testing in the Tianjiahe (TJH) section, which was completed by the Laboratory of Scientific and Technological Archaeology and Conservation of Cultural Relics at the School of Archaeology, Wenbo, Peking University. Based on the concordance analysis, five results of high reliability were selected (Figure 2).

3.3. Statistical Methods

3.3.1. Cluster Analysis

A cluster analysis is a common data analysis method [45,46], whose main purpose is to divide objects in a dataset into several categories, so that objects within the same category have higher similarity, while objects between different categories have lower similarity. Common clustering algorithms include K-means clustering, hierarchical clustering, density clustering, etc. Different clustering algorithms are suitable for different types of data and problems. This study is based on the spore pollen percentage data of the Tianjiahe (TJH) section, determines the clustering units and variables, and uses the hierarchical clustering method for the cluster analysis. Finally, different spore–pollen combination zones are divided based on the affinity relationship of spore–pollen assemblages.

3.3.2. Multiple Regression Analysis

A regression analysis is one of the most common statistical analysis methods [47,48,49], which is to study the correlation between random variables through a set of (univariate regression) or multiple sets of (multiple regression) experimental (or observational) data, and establish a mathematical model for prediction or control. A regression analysis can be divided into a linear regression analysis and nonlinear regression analysis. When applying regression analysis methods to palynological research, linear regression (usually multiple linear regression) is used to establish pollen–climate factor conversion functions.

3.3.3. Pollen–Climate Factor Conversion Function

As a simple method to establish functional relationships for quantitative research on paleoclimate and the paleoenvironment, the pollen–climate factor conversion function has been widely used in various regions [50,51,52]. The quantitative reconstruction of paleoclimate was conducted using the pollen–climate factor conversion function method [53], coupled with the spore–pollen data obtained in this study. The pollen–climate factor conversion function method uses the topsoil spore–pollen data to carry out mathematical statistics, establish the pollen–climate factor conversion function through a stepwise regression analysis, and then apply the conversion function to the spore–pollen data of the borehole cores and profiles to obtain the values of the paleoclimate parameters. In developing the conversion function, stepwise regression was conducted using climate factors as the function and various pollen types as the variables. Each regression equation was iteratively calculated 70 times, ranging from 0.1 to 7.0 with an increment of 0.1 for each increase in F1 and F2. Finally, the regression equations with the smallest regression coefficient and the largest complex correlation coefficient of the values of F1 and F2 were selected to be the final conversion functions.
Drawing from the analysis of 215 topsoil spore–pollen samples from northern China, Song Changqing et al. (1997) [40] formulated a pollen–climate factor conversion function:
R = 580.291 + 9.3X2 + 6.3X3 + 1.8X5 + 4.6X6 − 1.4X7 − 1.5X8 − 9.3X9 − 1.9X10 − 4.4X11 + 7.6X12 − 10.9X13
T = 5.441 − 0.079X1 + 0.073X2 + 0.04X5 − 0.08X7 − 0.056X8 − 0.013X9 − 0.014X10 + 0.018X12
where R is the average annual precipitation, T is the average annual temperature, X1 is Betula, X2 is Querus, X3 is Juglans, X4 is Corylus, X5 is Pinus, X6 is Carpinus, X7 is Picea, X8 is Cyperaceae, X9 is Ephedra, X10 is Artemisia, X11 is Chenopodiaceae, X12 is Compositae, and X13 is Gramineae.
Due to the lack of topsoil spore–pollen data and the fact that the study area coincides with the geographic space of the topsoil samples of the pollen–climate factor conversion function conducted by Song Changqing et al. (1997) [40], this study borrows the pollen–climate factor conversion function of northern China by Song Changqing et al. (1997) [40] to quantitatively reconstruct the paleoclimate of the Huangling area since the Holocene.

4. Results

4.1. Characterization of Spore–Pollen Assemblages

According to the results of the statistical analysis of microscopic spore–pollen identification, 86 samples met the statistical criteria (≥50 grains). A set of 37 quantitative indicators was selected for the analysis, encompassing various aspects such as the total concentration of spore–pollen, pollen of tree plants, pollen of shrub plants, pollen of herb plants, spores of ferns, Pinus, Betula, Juglans, Moraceae, Rhus, Querus, Ulmus, Salix, Gramineae, Chenopodiaceae, Compositae, Artemisia, Echinops Type, Aster, Taraxacum type, Leguminosae, Ranunculaceae, Thalictrum, Polygonum, Solanaceae, Rosaceae, Convolvulaceae, Zygophyllaceae, Labiatae, Humulus, Urticaceae, Cyperaceae, Typha, Selaginella, S.Sinensis, Pteris, Adiantum, and Polypodiaceae. The spore–pollen percentage content pattern was made by using the sporophyte-specialized mapping software Tilia 2.0.45. According to the cluster analysis, the Tianjiahe (TJH) profile can be divided into four sporophyte zones from bottom to top. The characteristics of each sporophyte zone, as well as the reflected vegetation and climate, are as follows (Figure 3):
Spore–pollen zone I (8.8–7.52 m): The total concentration of spore–pollen was 18 grains/g, indicating a relatively low spore–pollen count. Herbaceous plant pollen was dominant in the spore–pollen assemblage, with an average content of 54.73%, including families such as Ranunculaceae, Rosaceae, Chenopodiaceae, Artemisia, Gramineae, and Thalictrum. This was followed by tree plant pollen, with an average content of 38.88%, and the pollen composition contained Pinus, Betula, Ulmus, Juglans, etc. In addition, there was a small amount of fern spores, with an average content of 5.89%, which could be seen in the Selaginella, Pteris, Polypodiaceae, etc. The average content of pollen in shrub plants accounted for only 0.49%. It was inferred that the vegetation type at that time was grassland, and the climate was mild and humid.
Spore–pollen zone II (7.52–6.04 m): The total concentration of spore–pollen was 57 grains/g, indicating a richer spore–pollen count. The spore–pollen combination exhibited an average pollen content of 34.45% from tree plants, primarily dominated by Pinus, alongside smaller quantities of Ulmus, Betula, and Querus. The average spore content of fern was 33.17%, mainly dominated by Selaginella. The average pollen content of herbaceous plant pollen was 32.2%, and the pollen contained Chenopodiaceae, Artemisia, Rosaceae, Solanaceae, Ranunculaceae, Cyperaceae, Convolvulaceae, etc. The average pollen content of shrub plant pollen only accounted for 0.18% of the total spore–pollen. It is assumed that the vegetation type at that time was grassland, and the climate was warm and humid.
Spore–pollen zone III (6.04–4 m): The concentration of spore–pollen was 53 grains/g. The spore–pollen assemblage was dominated by herbaceous plant pollen with an average content of 40.2%, and the pollen mainly contained Gramineae, Artemisia, Chenopodiaceae, Compositae, Humulus, Rosaceae, Ranunculaceae, and others, followed by fern spores with an average share of 33.05%, dominated by Selaginella, the sparse Polypodiaceae, Adiantum, S.Sinensis, etc. The pollen of tree plants had an average content of 26.56%, and the pollen mainly contained Pinus, Ulmus, Querus, Rhus, Betula, etc. On average, shrub plant pollen accounted for only 0.19% of the total spore–pollen. It is assumed that the vegetation type at that time was grassland, and the climate was warm and humid.
Spore–pollen zone IV (4–0.05 m): The spore–pollen concentration was 84 grains/g, indicating the most abundant spore–pollen zone. The fern spore content in the spore–pollen mix was dominant, with an average of 77.83%, and the spore species were dominated by Selaginella, sporadic Adiantum, and Polypodiaceae. This was followed by tree plant pollen, with an average of 14.97%, and the pollen mainly contained Pinus, Ulmus, Moraceae, Rhus, and Juglans, among others. The average herbaceous plant pollen was 7.2%, containing only a small amount of Artemisia, Gramineae, Compositae, and Solanaceae. It is assumed that the local vegetation type is grassland and that the climate is warm and humid.

4.2. Chronological Sequences

Based on the results of chronological tests and sedimentation rates, the approximate age of each sample was obtained using linear interpolation. The geologic age represented by each spore–pollen zone was extrapolated: spore–pollen zone I (8.8–7.52 m) corresponds to 5.3–4.72 kaBP, sporophyte zone II (7.52–6.04 m) corresponds to 4.72–3.91 kaBP, spore–pollen zone III (6.04–4 m) corresponds to 3.91–2.7 kaBP, and spore–pollen zone IV (4–0.05 m) corresponds to 2.7–0.03 kaBP. The absence of strata in the early Holocene may have been caused by river erosion.

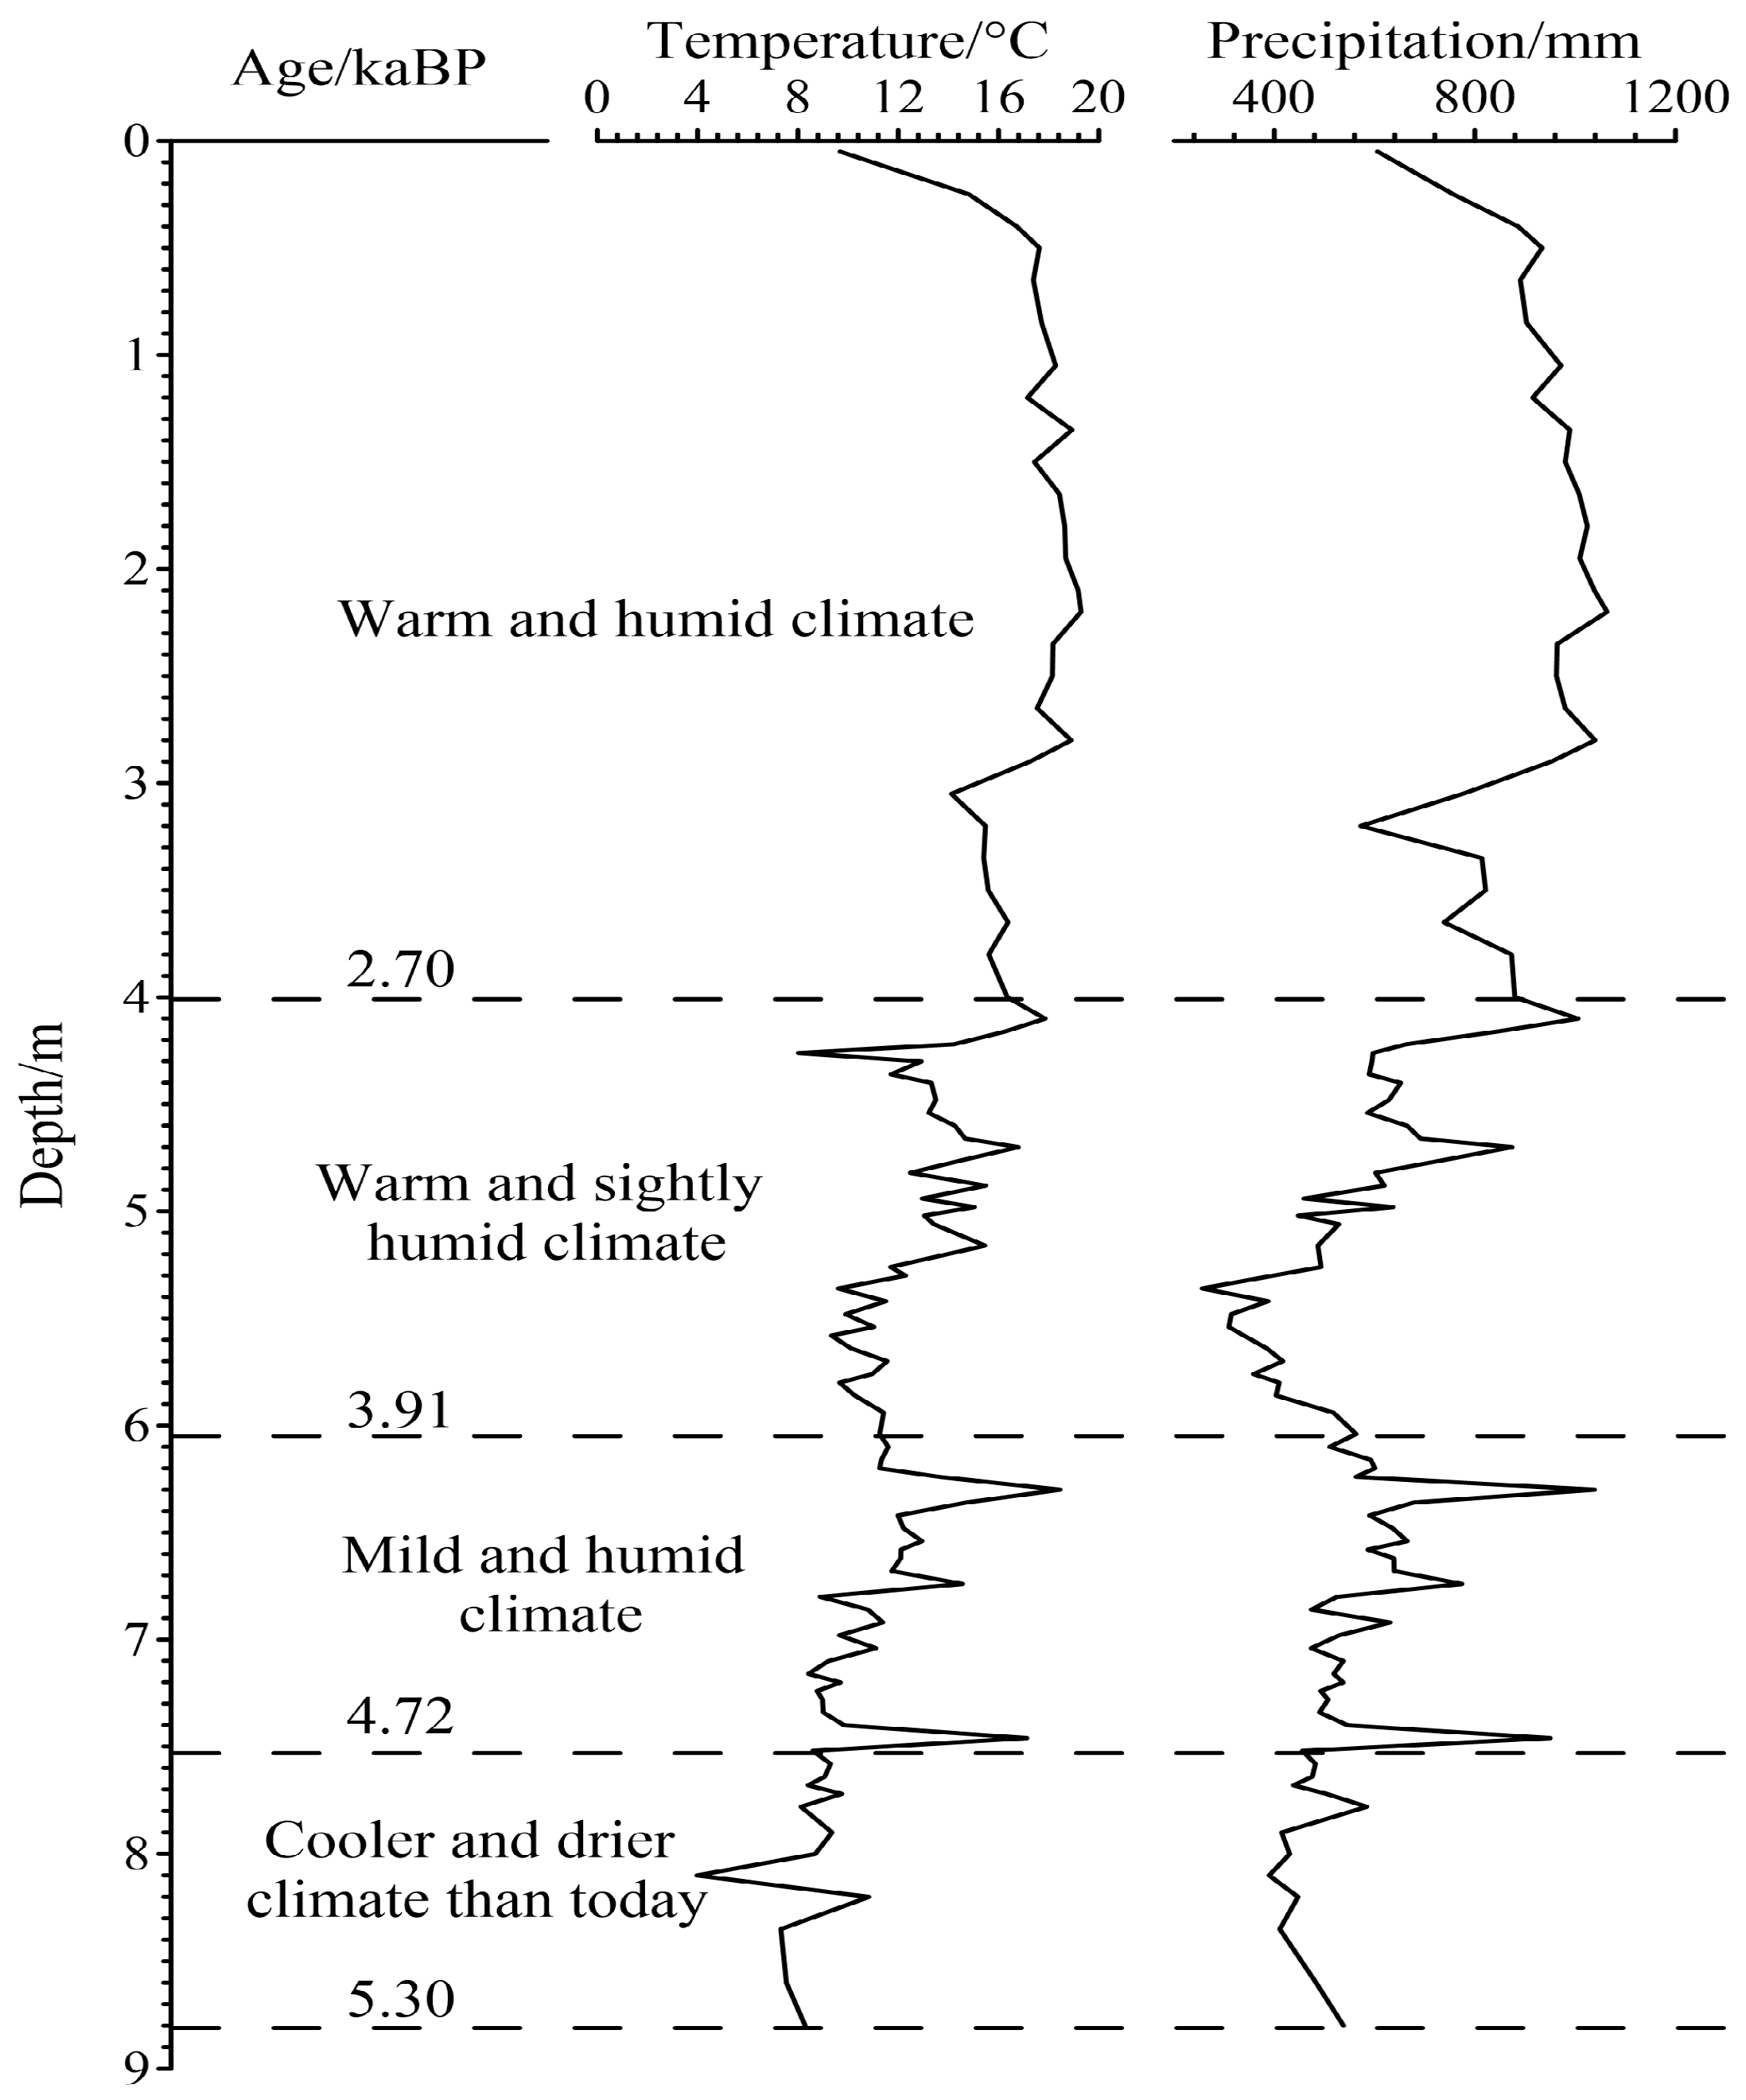
4.3. Results of the Quantitative Reconstruction of Paleoclimate

Based on the changing characteristics of spore–pollen assemblages in the Tianjiahe (TJH) profile, we quantitatively reconstructed the paleoclimate change characteristics during the Middle and Late Holocene in the Huangling area, which are described as follows (Figure 4):
Stage I (8.8–7.52 m; 5.3–4.72 kaBP): This stage has the lowest mean annual temperature and the smallest mean annual precipitation in this profile. The mean annual temperature fluctuates between 3.97 and 10.83 °C, with a mean annual temperature of 8.4 °C. The mean annual precipitation fluctuates between 390 and 584 mm, with a mean annual precipitation of 466 mm. It can be inferred from the above data analysis that the climate of that period was cooler and drier than today.
Stage II (7.52–6.04 m; 4.72–3.91 kaBP): Compared with the previous period, the climate in this stage gradually transitions to warm and humid and predominantly warm and humid. The mean annual temperature and mean annual precipitation fluctuated greatly, with the mean annual temperature fluctuating between 8.42 and 18.46 °C and the mean annual precipitation fluctuating between 473 and 1038 mm. The mean annual temperature during this stage was 11.59 °C, and the mean annual precipitation was 603 mm.
Stage III (6.04–4 m; 3.91–2.7 kaBP): The mean annual temperature in this period increased, and the mean annual precipitation decreased compared to the previous period. The mean annual temperature fluctuates from 8.02 to 17.86 °C, and the annual precipitation fluctuates from 256 to 1006 mm during this period, with a mean annual temperature of 12.79 °C and a mean annual precipitation of 552 mm. The mean annual rainfall of the sample at 5.36 m is the lowest in this profile, which is only 255.76 mm, possibly indicating a drought event.
Stage IV (4–0.05 m; 2.7–0.03 kaBP): This period has one of the region’s highest temperatures and highest precipitation. The average annual temperature and average annual precipitation increased compared to the previous period and remained relatively stable with less fluctuation. The average annual mean temperature in this period was 17.02 °C, and the average annual precipitation was 903 mm. The overall climate was warm and humid.
Overall, the paleoclimate reconstruction results from the sedimentary records indicate favorable, warm, and humid climate conditions in the Huangling area during the Middle and Late Holocene period. This is attributed to the enhanced solar radiation in the Northern Hemisphere in the summer from the early to Middle Holocene [54,55], leading to a significant rise in the summer temperature of the East Asian continent and increasing the gradient of the temperature difference between the land and the sea. This, in turn, caused the enhanced summer winds in East Asia, bringing in more water vapor and significantly pushing the rain belt to the northwest.

5. Discussion

The Holocene climate change has always been a hot research topic in the academic community, and its temperature and precipitation reconstruction provides an important basis for explaining modern warming and predicting future climate change [56]. In recent years, in order to obtain paleoclimate evolution information recorded in the Chinese loess in the Holocene, some scholars have used indicators such as the magnetic susceptibility [57], free iron/total iron ratio [58], phytoliths [12], organic carbon isotopes [59], Sr/Ca ratio of biocalcites [60], secondary carbonate Mg isotopes [61], cosmic nuclide 10Be [62], chemical weathering index [63], spore–pollen [64], terrestrial snail shell cluster isotopes [65], and microbial lipids [66] to conduct quantitative research on paleotemperature and precipitation in some classic loess profiles in different regions of the Loess Plateau. Based on the above quantitative climate reconstruction research results, it is found that the Holocene climate on the Loess Plateau showed an overall trend of gradually drying out. Among them, during the early Holocene, the climate warmed up and the East Asian summer monsoon gradually strengthened. The climate of the Middle Holocene was the wettest, during which the East Asian summer monsoon was prevalent. The Late Holocene was characterized by an overall arid climate and a weakening of the East Asian summer monsoon.
Taking the climate reconstruction results in the Weinan region since the Holocene, Li Jiahao (2022) [67] quantitatively reconstructed the temperature of the Holocene using the GDGTs’ index, which varied between 13.2 and 20.2 °C. Wang Fang (2015) [68] reconstructed the temperature of the Weinan region using pollen, which showed an overall trend of first increasing and then decreasing since the Holocene, with a range of −2.82–29.27 °C, an average temperature of about 14.2 °C, a precipitation range of 53.7–519.43 mm, and an average precipitation of 203 mm. Overall, the early Holocene generally in the Weinan region showed a gradual increase in temperature and precipitation, the Middle Holocene was the optimal climate period with the highest temperature and the highest precipitation, and the Late Holocene showed a trend of decreasing temperature and decreasing precipitation, with violent fluctuations.
The quantitative climate reconstruction in this study shows that the average annual temperature and precipitation in the Huangling area during the Middle and Late Holocene are mostly between 8.4 and 17.02 °C and 466 and 903 mm, and their climate change is roughly consistent with the classic Holocene changes. The pattern of change is that during the Middle Holocene was the best climate period with the highest temperature and the highest precipitation. Since the Late Holocene, the climate in this area has once again shown a trend of decreasing temperature and precipitation. Comparing the reconstructed paleoclimate changes using different indicators, although they reflect similar trends, there are significant differences in the magnitude and numerical values of the changes. The differences in the reconstructed results indicate the complexity and limitations of various indicators in reconstructing paleoclimate.

6. Conclusions

In summary, the Huangling area has probably undergone four climatic stages during the Middle and Late Holocene, including mild and slightly humid → warm and humid → warm and slightly humid → warm and humid. The quantitatively reconstructed mean annual temperature and mean annual precipitation in this study area generally ranged between 8.4 and 17.02 °C and 466 and 903 mm, respectively. In contrast, the current actual mean annual temperature and mean annual precipitation in the study area are 9.86 °C and 531 mm. Except for the period of 5.3–4.72 kaBP, which was cooler and drier than today, the climate in the rest of the period (4.72–0.03 kaBP) was generally warmer and more humid than that of the present.
The notable distinctions observed in the paleoclimatic indicators during the Middle and Late Holocene and the contemporary climate in this region imply a discernable discrepancy between the retrieved paleoclimatic parameters in this study and the actual parameters. This error is because the pollen–climate factor conversion function is based on a series of ecological assumptions, which assume a linear relationship between pollen and climate. In reality, the relationship between pollen and climate is unlikely to be entirely linear. Therefore, since the Holocene is only a kind of trend, the quantitatively reconstructed mean annual temperature and mean annual rainfall in the Huangling area represent a good attempt to quantitatively reconstruct the paleoclimate using mathematical methods. However, there is still a particular gap in the absolute value of the real quantitative reconstruction of paleoclimate parameters.

Author Contributions

Methodology, J.S.; validation, J.G., H.C., C.S. and Q.D.; formal analysis, W.W.; investigation, Q.D. and C.S.; resources, J.G.; data curation, Q.D.; writing—original draft preparation, J.G.; writing—review and editing, W.W.; visualization, W.W.; supervision, J.S.; project administration, J.G. and W.W.; funding acquisition, J.G. All authors have read and agreed to the published version of the manuscript.

Funding

This study was financially supported by the Basic Scientific Research Project (Grant No. SK202208 and SK202217), China Geological Survey Project (Grant No. DD20230427), and National Natural Science Foundation of China (Grant No. 41877398).

Institutional Review Board Statement

Not applicable.

Informed Consent Statement

Not applicable.

Data Availability Statement

Due to privacy the data presented in this study are available on request from the corresponding author.

Acknowledgments

We thank the editors and anonymous reviewers for their helpful comments.

Conflicts of Interest

The authors declare no conflicts of interest.

References

  1. Zeng, F.M. Research progress on quantitative reconstruction of paleotemperature recorded in loess deposit since late Quaternary. Geol. Sci. Technol. Inf. 2013, 32, 84–88. [Google Scholar]
  2. Stocker, T.F.; Qin, D.H.; Plattner, G.K.; Tignor, M.M.B.; Allen, S.K.; Boschung, J.; Nauels, A.; Xia, Y.; Bex, V.; Midgley, P.M. Climate change 2013: The physical science basis. In Intergovernmental Panel on Climate Change, Working Group Ⅰ Contribution to the IPCC Fifth Assessment Report (AR5); Cambridge University Press: New York, NY, USA, 2013; p. 42. [Google Scholar]
  3. Liu, T.S. Loess and Environment; Science Press: Beijing, China, 1985. [Google Scholar]
  4. Burbank, D.W.; Li, J.J. Age and palaeoclimatic significance of the loess of Lanzhou, North China. Nature 1985, 316, 429–431. [Google Scholar] [CrossRef]
  5. Heller, F.; Liu, T.S. Magnetostratigraphical dating of loess deposits in China. Nature 1982, 300, 431–433. [Google Scholar] [CrossRef]
  6. An, Z.S.; Kutzbach, J.E.; Prell, W.L.; Porter, S.C. Evolution of Asian monsoons and phased uplift of the Himalaya-Tibetan plateau since Late Miocene times. Nature 2001, 411, 62–66. [Google Scholar] [CrossRef]
  7. Guo, Z.T.; Ruddiman, W.F.; Hao, Q.Z.; Wu, H.B.; Qiao, Y.S.; Zhu, R.X.; Peng, S.Z.; Wei, J.J.; Yuan, B.Y.; Liu, T.S. Onset of asian desertification by 22 Myr ago inferred from loess deposits in China. Nature 2002, 416, 159–163. [Google Scholar] [CrossRef] [PubMed]
  8. Han, J.M.; Lu, H.Y.; Wu, N.Q.; Guo, Z.T. The magnetic susceptibility of modern soils in China and its use for paleoclimate reconstruction. Stud. Geophys. Et Geod. 1996, 40, 262–275. [Google Scholar]
  9. Lv, H.Y.; Han, J.M.; Wu, N.Q.; Guo, Z.T. The magnetic susceptibility analysis of modern soil in China and its paleoclimatic significance. Sci. China (Ser. B) 1994, 24, 1290–1297. [Google Scholar]
  10. Song, Y.; Hao, Q.Z.; Ge, J.Y.; Zhao, D.A.; Zhang, Y.; Li, Q.; Zuo, X.X.; Lv, Y.W.; Wang, P. Quantitative relationships between modern soil magnetic susceptibility and climatic variables of the Chinese Loess Plateau. Quat. Sci. 2012, 32, 679–689. [Google Scholar] [CrossRef]
  11. Sun, X.J.; Song, C.Q.; Wang, F.Y.; Sun, M.R. Vegetation history of the Loess Plateau of China during the last 100,000 years based on pollen data. Quat. Int. 1997, 37, 25–36. [Google Scholar] [CrossRef]
  12. Lv, H.Y.; Wu, N.Q.; Liu, K.B.; Jiang, H.; Liu, T.S. Phytoliths as quantitative indicators for the reconstruction of past environmental conditions in China Ⅱ: Palaeoenvironmental reconstruction in the Loess Plateau. Quat. Sci. Rev. 2007, 26, 759–772. [Google Scholar] [CrossRef]
  13. Lv, H.Y.; Wu, N.Q.; Yang, X.D.; Jiang, H.; Liu, K.B.; Liu, T.S. Phytoliths as quantitative indicators for the reconstruction of past environmental conditions in China Ⅰ: Phytolith-based transfer functions. Quat. Sci. Rev. 2006, 25, 945–959. [Google Scholar]
  14. Zhang, Z.H.; Wei, M.J. Quantitative relationship between total iron oxide in loess and climate indicators. Chin. Sci. Bull. 1995, 40, 1219–1221. [Google Scholar] [CrossRef]
  15. Sun, J.M.; Diao, G.Y.; Wen, Q.Z.; Zhou, H.Y. A preliminary study on quantitative estimate of palaeoclimate by using geochemical transfer function in the Loess Plateau. Geochimica 1999, 28, 265–272. [Google Scholar] [CrossRef]
  16. Peterse, F.; Prins, M.A.; Beets, C.J.; Troeistra, S.R.; Zheng, H.B.; Gu, Z.Y.; Schouten, S.; Damsté, J.S.S. Decoupled warming and monsoon precipitation in East Asia over the last deglaciation. Earth Planet. Sci. Lett. 2011, 301, 256–264. [Google Scholar] [CrossRef]
  17. Gao, L.; Nie, J.S.; Clemens, S.; Liu, W.G.; Sun, J.M.; Zech, R.; Huang, Y.S. The importance of solar insolation on the temperature variations for the past 110 kyr on the Chinese Loess Plateau. Palaeogeogr. Palaeoclimatol. Palaeoecol. 2012, 317–318, 128–133. [Google Scholar] [CrossRef]
  18. Qin, F.; Zhao, Y. Methods of quantitative climate reconstruction based on palynological data and their applications in China. Quat. Sci. 2013, 33, 1054–1068. [Google Scholar] [CrossRef]
  19. Song, Y.G.; Yu, S.Y.; Zhu, C. Simulations of paleoclimate in the east China monsoon area since the last glaciation. Resour. Environ. Yangtze Basin 1998, 7, 260–265. [Google Scholar]
  20. Ren, L.Y.; Fu, J.H.; Lin, G.F.; Zhang, D.X. The application of sporo-pollen fossil information function for paleoenvironment analysis. J. Northwest Univ. (Nat. Sci. Ed.) 2001, 31, 506–508. [Google Scholar] [CrossRef]
  21. Yu, G.; Xiankun, K.E. Temperature sequence reconstruction by pollen data since the past 1ka in Canada. Sci. Bull. 2002, 47, 1018–1021. [Google Scholar] [CrossRef]
  22. Deng, Y.; Zheng, Z.; Cour, P.; Huang, C.X.; Duzer, D.; Calleja, M.; Roben, G.; Berne, S.; Vagnier, P. Relation between pollen ratios and climate in East China and an attempt of paleoclimate reconstruction. Acta Palaeontol. Sin. 2002, 41, 508–516. [Google Scholar] [CrossRef]
  23. Hughes, J.F.; Mathewes, R.W.; Clague, J.J. Use of pollen and vascular plants to estimate coseismic subsudence at a tidal marsh near Tofino, British Columbia. Palaeogeogr. Palaeoclimatol. Palaeoecol. 2002, 185, 145–161. [Google Scholar] [CrossRef]
  24. Tang, L.Y.; Shen, C.M.; Zhao, X.T.; Xiao, J.Y.; Yu, G.; Han, H.Y. Vegetation and climate since 10000aBP in the Qingfeng section, Jianhu, Jiangsu. Sci. China (Ser. B) 1993, 23, 637–643. [Google Scholar]
  25. Lu, J.J. Quantitative research of Late Quaternary paleoclimate factors in core No.1 in XiaPu, Fujian. J. Oceanogr. Taiwan Strait 1995, 14, 32–38. [Google Scholar]
  26. Liu, H.P.; Wang, K.F. A study on the relations between sporo-pollen assemblages and climate in new stone age of Changjiang delta by correspondence analysis. Sci. Geogr. Sin. 1998, 18, 368–373. [Google Scholar]
  27. Sun, X.J.; Wang, F.Y.; Song, C.Q. Pollen-climate response surface analysis of some families and genera in northern China. Sci. China (Ser. D) 1996, 26, 431–436. [Google Scholar]
  28. Markgraf, V.; Webb, R.S.; Anderson, K.H.; Anderson, L. Modern pollen/climate calibration for southern South America. Palaeogeogr. Palaeoclimatol. Palaeoecol. 2002, 181, 375–397. [Google Scholar] [CrossRef]
  29. Mosbrugger, V.; Utescher, T. The coexistence approach: A method for quantitative reconstruction of Tertiary terrestrial paleoclimate data using plant fossils. Palaeogeogr. Palaeoclimatol. Palaeoecol. 1997, 134, 61–86. [Google Scholar] [CrossRef]
  30. Hoorn, C.; Straathof, J.; Abels, H.A.; Xu, Y.D.; Utescher, T.; Dupont-Nivet, G. A late Eocene palynological record of climate change and Tibetan Plateau uplift (Xining Basin, China). Palaeogeogr. Palaeoclimatol. Palaeoecol. 2012, 344–345, 16–38. [Google Scholar] [CrossRef]
  31. Quan, C.; Liu, Y.S.; Utescher, T. Paleogene temperature gradient, seasonal variation and climate evolution of northeast China. Palaeogeogr. Palaeoclimatol. Palaeoecol. 2012, 313–314, 150–161. [Google Scholar] [CrossRef]
  32. Kay, P.A. Multivariate statistical estimates of Holocene vegetation and climate change, forest-tundra transition zone, NWT, Canada. Quat. Res. 1979, 11, 125–140. [Google Scholar] [CrossRef]
  33. Andrews, J.T.; Mode, W.N.; Davis, P.T. Holocene climate based on pollen transfer function, eastern Canadian Arctic. Arct. Alp. Res. 1980, 12, 41–64. [Google Scholar] [CrossRef]
  34. Adam, D.P.; West, G.J. Temperature and precipitation estimates through the last glacial cycle from Clear Lake, California, pollen data. Science 1983, 219, 168–170. [Google Scholar] [CrossRef] [PubMed]
  35. Seppä, H.; Birks, H.J.B. July mean temperature and annual precipitation trends during the Holocene in the Fennoscandian tree-line area: Pollen-based climate reconstructions. Holocene 2001, 11, 527–539. [Google Scholar] [CrossRef]
  36. Seppä, H.; Birks, H.J.B. Holocene climate reconstructions the Fennoscandian tree-line area based on pollen data from Toskljavri. Quat. Res. 2002, 57, 191–199. [Google Scholar] [CrossRef]
  37. Tong, G.B.; Shi, Y.; Wu, R.J.; Yang, X.D.; Qu, W.C. Vegetation and climatic quantitative reconstruction of Longgan Lake since the past 3000 years. Mar. Geol. Quat. Geol. 1997, 17, 53–61. [Google Scholar] [CrossRef]
  38. Tong, G.B.; Wu, X.H.; Tong, L.; Xiao, H.G. Spore-pollen records and tentative paleoclimate reconstruction in Taibai Mountain in the last 1000 years. J. Geomech. 1998, 4, 58–63. [Google Scholar]
  39. Tong, G.B.; Liu, Z.M.; Wang, S.M.; Yang, X.D.; Wang, S.B. Reconstruction of climate sequence of the past 1 Ma in the Heqing Basin, Yunnan province. Quat. Sci. 2002, 22, 332–339. [Google Scholar] [CrossRef]
  40. Song, C.Q.; Lv, H.Y.; Sun, X.J. Establishment and application of transfer function of pollen-climatic factors in northern China. Chin. Sci. Bull. 1997, 42, 2182–2186. [Google Scholar]
  41. Wang, F.Y.; Song, C.Q.; Cheng, Q.G.; Sun, X.J. Palaeoclimate reconstruction by adopting the pollen-climate response surface model to analysis the Chasuqi deposition section. Acta Bot. Sin. 1998, 40, 1067–1074. [Google Scholar]
  42. Xu, Q.H.; Xiao, J.L.; Nakamura, T.; Yang, X.L.; Yang, Z.J.; Liang, W.D.; Iuchi, B.; Yang, S.Y. Quantitative reconstructed climatic changes of Daihai Basin by pollen data. Mar. Geol. Quat. Geol. 2003, 23, 99–108. [Google Scholar]
  43. Xu, Q.H.; Yang, X.L.; Yang, Z.J.; Liang, W.D.; Sun, L.M. Reconstruction of climatic changes of Yansan Mountain area since 5000 aBP inferred from pollen data. Sci. Geogr. Sin. 2004, 24, 339–345. [Google Scholar]
  44. Cai, Y.L.; Chen, Z.Y.; Zhang, W.; Guo, Z.Y.; Chen, Y. Climate fluctuation of the western Shanghai district by correspondence analysis since 8.5kaB.P. J. Lake Sci. 2001, 13, 118–124. [Google Scholar] [CrossRef]
  45. Wu, J.H.; Zhang, S.; Jiang, Y.; Kang, M.Y.; Qiu, Y. Plant Geography; Higher Education Press: Beijing, China, 2004. [Google Scholar]
  46. Chen, Y.G. Geography Mathematical Methods: Fundamentals and Applications; Science Press: Beijing, China, 2011. [Google Scholar]
  47. Wang, S.G.; Chen, M.; Chen, L.P. Linear Statistical Models—Linear Regression and Analysis of Variance; Higher Education Press: Beijing, China, 2002. [Google Scholar]
  48. Yuan, Z.F.; Guo, M.C.; Song, S.D.; Xie, X.L.; Liu, J.J.; Du, J.L.; Dong, X.M. Multivariate Statistical Analysis, 3rd ed.; Science Press: Beijing, China, 2018. [Google Scholar]
  49. Zhang, J. Study on Modern Surface Pollen-Climatic Factors Transfer Function in Partial Region of the Northwest China. Master’s Thesis, Lanzhou University, Lanzhou, China, 2004. [Google Scholar]
  50. Li, J.Y.; Ilvonen, L.; Xu, Q.H.; Ni, J.; Jin, L.Y.; Holmstrom, L.; Zheng, Z.; Lv, H.Y.; Luo, Y.L.; Li, Y.C. East Asian summer monsoon precipitation variations in China over the last 9500 years: A comparison of pollen-based reconstructions and model simulations. Holocene 2015, 26, 592–602. [Google Scholar] [CrossRef]
  51. Tian, F.; Herzschuh, U.; Telford, R.J.; Mischke, S.; Meeren, T.V.; Krengel, M. A modern pollen-climate calibration set from central-western Mongolia and its application to a Late Glacial-Holocene record. J. Biogeogr. 2014, 41, 1909–1922. [Google Scholar] [CrossRef]
  52. Zheng, Z.; Zhang, X.; Man, M.L.; Wei, J.H.; Huang, K.Y. Review and data integration of pollen-based quantitative paleoclimate reconstruction studies in China and adjacent areas. Quat. Sci. 2016, 36, 503–519. [Google Scholar] [CrossRef]
  53. Webb, T.; Bryson, R.A. Late and postglacial climate change in the Northern Midwest, USA: Quantitative estimates derived from fossil pollen spectra by multivariate statistic analysis. Quat. Res. 1972, 2, 70–115. [Google Scholar] [CrossRef]
  54. Berger, A.L. Long term variations of caloric insolation resulting from the Earth’s orbital elements. Quat. Res. 1978, 9, 139–167. [Google Scholar] [CrossRef]
  55. Yu, K.F.; Lu, H.Y.; Frank, L.; Veit, N. A preliminary quantitative paleoclimate reconstruction of the dune fields of northern China during the Last Glacial Maximum and Holocene Optimum. Quat. Sci. 2013, 33, 293–302. [Google Scholar] [CrossRef]
  56. Kaufman, D.; Mckay, N.; Routson, C.; Erb, M.; Davis, B.; Heiri, O.; Jaccard, S.; Tierney, J.; Dätwyler, C.; Axford, Y.; et al. A global database of Holocene paleotemperature records. Sci. Data 2020, 7, 115. [Google Scholar] [CrossRef]
  57. Sun, Y.B.; Lu, H.X.; Zhang, Z.K. New progress in quantitative reconstruction of paleoclimate changes in the Chinese Loess Plateau. Acta Geol. Sin. 2024, 98, 1–19. [Google Scholar] [CrossRef]
  58. Gao, X.B.; Hao, Q.Z.; Wang, L.; Frank, O.; Jan, B.; Deng, C.L.; Song, Y.; Ge, J.Y.; Wu, H.B.; Xu, B.; et al. The different climatic response of pedogenic hematite and ferrimagnetic minerals: Evidence from particle-sized modern soils over the Chinese Loess Plateau. Quat. Sci. Rev. 2018, 179, 69–86. [Google Scholar] [CrossRef]
  59. Ning, Y.F.; Liu, W.G.; An, Z.S. A 130-ka reconstruction of precipitation on the Chinese Loess Plateau from organic carbon isotopes. Palaeogeogr. Palaeoclimatol. Palaeoecol. 2008, 270, 59–63. [Google Scholar] [CrossRef]
  60. Li, T.; Liu, F.; Abels, H.A.; You, C.F.; Zhang, Z.K.; Chen, J.; Li, J.F.; Li, L.F.; Li, L.; Liu, H.C.; et al. Continued obliquity pacing of East Asian summer precipitation after the mid-Pleistocene transition. Earth Planet. Sci. Lett. 2017, 457, 181–190. [Google Scholar] [CrossRef]
  61. Ma, L.; Sun, Y.B.; Jin, Z.D.; Bao, Z.A.; Zhang, P.; Meng, Z.K.; Yuan, H.L.; Long, X.P.; He, M.Y.; Huang, K.J. Tracing changes in monsoonal precipitation using Mg isotopes in Chinese loess deposits. Geochim. Cosmochim. Acta 2019, 259, 1–16. [Google Scholar] [CrossRef]
  62. Beck, J.W.; Zhou, W.J.; Li, C.; Wu, Z.K.; White, L.; Xian, F.; Kong, X.H.; An, Z.S. A 550000-year record of East Asian monsoon rainfall from 10Be in loess. Science 2018, 360, 877–881. [Google Scholar] [CrossRef] [PubMed]
  63. Hao, Q.Z.; Guo, Z.T. Quantitative study on weathering soil formation intensity of loess-paleosol sequence since 1.2 Ma and evolution of east Asian summer monsoon. Sci. China (Ser. D) 2001, 31, 520–528. [Google Scholar]
  64. Tang, L.Y.; An, C.B. Pollen records of vegetation changes and drought events in the Holocene on the Loess Plateau of central Gansu. Prog. Nat. Sci. 2007, 17, 1371–1382. [Google Scholar]
  65. Bao, R.; Sheng, X.F.; Lu, H.Y.; Li, C.L.; Luo, L.; Shen, H.; Wu, M.; Ji, J.F.; Chen, J. Stable carbon and oxygen isotopic composition of modern land snails along a precipitation gradient in the mid-latitude East Asian monsoon region of China. Palaeogeogr. Palaeoclimatol. Palaeoecol. 2019, 533, 109236. [Google Scholar] [CrossRef]
  66. Wang, H.Y.; An, Z.S.; Lu, H.X.; Zhao, Z.H.; Liu, W.G. Calibrating bacterial tetraether distributions towards in situ soil temperature and application to a loess-paleosol sequence. Quat. Sci. Rev. 2020, 231, 106172. [Google Scholar] [CrossRef]
  67. Li, J.H. Holocene Climate Change Documented by Loess Biomarkers in the Southern Loess Plateau. Master’s Thesis, Northwest University, Xi’an, China, 2022. [Google Scholar]
  68. Wang, F. Research of Structural Geology and Genesis of Pollen Assemblages and Paleoenvironment Since Holocene in the Weinan Region. Master’s Thesis, Shijiazhuang University of Economics, Shijiazhuang, China, 2015. [Google Scholar]
Figure 1. Geographical location of TJH profile.
Atmosphere 15 00476 g001
Figure 2. Lithological characteristics of TJH profile.
Atmosphere 15 00476 g002
Figure 3. Characteristics of spore–pollen assemblages of TJH profile.
Atmosphere 15 00476 g003
Figure 4. The quantitative reconstruction of temperature, precipitation, and climate division of the Tianjiahe (TJH) profile since the Holocene.
Atmosphere 15 00476 g004
Disclaimer/Publisher’s Note: The statements, opinions and data contained in all publications are solely those of the individual author(s) and contributor(s) and not of MDPI and/or the editor(s). MDPI and/or the editor(s) disclaim responsibility for any injury to people or property resulting from any ideas, methods, instructions or products referred to in the content.

