1. Introduction
The exploration of topics such as sustainable vegetation management and control encompasses a pivotal concern within ecological research, specifically those studies delving into the sustainable processes governing vegetation fluctuations [
1]. Given the significance of climate change in contemporary discourse, significant efforts are dedicated to investigating the impact of meteorological factors on vegetation dynamics [
2]. The study of changes in vegetation patterns serves as an indicator of the dynamism of ecosystems, thereby allowing for their management to uphold ecosystem stability [
3]. Numerous natural and anthropogenic factors, including climate change, lead to changes in various phenomena and effects occurring on the Earth’s surface, including vegetation growth [
4]. The pivotal role of vegetation in supplying organic matter, regulating the carbon cycle, and facilitating energy exchanges in response to climatic changes underscores the need to discern, predict, and proactively address such ecosystem changes [
5,
6,
7]. Climatic characteristics exert a profound influence on various environmental parameters. The interplay between vegetation and climate exhibits a robust correlation, with alterations in either entity resulting in repercussions for other ecological functions. Precipitation amount, timing, frequency, spatial distribution, and intensity, alongside temperature regimes, intermingle with topographical features to bestow distinct vegetation patterns in different geographical regions [
8].
The geographical distribution of different plant communities depends heavily on prevailing climatic conditions, to the extent that climate represents a preeminent determinant of vegetation characteristics on both local and global scales. Among climatic variables, temperature and precipitation have the most significant impact on the spatiotemporal patterns of vegetation [
9,
10]. Drought, stemming from climate shifts and perturbations in atmospheric circulation, emerges as a primary contributor to vegetation reduction. Given the pivotal role that rainfall plays in both the growth and degradation of vegetation, the reduction in vegetation is directly linked to insufficient rainfall. Moreover, when accompanied by elevated air temperatures, strong winds, and reduced relative humidity, this combination exacerbates drought conditions and, conversely, diminishes the intensity of green cover [
11]. Vegetation is known to be a widely used biome in ecological assessments due to such characteristics as immobility, or relatively rapid growth. The increase in vegetation cover in an area reduces atmospheric carbon dioxide [
12], mitigates lead concentrations, regulates soil moisture, safeguards water resources [
13,
14], curtails soil erosion, and diminishes flood risks, thereby contributing to ecological sustainability [
15,
16]. While in some regions droughts are the main problem, in others flooding takes place [
17]. Consequently, environmental instability is liable to manifest as desertification, soil erosion, climate perturbations, and other effects, heralding adverse economic, societal, and climatic consequences [
18].
A series of scientific studies have explored the dynamics of plant growth in various geographical regions, employing sophisticated methodologies and data sources. For instance, the changes in the vegetation cover in Fars province were investigated by utilizing the NDVI index and the Mann–Kendall test [
19]. These investigations revealed a consistent increase in the rate of plant growth in mountainous regions compared to plain areas. In another study, satellite data were utilized in conjunction with time series regression analysis to examine the relationship between drought and vegetation in Afghanistan [
20]. The outcomes of this study indicated that in 2009 and 2010, there was a significant increase in vegetation cover, amounting to 16.3%. This increase was attributed in part to lower temperatures and greater precipitation compared to preceding years. MODIS NDVI and ERA-5 temperature and precipitation datasets were used to scrutinize spatial and temporal transformations in NDVI [
21], and the responses of vegetation to climate alterations were analyzed using regression models and Pearson correlation coefficients. Furthermore, NDVI MODIS data were used and the stability and regression analysis methodologies were employed to explore spatiotemporal variations in vegetation cover within the Pearl River Delta from 2000 to 2015 [
22]. The findings highlighted an upward trend in vegetation cover over this period, revealing a discernible correlation between changes in city-adjacent vegetation and human activities.
The impact of climatic elements such as temperature, precipitation, and drought on shifts in both linear and non-linear trends of vegetation cover was also investigated [
23]. This study was conducted for the Khor-Sifiderak watershed within the Alborz province and employed satellite images spanning from 2000 to 2019. Results indicated a lack of a significant trend in regional precipitation over the two decades, while temperature exhibited a noteworthy declining trend. The influence of drought on vegetation was evident, with the most pronounced decline observed in 2008 due to severe drought conditions.
In an endeavor to comprehend the sustainability of vegetative fluctuations in the northern catchment of Afghanistan, MODIS data were harnessed in conjunction with rainfall records (PDIRNOW) [
18]. The analysis revealed that the mean vegetation coverage throughout the entire period was 45.21%. The lowest levels of vegetation coverage were observed during the 2001–2008 period and 2011, attributed to scarce rainfall. Conversely, in the years 2003, 2009, and 2010, increased precipitation alongside lower land surface temperature (LST) corresponded to the peak of vegetation coverage. Through the application of a structural equation model, the intricate relationship between driving factors and variations in the Enhanced Vegetation Index (EVI) in Anhui, China, from 2000 to 2020 was investigated [
24]. The authors’ holistic analysis unveiled that EVI transformations were predominantly steered by urbanization. Human activities significantly affected changes in central and southern Anhui, with subsequent pronounced feedback in EVI alterations due to annual rainfall fluctuations. Topographical factors exerted both direct and indirect impacts on changes in the northern and central regions compared to their southern counterpart. Conversely, alterations in annual temperature exerted minimal influence on the vegetation across the entire region.
The non-parametric methodology proposed by Mann–Kendall was utilized in conjunction with remote sensing and used to scrutinize the trend trajectory of vegetation alterations within northeastern Iran from 2000 to 2018 [
5]. The results underscored that 52% of the studied area exhibited a declining vegetation trend, while the remaining regions demonstrated an ascending trend. Remote sensing data were used to investigate changes in vegetation cover and weather patterns in the Kabul River Basin in Afghanistan during the period 2001–2019 [
25]. The results showed that precipitation and land surface temperature are influential factors in the vegetation cover of this region, with land surface temperature playing a more prominent role in winter. Weather patterns can serve as a warning system to prevent water or temperature stress in agricultural areas [
26].
The relationship between climatic parameters and vegetation cover changes in the watersheds of the Caspian Sea was investigated using satellite images from 2001 to 2019 [
27]. The results revealed that precipitation had little effect on vegetation cover during winter, but was the main controlling factor of vegetation cover in spring. In summer, the surface temperature was identified as the primary factor influencing vegetation cover.
The spatiotemporal characteristics of vegetation cover in the Middle East between 2001 and 2019 were analyzed using the NDVI [
28]. The results indicate an increase in vegetation cover in the Middle East, particularly in Egypt and Saudi Arabia, with government policies being the main reason behind this. Additionally, both vegetation cover and density have increased in Turkey, which can be attributed to the construction of dams such as Ataturk and Ilisu. The impact of vegetation cover, land surface temperature, and precipitation on changes in water level and area of seven inland lakes in the Middle East area from 2000 to 2019 were investigated using elevation data [
29]. The study focused on Urmia Lake in Iran, Mosul and Hamar 4 Lagoon in Iraq, and Bishahir and Archak Lakes in Turkey. The results revealed an increase in vegetation cover and land surface temperature, and a decrease in annual precipitation in the assessed area. Changes in temperature and vegetation cover were similar in all three countries, but changes in water levels and the lake areas were influenced by factors other than climate and varied significantly. Notably, Lake Urmia exhibited the most pronounced reduction in water levels.
In another recent study, the remote sensing data from the MODIS-GPM and GLADAS satellites were utilized to investigate the complex relationship between meteorological parameters, drought conditions, and vegetation diversity within the eastern basins of Afghanistan [
30]. Employing regression methods, it was found that certain years, namely 2000, 2001, and 2008, displayed diminished vegetation cover, while the years 2010, 2013, 2016, and 2020 exhibited heightened levels of vegetation cover, accompanied by an ascending trend in the whole period. Overall, changes in soil moisture, precipitation, surface temperature, and the presence of drought conditions collectively accounted for 45% of the annual variations in vegetation cover.
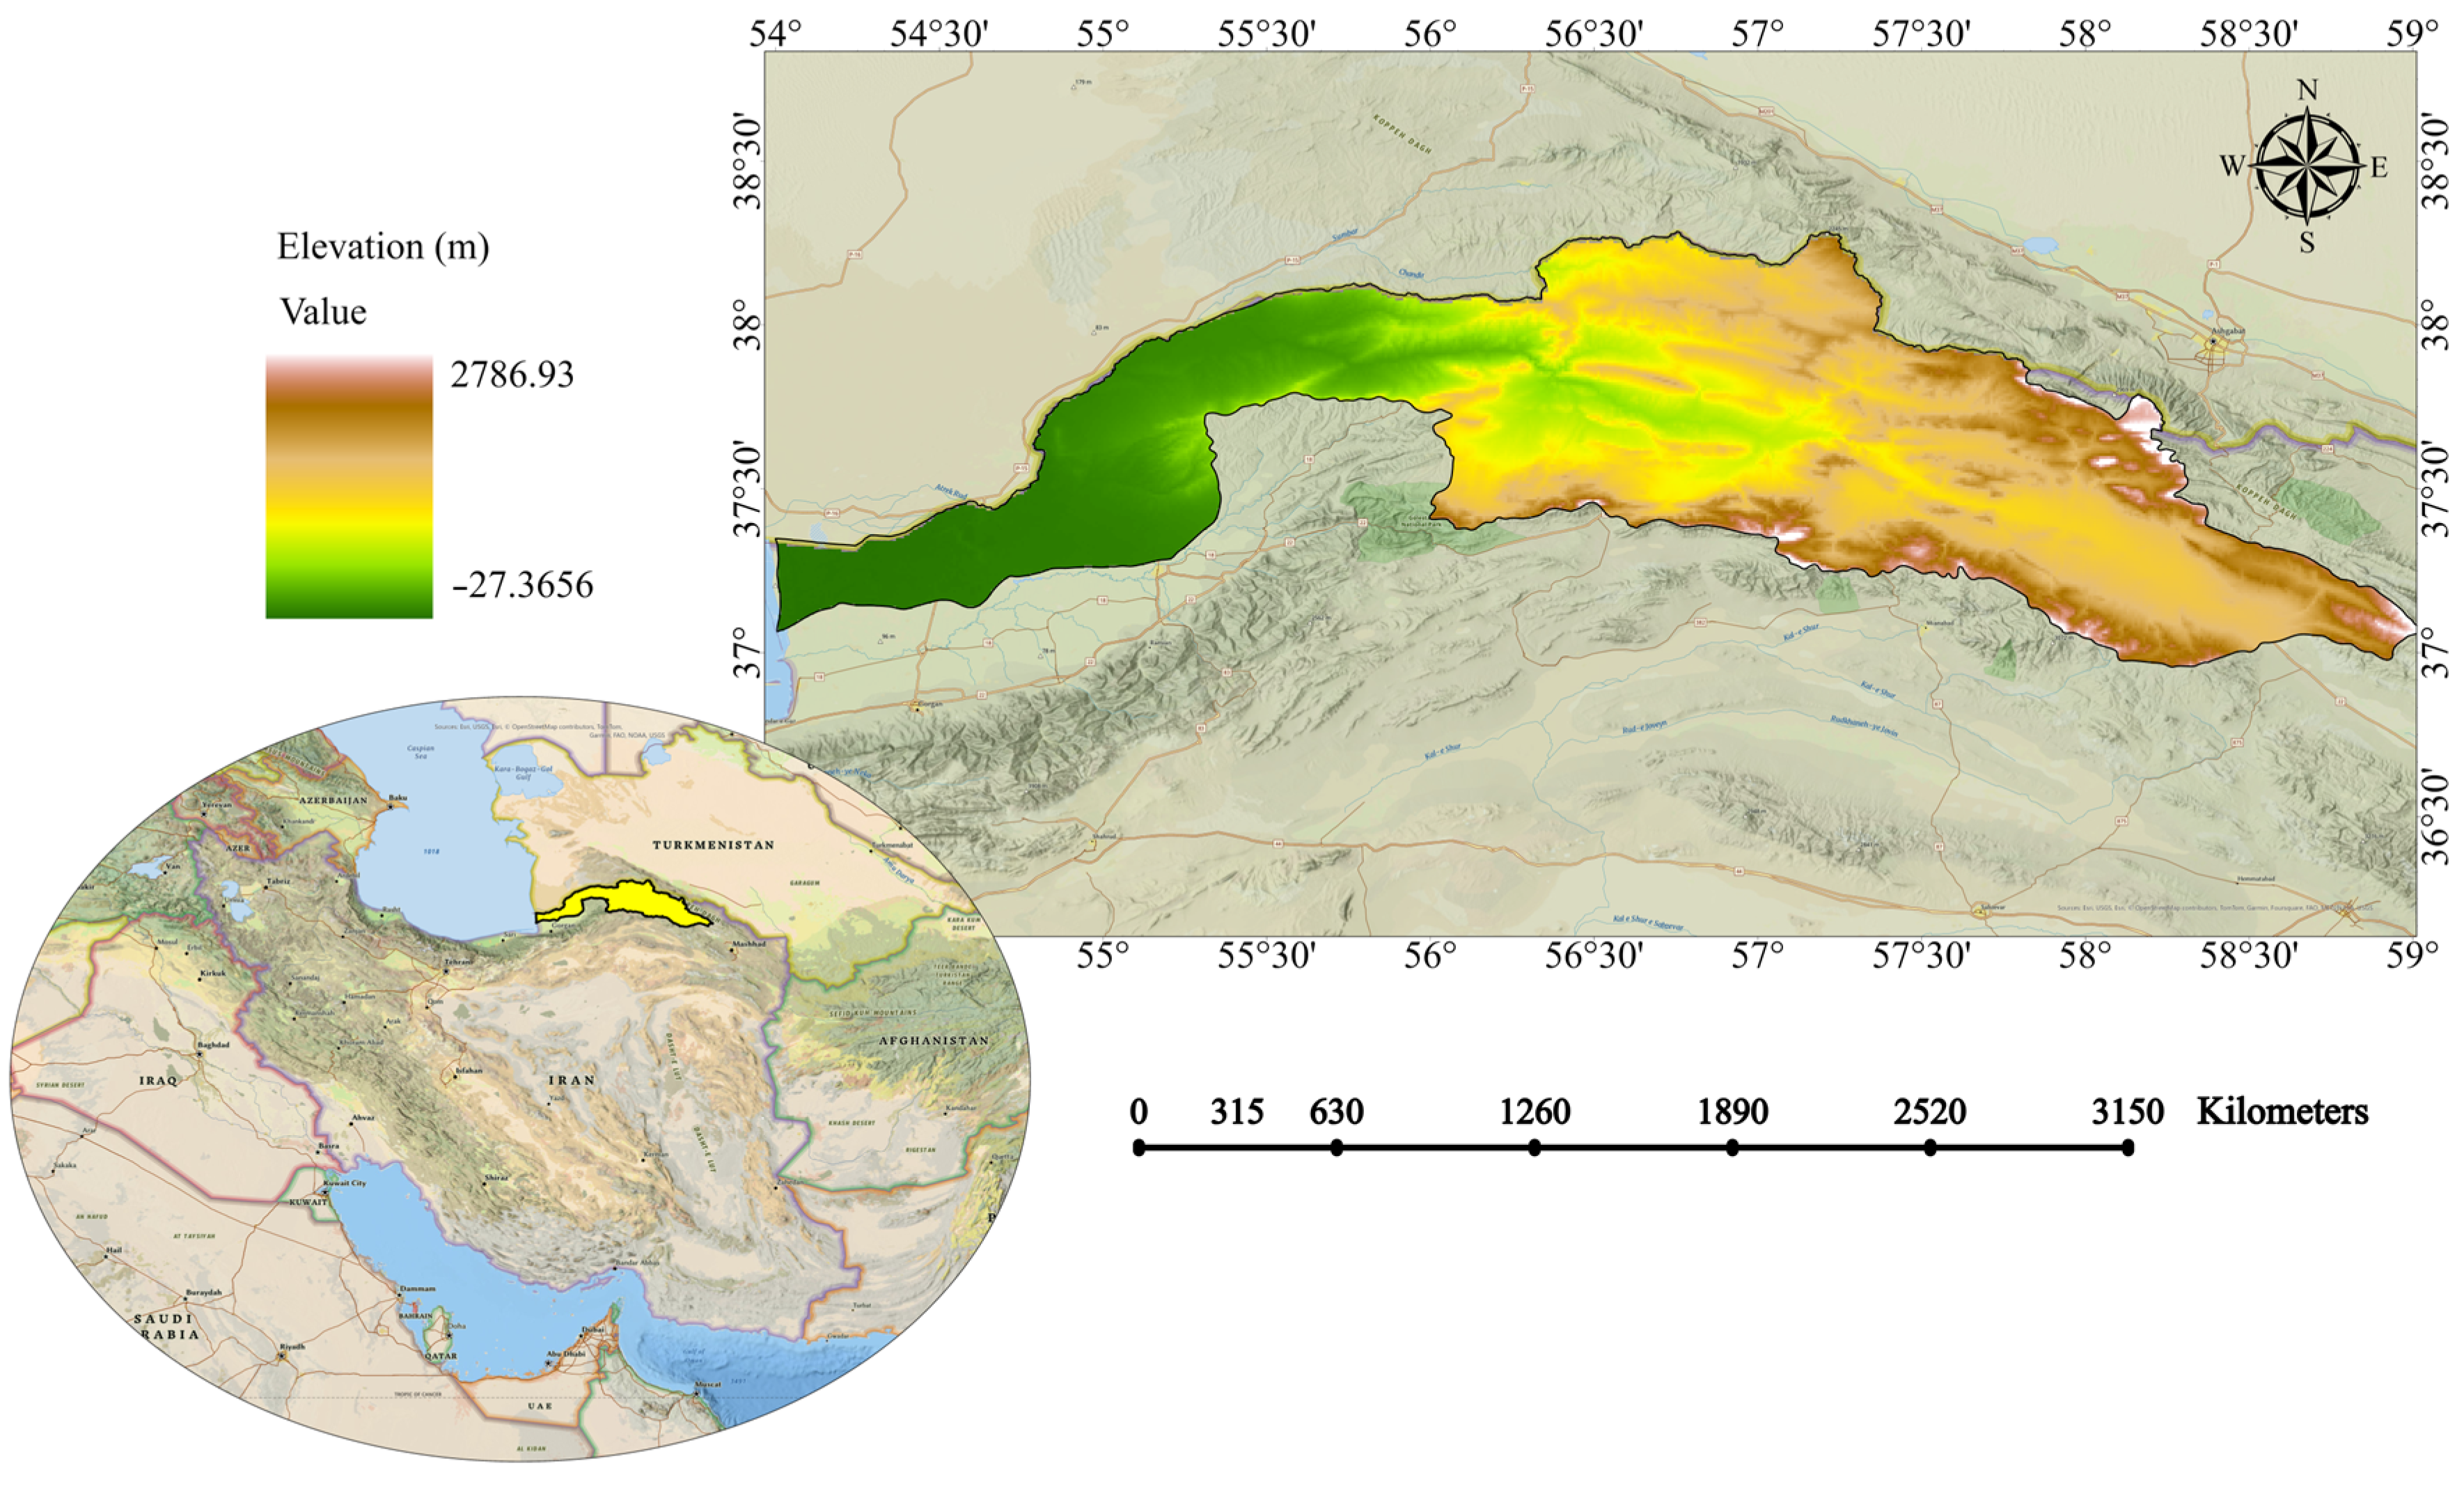
However, there is still a need to assess how meteorological conditions influence the vegetation in various areas of the world. The Atrak Basin faces challenges related to water scarcity due to increasing demand from various sectors such as agriculture, industry, and domestic use. Climate change exacerbates these issues by altering precipitation patterns and increasing evaporation rates. Research is needed to develop sustainable water management strategies [
26,
31], including efficient irrigation techniques, water recycling, and groundwater recharge methods. Intensive agricultural practices, deforestation, and overgrazing contribute to soil erosion and degradation in the Atrak Basin. This diminishes soil fertility, reduces agricultural productivity, and increases the risk of desertification. Scientists are exploring soil conservation measures, such as terracing, reforestation, and sustainable grazing practices, to mitigate these impacts. Therefore, the main aim of this research was to contribute to a comprehensive understanding of the interplay between rainfall patterns and the dynamics of vegetation within the Atrak basin area. Notably, the Atrak basin, the focal point of the present study, represents one of the longest rivers within Iran and forms a subunit of the broader Mazandaran Sea basin. This study analyzed the relationship between vegetation cover and drought conditions, quantified through the Vegetation Condition Index (VCI) and the Standardized Precipitation Index (SPI). It aimed to identify the impact of precipitation variability on vegetation cover and drought occurrence while examining changes in agricultural land coverage within the Atrak basin over the study period. The paper is organized as follows: after the introduction, the study area is described, followed by a presentation of the data sources and their features. The methods used are then described. Subsequently, the obtained results are presented and discussed, leading to the conclusion of the paper.
3. Results
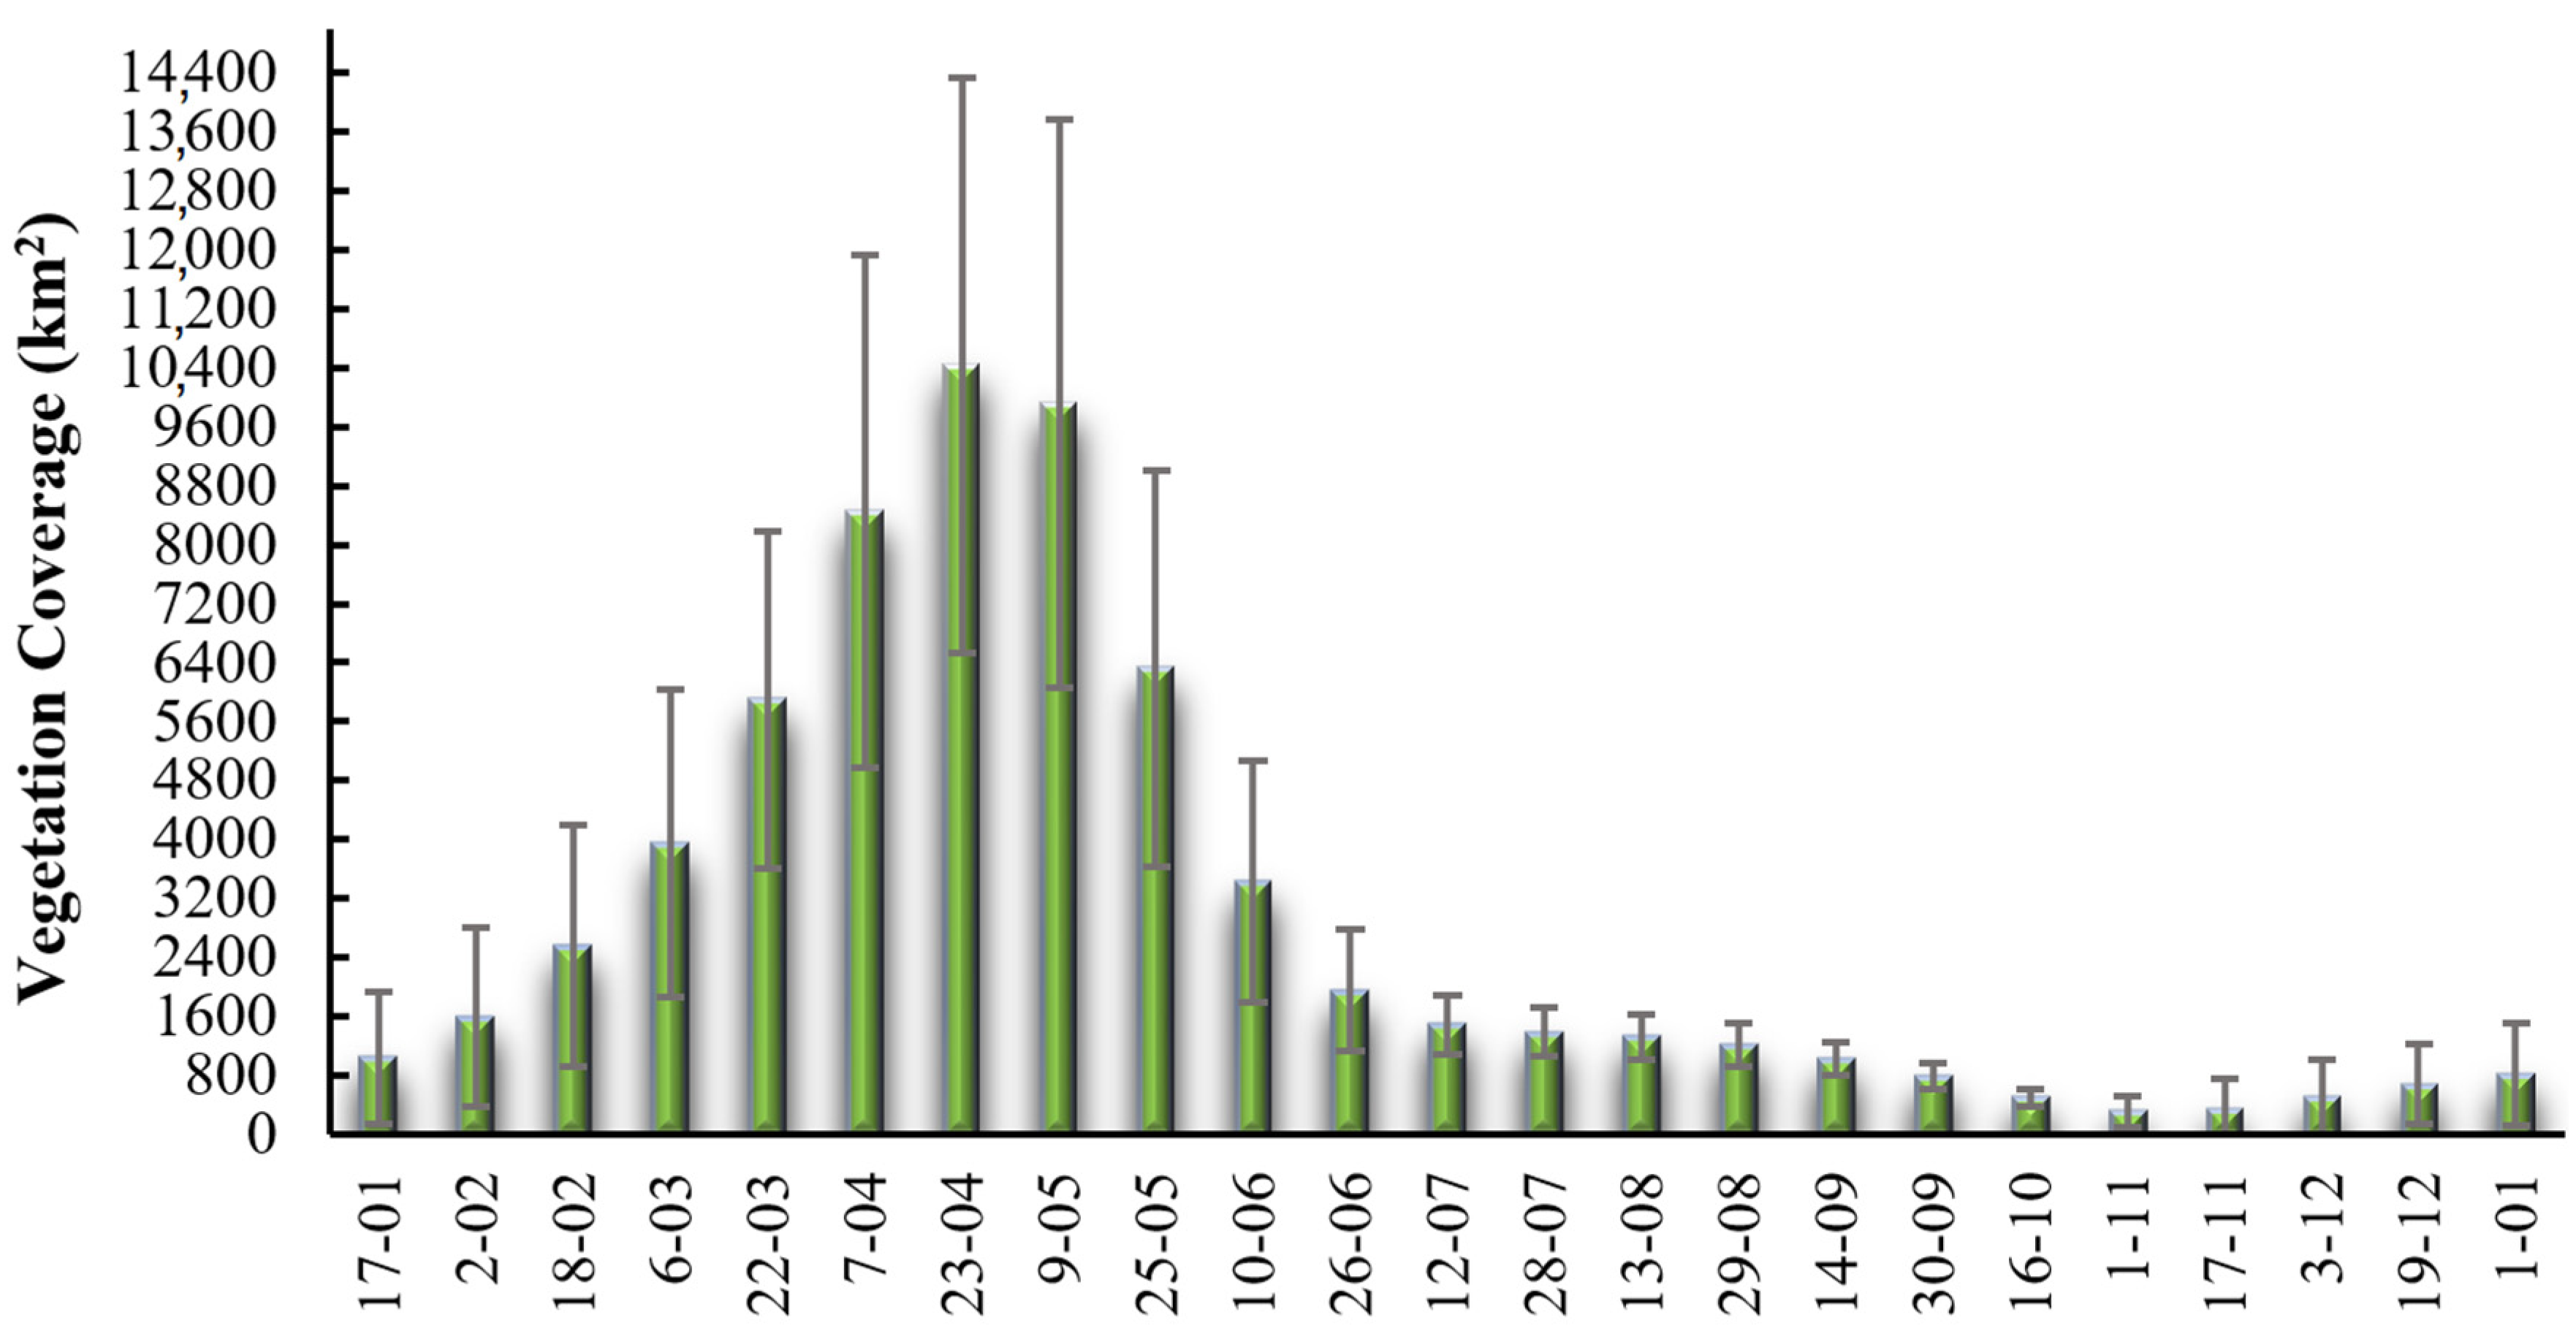
According to
Figure 3, which depicts the average vegetation cover spanning 19 years for each EVI date, it is evident that the more rapid phase of vegetation growth commences in January during the winter season and reaches its zenith in April, registering at 39.5% (equivalent to 10,434.11 km
2). Thus, the spring period from March to June exhibits the most extensive vegetation coverage. Starting from the initial days of May, the vegetation gradually diminishes, culminating in the lowest extent of vegetation around November at 1.16% (amounting to 307.3224 km
2), characterizing the late autumn period. Notably, a slight increase of 2.5% in vegetation occurred between the end of December and the beginning of January. Between June and September, corresponding to the summer season, the dehydration of plants contributes to a decrease in the vegetation area. Additionally, due to the positive correlation between the evaporation of water from leaf surfaces and the ground, the available water for plants in the soil increases, simultaneously reducing the plants’ daily water requirements Początek formularza [
27].
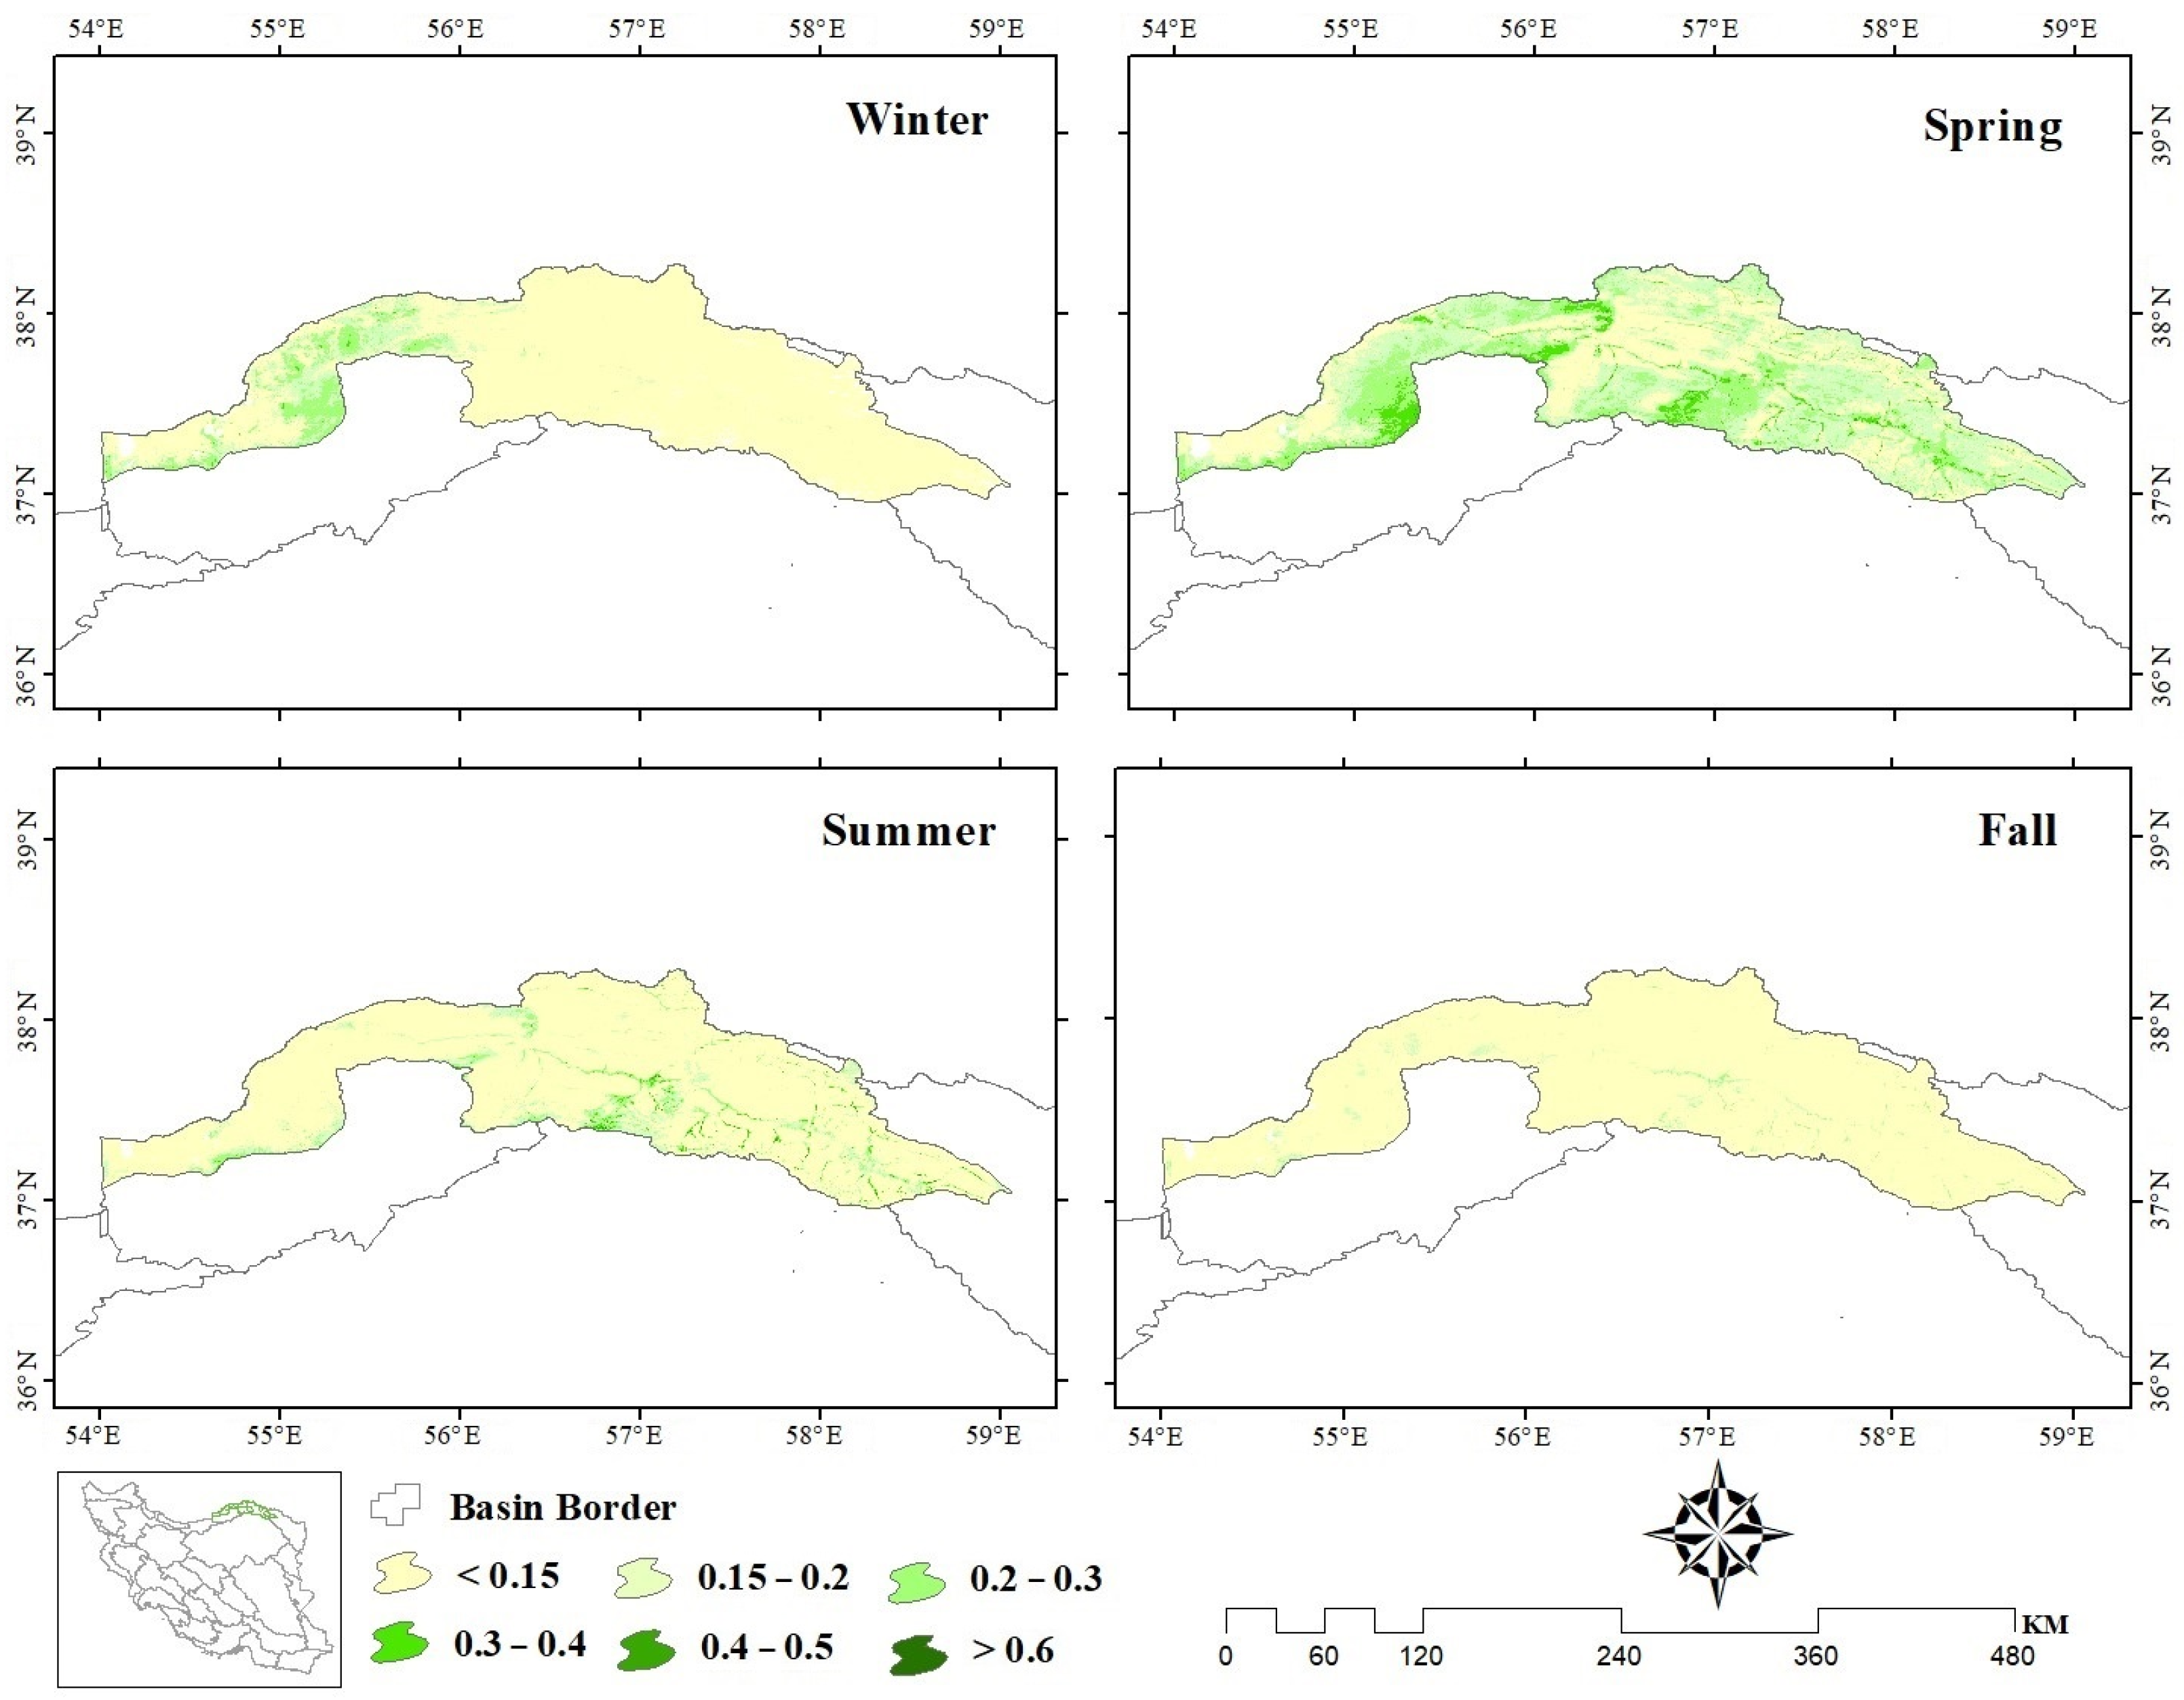
Based on
Figure 4, it is evident that during this specific season, the distribution of vegetation cover presents a notable contrast between the eastern half of the basin situated in North Khorasan province and the western half located in Golestan province. This discrepancy is attributed to the region’s temperate and mountainous climate. During the summer season, urban areas predominantly host green trees and parks. Furthermore, elevated regions experience lower temperatures, which subsequently decrease evaporation and transpiration rates in plants, effectively sustaining vegetation in the research area. Consequently, in this particular season, vegetation is more prevalent in the eastern half of the basin within North Khorasan province, characterized by a moderate mountainous climate, compared to the western half encompassing a portion of Golestan province.
At the end of September, coinciding with the onset of autumn, only urban locales retain their verdant state, as water evaporation from tree leaves becomes full. In the heart of the winter season, spanning 17 January to 18 February, substantial changes in vegetation become evident due to intermittent rains and slight temperature fluctuations. Notably, the distribution of vegetation in the western half of the basin within Golestan province, which receives the most winter rainfall, becomes conspicuously distinct.
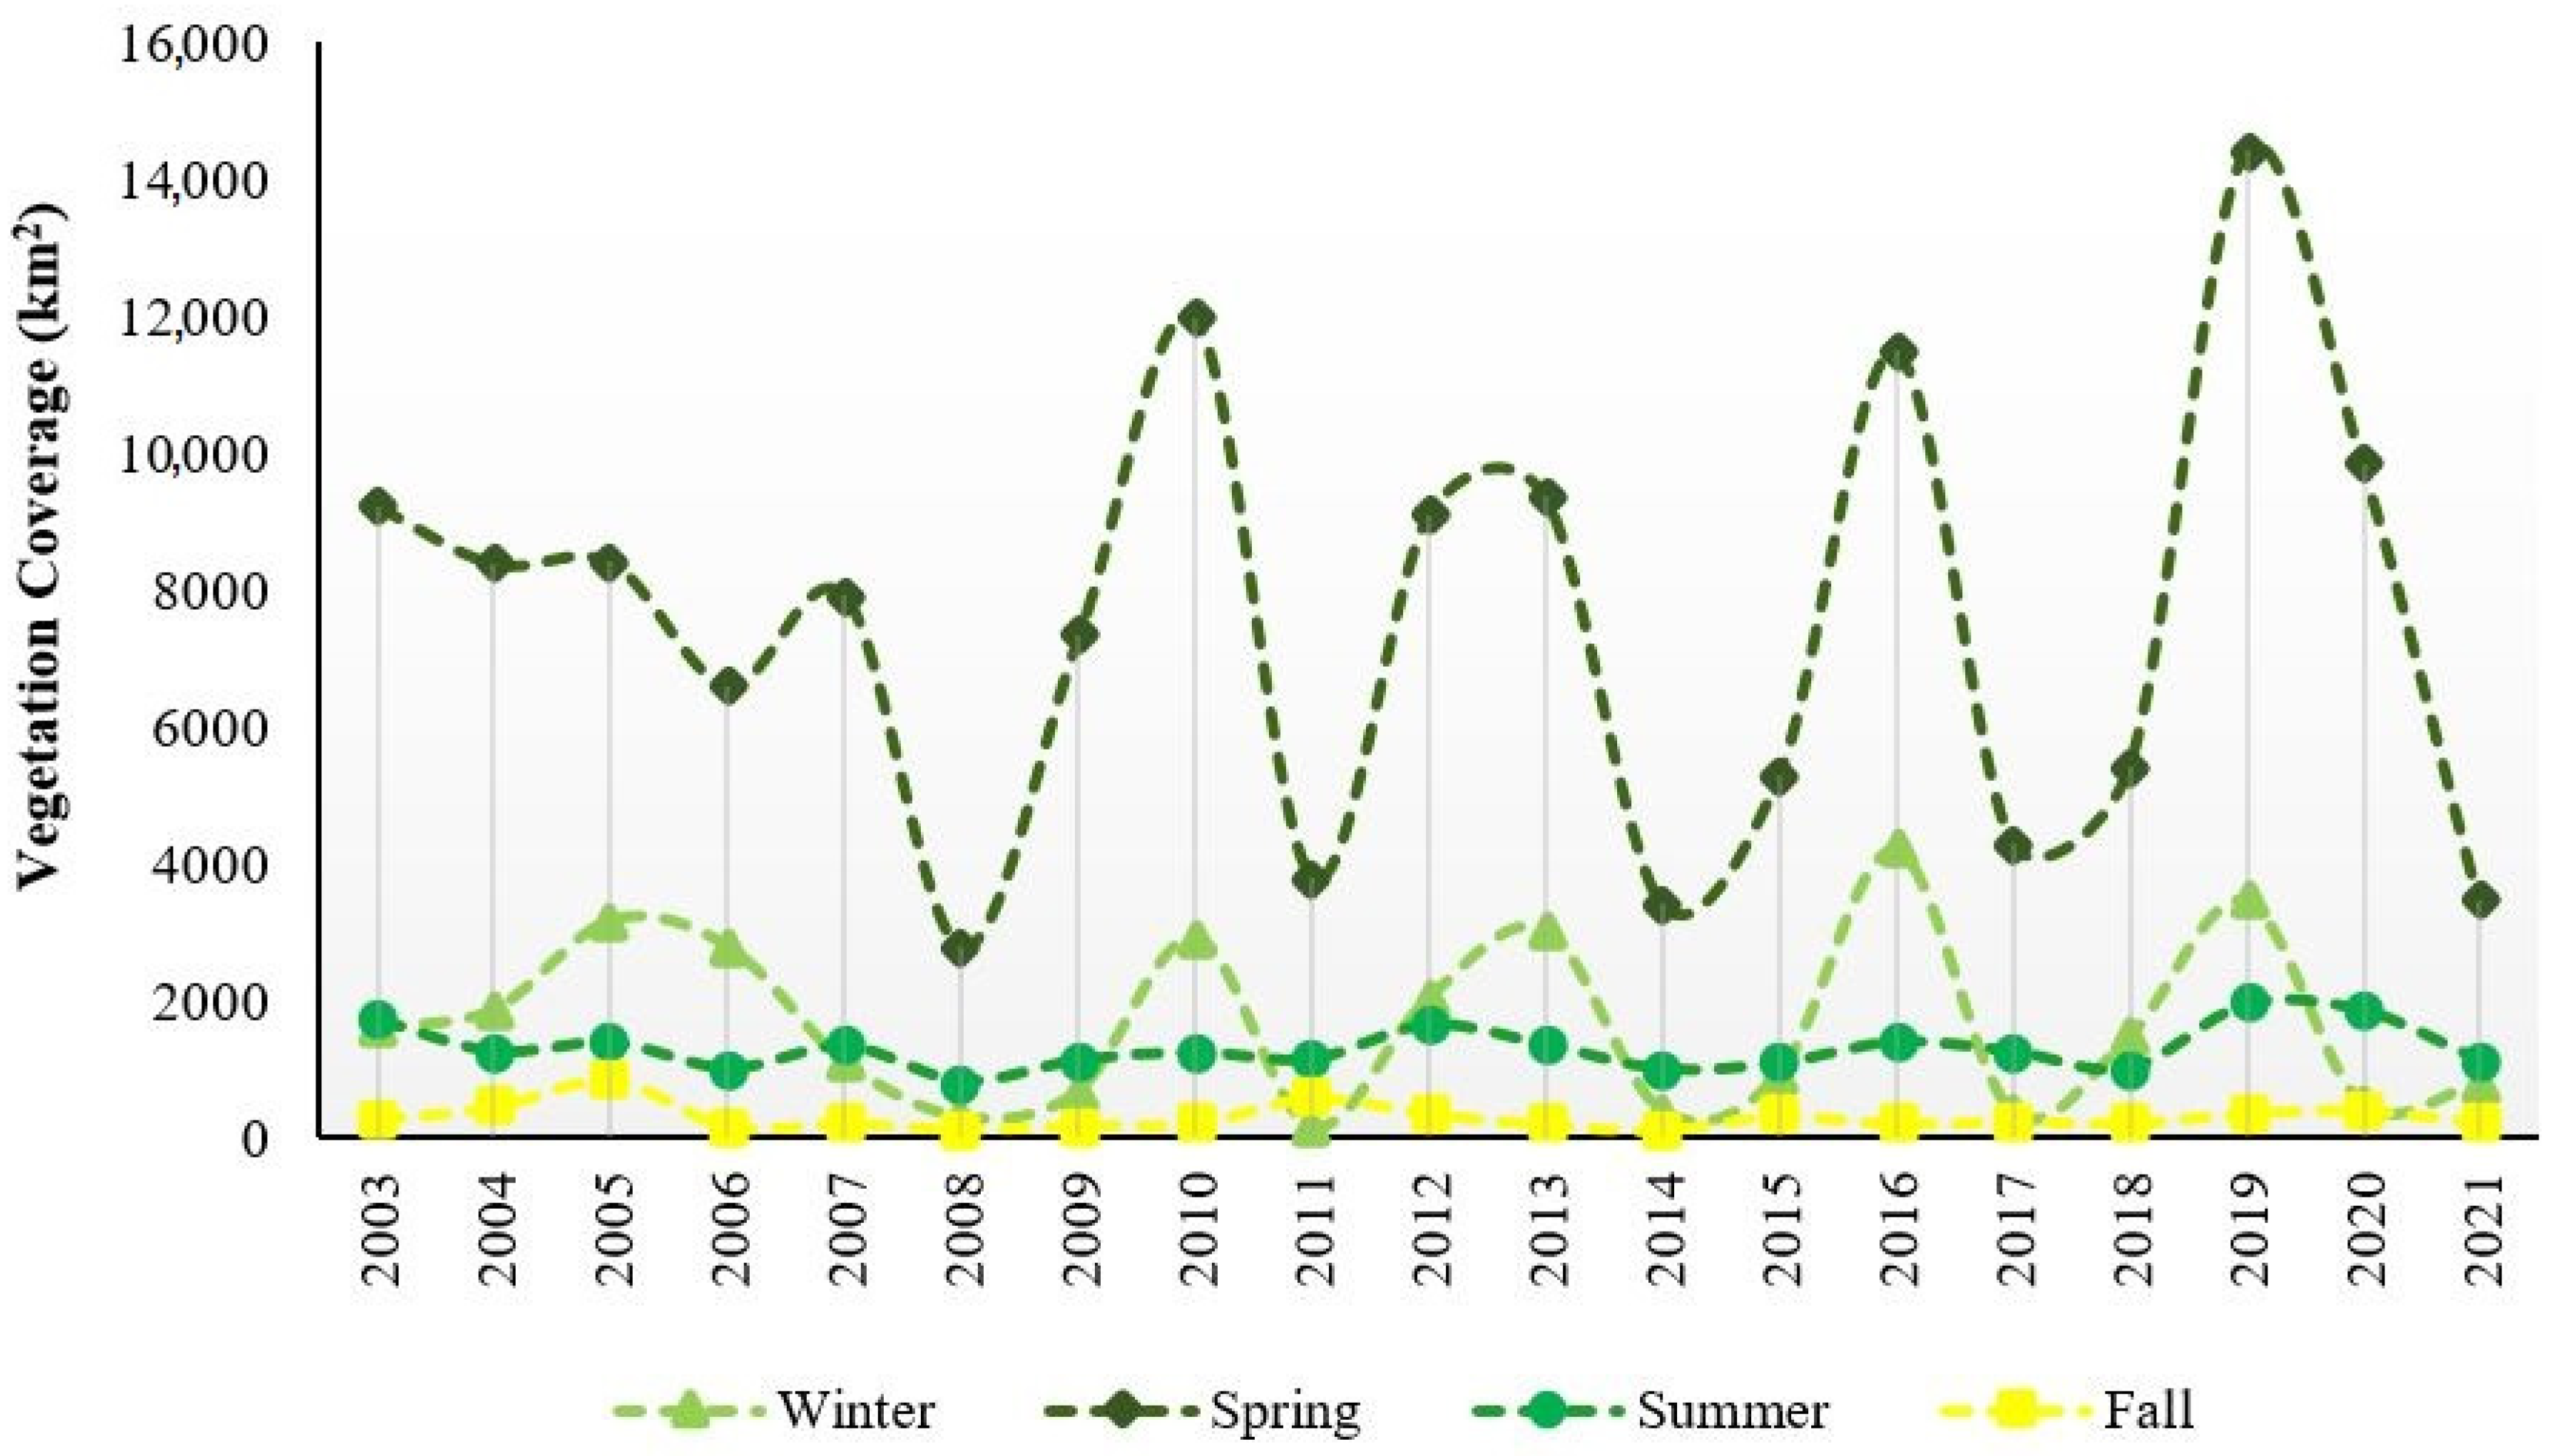
Based on
Figure 5, which depicts the seasonal shifts in vegetation cover throughout the analyzed time series, the spring season consistently exhibits the highest vegetation coverage. Specifically, in the years 2010, 2016, and 2019, the peak was observed at 45.28% (equivalent to 11,966.7 km
2), 43.45% (equivalent to 11,483.4 km
2), and 54.50% (equivalent to 14,404.18 km
2), respectively.
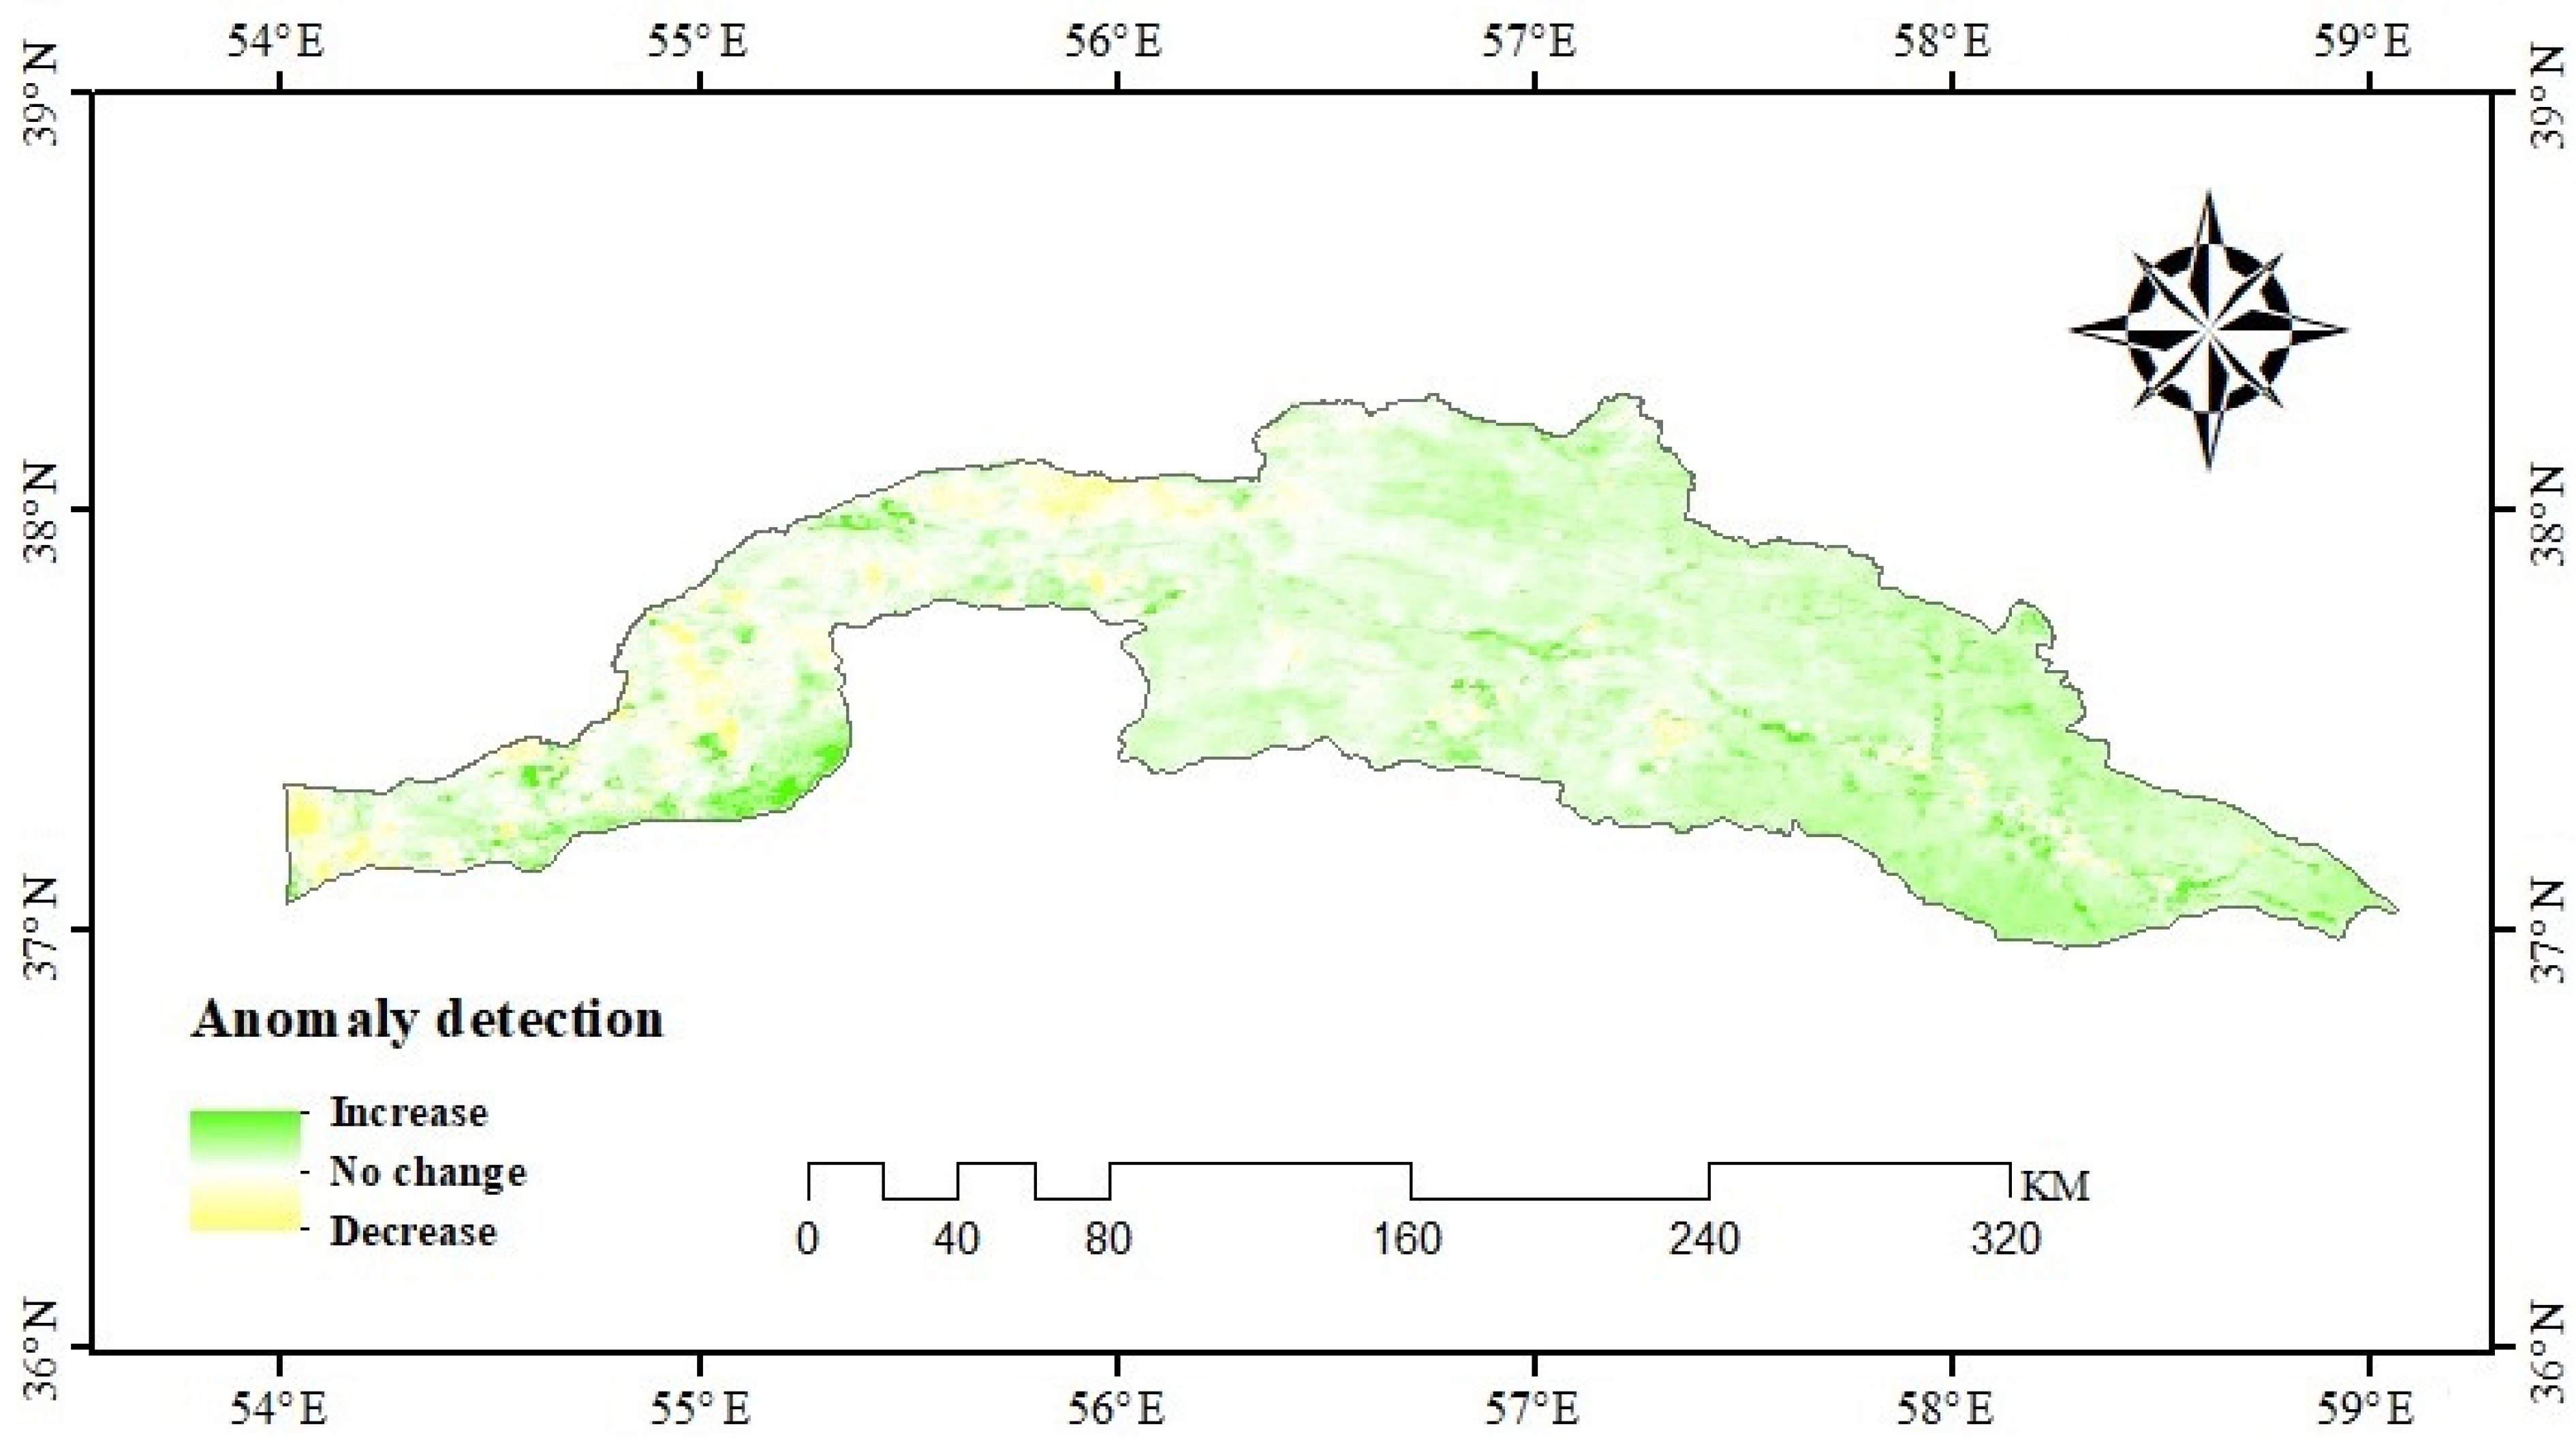
As shown in
Figure 6, detailing the trend of variations during the second decade (2011–2021) in comparison to the average of the first decade (2003–2010) within the studied time series, a discernible pattern emerges. The eastern sectors of the basin, located within North Khorasan province and a segment of Razavi Khorasan, contrast with the western areas comprising the northern portion of Golestan province. The former regions exhibit an increasing trend, while the central and western sections of the basin have witnessed varying degrees of decline, with certain parts displaying no significant change.
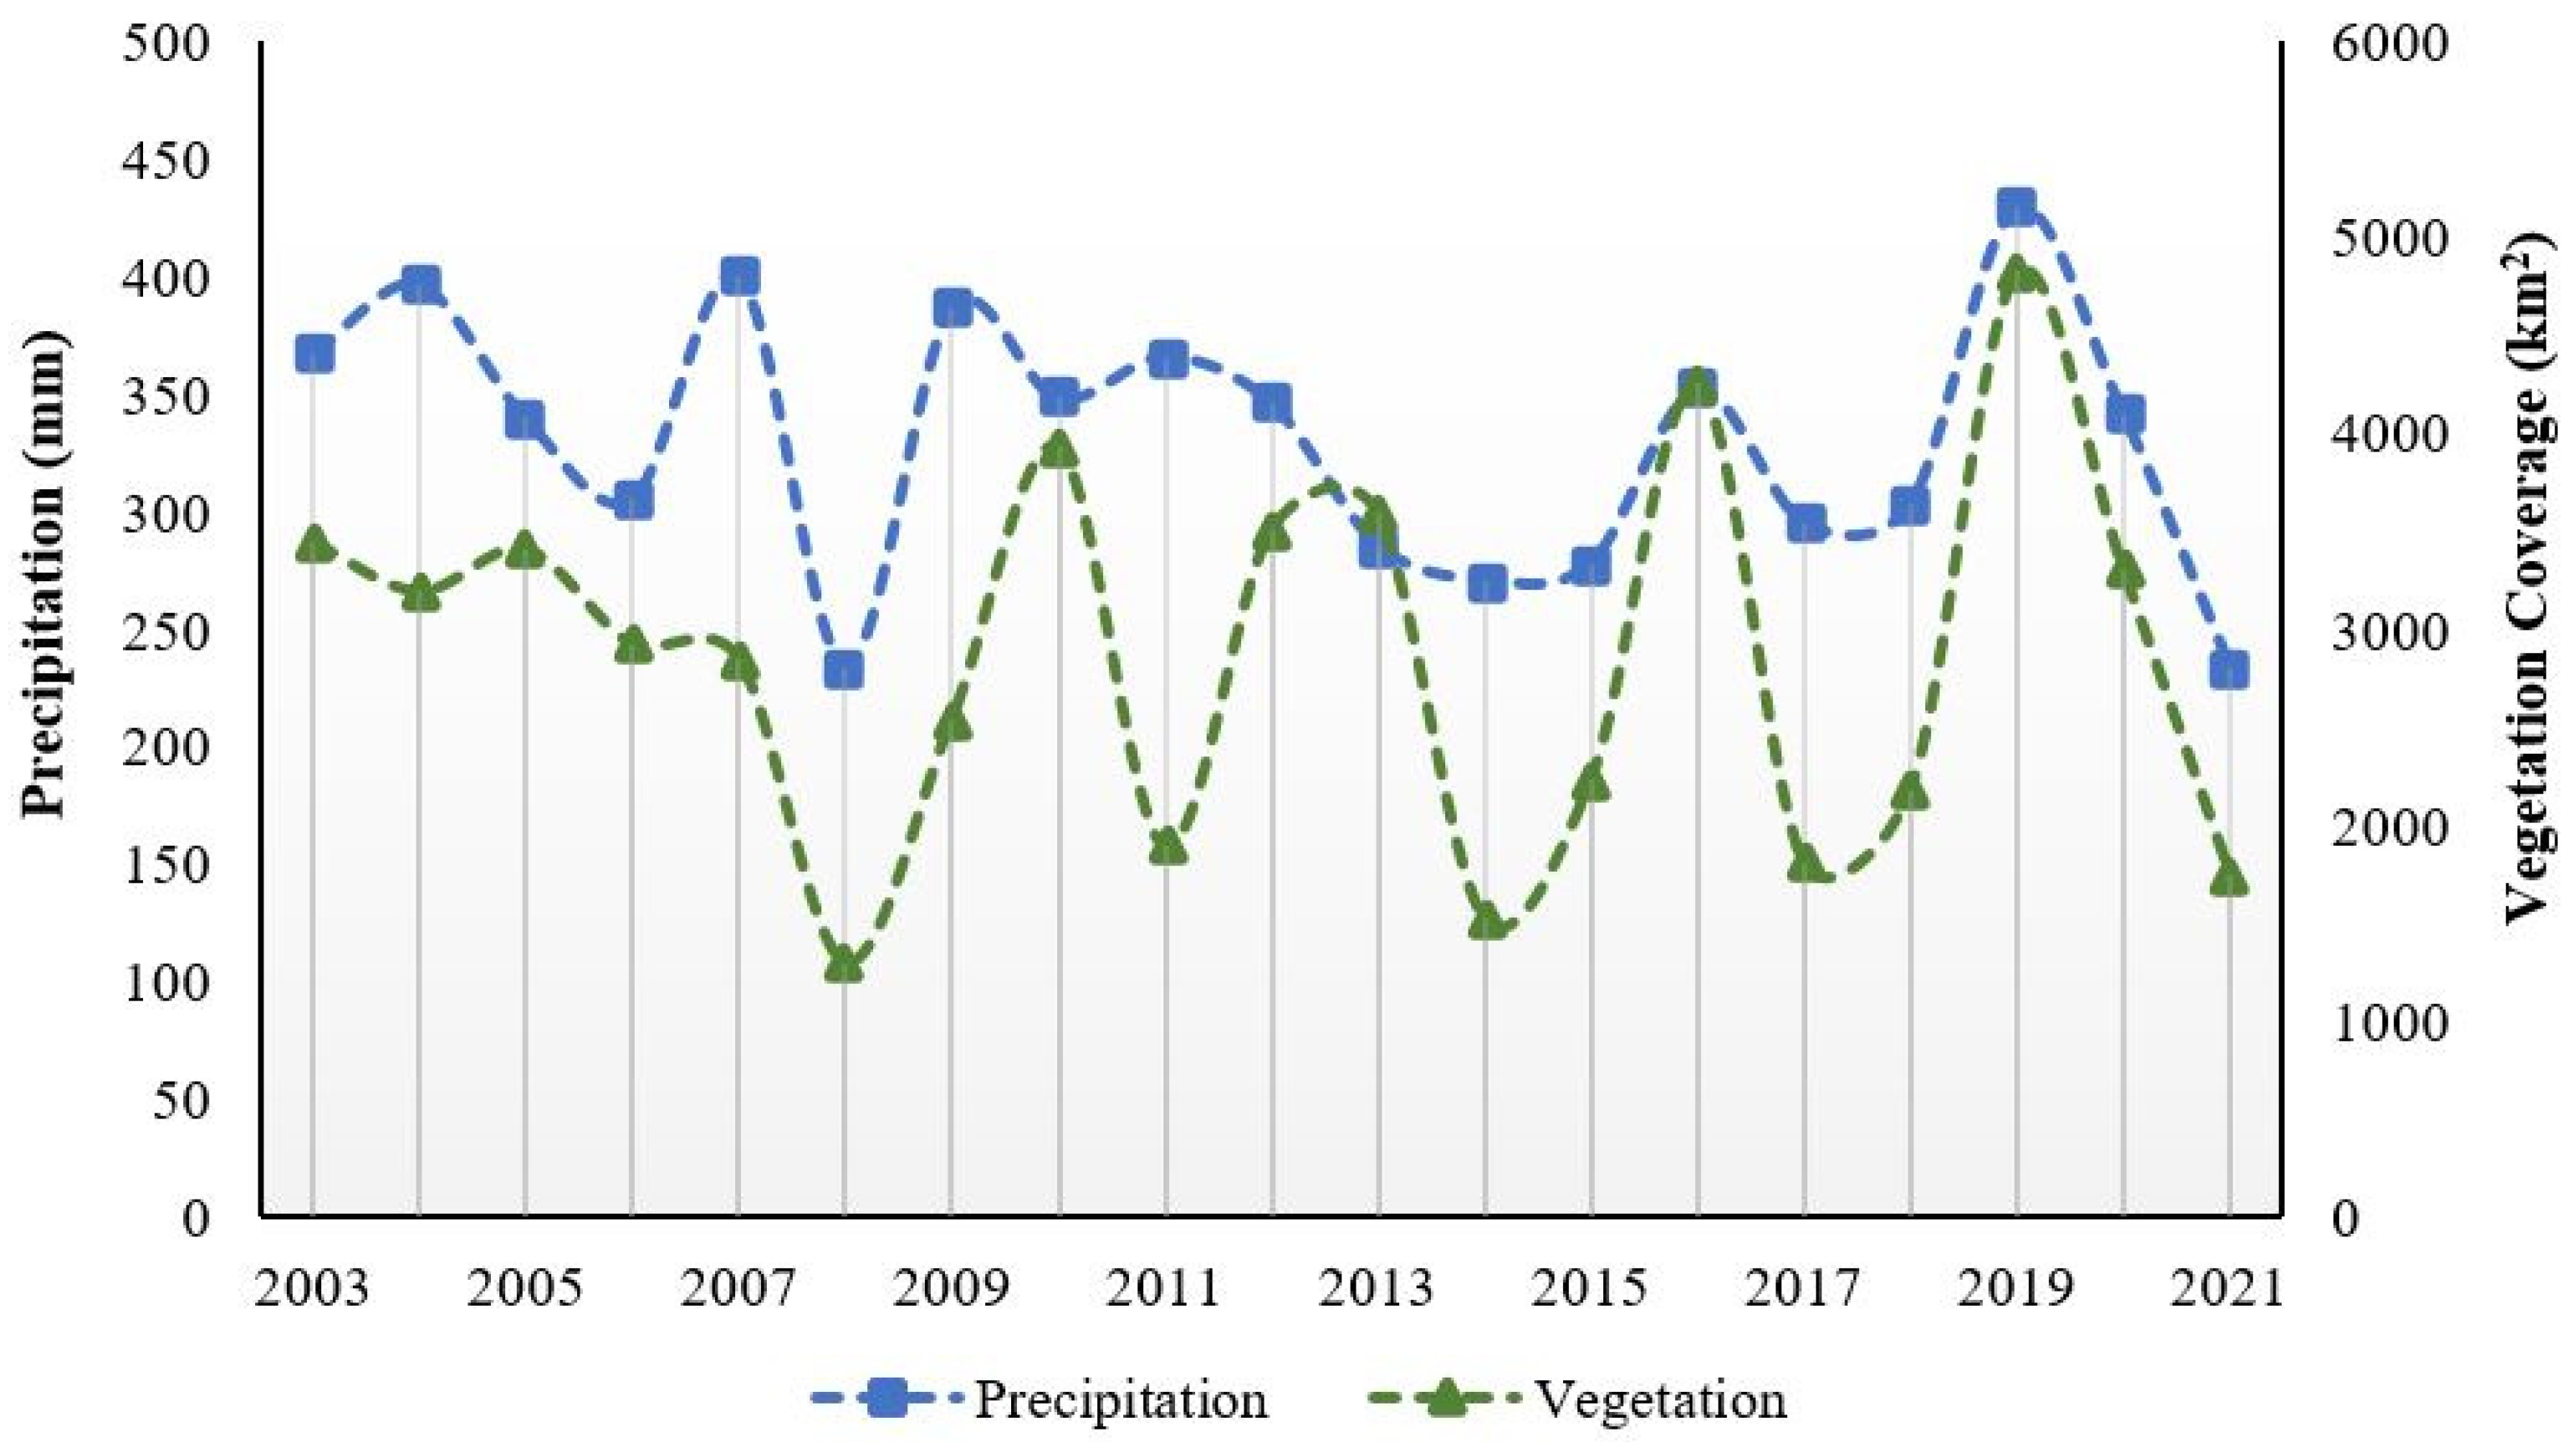
The findings reveal that over the examined statistical timeframe, the years 2008, 2014, 2017, and 2021 exhibited the lowest total vegetation coverage, accounting for 4.89%, 5.75%, 6.81%, and 6.61% respectively, of the entire Atrak basin area (as shown in
Table 3). Conversely, during the years of abnormally high precipitation sums, such as 2004 (396.7 mm), 2007 (400.4 mm), 2009 (386.8 mm), and 2019 (429.7 mm), the corresponding vegetation cover percentages were 12.8%, 10.78%, 9.6%, and 18.25%, respectively (
Figure 7).
Examining vegetation classes, the VC area classified as poor vegetation (EVI 0.2–0.3) was 998 km2 in 2008, reaching its peak of 3135 km2 in 2019. The moderate coverage class had the largest expanse in 2019, and it was 1090 km2, while the lowest occurred in 2008 with 215 km2. Across the categories of good, dense, and very dense cover, the most substantial areas observed in 2019 were 402, 147, and 50 km2, respectively. Conversely, the smallest extents were recorded in 2008, with 60, 16, and 4 km2, respectively. Overall, the 19-year average areas for poor, moderate, good, dense, and very dense cover were 1979, 587, 205, 70, and 24 km2, respectively, encompassing the entire basin area.
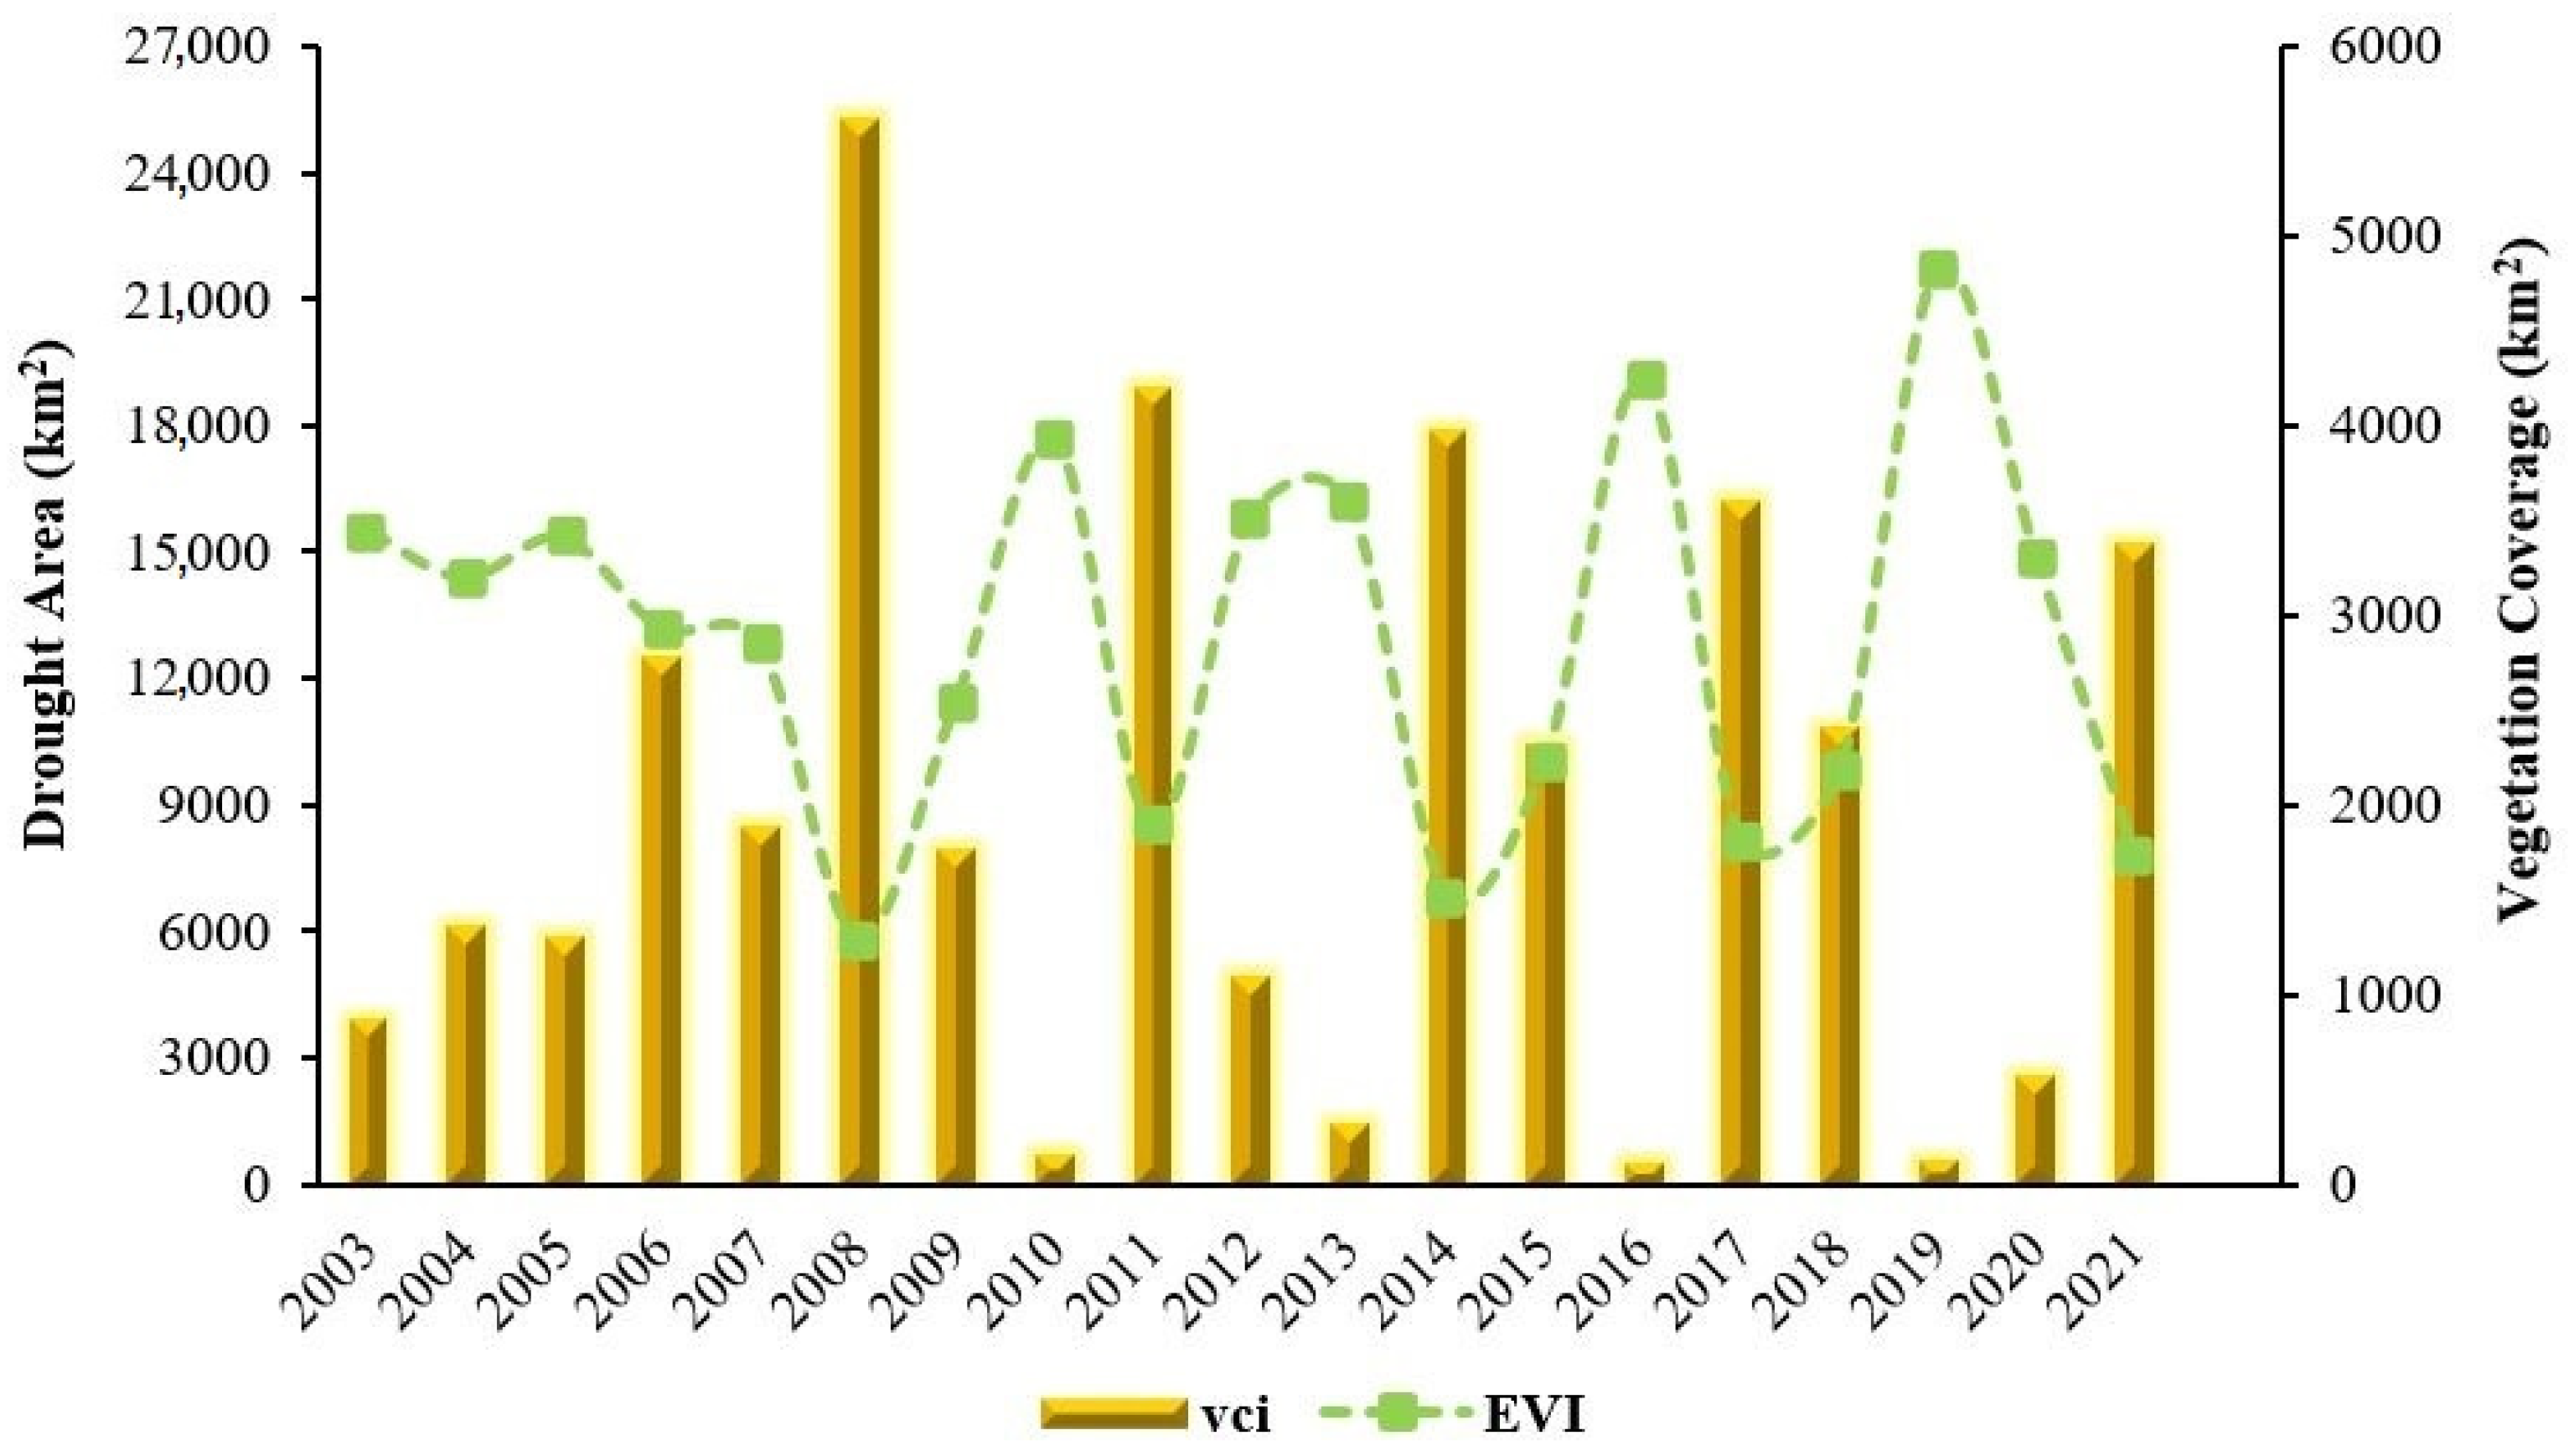
Figure 8 illustrates the correlation between annual vegetation cover and the severity of drought, employing the EVI and VCI indices, within the Atrak basin throughout the study duration from 2003 to 2021. Using the classification established in the scientific literature [
43], regions experiencing drought conditions and those not affected by drought are classified based on VCI index values ranging between 0% and 35%, and between 35% and 100%, respectively. Across the entire basin, which spans approximately 26,430 km
2, the vegetation area displays annual fluctuations, ultimately yielding an average vegetation coverage of 2864 km
2 (11% of the total study area) over the entire period. The VCI index shows that the most pronounced instances of drought were in the years 2008, 2011, 2014, 2017, and 2021, registering percentages of 95.93%, 71.5%, 67.8%, 61.5%, and 57.6% of the total area, respectively. Conversely, the least pronounced droughts were in 2010, 2013, 2016, 2019, and 2020, encompassing 2.6%, 5.4%, 2%, 2.19%, and 9.7% of the total area, respectively.
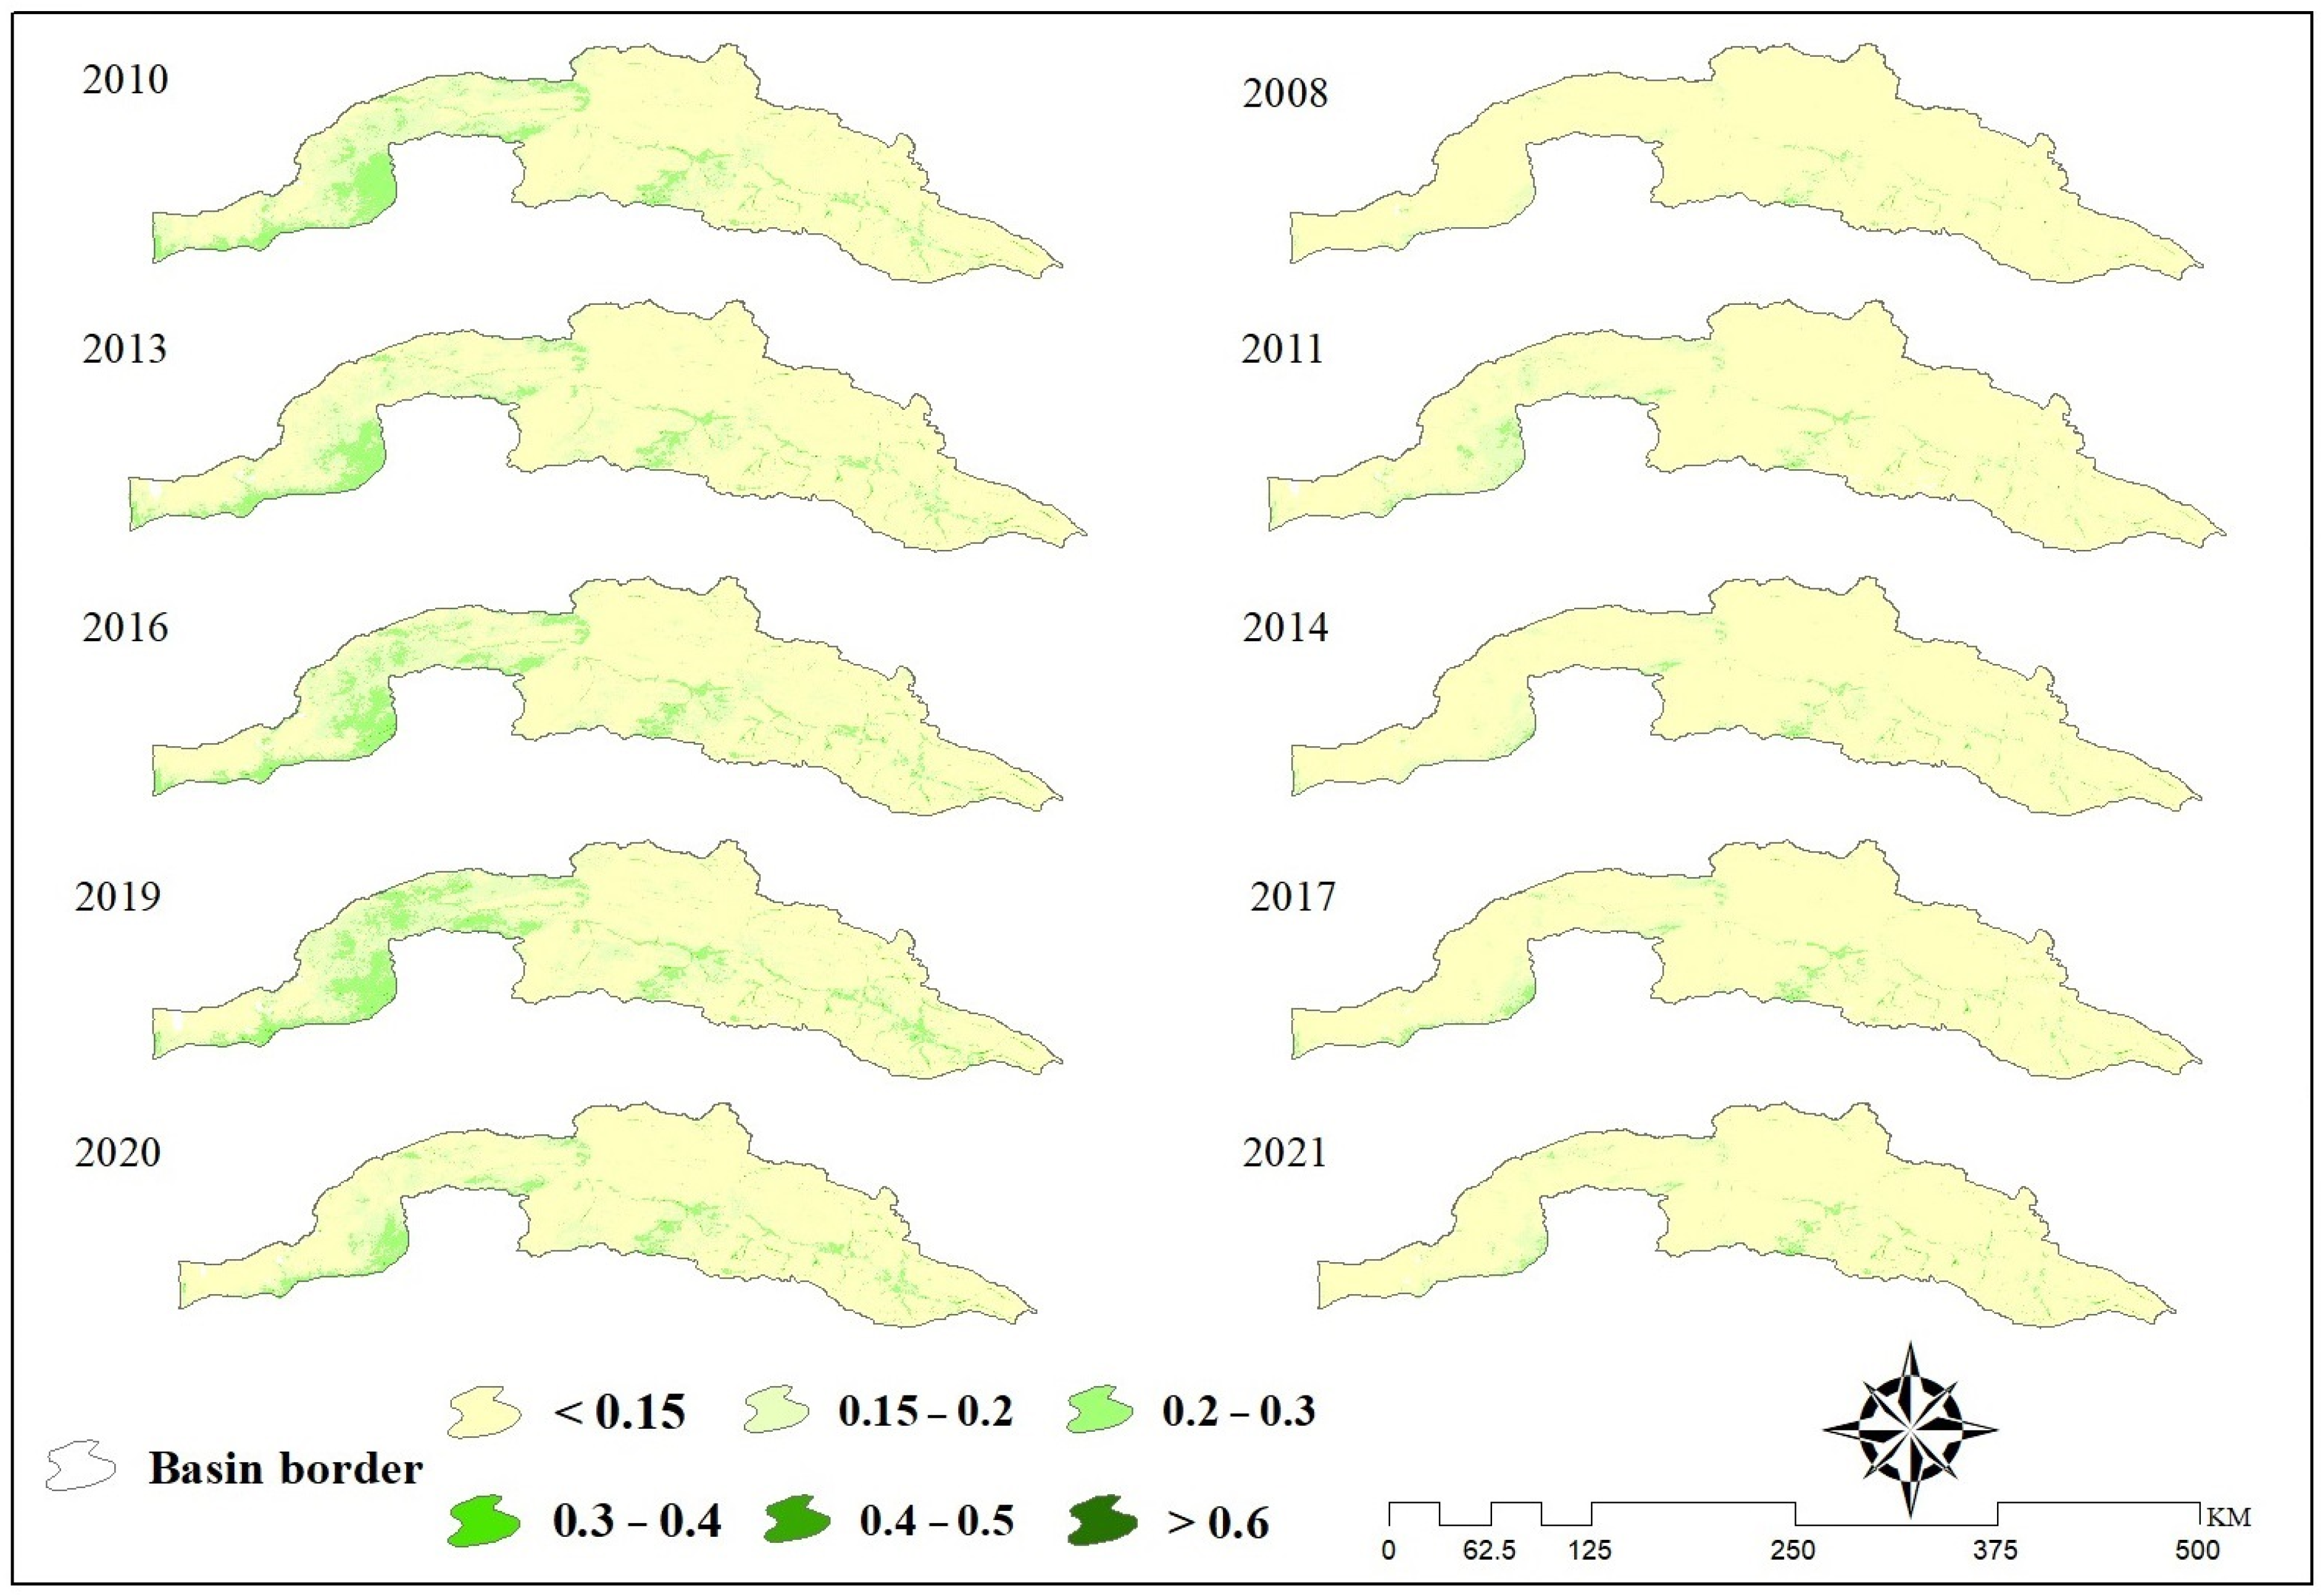
Figure 9 presents a visualization of vegetation density during both wet and dry years. From this representation, it becomes apparent that 2008 stands out as the driest year, characterized by a VCI index of 95.9%, whereas 2016 emerges as the wettest year, marked by a VCI index of 1.98%, within the scope of the analyzed time series. Additionally, during years with higher precipitation, the western regions of the basin, situated in Golestan province, exhibit greater vegetation density compared to the eastern and central parts of the basin in North Khorasan and Razavi provinces. This discrepancy is primarily attributed to the substantial average annual rainfall experienced in these areas. Notably, certain locales might demonstrate disparities in rainfall patterns, either high or low, due to influencing environmental factors like topography.
Across the examined time series, the years 2004, 2007, 2009, and 2019 stand out as having the highest average rainfall, with 396.7 mm, 400 mm, 386.8 mm, and 429.7 mm respectively. These values indicate conditions ranging from a moderate wet year to a very heavy wet year. Conversely, the years 2008, 2014, and 2021 exhibit the lowest annual rainfall averages of 234 mm, 270.7 mm, and 233.6 mm respectively, characterizing conditions of moderate and severe drought. The remaining years fall within the range of normal conditions. Furthermore, the years 2010, 2016, and 2019 notably display the most extensive vegetation coverage, spanning areas of 3931.5, 4250.1, and 4824.6 km
2, respectively. In contrast, the years 2008, 2014, and 2021 exhibit the smallest vegetation coverage areas, corresponding to 129, 1519.3, and 1746.1 km
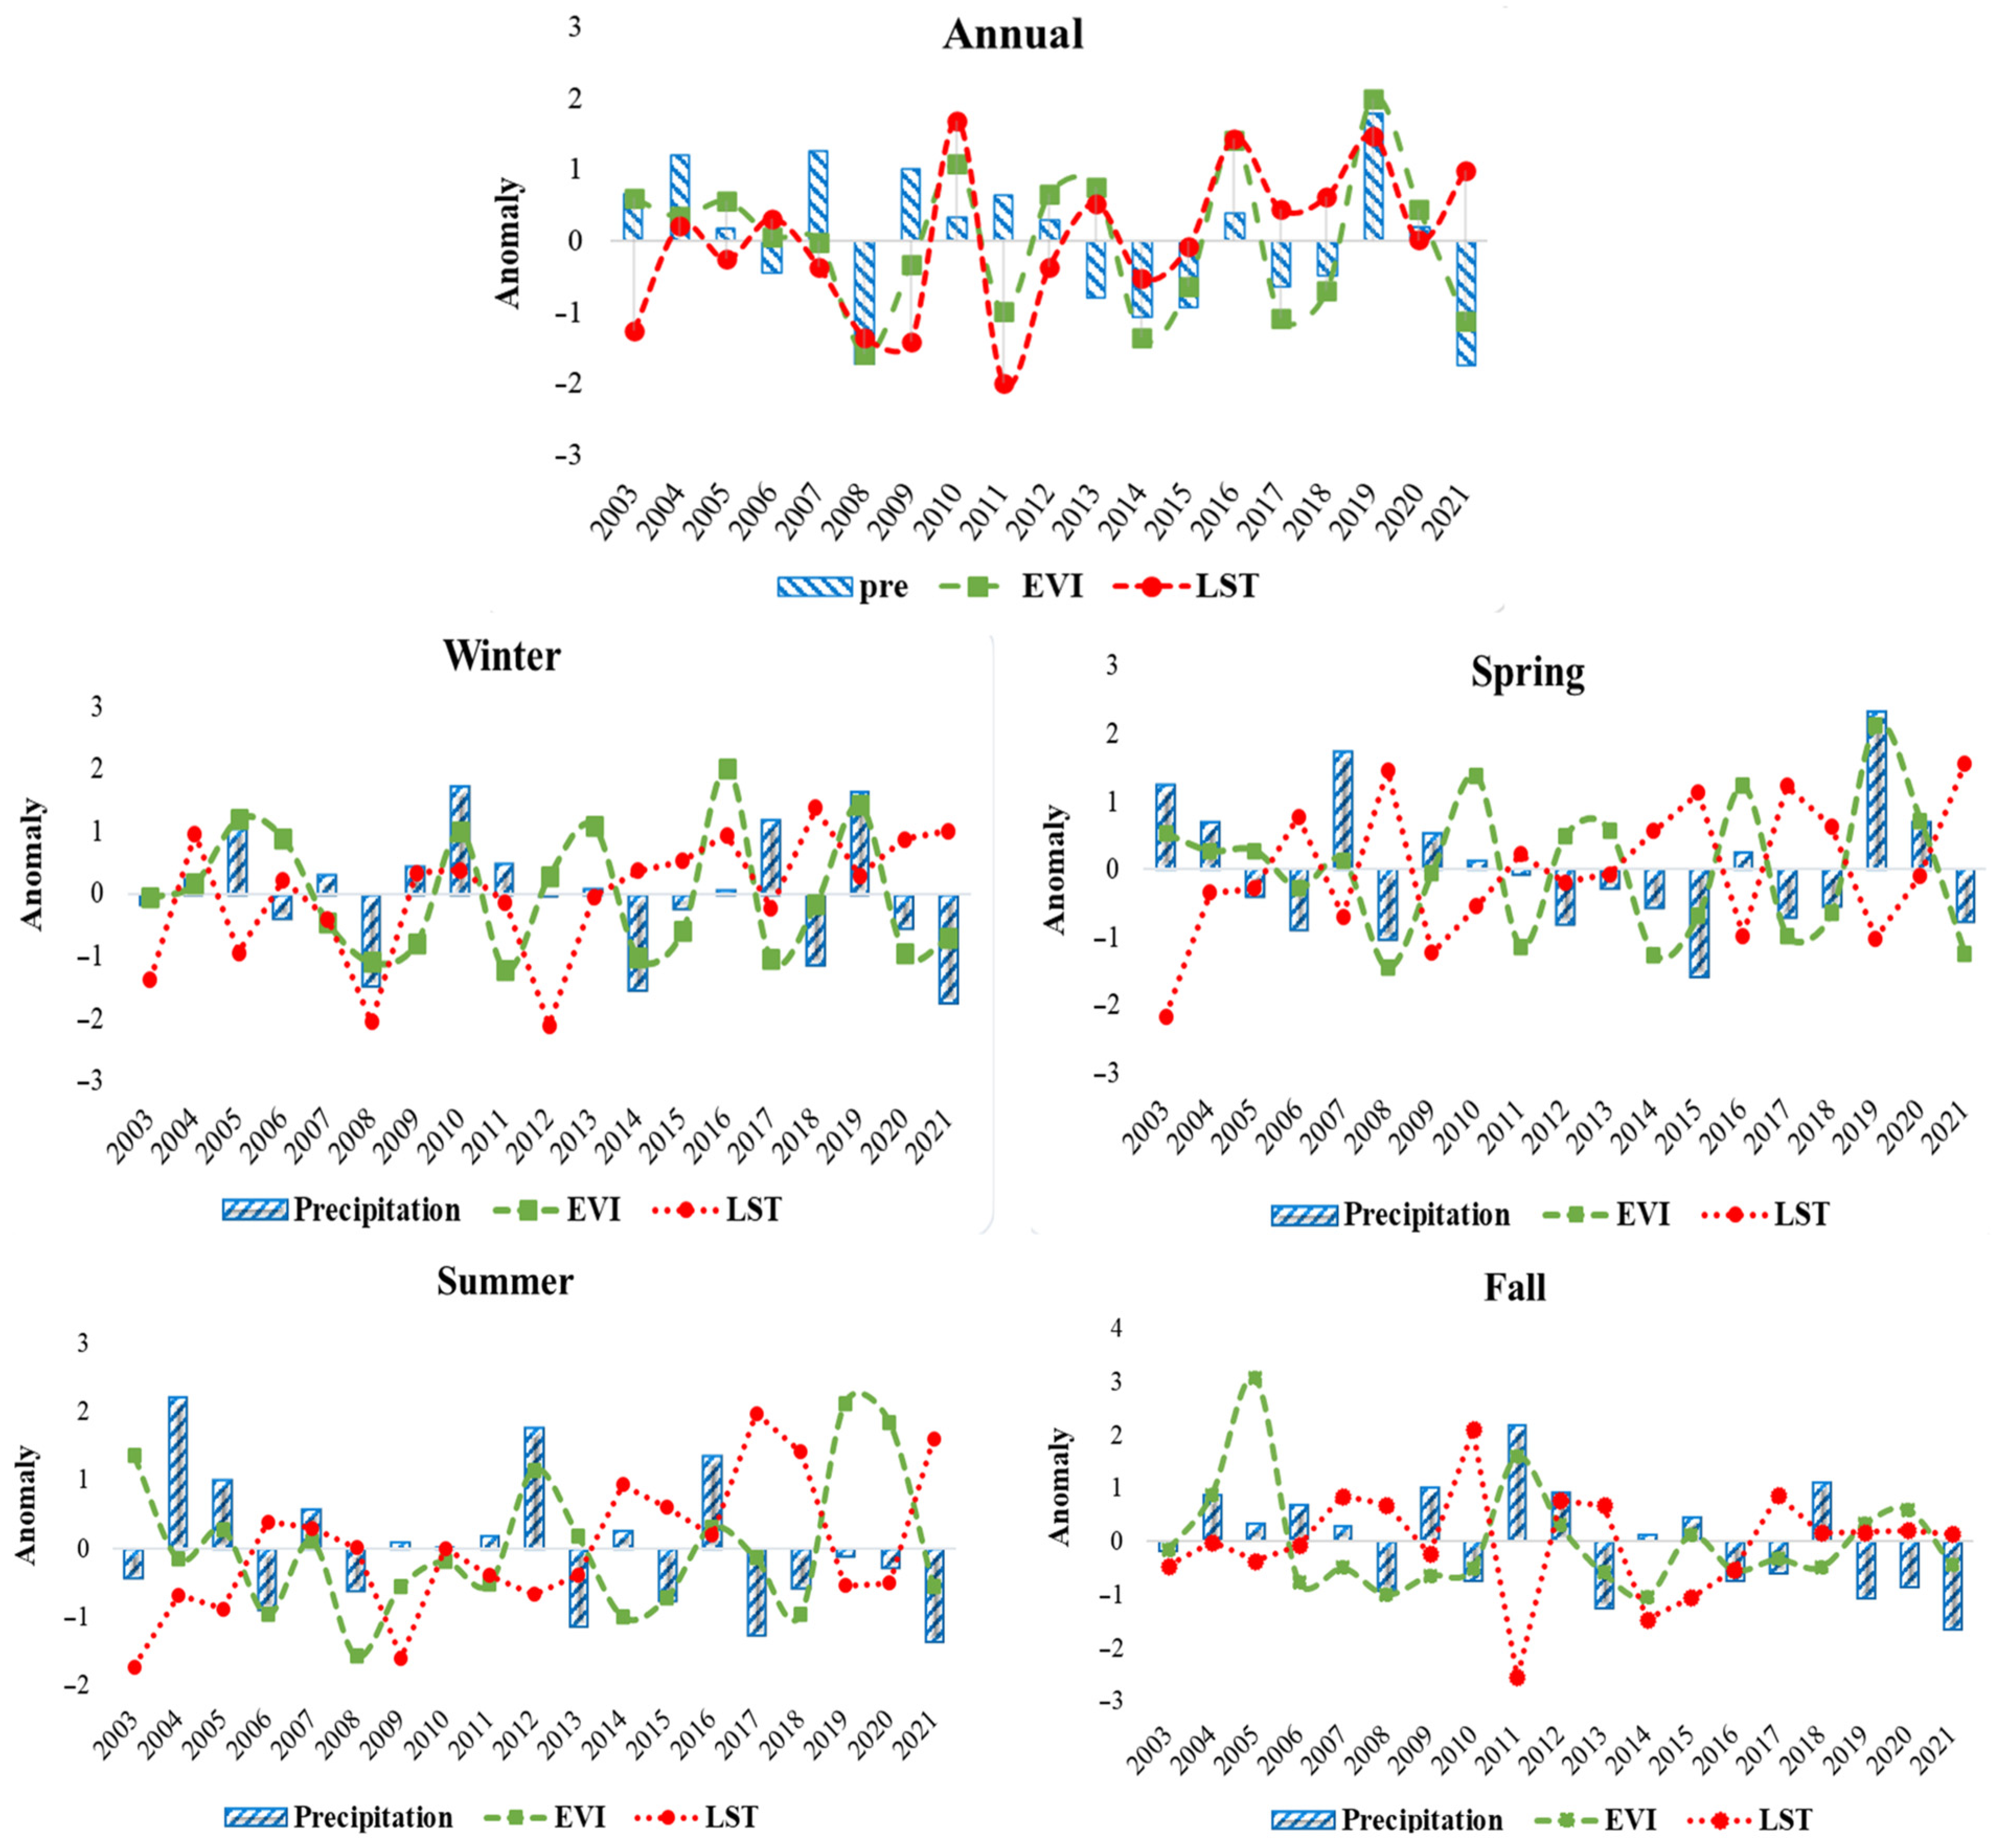
2, respectively. Additionally, the highest average temperature was recorded in 2021, with a temperature of 28.2 °C, and in 2017 and 2018, with temperatures of 27.6 and 27.4 °C, respectively, and the year 2003 has the lowest average temperature at 24 °C (
Figure 10). Within the winter season, particularly noteworthy are the years 2010 and 2019, characterized by the highest recorded rainfall levels of 158 mm and 156 mm, respectively. These values signify extremely wet conditions, as confirmed by SPI results. Furthermore, the years 2014 and 2021 recorded the lowest rainfall at 86.5 mm and 82.3 mm, indicating a state of severe drought. On the other hand, the largest vegetation coverage was observed in 2016, spanning an area of 4190 km
2, while the smallest vegetation area occurred in 2011, covering an area of 122.6 km
2. The highest average LST was in 2018, with a temperature of 11.7 °C, while the lowest average temperature was recorded in 2008 and 2012, with 5.21 and 5.12 °C, respectively.
Transitioning to the spring season, the highest recorded rainfall of 227.5 mm was documented in 2019, signaling a classification as an extremely wet year according to SPI results. Conversely, 2015 experienced notably low rainfall at 78.2 mm, indicative of a state of severe drought. Within this season, the maximum vegetation coverage occurred in 2019, encompassing an area of 14,404 km
2, while the minimum was recorded in 2008 at 2776.6 km
2. The highest average temperature, 33.34 °C, was recorded in 2021, and the lowest average temperature was recorded in 2003 with a temperature of 25.7 °C. Moving to the summer season, the peak rainfall of 31.7 mm transpired in 2004, signifying an extremely wet year, while 2021 had the lowest rainfall at 15.7 mm, reflecting a moderate state as per the SPI. Notably, the highest vegetation extent was documented in 2019, covering an area of 1929.8 km
2, while the smallest occurred in 2008 at 799.1 km
2. Additionally, the years 2017 and 2021 had the highest average temperatures, of 43.6 and 43 °C, respectively, while in the years 2003 and 2009 the lowest average temperatures were recorded for this season, with temperatures of 38.8 and 39 °C, respectively. Within the autumn season, the years 2011 and 2018 experienced the highest recorded rainfall at 76 mm and 62.7 mm, respectively, aligning with an extreme wet and very wet year classification based on SPI results. In contrast, the lowest autumnal rainfall was observed in 2021, measuring 28.2 mm and corresponding to severe drought. Correspondingly, the maximum vegetation coverage materialized in 2005, spanning an area of 820.9 km
2, while the minimum was noted in 2014 at 102.4 km
2. The highest LST for this season was in 2010, with a temperature of 24.8 °C, and the lowest was in 2011, with a temperature of 19 °C (
Figure 10).
While rainfall is commonly perceived as the primary driver of vegetation changes, it is noteworthy that years with elevated rainfall levels do not necessarily correspond to significant shifts in vegetation patterns. Therefore, other influential environmental factors such as topography, soil composition, and salinity must also be considered in this context [
49]. According to
Table 4, a significant relationship was observed between annual vegetation cover and temperature in spring (−0.520,
p = 0.01) and summer (−0.345,
p = 0.05). Additionally, a significant relationship (−0.380,
p = 0.05) exists between annual temperature and summer vegetation. Conversely, significant negative relationships were noted between spring temperature and winter, as well as between spring and summer vegetation. Moreover, summer temperature exhibits a significant negative correlation with spring and summer vegetation. Generally, when humidity is low, particularly during the summer season when water availability limits plant growth, a negative correlation between temperature and vegetation is typical [
50].
Table 5 presents the outcomes of the correlation analysis examining the relationship between rainfall and vegetation, considering both seasonal and annual perspectives over 19 years. The analysis revealed several noteworthy findings. Specifically, a substantial correlation exists between spring precipitation and the Enhanced Vegetation Index (EVI) during both spring and summer (0.439,0.450,
p = 0.01), and a statistically significant association is observed between annual precipitation and EVI during the spring and summer seasons (0.462,
p = 0.01) and (0.404,
p = 0.05), respectively. Additionally, there is a significant correlation between winter rainfall and annual EVI (0.333,
p = 0.05). Notably, no significant correlation is observed between precipitation and annual and seasonal EVI in the autumn season. Furthermore, a statistically significant correlation is identified between spring precipitation and the annual EVI, once again (0.392,
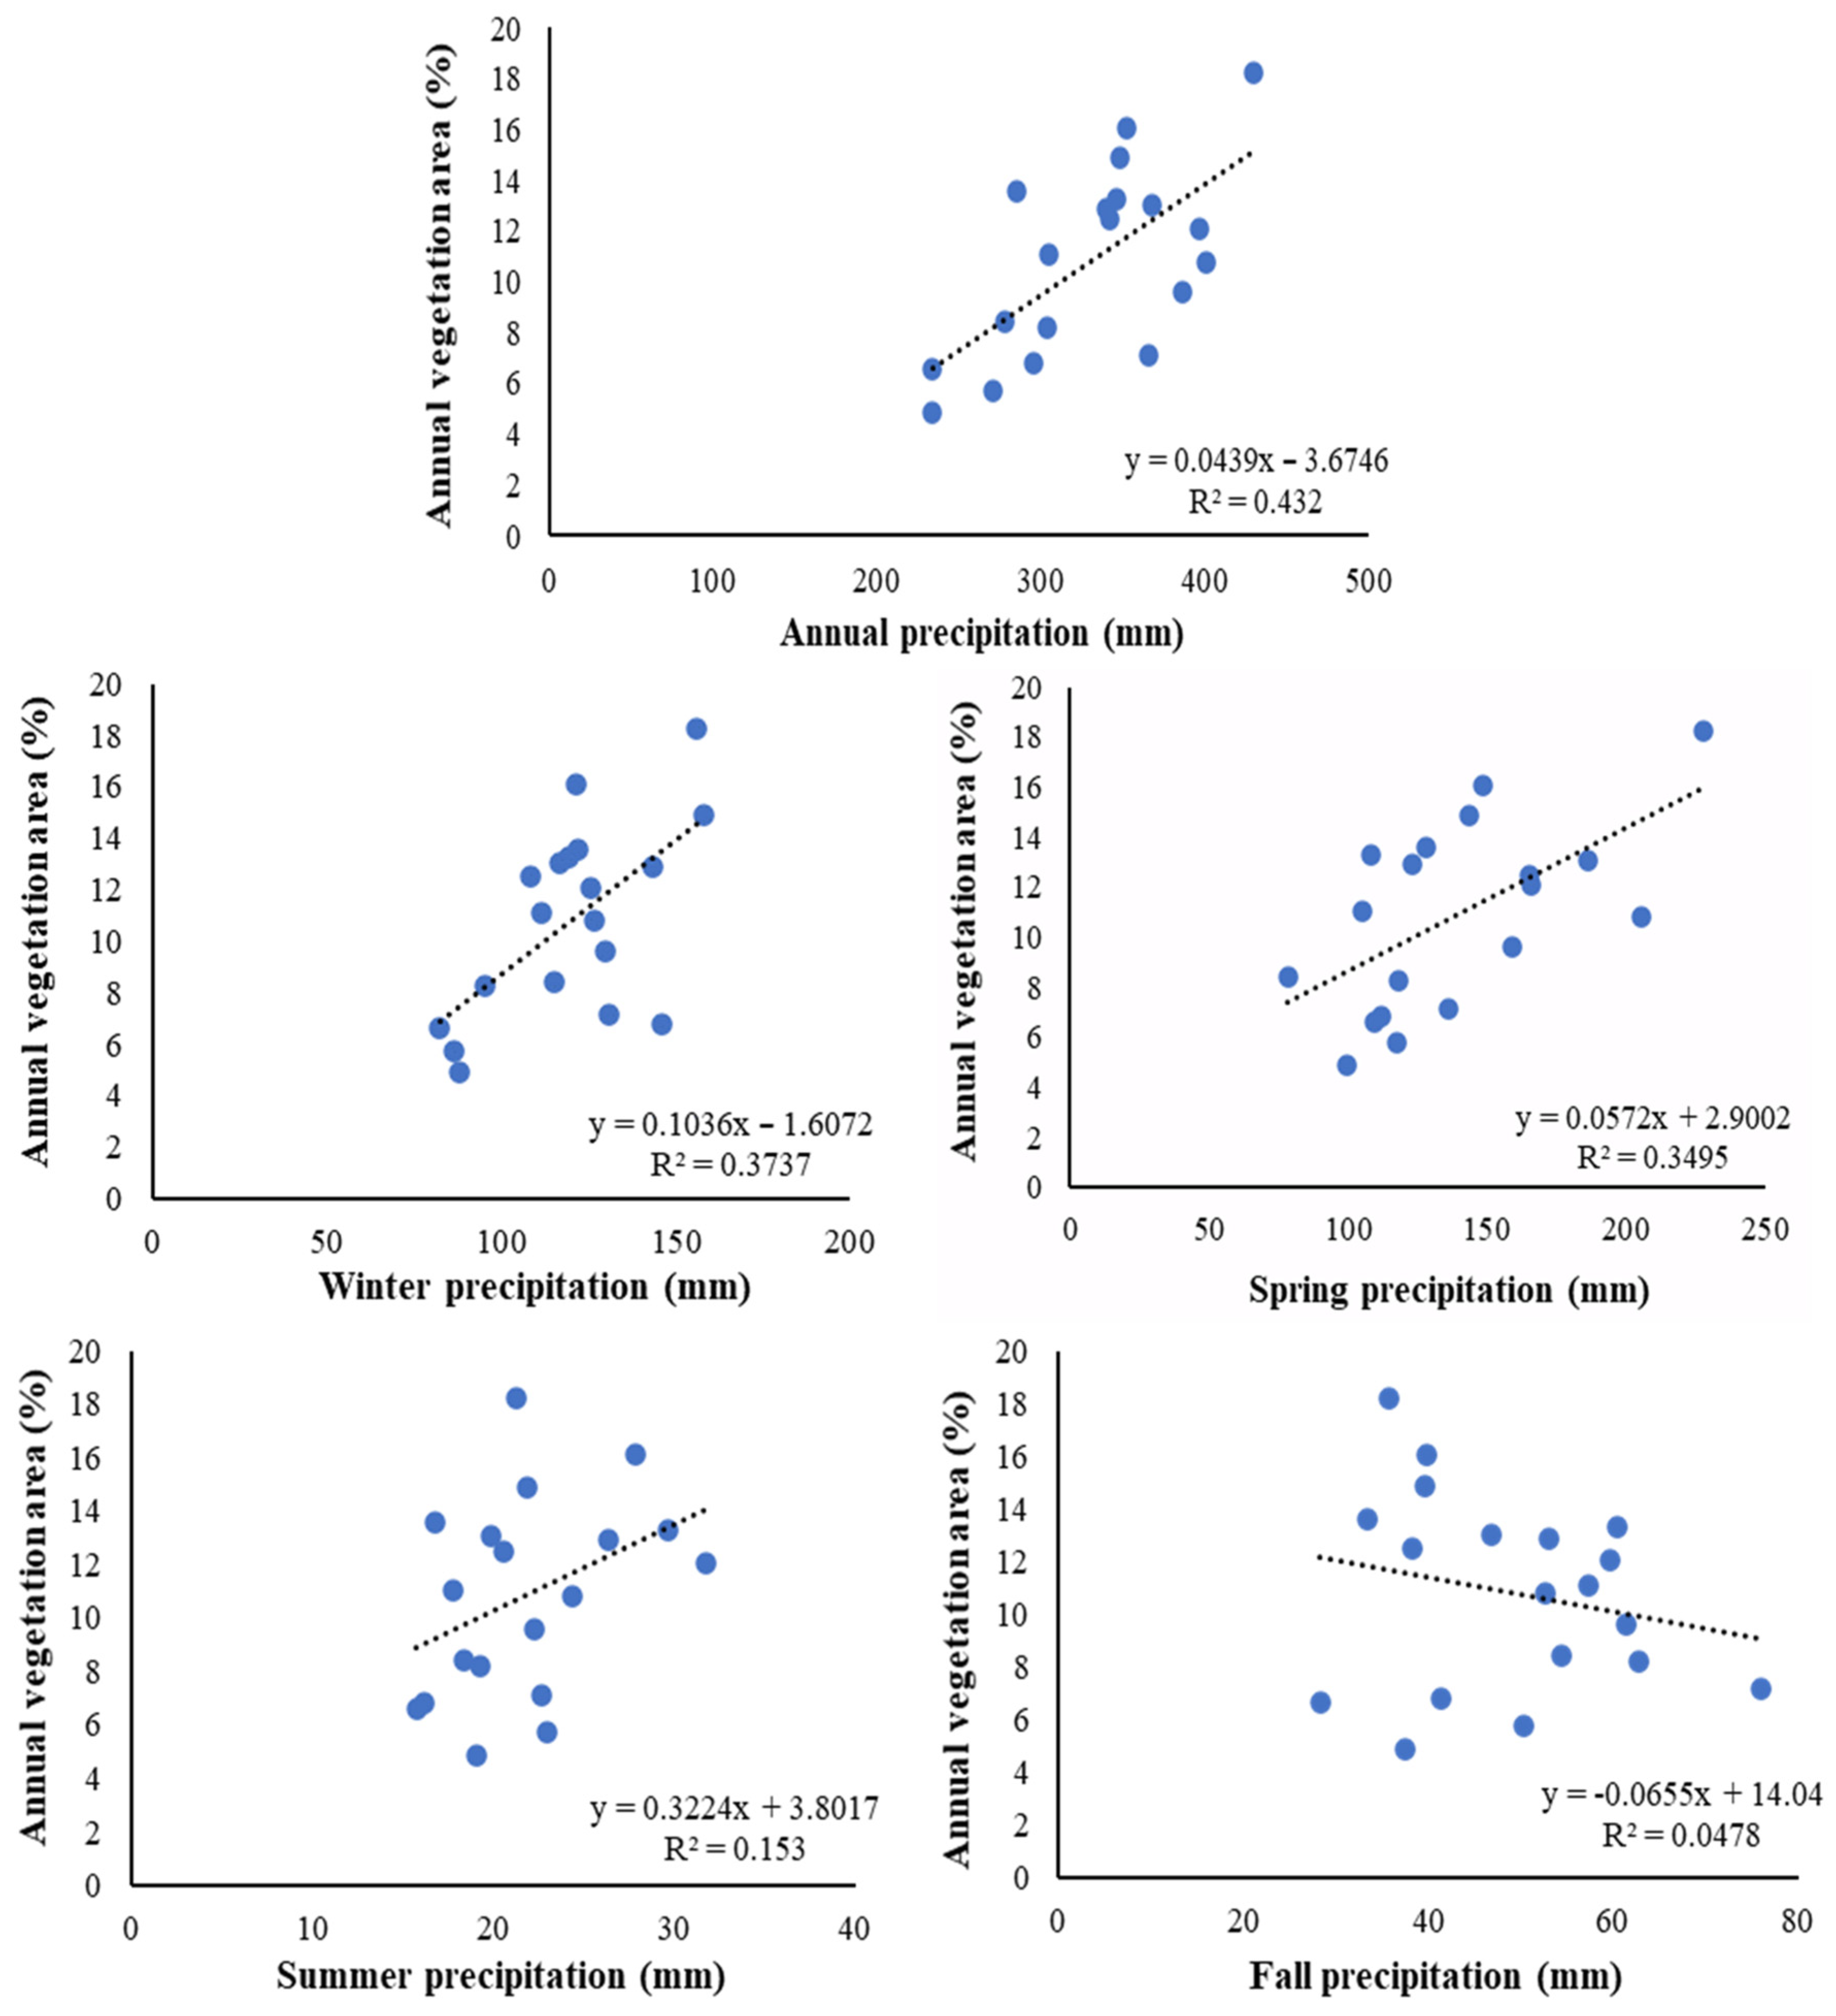
p = 0.05). This finding underscores the highest level of correlation between spring precipitation and EVI-related vegetation trends. To gain a deeper understanding of the annual and seasonal changes in EVI during the period of the study,
Table 6 presents the percentage of seasonal and annual changes in vegetation cover, and
Figure 11 illustrates the distribution of annual vegetation (in percent) compared to annual and seasonal precipitation in the study area.
Considering the crucial role of agricultural lands in the country’s food security, economy, and the preservation of biodiversity [
51], as well as their relationship with climate change [
52,
53], the changes occurring in the agricultural land class in the Atrak basin area was investigated separately from other land classes. According to
Table 7, the years 2003, 2007, and 2020, with an area of 751 km
2, followed by 2004 with 756 km
2 and 2019 with 758 km
2, had the highest area of croplands. In contrast, 2008 with an area of 525 km
2, 2011 and 2014 with 573 km
2, 2015 with 588 km
2, and 2021 with an area of 486 km
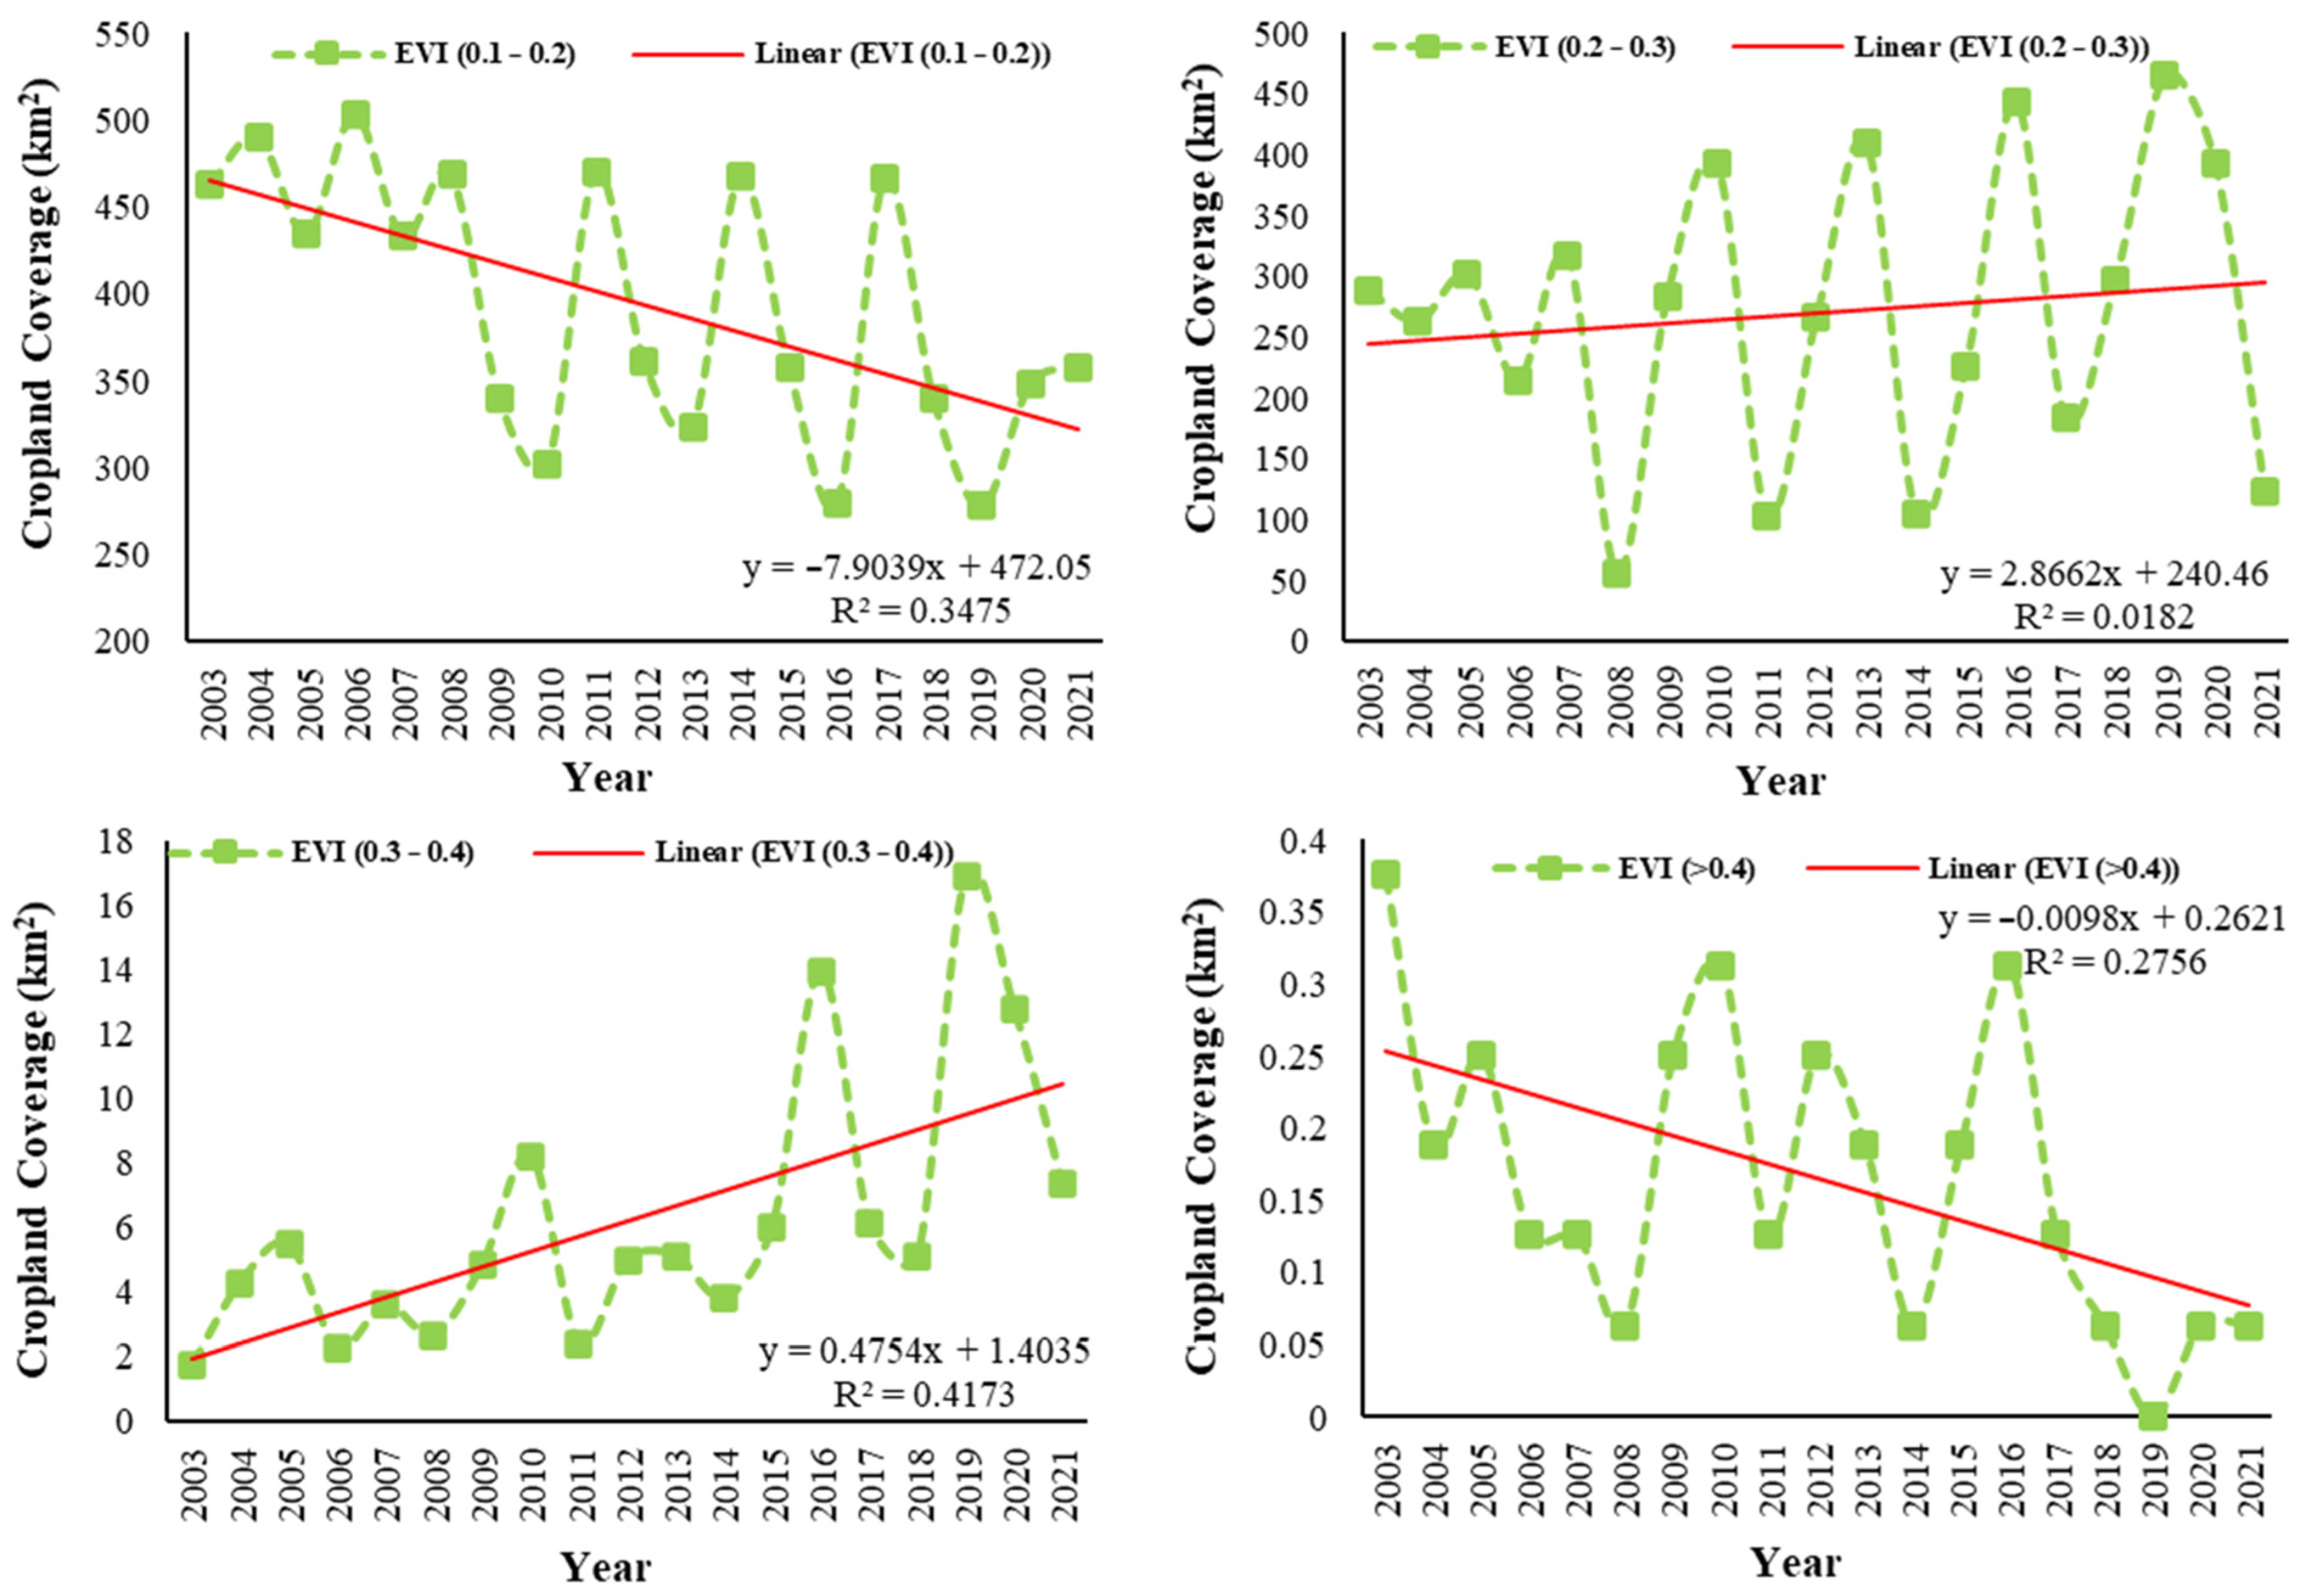
2 had the lowest cropland area. The largest area of cropland in this basin falls into the “very poor” and “poor” classes, covering 393 and 269 km
2, respectively. According to
Figure 12 and
Table 8, a significant decreasing trend can be observed in the “very poor” and “dense” classes (−0.392, −0.415,
p = 0.05), while the “moderate” class shows a significant increasing trend (−0.551,
p = 0.01). However, a significant trend of changes is not observed in the “poor” classes and the total annual cropland area.
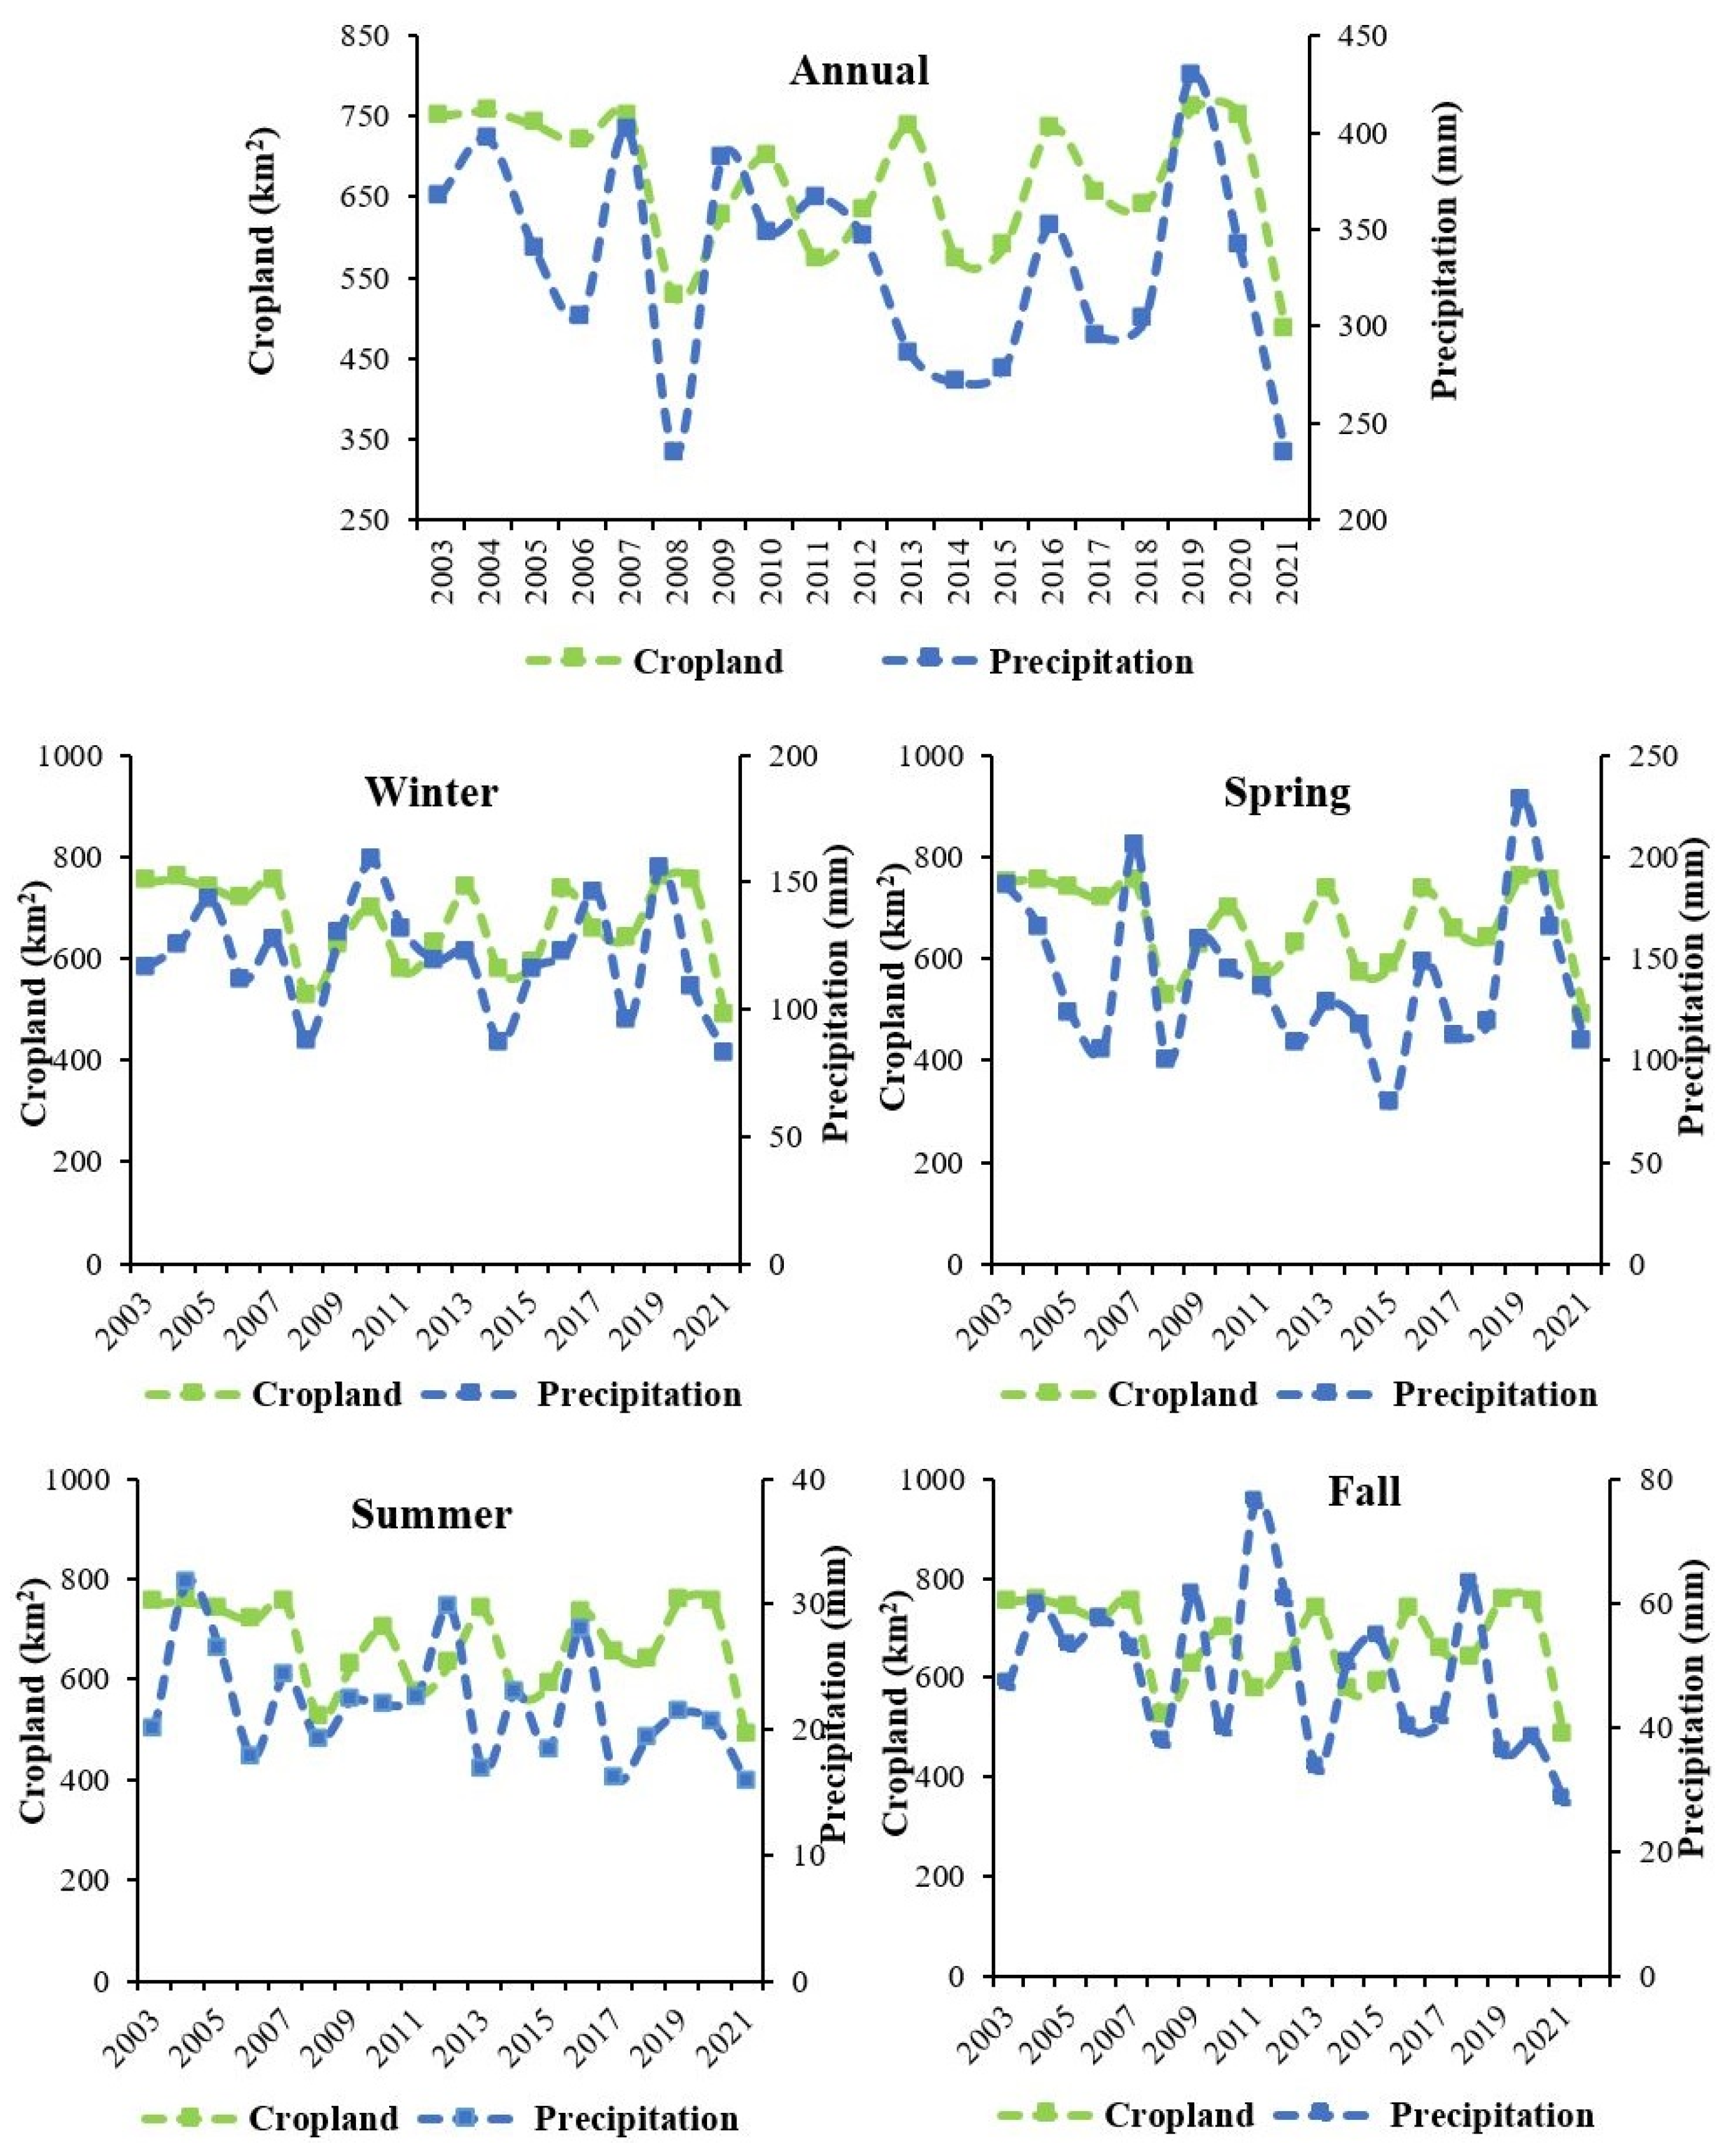
According to
Table 9, which presents the correlation between the total area of croplands in the Atrak Basin and annual and seasonal rainfall, a significant relationship between the total area of cropland and winter and spring rainfall can be observed (0.333,
p = 0.05 and 0.556,
p = 0.01, respectively). Additionally, concerning annual precipitation, a very strong and significant trend is evident (0.532,
p = 0.01). As shown in
Figure 13, during the winter and summer seasons, as well as annually, a positive relationship between precipitation and cropland is observed (an increase in rainfall is followed by an increase in crop cover).
4. Discussion
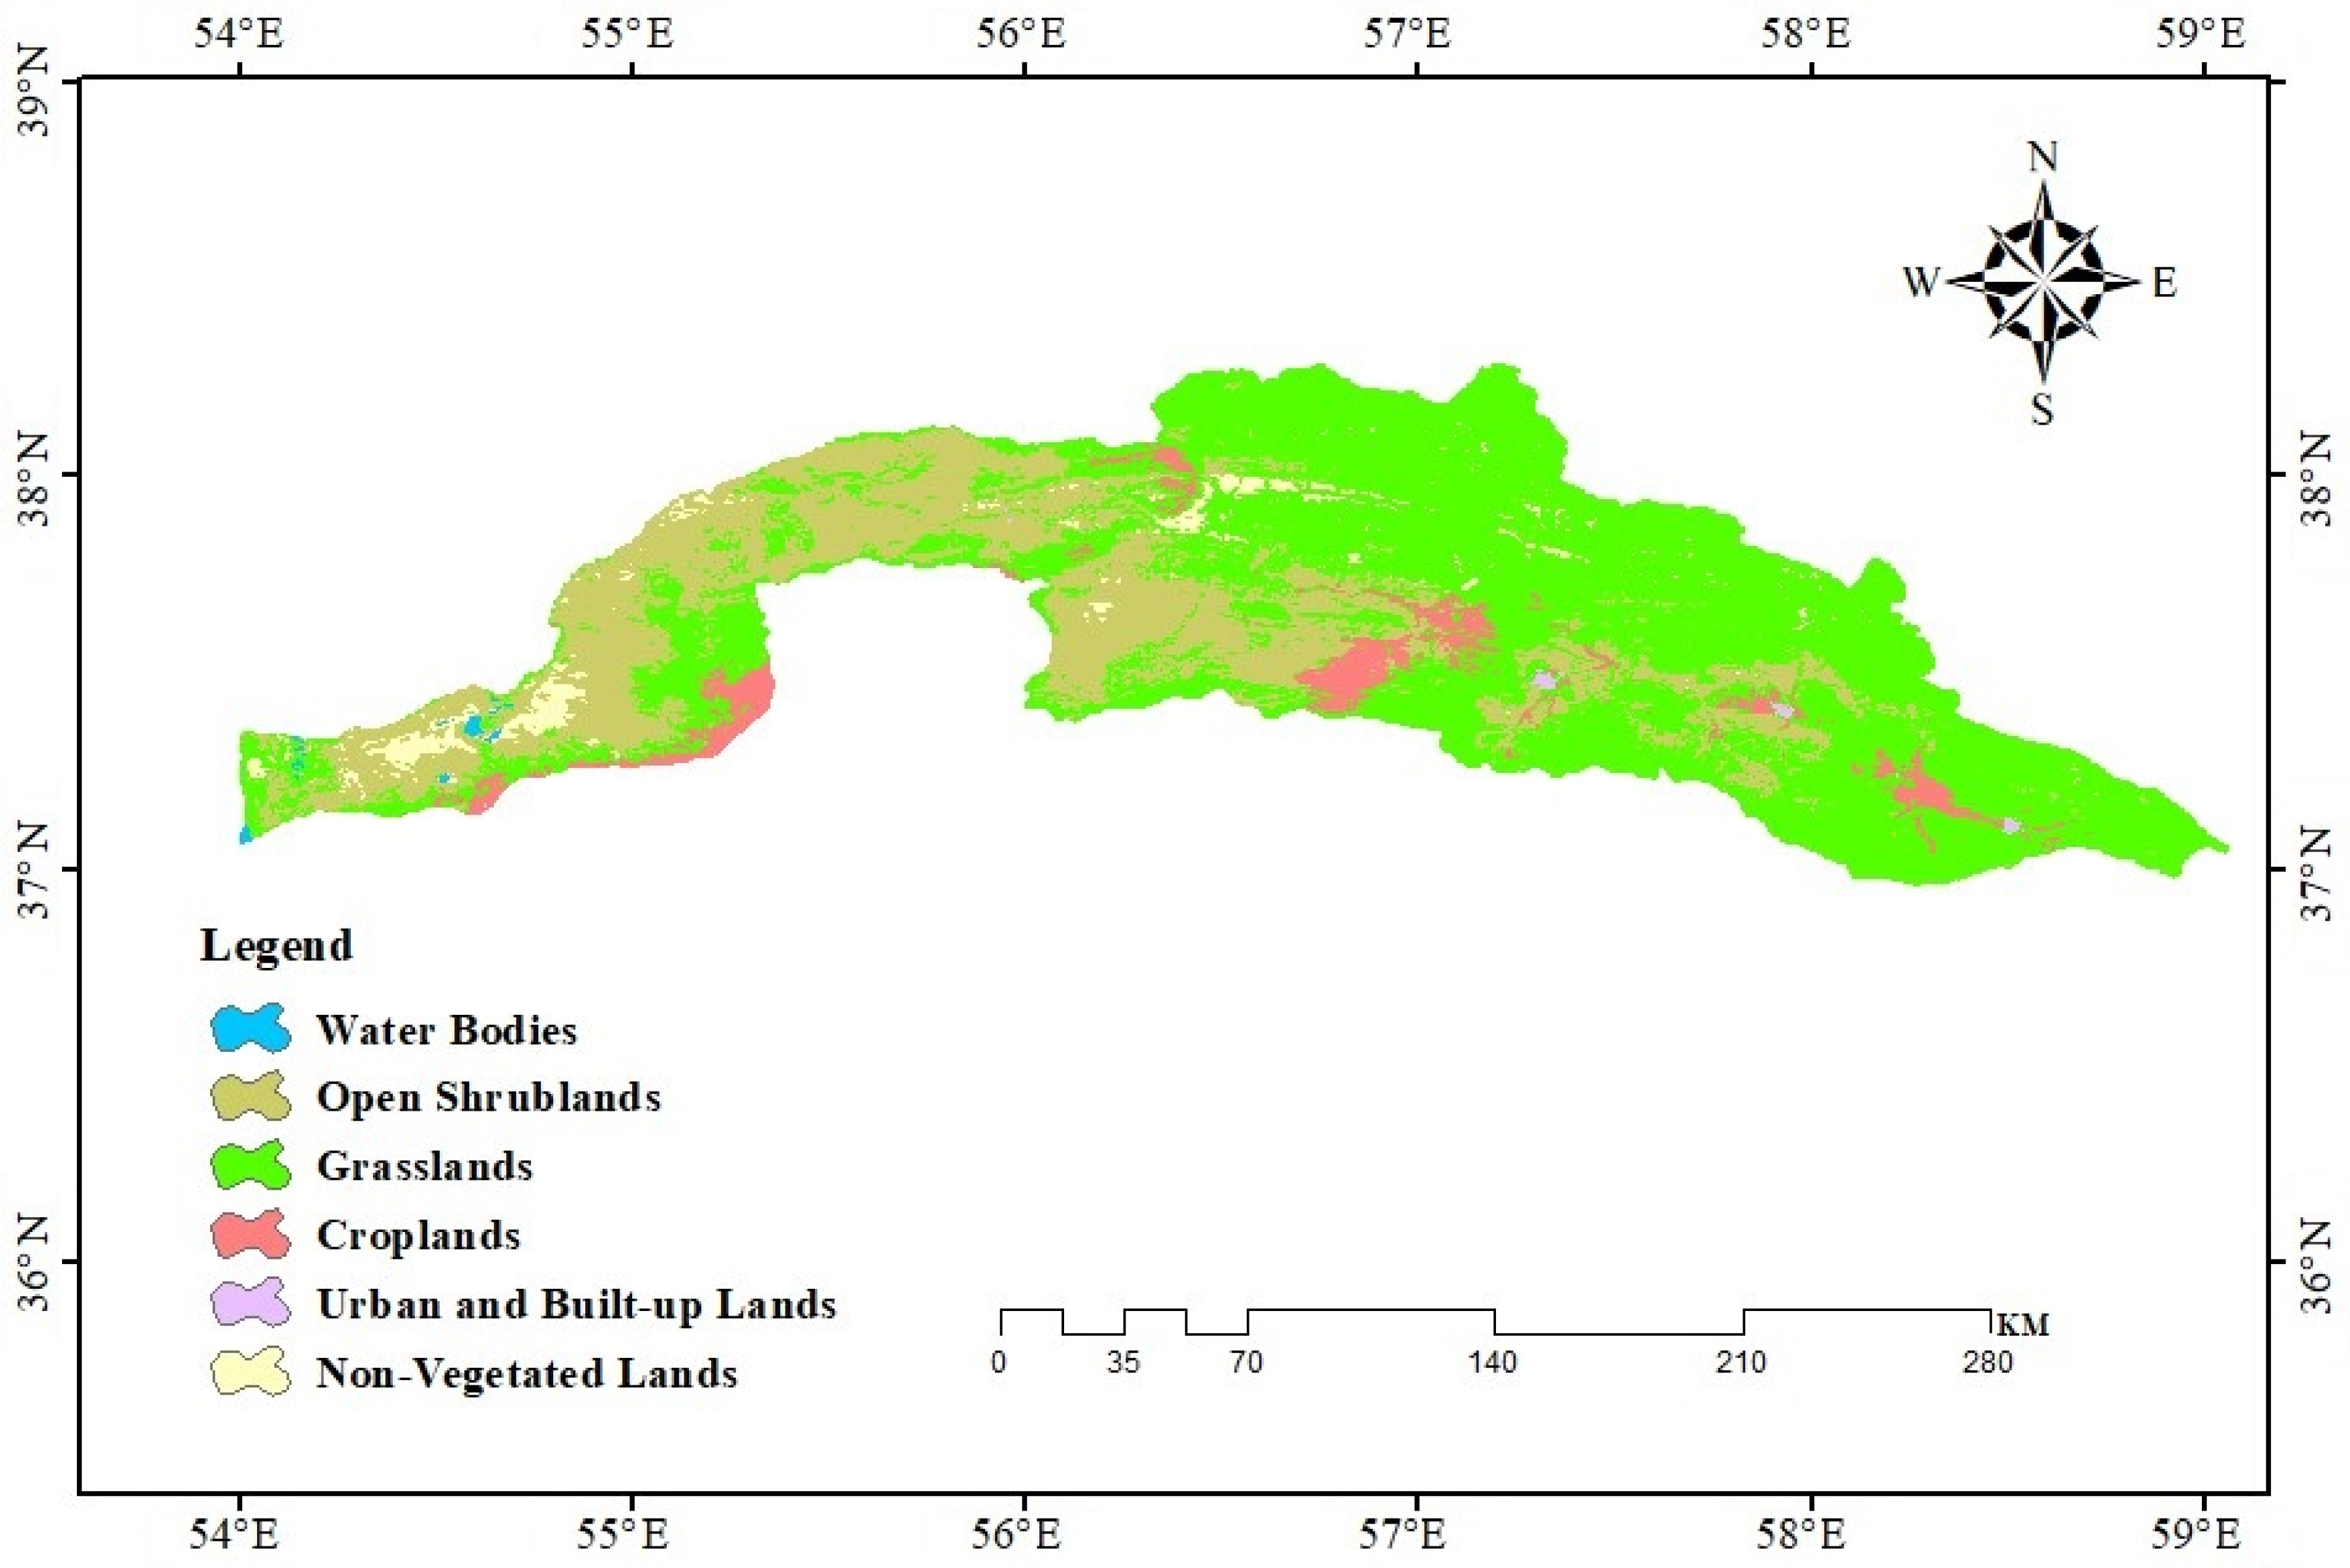
In this research, the dynamics of vegetation in relation to the detection and quantification of drought was investigated using remote sensing data in the Atrak basin for 2003–2021. According to the land use map (
Figure 2), and as indicated in
Table 3, which highlights that the vegetation cover classified as “poor” occupies the largest area, a huge part of the Atrak basin is covered by grasslands. Furthermore, as depicted in
Figure 6, the vegetation anomaly has an increasing trend in the eastern parts of the basin and a slightly decreasing trend in the western parts of the basin, while in some specific areas, it is stable. The findings showed that the lowest vegetation area was observed in 2008 (4.89%), 2014 (5.75%), 2017 (6.81%), and 2021 (6.61%). According to the VCI index, 2008 was identified as the driest year, with a VCI of 95.9%, consistent with the findings of other studies [
54]. Conversely, during the years with very high rainfall, such as 2004, 2007, 2009, and 2019, the vegetation coverage occupied 12.08%, 10.78%, 9.61%, and 18.25% of the total vegetation area, respectively. To some extent, vegetation cover follows the occurring rainfall pattern of change, with low rainfall years leading to decreased soil moisture, stress for vegetation, and, subsequently, reduced vegetation cover.
Based on the results of the VCI index, the highest occurrence of drought area occurred in the years 2008 (95.93%), 2011 (71.5%), 2014 (67.8%), 2017 (61.5%), and 2021 (57.6%), while the lowest drought area was recorded in 2010 (2.6%), 2013 (5.4%), 2016 (2%), 2019 (2.19%), and 2020 (9.7%). This result is in line with other studies’ conclusions [
18,
55]. Additionally, the Standardized Precipitation Index (SPI) has been employed to monitor drought conditions [
56]. The SPI analysis indicates that the years 2004, 2007, 2009, and 2019 exhibited conditions ranging from moderately wet to very heavy wet, whereas the years 2008, 2014, and 2021 experienced moderate to severe drought conditions [
27,
57]. In 2010, 2016, and 2019 the highest percentage of vegetation area was observed. According to the Standardized Precipitation Index (SPI), 2019, with 227.5 mm of rainfall, is classified as a very wet year, and it exhibited the maximum vegetation coverage during this year, spanning an area of 14,404 km
2. Conversely, the lowest amount of rainfall in this season occurred in 2015, with 78.2 mm, while the minimum vegetation cover was in 2008, covering an area of 2776.6 km
2. It is worth noting that while rainfall is a crucial factor in vegetation changes, it may not always be the sole determining factor, as other factors such as soil texture and salinity can also play a role [
49].
The conducted analyses demonstrate a significant relationship between precipitation and vegetation cover, which is also indicated by other authors [
58,
59]. This correlation indicates that changes in vegetation cover are somewhat influenced by the amount of rainfall in the region, and these two factors have a linear and direct relationship with each other. This finding aligns with the results of previous studies [
60,
61,
62,
63]. However, our results also suggest a phase delay between precipitation and EVI cycles, with a relatively higher correlation observed between spring precipitation and summer EVI than spring precipitation and spring EVI. This observation aligns with the greening response typically occurring a few weeks after rainfall events. This was shown in one of the papers using the cross-wavelet analysis for eight eco-regions of Italy to show that the forested regions with higher altitudes had a positive correlation with almost in-phase annual coherency between NDVI and precipitation, while, for vegetation in the warmest eco-region, lowest annual coherencies between NDVI and precipitation were observed [
64]. Additionally, a negative correlation between vegetation and temperature was observed, indicating another climatic factor influencing vegetation dynamics in the Atrak River basin. It is also worth noting that, similar to the observations in the referenced paper [
64], we found that the correlations between EVI and LST were almost out of phase, with the highest correlation between spring LST and spring EVI, and relatively high correlations between summer LST and summer EVI. However, high correlations were also observed between spring LST and summer EVI, as well as spring EVI and summer LST, underscoring the complexity of the relationships between climatic variables and vegetation dynamics.
Furthermore, considering the critical role of agricultural lands in food security and the country’s economy, the agricultural lands within the Atrak basin were separately investigated. The analysis indicates fluctuations in the extent of agricultural land over the study period, with some years witnessing larger agricultural areas compared to others. However, the majority of agricultural lands fall into the “very poor” and “poor” classes, underscoring the need for targeted interventions to improve soil fertility and agricultural productivity in the region. Additionally, a significant correlation was found between spring precipitation and cropland cover. Seasonal rainfall plays a crucial role in agriculture, influencing decisions such as the selection of seed species, the quantity of species to plant, and the timing of seed planting. A staggering 79% of farmers base their planting decisions on their predictions for the upcoming season’s weather. Interestingly, approximately two-thirds of these predictions stem from past experiences, while the remaining third relies on observations from the previous season. However, a notable challenge arises from the lack of precise correlation between rainfall patterns in consecutive seasons, making accurate rainfall predictions difficult. Consequently, this uncertainty poses challenges for farmers in selecting appropriate seed varieties and drought-resistant cultivars. Ultimately, farmers’ anticipations regarding future seasonal weather serve as a pivotal factor in guiding cropping decisions [
65]. In semi-arid regions like the Atrak basin, where grasslands are prevalent, an annual rainfall range of 300–600 mm (mm) may be considered favorable for maintaining healthy grassland coverage, while, generally, for successful dry agriculture, regions may require annual rainfall ranging from 200 to 500 mm, with variations based on specific crop requirements and local conditions [
66]. Sustainable management strategies should prioritize measures to mitigate the impact of droughts, enhance soil moisture retention, and improve the resilience of ecosystems and agricultural systems to climate variability. Additionally, integrated approaches that consider the complex interactions between climatic variables, land use practices, and vegetation dynamics are essential for fostering sustainable development and resilience in the region.
5. Conclusions
Understanding the factors that influence changes in vegetation cover is a critical aspect of vegetation management and protection. These factors encompass both climatic aspects and human-driven influences, such as management practices, human activities, restoration efforts, and exploitative actions. It is of great importance to elucidate the intricate relationship between these factors and the dynamics of vegetation, unraveling the mechanisms behind the changes. This study focused on understanding the factors impacting changes in vegetation cover, focusing on weather elements. Conducted in the Atrak River basin from 2003 to 2021, the research employed satellite data and indices like VCI and SPI to analyze the connection between rainfall patterns and vegetation dynamics. The VCI helps identify drought and moisture levels, revealing trends over the years. Additionally, the SPI revealed years of moderate drought and normal conditions, with varying annual rainfall amounts.
Anomaly detection highlights rising vegetation trends in the eastern basin over time. The basin’s vegetation cover varies, with poor vegetation being the largest category. Seasonally, spring sees the most extensive vegetation growth, particularly in 2010, 2016, and 2019. Contrasting vegetation distribution between the eastern and western halves is observed in summer and winter, with the eastern half displaying more scattered vegetation. The study established a notable correlation between spring precipitation and EVI in both spring and summer, indicating its significance. This emphasizes the pivotal role of spring precipitation in influencing vegetation dynamics within the Atrak basin area during the spring season. Additionally, in order to better understand the SPI in relation to vegetation dynamics, the LST index was used.
In conclusion, the findings of this study offer valuable insights for policymakers involved in vegetation management, water resource allocation, and environmental protection within the Atrak River basin. Our analysis of factors influencing vegetation cover, particularly focusing on weather elements, sheds light on the dynamics of the Atrak River basin’s ecosystem. By utilizing advanced satellite imagery and indices, we established a clear correlation between rainfall patterns and vegetation dynamics, providing a data-driven understanding of how climatic shifts impact the region’s vegetation health. While the identification of specific years marked by severe drought and abundant rainfall is crucial for policymakers, it is essential to note that addressing the predictability of droughts was beyond the scope of this study. However, acknowledging the limitations, our findings can still inform proactive measures during critical periods of water scarcity or excess. By understanding the intricate relationship between climatic factors and vegetation dynamics, policymakers can potentially mitigate the impacts of drought, support ecosystem restoration, and ensure the long-term sustainability of the region’s environment and communities.
In summary, while our study does not delve into the predictability of droughts, it provides a foundation for informed decision making and resource allocation strategies, thus contributing to the overall resilience and well-being of the Atrak River basin.


 ,
, 


