Article

Spatiotemporal Dynamics of Vegetation Productivity and Its Response to Meteorological Factors in China

1
College of Urban and Environmental Science, Northwest University, Xi’an 710127, China
2
Key Laboratory of Soil and Water Conservation on the Loess Plateau of Ministry of Water Resources, Yellow River Institute of Hydraulic Research, Yellow River Conservancy Commission, Zhengzhou 450003, China
3
Yellow River Institute of Hydrology and Water Resources, Yellow River Conservancy Commission, Zhengzhou 450003, China
4
School of Geological Engineering and Geomatics, Chang’an University, Xi’an 710054, China
*
Author to whom correspondence should be addressed.
Atmosphere 2024, 15(4), 491; https://doi.org/10.3390/atmos15040491
Submission received: 12 March 2024 / Revised: 2 April 2024 / Accepted: 8 April 2024 / Published: 16 April 2024
(This article belongs to the Section Climatology)

Abstract

:
Climate is one of the key factors driving changes in vegetation, and the response of the vegetation to climate often occurs with a time delay. However, research on the cumulative lagged response of the vegetation to meteorological factors in large-scale regions is limited. Therefore, this study first evaluated the performance of the Gross Primary Productivity (GPP) products provided by Moderate Resolution Imaging Spectroradiometer (MODIS) and Penman–Monteith–Leuning (PML) over the past 20 years in China and then determined the lagged relationships between the GPP and major meteorological factors in different regions and land-use types in China based on a partial correlation analysis. The results indicate that (1) GPP_PML outperforms GPP_MODIS products in the regional context of China; (2) China’s regional GPP has shown a fluctuating upward trend over the past 20 years, with a stepwise increase in the multi-year average from the northwest inland to the southeast coastal regions, and a higher contribution from the southern regions than the northern ones; (3) unlike the recent upward trend in regional temperatures, both precipitation and radiation have decreased, with these two factors showing completely opposite multi-year trends in most regions; and (4) the proportion of regions with lagged effects of the GPP on meteorological factors is higher than those with cumulative effects in China. Among these, GPP exhibits a higher proportion of a 3-month lagged response to precipitation, which is particularly pronounced at altitudes between 500 and 2500 m and above 5500 m. the proportion of the areas with no lag cumulative response to temperature and radiation with GPP in China is the highest due to the influence of more barren land and grassland in the northwest interior. Simultaneously, grassland and barren land have a higher proportion of the non-lagged cumulative responses to temperature and precipitation. This study contributes to our understanding of vegetation dynamics in the context of global climate change and provides a theoretical foundation for regional ecological conservation and high-quality coordinated development.

1. Introduction

According to the Fifth Assessment Report of the IPCC, the global average surface temperature increased by 0.85 °C from 1880 to 2010 [1]. The temperature rise has led to significant changes in regional rainfall amounts and frequencies, further resulting in the occurrence of numerous extreme weather events [2,3,4]. As a vital component of the terrestrial ecosystems, vegetation plays a crucial role in the carbon–water cycle and is the most direct reflection of the natural landscapes [5]. The existing research indicates that vegetation covers 20% of the Earth’s surface, and the growth of the vegetation is highly sensitive to regional climate changes [6]. Therefore, studying the response of the regional climate change to long-term changes in vegetation, based on remote-sensing monitoring, has become a hot topic in research, and research related to this is of significant importance for understanding the mechanisms of the vegetation ecosystems [7,8,9].
Climate, either directly or indirectly, regulates heat, moisture, and nutrients, impacting the growth and coverage of the vegetation [10,11]. When the climate changes, the structural and physiological changes in vegetation affect canopy conductance, latent heat flux, and surface albedo. Subsequently, the exchange of the energy between the land and the atmosphere further influences vegetation dynamics [12,13,14]. Matin et al. (1993) summarized the analysis methods for exploring the impact of the climate factors on vegetation changes, which mainly include deductive, correlation, and biophysical methods [15]. Relevant scholars have carried out extensive research on the response of vegetation to climate at regional and global scales. Del Grosso et al. compiled approximately 5600 global data points using regression models and estimated the global vegetation net primary productivity using climate and land-cover data. The results indicate that, compared to temperature, precipitation has a stronger global correlation with vegetation net primary productivity, and precipitation explains larger annual productivity variations in grassland- or shrubland-dominated systems than in forest-dominated systems [16]. Prasad et al. extracted Normalized Difference Vegetation Index (NDVI) values and corresponding environmental variables from 23 different forest sites in India. They employed the partial least-squares multiple-regression method to emphasize the control of climate on the vitality of the local evergreen forest vegetation. Their findings suggest that indices combining temperature and precipitation have a more significant positive impact on local vegetation compared to bioclimatic indices that rely solely on precipitation parameters [17]. Obuchowicz et al.’s study on vegetation in Switzerland found that NDVI had a low correlation with precipitation, while temperature was the main driving factor [18].
Vegetation and ecosystems often require time to adapt to new climate conditions or environmental changes [19]. For instance, when climate change leads to rising temperatures or altered precipitation patterns, vegetation may need some time to adapt to these new conditions. Therefore, the response of the vegetation to climate is not always immediate; the life cycles of plants, their reproductive periods, and ecological processes within populations can all contribute to lagged effects [20,21]. Ding et al. considered the lagged and cumulative effects of the vegetation on meteorological factors and found that, compared to temperature, precipitation and solar radiation exhibit more significant temporal cumulative effects throughout the vegetation growing season. Additionally, these effects differ during the growth and senescence stages of the vegetation in the high-latitude regions of the Northern Hemisphere [22]. Ma et al. found that the monthly variation in GPP in the Arctic North is mainly determined by the spatial distribution of the meteorological factors and shows different time lags for different meteorological factors [23]. Feng et al. analyzed the relationship between vegetation and precipitation in the Mara River Basin at a seasonal scale and found that the local vegetation lags behind the peak of precipitation by an average of 35.5 days [24]. Ma’s research found that, in Northern China, vegetation coverage exhibits significant temporal cumulative effects in response to meteorological factors, and the primary temporal influence of the climate factors on vegetation coverage is a 0-month lag or a 1–2-month cumulative effect [25]. Furthermore, related studies have shown that ecosystems exhibit significant dependencies in their lag effects on climate [26]. These lag effects mitigate the adverse impacts of the extreme weather and provide sufficient recovery time for vegetation [27,28], playing a crucial role in the growth and carbon balance of the terrestrial ecosystems.
As a significant participant in the field of the global climate change, China, one of the world’s most populous countries, is committed to maintaining ecological balance and adapting to future climate changes. In 2021, China announced its dual-carbon goals during the United Nations General Assembly debate. We understand that vegetation plays a vital role in carbon storage and CO2 absorption. Furthermore, the process of the vegetation absorbing CO2 from the atmosphere is not instantaneous, as it takes time to grow and absorb, storing carbon within the plant’s structure. The Gross Primary Productivity (GPP) refers to the overall rate at which plants in an ecosystem convert solar energy into organic matter, typically in the form of carbon. The GPP reflects the total amount of captured and fixed light energy in the entire plant community [29,30]. A comprehensive study of the distribution characteristics of GPP in China and its response to climate change is of particular importance. This helps in evaluating China’s carbon balance and provides a scientific basis for formulating policies to mitigate climate change.
Therefore, the objectives of this study were as follows: (1) to elucidate the spatiotemporal patterns of the GPP and various meteorological factors in different regions of China from 2000 to 2018; (2) to investigate the spatial distribution of lag effects of GPP concerning important meteorological factors; and (3) to quantitatively analyze the response characteristics of the GPP to meteorological elements in different regions and land-use types.

2. Materials and Methods
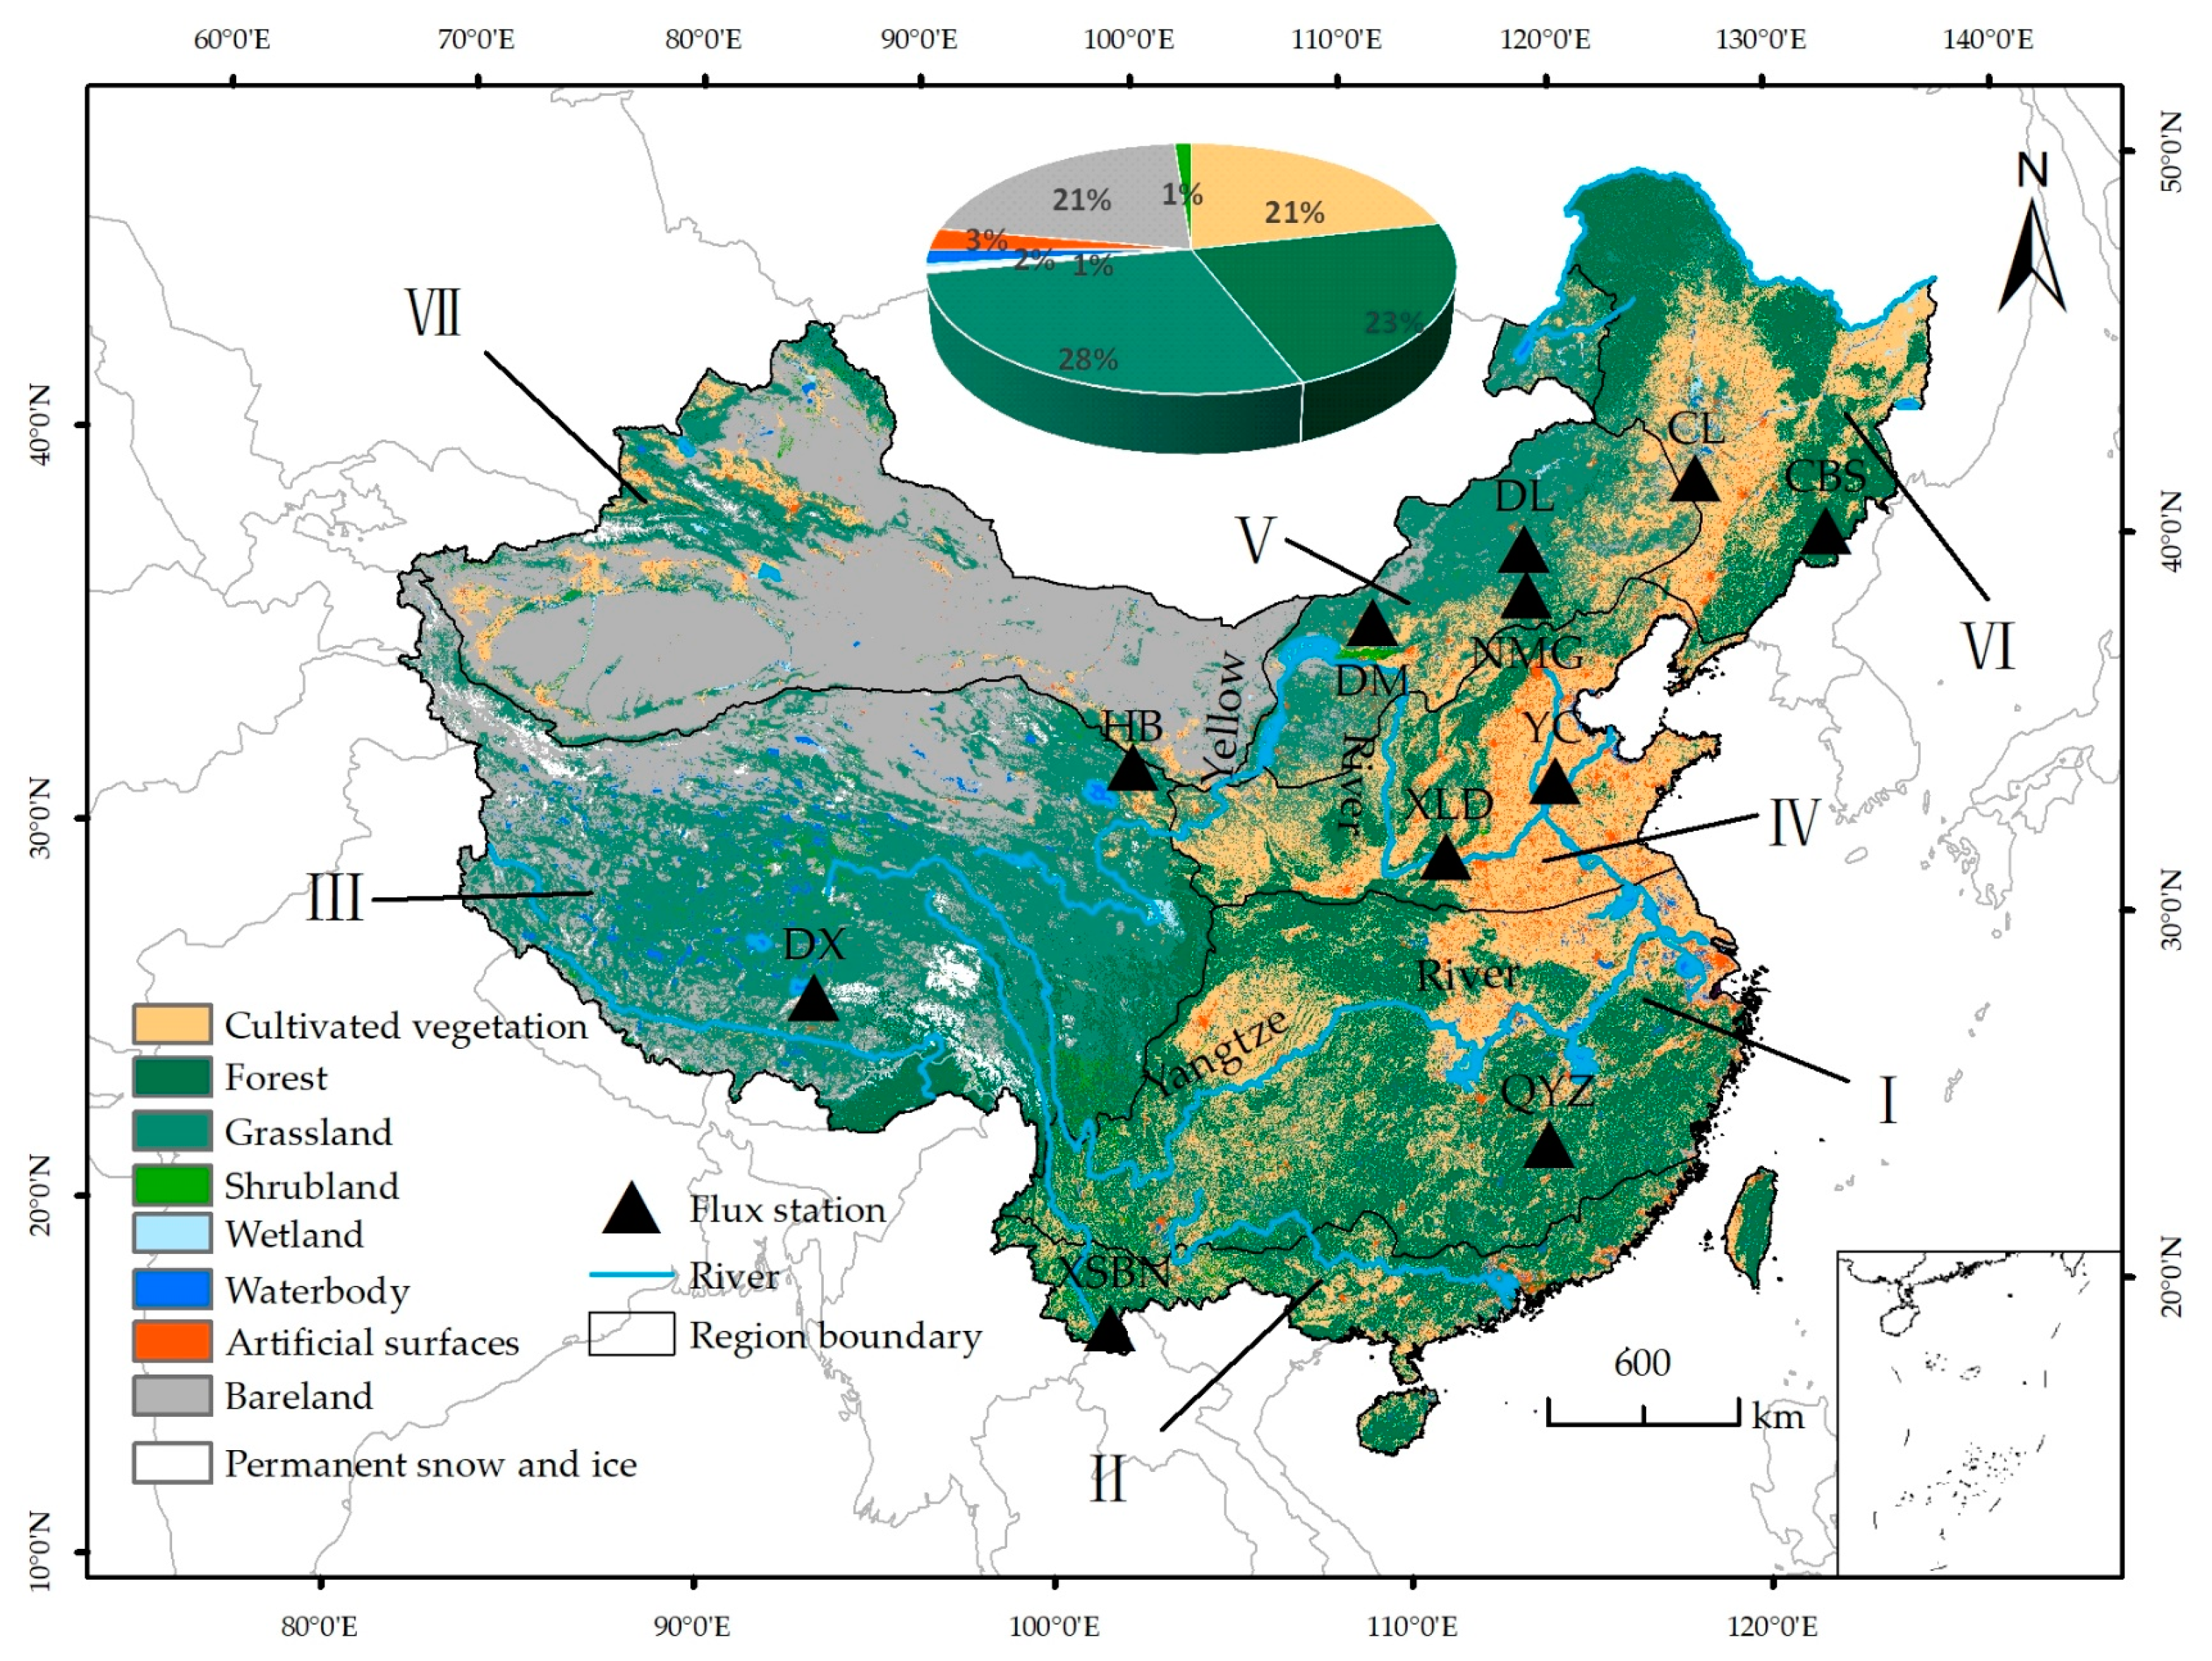
2.1. Study Area

China has a wide north–south span, with diverse topography, climate, and ecosystems (Figure 1). Mountains, plateaus, and hills cover approximately 67% of the land area, while basins and plains account for about 33% of the land. The highest plateau is the Tibetan Plateau, with an average elevation of 4000 m. The lowest plateau is located in Eastern China, adjacent to the ocean. The eastern region of China is influenced by monsoons, with moist maritime monsoons bringing rainfall in the summer and dry continental monsoons affecting it in the winter. The intensity and direction of the monsoons result in significant climate differences between Eastern and Western China. Annual precipitation decreases gradually from over 2000 mm·yr−1 along the southeastern coast to less than 100 mm·yr−1 in the northwestern inland areas. In recent decades, varying climate conditions in different regions have significantly influenced vegetation types and growth, ultimately leading to regional differences in China’s land-based vegetation carbon sink. To illustrate the spatial heterogeneity of vegetation dynamics in response to climate change, we divided China into seven major regions based on the study by Zhao et al. [31]: the North Subtropical Humid Region (Region I), Edge Subtropical Humid Region (Region II), Plateau Temperate Semi-Arid Region (Region III), Warm–Temperate Semi-Humid Region (Region IV), Temperate Semi-Arid Region (Region V), Temperate Semi-Humid Region (Region VI), and Temperate Arid Region (Region VII).

2.2. Dataset and Preprocessing

The dataset information used in this study is shown in Table 1. For ease of the overlay processing, the dataset’s resolution was uniformly resampled to 500 m, using ArcGIS 10.7 software.
Among them, the GPP remote-sensing data are derived from MODIS and PML, with a temporal resolution of 8 days and a spatial resolution of 500 m. GPP_MODIS utilizes the concept of light-use efficiency, which estimates GPP as the product of incoming photosynthetically active radiation, the fraction of the photosynthetically active radiation absorbed by plants, and the actual light-use efficiency of vegetation [32]. The PML-V2 model, building upon previous versions, incorporates vapor pressure deficit (VPD) to further improve accuracy on a global scale [33]. ERA5 is a global land-surface meteorological dataset developed by the European Centre for Medium-Range Weather Forecasts (ECMWF) [34,35]. Due to its high temporal and spatial resolution and global coverage, the ERA5 dataset is widely used in various climate studies, hydrological simulations, and environmental monitoring [36,37]. This dataset includes multiple meteorological variables, with a temporal resolution of hourly and a spatial resolution of 0.1 degrees. Furthermore, this paper takes the average temperature and the sum of precipitation and radiation to explore the impact of meteorological variables on GPP. GlobeLand30 is the world’s first land-cover dataset with a spatial resolution of 30 m. The land types include forests, shrublands, grasslands, farmland, tundra, water bodies, wetlands, artificial surfaces, bare land, and permanent ice and snow. It is worth noting that we employed a masking approach to extract regions where the vegetation type remained unchanged between 2000 and 2020. This allowed us to investigate the lag effects of different land-use and land-cover changes (LUCCs).
Additionally, we utilized carbon-flux observation data from the ChinaFLUX Observation Network (https://fluxnet.org/ (accessed on 17 November 2023)) to assess the accuracy of the GPP estimates for China, derived from the PML_V2 and MODIS products at 8-day and annual scales. Information about the flux stations used in this study is listed in Table 2.

2.3. Methods

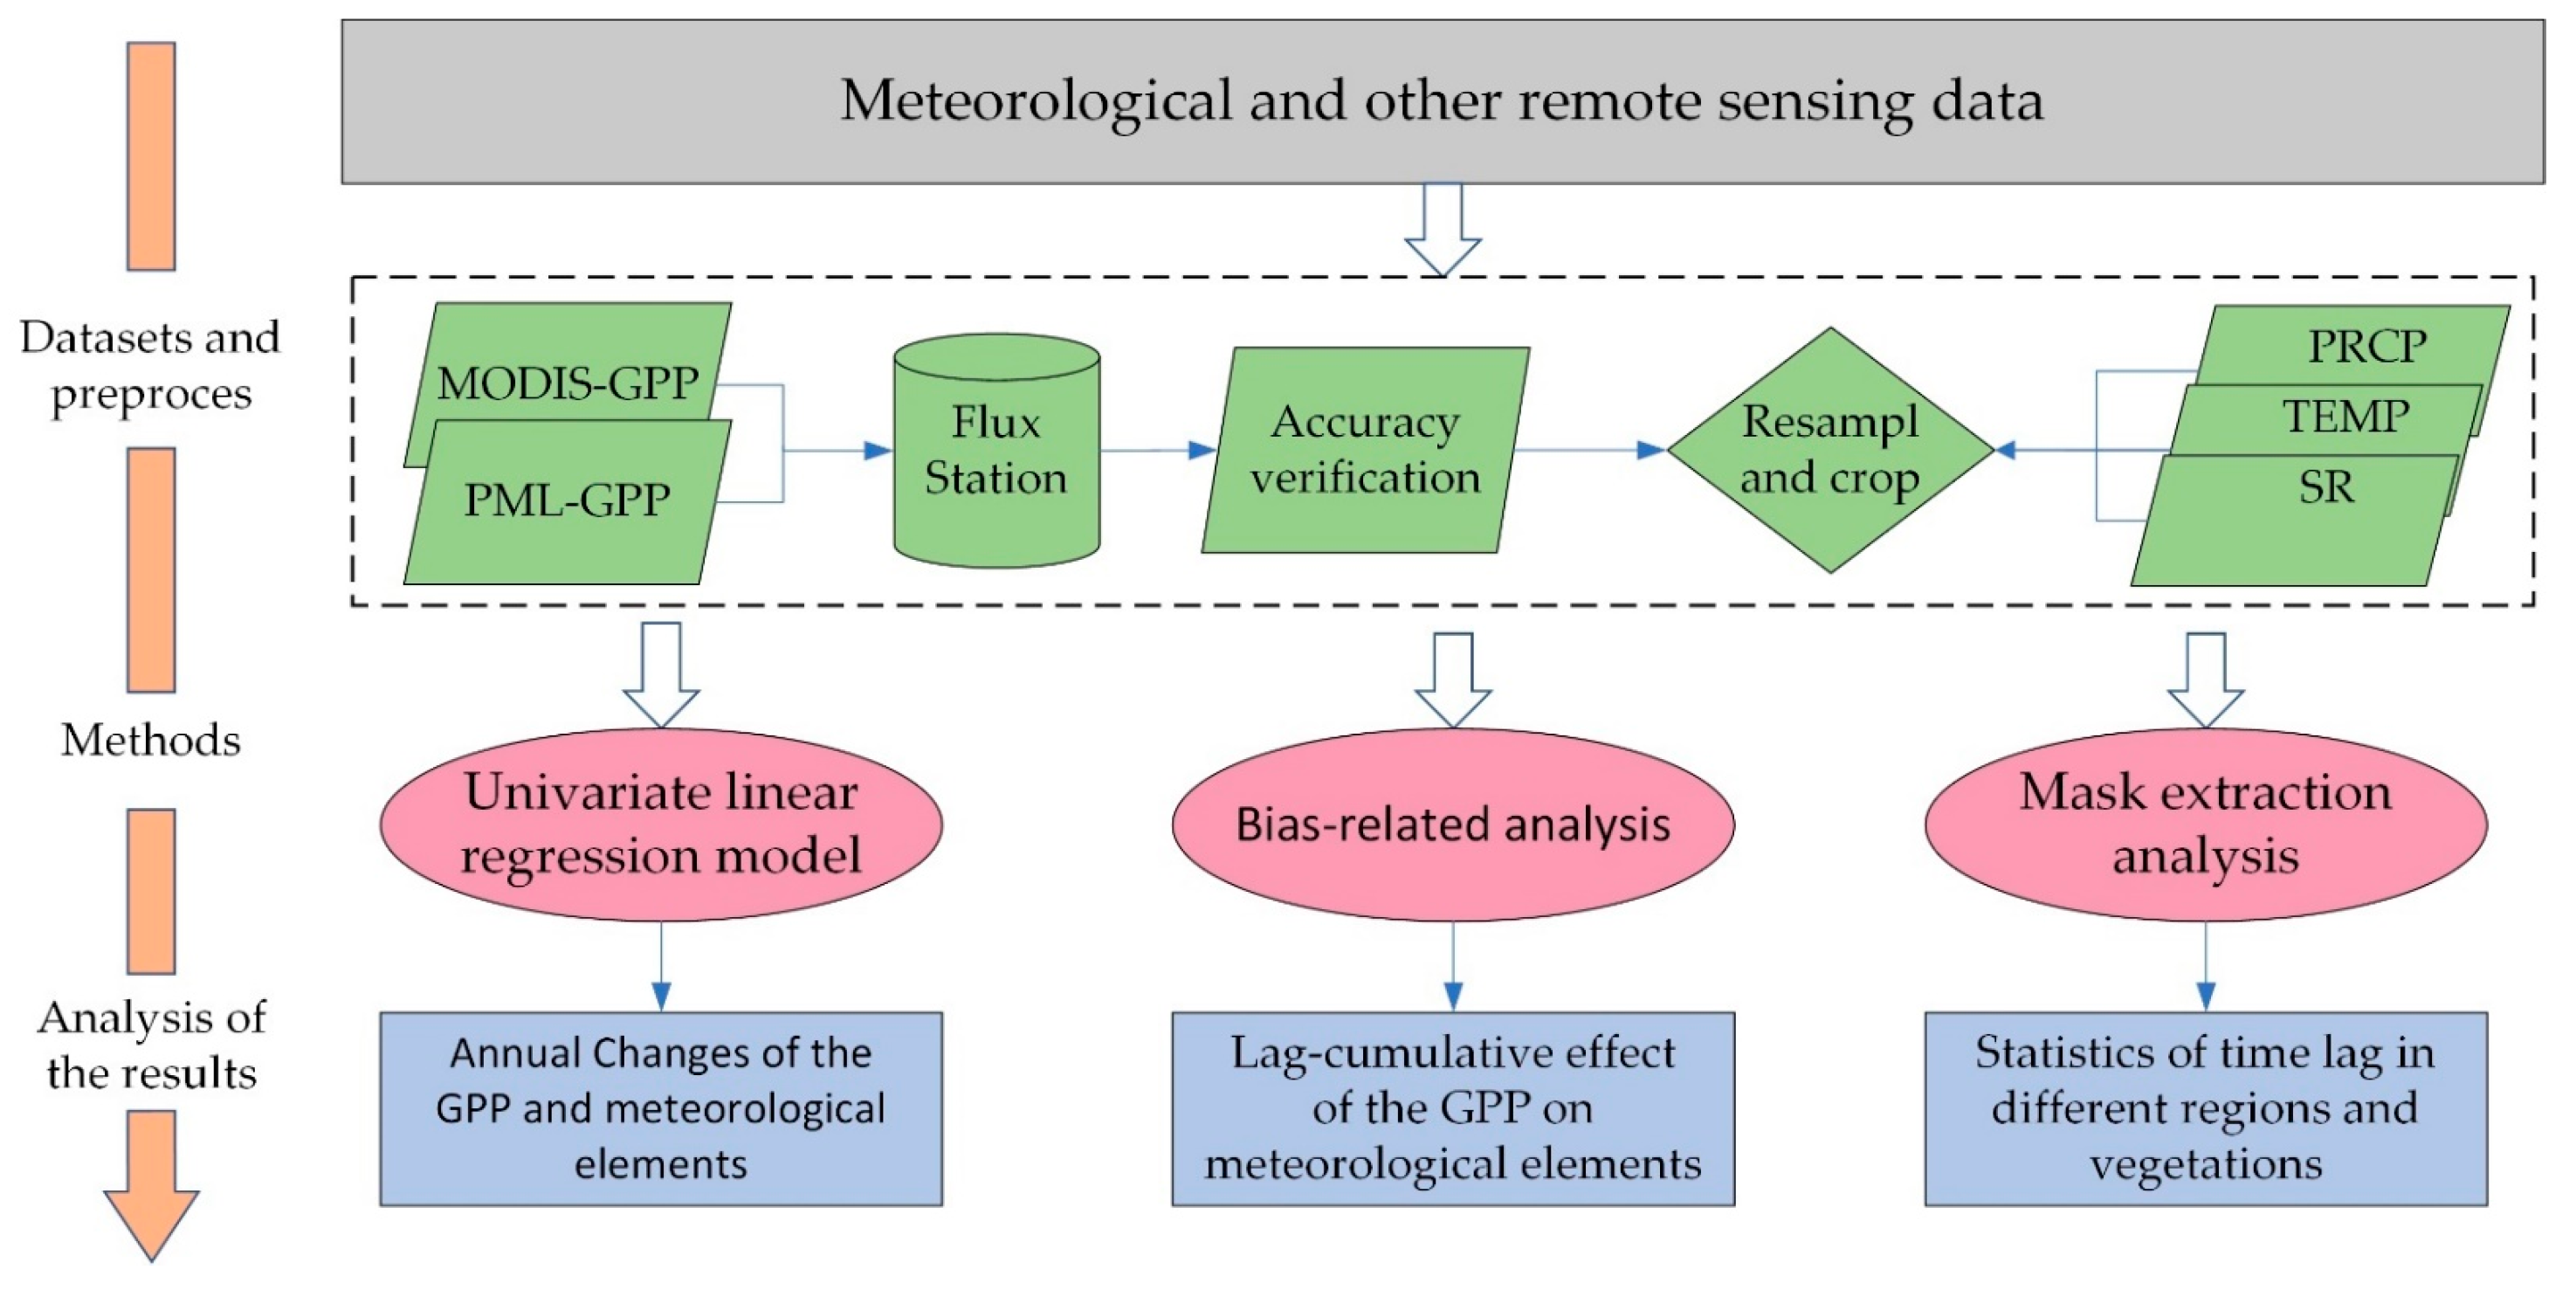
2.3.1. Overall Methodology

The overall workflow of this paper is presented in Figure 2.

2.3.2. GPP Product Accuracy Assessment

For the validation of the large-scale remote-sensing products, there is a lack of the more effective methods, and station data remain a crucial basis for the validating remote-sensing products [38,39]. While many GPP products have been validated in previous studies within various regions, there has been limited validation of GPP products specific to China [40,41]. Therefore, this article is based on the daily GPP observations from 11 flux sites in the ChinaFLUX observation network, further aggregated to an 8-day scale. To mitigate the impact of the data noise, geometric mismatch, and spatial heterogeneity on validation results, a 3 × 3 pixel mean filter mask was generated using the site center coordinates. This mask was used to extract values from PML-V2 and MODIS remote-sensing products at corresponding locations and compare them to the site’s values to demonstrate their reliability and acceptability for subsequent analysis. The accuracy evaluation metrics include the determination coefficient (R2) and the root mean squared error (RMSE).
The R2 can assess the goodness of fit of a regression line to the observed values. The range of the R2 values is from 0 to 1, and the closer R2 is to 1, the higher the goodness of fit of the linear regression line to the observed values. The formula for calculating R2 is as follows:
R 2 = 1 i = 1 n ( x i P ( x i ) ) 2 i = 1 n ( x i x i ¯ ) 2 ,
The RMSE can reflect the accuracy of a simulation and can assess the degree of deviation between simulated values and measured values. The formula for calculating RMSE is as follows:
R M S E = i = 1 n ( P ( x i ) x ¯ i ) 2 n ,
where P x i and x i , respectively, represent the product GPP value and the site value at the ith time point; n denotes the total number of time intervals; and x i ¯ represents the average value of site values.

2.3.3. Calculation of Linear Slope

The linear regression model’s slope is used to characterize the annual rate of change in the GPP and meteorological elements from 2000 to 2018. The calculation formula is as follows:
S l o p e = n × i = 1 n i × X i i = 1 n i i = 1 n X i n × i = 1 n i 2 ( i = 1 n i ) 2 ,
where i represents the year, with values ranging from 1 to 19; X i is the average GPP value for the ith year; n represents the total number of years, which is 19 in this study; and S l o p e represents the pixel-wise change in GPP. When S l o p e > 0 is positive, X increases; when S l o p e < 0 is negative, X decreases. Then, we use a t-test to examine the significance of the annual trend in GPP. When p < 0.05, it indicates a statistically significant interannual trend, and when p < 0.01, the trend is considered highly significant.

2.3.4. Lag Analysis Method

The optimal time lag of GPP with respect to climate factors is determined by calculating the maximum lag coefficient through partial correlation analysis. Partial correlation analysis is a method used to measure the degree of correlation between two random variables, while controlling for the influence of a set of control variables [42]. This type of analysis helps uncover spurious correlations and reveal hidden relationships. The past experience has shown that the time lag of vegetation response to climate at the monthly scale is typically less than a quarter of the full year [43,44]. Therefore, this study selected a time-lag range of 0–3 months to investigate the response of GPP to climate factors, expressed as follows:
r 1 ( k 1 ) = max ( r k ( x , y ) ) r 2 ( k 2 ) = min ( r k ( x , y ) ) { R = r 1 , K = k 1 | r 1 | > | r 2 | R = n u l l , K = n u l l | r 1 | = | r 2 | R = r 2 , K = k 2 | r 1 | < | r 2 |
where r1 and r2 represent the maximum and minimum correlation coefficients of the GPP with climate variables, respectively; and R and K represent the optimal correlation coefficient and time lag of the GPP response to climate variables.

3. Results

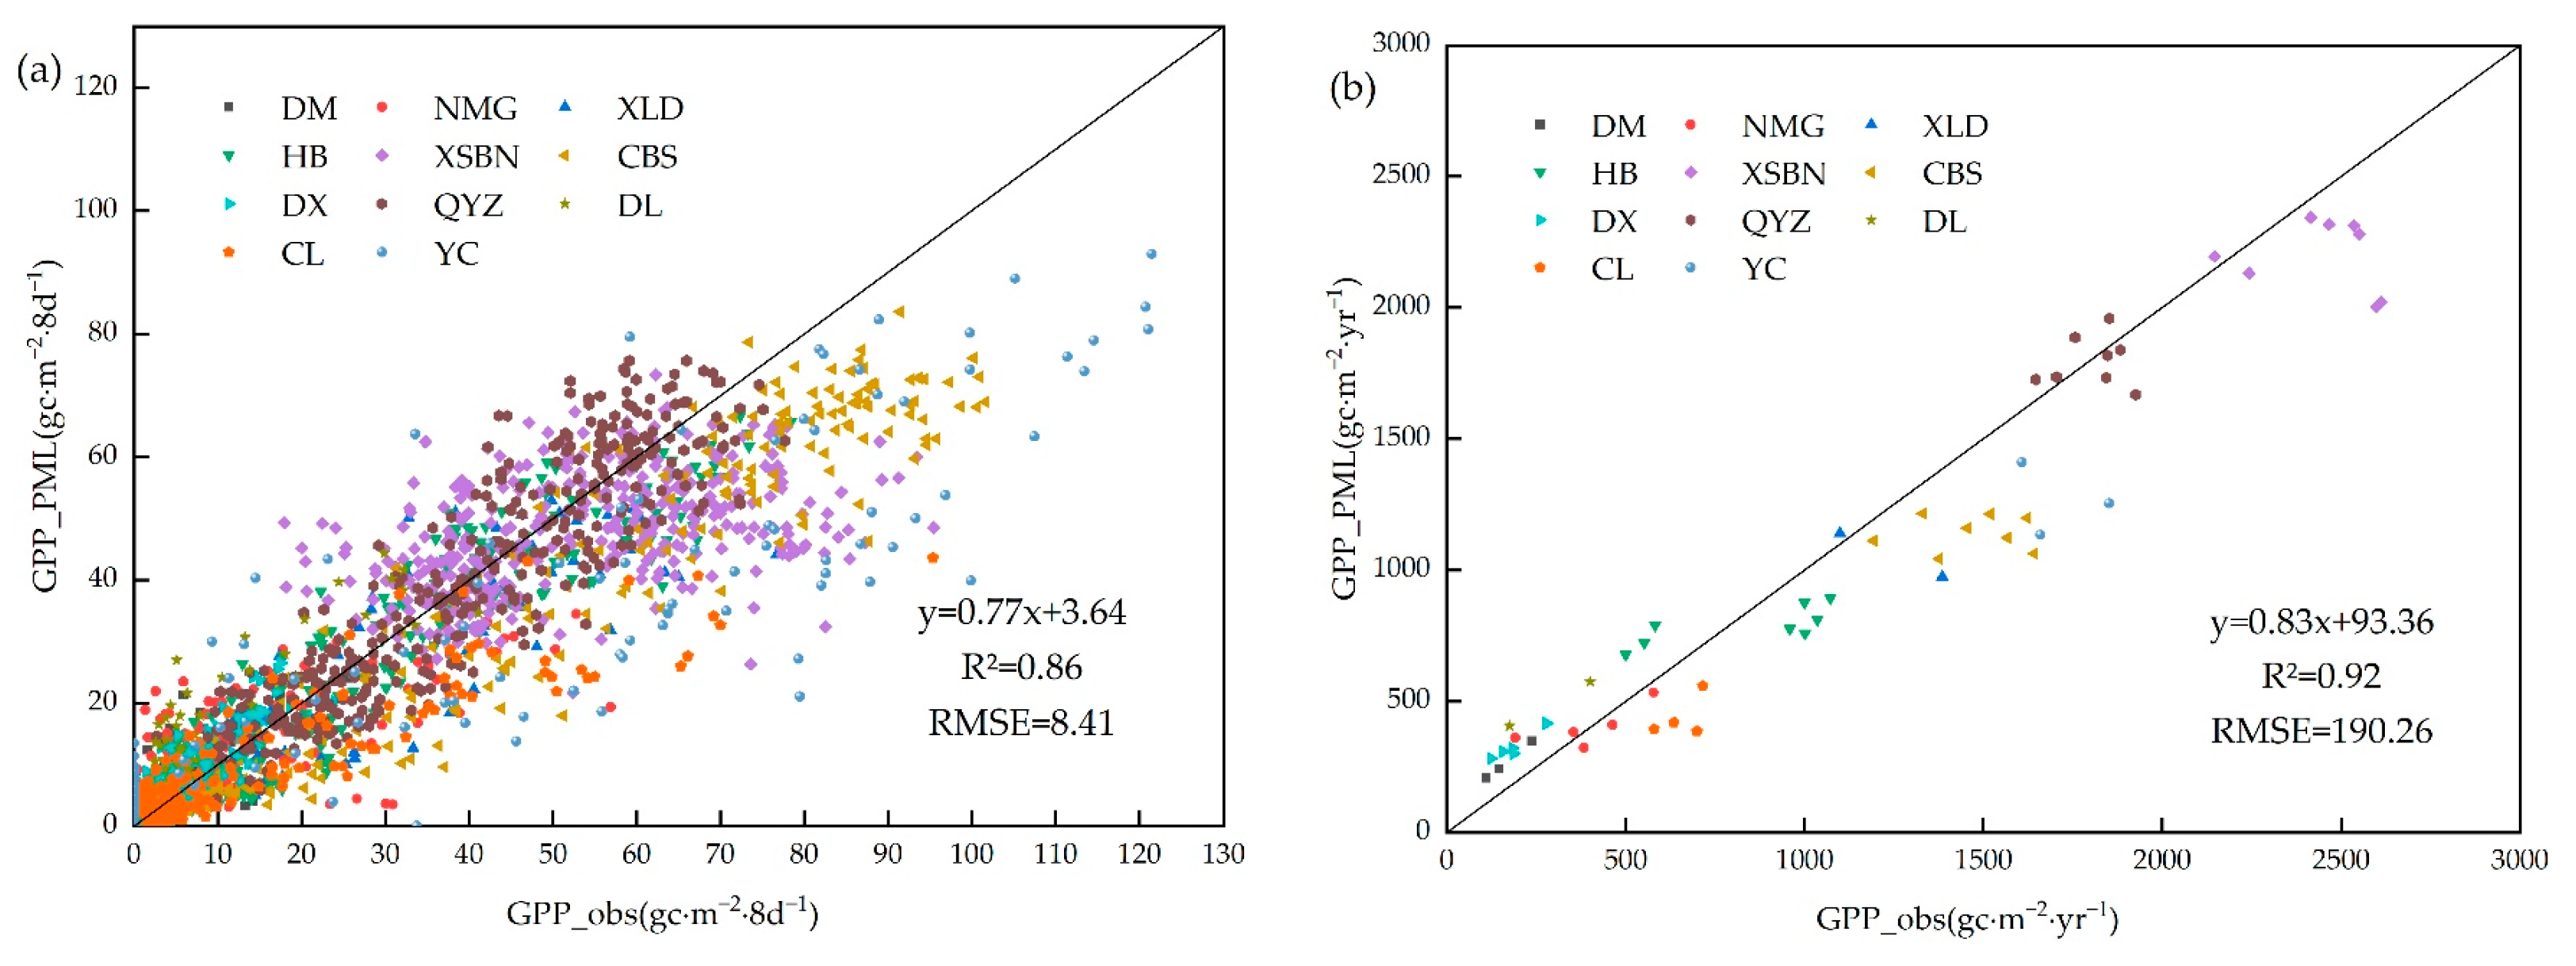
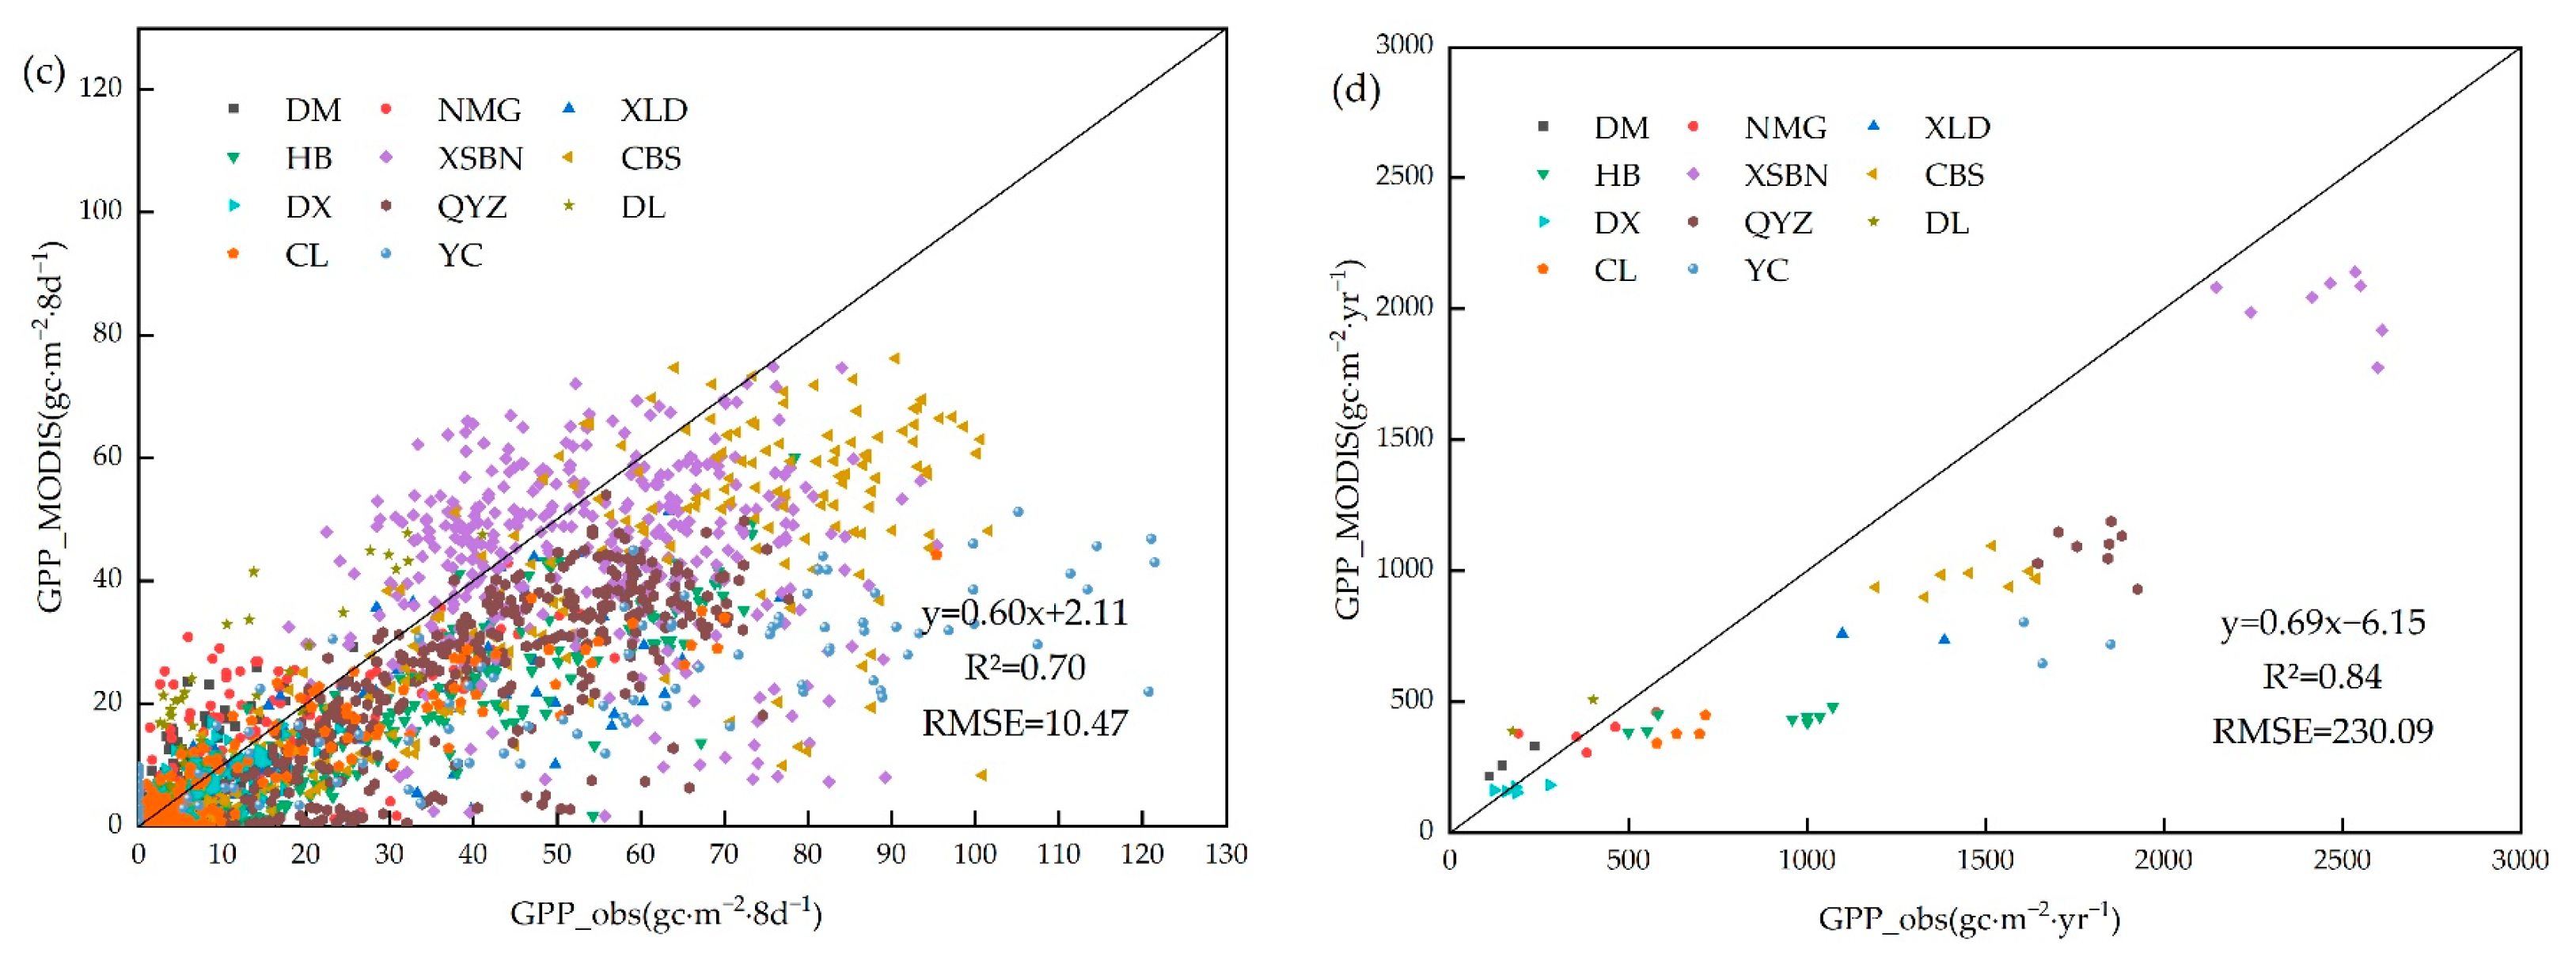
3.1. GPP Product Accuracy Validation

By comparing the observations from 11 flux sites with the average GPP values within a 3 × 3 grid of the adjacent pixels centered around the geographic location of the flux station (Figure 3). It can be observed that, on an 8-day scale, the R2 values for GPP_PML and GPP_MODIS are calculated as 0.86 and 0.70, respectively, with RMSE values of 8.41 gc·m−2 and 10.07 gc·m−2. On an annual scale, the R2 values for GPP_PML and GPP_MODIS are 0.92 and 0.84, respectively, with RMSE values of 190.26 gc·m−2 and 230.09 gc·m−2. Compared to GPP_PML, GPP_MODIS products exhibit lower R2 and RMSE values, with noticeable underestimation at sites like Changbai Mountain and Yucheng. The GPP_PML performs slightly better than GPP_MODIS at the 8-day scale, especially with estimates closer to the measured values at sites like Xiaolangdi, Qianyanzhou, and Inner Mongolia. Therefore, the subsequent analysis of the spatial and temporal distribution characteristics of the GPP in China and its response to climate factors was based on the GPP_PML product.

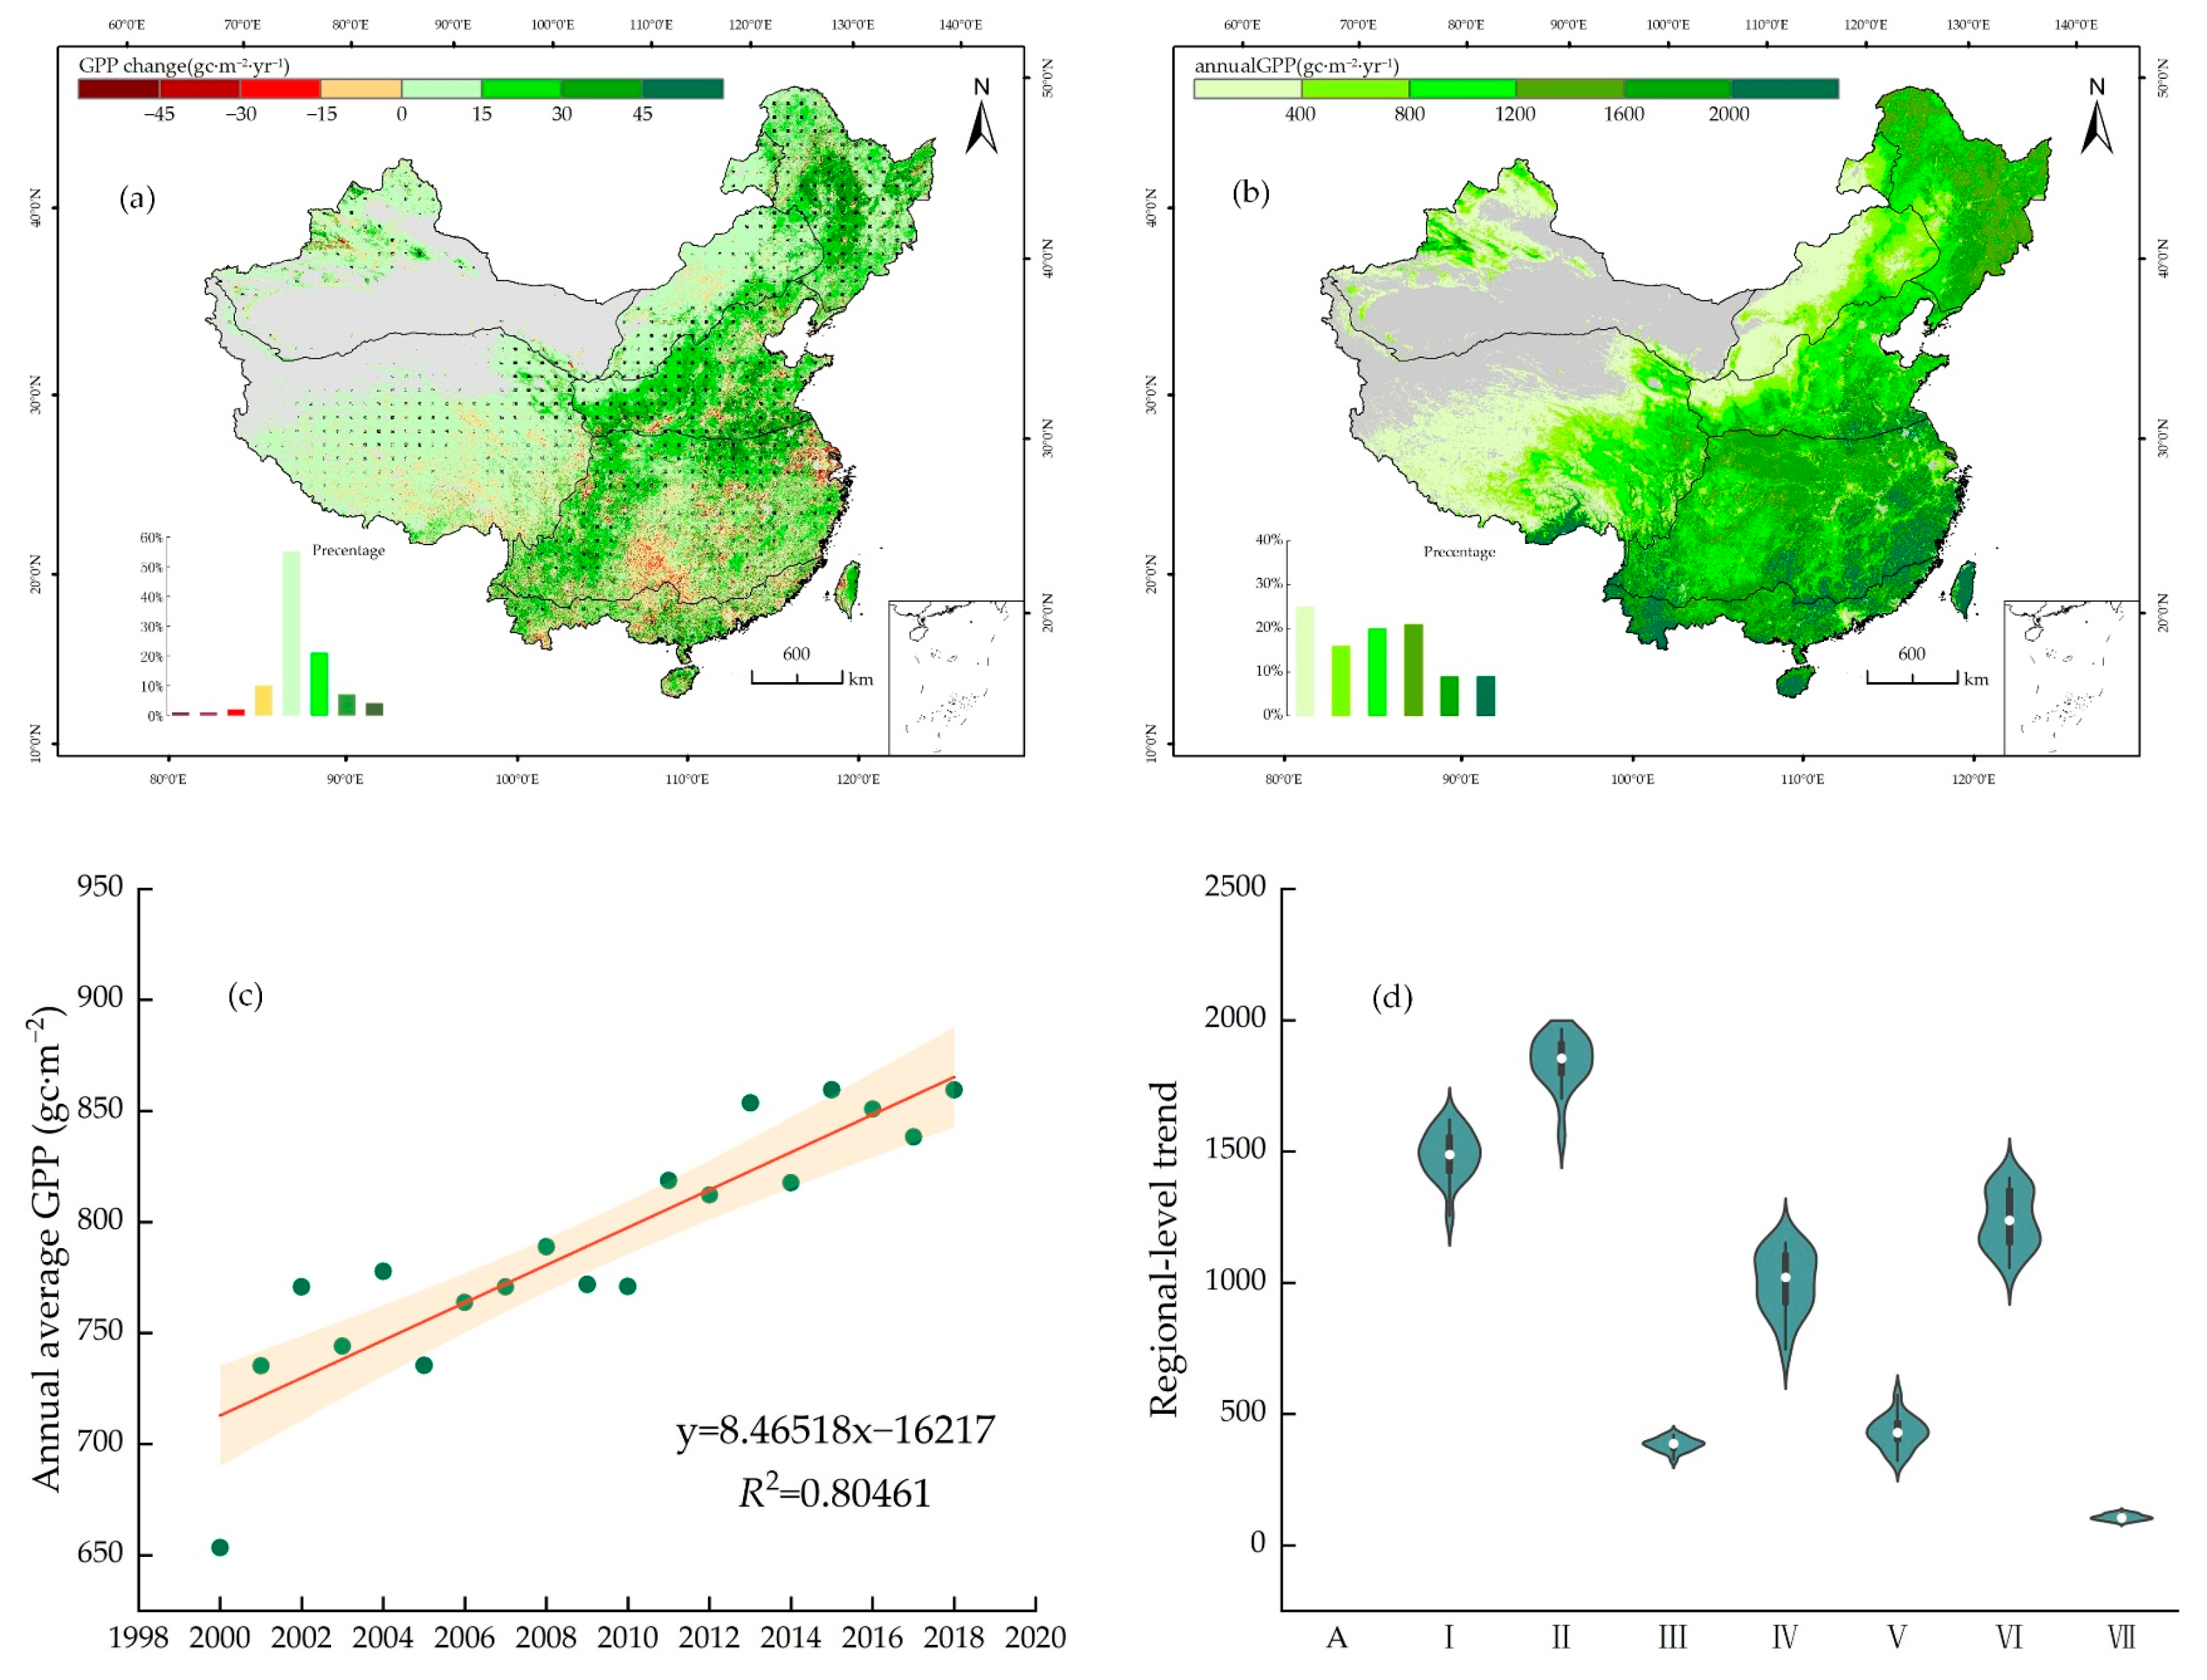
3.2. Temporal and Spatial Variations in GPP

Figure 4a depicts the spatial pattern of the annual GPP changes. Regions with a significant increase in GPP (p > 0.05, Slope > 0) account for 31.47% of China’s total area, with 41.62% of those regions (concentrated in Regions IV and V) exhibiting highly significant increasing trends (p < 0.01, Slope > 1). However, the GPP decreased in 2.36% of land areas, primarily concentrated in Regions I and III. Over the period from 2000 to 2018, the rate of change in China’s annual vegetation production was 8.46 gc·m−2·yr−1 (Figure 4c), and the multi-year average shows a clear gradient of increasing values from the northwest inland to the southeast coastal areas (Figure 4b), indicating substantial carbon sequestration potential in China’s inland regions. Based on the explicit statistics of GPP changes in different regions (Figure 4d), the ranking of regional GPP change rates is as follows: II > I > VI > IV > V > III > VII.

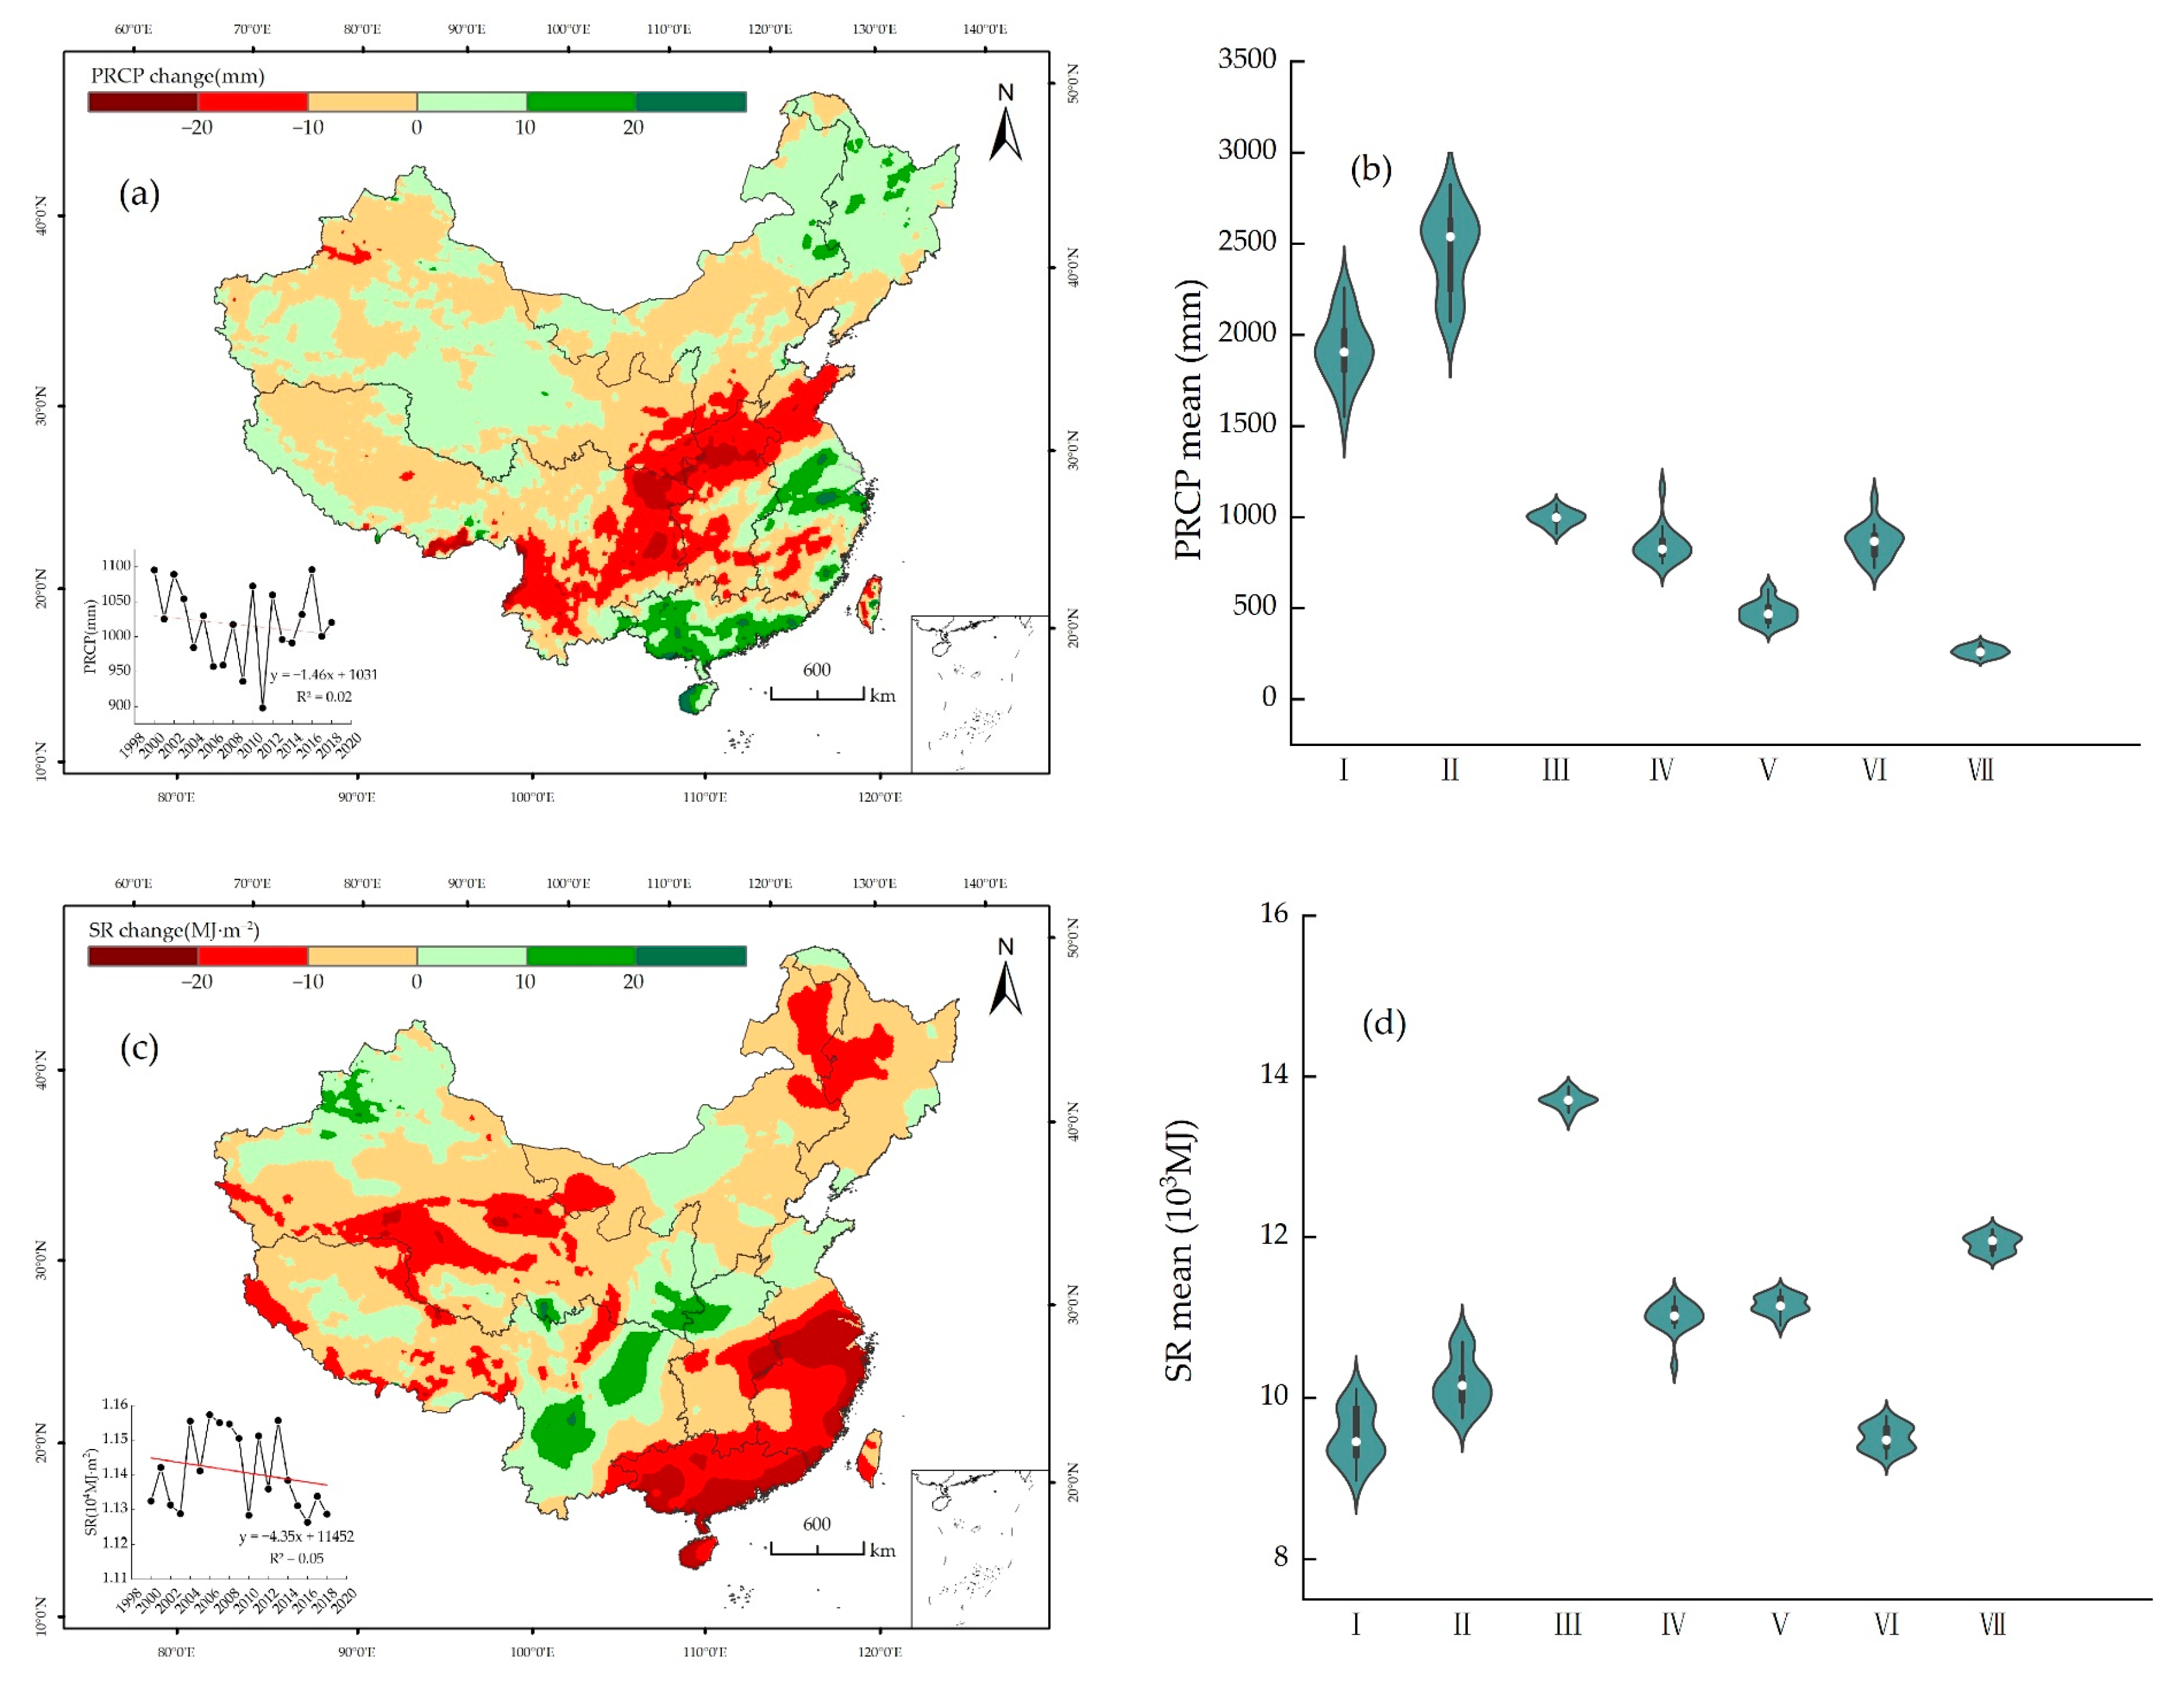
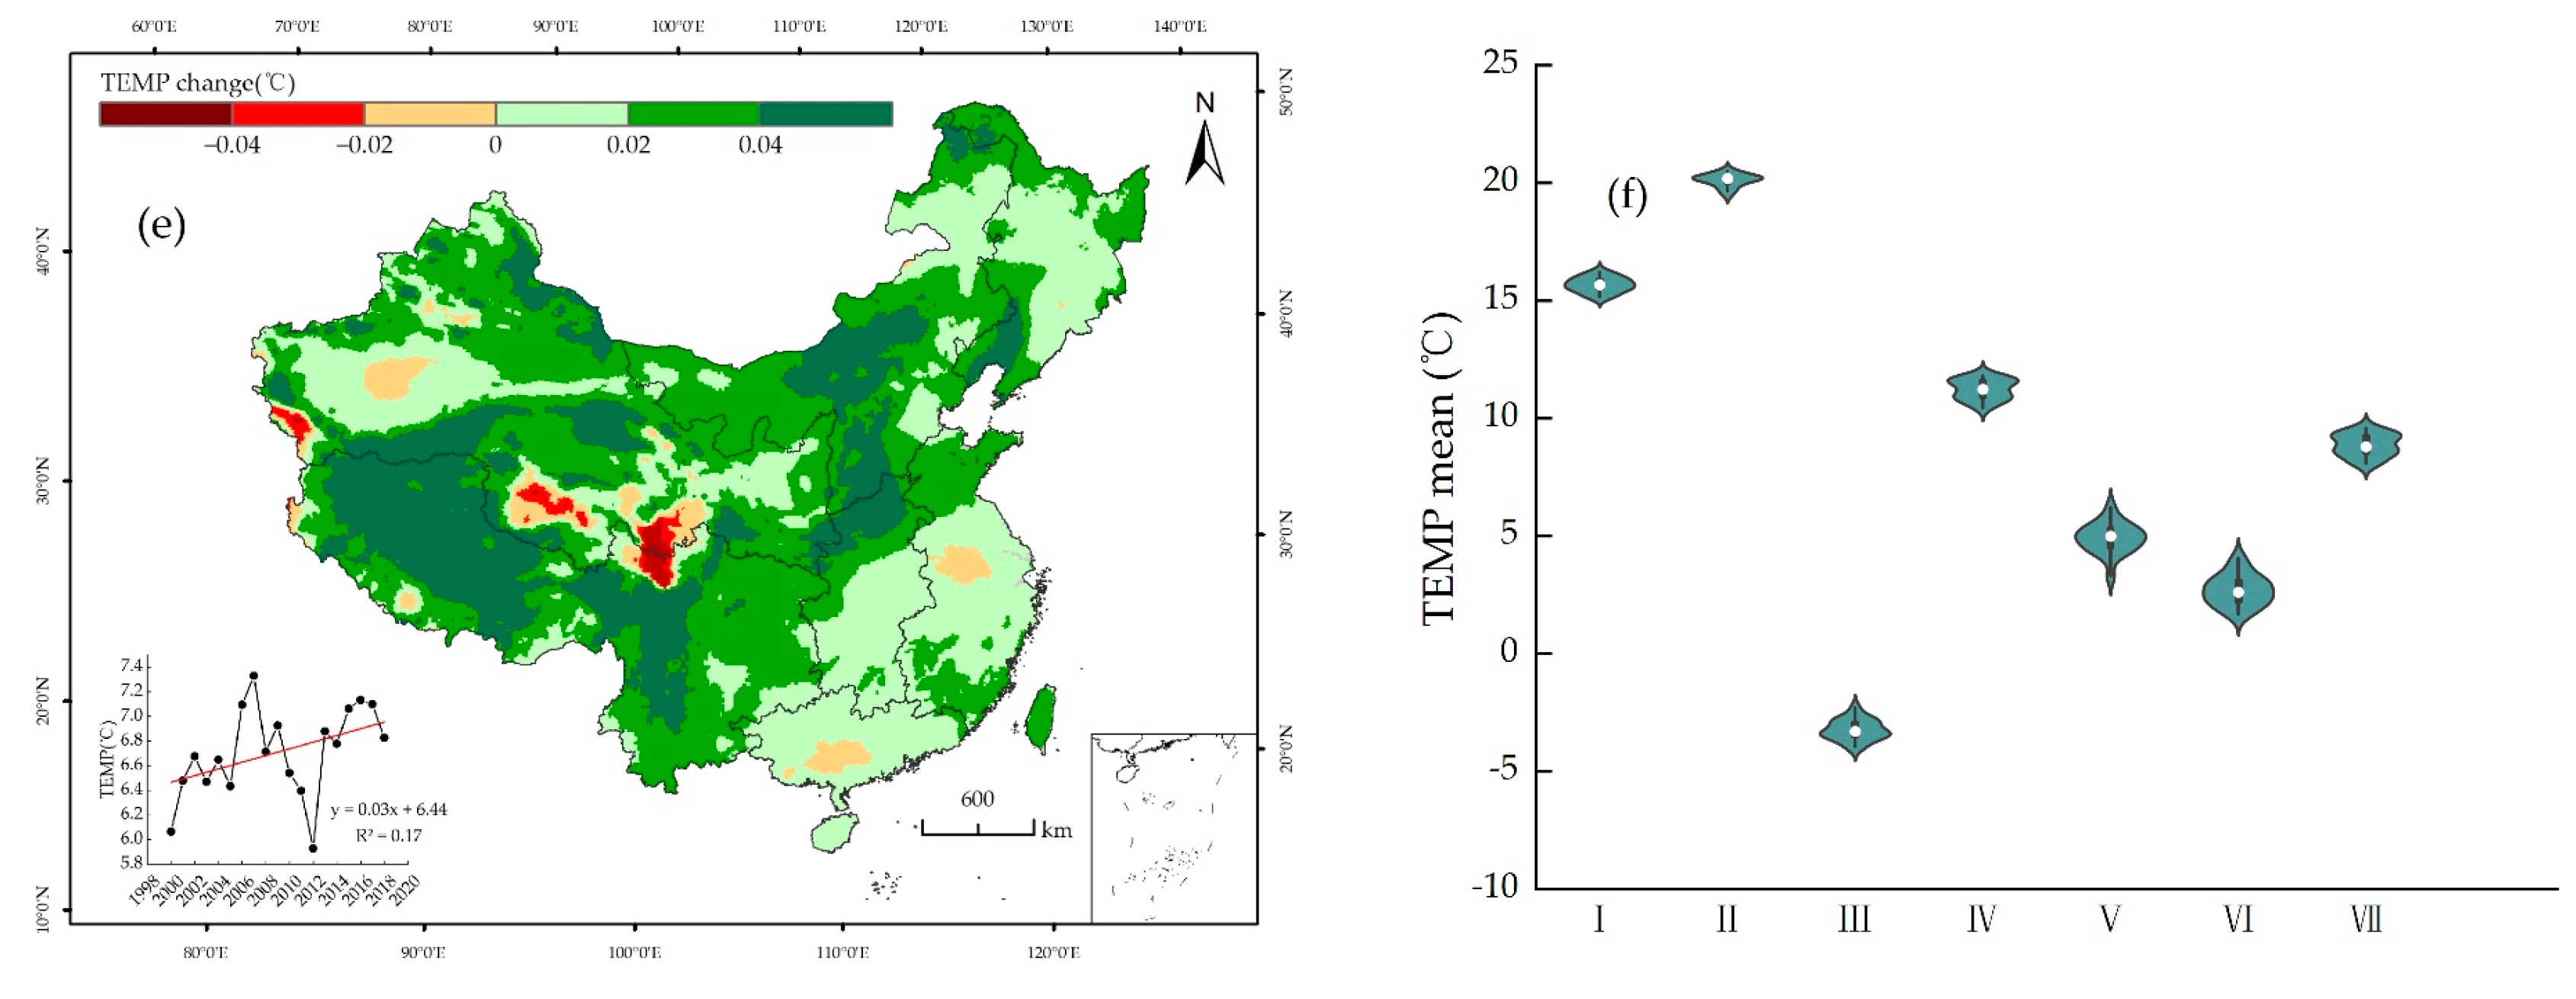
3.3. Temporal and Spatial Characteristics of the Meteorological Variables

There were significant spatial heterogeneities in the distribution of the meteorological variables during the period from 2000 to 2018 (Figure 5). The temperature showed an overall increasing trend with a multi-year average rate of 0.03 °C, while precipitation and radiation decreased, with annual average decreasing rates of 1.46 mm and 4.35 MJ·m−2, respectively. Specifically, the temperature reached its peak in 2007 during the study period, with a national average of 7.33 °C, and then slightly declined, reaching its lowest point in 2012 (5.93 °C). The spatial distribution pattern is characterized by higher temperatures in the south and lower temperatures in the north. Region II consistently had the highest temperatures during the study period, with a multi-year average of 20.12 °C, followed by Region I (15.68 °C), while Region III had lower average temperatures (−3.24 °C). Special geographical locations and climate conditions may contribute to this variation, but Region III has shown a noticeable increase in temperatures in recent years, with an average annual increase of 0.04 °C. At the same time, Regions I, II, and III also exhibit some degree of decreasing trends. Precipitation, on the other hand, displays an overall fluctuating downward trend, reaching its lowest point in 2011 (897.69 mm). The spatial distribution pattern shows that the eastern and southeastern coastal areas receive more abundant rainfall, with a ranking of precipitation amount from highest to lowest in the seven regions as follows: II > I > III > VI > IV > V > VII. The ocean carries moist air into the inland regions, where it meets cold air, leading to rainfall. In contrast, the western regions are located further inland, making it challenging for maritime moisture to reach them. Additionally, these regions have extensive grasslands and deserts, contributing to drier conditions and serving as important factors causing regional differences in precipitation.
Looking at the trend of changes, Region V has an annual precipitation increase rate of 1.70 mm, while the other regions all experience varying degrees of decrease. It is noteworthy that Regions I and IV show more pronounced decreases in precipitation, with annual average decreasing rates of 14.26 mm and 5.48 mm, respectively. Radiation remained consistently high from 2006 to 2009, with the highest annual average occurring in 2006 (11,574.92 MJ·m2) and the lowest in 2016 (11,261.87 MJ·m2). The ranking of annual average radiation values among the seven regions, from highest to lowest, is as follows: III > VII > V > IV > II > I > VI. Regions III and VII consistently have higher multi-year radiation values.
Furthermore, at the pixel scale, this study found that, in the same region, the trends in precipitation and radiation from 2000 to 2018 were nearly opposite. Areas with increasing precipitation tend to have higher water vapor content in the air, and when sunlight shines, it gets refracted, resulting in less sunlight reaching the surface. Additionally, regions with higher rainfall tend to have thicker cloud cover, which leads to a greater weakening of solar radiation by the atmosphere, partly blocking sunlight. These factors might be significant reasons for the opposite multi-year trends in precipitation and radiation in many areas.

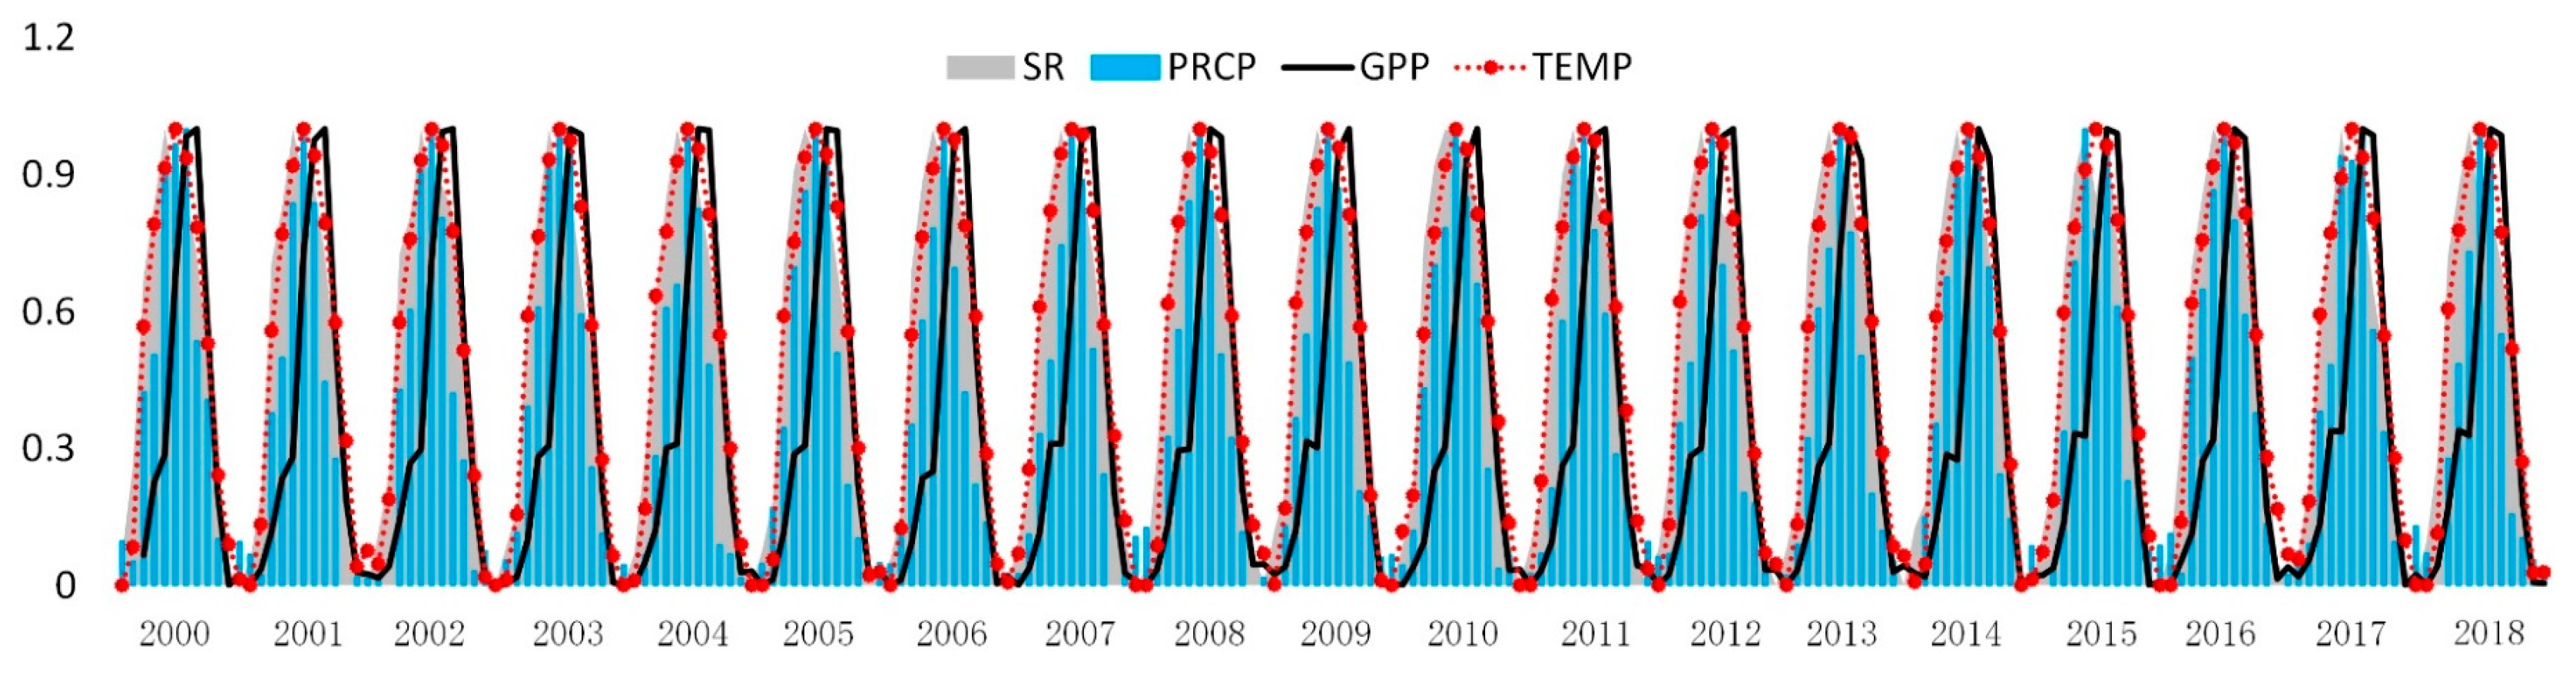
3.4. Time-Lag Response of the GPP to Meteorological Variables during the Vegetation Growing Season

Since the impact of the climate on vegetation photosynthesis is not immediate, this study focused on the lagged response of the China’s regional Gross Primary Productivity (GPP) to climate during the vegetation growing season from 2000 to 2018 (May to September). The detrended GPP and its periodic interactions with climate factors are represented by the monthly total GPP values and normalized monthly average temperature and precipitation values for China during 2000–2018 (Figure 6). Temperature, precipitation, and radiation fluctuations exhibit stable periodicity across the entire region. GPP fluctuations show trends similar to the meteorological factor curves, but the normalized GPP curve does not always align with the meteorological factors. A certain degree of delay compared to the meteorological factors can be observed over the entire study period. This serves as evidence of the lag effect in GPP response to meteorological factors.
By analyzing the correlation coefficients between GPP and meteorological variables within different time periods, specifically the lag and cumulative effects in the 0–3 months prior to the vegetation growing season, this study aimed to explore the sensitivity of GPP changes to climate variables. For example, a lag of 1-0 (one-month lag, zero-month accumulation) for a given year implies that the total GPP for May to September is correlated with meteorological variables for April to August. A lag of 1-1 (one-month lag, one-month accumulation) means that the GPP for May to September is correlated with meteorological variables for March and April to July and August.

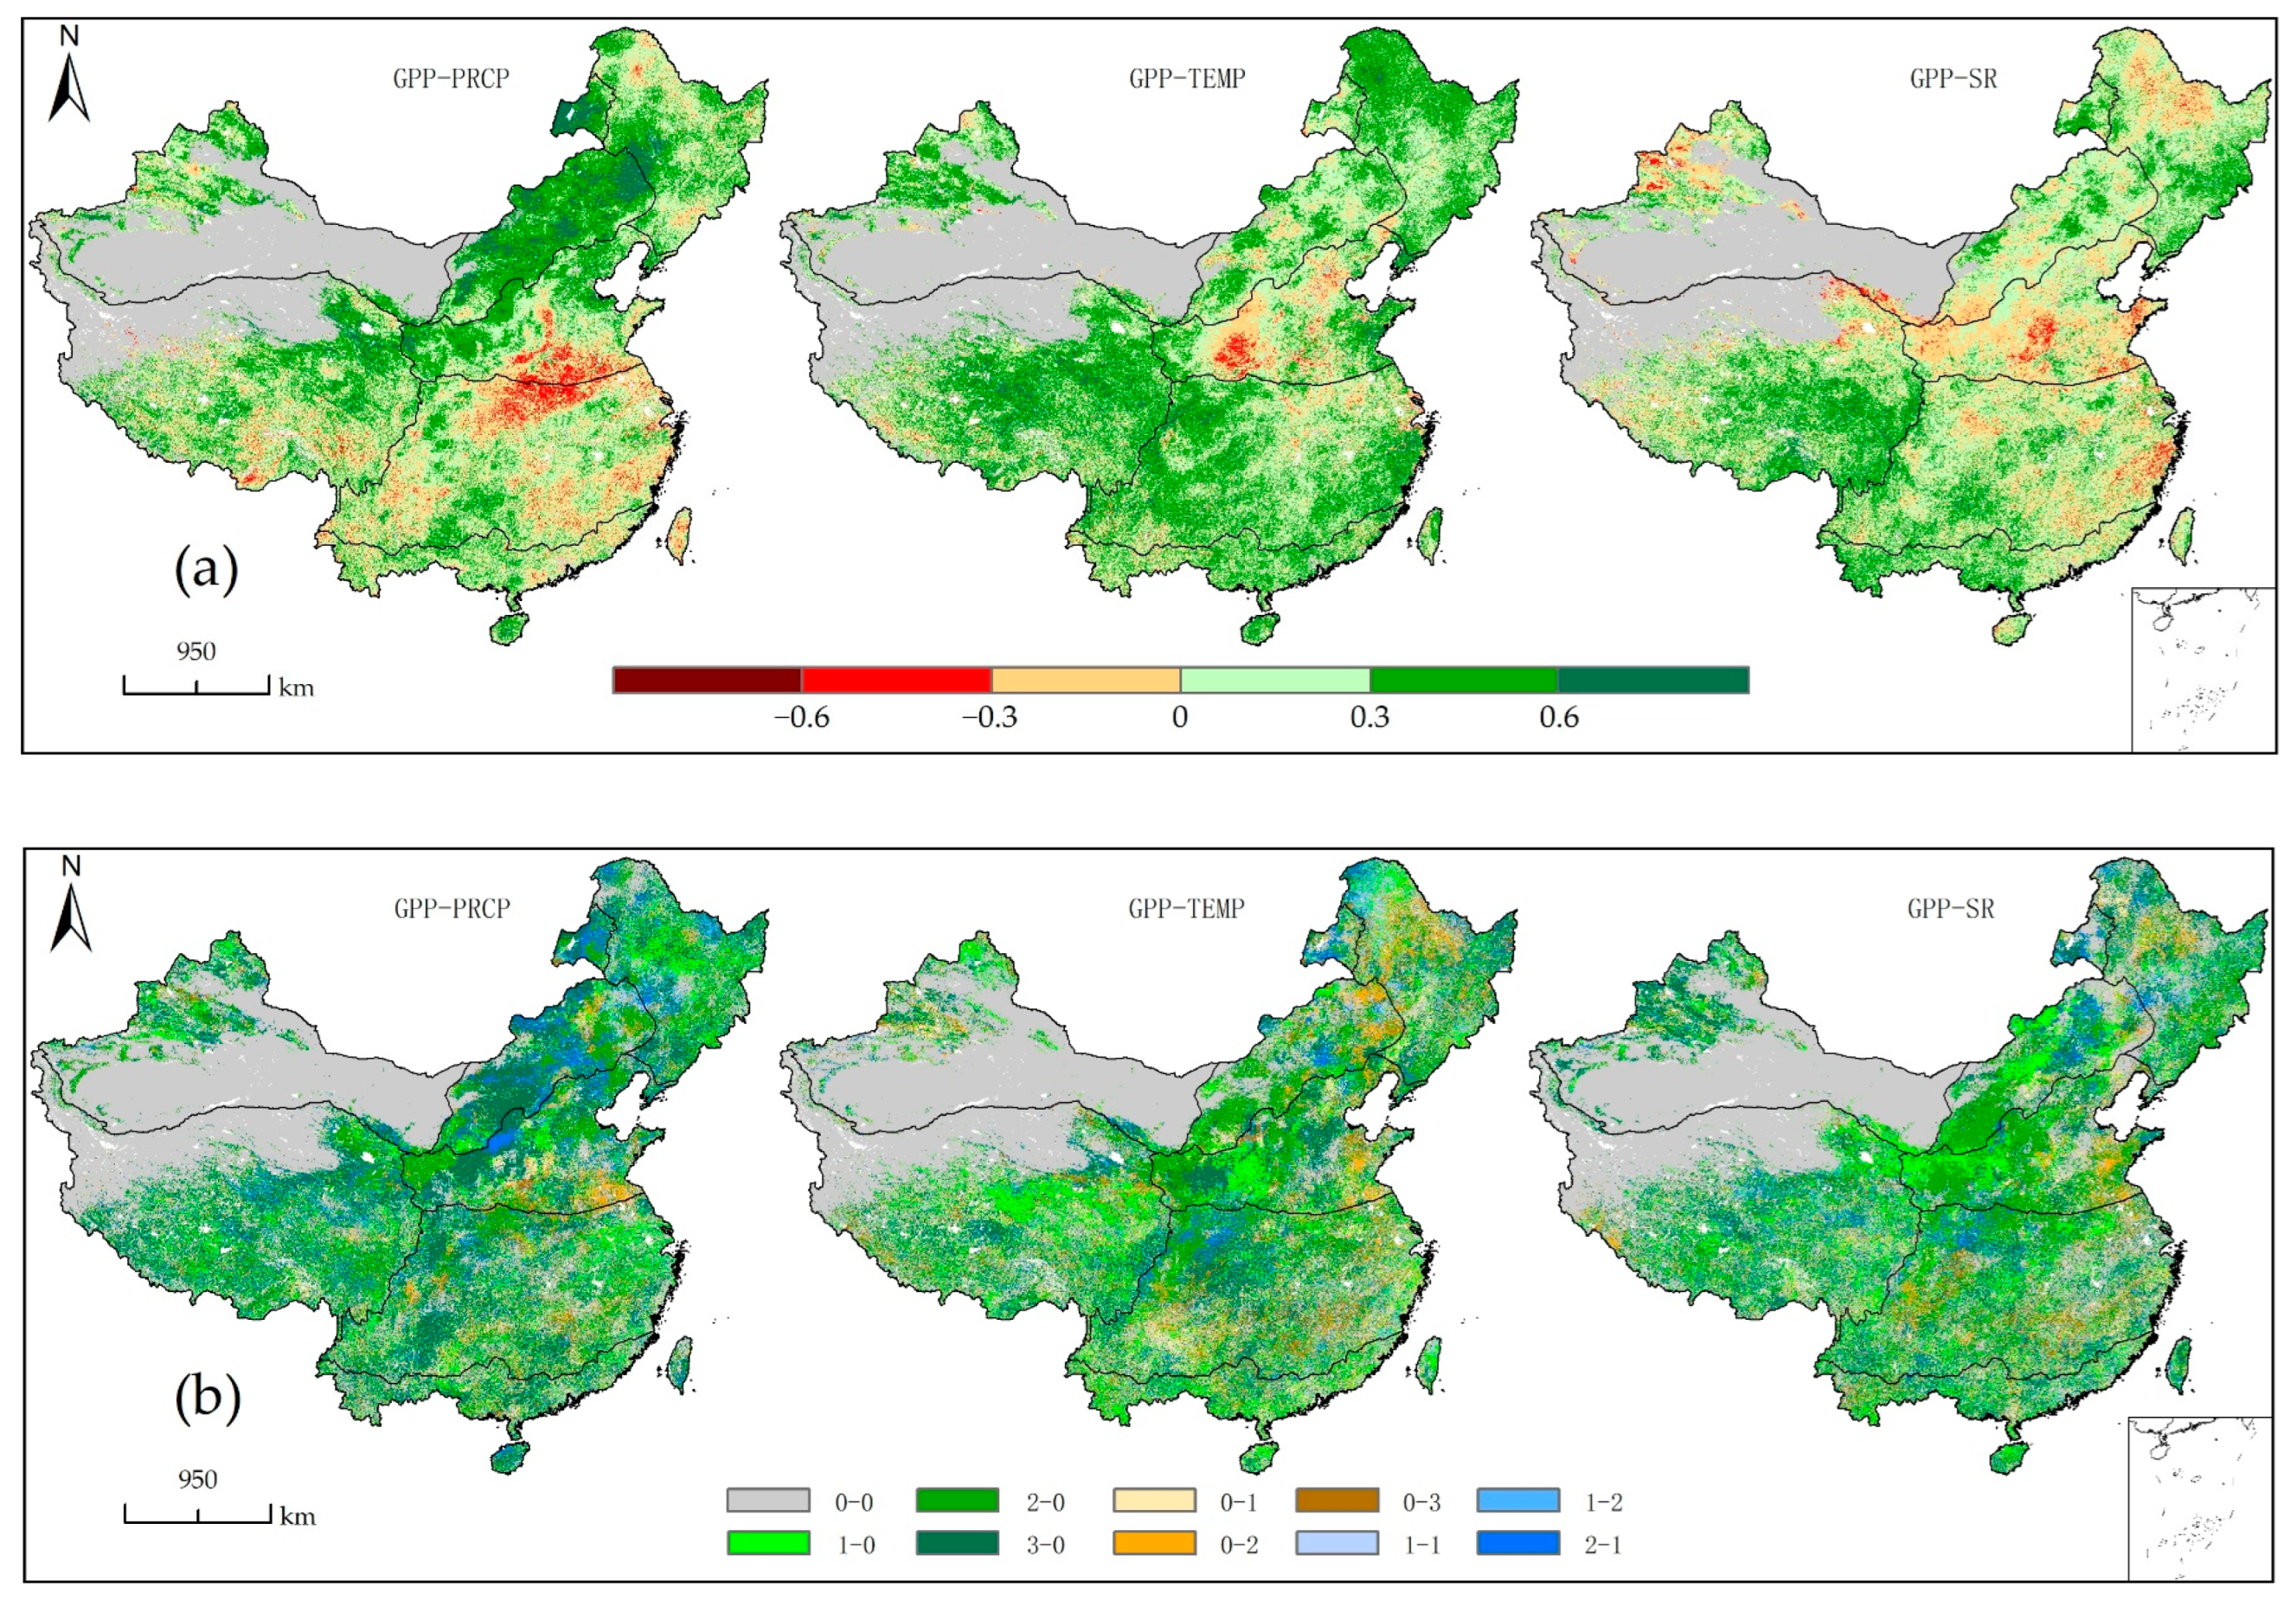
3.5. Spatial Distribution of the Lag Effects of Meteorological Elements on GPP during the Vegetation Growing Season

This research investigated the maximum correlation coefficients between GPP and meteorological variables at different lag periods within the growing season based on the vegetation pixel scale to discuss the spatial distribution of lag effects (Figure 7). GPP values show significant correlations with meteorological elements in over 90% of the vegetation area (p < 0.05) during the growing season. The maximum correlation coefficients between GPP and temperature are greater than zero in 88% of the vegetation regions, especially in the western part of Region I, the eastern part of Region III, and the northern part of Region VI (Figure 5a). In these areas, abundant lakes and rivers provide vegetation with ample sources of soil moisture, reducing vegetation’s dependence on precipitation and making temperature the primary limiting factor for vegetation growth in these regions [45,46]. The maximum correlation coefficients between GPP and rainfall are greater than zero in 78% of the vegetation regions, primarily concentrated in Northern China (Figure 7a). In 73% of the vegetation regions, there are maximum correlation coefficients greater than zero between GPP and radiation, with these regions mainly concentrated in local areas within Regions III and VI. These areas share a common characteristic of having a significant amount of forest cover, where sunlight provides the primary energy source for plants. Compared to other vegetation types, forests with larger canopy cover might absorb more energy, which is likely an important reason for the sensitivity of radiation variables in some parts of the southwest and northeast.
In the western part of the Region IV, there is a clear negative correlation between the GPP and temperature. This region experiences a relatively arid climate and is largely influenced by water supply; as a result, vegetation growth in this area is strongly correlated with precipitation. During the growing season, there is a strong negative correlation between vegetation and rainfall in the northern part of Region I, where the region is predominantly covered by forests and farmland. Despite a significant decrease in rainfall in this area, forests have a robust water-retention capacity. Furthermore, to ensure food production, there is a high degree of human intervention in farmland, which may weaken the negative impact of rainfall changes on GPP in this region.
According to our results, the GPP exhibits clear lag effects in response to meteorological factors such as temperature, rainfall, and radiation (Figure 7b). In China, excluding regions with no meaningful research significance (primarily deserts), areas with no time lag for temperature are the largest, covering 17.74% of the total area. These areas are mainly concentrated in the northwest, where vegetation is predominantly composed of short-growing grasslands. Regions with a 3-month lag effect on GPP in response to rainfall constitute the largest proportion at 26.84%, primarily concentrated in the Loess Plateau region, followed by regions with a 2-month lag effect at 17.59%. For GPP in response to radiation, areas with no time lag are the most prominent, accounting for 23.21% of the total, mainly concentrated in local parts of Regions VII and V, followed by regions with a 2-month lag effect at 19.10%. It is noteworthy that we observed that the proportion of the regions with an accumulating effect of vegetation carbon absorption in response to meteorological elements is lower than those with lag effects. The proportion of regions with an accumulating effect is less than 40% of the total study area.

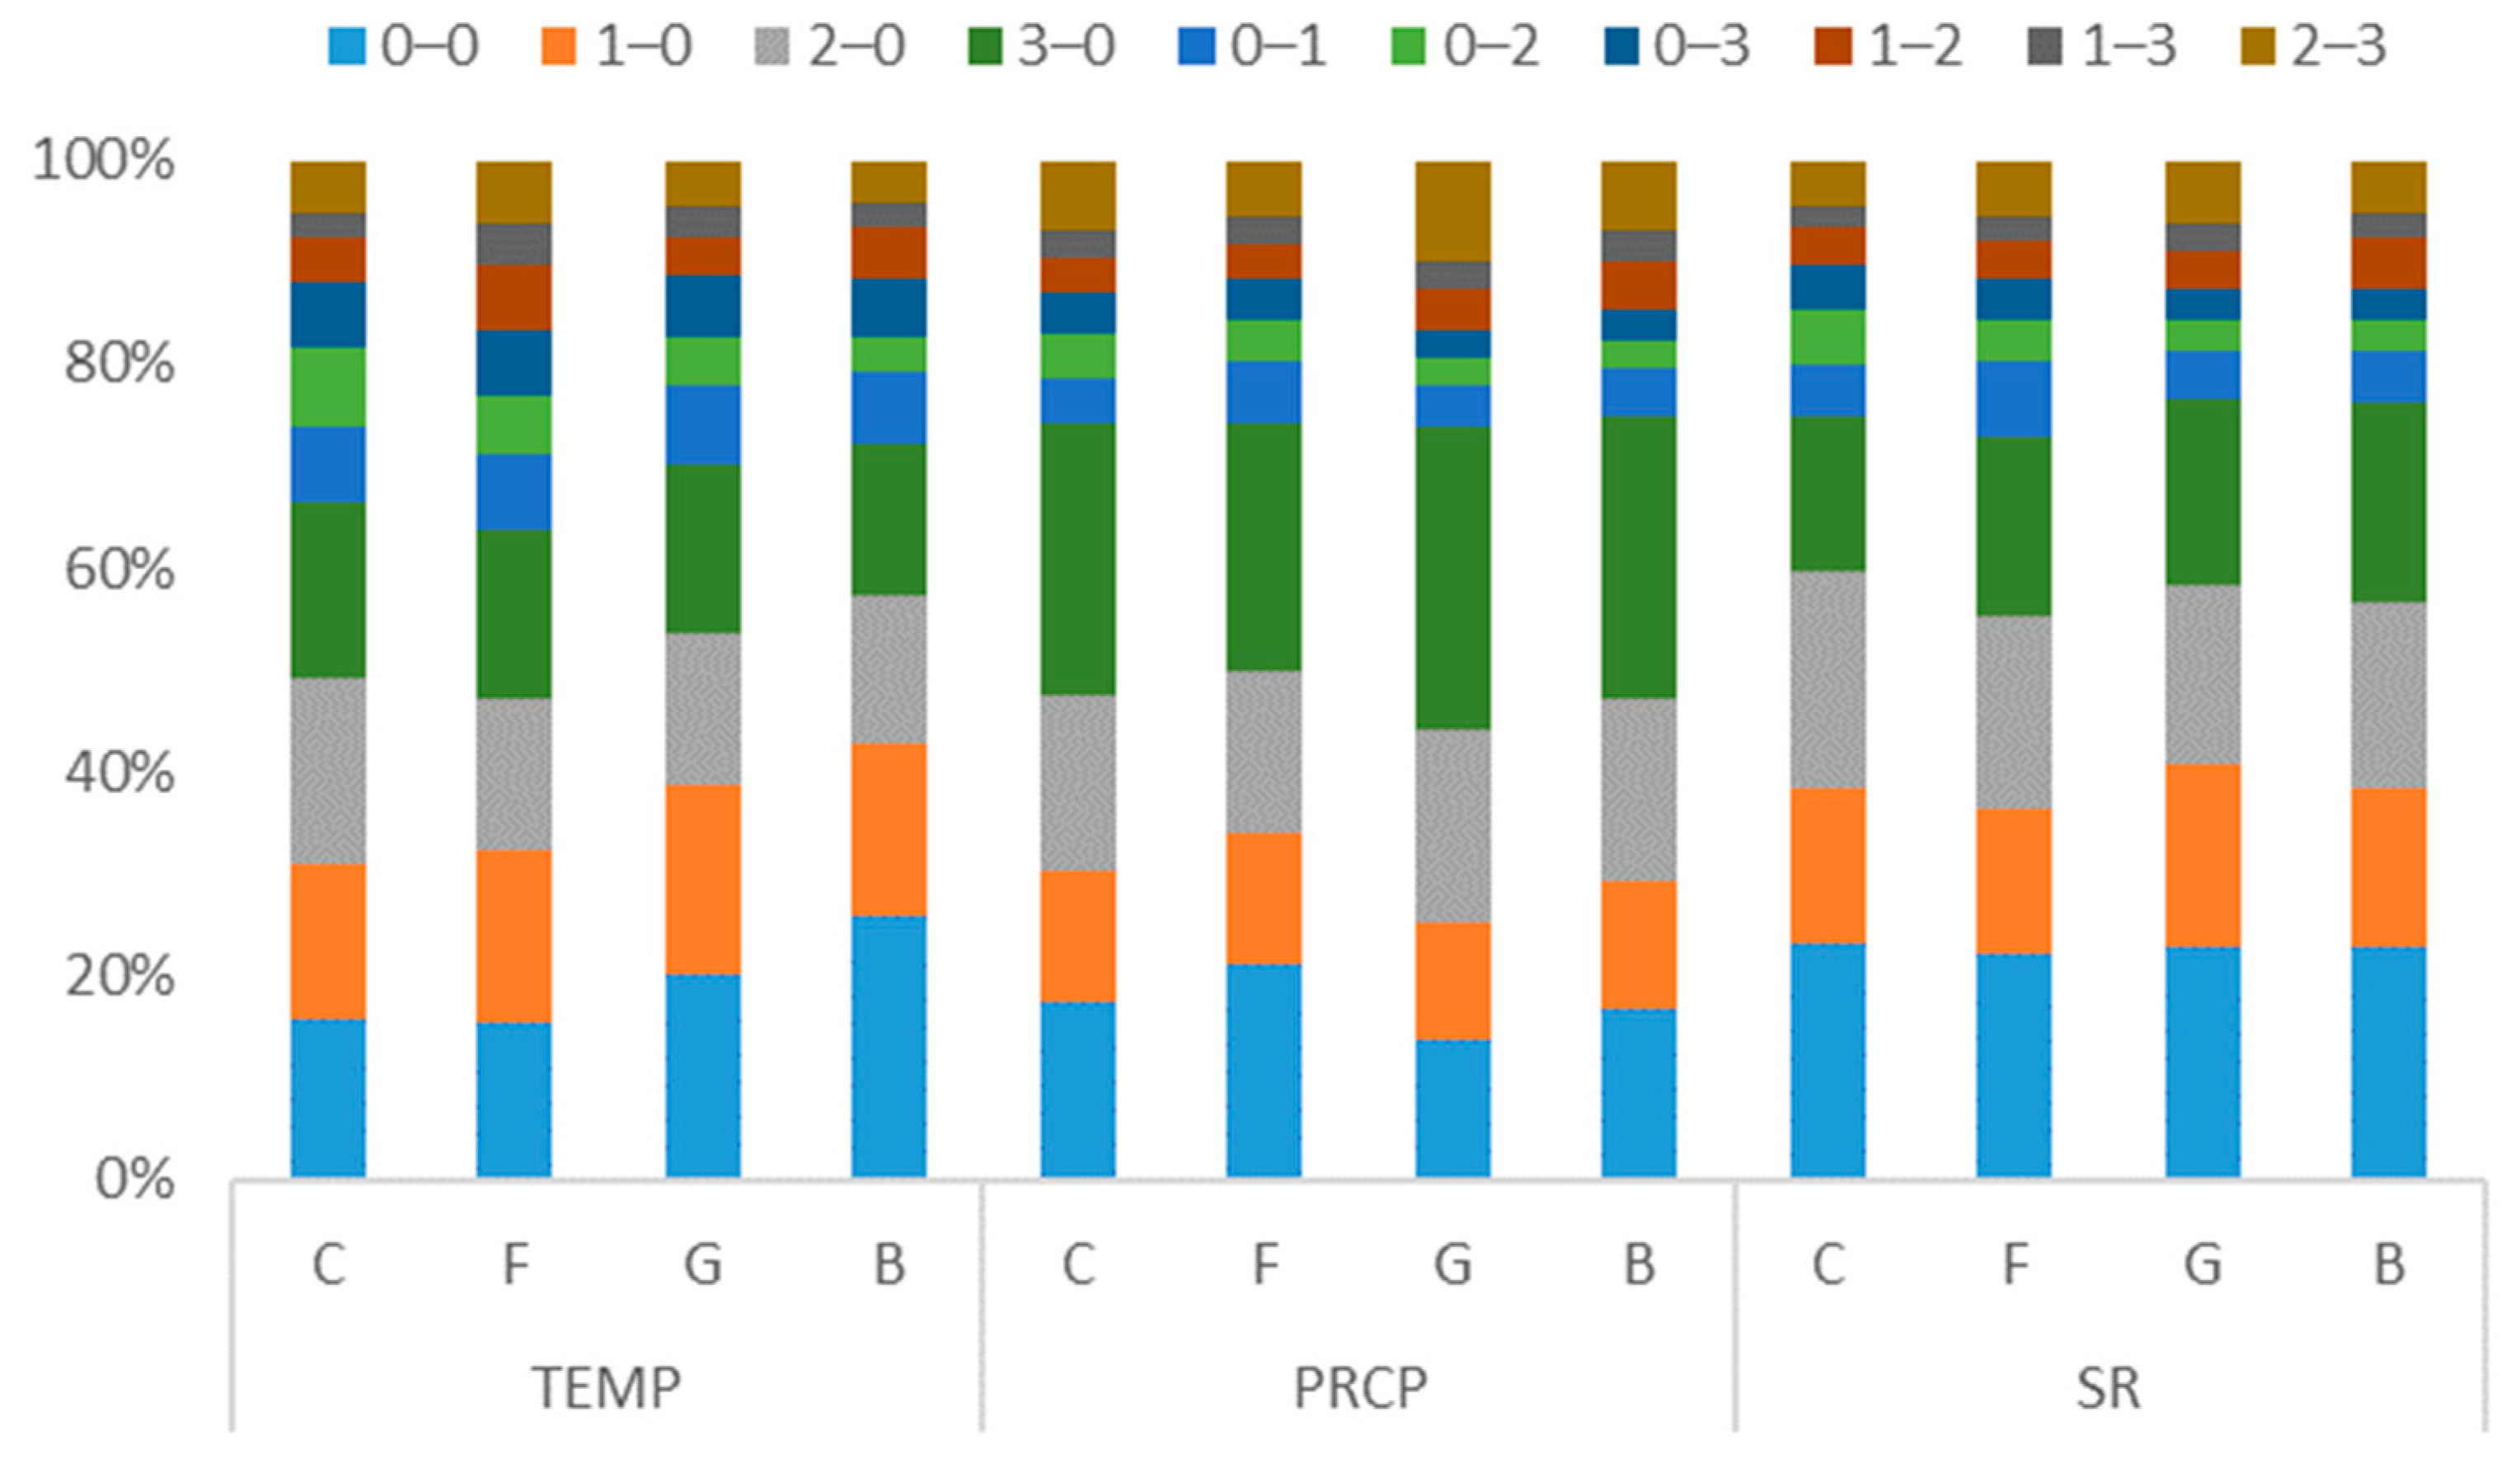
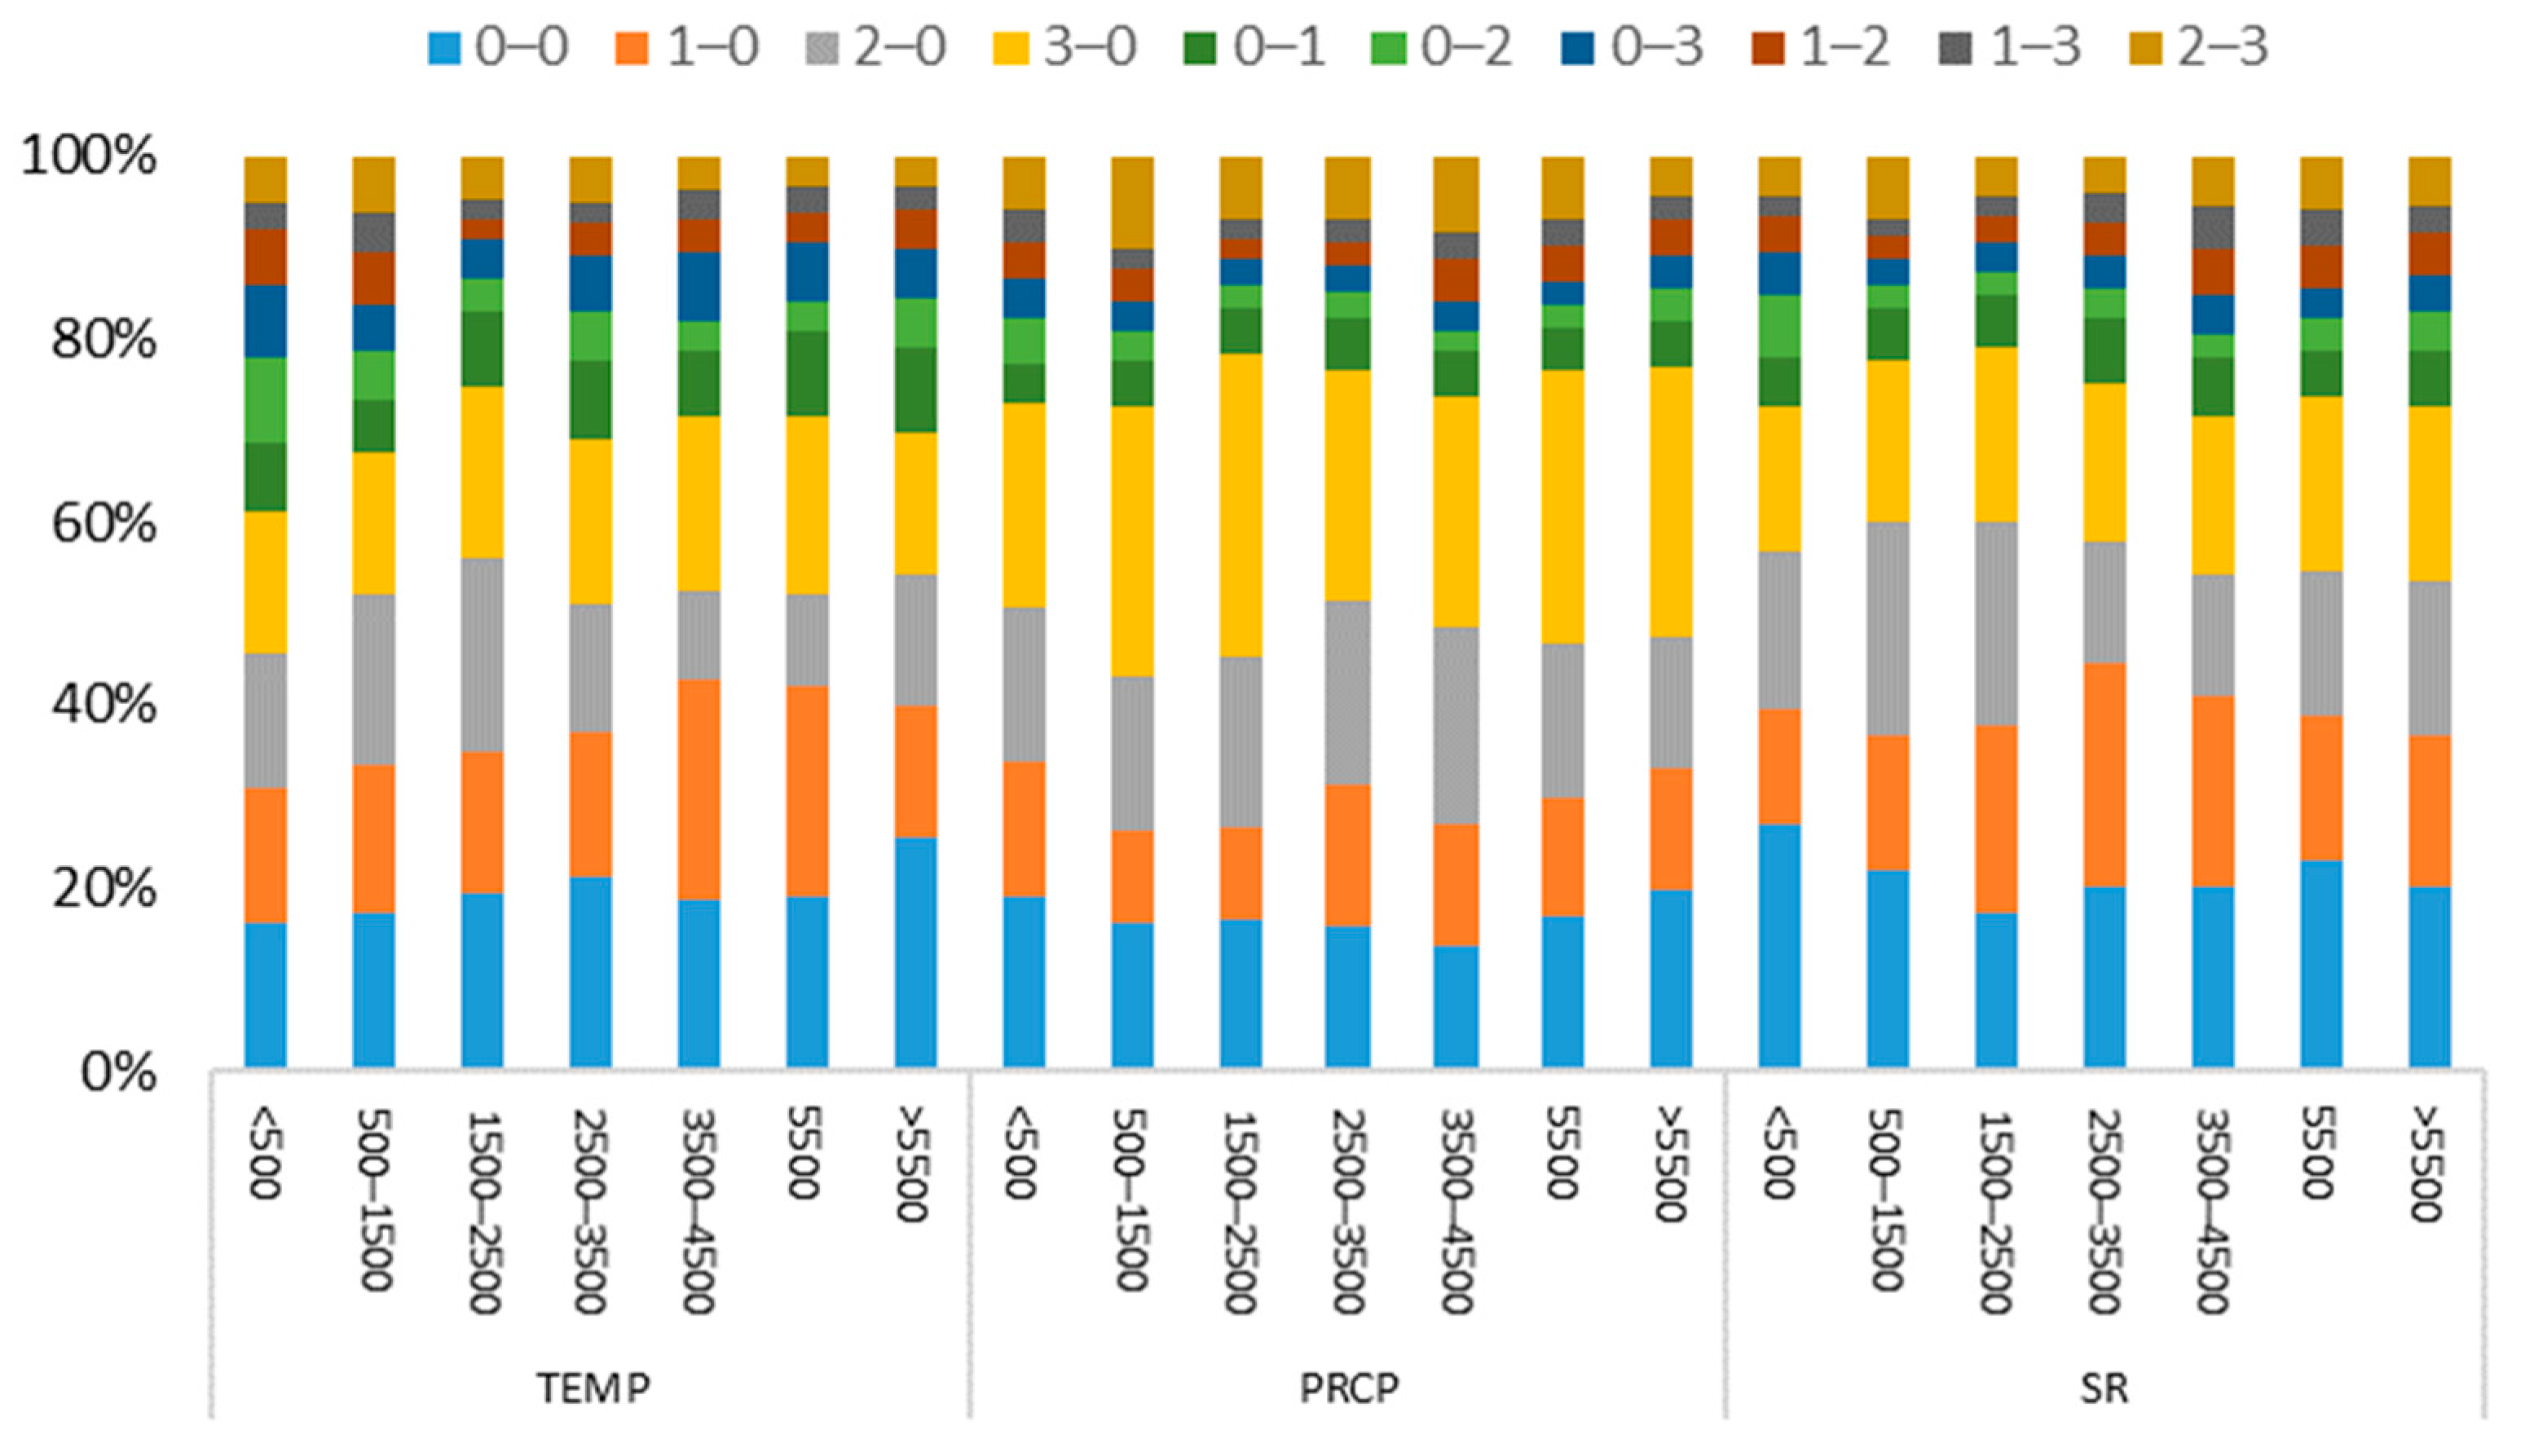
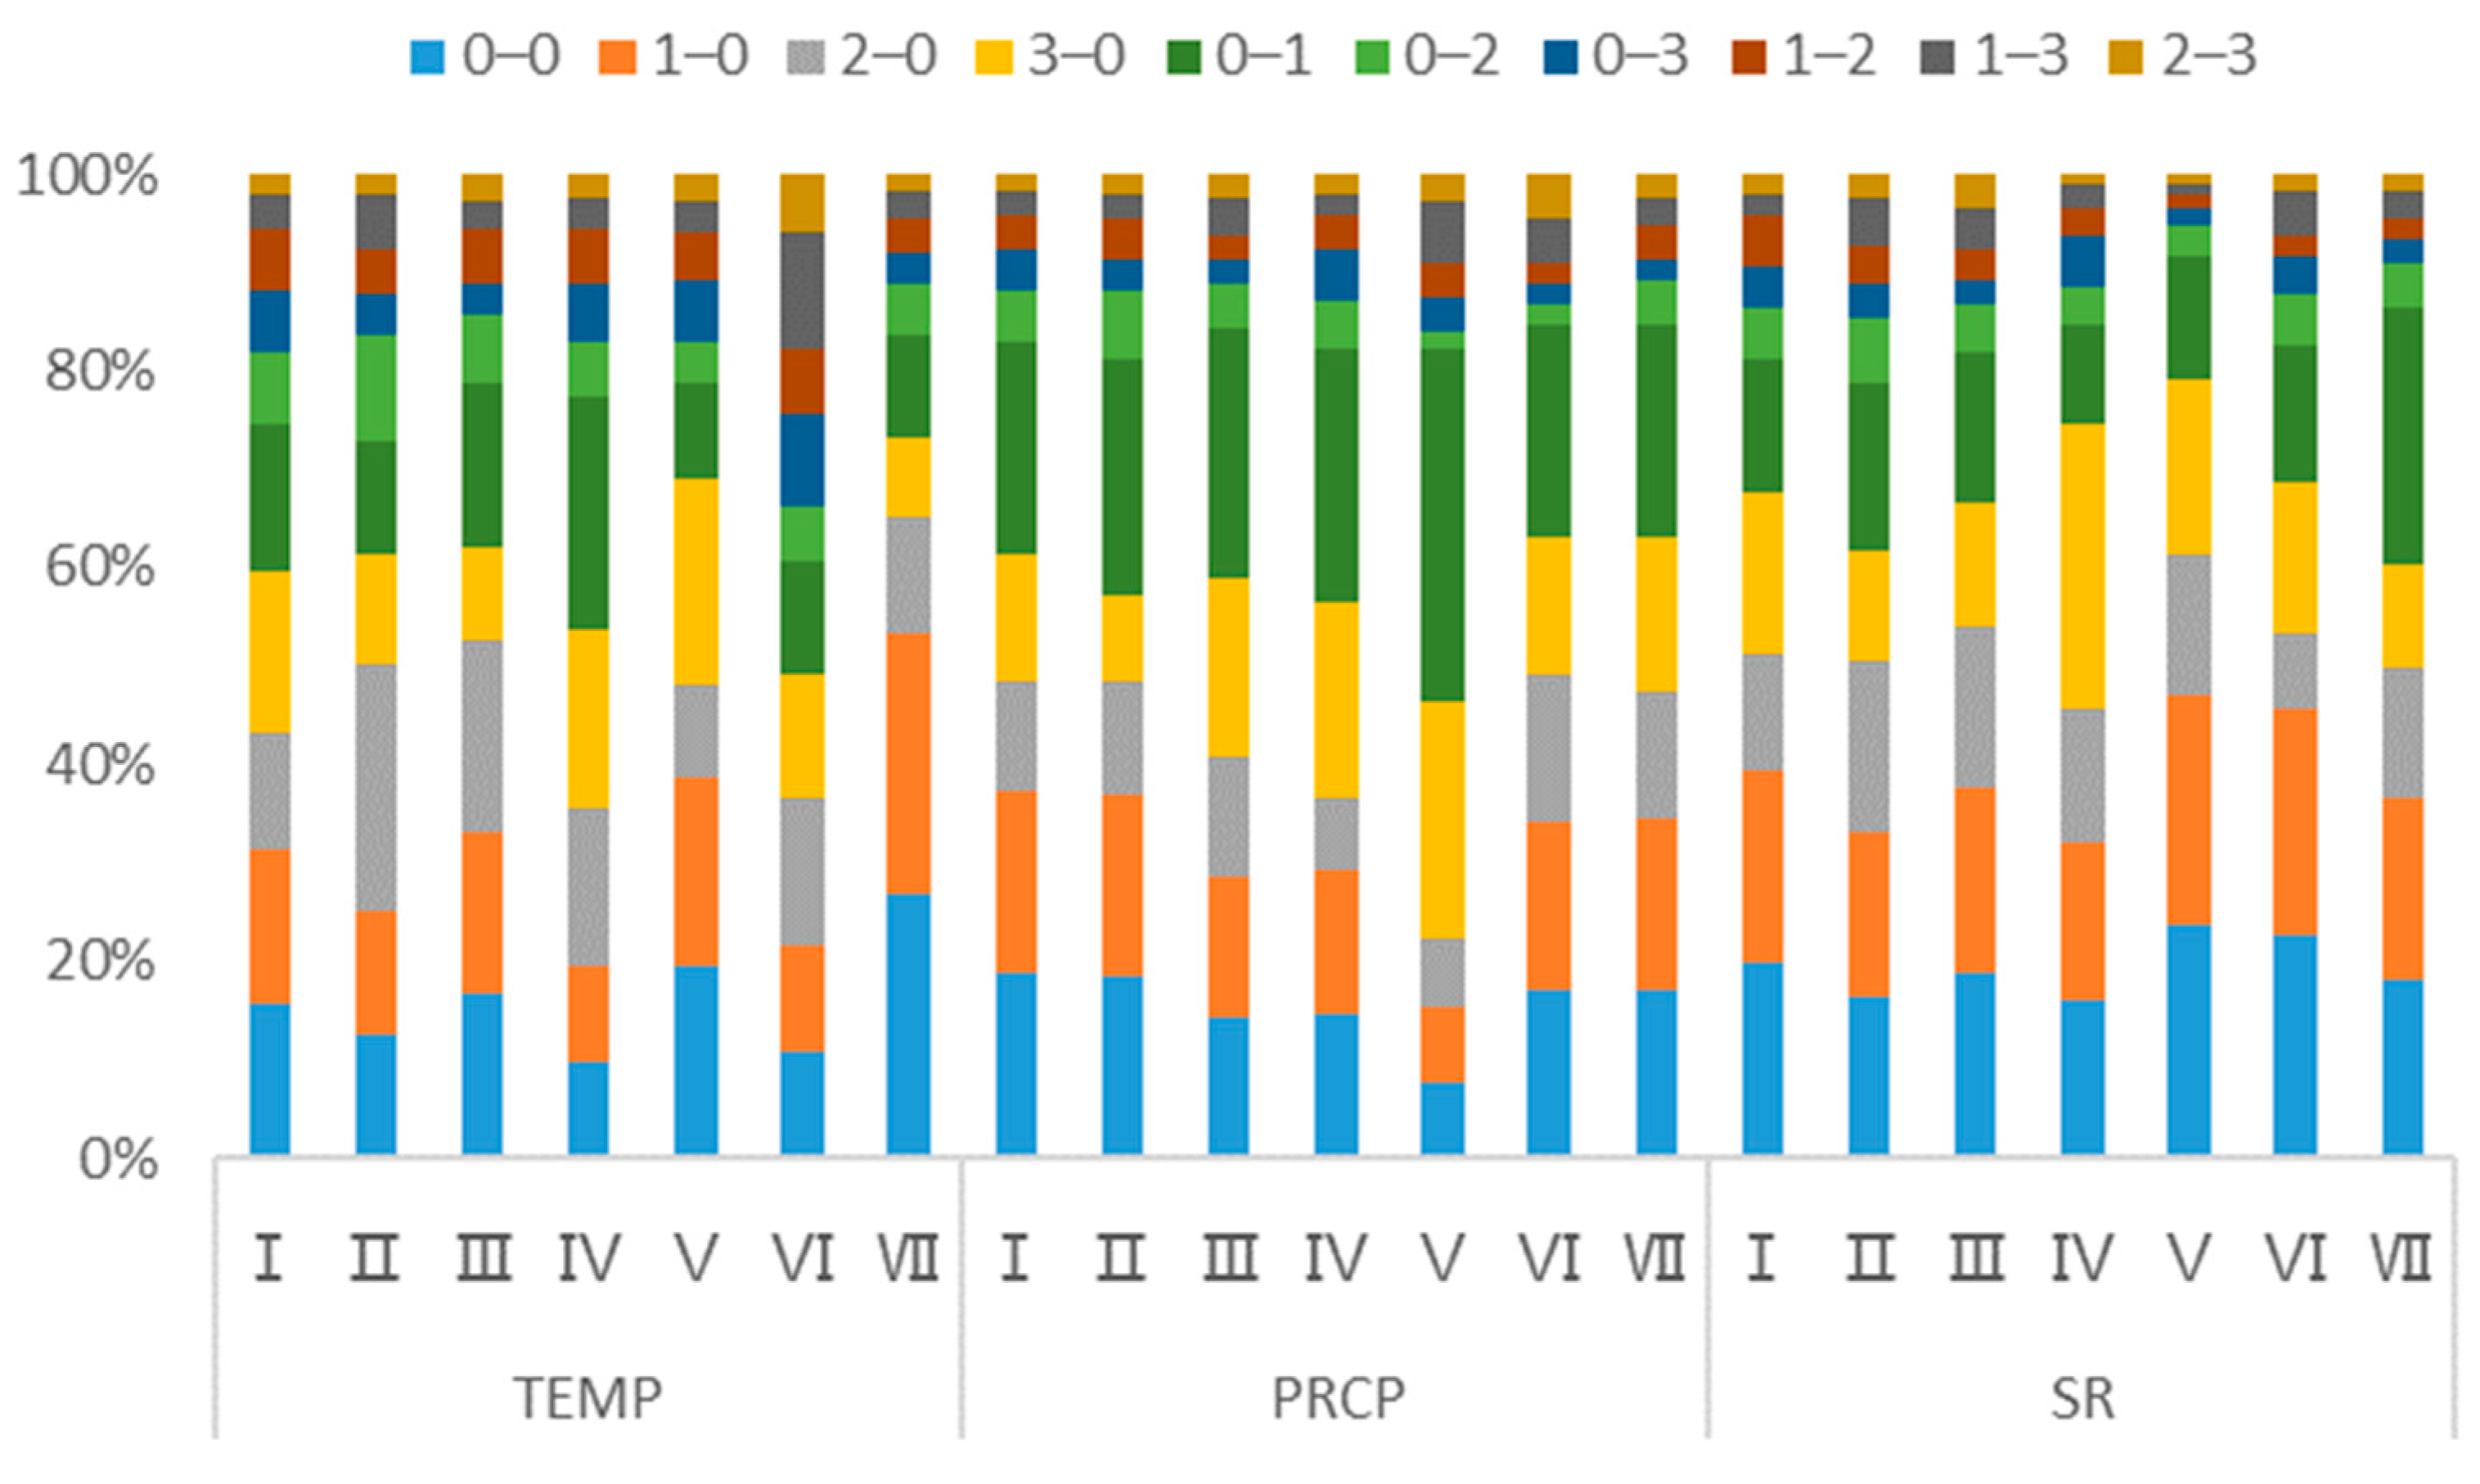
3.6. Lag Statistics of GPP in Different Elevation Ranges, Regions, and Land-Use Types in Response to Meteorological Elements

The response ratio of vegetation GPP to meteorological elements varies with different altitudes (Figure 8). Specifically, as altitude increases, the proportion of the GPP’s cumulative response without lag to temperature increases. Within the altitude range of 3500–5500 m, the proportion of the high-lag 1-0 stage is higher, accounting for 23.38%. The GPP’s response ratio to rainfall in stages 3-0 is higher, concentrated in the range of 500–2500 m and above 5500 m. The proportion of GPP’s cumulative response without lag to radiation is higher in regions with altitudes less than 500 m, and this proportion tends to decrease with increasing altitude. Additionally, the proportion of the GPP’s cumulative response to radiation increases with increasing altitude.
From a climatic-zone perspective, there are significant differences in the response to meteorological elements in various regions (Figure 9). Specifically, when examining the lag-accumulation effects of the GPP in response to temperature, the stages with the highest proportion, from Region I to Region VII, are as follows: 3-0 (17.87%), 2-0 (27.37%), 2-0 (22.46%), 0-1 (25.39%), 3-0 (24.45%), 2-0 (15.74%), and 1-0 (35.01%). For GPP responses to rainfall, the stages with the highest proportion of lag are all 3-0, with proportions ranging from 24.42% in Region VII to 32.10% in Region IV. Regarding GPP responses to radiation, the stages with the highest proportion of lag-accumulation effects in these seven regions are as follows: 1-0 (23.24%), 2-0 (19.83%), 1-0 (21.92%), 3-0 (33.56%), 1-0 (28.42%), 2-0 (27.71%), and 0-1 (30.86%).
Apart from regional differences, different land-use types exhibit varying responses to meteorological elements. Therefore, we calculated the proportions of lag stages of the GPP response to meteorological elements in several land-use types with higher representation (Figure 10). For instance, cropland and forest GPP have the highest proportions for the temperature lag stages of 2-0 (18.05%) and 1-0 (17.10%), respectively. Grassland and barren-land GPP have the highest proportions of areas that do not exhibit a lag response to temperature, at 20.09% and 25.88%, respectively, mainly concentrated in Regions V and VII. Furthermore, all four land-use types have a relatively consistent pattern in their GPP response to rainfall (3-0) and radiation (0-0), with proportions exceeding 20%. This pattern may be related to the soil’s water storage capacity. After rainfall, the water stored in the soil takes time to be absorbed by plants and released into the atmosphere through transpiration. Unlike rainfall, solar radiation reaching the Earth is almost instantaneous and typically does not require time for accumulation or release.

4. Discussion

4.1. Analysis of the GPP Trends and Reasons for Variation

Recent MODIS satellite data showed that despite the fact that China covers only 6.6% of the global vegetated area, it contributes as much as a quarter to the global greening. China’s afforestation and forest conservation efforts are crucial factors in achieving this outcome [47], the conclusion supported by our study. Since the 1970s, China has launched several significant ecological construction projects, with at least six directly related to land greening and carbon sequestration: the Three-North Shelterbelt Project, Natural Forest Resource Protection Project, Grain for Green Project, Yangtze River/Pearl River Basin Shelterbelt Project, Beijing–Tianjin Sand Source Control Project, and Grazing Ban and Grassland Conversion Project [48,49,50]. These projects cover the vast majority of China’s territory.
The large-scale ecological projects related to vegetation restoration can increase vegetation cover. Higher vegetation cover means more leaves to absorb the solar energy, which can increase the total photosynthetic rate of the vegetation, thereby enhancing the land ecosystem’s carbon absorption capacity [51]. Higher vegetation cover can also reduce the temperature of the soil surface and lower the temperature of the vegetation through transpiration [52]. This helps maintain the relative humidity within the vegetation, improving water absorption and utilization efficiency. More efficient water usage allows vegetation to maintain a higher photosynthetic rate under limited water conditions [53]. Previous studies have also suggested that increased vegetation cover contributes to terrestrial carbon sinks. Chen et al., using a process-based diagnostic system model, found that the global increase in Leaf Area Index (LAI) led to a 12.4% accumulation of terrestrial carbon sinks [54]. Li et al. discovered that large-scale ecological projects improved the environment in Northern China, leading to a significant increase in GPP in the Loess Plateau and Northeast Plain regions, with increased LAI being the main driver behind the GPP increase in these areas [55].

4.2. The Relationship between Meteorological Elements and GPP

Temperature, precipitation, and radiation, among other meteorological elements, collectively influence vegetation growth and photosynthesis [56], consequently affecting vegetation’s carbon absorption from the atmosphere and terrestrial carbon sequestration capacity. The primary way that solar radiation affects GPP is through light energy. Plants utilize chlorophyll in their leaves to absorb light energy, convert it into chemical energy, and use it for photosynthesis. Different wavelengths of radiation have varying effects on chlorophyll absorption [57]. Under low light conditions, where light saturation is high, plants can efficiently utilize more light energy to increase photosynthesis rates. However, under high light conditions, light saturation gradually decreases, and the photosynthesis rate of plants no longer increases with the increasing light, thereby limiting their carbon absorption capacity. Therefore, higher light intensity is generally beneficial for increasing the photosynthesis rate of plants and enhancing their carbon absorption capacity.
Temperature affects the growth and development process of plants, including seed germination, seedling growth, flowering, and fruiting [58]. Suitable temperature is beneficial for plant growth and improves GPP. Generally, photosynthesis rates increase with rising temperatures because temperature promotes the catalytic reactions of enzymes. This means that, at higher temperatures, plants can convert carbon dioxide (CO2) and water (H2O) into organic compounds more rapidly, thereby enhancing their carbon absorption capacity. For example, during the warm summer season, increased temperatures often lead to higher photosynthesis rates in plants, boosting vegetation’s carbon absorption capacity. However, extreme heat or cold events can have a severe impact on vegetation, limiting photosynthesis rates and carbon absorption capacity [59]. High-temperature events can potentially deactivate photosynthetic enzymes, damage leaf tissues, and consequently reduce carbon absorption. In addition, temperature also affects the activity of soil microorganisms, which in turn affects the decomposition and cycling of soil nutrients, and ultimately affects GPP [60].
Rainfall provides the necessary water for plants, maintaining their water balance. Adequate water can promote photosynthesis in plants since water is one of the reactants in photosynthesis. For example, in tropical rainforests, where annual rainfall is abundant, plants often exhibit a high carbon absorption capacity [61]. These plants can efficiently utilize the ample rainfall for photosynthesis, resulting in substantial carbon absorption, thereby helping to maintain the carbon balance of the rainforest ecosystem. Conversely, insufficient rainfall or drought conditions can limit plants due to water stress [62]. Drought conditions can cause plants to close their stomata to reduce water loss, which restricts the entry of the carbon dioxide and reduces photosynthetic rates. Increased rainfall helps to alleviate water stress, promote vegetation restoration, and improve GPP. Furthermore, rainfall also brings nutrients such as nitrogen from the atmosphere into the soil, increasing soil nutrient content and providing more nutrients for plant growth [63].
The delayed response of vegetation to meteorological changes typically does not occur immediately but rather involves a certain time lag. This lag effect can offer several important benefits for ecosystems and the climate. Vegetation lag effects can enhance the stability and resilience of ecosystems [64]. When meteorological elements undergo short-term fluctuations or extreme events, vegetation does not respond abruptly but rather gradually adapts to the new conditions. This gradual response can mitigate the impact of the meteorological changes on ecosystems, reducing their vulnerability to such changes. This helps prevent ecosystems from suffering adverse effects due to short-term meteorological variations. Furthermore, the lagged response of the vegetation to meteorological factors can serve as a regulating mechanism for the climate. For instance, the delayed vegetation response can slow down temperature fluctuations in the climate system, preventing rapid temperature increases or decreases. This climate-regulating effect contributes to maintaining the relative stability of the climate system.
This paper elucidates the lagged responses of the GPP to meteorological elements in different regions and vegetation types across China. It also reveals that regions in China, especially Regions V and VII, exhibit the highest proportion of the GPP with no lag effects in response to temperature and radiation. We propose that this observation may be attributed to the high prevalence of the single vegetation types and a significant proportion of barren land and grassland in these regions (Figure 11). The Grasslands and barren lands typically consist of the less vegetation or exposed soil, which have relatively lower heat capacity and higher surface reflectance [65]. The high surface reflectance allows them to more effectively reflect heat, reducing their heat absorption and temperature increase capabilities. Additionally, the low heat capacity means that they can quickly warm up or cool down when exposed to heat radiation, without requiring an extended period to accumulate or release heat. Consequently, these areas do not exhibit significant lag effects.

4.3. Uncertainty

Remote-sensing products may have uncertainties due to sensor characteristics, cloud and atmospheric conditions, and processing algorithms. These uncertainties can affect the accuracy and reliability of the data. Although this study validated PML and MODIS products based on 11 flux sites, the limitations of the data station availability only allowed us to obtain data from one cropland site. Since croplands constitute more than 20% of the study area, collecting more sites for a comprehensive assessment of remote-sensing product accuracy is a future goal. Furthermore, this study utilized several different remote-sensing products. An overlay analysis typically requires resampling all datasets to the same spatial resolution, which may alter the values of certain pixels. Employing imagery with the same resolution could contribute to further enhancing the reliability of results. Incorporating additional products or models is another way to improve accuracy. Additionally, the use of remote-sensing data with higher spatial and temporal resolution than those used in this study may lead to more meaningful conclusions and is worth further exploration.

5. Conclusions

Data from 11 eddy covariance flux tower sites were used to validate the accuracy of the both PML and MODIS GPP products, with the results indicating that PML outperforms MODIS in the Chinese region. Over the past two decades, there has been a trend of increasing GPP in China’s terrestrial ecosystems. The spatial pattern shows an increase from inland regions to the southeast coast, suggesting significant carbon uptake potential in Inland China.
In the past two decades, the regional temperature in China has shown a modest increase, while precipitation and radiation have slightly decreased, which is crucial for future climate predictions and water resource management. Moreover, in many regions, precipitation and radiation display opposing trends, which could impact the functionality and stability of ecosystems in different areas. Therefore, future ecosystem management needs to take these changes into account to ensure the health and sustainable development of the ecosystems. During the vegetation growth season, there is a higher proportion of regions with lag effects compared to cumulative effects in GPP response to meteorological factors. Specifically, regions where the GPP exhibits no lag or cumulative effect in response to temperature and radiation are predominantly located in the northwestern region. This observation is associated with the substantial presence of the barren land and grassland in these areas. Regarding land-use types such as cropland, forest, grassland, and barren land, their responses to temperature vary, with a higher proportion showing no lag response to radiation. There is a higher proportion of a 3-month lag response to precipitation, and this phenomenon is particularly evident in areas with elevations between 500 and 2500 m and above 5500 m. Understanding the response of different land-use types to climate factors can help farmers and forestry managers make better decisions to adapt to future climate change and optimize land-use practices. Our research findings offer valuable data references for the quantitative analysis of China’s terrestrial carbon development over the past 20 years, providing a new theoretical basis for future regional ecological improvement plans and coordinated development.

Author Contributions

Conceptualization, Z.W. and E.G.; methodology, Z.W. and E.G.; software, J.Z.; formal analysis, Z.M. and J.Z.; investigation, E.G.; resources, E.G. and Z.W.; data curation, E.G. and Z.W.; writing—original draft preparation, E.G.; writing—review and editing, Z.W.; visualization, Z.M. and J.Z.; supervision, Z.W.; funding acquisition, Z.W. All authors have read and agreed to the published version of the manuscript.

Funding

This research was funded by the Science Foundation for Young Elite Talents of YRCC (HQK-202307), and the Joint Funds of the National Natural Science Foundation of China (U2243212).

Institutional Review Board Statement

Not applicable.

Informed Consent Statement

Not applicable.

Data Availability Statement

The data presented in this study are available on request from the corresponding author. The data are not publicly available due to privacy.

Conflicts of Interest

The authors declare no conflict of interest.

References

  1. Zhao, J.; Huang, S.; Huang, Q.; Wang, H.; Leng, G.; Fang, W. Time-lagged response of vegetation dynamics to climatic and teleconnection factors. CATENA 2020, 189, 104474. [Google Scholar] [CrossRef]
  2. Guo, Y.; Huang, S.; Huang, Q.; Leng, G.; Fang, W.; Wang, L.; Wang, H. Propagation thresholds of meteorological drought for triggering hydrological drought at various levels. Sci. Total Environ. 2020, 712, 136502. [Google Scholar] [CrossRef] [PubMed]
  3. Dai, M.; Huang, S.; Huang, Q.; Leng, G.; Guo, Y.; Wang, L.; Fang, W.; Li, P.; Zheng, X. Assessing agricultural drought risk and its dynamic evolution characteristics. Agric. Water Manag. 2020, 231, 106003. [Google Scholar] [CrossRef]
  4. Han, Z.; Huang, S.; Huang, Q.; Leng, G.; Wang, H.; He, L.; Fang, W.; Li, P. Assessing GRACE-based terrestrial water storage anomalies dynamics at multi-timescales and their correlations with teleconnection factors in Yunnan Province, China. J. Hydrol. 2019, 574, 836–850. [Google Scholar] [CrossRef]
  5. Deng, C.; Zhang, B.; Cheng, L.; Hu, L.; Chen, F. Vegetation dynamics and their effects on surface water-energy balance over the Three-North Region of China. Agric. For. Meteorol. 2019, 275, 79–90. [Google Scholar] [CrossRef]
  6. Daham, A.; Han, D.; Rico-Ramirez, M.; Marsh, A. Analysis of NVDI variability in response to precipitation and air temperature in different regions of Iraq, using MODIS vegetation indices. Environ. Earth Sci. 2018, 77, 389. [Google Scholar] [CrossRef]
  7. Zhang, J.; Yang, G.; Yang, L.; Li, Z.; Gao, M.; Yu, C.; Gong, E.; Long, H.; Hu, H. Dynamic Monitoring of Environmental Quality in the Loess Plateau from 2000 to 2020 Using the Google Earth Engine Platform and the Remote Sensing Ecological Index. Remote Sens. 2022, 14, 5094. [Google Scholar] [CrossRef]
  8. Wei, Y.; Sun, S.; Liang, D.; Jia, Z. Spatial–temporal variations of NDVI and its response to climate in China from 2001 to 2020. Int. J. Digit. Earth 2022, 15, 1463–1484. [Google Scholar] [CrossRef]
  9. Peng, J.; Liu, Z.; Liu, Y.; Wu, J.; Han, Y. Trend analysis of vegetation dynamics in Qinghai–Tibet Plateau using Hurst Exponent. Ecol. Indic. 2012, 14, 28–39. [Google Scholar] [CrossRef]
  10. Ma, R.; Xia, C.; Liu, Y.; Wang, Y.; Zhang, J.; Shen, X.; Lu, X.; Jiang, M. Spatiotemporal Change of Net Primary Productivity and Its Response to Climate Change in Temperate Grasslands of China. Front. Plant Sci. 2022, 13, 899800. [Google Scholar] [CrossRef] [PubMed]
  11. Yang, H.; Munson, S.M.; Huntingford, C.; Carvalhais, N.; Knapp, A.K.; Li, X.; Peñuelas, J.; Zscheischler, J.; Chen, A. The detection and attribution of extreme reductions in vegetation growth across the global land surface. Glob. Chang. Biol. 2023, 29, 2351–2362. [Google Scholar] [CrossRef] [PubMed]
  12. Forzieri, G.; Miralles, D.G.; Ciais, P.; Alkama, R.; Ryu, Y.; Duveiller, G.; Zhang, K.; Robertson, E.; Kautz, M.; Martens, B.; et al. Increased control of vegetation on global terrestrial energy fluxes. Nat. Clim. Chang. 2020, 10, 356–362. [Google Scholar] [CrossRef]
  13. Bonan, G.B. Forests and Climate Change: Forcings, Feedbacks, and the Climate Benefits of Forests. Science 2008, 320, 1444–1449. [Google Scholar] [CrossRef] [PubMed]
  14. Forzieri, G.; Alkama, R.; Miralles, D.G.; Cescatti, A. Satellites reveal contrasting responses of regional climate to the widespread greening of Earth. Science 2017, 356, 1180–1184. [Google Scholar] [CrossRef] [PubMed]
  15. Martin, P. Vegetation responses and feedbacks to climate: A review of models and processes. Clim. Dyn. 1993, 8, 201–210. [Google Scholar] [CrossRef]
  16. Del Grosso, S.; Parton, W.; Stohlgren, T.; Zheng, D.; Bachelet, D.; Prince, S.; Hibbard, K.; Olson, R. Global potential net primary production predicted from vegetation class, precipitation, and temperature. Ecology 2008, 89, 2117–2126. [Google Scholar] [CrossRef] [PubMed]
  17. Prasad, V.K.; Badarinath, K.V.S.; Eaturu, A. Effects of precipitation, temperature and topographic parameters on evergreen vegetation greenery in the Western Ghats, India. Int. J. Climatol. 2008, 28, 1807–1819. [Google Scholar] [CrossRef]
  18. Obuchowicz, C.; Poussin, C.; Giuliani, G. Change in observed long-term greening across Switzerland–evidence from a three decades NDVI time-series and its relationship with climate and land cover factors. Big Earth Data 2024, 8, 1–32. [Google Scholar] [CrossRef]
  19. Zhe, M.; Zhang, X. Time-lag effects of NDVI responses to climate change in the Yamzhog Yumco Basin, South Tibet. Ecol. Indic. 2021, 124, 107431. [Google Scholar] [CrossRef]
  20. Xu, S.; Wang, Y.; Liu, Y.; Li, J.; Qian, K.; Yang, X.; Ma, X. Evaluating the cumulative and time-lag effects of vegetation response to drought in Central Asia under changing environments. J. Hydrol. 2023, 627, 130455. [Google Scholar] [CrossRef]
  21. Wang, D.; Alimohammadi, N. Responses of annual runoff, evaporation, and storage change to climate variability at the watershed scale. Water Resour. Res. 2012, 48, W05546. [Google Scholar] [CrossRef]
  22. Ding, Y.; Li, Z.; Peng, S. Global analysis of time-lag and -accumulation effects of climate on vegetation growth. Int. J. Appl. Earth Obs. Geoinf. 2020, 92, 102179. [Google Scholar] [CrossRef]
  23. Ma, D.; Wu, X.; Yin, G.; Li, Z.; Wang, J.; Tang, R.; Zeng, Q.; Mu, C. Detection, mapping, and interpretation of the main drivers of the Arctic GPP change from 2001 to 2019. Clim. Dyn. 2024, 62, 723–738. [Google Scholar] [CrossRef]
  24. Feng, S.; Zhang, Z.; Zhao, S.; Guo, X.; Zhu, W.; Das, P. Time lag effect of vegetation response to seasonal precipitation in the Mara River Basin. Ecol. Process. 2023, 12, 49. [Google Scholar] [CrossRef]
  25. Ma, M.; Wang, Q.; Liu, R.; Zhao, Y.; Zhang, D. Effects of climate change and human activities on vegetation coverage change in northern China considering extreme climate and time-lag and -accumulation effects. Sci. Total Environ. 2023, 860, 160527. [Google Scholar] [CrossRef]
  26. Braswell, B.H.; Schimel, D.S.; Linder, E.; Moore, B. The Response of Global Terrestrial Ecosystems to Interannual Temperature Variability. Science 1997, 278, 870–873. [Google Scholar] [CrossRef]
  27. Wen, Y.; Liu, X.; Yang, J.; Lin, K.; Du, G. NDVI indicated inter-seasonal non-uniform time-lag responses of terrestrial vegetation growth to daily maximum and minimum temperature. Glob. Planet. Chang. 2019, 177, 27–38. [Google Scholar] [CrossRef]
  28. Müller, L.M.; Bahn, M. Drought legacies and ecosystem responses to subsequent drought. Glob. Chang. Biol. 2022, 28, 5086–5103. [Google Scholar] [CrossRef] [PubMed]
  29. Chen, W.; Wang, S.; Wang, J.; Xia, J.; Luo, Y.; Yu, G.; Niu, S. Evidence for widespread thermal optimality of ecosystem respiration. Nat. Ecol. Evol. 2023, 7, 1379–1387. [Google Scholar] [CrossRef] [PubMed]
  30. Miller, D.L.; Wolf, S.; Fisher, J.B.; Zaitchik, B.F.; Xiao, J.; Keenan, T.F. Increased photosynthesis during spring drought in energy-limited ecosystems. Nat. Commun. 2023, 14, 7828. [Google Scholar] [CrossRef]
  31. Zhao, S. A new scheme for comprehensive physical regionalization in China. Acta Geogr. Sin. 1983, 50, 1–10. [Google Scholar]
  32. Pei, Y.; Dong, J.; Zhang, Y.; Yang, J.; Zhang, Y.; Jiang, C.; Xiao, X. Performance of four state-of-the-art GPP products (VPM, MOD17, BESS and PML) for grasslands in drought years. Ecol. Inform. 2020, 56, 101052. [Google Scholar] [CrossRef]
  33. Zhang, Y.; Kong, D.; Gan, R.; Chiew, F.H.S.; McVicar, T.R.; Zhang, Q.; Yang, Y. Coupled estimation of 500 m and 8-day resolution global evapotranspiration and gross primary production in 2002–2017. Remote Sens. Environ. 2019, 222, 165–182. [Google Scholar] [CrossRef]
  34. Hersbach, H.; Bell, B.; Berrisford, P.; Hirahara, S.; Horányi, A.; Muñoz-Sabater, J.; Nicolas, J.; Peubey, C.; Radu, R.; Schepers, D.; et al. The ERA5 global reanalysis. Q. J. R. Meteorol. Soc. 2020, 146, 1999–2049. [Google Scholar] [CrossRef]
  35. Dee, D.P.; Uppala, S.M.; Simmons, A.J.; Berrisford, P.; Poli, P.; Kobayashi, S.; Andrae, U.; Balmaseda, M.A.; Balsamo, G.; Bauer, P.; et al. The ERA-Interim reanalysis: Configuration and performance of the data assimilation system. Q. J. R. Meteorol. Soc. 2011, 137, 553–597. [Google Scholar] [CrossRef]
  36. Gao, L.; Zhang, Y.; Zhang, L. Validation and Spatiotemporal Analysis of Surface Net Radiation from CRA/Land and ERA5-Land over the Tibetan Plateau. Atmosphere 2023, 14, 1542. [Google Scholar] [CrossRef]
  37. Bongioannini Cerlini, P.; Saraceni, M.; Silvestri, L.; Meniconi, S.; Brunone, B. Monitoring the Water Mass Balance Variability of Small Shallow Lakes by an ERA5-Land Reanalysis and Water Level Measurement-Based Model. An Application to the Trasimeno Lake, Italy. Atmosphere 2022, 13, 949. [Google Scholar] [CrossRef]
  38. Uuemaa, E.; Ahi, S.; Montibeller, B.; Muru, M.; Kmoch, A. Vertical Accuracy of Freely Available Global Digital Elevation Models (ASTER, AW3D30, MERIT, TanDEM-X, SRTM, and NASADEM). Remote Sens. 2020, 12, 3482. [Google Scholar] [CrossRef]
  39. Yamazaki, D.; Ikeshima, D.; Tawatari, R.; Yamaguchi, T.; O’Loughlin, F.; Neal, J.C.; Sampson, C.C.; Kanae, S.; Bates, P.D. A high-accuracy map of global terrain elevations. Geophys. Res. Lett. 2017, 44, 5844–5853. [Google Scholar] [CrossRef]
  40. Sarmah, S.; Singha, M.; Wang, J.; Dong, J.; Deb Burman, P.K.; Goswami, S.; Ge, Y.; Ilyas, S.; Niu, S. Mismatches between vegetation greening and primary productivity trends in South Asia—A satellite evidence. Int. J. Appl. Earth Obs. Geoinf. 2021, 104, 102561. [Google Scholar] [CrossRef]
  41. Zhao, M.; Heinsch, F.A.; Nemani, R.R.; Running, S.W. Improvements of the MODIS terrestrial gross and net primary production global data set. Remote Sens. Environ. 2005, 95, 164–176. [Google Scholar] [CrossRef]
  42. Bhuyan, U.; Zang, C.; Vicente-Serrano, S.M.; Menzel, A. Exploring Relationships among Tree-Ring Growth, Climate Variability, and Seasonal Leaf Activity on Varying Timescales and Spatial Resolutions. Remote Sens. 2017, 9, 526. [Google Scholar] [CrossRef]
  43. Chen, T.; de Jeu, R.A.M.; Liu, Y.Y.; van der Werf, G.R.; Dolman, A.J. Using satellite based soil moisture to quantify the water driven variability in NDVI: A case study over mainland Australia. Remote Sens. Environ. 2014, 140, 330–338. [Google Scholar] [CrossRef]
  44. Wu, D.; Zhao, X.; Liang, S.; Zhou, T.; Huang, K.; Tang, B.; Zhao, W. Time-lag effects of global vegetation responses to climate change. Glob. Chang. Biol. 2015, 21, 3520–3531. [Google Scholar] [CrossRef] [PubMed]
  45. Du, J.; Zhao, C.; Shu, J.; Jiaerheng, A.; Yuan, X.; Yin, J.; Fang, S.; He, P. Spatiotemporal changes of vegetation on the Tibetan Plateau and relationship to climatic variables during multiyear periods from 1982–2012. Environ. Earth Sci. 2015, 75, 77. [Google Scholar] [CrossRef]
  46. Liu, S.; Cheng, F.; Dong, S.; Zhao, H.; Hou, X.; Wu, X. Spatiotemporal dynamics of grassland aboveground biomass on the Qinghai-Tibet Plateau based on validated MODIS NDVI. Sci. Rep. 2017, 7, 4182. [Google Scholar] [CrossRef]
  47. Chen, C.; Park, T.; Wang, X.; Piao, S.; Xu, B.; Chaturvedi, R.K.; Fuchs, R.; Brovkin, V.; Ciais, P.; Fensholt, R.; et al. China and India lead in greening of the world through land-use management. Nat. Sustain. 2019, 2, 122–129. [Google Scholar] [CrossRef] [PubMed]
  48. Bryan, B.A.; Gao, L.; Ye, Y.; Sun, X.; Connor, J.D.; Crossman, N.D.; Stafford-Smith, M.; Wu, J.; He, C.; Yu, D.; et al. China’s response to a national land-system sustainability emergency. Nature 2018, 559, 193–204. [Google Scholar] [CrossRef] [PubMed]
  49. Qin, Z.; Deng, X.; Griscom, B.; Huang, Y.; Li, T.; Smith, P.; Yuan, W.; Zhang, W. Natural Climate Solutions for China: The Last Mile to Carbon Neutrality. Adv. Atmos. Sci. 2021, 38, 889–895. [Google Scholar] [CrossRef]
  50. Liao, C.; Yue, Y.; Wang, K.; Fensholt, R.; Tong, X.; Brandt, M. Ecological restoration enhances ecosystem health in the karst regions of southwest China. Ecol. Indic. 2018, 90, 416–425. [Google Scholar] [CrossRef]
  51. Xu, X.; Li, X.; Liang, H.; Huang, L. Change in vegetation coverage and its relationships with climatic factors in temperate steppe, Inner Mongolia. Shengtai Xuebao/Acta Ecol. Sin. 2010, 30, 3733–3743. [Google Scholar]
  52. Hu, P.; Zhang, W.; Chen, H.; Li, D.; Zhao, Y.; Zhao, J.; Xiao, J.; Wu, F.; He, X.; Luo, Y.; et al. Soil carbon accumulation with increasing temperature under both managed and natural vegetation restoration in calcareous soils. Sci. Total Environ. 2021, 767, 145298. [Google Scholar] [CrossRef] [PubMed]
  53. Pitman, A.J.; Avila, F.B.; Abramowitz, G.; Wang, Y.P.; Phipps, S.J.; de Noblet-Ducoudré, N. Importance of background climate in determining impact of land-cover change on regional climate. Nat. Clim. Chang. 2011, 1, 472–475. [Google Scholar] [CrossRef]
  54. Chen, J.M.; Ju, W.; Ciais, P.; Viovy, N.; Liu, R.; Liu, Y.; Lu, X. Vegetation structural change since 1981 significantly enhanced the terrestrial carbon sink. Nat. Commun. 2019, 10, 4259. [Google Scholar] [CrossRef] [PubMed]
  55. Li, C.; Zhang, Y.; Shen, Y.; Kong, D.; Zhou, X. LUCC-Driven Changes in Gross Primary Production and Actual Evapotranspiration in Northern China. J. Geophys. Res. Atmos. 2020, 125, e2019JD031705. [Google Scholar] [CrossRef]
  56. Chu, H.; Venevsky, S.; Wu, C.; Wang, M. NDVI-based vegetation dynamics and its response to climate changes at Amur-Heilongjiang River Basin from 1982 to 2015. Sci. Total Environ. 2019, 650, 2051–2062. [Google Scholar] [CrossRef]
  57. Jiang, H.M.; Jiang, H.; Zhou, G.M.; Hong, X.; Xie, X.Z.; Huang, M.L. Spectral reflectance response of plant leaf to simulated UVB stress. Guang Pu Xue Yu Guang Pu Fen Xi 2012, 32, 453–458. [Google Scholar] [PubMed]
  58. Marchin, R.M.; Salk, C.F.; Hoffmann, W.A.; Dunn, R.R. Temperature alone does not explain phenological variation of diverse temperate plants under experimental warming. Glob. Chang. Biol. 2015, 21, 3138–3151. [Google Scholar] [CrossRef] [PubMed]
  59. Rammig, A.; Mahecha, M.D. Ecosystem responses to climate extremes. Nature 2015, 527, 315–316. [Google Scholar] [CrossRef]
  60. Wu, L.; Zhang, Y.; Guo, X.; Ning, D.; Zhou, X.; Feng, J.; Yuan, M.M.; Liu, S.; Guo, J.; Gao, Z.; et al. Reduction of microbial diversity in grassland soil is driven by long-term climate warming. Nat. Microbiol. 2022, 7, 1054–1062. [Google Scholar] [CrossRef]
  61. Fei, X.; Song, Q.; Zhang, Y.; Liu, Y.; Sha, L.; Yu, G.; Zhang, L.; Duan, C.; Deng, Y.; Wu, C.; et al. Carbon exchanges and their responses to temperature and precipitation in forest ecosystems in Yunnan, Southwest China. Sci. Total Environ. 2018, 616–617, 824–840. [Google Scholar] [CrossRef] [PubMed]
  62. Liu, Q.; Fu, Y.H.; Zeng, Z.; Huang, M.; Li, X.; Piao, S. Temperature, precipitation, and insolation effects on autumn vegetation phenology in temperate China. Glob. Chang. Biol. 2016, 22, 644–655. [Google Scholar] [CrossRef] [PubMed]
  63. Wu, Q.; Yue, K.; Ma, Y.; Heděnec, P.; Cai, Y.; Chen, J.; Zhang, H.; Shao, J.; Chang, S.X.; Li, Y. Contrasting effects of altered precipitation regimes on soil nitrogen cycling at the global scale. Glob. Chang. Biol. 2022, 28, 6679–6695. [Google Scholar] [CrossRef] [PubMed]
  64. Lin, C.; He, Y.; Wang, Z. Sensitivity of Vegetation Productivity to Extreme Droughts across the Yunnan Plateau, China. Atmosphere 2023, 14, 1026. [Google Scholar] [CrossRef]
  65. Tollerud, H.J.; Brown, J.F.; Loveland, T.R. Investigating the Effects of Land Use and Land Cover on the Relationship between Moisture and Reflectance Using Landsat Time Series. Remote Sens. 2020, 12, 1919. [Google Scholar] [CrossRef]
Figure 1. Land use-type map of Regional China (2020).
Atmosphere 15 00491 g001
Figure 2. Flowchart.
Atmosphere 15 00491 g002
Figure 3. Accuracy validation results of GPP products at 8-day ((a) PML, (c) MODIS) and annual scales ((b) PML, (d) MODIS).
Atmosphere 15 00491 g003aAtmosphere 15 00491 g003b
Figure 4. The spatial distribution of the interannual variations in GPP in China’s regions from 2000 to 2018, with significantly increased grid areas (p < 0.01) (a); multi-year averages (b); interannual change rates, with the red regions representing the 95% confidence interval (c); and boxplots of interannual change rates in different regions (d).
Atmosphere 15 00491 g004
Figure 5. The interannual change rates of PRCP (a), SR (c), and TEMP (e) from 2000 to 2018, and boxplots of interannual changes in PRCP (b), SR (d), and TEMP (f) in different regions.
Atmosphere 15 00491 g005aAtmosphere 15 00491 g005b
Figure 6. Normalized results (dimensionless) of the GPP and meteorological variables (SR, solar radiation; PRCP, precipitation; GPP, Gross Primary Productivity; TEMP, temperature).
Atmosphere 15 00491 g006
Figure 7. Distribution of the maximum correlation coefficients between GPP and meteorological elements (a) and lag distribution (b).
Atmosphere 15 00491 g007
Figure 8. Statistics of lag periods for GPP response to meteorological elements in different elevation ranges (m).
Atmosphere 15 00491 g008
Figure 9. Statistics of lag periods for GPP response to meteorological elements in different regions.
Atmosphere 15 00491 g009
Figure 10. Statistical analysis of the lag phases in GPP response to meteorological elements in key land use-type regions (C, cropland; F, forest; G, grassland; B, barren land).
Atmosphere 15 00491 g010
Figure 11. Land use-type distribution in Regions V and VII.
Atmosphere 15 00491 g011
Table 1. Remote-sensing data used in this study.
VariablesProductSpatial
Resolution
Temporal
Resolution
PeriodAccess
Address
GPPPML-V2
MODIS
500 m8 days2000–2018https://data.tpdc.ac.cn (accessed on 27 July 2023)
https://modis.gsfc.nasa.gov (accessed on 13 July 2023)
TEMP
PRCP
SR
ERA50.25°hourly2000–2018https://cds.climate.copernicus.eu (accessed on 11 June 2023)
LUCCGlobe
Land30
30 myearly2000–2020http://www.globallandcover.com (accessed on 5 January 2022)
DEMSTART1 kmyearly-http://www.globallandcover.com (accessed on 23 June 2023)
Table 2. Information on the flux stations used in this study.
SiteLatitude
(°N)
Longitude
(°E)
Data PeriodAnnual
Precipitation
(mm)
Annual
Temperature
(°C)
Altitude (m)Vegetation
Type
Cangbaishan (CBS)42.40128.12003–20107133.6738Forest
Changlin (CL)44.59123.512007–20104704.9171Grassland
Dangxiong (DX)30.5091.072006–20104501.3295.7Grassland
Duolun (DL)42.05116.282007–20082751.71350Grassland
Qianyanzhou (QYZ)26.74115.062003–2010154217.9100Forest
Haibei (HB)37.68101.342003–2010535−1.23190Bush
Yucheng (YC)36.83116.572003–200558213.128Cropland
Inner Mongolia (NMG)43.33116.402004–20083380.91200Grassland
Damao (DM)41.64110.332015–2017255.24.61407Grassland
Xiaolangdi (XLD)35.03112.472016–201764213.4410Forest
Xishuangbanna (XSBN)21.93101.272003–2010149321.8750Forest
Disclaimer/Publisher’s Note: The statements, opinions and data contained in all publications are solely those of the individual author(s) and contributor(s) and not of MDPI and/or the editor(s). MDPI and/or the editor(s) disclaim responsibility for any injury to people or property resulting from any ideas, methods, instructions or products referred to in the content.

