Article

Emission Pattern of Biogenic Volatile Organic Compounds from Wetland Vegetation

by
Wenbin Chen
,
Luxi Wang
,
Ju Wu
,
Xiaoxiu Lun
*,
Xiaoyue Wang
and
Xiaoyi Li
College of Environmental Science and Engineering, Beijing Forestry University, Beijing 100083, China
*
Author to whom correspondence should be addressed.
Atmosphere 2024, 15(6), 651; https://doi.org/10.3390/atmos15060651
Submission received: 20 April 2024 / Revised: 11 May 2024 / Accepted: 23 May 2024 / Published: 29 May 2024
(This article belongs to the Special Issue The Role of Vegetation in Urban Air Quality)

Abstract

:
Biogenic volatile organic compounds (BVOCs) significantly contribute to atmospheric chemistry at both regional and global scales. The composition and intensity of BVOC emissions vary significantly among different plant species. Previous studies have focused on BVOC emissions from tree species, but the results of research on BVOC emissions from wetland plants are still limited. Therefore, in this study, BVOCs emitted by three aquatic plants (Phragmites australis, Typha angustifolia, and Iris pseudacorus) were sampled and analyzed using a dynamic headspace technique combined with GC-MS at daily scales. The diurnal observation data showed that the total BVOC emission rates of the three plants peaked with the increase in environmental factors (temperature, PAR, and water temperature). P. australis was the only of the three plants that emitted isoprene with a high rate of 48.34 μg·g−1Dw·h−1. Moreover, the peak emission rates of total BVOC (78.45 μg·g−1Dw·h−1) in P. australis were higher than most tree species. The emissions rates of volatile organic compounds, including monoterpenes, oxygenated volatile organic compounds, alkanes, and other volatile organic compounds, were statistically correlated across all species. The emission rates of isoprene from P. australis had significant associations with intercellular CO2 concentration (Ci) (0.58, p < 0.05) and transpiration rate (Tr) (−0.63, p < 0.01). The emission rates of monoterpenes from P. australis were found to have a significantly positive correlation with the net photosynthetic rate (Pn) (0.58, p < 0.05) while T. angustifolia (−0.59, p < 0.05) and I. pseudacorus (−0.47, p < 0.05) showed the opposite trend. Such findings hold significance for the refinement of localized emission inventories and the development of comprehensive emission process models in future research, as BVOC emissions from wetland plants were reported here for the first time.

1. Introduction

Biogenic volatile organic compounds (BVOCs) are produced by various plant species as part of their physiological metabolism [1]. The high reactivity of BVOCs contributes to the formation of troposphere air pollutants, such as ozone, secondary organic aerosols, and fine particulate matter [2]. Globally, plants emit a substantial amount of BVOCs, with an annual emission of 591 Tg [3]. In China, the total emissions of BVOCs are estimated at 58.89 Tg, which is approximately 2.2 times the emissions of anthropogenic volatile organic compounds (AVOCs) [4,5]. In many regions of China, the concentration of ozone has exceeded national standards and the frequency of secondary organic aerosol pollution has increased [6,7]. Especially in summer, the contribution of BVOCs to SOA was up to 74% in China [8]. Therefore, BVOC emissions play significant roles in air quality and the carbon cycle, both regionally and globally.
The estimation of BVOC emissions depends on the emission factors. Many studies have investigated the emission factors of BVOCs from various terrestrial plants, especially tree species [9,10,11,12]. However, BVOC emissions from wetland plants have not been sufficiently emphasized, even though studies have shown that some wetland species (e.g., Phragmites australis) have significant emission potential [13,14]. The natural wetland area, which includes coastal wetlands, riparian wetlands, and peatlands, covers 7 × 10⁶ to 9×10⁶ km2, constituting 5% to 8% of the terrestrial surface area [15,16]. China has a vast land area and rich vegetation types, with a natural wetland area of approximately 4.5 × 10⁵ km2 [17]. Urban wetlands can provide a variety of functions for the sustainable development of cities, such as water quality purification, carbon sequestration, biodiversity conservation, and reducing urban heat island effects [18,19,20,21]. The core function of urban wetlands lies in wetland vegetation, and the selection and management of plant species are of great significance for the efficient utilization of urban wetlands to enhance urban sustainability [22]. Therefore, it is essential for large amounts of measurements on BVOC emission factors from various plants and vegetation types. Although large amounts of studies have been conducted to investigate the BVOC emission factors of dominant species in different Chinese regions [23,24,25,26,27,28,29], the field measurements of BVOC emissions from wetland species are still limited. In such a context, emissions from wetlands are typically ignored in emission inventory studies, leading to significant underestimates of regional and global BVOC emission estimations. Therefore, there is an urgent need to conduct studies on BVOC emission rates of wetland aquatic vegetation, as well as their impact factors.
The emission rates of BVOCs from plants can be influenced by various factors, with plant species variation being the primary determinant. Trees typically exhibit higher BVOC emission rates compared to shrubs, herbaceous plants, and crops [30,31,32]. Notably, isoprene is primarily emitted by broadleaf forests, while coniferous forests typically emit monoterpenes [26]. BVOC emissions are influenced by plant age and the developmental stage of organs, but the patterns are not well understood [33]. Among environmental factors, temperature and photosynthetically active radiation are the principal drivers of plant BVOC emissions. The temperature has a significant impact on the enzymatic activity of plants, which in turn affects the release of isoprene and monoterpenes. BVOC emission rates generally increase with rising temperatures within a 15–30 °C range. However, excessively high temperatures can lead to enzyme inactivation, resulting in a decrease in the emission rates of BVOCs [34]. Similarly, within a certain range of PAR (500–2000 µmol·m−2·s−1), the emission rates of terpenes exhibit a positive correlation [35,36,37]. Numerous studies have investigated the relationship between BVOC emissions from tree leaves and physiological parameters at both micro and macro levels [9,11,38,39,40]. By understanding the correlation between these factors, it is possible to develop more accurate emission process models and predict the total BVOC emissions in specific regions. Studies on the correlation between photosynthetic parameters and tree BVOC emission rates have also shown that the physiological mechanisms affecting BVOC emissions from plants are complex. Notably, Lyu et al. elucidate the complex physiological mechanisms underlying isoprene emissions across various subtropical tree species, emphasizing the pivotal roles of photosynthetic rates and stomatal conductance [41]. Given the nuanced interrelationships among these factors, it is important to conduct region-specific studies to further develop models for the BVOC emission process and inventories.
In this study, BVOC emission factors from wetland aquatic plants were measured and the connection between BVOC emission rates, environmental factors, and physiological parameters was analyzed. Three aquatic species were chosen as sampling objects, specifically P. australis, Typha angustifolia, and Iris pseudacorus, and their BVOC emissions were collected using the dynamic headspace sampling method. During each sampling event, environmental factors such as air temperature, photosynthetically active radiation, water temperature, and vapor pressure deficit along with plant physiological parameters including net photosynthetic rate, stomatal conductance, intercellular CO2 concentration, and transpiration rate were measured. The results of this study will not only enhance our understanding of emission factors but also pave the way for the development of more comprehensive BVOC emission models.

2. Materials and Methods

2.1. Sampling Sites and Plant Species

The Baiyangdian wetland (Figure 1) is situated in Anxin County, Baoding City, Hebei Province, China, between 38°43′ N and 39°02′ N latitudes and 115°45′ E and 116°07′ E longitudes. It is the largest freshwater wetland system in the North China Plain, covering an area of 366 km2. The region has a warm temperate continental monsoon climate, with an average annual temperature of 12.2 °C and an average annual rainfall of 550 mm. The Baiyangdian wetland is a unique plant-dominated wetland with a unique ecological pattern of interlaced aquatic fields and villages, allowing for a diverse range of aquatic and terrestrial vegetation to coexist. The wetland’s vegetation can be classified into four categories: emergent, submerged, floating, and floating leaf vegetation. Emergent and submerged vegetation are the dominant groups in the aquatic vegetation of Baiyangdian, with P. australis being the prominent species of emergent vegetation that covers the entire wetland. In addition, there are species such as T. angustifolia, Nelumbo nucifera, Nymphaea tetragona, and I. pseudacorus. In summer and autumn, some submerged plants will die due to water level fluctuations and lifestyle habits.

2.2. BVOC Sampling and Analysis

The dynamic headspace sampling method was used to collect plant BVOCs. The healthy plant branches and leaves to be tested were enclosed in a 10 L Teflon sampling bag (TF-402-10, Dalian Delin Gas Packaging, China) (TF-402-10, Dalian Delin Gas Packaging, Dalian, China)and sealed with a strip. The inlet valve and outlet valve on the bag were then opened and the inlet valve was connected to a sampling pump (QC-1B, Beijing Municipal Institute of Labor Protection, China) (QC-1B, Beijing Municipal Institute of Labor Protection, Beijing, China) using an FEP (fluorinated ethylene propylene) tube (inner diameter 6 mm, outer diameter 8 mm, Shanghai Huijing Electromechanical Equipment, China) (inner diameter 6 mm, outer diameter 8 mm, Shanghai Huijing Electromechanical Equipment, Shanghai, China). Purified air was introduced into the bag, passing through an activated carbon and O3 removal column (filled with granular KI 1.42.5 g, Ningbo Huance Experimental Equipment, China) (filled with granular KI 1.42.5 g, Ningbo Huance Experimental Equipment, Ningbo, China). Once the bag was filled, the valves were closed, and an adsorption tube filled with Tenax TA (0.18–0.25 mm diameter adsorbent particles, Camsco Company, USA) (0.18–0.25 mm diameter adsorbent particles, Anpel Laboratory Technologies, Shanghai, China) was connected to the outlet valve. Then, the inlet and outlet valves were both opened. Sampling was then performed for 1 h at a gas flow rate of 200 mL·min−1. After each sample collection, the sampling bags were removed and the vapor was extracted to prevent disturbance in the next sample collection (Figure S1).
The collected samples were analyzed using GC-MS (Turbo Matrix Clarus 600, Perkin Elmer, USA) (Turbo Matrix Clarus 600, Perkin Elmer, Massachusetts, USA). Firstly, the sample adsorption tubes were heated at 260 °C for 5 min to release the volatile organic compounds. Then, the released compounds were introduced into a cold trap at −25 °C. Next, the condensed compounds were heated rapidly in the cold trap from 260 °C to 300 °C at a heating rate of 40 °C·s−1 before introducing them into the chromatograph. The DB-5MS model chromatography column (30 m in height, inner diameter 0.25 mm, pore size 0.25 μm) was used. The column heating process had three stages: 40 °C, 160 °C, and 270 °C, each stage maintained for 2, 2, and 3 min, respectively. A mass spectrometer with electron bombardment ionization mode was used, with an energy of 70 electron volts and scanning atomic mass range of 30–500 atomic mass units.
BVOCs were identified and quantified via the external standard method according to the retention time, peak area, and standard mass spectra in the NIST 2008 library. Each compound’s qualitative similarity should be greater than 90%.To quantify the peak areas of each compound, an external standard method was used with a linear fit of R2 > 0.99. Standard dilution and standard curve preparation are described in Table S2.
Sampling was conducted during sunny days with ample sunlight, from 7:00 to 18:00 in August 2023. Several healthy plants grown consistently and nearby were selected for BVOC sampling. A total of 6 time periods were taken. The sampling interval was set at 2 h. A total of 3 replicate samples were collected during each 1 h sampling period. An adsorption tube was connected at the inlet of the sampling pump to collect air samples. Sampling was then performed for 1 h at a gas flow rate of 200 mL·min−1. The mass of each substance in the air sample was subtracted to obtain the actual mass of each substance emitted by the plant. After sampling, the foliage enclosed in the bag was cut and dried at 60 °C for 48 h to obtain the dry weight (Dw).
During the BVOCs sampling process, the air temperature, water temperature, and photosynthetically active radiation were recorded every 30 min. Air temperature was measured using Kestrel 4000 meteorological instruments (Kestrel, USA) (Kestrel 4000, Miami, USA). Water temperature was measured using thermometers (mbs-spwdj01 Doctor Mu, China) (mbs-spwdj01, Doctor Mu, Zhejiang, China). PAR (photosynthetically active radiation) was measured using SKP 215 PAR Quantum light sensors (Skye Instruments Ltd., UK) (Skye Instruments Ltd., Wells, UK). All the instruments were positioned adjacent to the sampling bags.

2.3. BVOC Emission Rates

Emission rates (ER), expressed as microgram (carbon) per gram leaf dry weight per hour, were calculated using
E R = m t × M
where E R is the emission rates of each sampled plant species (μg·g−1Dw·h−1), m is the microgram of each compound in the obtained adsorbent tube (μg), M is the dry weight of the inner leaf in the sampling bag (g), and t is the sample collection time (h).

2.4. Physiological Parameters

During the collection process of BVOC samples, healthy plant leaves with consistent growth conditions were synchronously collected to analyze the correlation between plant emission rate of volatile organic compounds and photosynthetic physiological parameters. Plant leaf physiological parameters such as net photosynthetic rate (Pn) (µmol CO2·m−2·s−1), stomatal conductance (Gs) (mmol H2O m−2s−1), intercellular CO2 concentration (Ci) (µmol CO2·mol−1), transpiration rate (Tr) (mmol H2O m−2s−1), and vapor pressure deficit (Vpd) (kPa) were collected using a portable photosynthesis system LI-6400xt with a standard 2 × 3 cm2 leaf chamber (LiCor Inc., Lincoln, USA) (LiCor Inc., Nebraska, USA). Every hour, 3 sets of data were recorded for each measurement. During the measurement of each leaf, data were recorded several times after the indication was stable, and the average value was taken as a repetition.

2.5. Statistical Analysis

Pearson’s correlation analyses were conducted to examine the correlations between different BVOC emission rates and plant photosynthetic parameters. All statistical analyses were performed using SPSS (v27.0; SPSS Inc., Chicago, IL, USA).

3. Results

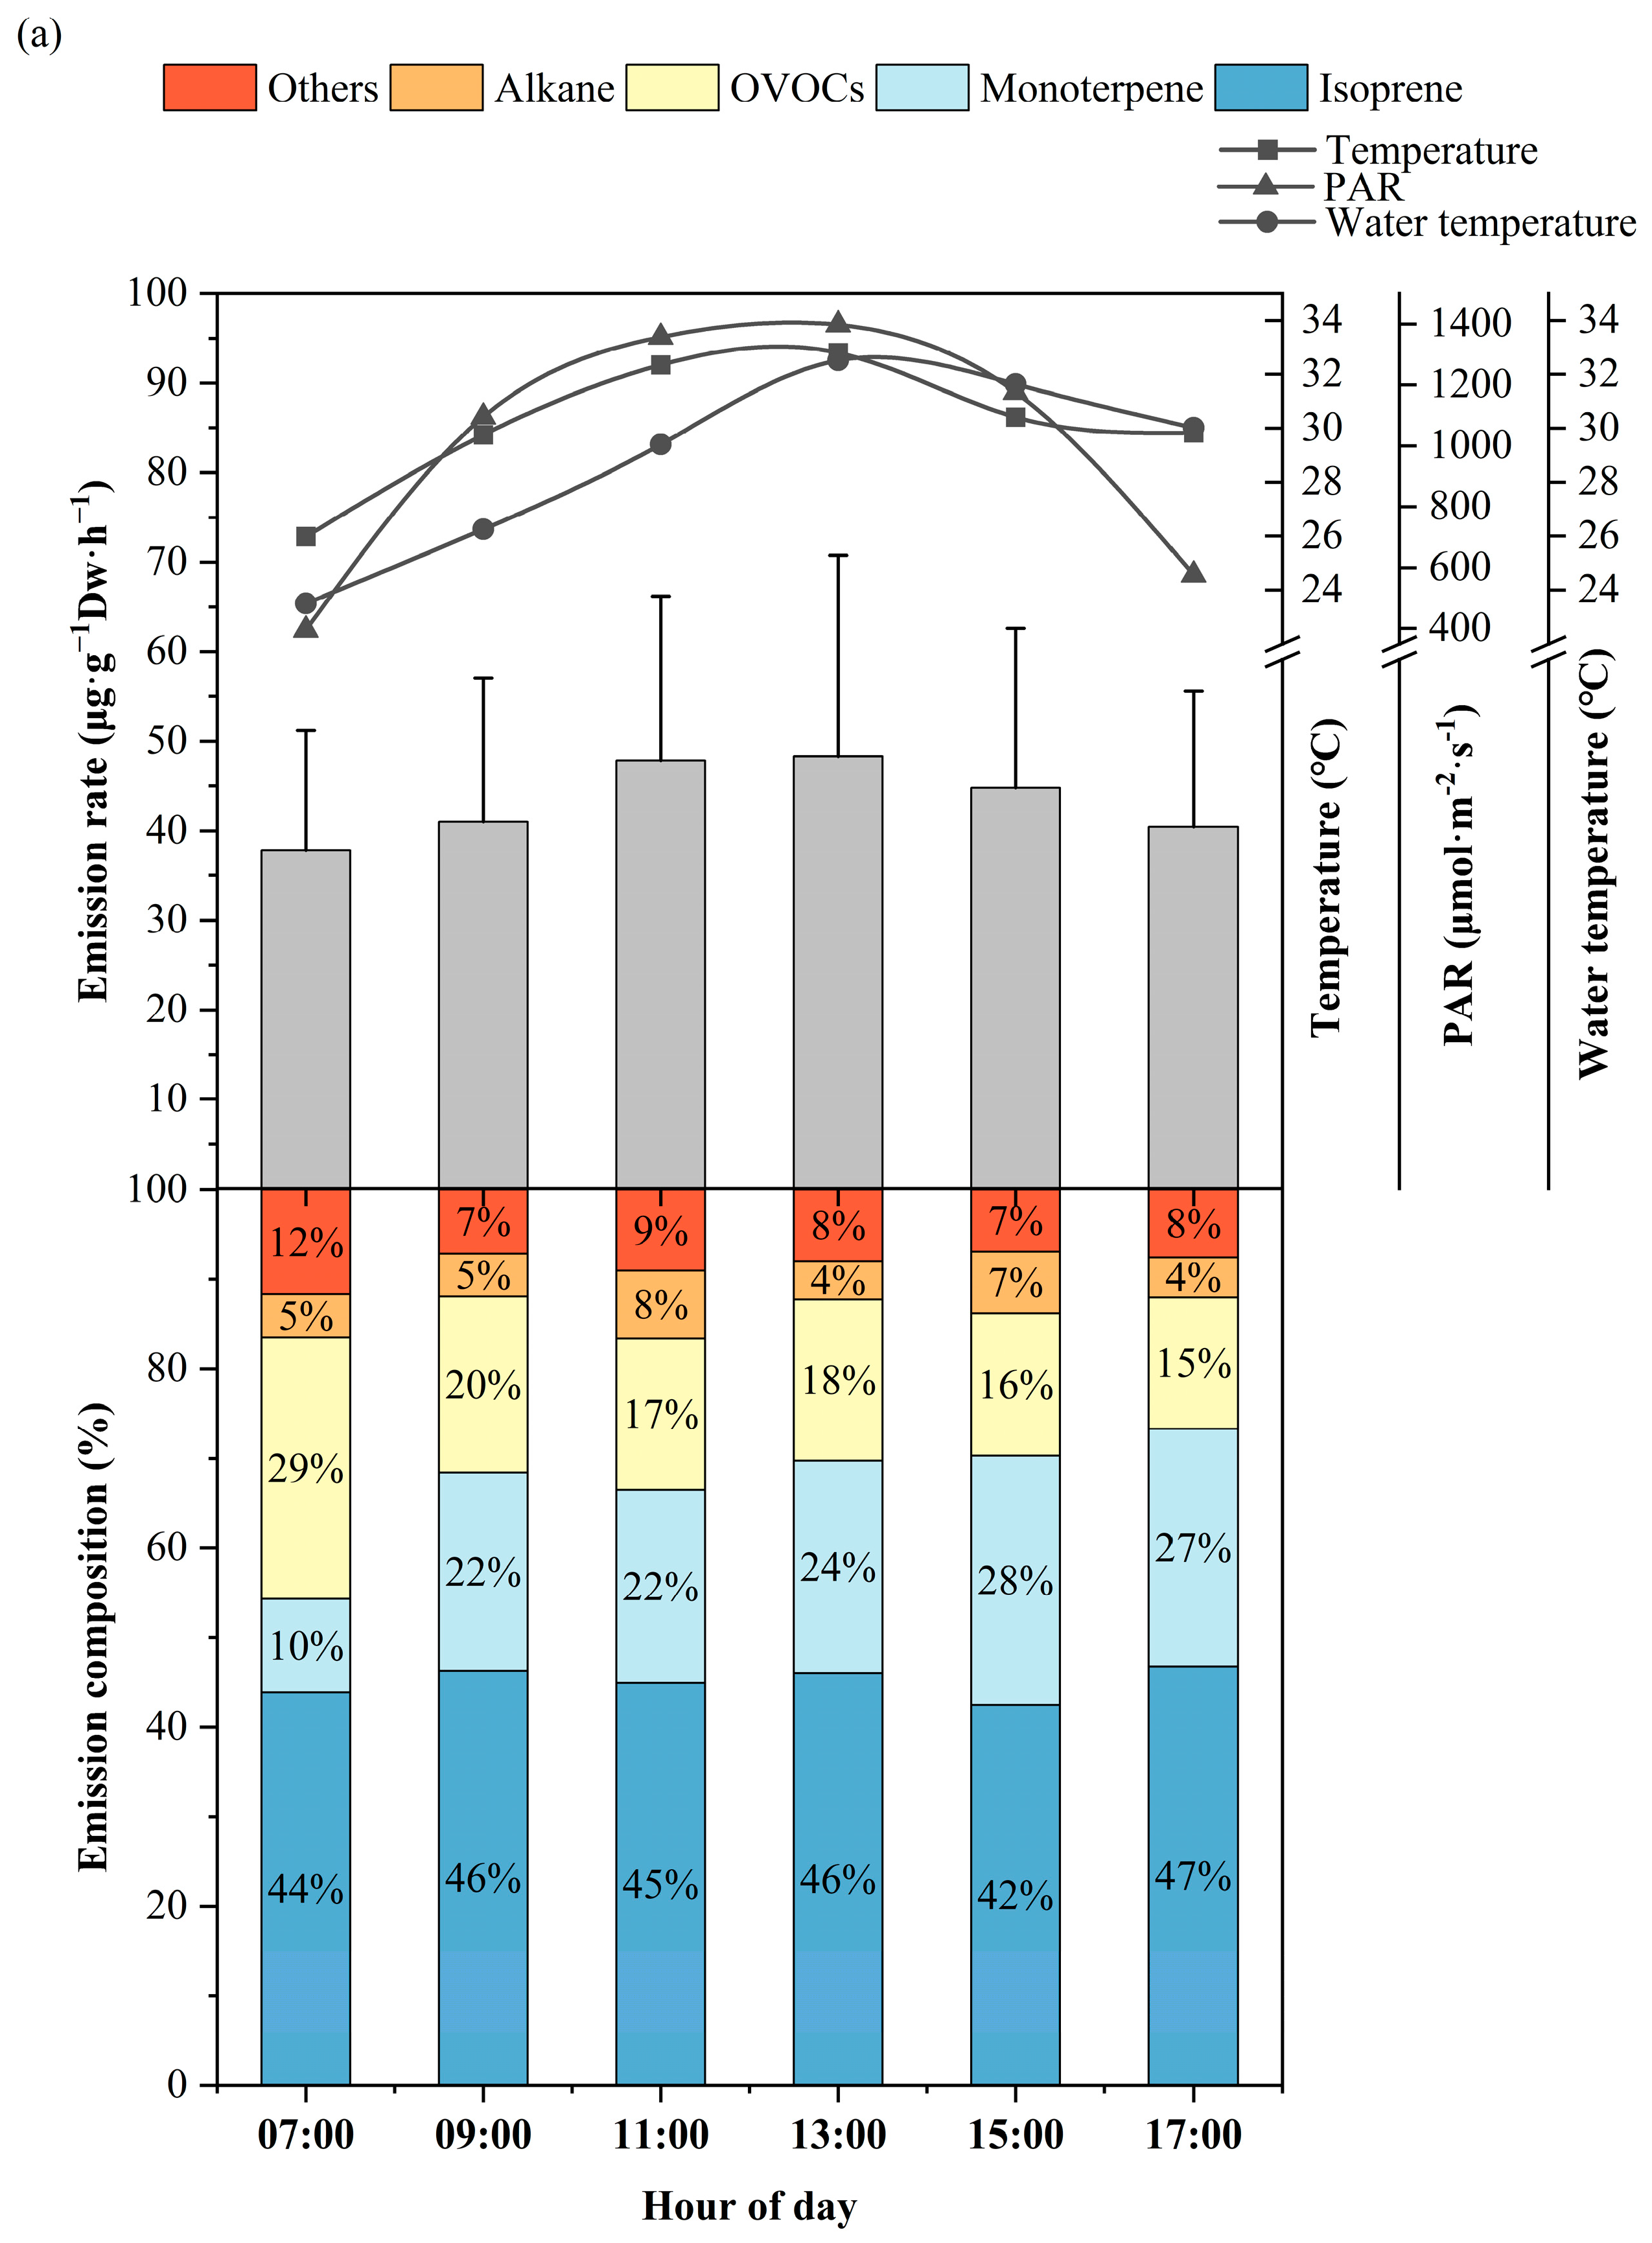
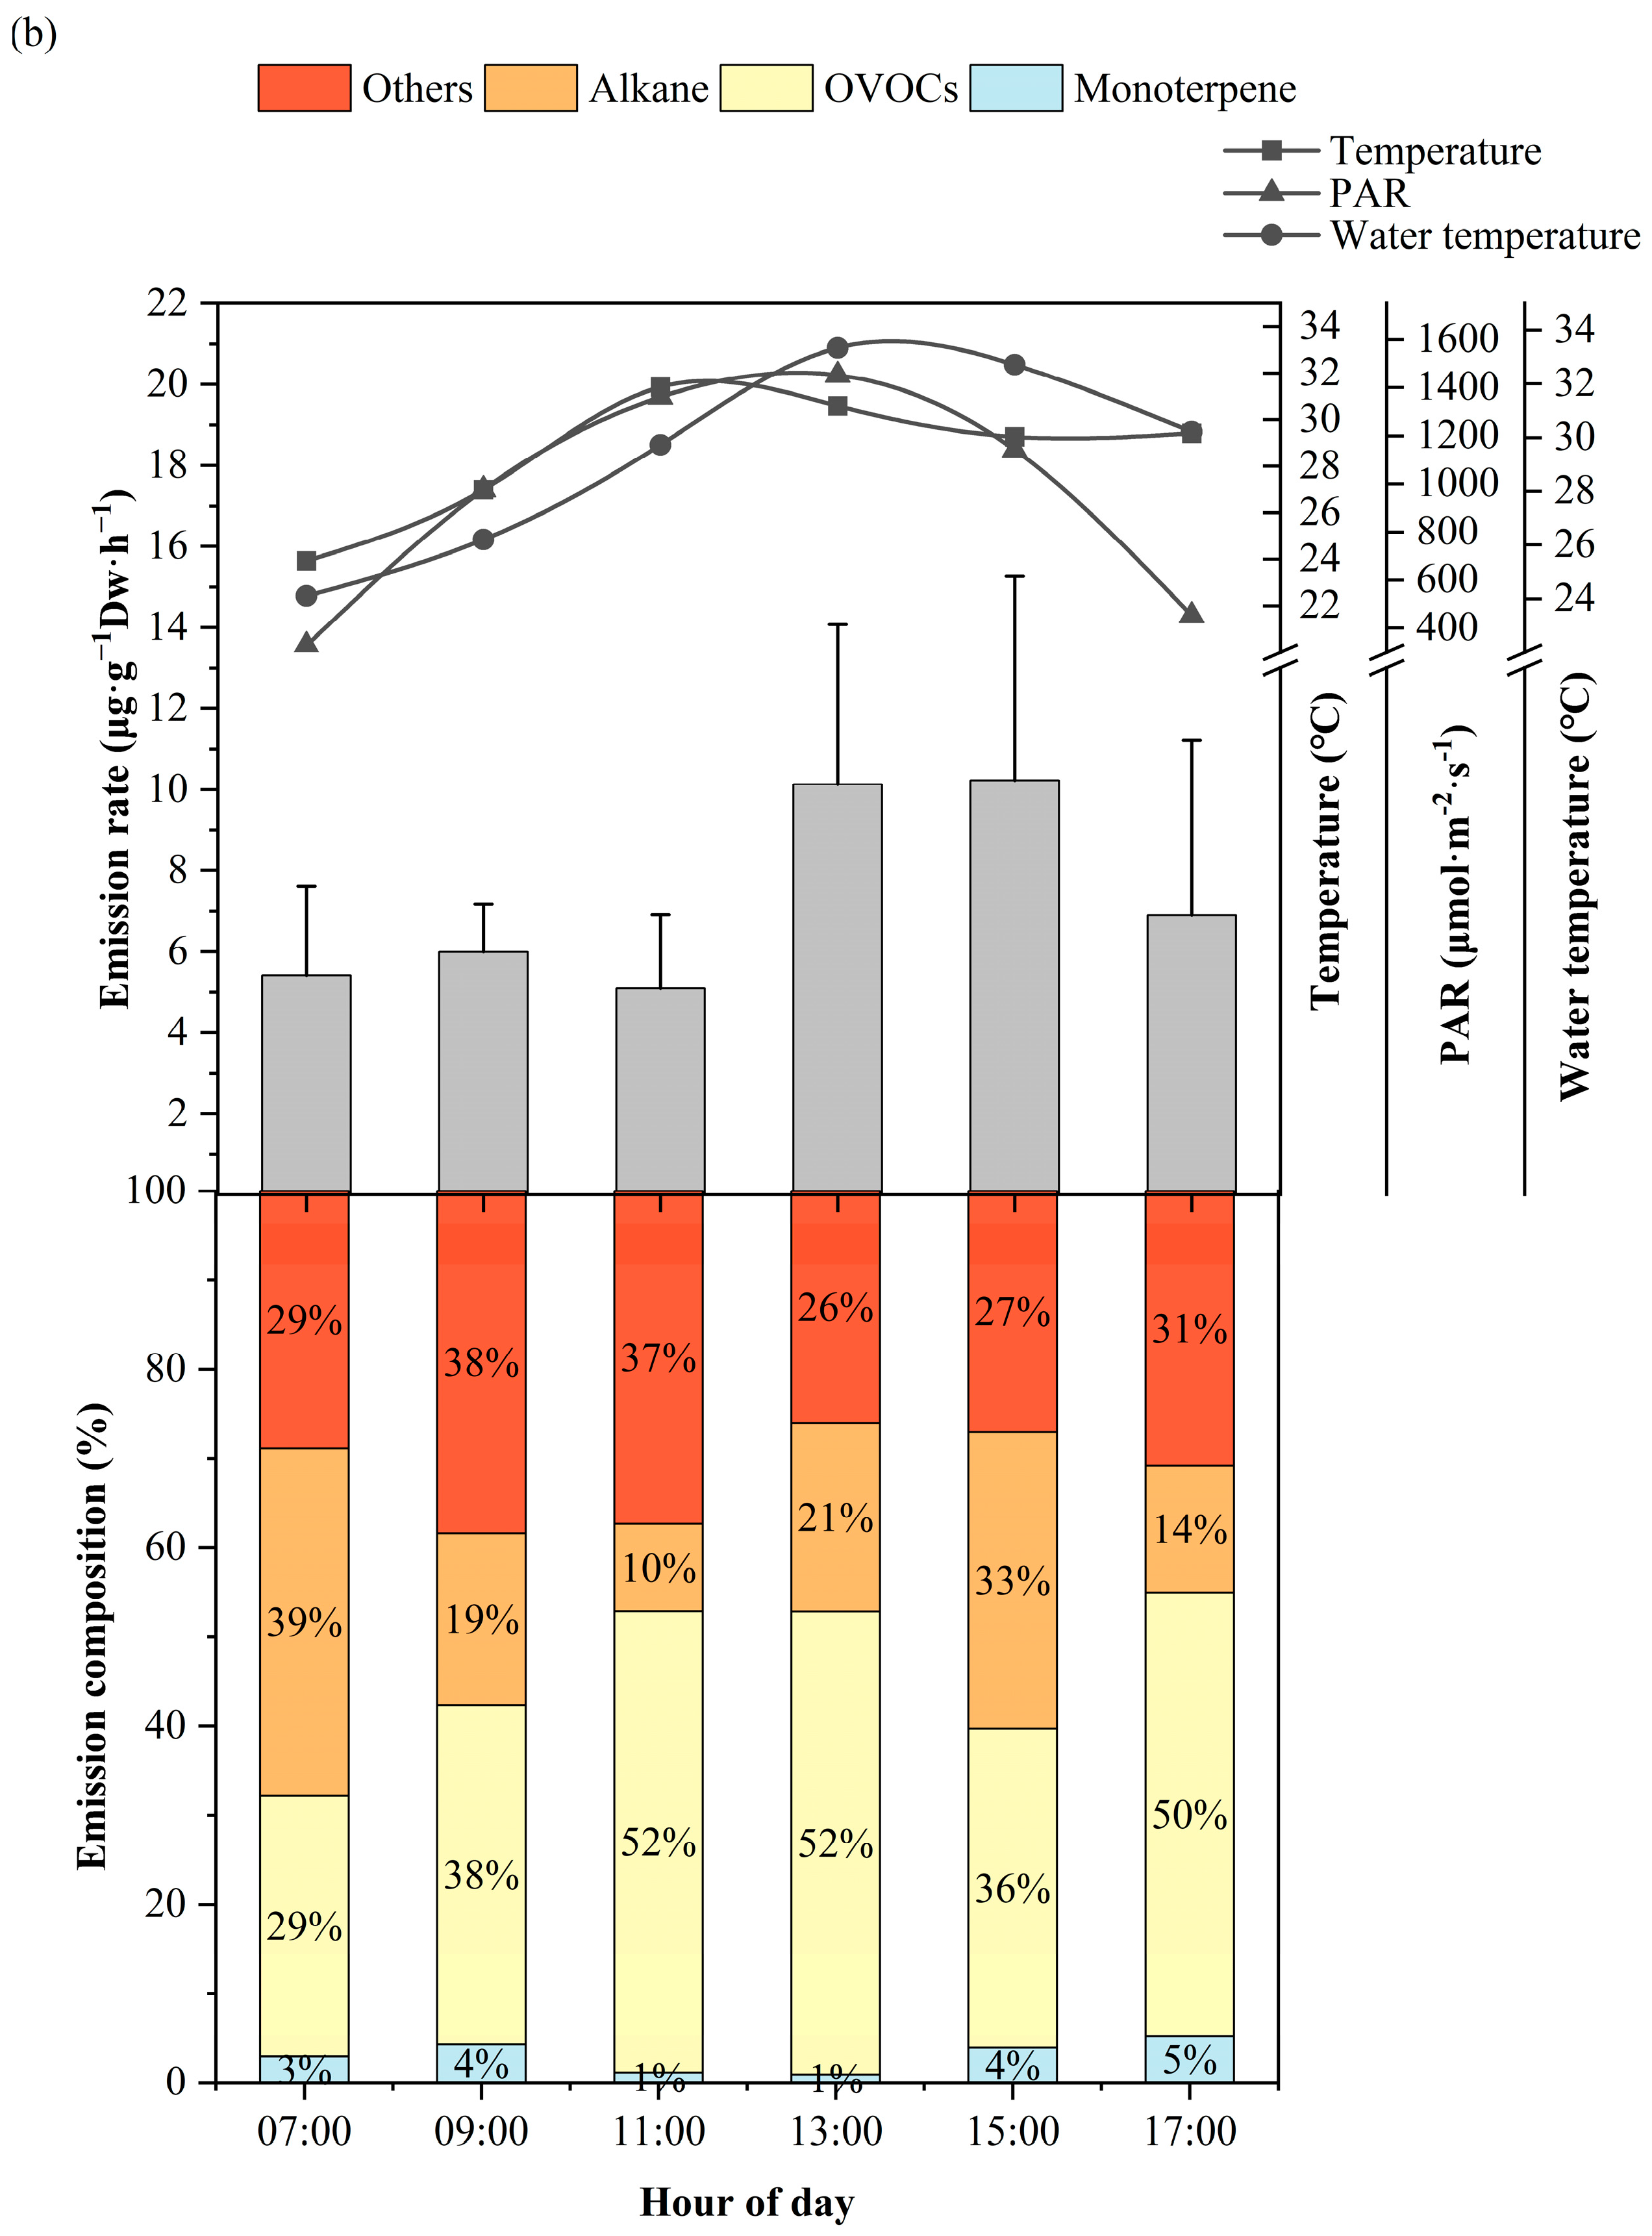
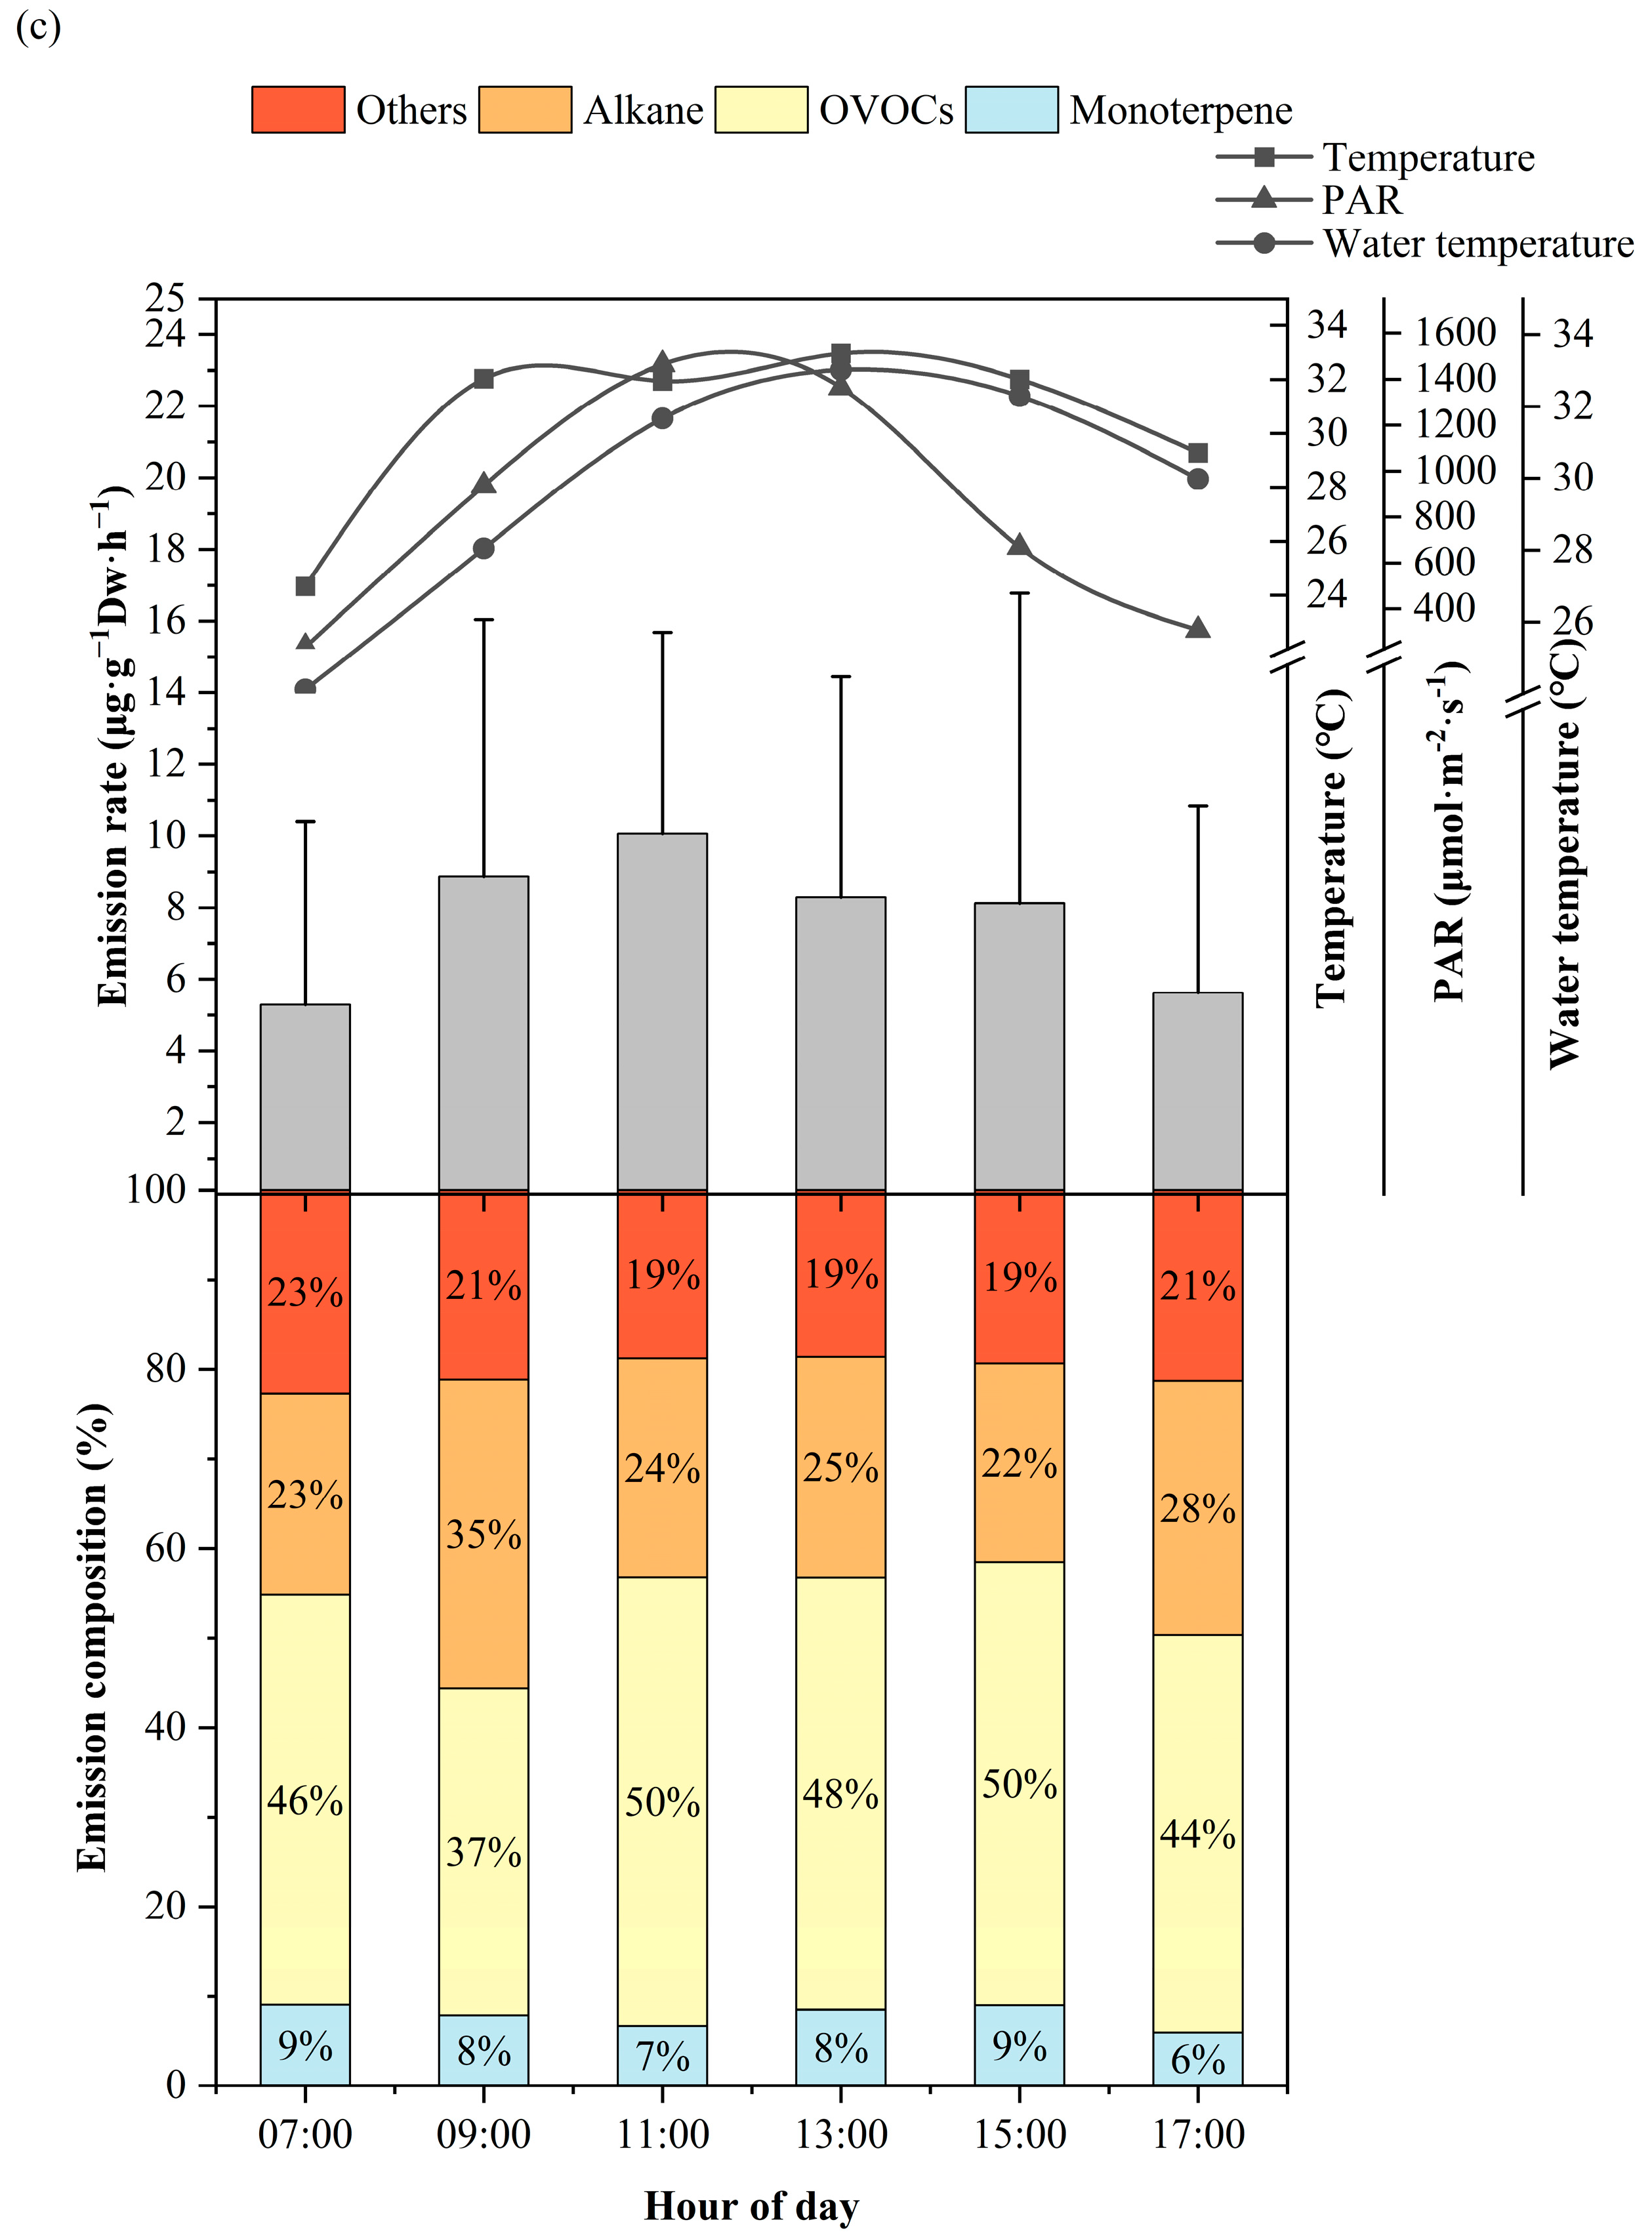
3.1. Diurnal Variation of BVOCs

Throughout the sampling period, BVOCs were divided into five main categories for statistical analysis. There were several categories of compounds that were included, such as isoprene, monoterpenes, OVOCs (oxygenated volatile organic compounds), alkanes, and other compounds. Samples collected were detected a total of nine monoterpenes, forty OVOCs, and fifteen alkanes. OVOCs were primarily composed of alcohols, ketones, aldehydes, carboxylic acids, and esters. Other compounds contained aromatic compounds and their derivatives. Isoprene emissions made up 50% of total BVOC emissions in P. australis samples, while monoterpenes accounted for around 25% (Table S3). Neither T. angustifolia nor I. pseudacorus emitted isoprene (Tables S4 and S5). The T. angustifolia samples had the highest number of compounds detected, with a total of 72 species, of which OVOCs accounted for more than 50% of the total emissions. (Z)-β-Ocimene (56.2%) was the most abundant monoterpene emitted from P. australis samples, while limonene (55.1%, 66.3%) was the predominant monoterpene emitted from samples of T. angustifolia and I. pseudacorus (Figure 2).
The emission composition of BVOCs from P. australis remained quite stable throughout the day, with isoprene emissions accounting for around 50% of the total emissions. The proportions of OVOCs and monoterpenes varied between 10% to 30%, with OVOCs showing a decreasing trend throughout the day, while the proportion of monoterpenes increased. As the day progressed, the combined share of isoprene and monoterpenes in the total emissions increased and ranged from 54% to 74% (Figure 3). The emission composition of BVOCs from T. angustifolia had a higher proportion of OVOCs compared to other components throughout all periods, and this proportion showed an increasing trend over time. During the daytime, the share of monoterpenes in total emissions was extremely low, not exceeding 5% (Figure 3). The emission composition of BVOCs from I. pseudacorus showed that OVOCs comprised approximately 50% of the total emissions for most periods. This proportion was consistently higher than the proportions of other components. Monoterpenes, on the other hand, made up a relatively small share of total emissions, not exceeding 10% (Figure 3).
The study found that the highest total BVOC emission rates from P. australis were 48.34 ± 22.41 μg·g−1Dw·h−1, which occurred during the time interval from 13:00 to 14:00. Additionally, the total emission rates of BVOCs were observed following a similar unimodal curve as the variations in temperature, photosynthetically active radiation, and water temperature. The emission rates of isoprene and monoterpenes from P. australis displayed a pattern of increasing followed by decreasing. Specifically, the emission rates of isoprene showed two peaks that were closely spaced, occurring between 11:00–12:00 and 13:00–14:00. The maximum values recorded for these peaks were 41.00 ± 14.59 μg·g−1Dw·h−1 and 41.03 ± 17.83 μg·g−1Dw·h−1, respectively. These values coincided with the highest temperature points, photosynthetically active radiation, and water temperature during the diurnal cycle. Although the overall trend of monoterpene emission rates from P. australis was similar to the environmental factors, the peak emission rates of monoterpenes occurred during the time interval 15:00–16:00, with a value of 2.21 ± 3.12 μg·g−1Dw·h−1, lagging behind the peak occurrence of environmental factors (13:00–14:00). This indicated a “delayed” response in variation of emission rates. This can be attributed to environmental factors’ indirect influence on monoterpene emission.
The study recorded the highest total BVOC emission rates from T. angustifolia from 15:00–16:00, reaching a value of 10.23 ± 5.04 μg·g−1Dw·h−1. Similarly, the highest total BVOC emission rates from I. pseudacorus were recorded during the 11:00–12:00, with a value of 10.06 ± 5.63 μg·g−1Dw·h−1. The emission rates of total BVOCs from T. angustifolia showed a bimodal curve with an initial increase, followed by a decrease, then another increase, and a subsequent decrease. The emission rates of monoterpenes from T. angustifolia showed two peaks: 9:00–10:00 (0.41 ± 0.50 μg·g−1Dw·h−1) and 15:00–16:00 (0.54 ± 0.89 μg·g−1Dw·h−1). At noon (11:00–12:00), when temperature and photosynthetically active radiation reached their daily peak values, the emission rates of monoterpenes decreased to the lowest value of 0.03 ± 0.01 μg·g−1Dw·h−1. The emission rates of BVOCs from I. pseudacorus varied over time and showed a curve with a single peak characterized by an initial increase followed by a decrease. In addition, the emission rates of monoterpenes from I. pseudacorus showed two peaks at 9:00–10:00 (0.34 ± 0.18 μg·g−1Dw·h−1) and 15:00–16:00 (0.40 ± 0.36 μg·g−1Dw·h−1), as shown in Figure 3.

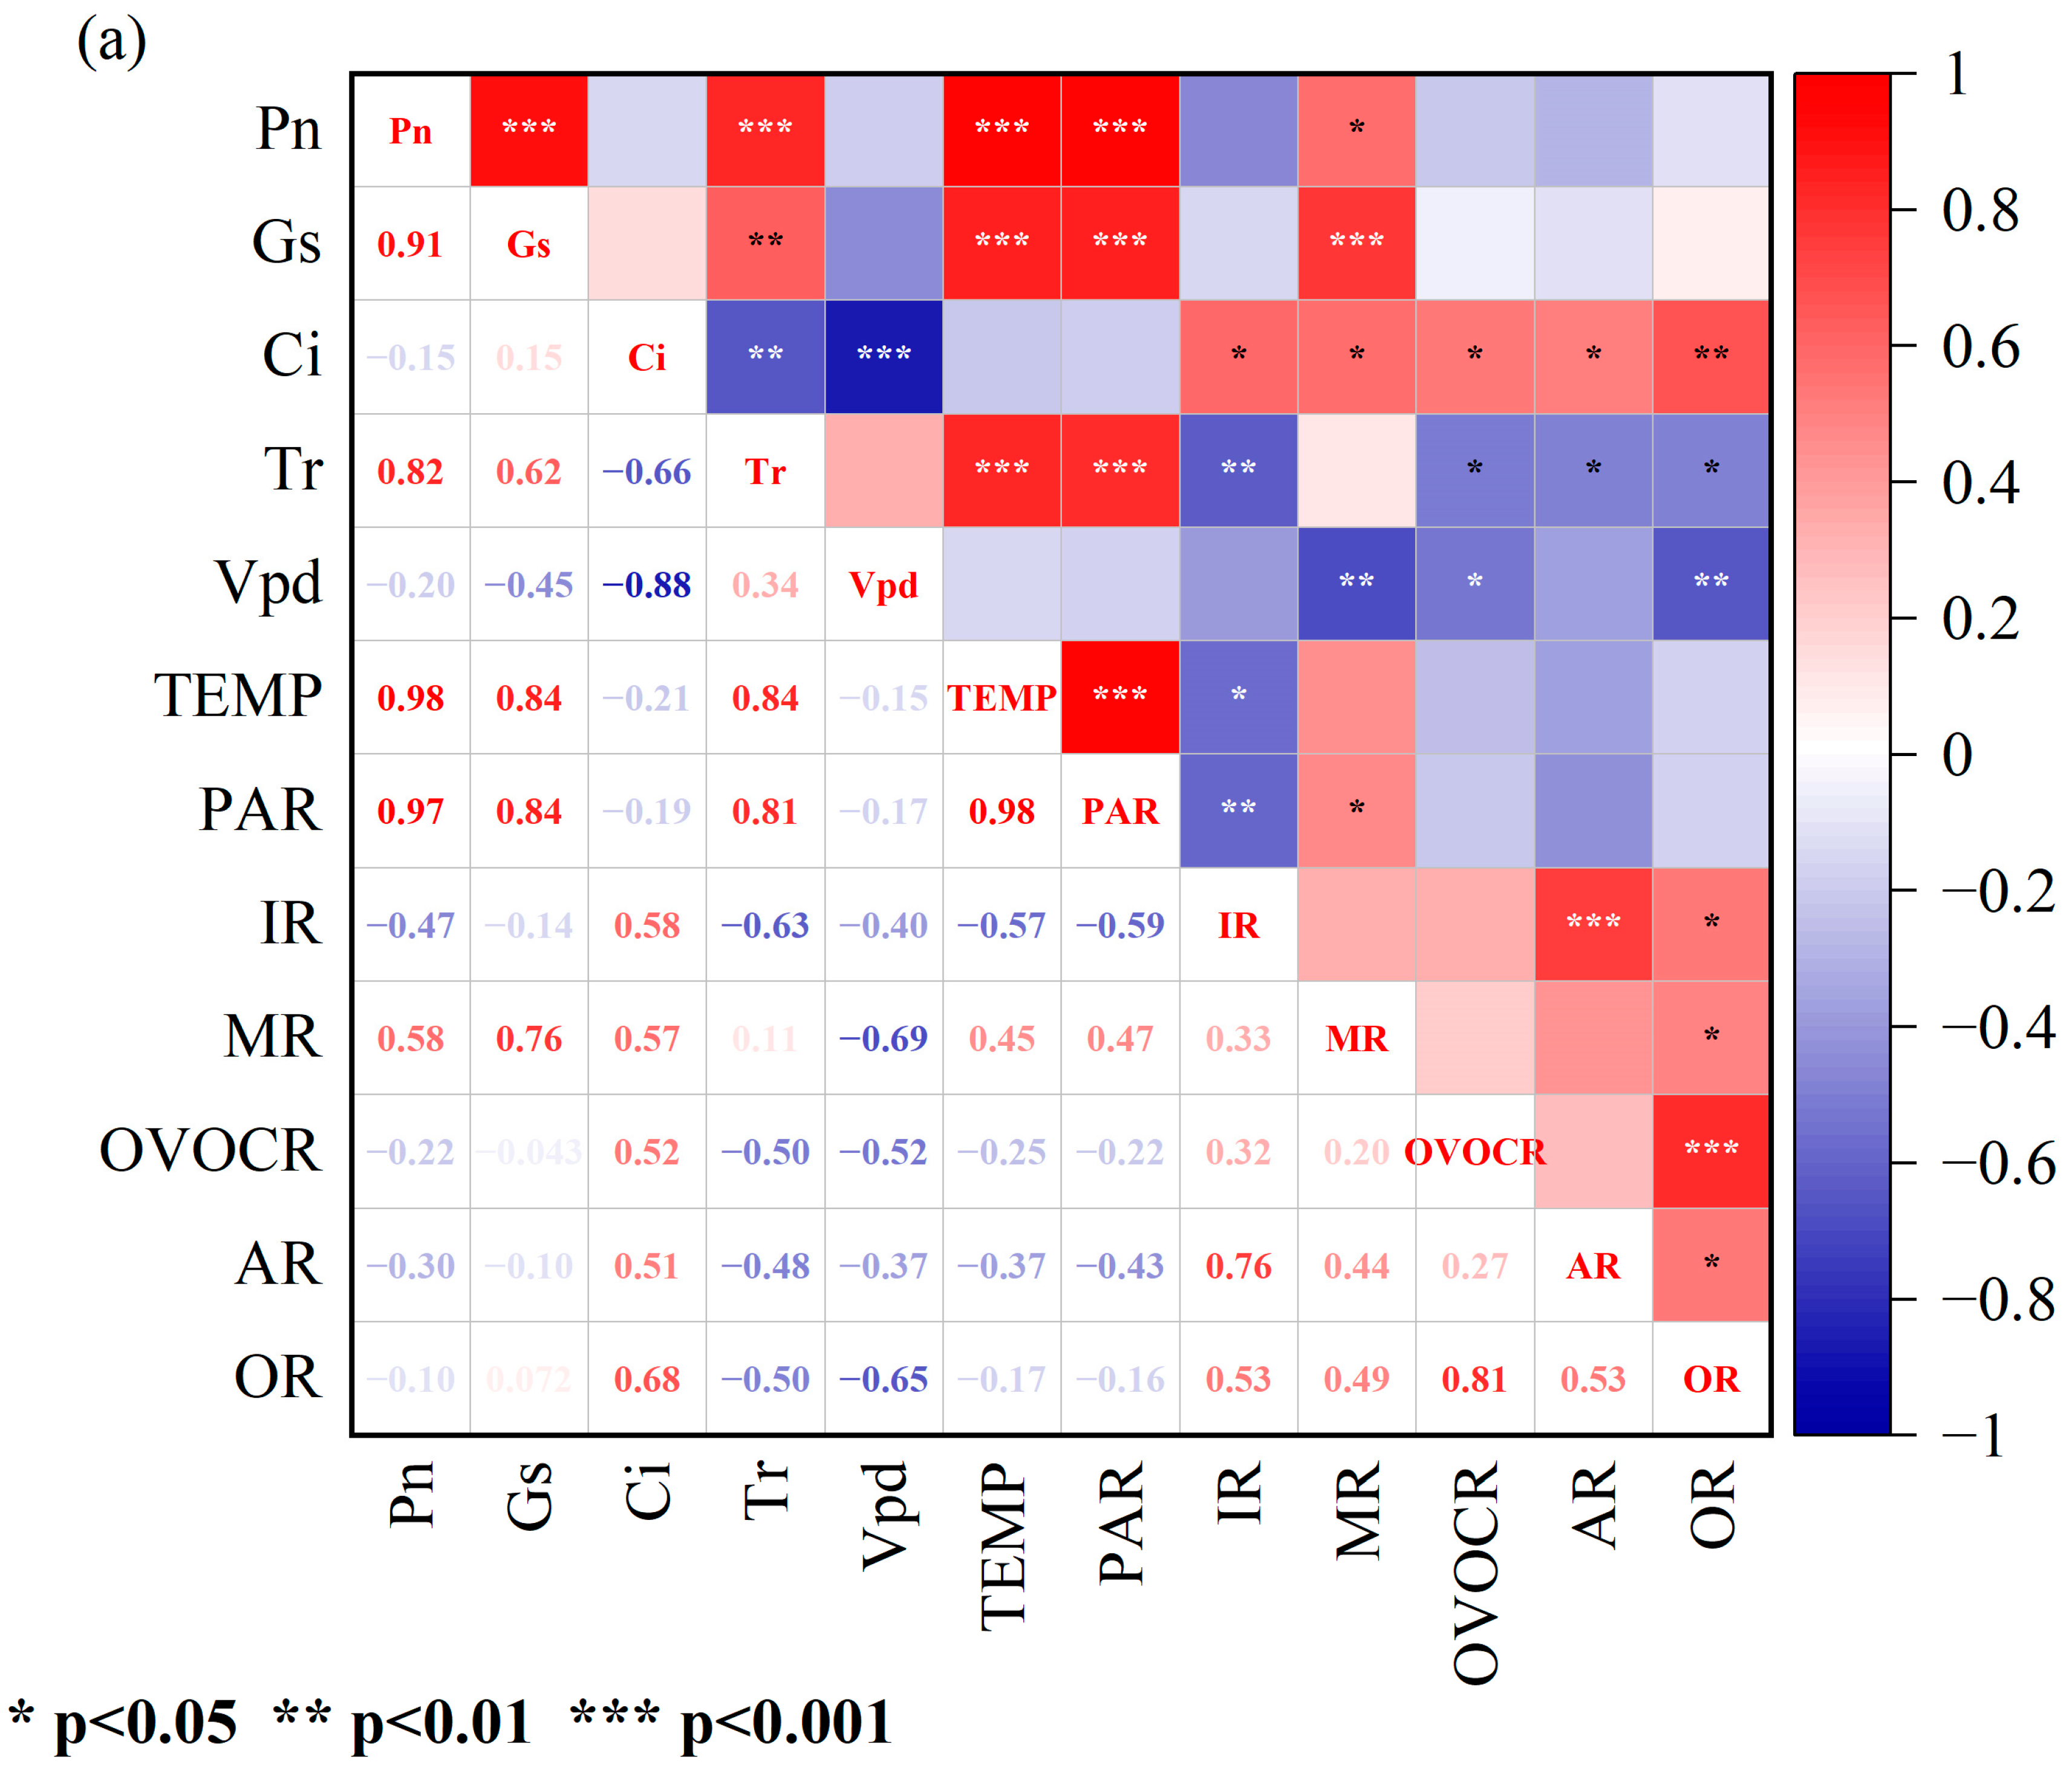
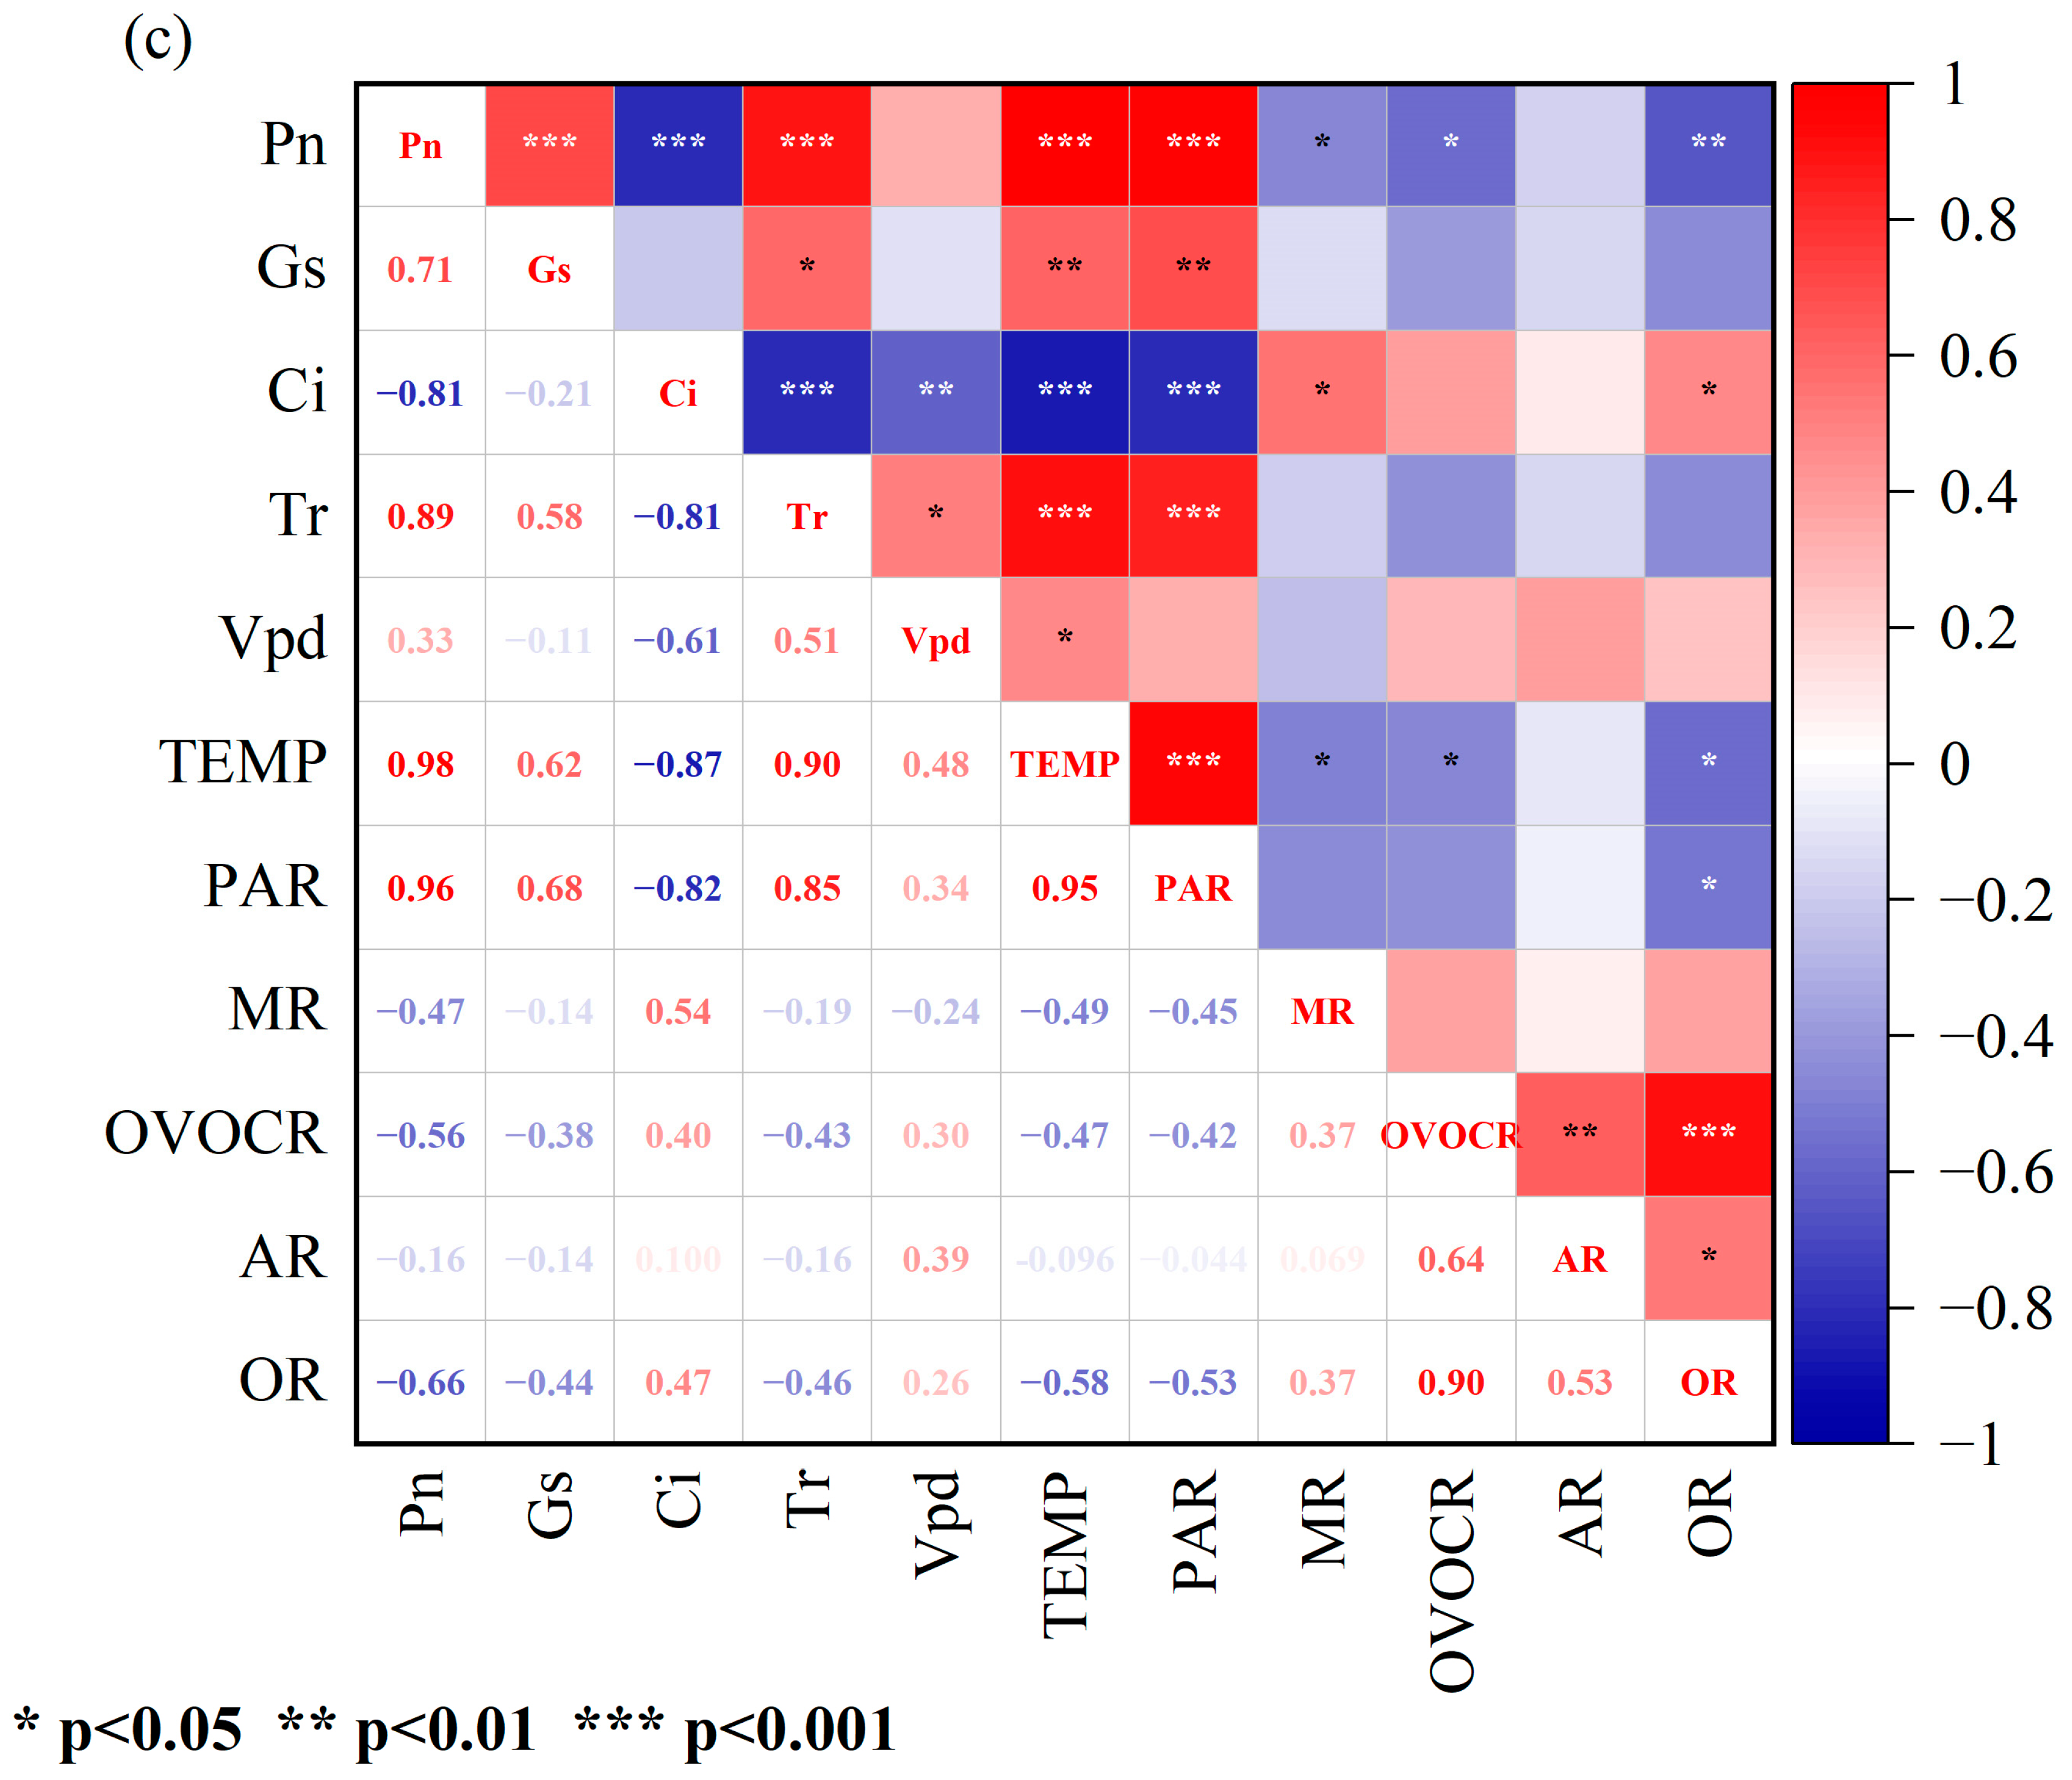
3.2. Correlations between Physiological Parameters and BVOC Emission Rates

The emission rates of various BVOC components with photosynthesis parameters were correlated using Pearson’s correlation analyses (Figure 4). The emission rates of isoprene (IR) from P. australis showed significant associations with physiological parameters of photosynthesis, namely intercellular carbon dioxide concentration (Ci) (p < 0.05) and transpiration rate (Tr) (p < 0.01), with correlation coefficients of 0.58 and −0.63, showing a moderate positive relationship with Ci and a moderate negative relationship with Tr. In contrast to isoprene emission rates, the emission rates of monoterpenes (MR) showed significant positive correlations with the net photosynthesis rate (Pn) (p < 0.05), stomatal conductance (Gs) (p < 0.001), and Ci (p < 0.05), respectively. The high correlation coefficient of 0.76 between MR and Gs suggests a strong positive relationship, while the Pearson correlation coefficients with Pn and Ci fell between 0.4 and 0.6, indicating a moderate relationship. Moreover, the emission rates of oxygenated volatile organic compounds (OVOCR), and other volatile organic compounds (OR) exhibited significant moderate positive correlations with Ci (p < 0.05, p < 0.001), respectively. These compounds also showed significant moderate negative correlations with Tr (p < 0.05). There were significant negative correlations between OVOCR, OR, and Vpd, with moderate correlation strengths (p < 0.05, p < 0.01). Additionally, there were significant positive correlations among different types of volatile organic compound emission rates, such as IR and AR (p < 0.001), and OR with IR (p < 0.05), MR (p < 0.05), OVOC (p < 0.001), and AR (p < 0.05) (Table S6).
Contrary to the correlation analysis results for P. australis, the emission rates of monoterpenes (MR) from T. angustifolia showed a significant negative correlation with Pn (p < 0.05), with a correlation coefficient of −0.59. The OVOCR exhibited a strong negative correlation with Pn (p < 0.001), with a correlation coefficient of −0.73. The OR showed significant correlations with Tr (p < 0.01), Ci (p < 0.05), Gs (p < 0.01), and Pn (p < 0.001). The absolute values of the correlation coefficients between OR and Pn were greater than 0.7, indicating a strong correlation with net photosynthesis rate, while the coefficients with Gs, Ci, and Tr fell between 0.4 and 0.7, suggesting a moderate strength of relationship with these parameters (Table S7).
The emission rates of monoterpenes (MR) from I. pseudacorus exhibited a significant negative correlation with the Pn (p < 0.05), with a correlation coefficient of −0.47. MR showed a significant positive correlation with Ci (p < 0.05), with a correlation coefficient of 0.54. The OVOCR showed a significant negative correlation with Pn (p < 0.05), with a correlation coefficient of −0.47. The OR exhibited significant correlations with Ci and Pn (p < 0.05, p < 0.01), respectively. The absolute values of the correlation coefficients between OR and Pn fell between 0.4 and 0.7, indicating a moderate strength of the relationship between the two variables (Table S8).
Overall, there is a significant correlation between Pn and the emission rate of some BVOC components from the three plants. Unlike the other two plants, there is a significant correlation between the BVOC emission rate of P. australis and Gs, Ci, and Tr. This may be due to physiological differences between aquatic plants.

4. Discussion

This study was a groundbreaking investigation into the emission of BVOCs from aquatic plants. The research analyzed the composition of BVOCs released by three aquatic plants and delved into the study of terpene emission rates throughout the day. Additionally, the study explored any potential correlations between BVOC emission rates and photosynthetic parameters in aquatic plants.

4.1. BVOC Emission Characteristics: Comparison with Other Plant Species

Studies on tree species were compared and analyzed due to limited research on aquatic plants. The diurnal emission rate profiles of BVOCs from the three aquatic plants manifested a conspicuous unimodal curve. The temporal dynamics of emission rates demonstrated a parallelism with the overarching patterns of environmental factors. The BVOC emission rates of aquatic plants may not always align with changes in environmental factors due to variations in their tolerance levels. Some components were inhibited when exposed to conditions that exceeded their tolerance limits, resulting in a negative correlation, while others were less impacted or possessed a higher tolerance, leading to a consistent correlation. Additionally, studies suggested a significant negative correlation between the isoprene emission rate of certain plants and PAR [41]. This congruity with investigations about arboreal taxa corroborated the pronounced impact of pivotal environmental factors on the emission rates of volatile organic compounds from these three aquatic plants [27,29,42,43,44].
The emission of BVOCs from aquatic plants also should not be overlooked. According to several reports [23,24,27,28], Platanus occidentalis had the highest standardized emission rates of total BVOCs at 48.65 μg·g−1Dw·h−1, followed by Pinus griffithii at 37.82 μg·g−1Dw·h−1, Platycladus orientalis at 29.35 μg·g−1Dw·h−1, and Buxus megistophylla at 28.23 μg·g−1Dw·h−1. Higher than those tree species, P. australis had the highest emission rates of total BVOCs at 78.45 μg·g−1Dw·h−1. Moreover, P. australis had the highest emission rates of isoprene at 63.16 μg·g−1Dw·h−1 among all plant species (Table S9). T. angustifolia and I. pseudacorus were medium to high emitting species, with total BVOC emission rates of 10.38 μg·g−1Dw·h−1 and 11.14 μg·g−1Dw·h−1, respectively. Therefore, aquatic plants might play a significant role in ozone pollution [45,46,47].
The intermediate products produced during photosynthesis were used by plants to synthesize isoprenoids [48]. Therefore, there was a significant variation in the types and rates of BVOCs emitted by different plant species [29,33,44,49,50,51]. The indicators reflecting plant physiology included the net photosynthetic rate, stomatal conductance, intercellular CO2 concentration, and transpiration rate. Environmental factors like temperature, soil moisture, and water temperature indirectly affect the synthesis and release of BVOCs by influencing the physiological processes in plants, such as the availability of photons for photosynthesis and the efficiency of gas exchange between plants and the atmosphere [13,37,52,53,54,55,56,57,58,59,60].

4.2. The Relationship between Isoprenoid Emission and Physiological Factors

A correlation analysis between the emission rates of BVOCs from three aquatic plants and photosynthetic physiological parameters revealed a significant correlation between them. Nevertheless, species-specific variations in correlation were observed, which could be attributed to physiological differences among the plant species. The substrates and energy required for the synthesis of isoprenoid compounds in plants were derived from photosynthesis, but not their only source [61,62,63,64]. Consequently, plants were capable of synthesizing and emitting isoprenoid compounds even when photosynthesis was inhibited or occurring at a low level [65,66,67]; whereas, during active photosynthesis, the synthesis of isoprenoids was not constrained by the availability of substrates and energy. Under these conditions, factors potentially limiting their emission could be linked to the activity of enzymes along the synthesis pathway and the opening of stomata in the plant leaves [68,69]. However, the results of this study showed that stomatal conductance was not related to the emission rates of certain isoprenoids, perhaps due to the presence of ventilatory tissues in aquatic plants that function in exchanging materials, facilitating BVOC emissions. Moreover, some conifer species possessed leaf tissues that serve as storage organs for substances, like resin ducts and oil glands. Terpenoids of certain types were stored therein and were released upon heat stress-induced damage to these organs [70,71,72], rather than being emitted immediately after synthesis. The emission rates of these BVOCs are influenced by diffusion processes, with temperature being the primary driver, rather than being directly related to other environmental and physiological factors. Some studies suggested that different monoterpenes react differently to environmental factors. This study did not analyze the correlation of different monoterpenes individually with other factors, instead treating them collectively as monoterpenes for analysis, which might affect the outcome of the correlation analysis [27,41,73].
The findings of this study indicated a significant correlation among the emission rates of different BVOC types, resonating with previous research. This was because isoprenoids were synthesized through two interconvertible key precursors, isopentenyl diphosphate (IPP) and dimethylallyl diphosphate (DMAPP), by pathways such as the mevalonate (MVA) pathway located within the cytoplasm and endoplasmic reticulum, and the methylerythritol phosphate (MEP) pathway found in plant plastids [48,74,75,76]. Isoprenoid compounds with different numbers of carbon atoms were formed through distinct enzymatic reaction steps. The primary factors influencing their synthesis were the activities of various enzymes at different steps along the pathways and the expression of genes associated with those synthesis enzymes. Consequently, the emission rates of BVOCs demonstrated significant correlations across different species.
It is recommended that future research on BVOC emission capacities of aquatic plants should be conducted at a more specific taxonomic level, focusing on species that were widely distributed. Laboratory-based controlled experiments should be designed to establish a model that correlates BVOC emission rates with environmental factors, thereby improving regional and global inventories of BVOC emissions. Furthermore, investigations into the relationship between plant physiological parameters and BVOC emission rates should be extended to the microscale level, revealing more detailed physiological processes and uncovering the underlying mechanisms that influence BVOC emissions. This will provide insights into how to control BVOC emissions in a better way.
To reduce environmental pollution and improve urban sustainability, the use of high BVOC-emitting plant species should be reduced in future urban wetland planning and management.
Although this study did not explore the mechanical relationship between plant photosynthetic physiological parameters and BVOC emission rates, it provided valuable insights into their association. These data will be crucial for future optimization of emission models and localization of emission inventories.

5. Conclusions

The dynamic headspace sampling method was used to analyze the emission components and rates of BVOCs from three aquatic plants (P. australis, T. angustifolia, and I. pseudacorus) in the Baiyangdian area. The BVOC components were classified into five major groups: isoprene, monoterpenes, OVOCs, alkanes, and other substances. The samples showed a total of 72 compounds. Isoprene accounted for the highest proportion of the total emission of P. australis, while OVOCs accounted for 50% of the total emission in the other two plant species. P. australis had higher total BVOC emission rates, which could significantly impact local ozone pollution. In the future, it is important to take into account the impact of wetland plants on atmospheric chemistry when selecting wetland plants. The transpiration rate has a significant negative correlation with the emission rates of isoprene in P. australis, while the intercellular carbon dioxide concentration has a significant positive correlation with the isoprene emission rates in P. australis. The net photosynthetic rate has a significant impact on the emission rates of monoterpenes in three aquatic plants. Further investigations are required to better understand the relationship between BVOC emissions and environmental responses, and these should be conducted using controlled indoor experiments.

Supplementary Materials

The following supporting information can be downloaded at: https://www.mdpi.com/article/10.3390/atmos15060651/s1, Figure S1: The dynamic headspace system used for BVOCs sampling. Table S1: Sampling date in this study and air temperature (T) and photosynthetically active radiation (PAR) and water temperature (WT) during the sampling. Table S2: External standard curves for compound quantification. Table S3: All compounds detected in Phragmites australis samples. Table S4: All compounds detected in Typha angustifolia samples. Table S5: All compounds detected in Iris pseudacorus samples. Table S6: The analysis of the Pearson Correlation Coefficient results for Phragmites australis. Table S7: The analysis of the Pearson Correlation Coefficient results for Typha angustifolia. Table S8: The analysis of the Pearson Correlation Coefficient results for Iris pseudacorus. Table S9: Comparison of standard emission rates for BVOCs from trees and emergent vegetation.

Author Contributions

W.C.: Conceptualization, Methodology, Formal Analysis, Investigation, Writing—Original Draft. X.L. (Xiaoxiu Lun): Conceptualization, Methodology, Writing—Review and Editing. J.W.: Methodology, Software, Investigation, Writing—Review and Editing. L.W.: Writing—Review and Editing. X.W.: Resources. X.L. (Xiaoyi Li): Resources. All authors have read and agreed to the published version of the manuscript.

Funding

This study was funded by the Xiong’an New Area Science and Technology Innovation Project (2022XACX1000), the 5·5 Engineering Research & Innovation Team Project of Beijing Forestry University (No: BLRC2023B04), National Natural Science Foundation of China (No. 42077454). And the APC was funded by the Xiong’an New Area Science and Technology Innovation Project (2022XACX1000).

Institutional Review Board Statement

Not applicable.

Informed Consent Statement

Not applicable.

Data Availability Statement

The data presented in this study are available in Supplementary Materials.

Conflicts of Interest

The authors declare no conflict of interest.

References

  1. Loreto, F.; Schnitzler, J.P. Abiotic stresses and induced BVOCs. Trends Plant Sci. 2010, 15, 154–166. [Google Scholar] [CrossRef] [PubMed]
  2. Joutsensaari, J.; Loivamäki, M.; Vuorinen, T.; Miettinen, P.; Nerg, A.M.; Holopainen, J.K.; Laaksonen, A. Nanoparticle formation by ozonolysis of inducible plant volatiles. Atmos. Chem. Phys. 2005, 5, 1489–1495. [Google Scholar] [CrossRef]
  3. Sindelarova, K.; Markova, J.; Simpson, D.; Huszar, P.; Karlicky, J.; Darras, S.; Granier, C. High-resolution biogenic global emission inventory for the time period 2000–2019 for air quality modeling. Earth Syst. Sci. Data 2022, 14, 251–270. [Google Scholar] [CrossRef]
  4. Li, L.; Yang, W.; Xie, S.; Wu, Y. Estimations and uncertainty of biogenic volatile organic compound emission inventory in China for 2008–2018. Sci. Total Environ. 2020, 733, 139301. [Google Scholar] [CrossRef] [PubMed]
  5. Li, B.; Ho, S.S.H.; Li, X.; Guo, L.; Chen, A.; Hu, L.; Yang, Y.; Chen, D.; Lin, A.; Fang, X. A comprehensive review on anthropogenic volatile organic compounds (VOCs) emission estimates in China: Comparison and outlook. Environ. Int. 2021, 156, 106710. [Google Scholar] [CrossRef] [PubMed]
  6. Feng, T.; Bei, N.; Huang, R.-J.; Cao, J.; Zhang, Q.; Zhou, W.; Tie, X.; Liu, S.; Zhang, T.; Su, X.; et al. Summertime ozone formation in Xi’an and surrounding areas, China. Atmos. Chem. Phys. 2016, 16, 4323–4342. [Google Scholar] [CrossRef]
  7. Sheng, J.; Zhao, D.; Ding, D.; Li, X.; Huang, M.; Gao, Y.; Quan, J.; Zhang, Q. Characterizing the level, photochemical reactivity, emission, and source contribution of the volatile organic compounds based on PTR-TOF-MS during winter haze period in Beijing, China. Atmos. Res. 2018, 212, 54–63. [Google Scholar] [CrossRef]
  8. Wang, P.; Ying, Q.; Zhang, H.; Hu, J.; Lin, Y.; Mao, H. Source apportionment of secondary organic aerosol in China using a regional source-oriented chemical transport model and two emission inventories. Environ. Pollut. 2018, 237, 756–766. [Google Scholar] [CrossRef] [PubMed]
  9. Guenther, A.B.; Zimmerman, P.R.; Harley, P.C.; Monson, R.K.; Fall, R. Isoprene and monoterpene emission rate variability: Model evaluations and sensitivity analyses. J. Geophys. Res. Atmos. 1993, 98, 12609–12617. [Google Scholar] [CrossRef]
  10. Guenther, A.; Karl, T.; Harley, P.; Wiedinmyer, C.; Palmer, P.I.; Geron, C. Estimates of global terrestrial isoprene emissions using MEGAN (Model of Emissions of Gases and Aerosols from Nature). Atmos. Chem. Phys. 2006, 6, 3181–3210. [Google Scholar] [CrossRef]
  11. Guenther, A.B.; Jiang, X.; Heald, C.L.; Sakulyanontvittaya, T.; Duhl, T.; Emmons, L.K.; Wang, X. The Model of Emissions of Gases and Aerosols from Nature version 2.1 (MEGAN2.1): An extended and updated framework for modeling biogenic emissions. Geosci. Model. Dev. 2012, 5, 1471–1492. [Google Scholar] [CrossRef]
  12. Guenther, A.; Hewitt, C.N.; Erickson, D.; Fall, R.; Geron, C.; Graedel, T.; Harley, P.; Klinger, L.; Lerdau, M.; Mckay, W.A.; et al. A global model of natural volatile organic compound emissions. J. Geophys. Res. Atmos. 1995, 100, 8873–8892. [Google Scholar] [CrossRef]
  13. Medori, M.; Michelini, L.; Nogues, I.; Loreto, F.; Calfapietra, C. The impact of root temperature on photosynthesis and isoprene emission in three different plant species. Sci. World J. 2012, 2012, 525827. [Google Scholar] [CrossRef] [PubMed]
  14. Fares, S.; Brilli, F.; Nogues, I.; Velikova, V.; Tsonev, T.; Dagli, S.; Loreto, F. Isoprene emission and primary metabolism in Phragmites australis grown under different phosphorus levels. Plant Biol. 2008, 10, 38–43. [Google Scholar] [CrossRef] [PubMed]
  15. Tan, L.; Ge, Z.; Zhou, X.; Li, S.; Li, X.; Tang, J. Conversion of coastal wetlands, riparian wetlands, and peatlands increases greenhouse gas emissions: A global meta-analysis. Glob. Chang. Biol. 2020, 26, 1638–1653. [Google Scholar] [CrossRef] [PubMed]
  16. Zhou, D.; Yu, J.; Guan, B.; Li, Y.; Yu, M.; Qu, F.; Zhan, C.; Lv, Z.; Wu, H.; Wang, Q.; et al. A Comparison of the Development of Wetland Restoration Techniques in China and Other Nations. Wetlands 2020, 40, 2755–2764. [Google Scholar] [CrossRef]
  17. Mao, D.; Wang, Z.; Du, B.; Li, L.; Tian, Y.; Jia, M.; Zeng, Y.; Song, K.; Jiang, M.; Wang, Y. National wetland mapping in China: A new product resulting from object-based and hierarchical classification of Landsat 8 OLI images. ISPRS J. Photogramm. Remote Sens. 2020, 164, 11–25. [Google Scholar] [CrossRef]
  18. Quin, A.; Jaramillo, F.; Destouni, G. Dissecting the ecosystem service of large-scale pollutant retention: The role of wetlands and other landscape features. Ambio 2015, 44, S127–S137. [Google Scholar] [CrossRef] [PubMed]
  19. Mitsch, W.J.; Mander, Ü. Wetlands and carbon revisited. Ecol. Eng. 2018, 114, 1–6. [Google Scholar] [CrossRef]
  20. Zhou, J.B.; Wu, J.; Gong, Y.Z. Valuing wetland ecosystem services based on benefit transfer: A meta-analysis of China wetland studies. J. Clean. Prod. 2020, 276, 11. [Google Scholar] [CrossRef]
  21. Sun, R.H.; Chen, A.L.; Chen, L.D.; Lü, Y.H. Cooling effects of wetlands in an urban region: The case of Beijing. Ecol. Indic. 2012, 20, 57–64. [Google Scholar] [CrossRef]
  22. Seifollahi-Aghmiuni, S.; Nockrach, M.; Kalantari, Z. The Potential of Wetlands in Achieving the Sustainable Development Goals of the 2030 Agenda. Water 2019, 11, 609. [Google Scholar] [CrossRef]
  23. Wang, Z.H.; Bai, Y.H.; Zhang, S.Y. A biogenic volatile organic compounds emission inventory for Beijing. Atmos. Environ. 2003, 37, 3771–3782. [Google Scholar] [CrossRef]
  24. Jing, X.; Lun, X.; Fan, C.; Ma, W. Emission patterns of biogenic volatile organic compounds from dominant forest species in Beijing, China. J. Environ. Sci. 2020, 95, 73–81. [Google Scholar] [CrossRef] [PubMed]
  25. Lun, X.; Lin, Y.; Chai, F.; Fan, C.; Li, H.; Liu, J. Reviews of emission of biogenic volatile organic compounds (BVOCs) in Asia. J. Environ. Sci. 2020, 95, 266–277. [Google Scholar] [CrossRef] [PubMed]
  26. Bao, X.; Zhou, W.; Wang, W.; Yao, Y.; Xu, L. Tree species classification improves the estimation of BVOCs from urban greenspace. Sci. Total Environ. 2024, 914, 169762. [Google Scholar] [CrossRef] [PubMed]
  27. Chen, J.; Tang, J.; Yu, X. Environ.mental and physiological controls on diurnal and seasonal patterns of biogenic volatile organic compound emissions from five dominant woody species under field conditions. Environ. Pollut. 2020, 259, 113955. [Google Scholar] [CrossRef] [PubMed]
  28. Wu, J.; Long, J.; Liu, H.; Sun, G.; Li, J.; Xu, L.; Xu, C. Biogenic volatile organic compounds from 14 landscape woody species: Tree species selection in the construction of urban greenspace with forest healthcare effects. J. Environ. Manag. 2021, 300, 113761. [Google Scholar] [CrossRef] [PubMed]
  29. Wang, L.; Lun, X.; Wu, J.; Wang, Q.; Tao, J.; Dou, X.; Zhang, Z. Investigation of biogenic volatile organic compounds emissions in the Qinghai-Tibetan Plateau. Sci. Total Environ. 2023, 902, 165877. [Google Scholar] [CrossRef] [PubMed]
  30. Abis, L.; Kalalian, C.; Lunardelli, B.; Wang, T.; Zhang, L.W.; Chen, J.M.; Perrier, S.; Loubet, B.; Ciuraru, R.; George, C. Measurement report: Biogenic volatile organic compound emission profiles of rapeseed leaf litter and its secondary organic aerosol formation potential. Atmos. Chem. Phys. 2021, 21, 12613–12629. [Google Scholar] [CrossRef]
  31. Deng, X.J.; Peng, J.Y.; Luo, B.; Wei, M.; Hu, W.L.; Du, J.W. A direct quantitative analysis method for monitoring biogenic volatile organic compounds released from leaves of Pelargonium hortoram in situ. Anal. Bioanal. Chem. 2004, 380, 950–957. [Google Scholar] [CrossRef] [PubMed]
  32. Morrison, E.C.; Drewer, J.; Heal, M.R. A comparison of isoprene and monoterpene emission rates from the perennial bioenergy crops short-rotation coppice willow andMiscanthusand the annual arable crops wheat and oilseed rape. GCB Bioenergy 2016, 8, 211–225. [Google Scholar] [CrossRef]
  33. Li, S.; Yuan, X.; Xu, Y.; Li, Z.; Feng, Z.; Yue, X.; Paoletti, E. Biogenic volatile organic compound emissions from leaves and fruits of apple and peach trees during fruit development. J. Environ. Sci. 2021, 108, 152–163. [Google Scholar] [CrossRef] [PubMed]
  34. Huang, J.; Hartmann, H.; Hellen, H.; Wisthaler, A.; Perreca, E.; Weinhold, A.; Rucker, A.; van Dam, N.M.; Gershenzon, J.; Trumbore, S.; et al. New Perspectives on CO(2), Temperature, and Light Effects on BVOC Emissions Using Online Measurements by PTR-MS and Cavity Ring-Down Spectroscopy. Environ. Sci. Technol. 2018, 52, 13811–13823. [Google Scholar] [CrossRef] [PubMed]
  35. Van Meeningen, Y.; Schurgers, G.; Rinnan, R.; Holst, T. Isoprenoid emission response to changing light conditions of English oak, European beech and Norway spruce. Biogeosciences 2017, 14, 4045–4060. [Google Scholar] [CrossRef]
  36. Son, Y.-S.; Hwang, Y.-S.; Sung, J.-H.; Kim, J.-C. Variations of BVOCs Emission Characteristics according to Increasing PAR. J. Korean Soc. Atmos. Environ. 2012, 28, 77–85. [Google Scholar] [CrossRef]
  37. Wang, X.; Zhang, Y.; Tan, Y.; Tan, Y.; Bai, J.; Gu, D.; Ma, Z.; Du, J.; Han, Z. Effects of light on the emissions of biogenic isoprene and monoterpenes: A review. Atmos. Pollut. Res. 2022, 13, 101397. [Google Scholar] [CrossRef]
  38. Ashworth, K.; Chung, S.H.; McKinney, K.A.; Liu, Y.; Munger, J.W.; Martin, S.T.; Steiner, A.L. Modelling bidirectional fluxes of methanol and acetaldehyde with the FORCAsT canopy exchange model. Atmos. Chem. Phys. 2016, 16, 15461–15484. [Google Scholar] [CrossRef]
  39. Pazouki, L.; Niinemets, U. Multi-Substrate Terpene Synthases: Their Occurrence and Physiological Significance. Front. Plant Sci. 2016, 7, 1019. [Google Scholar] [CrossRef] [PubMed]
  40. Li, S.; Harley, P.C.; Niinemets, U. Ozone-induced foliar damage and release of stress volatiles is highly dependent on stomatal openness and priming by low-level ozone exposure in Phaseolus vulgaris. Plant Cell Environ. 2017, 40, 1984–2003. [Google Scholar] [CrossRef] [PubMed]
  41. Lyu, J.; Xiong, F.; Sun, N.; Li, Y.; Liu, C.; Yin, S. Photosynthesis and Related Physiological Parameters Differences Affected the Isoprene Emission Rate among 10 Typical Tree Species in Subtropical Metropolises. Int. J. Environ. Res. Public Health 2021, 18, 954. [Google Scholar] [CrossRef] [PubMed]
  42. Borsdorf, H.; Bentele, M.; Müller, M.; Rebmann, C.; Mayer, T. Comparison of Seasonal and Diurnal Concentration Profiles of BVOCs in Coniferous and Deciduous Forests. Atmosphere 2023, 14, 1347. [Google Scholar] [CrossRef]
  43. Kammer, J.; Flaud, P.M.; Chazeaubeny, A.; Ciuraru, R.; Le Menach, K.; Geneste, E.; Budzinski, H.; Bonnefond, J.M.; Lamaud, E.; Perraudin, E.; et al. Biogenic volatile organic compounds (BVOCs) reactivity related to new particle formation (NPF) over the Landes forest. Atmos. Res. 2020, 237, 11. [Google Scholar] [CrossRef]
  44. Mu, Z.; Llusià, J.; Zeng, J.; Zhang, Y.; Asensio, D.; Yang, K.; Yi, Z.; Wang, X.; Peñuelas, J. An Overview of the Isoprenoid Emissions From Tropical Plant Species. Front. Plant Sci. 2022, 13, 833030. [Google Scholar] [CrossRef] [PubMed]
  45. Bao, X.; Zhou, W.; Xu, L.; Zheng, Z. A meta-analysis on plant volatile organic compound emissions of different plant species and responses to Environ.mental stress. Environ. Pollut. 2023, 318, 120886. [Google Scholar] [CrossRef] [PubMed]
  46. Salvador, C.M.; Chou, C.C.K.; Ho, T.-T.; Tsai, C.-Y.; Tsao, T.-M.; Tsai, M.-J.; Su, T.-C. Contribution of Terpenes to Ozone Formation and Secondary Organic Aerosols in a Subtropical Forest Impacted by Urban Pollution. Atmosphere 2020, 11, 1232. [Google Scholar] [CrossRef]
  47. Liu, L.; Seyler, B.C.; Liu, H.; Zhou, L.; Chen, D.; Liu, S.; Yan, C.; Yang, F.; Song, D.; Tan, Q.; et al. Biogenic volatile organic compound emission patterns and secondary pollutant formation potentials of dominant greening trees in Chengdu, southwest China. J. Environ. Sci. 2022, 114, 179–193. [Google Scholar] [CrossRef] [PubMed]
  48. Schuman, M.C. Where, When, and Why Do Plant Volatiles Mediate Ecological Signaling? The Answer Is Blowing in the Wind. Annu. Rev. Plant Biol. 2023, 74, 609–633. [Google Scholar] [CrossRef] [PubMed]
  49. Malik, T.G.; Gajbhiye, T.; Pandey, S.K. Plant specific emission pattern of biogenic volatile organic compounds (BVOCs) from common plant species of Central India. Environ. Monit. Assess. 2018, 190, 631. [Google Scholar] [CrossRef] [PubMed]
  50. Tang, H.; Yang, Q.; Jiang, M.; Wang, T.; Li, X.; Chen, Q.; Luo, Z.; Lv, B. Seasonal Variation in the Thermal Environ.ment and Health-Related Factors in Two Clustered Recreational Bamboo Forests. Forests 2023, 14, 1894. [Google Scholar] [CrossRef]
  51. Zeng, J.; Song, W.; Zhang, Y.; Mu, Z.; Pang, W.; Zhang, H.; Wang, X. Emissions of isoprenoids from dominant tree species in subtropical China. Front. For. Glob. Chang. 2022, 5, 1089676. [Google Scholar] [CrossRef]
  52. Pikkarainen, L.; Nissinen, K.; Ghimire, R.P.; Kivimaenpaa, M.; Ikonen, V.P.; Kilpelainen, A.; Virjamo, V.; Yu, H.; Kirsikka-Aho, S.; Salminen, T.; et al. Responses in growth and emissions of biogenic volatile organic compounds in Scots pine, Norway spruce and silver birch seedlings to different warming treatments in a controlled field experiment. Sci. Total Environ. 2022, 821, 153277. [Google Scholar] [CrossRef] [PubMed]
  53. Lappalainen, H.K.; Sevanto, S.; Bäck, J.; Ruuskanen, T.M.; Kolari, P.; Taipale, R.; Rinne, J.; Kulmala, M.; Hari, P. Day-time concentrations of biogenic volatile organic compounds in a boreal forest canopy and their relation to Environ.mental and biological factors. Atmos. Chem. Phys. 2009, 9, 5447–5459. [Google Scholar] [CrossRef]
  54. Pegoraro, E.; Potosnak, M.J.; Monson, R.K.; Rey, A.; Barron-Gafford, G.; Osmond, C.B. The effect of elevated CO2, soil and atmospheric water deficit and seasonal phenology on leaf and ecosystem isoprene emission. Funct. Plant Biol. 2007, 34, 774–784. [Google Scholar] [CrossRef] [PubMed]
  55. Lerdau, M.; Gray, D. Ecology and evolution of light-dependent and light-independent phytogenic volatile organic carbon. New Phytol. 2003, 157, 199–211. [Google Scholar] [CrossRef] [PubMed]
  56. Pétron, G.; Harley, P.; Greenberg, J.; Guenther, A. Seasonal temperature variations influence isoprene emission. Geophys. Res. Lett. 2001, 28, 1707–1710. [Google Scholar] [CrossRef]
  57. Zeng, J.; Zhang, Y.; Mu, Z.; Pang, W.; Zhang, H.; Wu, Z.; Song, W.; Wang, X. Temperature and light dependency of isoprene and monoterpene emissions from tropical and subtropical trees: Field observations in south China. Appl. Geochem. 2023, 155, 105757. [Google Scholar] [CrossRef]
  58. Sabillón, D.; Cremades, L.V. Diurnal and seasonal variation of monoterpene emission rates for two typical Mediterranean species (Pinus pinea and Quercus ilex) from field measurements-relationship with temperature and PAR. Atmos. Environ. 2001, 35, 4419–4431. [Google Scholar] [CrossRef]
  59. Taylor, T.C.; Smith, M.N.; Slot, M.; Feeley, K.J. The capacity to emit isoprene differentiates the photosynthetic temperature responses of tropical plant species. Plant Cell Environ. 2019, 42, 2448–2457. [Google Scholar] [CrossRef] [PubMed]
  60. Mutanda, I.; Inafuku, M.; Saitoh, S.; Iwasaki, H.; Fukuta, M.; Watanabe, K.; Oku, H. Temperature controls on the basal emission rate of isoprene in a tropical tree Ficus septica: Exploring molecular regulatory mechanisms. Plant Cell Environ. 2016, 39, 2260–2275. [Google Scholar] [CrossRef] [PubMed]
  61. Sharkey, T.D.; Preiser, A.L.; Weraduwage, S.M.; Gog, L. Source of 12C in Calvin-Benson cycle intermediates and isoprene emitted from plant leaves fed with 13CO2. Biochem. J. 2020, 477, 3237–3252. [Google Scholar] [CrossRef] [PubMed]
  62. Monson, R.K.; Fall, R. Isoprene emission from aspen leaves: Influence of Environ.ment and relation to photosynthesis and photorespiration. Plant Physiol. 1989, 90, 267–274. [Google Scholar] [CrossRef] [PubMed]
  63. Guidolotti, G.; Pallozzi, E.; Gavrichkova, O.; Scartazza, A.; Mattioni, M.; Loreto, F.; Calfapietra, C. Emission of constitutive isoprene, induced monoterpenes, and other volatiles under high temperatures in Eucalyptus camaldulensis: A (13) C labelling study. Plant Cell Environ. 2019, 42, 1929–1938. [Google Scholar] [CrossRef] [PubMed]
  64. Duan, C.S.; Wu, Z.F.; Liao, H.; Ren, Y. Interaction Processes of Environ.ment and Plant Ecophysiology with BVOC Emissions from Dominant Greening Trees. Forests 2023, 14, 523. [Google Scholar] [CrossRef]
  65. De Souza, V.F.; Niinemets, Ü.; Rasulov, B.; Vickers, C.E.; Duvoisin, S.; Araújo, W.L.; Gonçalves, J.F.D. Alternative Carbon Sources for Isoprene Emission. Trends Plant Sci. 2018, 23, 1081–1101. [Google Scholar] [CrossRef]
  66. Staudt, M.; Daussy, J.; Ingabire, J.; Dehimeche, N. Growth and actual leaf temperature modulate CO2 responsiveness of monoterpene emissions from holm oak in opposite ways. Biogeosciences 2022, 19, 4945–4963. [Google Scholar] [CrossRef]
  67. Ladd, S.N.; Daber, L.E.; Bamberger, I.; Kübert, A.; Kreuzwieser, J.; Purser, G.; Ingrisch, J.; Deleeuw, J.; van Haren, J.; Meredith, L.K.; et al. Leaf-level metabolic changes in response to drought affect daytime CO2 emission and isoprenoid synthesis pathways. Tree Physiol. 2023, 43, 1917–1932. [Google Scholar] [CrossRef] [PubMed]
  68. Filella, I.; Penuelas, J.; Llusia, J. Dynamics of the enhanced emissions of monoterpenes and methyl salicylate, and decreased uptake of formaldehyde, by Quercus ilex leaves after application of jasmonic acid. New Phytol. 2006, 169, 135–144. [Google Scholar] [CrossRef] [PubMed]
  69. Harley, P.; Eller, A.; Guenther, A.; Monson, R.K. Observations and models of emissions of volatile terpenoid compounds from needles of ponderosa pine trees growing in situ: Control by light, temperature and stomatal conductance. Oecologia 2014, 176, 35–55. [Google Scholar] [CrossRef] [PubMed]
  70. Nagalingam, S.; Seco, R.; Kim, S.; Guenther, A. Heat stress strongly induces monoterpene emissions in some plants with specialized terpenoid storage structures. Agric. For. Meteorol. 2023, 333, 13. [Google Scholar] [CrossRef]
  71. Tissier, A.; Morgan, J.A.; Dudareva, N. Plant Volatiles: Going ’In’ but not ’Out’ of Trichome Cavities. Trends Plant Sci. 2017, 22, 930–938. [Google Scholar] [CrossRef]
  72. Foster, A.J.; Aloni, R.; Fidanza, M.; Gries, R.; Gries, G.; Mattsson, J. Foliar phase changes are coupled with changes in storage and biochemistry of monoterpenoids in western redcedar (Thuja plicata). Trees-Struct. Funct. 2016, 30, 1361–1375. [Google Scholar] [CrossRef]
  73. Chen, J.; Bi, H.; Yu, X.; Fu, Y.; Liao, W. Influence of physiological and Environ.mental factors on the diurnal variation in emissions of biogenic volatile compounds from Pinus tabuliformis. J. Environ. Sci. 2019, 81, 102–118. [Google Scholar] [CrossRef] [PubMed]
  74. Pu, X.J.; Dong, X.M.; Li, Q.; Chen, Z.X.; Liu, L. An update on the function and regulation of methylerythritol phosphate and mevalonate pathways and their evolutionary dynamics. J. Integr. Plant Biol. 2021, 63, 1211–1226. [Google Scholar] [CrossRef] [PubMed]
  75. Vranová, E.; Coman, D.; Gruissem, W. Network Analysis of the MVA and MEP Pathways for Isoprenoid Synthesis. In Annual Review of Plant Biology; Merchant, S.S., Ed.; Annual Reviews: Palo Alto, CA, USA, 2013; Volume 64, pp. 665–700. [Google Scholar]
  76. Hemmerlin, A.; Harwood, J.L.; Bach, T.J. A raison d’etre for two distinct pathways in the early steps of plant isoprenoid biosynthesis? Prog. Lipid Res. 2012, 51, 95–148. [Google Scholar] [CrossRef] [PubMed]
Figure 1. Location of the study area and sample sites.
Atmosphere 15 00651 g001
Figure 2. Proportion of each monoterpene compound within total emissions of monoterpenes. (a) P. australis, (b) T. angustifolia, (c) I. pseudacorus.
Atmosphere 15 00651 g002
Figure 3. Diurnal dynamic changes in emission rates, composition, temperature, photosynthetically active radiation, and water temperature. (a) P. australis, (b) T. angustifolia, (c) I. pseudacorus.
Atmosphere 15 00651 g003aAtmosphere 15 00651 g003bAtmosphere 15 00651 g003c
Figure 4. Correlations between physiological parameters and BVOCs emission rate of (a) P. australis, (b) T. angustifolia, and (c) I. pseudacorus. Temperature (TEMP), isoprene emission rate (IR), monoterpenes emission rate (MR), OVOCs emission rate (OVOCR), alkane emission rate (AR), and others emission rate (OR).
Atmosphere 15 00651 g004aAtmosphere 15 00651 g004bAtmosphere 15 00651 g004c
Disclaimer/Publisher’s Note: The statements, opinions and data contained in all publications are solely those of the individual author(s) and contributor(s) and not of MDPI and/or the editor(s). MDPI and/or the editor(s) disclaim responsibility for any injury to people or property resulting from any ideas, methods, instructions or products referred to in the content.

