Article

Assessing the Air Pollution Tolerance Index of Urban Plantation: A Case Study Conducted along High-Traffic Roadways

1
Department of Engineering, University of New Brunswick, 100 Tucker Park Rd, Saint John, NB E2L 4L5, Canada
2
Department of Chemical and Biotechnological Engineering, Université de Sherbrooke, Sherbrooke, QC J1K 2R1, Canada
*
Author to whom correspondence should be addressed.
Atmosphere 2024, 15(6), 659; https://doi.org/10.3390/atmos15060659
Submission received: 19 April 2024 / Revised: 17 May 2024 / Accepted: 28 May 2024 / Published: 30 May 2024
(This article belongs to the Special Issue Air Pollution in Asia)

Abstract

:
Road transport and traffic congestion significantly contribute to dust pollution, which negatively impacts the growth of roadside plants in urban areas. This study aims to quantify the air pollution tolerance index (APTI) and analyze the impacts of dust deposition on different plant species and trees planted along a busy urban roadside in Lahore, Pakistan by considering seasonal variations. The APTI of each species is determined based on inputs of various biochemical parameters (leaf extract pH, ascorbic acid content, relative water content, and total chlorophyll levels), including dust deposition. In this study, laboratory analysis techniques are employed to assess these factors in selected plant species such as Mangifera indica, Saraca asoca, Cassia fistula, and Syzygium cumini. A statistical analysis is conducted to understand the pairwise correlation between various parameters and the APTI at significant and non-significant levels. Additionally, uncertainties in the inputs and APTI are addressed through a probabilistic analysis using the Monte Carlo simulation method. This study unveils seasonal variations in key parameters among selected plant species. Almost all biochemical parameters exhibit higher averages during the rainy season, followed by the summer and winter. Conversely, dust deposition on plants follows an inverse trend, with values ranging from 0.19 to 4.8 g/cm2, peaking during winter, notably in Mangifera indica. APTI values, ranging from 9.39 to 14.75, indicate varying sensitivity levels across species, from sensitive (Syzygium cumini) to intermediate tolerance (Mangifera indica). Interestingly, plants display increased tolerance during regular traffic hours, reflecting a 0.9 to 5% difference between the APTI at peak and regular traffic hours. Moreover, a significant negative correlation (−0.86 at p < 0.05 level) between APTI values and dust deposition suggests a heightened sensitivity to pollutants during the winter. These insights into the relationship between dust pollution and plant susceptibility will help decision makers in the selection of resilient plants for urban areas and improve air quality.

1. Introduction

Urban vegetation, including vegetation buffers comprising shrubs and dense trees, serves as a critical tool in mitigating the adverse effects of air pollution in densely populated areas [1,2]. These green spaces act as natural filters, intercepting pollutants and providing cost-effective solutions to combat traffic pollution [1,3]. Despite recent research highlighting their significant benefits in reducing concentrations of pollutants, there remains a notable gap in the knowledge of specific mechanisms underlying their effectiveness, particularly in high-traffic urban environments [4,5,6,7]. The efficacy of vegetation buffers is contingent on appropriate species selection and the tolerance of plants towards pollution [8,9]. Inappropriate plant choices can compromise the filtering performance of buffers and exacerbate pollution exposure [10,11].
In Pakistan, Lahore is ranked among the top five most polluted cities in the world, with the transport sector serving as a significant contributor to air pollution [12]. According to the World Health Organization (WHO) data from 2021 (November), Lahore’s average yearly air quality index (AQI) is 203, which is considered unhealthy [13]. There have been instances when Lahore’s AQI exceeded 300, a hazardous level, prompting authorities to declare emergencies and shut down schools due to average PM2.5 values exceeding 79.2 µg/m3 [12]. However, there is a lack of research investigating the impact of traffic-induced pollution on roadside plant species, particularly dust deposition, and their resilience mechanisms [14,15]. Similar challenges exist in other polluted cities worldwide, such as Delhi, India and Beijing, China, where vehicular emissions significantly impact air quality and road side plants [16,17]. This knowledge gap leaves a critical void in the understanding of urban vegetation’s response to pollution stressors.
The growth of roadside plant species is adversely affected by poor road infrastructure and high volumes of traffic, while trees and plants play a crucial role in reducing air pollution through processes such as adsorption, accumulation, and deposition [18,19,20]. Although past studies indicate that one square meter (m2) of leaf area can absorb between 70 mg and 2.8 g of particulate matter per annum [2,21], research investigating the impact of particulate matter deposition on various species, particularly related to seasonal variation within traffic-induced contexts, remains limited [3,22]. Research in this area holds promise for developing more resilient urban ecosystems and improving public health outcomes for residents.
In Asian countries with limited access to satellite data, laboratory techniques are reliable for quantifying the air pollution tolerance index (APTI) of plants [11]. The APTI is a crucial metric used to assess the susceptibility levels of plants to dust or other air pollutants [23]. Although hyperspectral methods (such as using spectral sensors and machine learning methods [24]) offer time-efficient alternatives, they may not be suitable for areas with limited access to satellite databases or technical expertise [25]. This makes laboratory-based approaches preferable for local-scale studies, allowing for a more nuanced understanding of the impacts of pollutants on different plant species [26].
Building upon the understanding of urban vegetation’s pivotal role in mitigating air pollution, particularly in densely populated areas like Lahore, Pakistan, the present study seeks to address the knowledge gaps in assessing the resilience of roadside plant species to pollution stressors. Thus, the primary objective of the present study is to quantify the air pollution tolerance index (APTI) and analyze the impact of dust deposition on selected plant species along a busy urban roadside in Lahore, Pakistan while considering seasonal variations and other biochemical parameters (such as total chlorophyll, relative water content, and ascorbic acid). This research concentrates on a busy road with high traffic volumes to assess the tolerance levels of different plant species in these challenging conditions. This study is important as it provides valuable insights into the resilience of urban vegetation in polluted environments and can guide urban planners and environmentalists in selecting the most suitable plant species for mitigating pollution and improving air quality in urban areas.

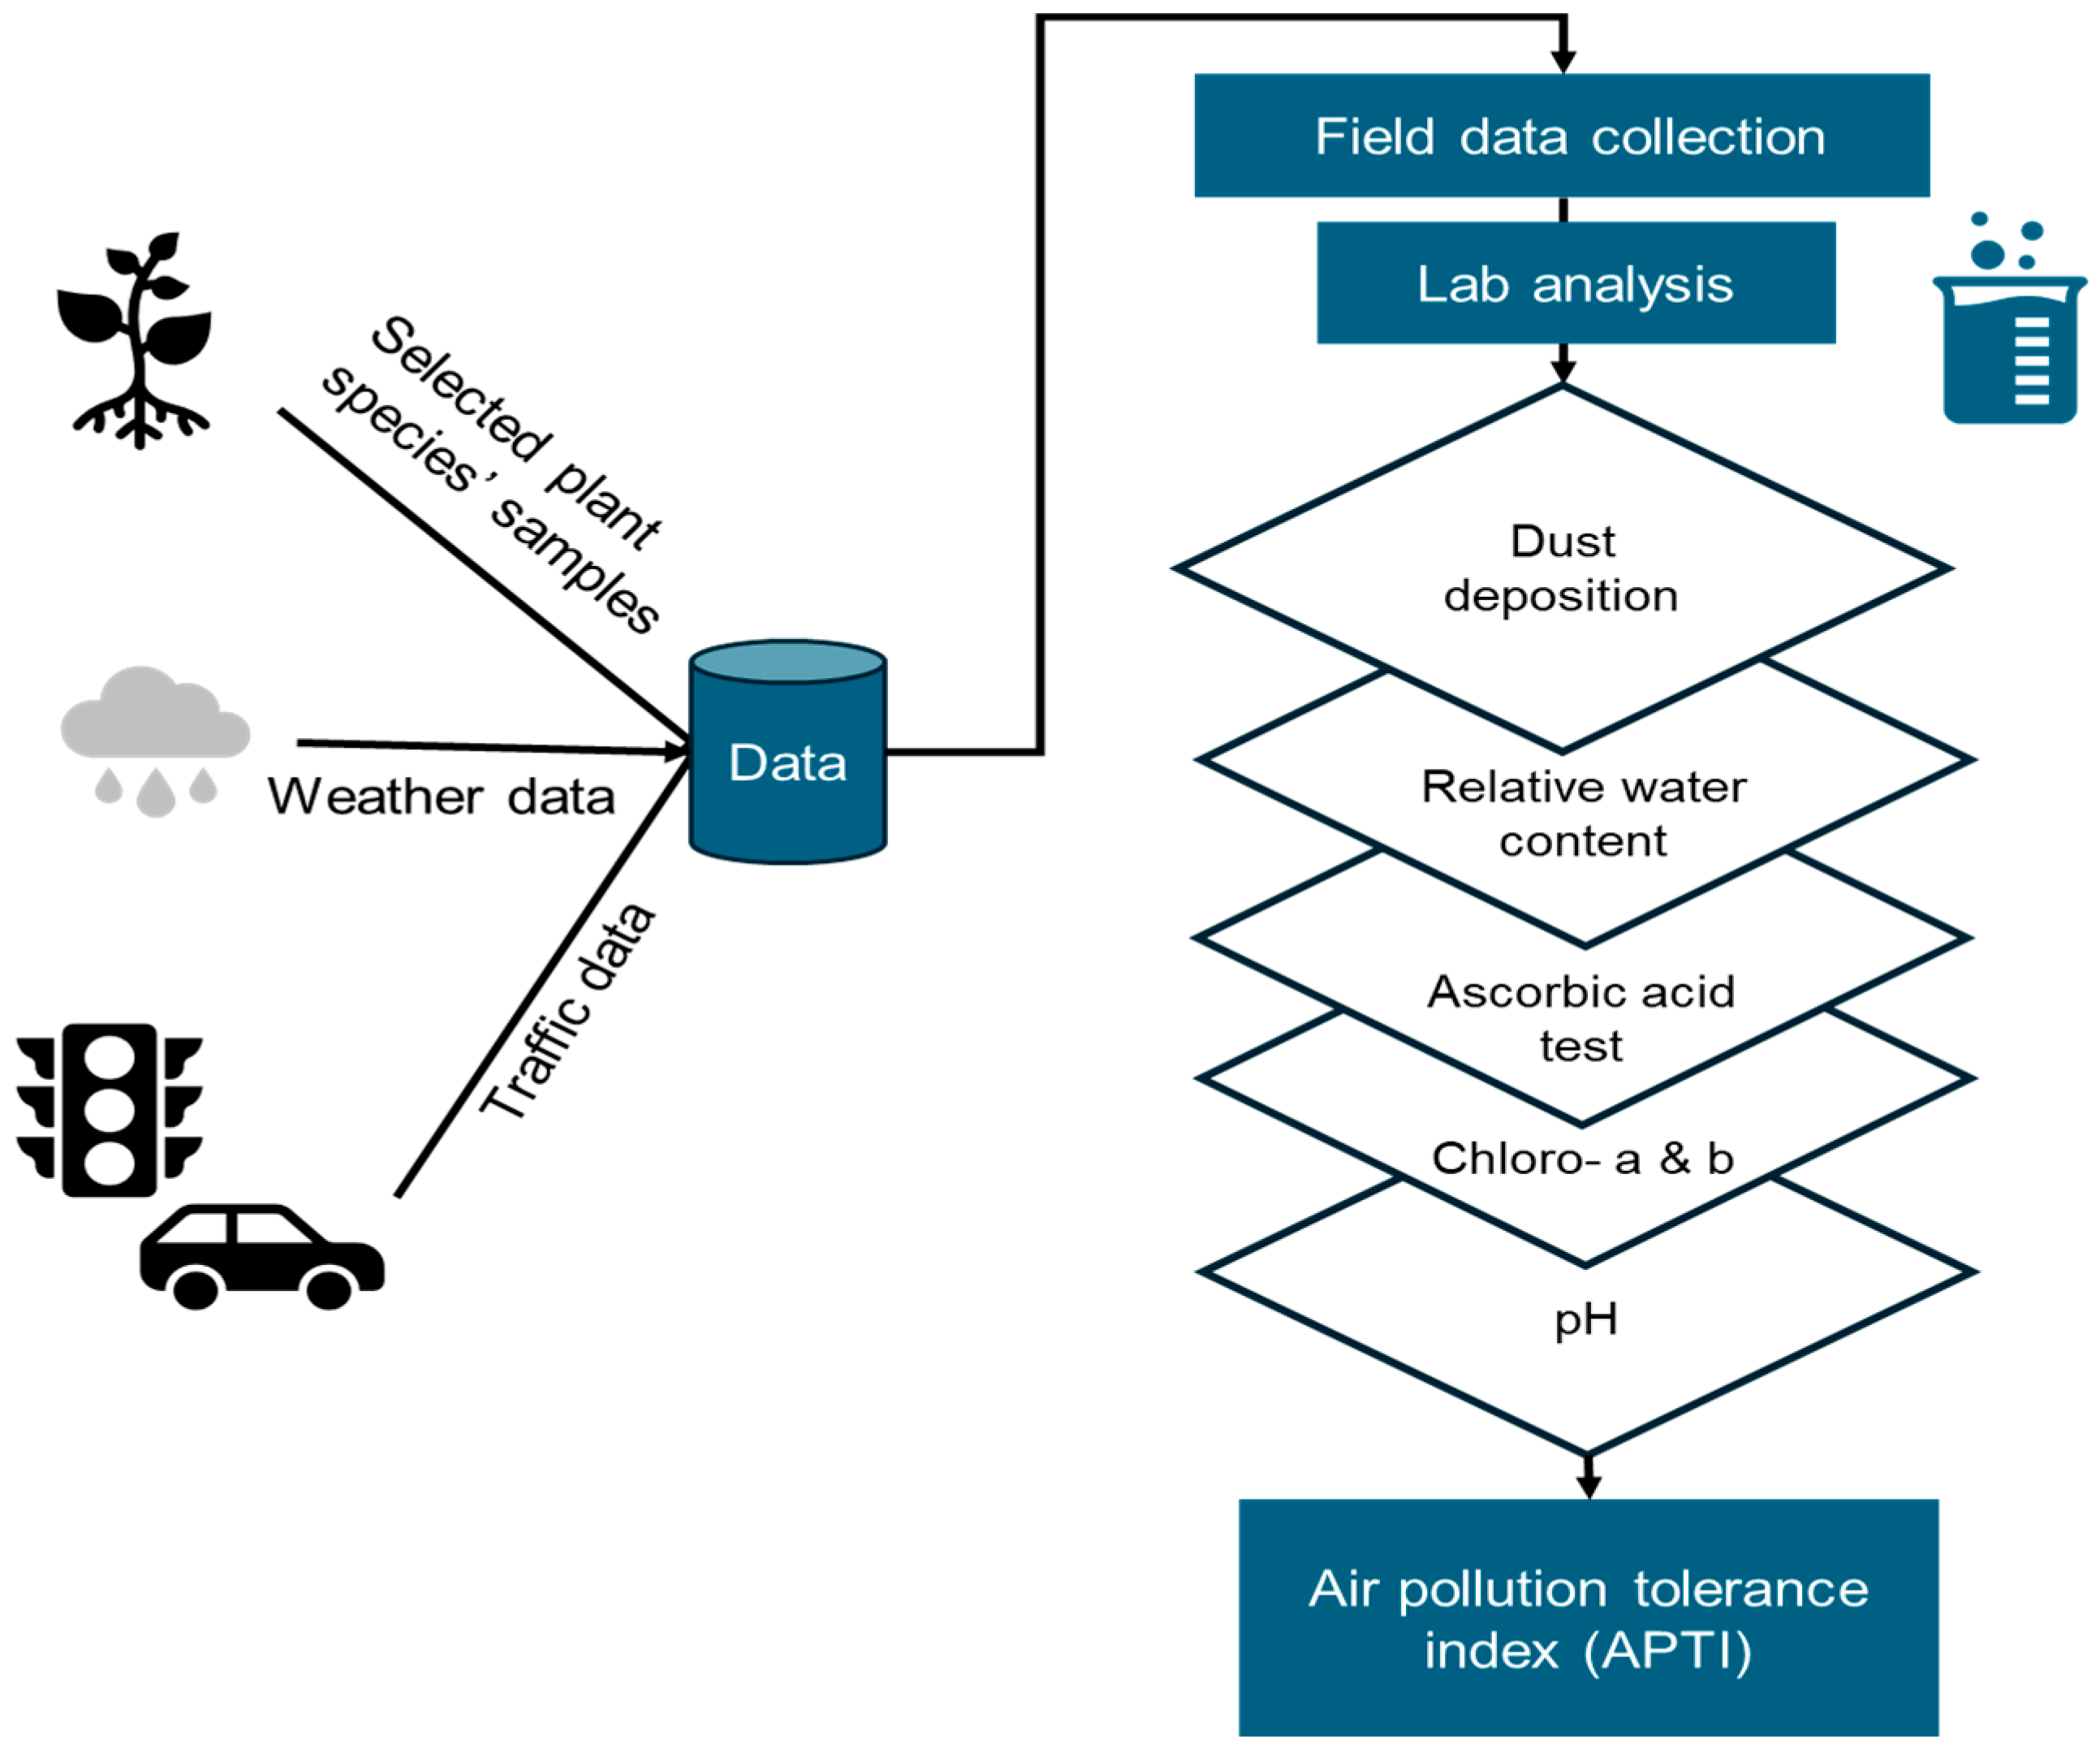
2. Materials and Methods

The following framework (Figure 1) was used to conduct this research: (a) The first step was to collect leaf samples from selected plant species to measure a dust deposition (PM10). This method involves weighing the leaves before and after washing to calculate the dust content (mg/cm2). (b) Additionally, a leaf extract pH method was used to measure the acidity or alkalinity of the leaf extract. (c) An ascorbic acid test was conducted to determine the ascorbic acid content of the leaves using a spectrophotometric method. (d) The relative water content (RWC) of the leaves was also measured to assess the plants’ water statuses. (e) Finally, the total chlorophyll values were determined using a spectrophotometer to measure the optical density at two wavelengths and calculate the chlorophyll a, chlorophyll b, and total chlorophyll contents. The above-mentioned parameters were used to calculate the air pollution tolerance index (APTI) for each plant species, indicating their tolerance to air pollution. Meanwhile, a digital camera with a tripod and 1200-pixel resolution was used to record the number of vehicles in traffic. The dust concentration values helped in understanding the amount of dust deposited on the leaves through dry or wet deposition (via rain) in the study area.

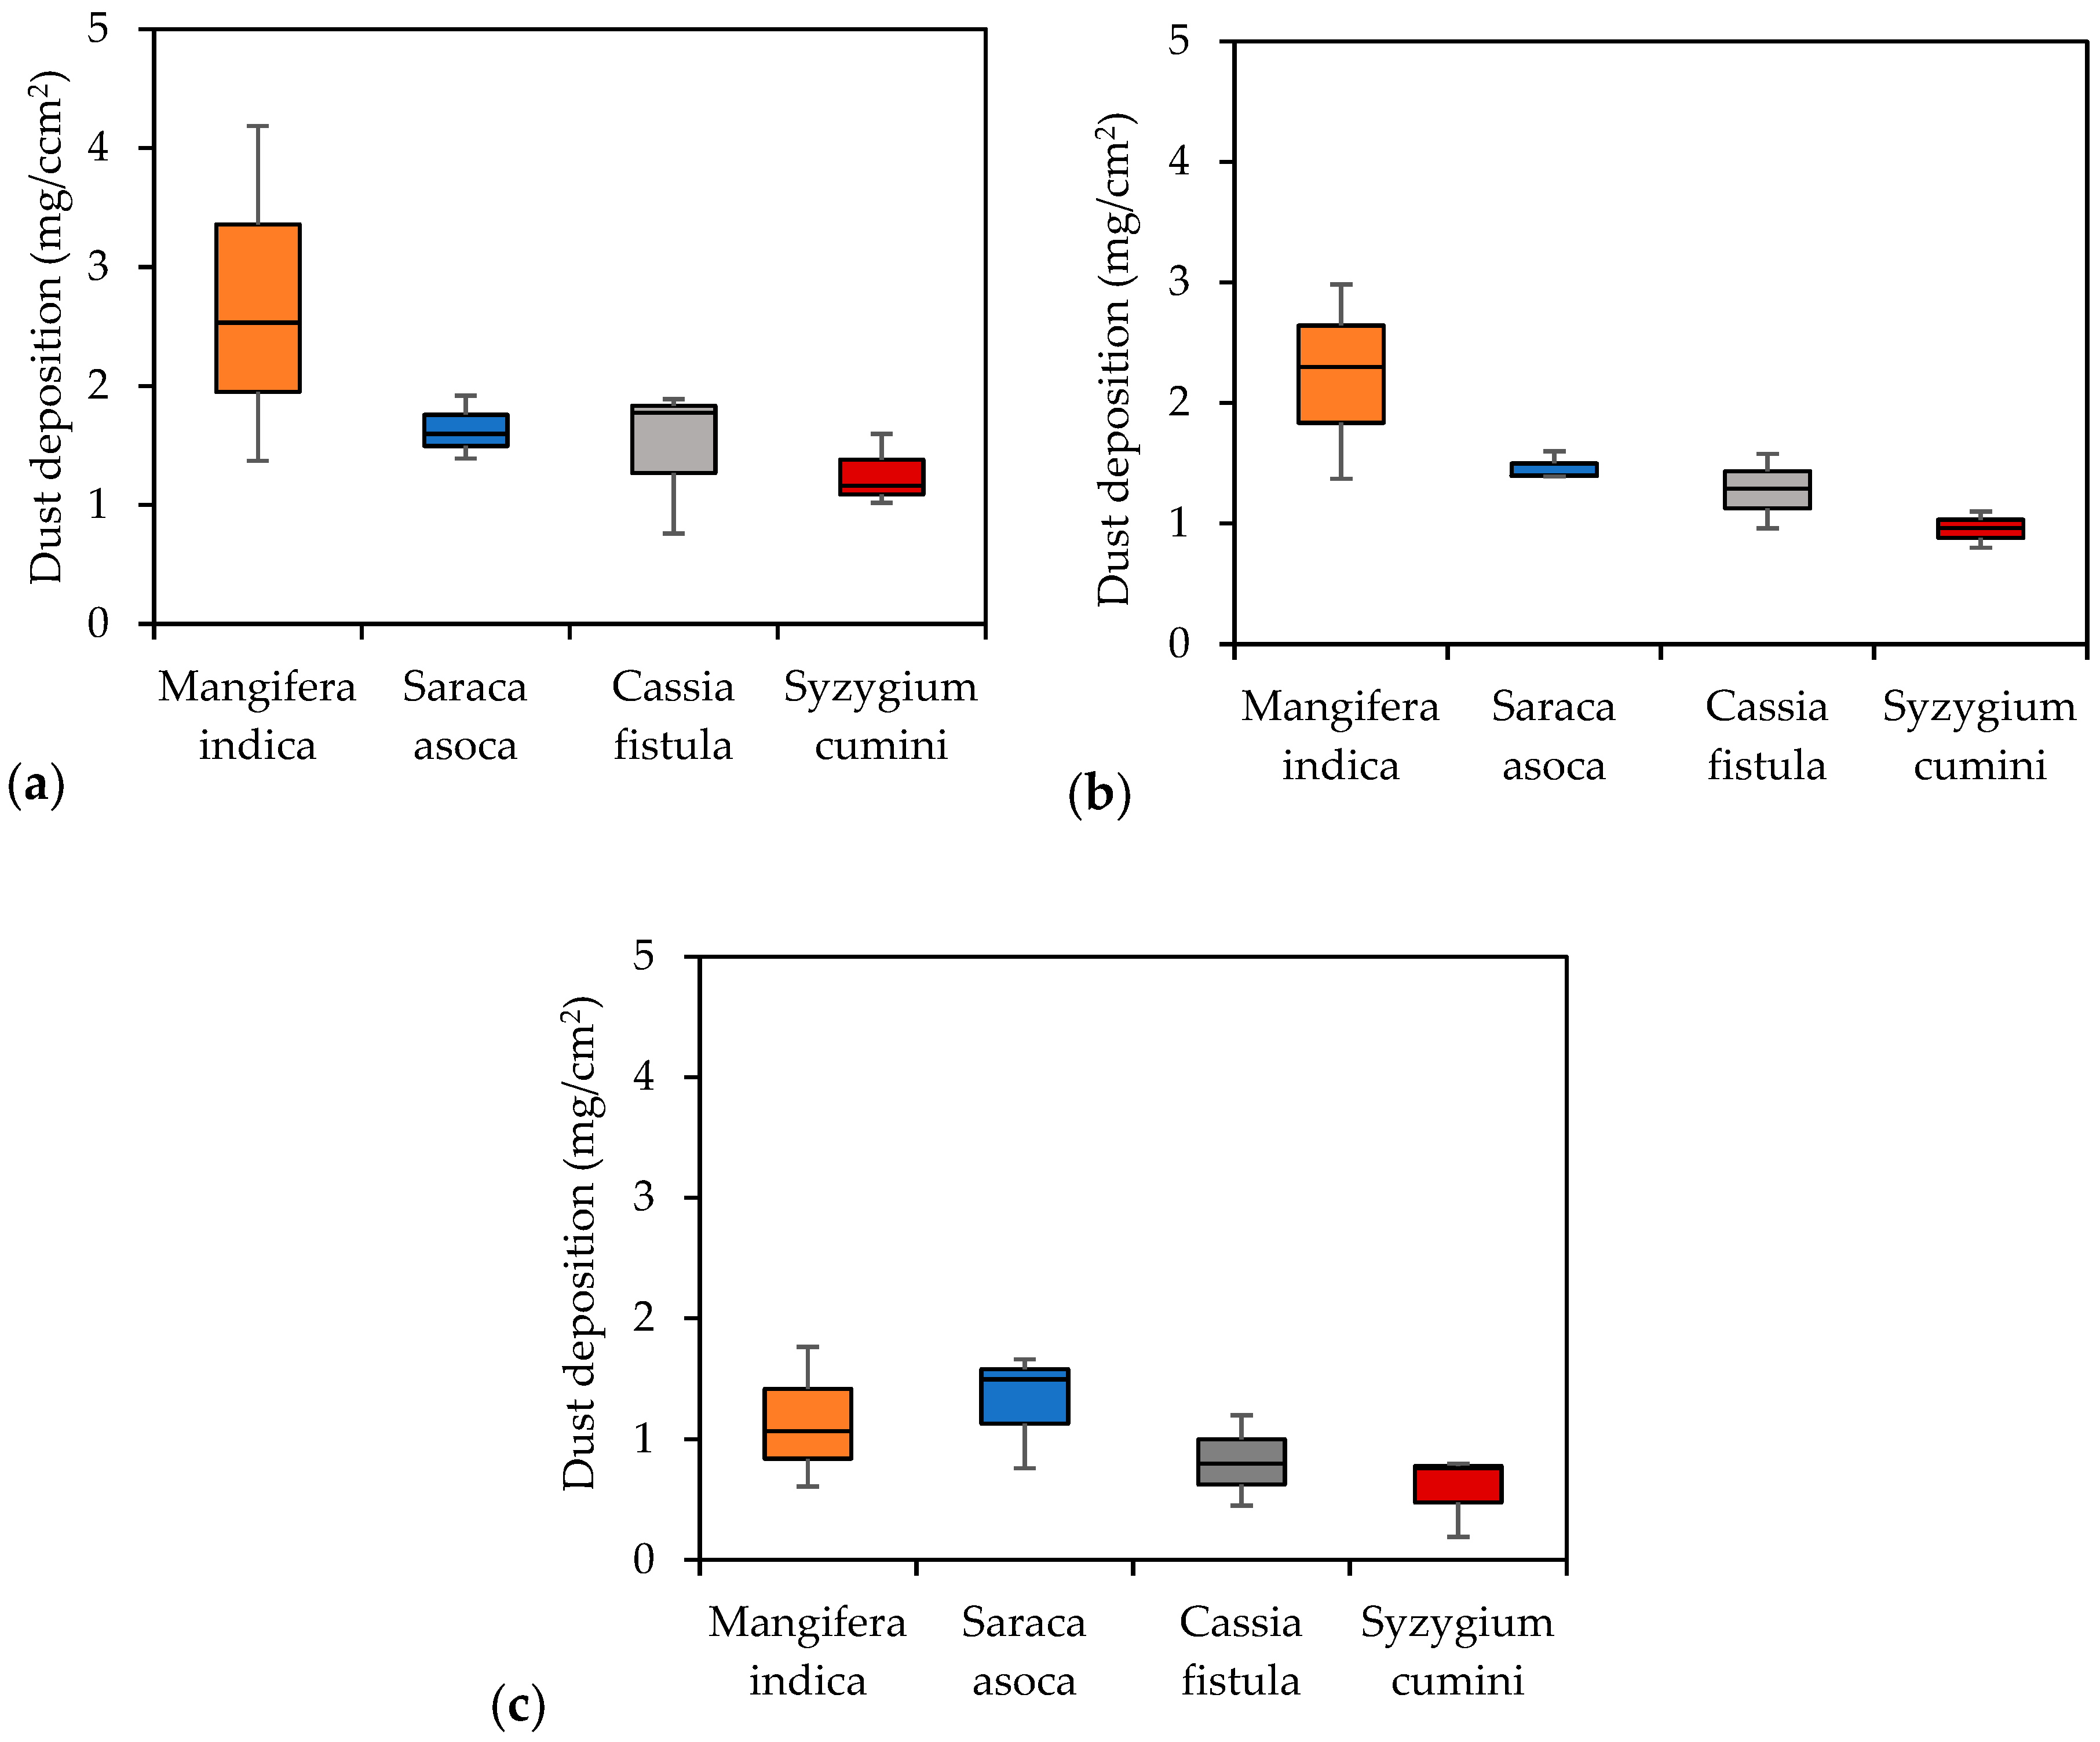
2.1. Dust Deposition

Leaves were collected from various plant species planted along both sides of Canal Road. At least three samples from each species were collected for analysis during the study period. The collected leaves were carefully placed in clean plastic bags and brought to the laboratory for further examination. It is advisable to weigh the leaves as soon as possible after collection to minimize potential changes in weight due to environmental factors such as moisture loss or additional dust settling. Once in the laboratory, the leaves were weighed and then washed and dried at 65 °C for 1.5 h. The selection of this optimal time and temperature followed careful evaluation across various temperature settings to ensure effective drying while preserving leaf integrity and associated properties. After drying, the leaves were reweighed to calculate dust accumulation using the following equation [27]:
X = X 1 X 2 A
where “X” is the dust content (mg/cm2), “X1” is the initial weight, “X2” is the final weight of leaves after drying, and “A” is the total area of the leaf (cm2).

2.2. pH of Leaf Extract

The pH of leaf samples was measured by crushing 0.5 g of each leaf sample and homogenizing it in 50 mL of water. The mixture was centrifuged to obtain the supernatant, and the pH was measured using a pH meter.

2.3. Ascorbic Acid Test

The ascorbic acid content was determined by using a spectrophotometric method (A spectrophotometer measures the intensity of light absorbed by a substance across a range of wavelengths. A spectrophotometer is well suited for measuring ascorbic acid due to its high sensitivity and precision, enabling accurate quantification even at low concentrations by detecting subtle color changes in reaction with specific reagents [28]). In a test tube, a solution was prepared comprising 1 g of fresh leaves, 4 mL of oxalic acid/EDTA extracting solution, 1 mL of orthophosphoric acid, 1 mL (5%) of tetraoxosulphate acid, 2 mL of ammonium molybdate, and 3 mL of water. The mixture was left to settle for 15 min. Absorbance of the solution was then measured using a spectrophotometer at 760 nm. The wavelength and quantity of chemical solutions were adopted from the study [6]. The concentration of ascorbic acid was calculated from a standard ascorbic acid curve, as shown in Figure 2.

2.4. Leaf Relative Water Content Test

Determining the relative water content (RWC) of the leaves is one way to estimate a plant’s water status in the context of observing the physiological effect of dust deposition. Firstly, weight of fresh samples was obtained (Xf) and then immersed in water overnight to obtain the turgid weight (Xt). After drying the leaves at 90 °C overnight, the dry weight (Xd) was recorded, and RWC was calculated using the following expression [27]:
RWC   ( % ) =   ( X f X d X t X d )   × 100

2.5. Total Chlorophyll Content Test

The total chlorophyll content of the leaf samples was calculated using spectrophotometry. Approximately 0.4 g of fresh leaf samples was ground in a mortar and pestle and extracted with 10 mL of 80% acetone. The liquid was centrifuged at 2500× g rpm for five minutes, and 50 mL of the supernatant was transferred to a volumetric flask. The optical density (OD) was measured at different wavelengths “ λ ” at 645 nm and 663 nm against an 80% acetone blank sample.
Chlorophyll a content was calculated using the following formula [23,29]:
Chlorophyll   a = 12 . 7   ×   OD   at   λ 663 2 . 69   ×   OD   at   λ 645   .   β
Chlorophyll b content was calculated using the following formula [23,29]:
Chlorophyll   b = 22 . 9   ×   OD   at   λ 645 4 . 68   ×   OD   at   λ 663 .   β
Where the total chlorophyll was determined as follows [23]:
Total   chlorophyll = 20 . 2   ×   OD   at   λ 645 8 . 02   ×   OD   at   λ 663 .   β whereas   β = Final   volume   of   chlorophyll   solution   prepared   in   acetone weight   of   leaf   tissues   extracted ( g )

2.6. Air Pollution Tolerance Index (APTI)

The air pollution tolerance index (APTI) was calculated based on an empirical approach to evaluate the tolerance of plants and trees to dust and air pollution. Plants with high APTI values are considered more tolerant to air pollutants. APTI was calculated using the equation provided in [29]:
APTI = A   ( C t + P ) + RWC 10
where “A” is the ascorbic acid content (mg/g); “Ct” is the total chlorophyll (mg/g); “P” is the pH of the leaf extract, and “RWC” is the relative water content of the leaves (%).

2.7. Quality Assurance
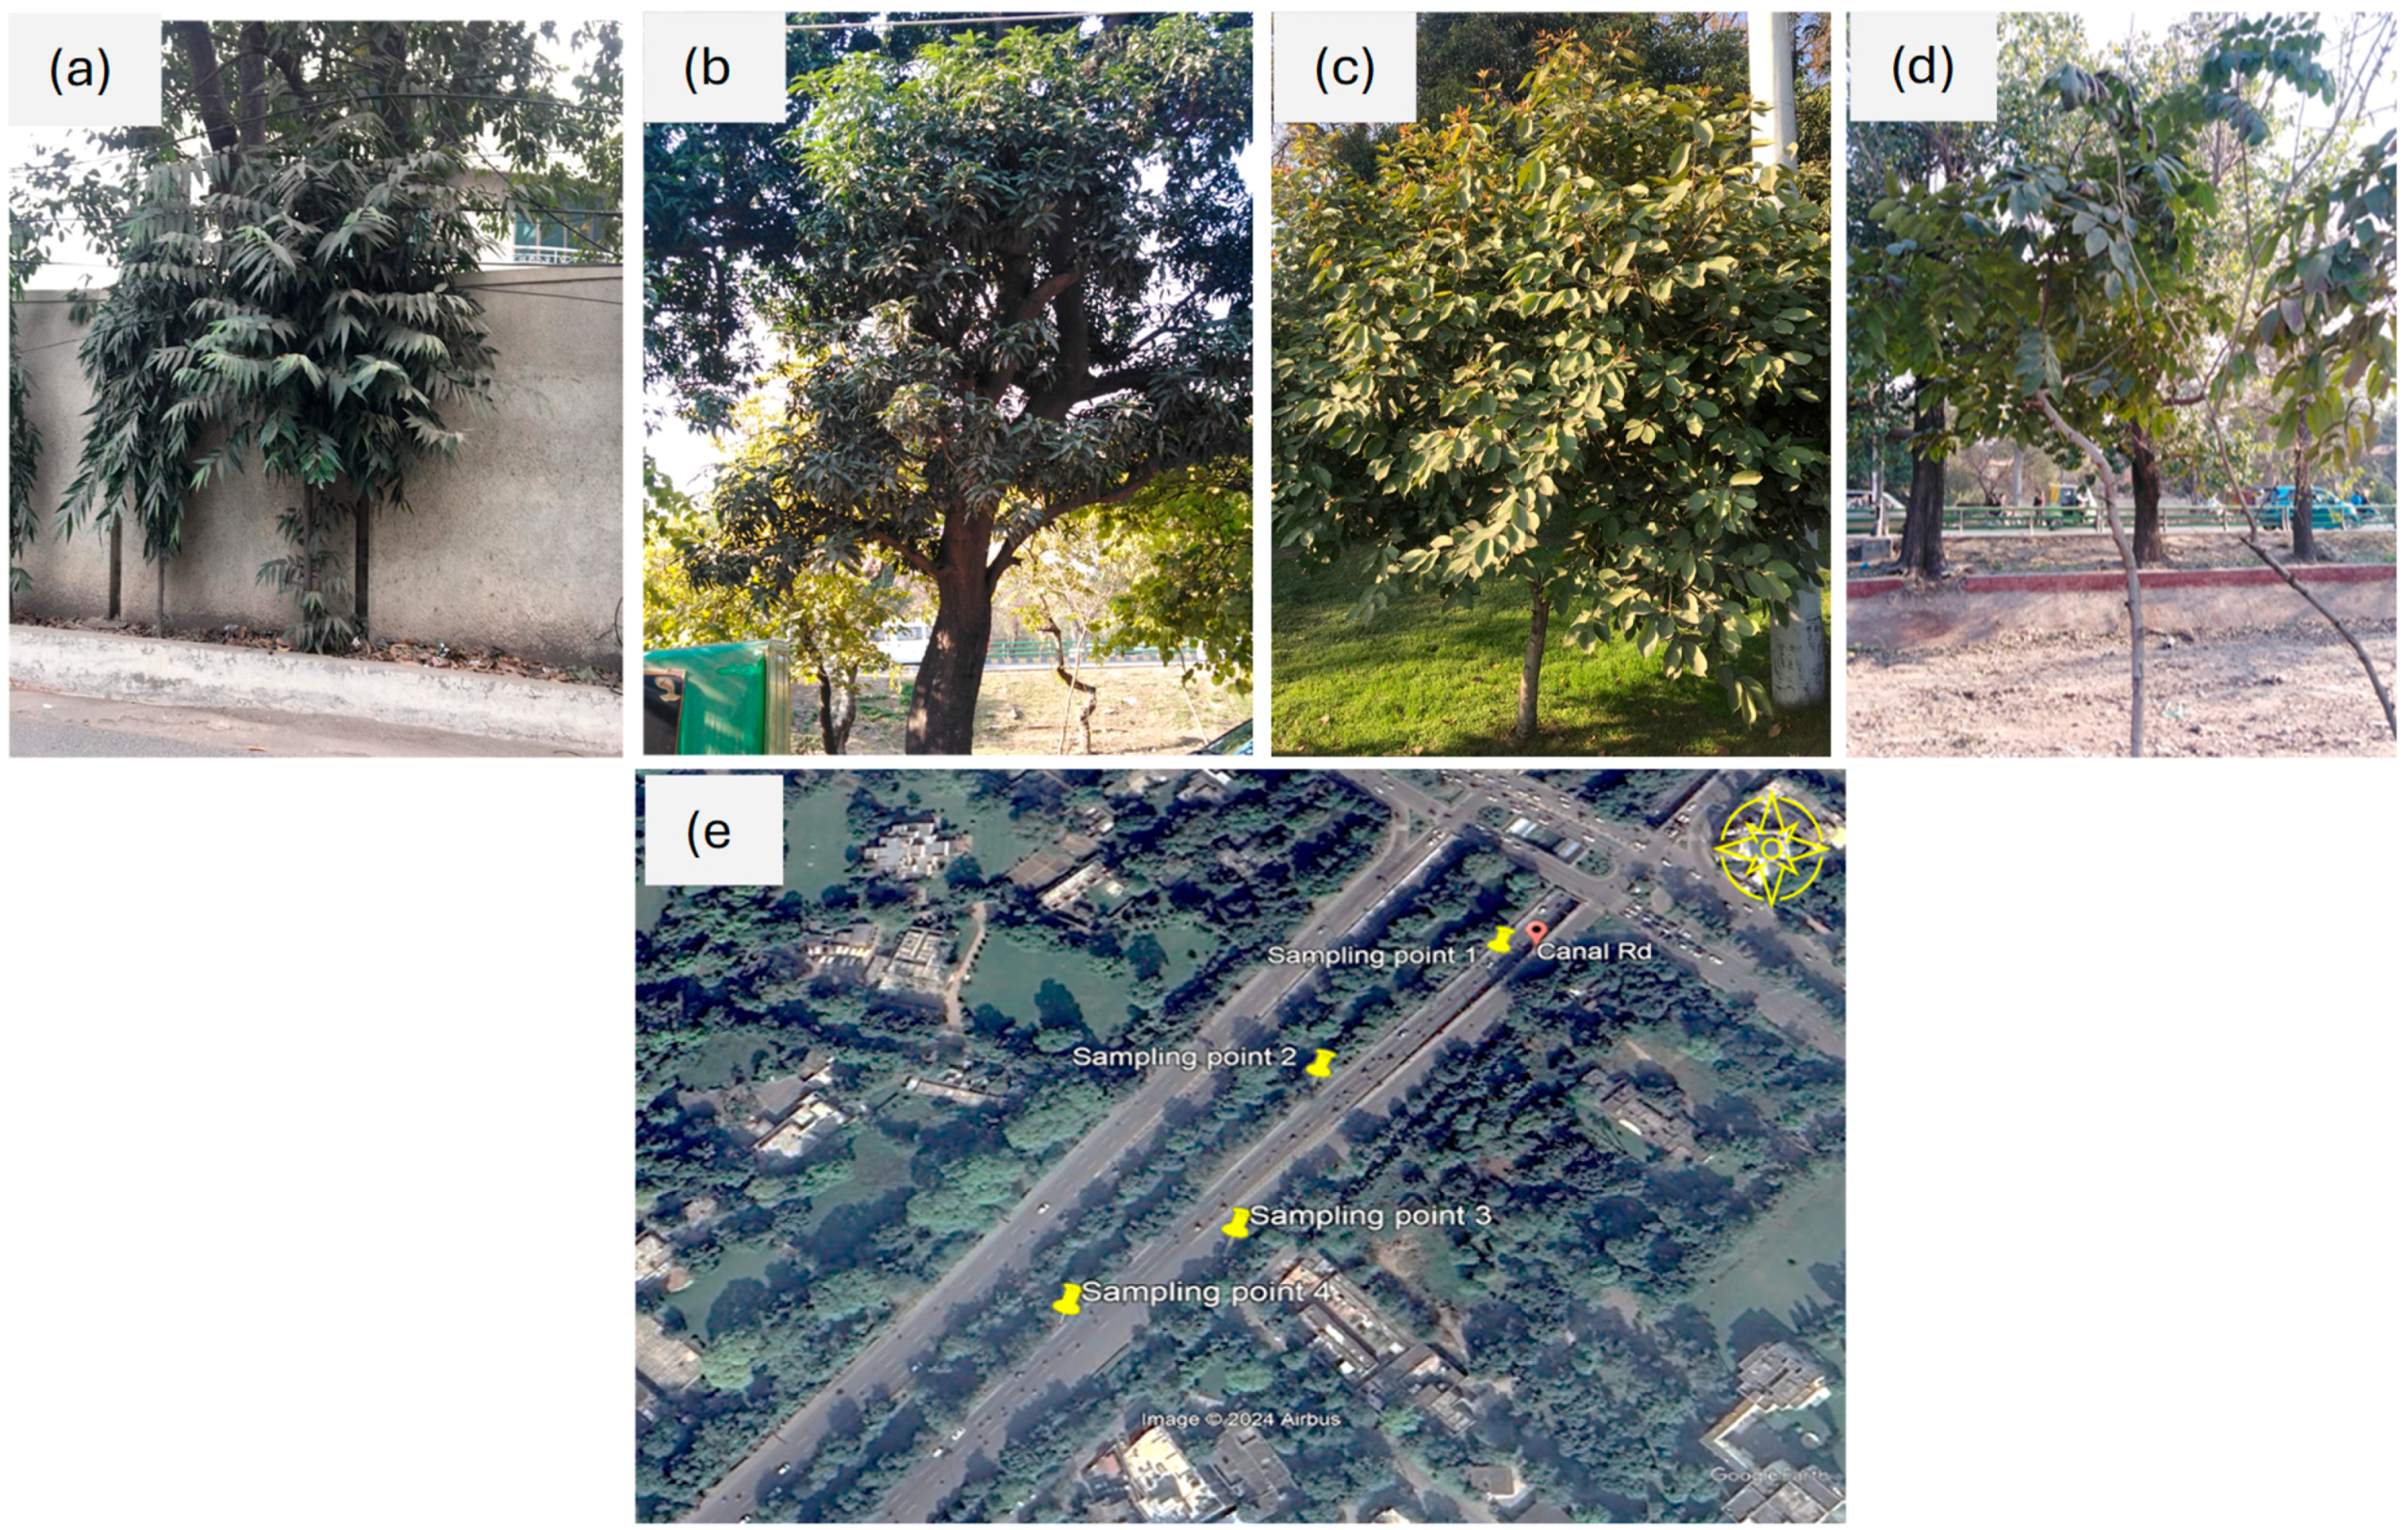
In this research, quality assurance was carefully maintained through rigorous control measures and adherence to established guidelines. For the spectrophotometer tests, blank samples were run to calibrate the equipment and establish a baseline for absorbance readings, ensuring the accuracy of the chlorophyll and ascorbic acid measurements. The concentration of ascorbic acid in the samples was calculated based on a standard ascorbic curve. For this, 0.1 to 0.8 mL of standard ascorbic acid solution was taken in a series of test tubes, and chemicals were added as before. After the incubation period, absorbance was measured at 760 nm, and a standard graph was created.
All spectrophotometer readings were taken against a solvent blank sample to eliminate potential interference and achieve precise and reliable results. For other tests, such as the pH of leaf extract, the calibration of pH meters was regularly performed using standard buffer solutions to maintain accuracy. For dust accumulation measurements, leaf samples were weighed before and after washing to precisely calculate dust content.

2.8. Case Study

Canal Road, located near the junction of Jail Road in Lahore, Pakistan, was chosen as the study site (31°32′37.51″ N and 74°20′58.91″ E) due to its status as one of the busiest roads in the city and the fact that it is part of an extensive urban traffic network. There are no other potential dust pollution sources near the road, such as industrial buildings or crowded commercial buildings. Based on the prevalence of specific plant species along the roadside, four species were selected for this study: Mangifera indica, Saraca asoca, Cassia fistula, and Syzygium cumini (Figure 3). The morphology of the selected species and their physical appearances are shown in Supplementary Material Table S1. The focus of this study was on studying dust accumulation and its impact on these plant species. Leaf samples were collected from selected plant species during the morning peak hours (8:00–10:00 am) and normal traffic hours (11:00 am–1:00 pm) to cover traffic intensity. Leaves were gathered from the lower canopy 4–6 feet above the ground during the winter, summer, and monsoon seasons. Triplicate samples of fresh and mature leaves were collected per plant. Fresh and mature leaf samples were collected from four different species at the selected site. For each tree species, eight individuals were selected for sampling in triplicate (trees on the road = 8 × 3 replicas × frequency of sampling once a month for a year). This resulted in 288 samples for each species over the entire study period. The selected species were chosen due to their abundance along roadsides throughout the province, making their analysis beneficial for understanding air pollution’s impacts on busy roads. Figure 3 illustrates the sampling sites along the roadside. The study period spanned from 2020 to 2021 (January to December), providing data across different seasonal conditions for a comprehensive analysis. This approach allowed for the assessment of dust deposition patterns and the seasonal impact of vehicular emissions on the selected plant species.
The study area is in a semi-arid climate. The daily mean temperature averages 24.9 °C. June is the hottest month, with temperatures often surpassing 45 °C. The monsoon season begins in late June, with July, August, and September being the wettest months. Additionally, the period from October to February is considered winter, while the period from March to June is considered summer. The average wind speed ranges from 7 to 13 km/h in the winter and from 15 to 20 km/h in the summer. The number of rainy days during the monsoon season is crucial for this study due to its potential effect on dust deposition, as shown in Table S2.

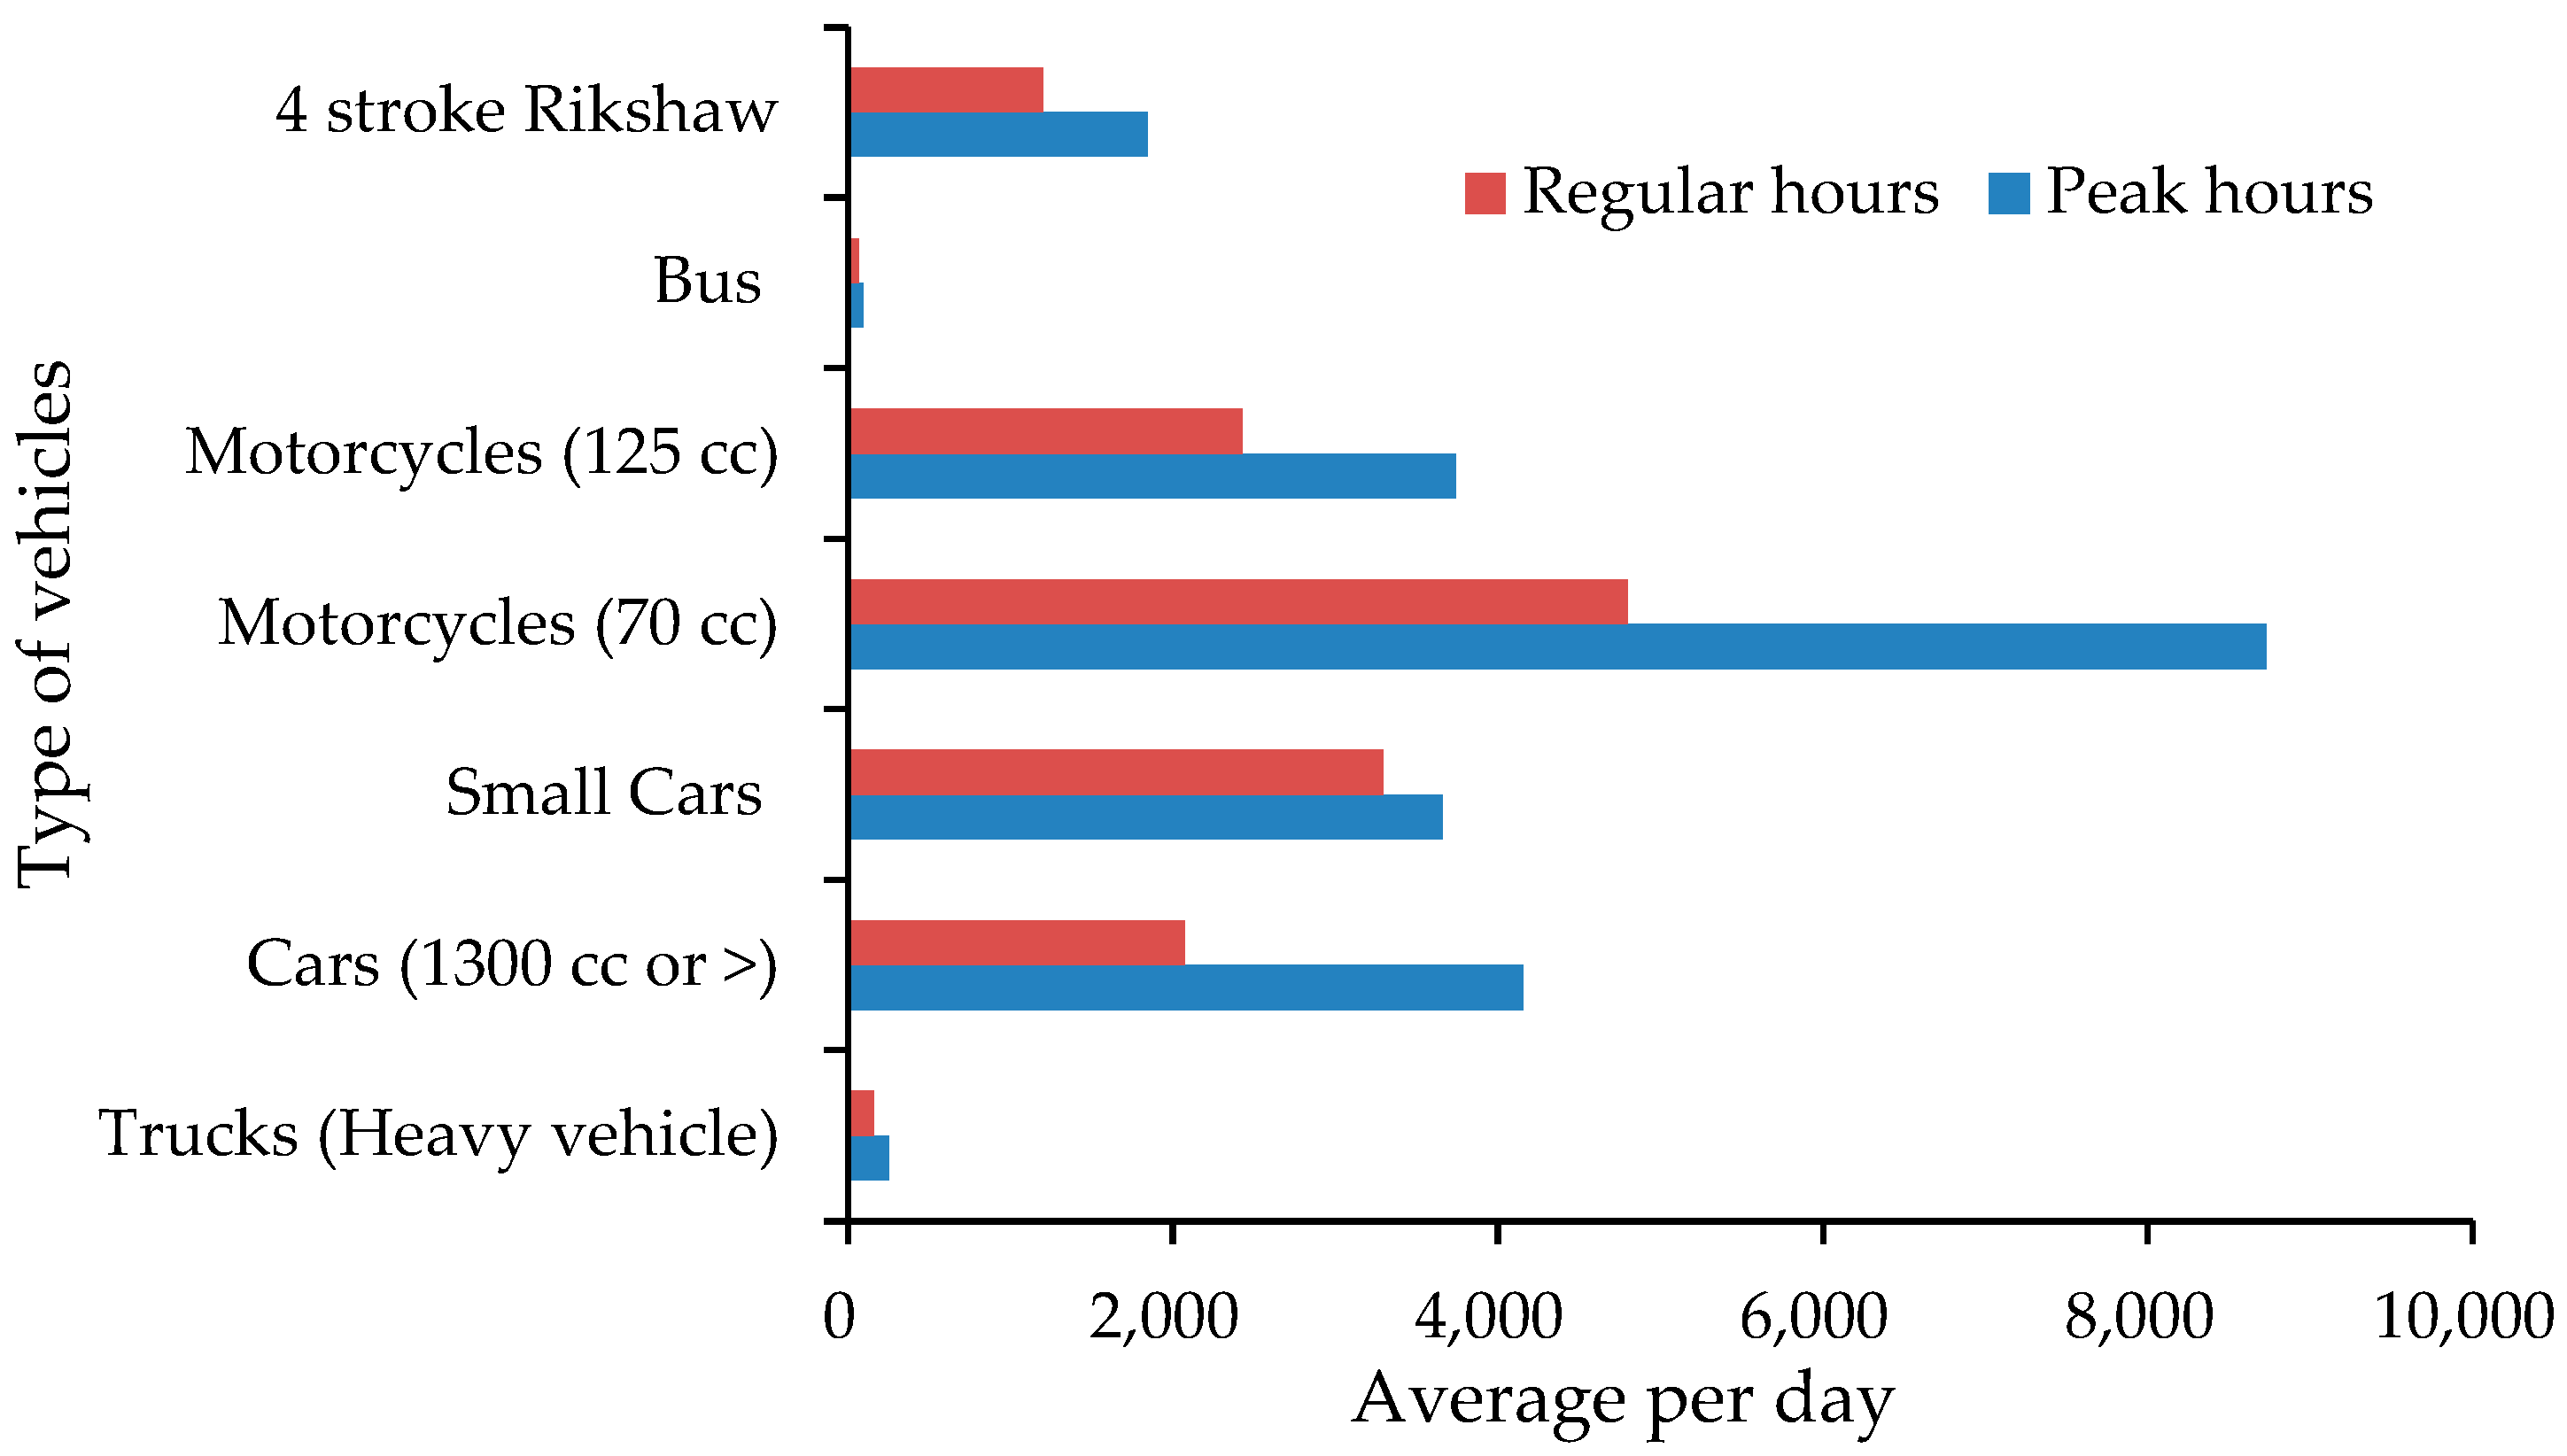
2.9. Traffic Estimation

The selected road is one of the busiest roads in the city, serving as a major thoroughfare for daily commuting. Canal Road is a two-way road and is a major thoroughfare in Lahore, and it typically has multiple lanes in each direction to accommodate the flow of traffic. The road condition and surface adjacent to the trees on Canal Road were assessed to be in fair condition, with the asphalt pavement exhibiting minor signs of wear and occasional surface cracks. The area adjacent to the trees showed evidence of routine maintenance, with intact sidewalks and green belts. The roadside trees on Canal Road are typically planted within 3 to 5 m from the edge of the road. As shown in Figure 4, traffic counts during peak traffic hours indicate an average vehicular load of 22,475 vehicles per hour, including two, three, and four-wheeled vehicles. Motorcycles (70 cc) were the most common type of vehicle (8727 per hour), while public buses were the least common (90 per hour). Many medium-income residents prefer motorcycles for personal transportation due to affordability. For public transport, people tend to prefer three-wheeled rickshaws over buses because local bus routes may not cover all areas. The prevalence of private vehicles is influenced by nearby office buildings, resulting in higher numbers of private cars compared to public transport. During peak hours, the traffic volume increases by 25 to 40% compared to regular traffic hours. This surge is particularly pronounced in the morning due to rush hours when commuters are heading to their offices. Road surface conditions play a significant role in dust generation, as vehicle pressure pulverizes unpaved materials, contributing to air pollution.

2.10. Statistical Analysis

A statistical analysis was performed to evaluate the significance of differences among group means and explore correlations between various biochemical parameters and the air pollution tolerance index (APTI). Initially, a one-way analysis of variance (ANOVA) was employed to determine significant differences among group means, with the F-statistic being used to assess the overall significance. An ANOVA assesses whether there are any statistically significant differences between the means of three or more independent groups. Subsequently, Duncan’s multiple range test (DMRT) was utilized as a post hoc method to identify specific group variations. Following this, a Pearson correlation analysis was employed to explore pairwise correlations between various biochemical parameters and the air pollution tolerance index (APTI). This methodological approach facilitated a comprehensive examination of the dataset, encompassing both group differences and pairwise associations.
Furthermore, a Spearman correlation ranking analysis was utilized to elucidate the relative importance and percentage contribution of various factors, including traffic density, seasonal variations, dust deposition, and species type, to the overall APTI. This non-parametric method facilitated the examination of monotonic relationships between these factors and APTI scores, providing valuable insights into their respective influences on plants’ tolerance to air pollution.

Monte Carlo (MC) Method

The MC method offers a direct approach to addressing stochastic uncertainties by generating numerous random instances of input parameters and providing APTI values using the resulting mean and standard deviation. Subsequently, the sampled outcomes are assessed using the probability density function (PDF). For this study, the normal PDF method is employed, and 1000 iterations are used to analyze uncertainties. The following expression represents the normal distribution function [30]:
P f ( x ) = 1 σ 2 π .   exp   ( ( x     μ x ) 2 2 σ 2 )
where “Pf” is the probability distribution function, “x” represents the random variable of input parameters, “µ” is the mean of x, “σ” represents the standard deviation, and “σ2” is the variance.

3. Results

3.1. Dust Deposition

This study found that dust deposition on leaves varied among different plant species, with values ranging from 0.19 to 4.8 g/cm2. Figure 5 illustrates the seasonal variation in dust accumulation on the leaves of the studied plants. All plants experienced higher dust deposition during the winter (AQI: 79–247), followed by the summer (AQI: 39–56), with the lowest accumulation in the rainy season (AQI: <50) [12]. The highest accumulation in winter may be due to the wet surfaces of leaves capturing dust particles in foggy conditions, with gentle breezes limiting particle dispersion. In contrast, dust particles are washed away on rainy days, resulting in lower accumulation compared to the winter. Among the studied species, Mangifera indica experienced the highest dust accumulation, followed by Saraca asoca, Cassia fistula, and Syzygium cumini. Cassia fistula and Syzygium cumini had less dust deposition due to their smooth surfaces and minimal roughness. The higher dust deposition on Mangifera indica may be attributed to its waxy coating, roughness, and slightly folded margin compared to other species. However, a higher dust deposition does not necessarily indicate sensitivity to air pollution. A further biochemical analysis is required to identify sensitive species, as discussed in the next section.

3.2. Biochemical Analysis

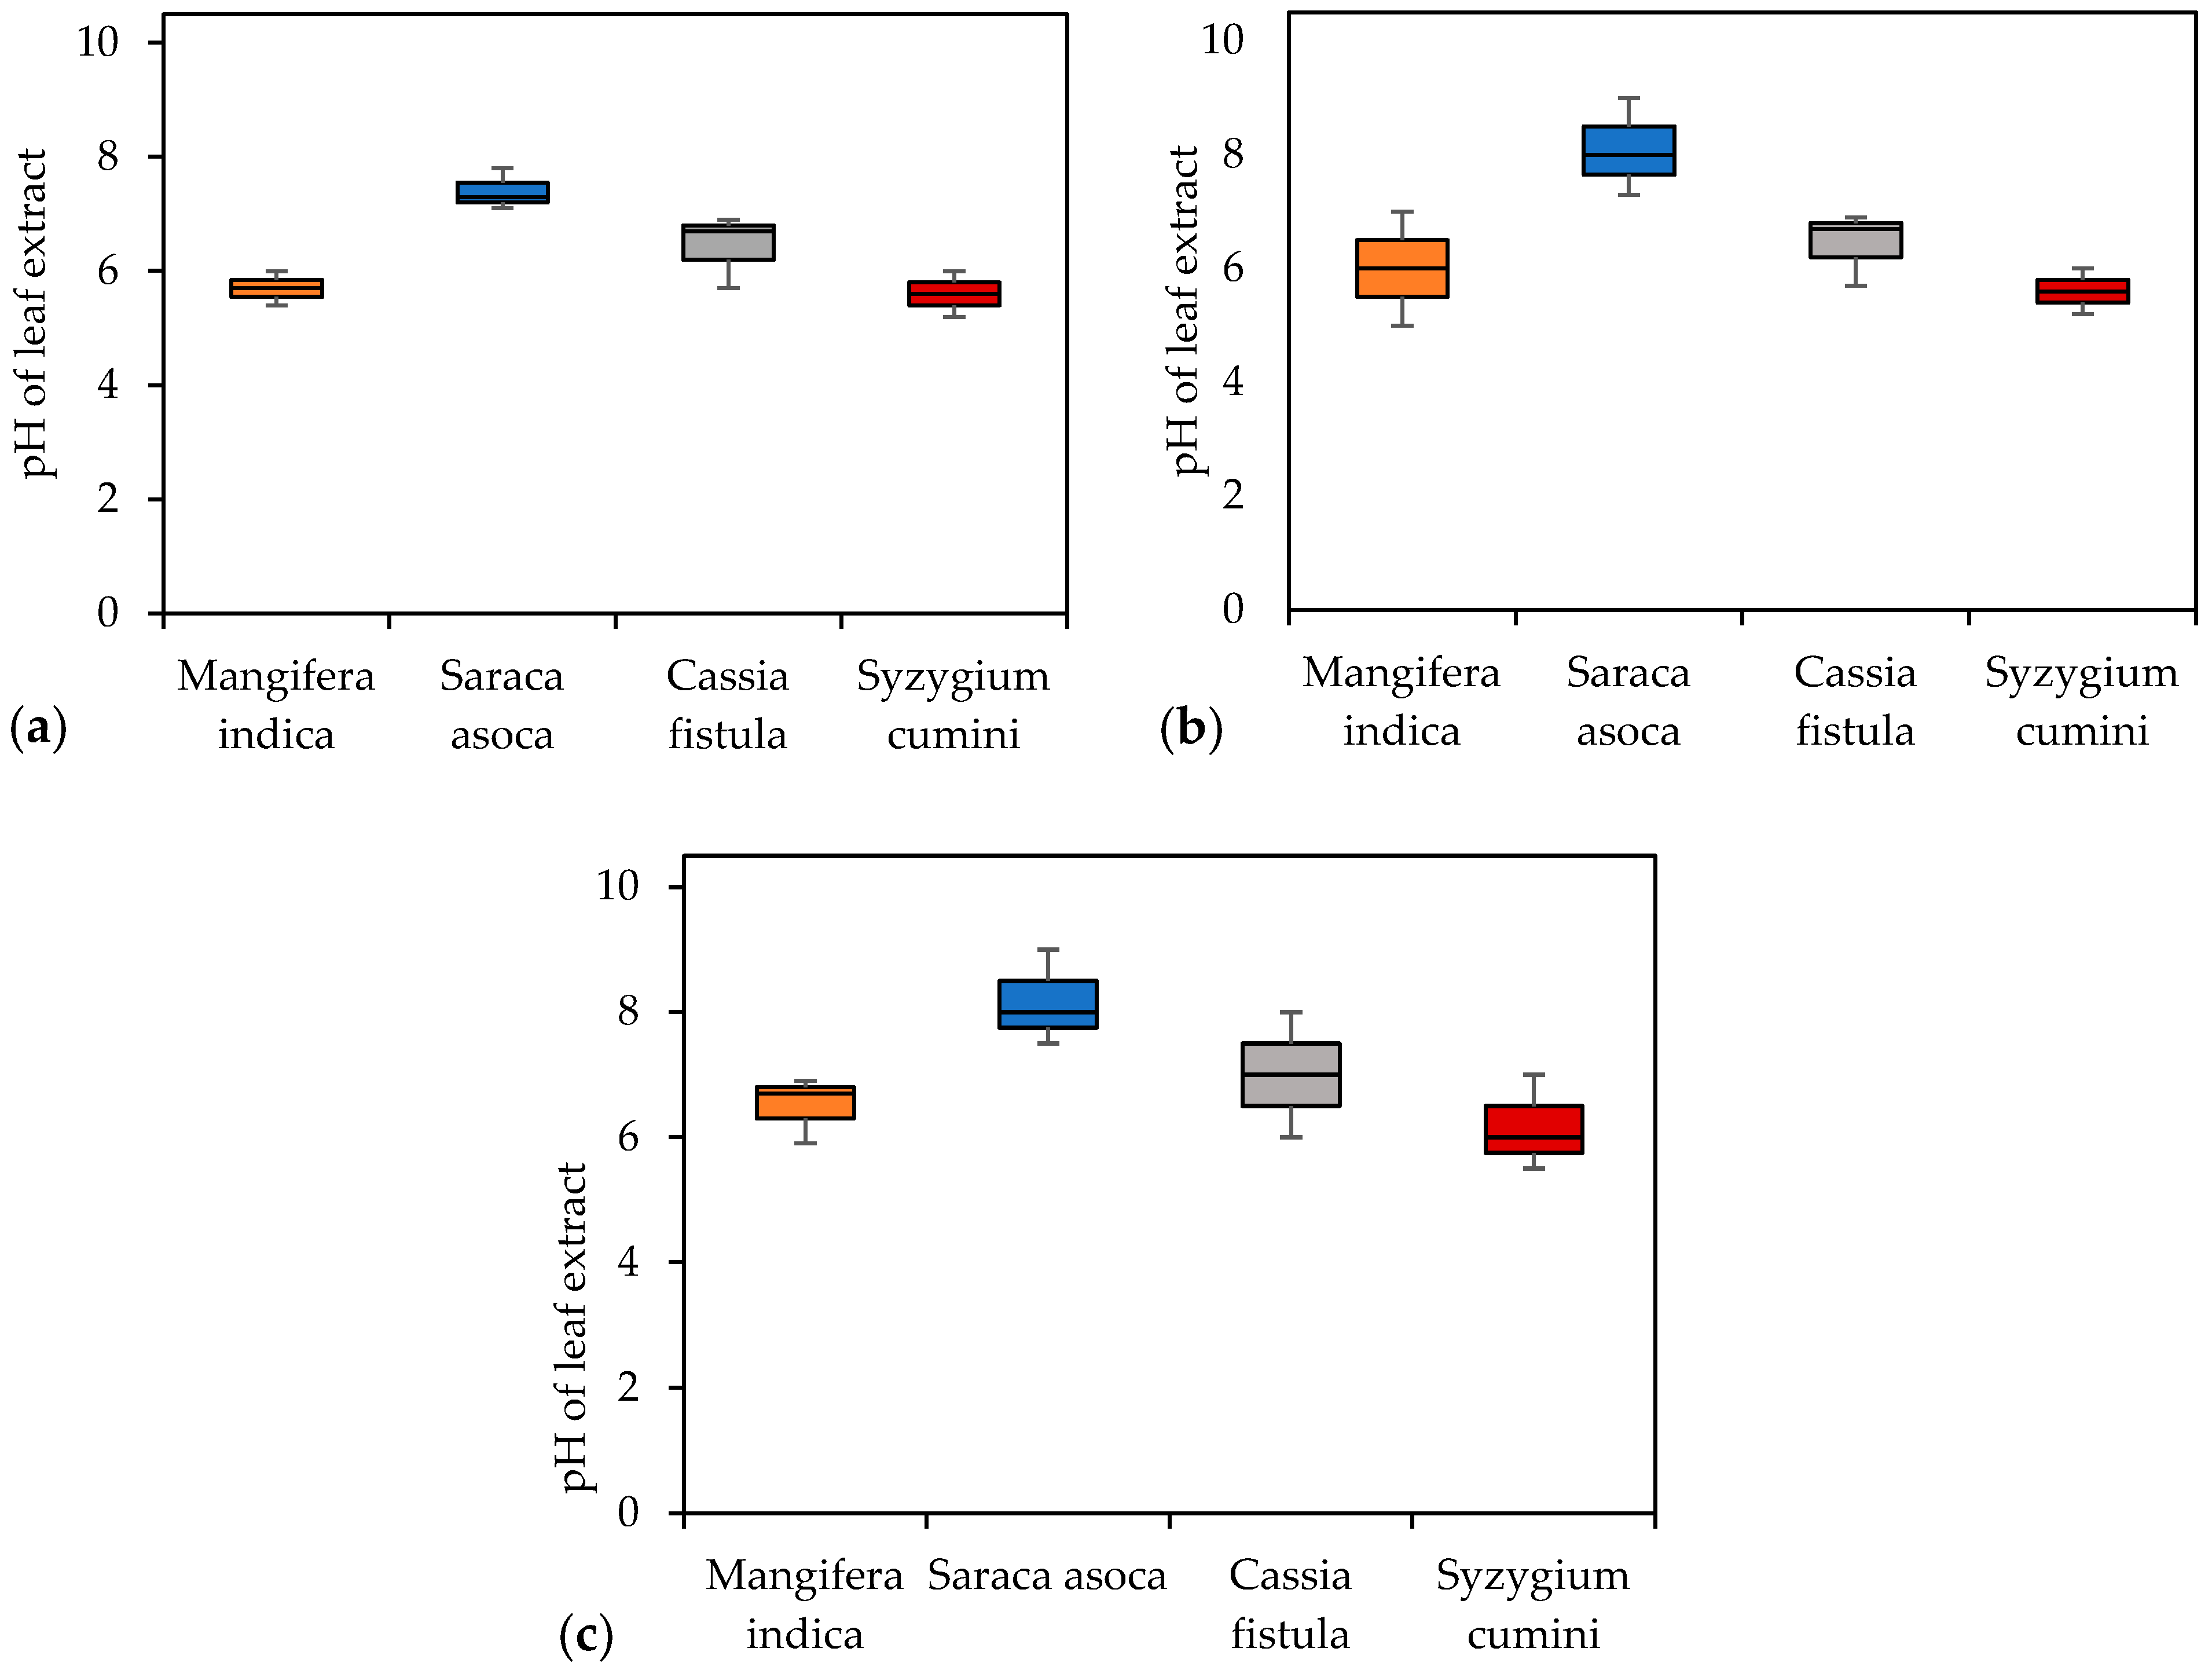
3.2.1. Leaf Extract pH

The pH of leaf extract is an indicator of a plant’s susceptibility to air pollution. A lower, more acidic pH suggests that photosynthesis may be reduced, rendering the plant more sensitive to air pollution. In contrast, a higher, more alkaline pH indicates greater resistance to air pollution and other contaminants. An acidic pH also leads to decreased cell sap in plants and a reduced transformation of hexose sugars into ascorbic acid. The pH levels of the four studied species ranged between 5.5 and 8, as shown in Figure 6. According to past studies, a pH range between 4.4 and 8.8 encompasses both intermediately tolerant and sensitive plant species [29]. Therefore, the studied species can be considered intermediately tolerant and sensitive to air pollution. Seasonal variation had different effects on plant species, with an average higher pH level being observed during the rainy season compared to the summer, and the lowest pH levels being observed in the winter. The pH values during the summer may be attributed to increased dust accumulation, which leads to particle dissolution in cell sap. Additionally, the washing of leaves during the rainy season may contribute to higher pH levels. Regarding sensitivity, Mangifera indica was found to be the most sensitive species based on the pH levels, followed by Syzygium cumini. In contrast, Saraca asoca and Cassia fistula showed pH levels ranging from neutral to alkaline, indicating less sensitivity to air pollution.

3.2.2. Chlorophyll Content

The chlorophyll content of plants is a significant parameter that evaluates photosynthetic activity, growth, and biomass development. A higher level of vehicular pollution typically correlates with a lower chlorophyll content in plants. The selected plant species demonstrated significant variation in the total chlorophyll content, ranging from 1.96 to 2.86 mg/g, as shown in Figure 7. Among the four species, Mangifera indica had the highest total chlorophyll content at 2.43 mg/g, which was significantly different from the other species. This was followed by Cassia fistula (2.5 mg/g), Syzygium cumini (2.3 mg/g), and Saraca asoca (2.2 mg/g). The variation in chlorophyll content among the species may be due to the different environmental conditions and pollution levels, as well as the sensitivity of the plants.
Dust accumulation on the plants can interfere with the process of photosynthesis, which is essential for plant growth. The greater the dust deposition, the lower the chlorophyll content. Plants with a total chlorophyll content between 0.90 and 9.38 mg/g are categorized as being sensitive to pollution, indicating that all of the studied species were sensitive to pollution load. In terms of seasonal variation, the chlorophyll content followed a similar trend to the pH levels, with a higher content during the rainy season, followed by the summer, and the lowest levels during the winter.

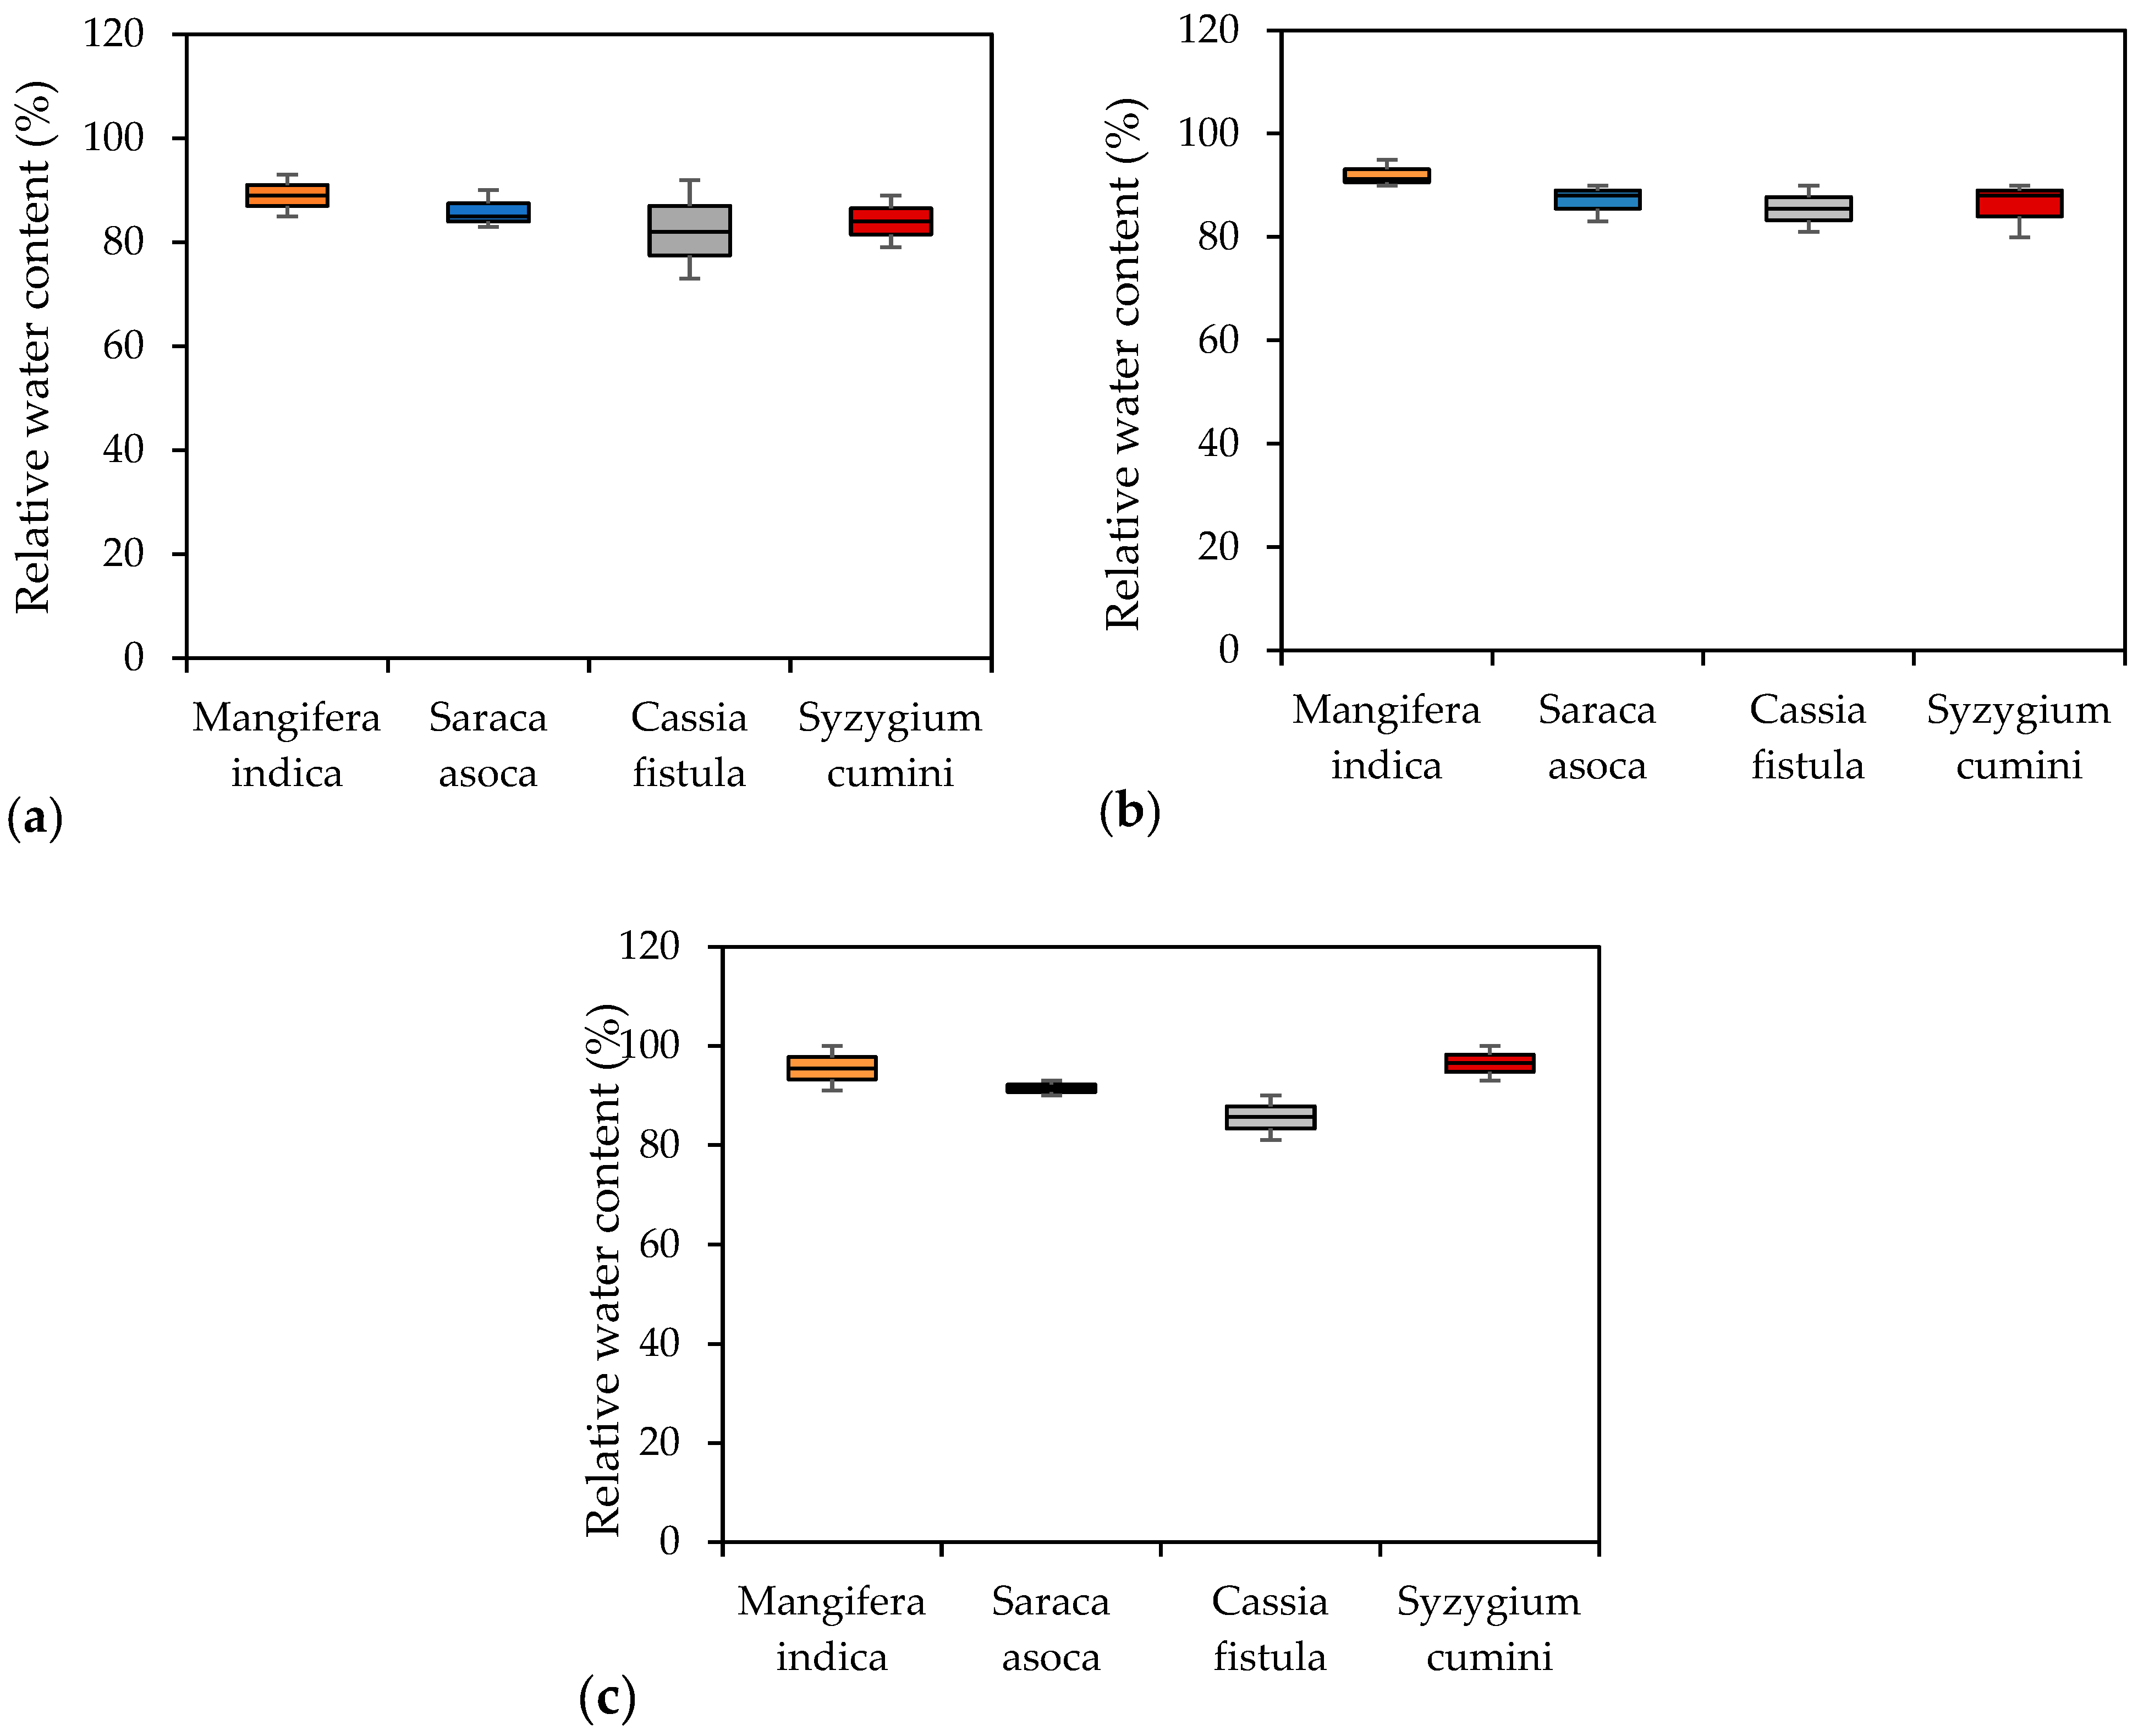
3.2.3. Relative Water Content

The impact of pollutants on the transpiration rate in plant leaves can reduce the relative water content (RWC) in the leaves. Dust on the plant may also absorb water from non-cutinized plant surfaces, such as leaves, stems, and branches, particularly in high-temperature conditions. This can lead to an increase in evaporation from the plant, resulting in a decrease in the RWC. High RWC levels were observed during the rainy season, followed by summer and winter (Figure 8). The current findings show that the average maximum RWC was recorded for Syzygium cumini during the monsoon season (94.8%), while the minimum RWC was recorded for Cassia fistula during the winter (77.5%). The average ranking for the RWC values of the plant species is as follows: Mangifera indica (91.93%) > Syzygium cumini (88.73) > Saraca asoca (87.39%) > Cassia fistula (84.1%). The RWC status of leaves depends on physiological variables, such as leaf turgor, stomatal conductance, transpiration, photosynthesis, and respiration. An RWC value ranging between 51.3% and 84.0% is usually correlated with sensitive plant species [11]. Therefore, Cassia fistula was found to be the most sensitive during the summer and winter seasons.

3.2.4. Ascorbic Acid

Ascorbic acid plays a crucial role in stress tolerance, serving as an antioxidant that is present in large amounts in all growing plants. It influences resistance during exposure to air pollution and adverse environmental conditions. Ascorbic acid is also vital for cell wall synthesis, defense, and cell division. The reducing power of ascorbic acid is proportional to its concentration and is dependent on pH. The highest ascorbic acid content was found in Mangifera indica during the rainy season, measuring 6.4 mg/g, while the lowest content was found in Syzygium cumini during the winter season, measuring 0.42 mg/g (Figure 9). Seasonal variation studies showed that the most ascorbic acid was observed during the rainy season, followed by the summer and winter seasons. The increase in pollution load during the winter due to meteorological conditions, the heat stress during the summer, and the washing down of pollutants during the rainy season may influence the ascorbic acid content. The ranking order of high ascorbic acid contents for the selected plant species is Mangifera indica (5.13 mg/g), Cassia fistula (4.09 mg/g), Syzygium cumini (1.07 mg/g), and Saraca asoca (0.92 mg/g). These results align with the findings of Bhattacharya et al. (2013). A higher ascorbic acid content in plants is indicative of tolerance against pollutants such as sulfur dioxide (SO2) and nitrogen dioxide (NO2). Plants that are less tolerant to these pollutants tend to close their stomata quickly upon exposure. A similar effect was observed for dust particles in this study, suggesting a defense mechanism against pollution. In sensitive species, ascorbic acid levels can reach up to 8.23 mg/g.

3.3. Air Pollution Tolerance Index

The air pollution tolerance index (APTI) of a plant indicates its susceptibility to pollution, such as dust deposition and peak traffic hours, as studied here. A high APTI value suggests that a plant is more tolerant to pollution. Plants can be classified into three categories of sensitivity: an APTI < 10 is considered sensitive, an APTI of 10–16 represents intermediate sensitivity, and an APTI ≥ 16 represents good tolerance [25,29]. The APTI values calculated for each plant species studied across different seasons are represented in Table 1. The APTI range for the studied plants is between 9.39 and 14.75, indicating sensitivity to intermediate sensitivity. On average, most species showed the highest tolerance in the monsoon season and the lowest in the winter. When comparing the APTI results with seasonal dust deposition, increased dust deposition during the winter is observed due to a low wind speed and fewer chances of dust dispersion, hence contributing to a low level APTI. Similarly, when comparing the data between peak hours and regular traffic hours, the plants showed more tolerance during regular traffic hours. Thus, there is a 0.9 to 5% difference in the APTI between peak and regular traffic hours. However, the sensitivity range is not affected by traffic intensity. If a plant has intermediate tolerance, it remains in the same domain. Table 1 illustrates that Mangifera indica is the most intermediately tolerant (13.4), followed by Cassia fistula (12.1). Meanwhile, Syzygium cumini is the most sensitive (9.77), followed closely by Saraca asoca (9.75) as the most sensitive species among the selected plants.
In addition, Table 1 presents a comparison of the APTI values of the selected tree species with existing values in the literature, which helps us understand that regardless of the source type and atmospheric conditions, the tolerance rankings remain relatively consistent when based on similar species. While traffic intensity plays a qualitative role in building a scenario, the dust level is a good parameter to quantify the APTI levels of the species. Moreover, variations in the APTI value in this study, compared to other studies, can be attributed to disparities in urban conditions such as pollution levels and sources. This underscores the significance of conducting location-specific studies to better understand the tolerance levels of various tree species and their potential roles in urban pollution mitigation efforts.
Figure 10 presents a probability analysis of the air pollution tolerance index (APTI) for the four selected species, along with their standard deviations and standard errors, employing the Monte Carlo (MC) analysis methodology. Additionally, it displays the average APTI values for Mangifera indica (13.75), Saraca asoca (9.74), Cassia fistula (12.17), and Syzygium cumini (9.76). The normal distribution method was utilized to statistically ascertain the maximum probability of APTI based on the input variables by employing Equation (4).
In the selected site, based on the total sample size of 288 leaves per species, significant correlations among different biochemical parameters and the air pollution tolerance index (APTI) were observed at the 0.05 level and 0.01 level (see Table 2). The APTI exhibited significant positive correlations with both the ascorbic acid content and relative water content (r = +0.92, p < 0.01 and r = +0.82, p < 0.05, respectively). This positive correlation suggests that higher levels of both ascorbic acid and relative water content are associated with increased air pollution tolerance, indicating that plants with elevated levels of these compounds may have enhanced resilience to air pollution stressors. Additionally, a significant positive correlation was observed between the APTI and total chlorophyll (r = +0.42, p < 0.01), indicating that plants with higher APTI values tend to have a good total chlorophyll content. However, a negative significant correlation was observed between some parameters, for example, pH and dust deposition (−0.86, p < 0.01) (a negative correlation means the value of one parameter increases and the value of the other parameter tends to decrease, and vice versa). The matrix shows that there are no statistically significant relationships between some biochemical parameters. For example, although the relative water content shows a negative correlation with dust deposition (r = −0.35), these values are not statistically significant.
Figure 11 illustrates the relative contributions of four distinct factors, namely the species type, seasonal variation, dust deposition, and traffic intensity, by employing Spearman’s rank correlation method based on a year’s worth of data. It is evident that these factors exert varying degrees of influence on the air pollution tolerance index (APTI) for each species. For instance, in the case of Syzygium cumini, sensitivity is notably higher towards the species type and seasonal variation compared to dust deposition and traffic intensity. Conversely, for Mangifera indica and Saraca asoca, dust deposition contributes approximately 12 to 15%. Table 1 shows that during normal traffic hours, the APTI values are only a little improved. Notably, it is demonstrated that traffic intensity does not have much influence on the APTI relative to the other parameters.

4. Discussion

The impact of dust pollution on leaf permeability and pollination for the studied plant species—Mangifera indica (mango), Saraca asoca (ashoka), Cassia fistula (golden shower tree), and Syzygium cumini (black plum)—warrants closer examination. Dust accumulation on leaf surfaces can interfere with a plant’s ability to regulate water loss through transpiration [11,34]. This, in turn, may impact the photosynthetic efficiency and overall plant health, potentially reducing growth and vitality. This study establishes correlations between various parameters, including dust deposition and APTI, offering valuable insights into the physiological responses of plants to air pollution, facilitating the management method of particulate matter. One effective technique for dust control along well-paved roadsides is the strategic placement of water sprinkler systems combined with the planting of species exhibiting high to intermediate tolerance to dust accumulation. For instance, in an urban area with heavy traffic and dust pollution, installing water sprinklers along the roadside and planting species like Mangifera indica, which showed intermediate tolerance to dust accumulation in this study, could be particularly beneficial. These sprinkler systems could be programmed to periodically moisten the surrounding soil and vegetation, helping to settle dust particles and maintain a cleaner roadside environment. Regular pruning, trimming, and upkeep of existing vegetation along roadsides can prevent the accumulation of dust on plant surfaces. This maintenance not only enhances the aesthetic appeal of roadside vegetation but also improves its effectiveness in trapping dust particles. Cities like Singapore are known for their meticulous roadside vegetation management practices, including regular pruning and trimming to ensure optimal air flow and dust capture [35,36]. The application of dust binding solutions on roadside surfaces, such as bio-based products or polymer emulsions, can help reduce dust emissions [37,38]. These solutions work by binding dust particles together, preventing them from becoming airborne. For instance, in parts of Europe, municipalities utilize environmentally friendly dust-binding agents derived from natural polymers like lignin or cellulose to suppress dust on paved surfaces [39].
In addition to the direct effects of dust pollution on the studied plant species, meteorological conditions play a significant role in the dispersion and deposition of dust particles across the urban landscape. For example, strong winds can transport dust particles over long distances, leading to increased dust deposition on plants in parks, gardens, and other vegetated areas [25,29]. Moreover, rainfall can wash dust particles from one area to another, potentially introducing pollutants to sensitive plant species in previously unaffected locations. This indirect transfer of dust pollution can have far-reaching ecological consequences, affecting the health and growth of diverse plant species across urban environments. Solar radiation could impact the APTI through its effects on the total chlorophyll values and relative water content of plants. Increased exposure to solar radiation can stimulate chlorophyll production, enhancing a plant’s ability to photosynthesize and synthesize protective compounds against air pollutants [40,41,42]. Solar radiation contributes to the regulation of plant water balance, influencing the relative water content, which is crucial for maintaining physiological functions and resilience to environmental stressors, including air pollution.
This study provides a significant correlation between the APTI and biochemical parameters, such as the relative water content, ascorbic acid content, and dust deposition, which underscores the potential for deeper investigations into the physiological responses of trees to urban air pollution. Determining the variability in factors such as traffic density, pollution sources, and atmospheric conditions across urban environments is crucial when extrapolating findings. Moreover, location-specific studies are essential for a comprehensive understanding of trees’ tolerance to air pollution, and further research is required to explore the complex interplay between sources, the APTI, and environmental factors, guiding tailored urban forestry and pollution mitigation strategies. One limitation of this study is the limited spatial coverage, with only four sampling sites considered for each species despite analyzing 288 pool samples. Including more diverse sampling sites could provide a broader understanding of species distribution and environmental dynamics.

5. Conclusions

In this study, the impact of traffic-related dust pollution on roadside plants in an urban setting was investigated. Our findings reveal that Mangifera indica exhibited the highest dust accumulation and chlorophyll content, while Cassia fistula and Syzygium cumini showed lower dust deposition due to their smoother leaf surfaces. Dust deposition negatively impacts the chlorophyll content, relative water content, and pH of the leaf extract, affecting plant health and productivity. In addition, seasonal variation influences the pH levels, chlorophyll content, relative water content, and ascorbic acid levels, with generally higher values being observed during the rainy season. Plants such as Mangifera indica and Cassia fistula exhibited higher resistance to pollution, as indicated by their air pollution tolerance index (APTI), compared to more sensitive species like Syzygium cumini. Interestingly, traffic intensity had little effect on the APTI compared to other parameters. This study highlights the significant contributions of species type and seasonal variation on the APTI and underscores the importance of considering inherent plant characteristics and environmental fluctuations when assessing air pollution tolerance. Future studies should focus on the long-term monitoring of dust pollution and its effects on a broader range of plant species. Investigating the impacts of different road conditions, multiple sources, and microclimatic conditions, such as environmental stability and solar radiation, could offer insights into mitigating plant stress due to dust pollution. Moreover, exploring the potential of using roadside plants as bioindicators for assessing air quality could help inform urban planning and policy decisions for greener, healthier cities.

Supplementary Materials

The following supporting information can be downloaded at https://www.mdpi.com/article/10.3390/atmos15060659/s1, Table S1: Morphological characteristics of selected plant species; Table S2: Meteorological data of Canal Road, Lahore.

Author Contributions

Conceptualization, Z.A.; writing—original draft preparation, Z.A.; supervision and editing, Z.A.; revision and editing, W.M. All authors have read and agreed to the published version of the manuscript.

Funding

This study received no funding.

Institutional Review Board Statement

Not applicable.

Informed Consent Statement

Not applicable.

Data Availability Statement

The original contributions presented in the study are included in the article/Supplementary Material, further inquiries can be directed to the corresponding author/s.

Acknowledgments

The authors would like to thank all those who directly and indirectly participated in the improvement of this study.

Conflicts of Interest

The authors declare no conflicts of interest.

References

  1. Deshmukh, P.; Isakov, V.; Venkatram, A.; Yang, B.; Zhang, K.M.; Logan, R.; Baldauf, R. The effects of roadside vegetation characteristics on local, near-road air quality. Air Qual. Atmos. Health 2019, 12, 259–270. [Google Scholar] [CrossRef] [PubMed]
  2. Ferrini, F.; Fini, A.; Mori, J.; Gori, A. Role of vegetation as a mitigating factor in the urban context. Sustainability 2020, 12, 4247. [Google Scholar] [CrossRef]
  3. Wania, A.; Bruse, M.; Blond, N.; Weber, C. Analysing the influence of different street vegetation on traffic-induced particle dispersion using microscale simulations. J. Environ. Manag. 2012, 94, 91–101. [Google Scholar] [CrossRef] [PubMed]
  4. Manisalidis, I.; Stavropoulou, E.; Stavropoulos, A.; Bezirtzoglou, E. Environmental and Health Impacts of Air Pollution: A Review. Front. Public Health 2020, 8, 505570. [Google Scholar] [CrossRef] [PubMed]
  5. Zhang, K.; Batterman, S. Air pollution and health risks due to vehicle traffic. Sci. Total Environ. 2013, 450–451, 307–316. [Google Scholar] [CrossRef] [PubMed]
  6. Sahu, C.; Basti, S.; Sahu, S.K. Air pollution tolerance index (APTI) and expected performance index (EPI) of trees in sambalpur town of India. SN Appl. Sci. 2020, 2, 1327. [Google Scholar] [CrossRef]
  7. Matz, C.J.; Egyed, M.; Hocking, R.; Seenundun, S.; Charman, N.; Edmonds, N. Human health effects of traffic-related air pollution (TRAP): A scoping review protocol. Syst. Rev. 2019, 8, 223. [Google Scholar] [CrossRef] [PubMed]
  8. Perini, K.; Ottelé, M.; Giulini, S.; Magliocco, A.; Roccotiello, E. Quantification of fine dust deposition on different plant species in a vertical greening system. Ecol. Eng. 2017, 100, 268–276. [Google Scholar] [CrossRef]
  9. Zhu, J.; Xu, J.; Cao, Y.; Fu, J.; Li, B.; Sun, G.; Zhang, X.; Xu, C. Leaf reflectance and functional traits as environmental indicators of urban dust deposition. BMC Plant Biol. 2021, 21, 533. [Google Scholar] [CrossRef]
  10. Calfapietra, C. Nature-Based Solutions for Microclimate Regulation and Air Quality; EU Publications: Luxembourg, 2020; ISBN 9789276182054. [Google Scholar]
  11. Hamal, J.P.; Chettri, M.K. Air pollution tolerance index of some selected Gymnosperm species along the road side of Kathmandu Valley, Nepal. Ecoprint Int. J. Ecol. 2017, 24, 13–19. [Google Scholar] [CrossRef]
  12. IQAir World’s Most Polluted Cities 2020 (PM2.5). Available online: https://www.iqair.com/us/world-most-polluted-cities (accessed on 25 November 2021).
  13. Pakistan Today News Lahore Ranks Second among Top Five Most Polluted Cities in World: Report. Available online: https://www.pakistantoday.com.pk/2021/11/01/lahore-second-most-polluted-city-in-world-report/ (accessed on 25 April 2024).
  14. FAO. FAO Report Analyzes the Causes of Smog in Punjab Focusing on Agriculture. Available online: https://www.fao.org/pakistan/news/detail-events/en/c/1179183/ (accessed on 21 November 2021).
  15. Qureshi, Z. Pakistan: Lahore Ranked World’s Most Polluted City for 3rd Time During the Current Month. Available online: https://gulfnews.com/world/asia/pakistan/pakistan-lahore-ranked-worlds-most-polluted-city-for-3rd-time-during-the-current-month-1.83929010 (accessed on 24 November 2021).
  16. Alvi, M.U.; Chishtie, F.; Shahid, I.; Mahmud, T.; Hussain, R. Traffic- and Industry-Related Air Pollution Exposure Assessment in an Asian Megacity. Clean Soil Air Water 2018, 46, 1600773. [Google Scholar] [CrossRef]
  17. Otuyo, M.K.; Nadzir, M.S.M.; Latif, M.T.; Din, S.A.M. A review of personal exposure studies in selected Asian countries’ public transport microenvironments: Lessons learned and future directions. Environ. Sci. Pollut. Res. Int. 2023, 30, 121306–121337. [Google Scholar] [CrossRef] [PubMed]
  18. Meravi, N.; Singh, P.K.; Prajapati, S.K. Seasonal variation of dust deposition on plant leaves and its impact on various photochemical yields of plants. Environ. Chall. 2021, 4, 100166. [Google Scholar] [CrossRef]
  19. Kumar Rai, P.; Panda, L.L. Leaf dust deposition and its impact on Biochemical aspect of some Roadside Plants of Aizawl, Mizoram, North East India. Int. Res. J. Environ. Sci. Int. Sci. Congr. Assoc. 2014, 3, 14–19. [Google Scholar]
  20. Swoish, M.; Da Cunha Leme Filho, J.F.; Reiter, M.S.; Campbell, J.B.; Thomason, W.E. Comparing satellites and vegetation indices for cover crop biomass estimation. Comput. Electron. Agric. 2022, 196, 106900. [Google Scholar] [CrossRef]
  21. Nowak, D.J.; Crane, D.E.; Stevens, J.C. Air pollution removal by urban trees and shrubs in the United States. Urban For. Urban Green. 2006, 4, 115–123. [Google Scholar] [CrossRef]
  22. Janhäll, S. Review on urban vegetation and particle air pollution—Deposition and dispersion. Atmos. Environ. 2015, 105, 130–137. [Google Scholar] [CrossRef]
  23. Das, S.; Prasad, P. Seasonal variation in air pollution tolerance indices and selection of plant species for industrial areas of rourkela. Indian J. Environ. Prot. 2010, 30, 978–988. [Google Scholar]
  24. Li, Y.; Sha, Z.; Tang, A.; Goulding, K.; Liu, X. The application of machine learning to air pollution research: A bibliometric analysis. Ecotoxicol. Environ. Saf. 2023, 257, 114911. [Google Scholar] [CrossRef]
  25. Yadav, A.; Dixit, A.; Singh, D. Estimation of air pollution tolerance index of plants in selected locations in Kanpur City, India. Mater. Today Proc. 2023; in press. [Google Scholar] [CrossRef]
  26. Mardanisamani, S.; Eramian, M. Segmentation of vegetation and microplots in aerial agriculture images: A survey. Plant Phenome J. 2022, 5, e20042. [Google Scholar] [CrossRef]
  27. Yadav, R.; Pandey, P. Assessment of Air Pollution Tolerance Index (APTI) and Anticipated Performance Index (API) of Roadside Plants for the Development of Greenbelt in Urban Area of Bathinda City, Punjab, India. Bull. Environ. Contam. Toxicol. 2020, 105, 906–914. [Google Scholar] [CrossRef] [PubMed]
  28. Wu, F.; Xu, F.; Liu, W.; Chen, S.; Luo, H.; Cheng, N.; Zhao, H.; Cao, W. A High-Performance Liquid Chromatography with Electrochemical Detection Method Developed for the Sensitive Determination of Ascorbic Acid: Validation, Application, and Comparison with Titration, Spectrophotometric, and High-Performance Liquid Chromatograp. Foods 2023, 12, 3100. [Google Scholar] [CrossRef] [PubMed]
  29. Enitan, I.T.; Durowoju, O.S.; Edokpayi, J.N.; Odiyo, J.O. A Review of Air Pollution Mitigation Approach Using Air Pollution Tolerance Index (APTI) and Anticipated Performance Index (API). Atmosphere 2022, 13, 374. [Google Scholar] [CrossRef]
  30. Asif, Z.; Chen, Z. An integrated optimization and simulation approach for air pollution control under uncertainty in open-pit metal mine. Front. Environ. Sci. Eng. 2019, 13. [Google Scholar] [CrossRef]
  31. Bhattacharya, T.; Kriplani, L.; Sukalyan, C. Seasonal Variation in Air Pollution Tolerance Index of Various Plant Species of Baroda City. Univers. J. Environ. Res. Technol. 2013, 3, 199. [Google Scholar]
  32. Tak, A.A.; Kakde, U.B. Assessment of air pollution tolerance index of plants: A comparative study. Int. J. Pharm. Pharm. Sci. 2017, 9, 83–89. [Google Scholar] [CrossRef]
  33. Nayak, D.; Patel, D.P.; Thakare, H.S.; Satasiya, K.F.; Shrivastava, P. Assessment of Air Pollution Tolerance Index of Selected Plants. Indian For. 2015, 141, 372–378. [Google Scholar]
  34. Zahid, A.; Ali, S.; Anwar, W.; Fatima, A.; Chattha, M.B.; Ayub, A.; Raza, A.; Ali, K.; Siddique, M. Assessing the air pollution tolerance index (APTI) of trees in residential and roadside sites of Lahore, Pakistan. SN Appl. Sci. 2023, 5, 294. [Google Scholar] [CrossRef]
  35. Koh, M.; Lee, A. Strategies for Liveable and Sustainable Cities: The Singapore Experience. In The Palgrave Encyclopedia of Urban and Regional Futures; Springer: Berlin/Heidelberg, Germany, 2022; pp. 1–28. [Google Scholar]
  36. Lim, T.K.; Rajabifard, A.; Khoo, V.; Sabri, S.; Chen, Y. Chapter 3—The smart city in Singapore: How environmental and geospatial innovation lead to urban livability and environmental sustainability. In Smart Cities for Technological and Social Innovation; Kim, H.M., Sabri, S., Kent, A.B.T., Eds.; Academic Press: Cambridge, MA, USA, 2021; pp. 29–49. ISBN 978-0-12-818886-6. [Google Scholar]
  37. Tsogt, B.; Oh, S.Y. Preparations and application of dust suppressants from biomass-based materials. J. Air Waste Manag. Assoc. 2021, 71, 1386–1396. [Google Scholar] [CrossRef]
  38. Oh, S.Y.; Cha, S.W.; Lee, H. Biodegradable dust suppressants prepared from biomass-based materials: The role of viscosity and suppressed particles. J. Air Waste Manag. Assoc. 2024, 74, 253–260. [Google Scholar] [CrossRef]
  39. Chauhan, P.S.; Agrawal, R.; Satlewal, A.; Kumar, R.; Gupta, R.P.; Ramakumar, S.S.V. Next generation applications of lignin derived commodity products, their life cycle, techno-economics and societal analysis. Int. J. Biol. Macromol. 2022, 197, 179–200. [Google Scholar] [CrossRef] [PubMed]
  40. Ismail, A.H.; Dawi, E.A.; Almokdad, N.; Abdelkader, A.; Salem, O. Estimation and Comparison of the Clearness Index using Mathematical Models—Case study in the United Arab Emirates. Evergreen 2023, 10, 863–869. [Google Scholar] [CrossRef]
  41. Asif, Z.; Chen, Z.; Guo, J. A study of meteorological effects on PM 2.5 concentration in mining area. Atmos. Pollut. Res. 2018, 9, 688–696. [Google Scholar] [CrossRef]
  42. Ismail, A.A.K.H. Prediction of global solar radiation from sunrise duration using regression functions. Kuwait J. Sci. 2022, 49, 1–8. [Google Scholar] [CrossRef]
Figure 1. Proposed framework to estimate air pollution tolerance index using lab techniques and field data.
Atmosphere 15 00659 g001
Figure 2. Standard ascorbic acid curve for ascorbic acid concentration.
Atmosphere 15 00659 g002
Figure 3. Plant species. (a) Saraca asoca; (b) Mangifera indica; (c) Syzygium cumini; (d) Cassia fistula. (e) Sampling points of selected case study (source: Google Earth Pro).
Atmosphere 15 00659 g003
Figure 4. Average traffic of selected road per day (2020–2021).
Atmosphere 15 00659 g004
Figure 5. Box plot of dust deposition on selected plant species based on various seasons. (a) Winter (October–February); (b) summer (March–June); (c) monsoon season (July–September).
Atmosphere 15 00659 g005
Figure 6. Box plot illustrating seasonal leaf extract pH variation across different plant species. (a) Summer; (b) winter; (c) monsoon season.
Atmosphere 15 00659 g006
Figure 7. Box plot showing total chlorophyll values of selected species. (a) Summer; (b) winter; (c) monsoon season.
Atmosphere 15 00659 g007
Figure 8. Box plot of relative water content observed in different plant species. (a) Winter (b) summer; (c) monsoon season.
Atmosphere 15 00659 g008
Figure 9. Box plot showing experimental ascorbic acid content. (a) Summer; (b) monsoon season; (c) winter.
Atmosphere 15 00659 g009
Figure 10. Monte Carlo simulation of APTI. (a) Mangifera indica, (b) Saraca asoca, (c) Cassia fistula, and (d) Syzygium cumini. Note: SD = standard deviation; CV = coefficient of variation; SE = standard error.
Atmosphere 15 00659 g010
Figure 11. Percentage of contribution of various factors on APTI of different species using Spearman’s rank correlation method.
Atmosphere 15 00659 g011
Table 1. A comparison of the APTI values between different traffic hours and with the data in the literature.
SpeciesSeasonsDust Deposition in Current Study (mg/cm2)
(Mean ± SD)
APTI in Current Study (Mean ± SD)Literature Values *SourcesReferences
Peak Traffic Hours (8:00–10:00 am)Normal Traffic Hours (11:00 am–1:00 pm)
Mangifera indicaSummer 2.28 ± 0.8013 ± 0.713.4 ± 0.4516.21Samples from various places in a city (Baroda, India)[31]
Winter2.69 ± 1.412.51 ± 1.212.9 ± 0.812.7Roadside with heavy traffic in Mumbai, India[32]
Monsoon1.14 ± 0.5814.75 ± 0.414.5 ± 1.1
Saraca asocaSummer 1.46 ± 0.119.84 ±1.09.96 ± 1.410.77Around university campus, Gujrat, India[33]
Winter1.64 ± 0.269.51 ± 0.310.1 ± 0.238.45Roadside along orange line metro, Lahore, Pakistan[34]
Monsoon1.31 ± 0.479.91 ± 0.0710.7 ± 0.29
Cassia fistulaSummer 1.26 ± 0.3013.19 ± 0.413.7 ± 0.611.7Roadside with heavy traffic in Mumbai, India[32]
Winter1.47 ± 0.629.63 ± 1.29.9 ± 0.7214.34Around university campus, Gujrat, India[33]
Monsoon0.82 ± 0.3713.82 ± 0.0614.1 ± 0.56
Syzygium cuminiSummer 0.954 ± 0.159.73 ± 0.0610.49 ± 1.0910.87Around university campus, Gujrat, India [33]
Winter1.26 ± 0.309.39 ± 0.099.87 ± 0.07
Monsoon0.59 ± 0.3410.18 ± 0.510.68 ± 1.30
* Average values are reported based on yearly data based on different sources.
Table 2. Correlation matrix among APTI and biochemical parameters.
ParametersTotal ChlorophyllPHRelative Water ContentAscorbic AcidAPTIDust Deposition
Total chlorophyll10.39 **0.23 (ns)0.095 (ns)0.42 **−0.404 **
pH (leaf extract) 1−0.078 *0.156 **0.169 **−0.59 **
Relative water content 1−0.51 **0.82 *−0.35 (ns)
Ascorbic acid 10.92 **0.29 (ns)
APTI 1−0.86 *
Dust deposition 1
** Correlation is significant at p-value < 0.01. * Correlation is significant at p < 0.05 level; ns represents non-significant values.
Disclaimer/Publisher’s Note: The statements, opinions and data contained in all publications are solely those of the individual author(s) and contributor(s) and not of MDPI and/or the editor(s). MDPI and/or the editor(s) disclaim responsibility for any injury to people or property resulting from any ideas, methods, instructions or products referred to in the content.

