
Variation in Soil CO2 Fluxes across Land Cover Mosaic in Typical Tundra of the Taimyr Peninsula, Siberia

 ,
,  ,
,  ,
,  ,
,
Abstract
:1. Introduction
2. Materials and Methods
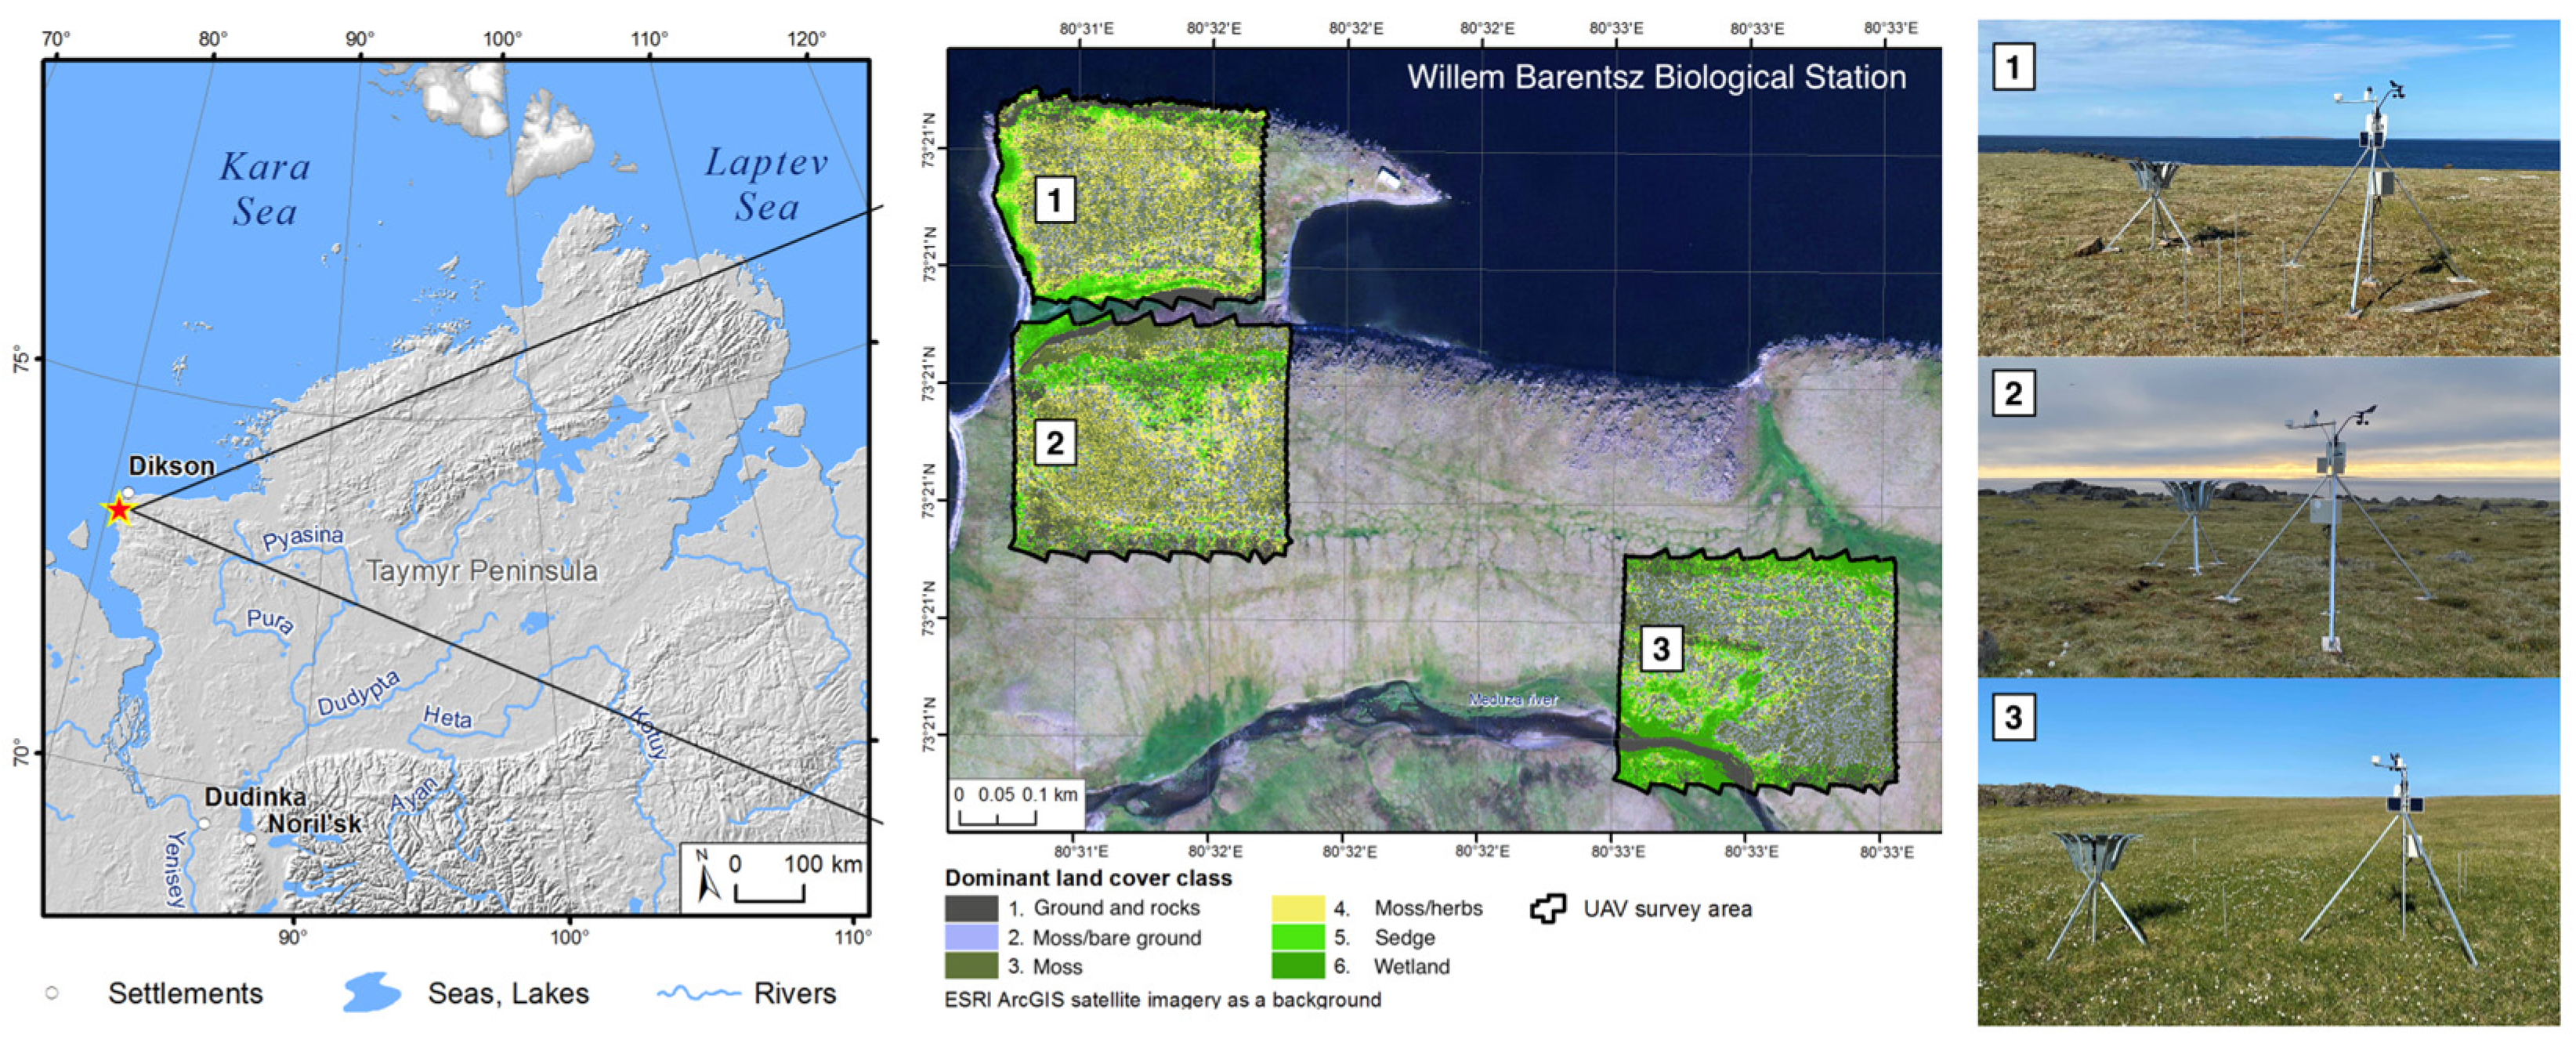
2.1. Study Area
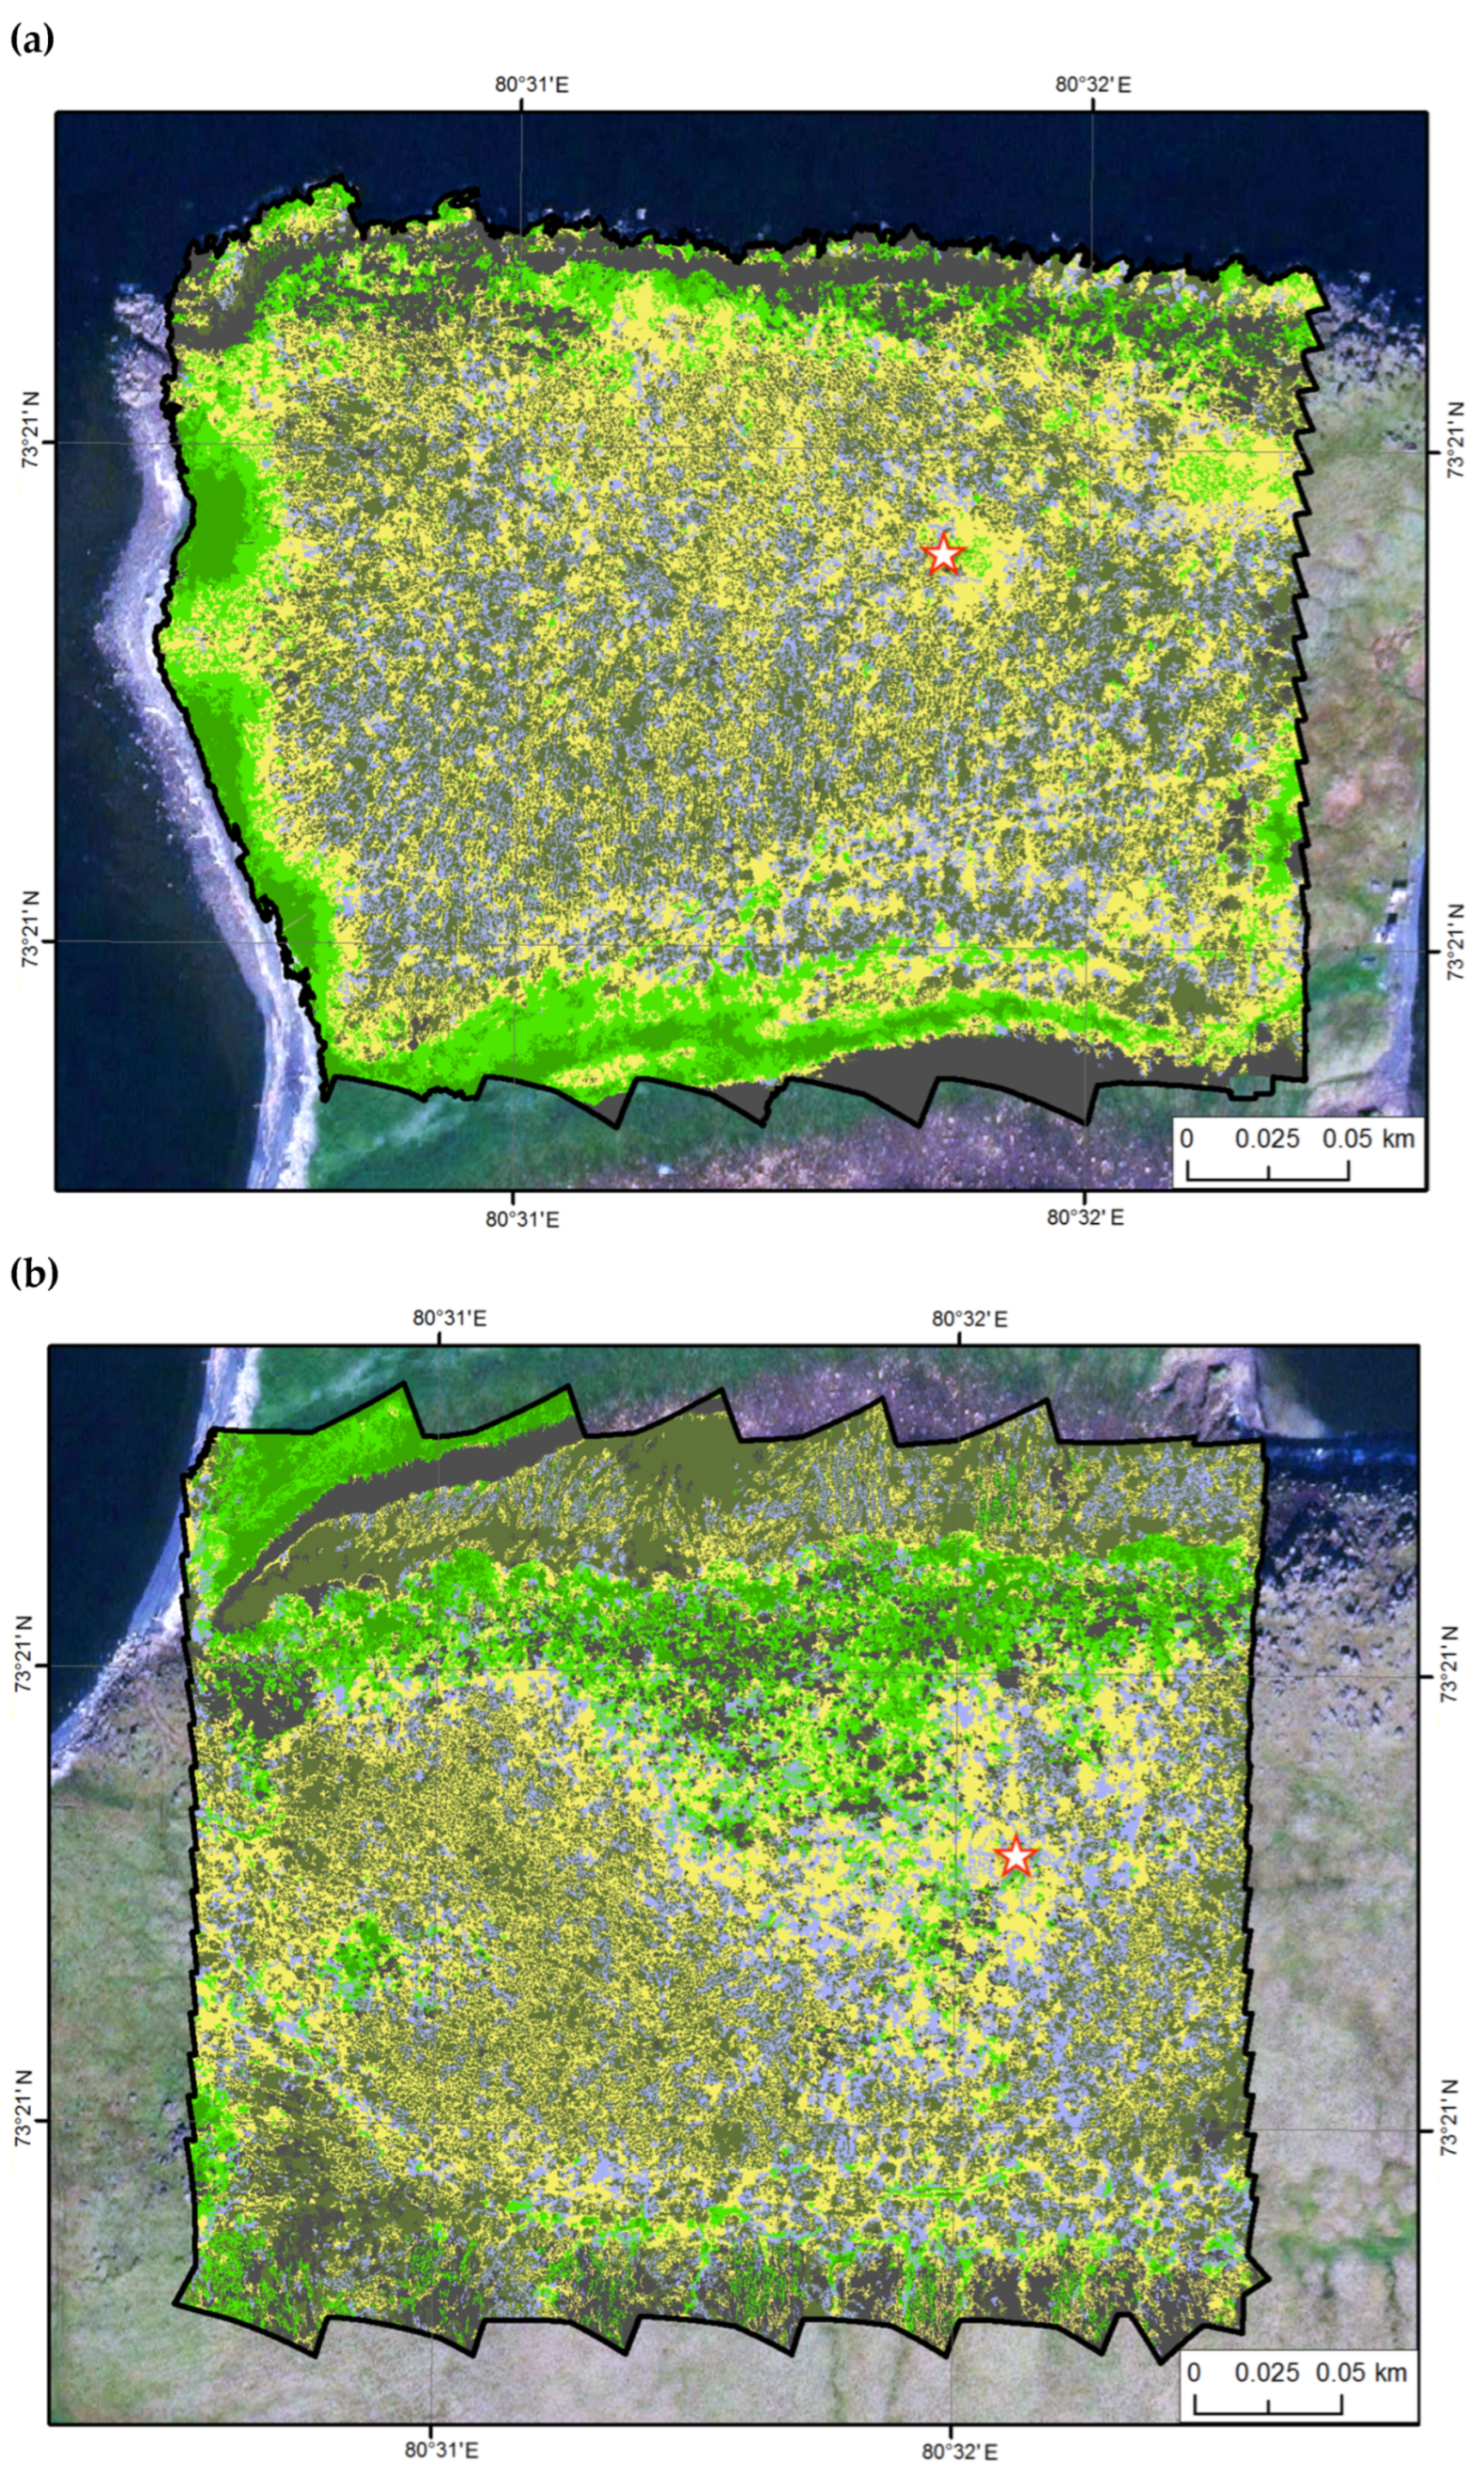
2.2. Research Plots
2.3. Experimental Design and Methods
3. Results and Discussion
3.1. Soil CO2 Flux Rates across Typical Tundra
3.2. Soil CO2 Fluxes and Soil Temperature Relationships: Simulating the Seasonal Patterns
3.3. Soil CO2 Fluxes and Precipitation: Simulating Immediate and Seasonal Patterns
4. Conclusions
Author Contributions
Funding
Institutional Review Board Statement
Informed Consent Statement
Data Availability Statement
Acknowledgments
Conflicts of Interest
References
- IPCC: The Ocean and Cryosphere in a Changing Climate. Available online: https://www.ipcc.ch/srocc/home (accessed on 20 February 2024).
- Arctic Report Card: Update for 2020. Available online: https://arctic.noaa.gov/Report-Card/Report-Card-2020 (accessed on 20 February 2024).
- Coates, K.S.; Holroyd, C. The Palgrave Handbook of Arctic Policy and Politics; Palgrave Macmillan: Cham, Switzerland, 2020; p. 555. [Google Scholar]
- Overland, J.E.; Hanna, E.; Hanssen-Bauer, I.; Kim, S.-J.; Walsh, J.E.; Wang, M.; Bhatt, U.S.; Thoman, R.L.; Ballinger, T.J. Surface air temperature. In Arctic Report Card 2019; Richter-Menge, J., Druckenmiller, M.L., Jeffries, M., Eds.; NOAA: Silver Spring, MD, USA, 2019. Available online: https://www.arctic.noaa.gov/Report-Card (accessed on 20 February 2024).
- Magnani, M.; Baneschi, I.; Giamberini, M.; Raco, B.; Provenzale, A. Microscale drivers of summer CO2 fluxes in the Svalbard High Arctic tundra. Sci. Rep. 2022, 12, 763. [Google Scholar] [CrossRef]
- Schuur, E.A.G.; McGuire, A.D.; Schadel, C.; Grosse, G.; Harden, J.W.; Hayes, D.J.; Hugelius, G.; Koven, C.D.; Kuhry, P.; Lawrence, D.M.; et al. Climate change and the permafrost carbon feedback. Nature 2015, 520, 171–179. [Google Scholar] [CrossRef] [PubMed]
- Strauss, J.; Schirrmeister, L.; Grosse, G.; Fortier, D.; Hugelius, G.; Knoblauch, C.; Romanovsky, V.E.; Schädel, C.; Schneider von Deimling, T.; Schuur, E.A.G.; et al. Deep Yedoma permafrost: A synthesis of depositional characteristics and carbon vulnerability. Earth-Sci. Rev. 2017, 172, 75–86. [Google Scholar] [CrossRef]
- Jeong, S.J.; Bloom, A.A.; Schimel, D.; Sweeney, C.; Parazoo, N.C.; Medvigy, D.; Schaepman-Strub, G.; Zheng, C.; Schwalm, C.R.; Huntzinger, D.N.; et al. Accelerating rates of Arctic carbon cycling revealed by long-term atmospheric CO2 measurements. Sci. Adv. 2018, 4, eaao1167. [Google Scholar] [CrossRef] [PubMed]
- Feng, J.; Wang, C.; Lei, J.; Yang, Y.; Yan, Q.; Zhou, X.; Tao, X.; Ning, D.; Yuan, M.M.; Qin, Y.; et al. Warming-induced permafrost thaw exacerbates tundra soil carbon decomposition mediated by microbial community. Microbiome 2020, 8, 3. [Google Scholar] [CrossRef]
- Kusch, S.; Rethemeyer, J.; Ransby, D.; Mollenhauer, G. Permafrost organic carbon turnover and export into a High-Arctic fjord: A case study from Svalbard using compound-specific 14C analysis. J. Geophys. Res. Biogeosci. 2021, 126, e2020JG006008. [Google Scholar] [CrossRef]
- Mudryk, L.; Brown, R.; Derksen, C.; Luojus, K.; Decharme, B.; Helfrich, S. Terrestrial snow cover. In Arctic Report Card 2019; Richter-Menge, J., Druckenmiller, M.L., Jeffries, M., Eds.; NOAA: Silver Spring, MD, USA, 2019. Available online: https://www.arctic.noaa.gov/Report-Card (accessed on 20 February 2024).
- Mernild, S.H.; Malmros, J.K.; Yde, J.C.; Knudsen, N.T. Multi-decadal marine- and land-terminating glacier recession in the Ammassalik region, southeast Greenland. Cryosphere 2012, 6, 625–639. [Google Scholar] [CrossRef]
- Overeem, I.; Syvitski, J.P.M. Shifting discharge peaks in arctic rivers, 1977–2007. Geogr. Ann. Ser. A Phys. Geogr. 2010, 92, 285–296. [Google Scholar] [CrossRef]
- Berner, L.T.; Massey, R.; Jantz, P.; Forbes, B.C.; Macias-Fauria, M.; Myers-Smith, I.; Kumpula, T.; Gauthier, G.; Andreu-Hayles, L.; Gaglioti, B.V.; et al. Summer warming explains widespread but not uniform greening in the Arctic tundra biome. Nat. Commun. 2020, 11, 4621. [Google Scholar] [CrossRef]
- Hudson, J.M.G.; Henry, G.H.R.; Cornwell, W.K. Taller and larger: Shifts in Arctic tundra leaf traits after 16 years of experimental warming. Glob. Change Biol. 2011, 17, 1013–1021. [Google Scholar] [CrossRef]
- Leffler, A.J.; Klein, E.S.; Oberbauer, S.F.; Welker, J.M. Coupled long-term summer warming and deeper snow alters species composition and stimulates gross primary productivity in tussock tundra. Oecologia 2016, 181, 287–297. [Google Scholar] [CrossRef] [PubMed]
- Abbott, B.W.; Jones, J.B.; Schuur, E.A.G.; Chapin, F.S., III; Bowden, W.B.; Bret-Harte, M.S.; Epstein, H.E.; Flannigan, M.D.; Harms, T.K.; Hollingsworth, T.N.; et al. Biomass offsets little or none of permafrost carbon release from soils, streams, and wildfire: An expert assessment. Environ. Res. Lett. 2016, 11, 034014. [Google Scholar] [CrossRef]
- Andresen, C.G.; Lougheed, V.L. Arctic aquatic graminoid tundra responses to nutrient availability. Biogeosciences 2021, 18, 2649–2662. [Google Scholar] [CrossRef]
- Schuur, T. Permafrost and the global carbon cycle. In Arctic Report Card 2019; Richter-Menge, J., Druckenmiller, M.L., Jeffries, M., Eds.; NOAA: Silver Spring, MD, USA, 2019. Available online: https://www.arctic.noaa.gov/Report-Card (accessed on 20 February 2024).
- Lund, M.; Falk, J.M.; Friborg, T.; Mbufong, H.N.; Sigsgaard, C.; Søgaard, H.; Tamstorf, M.P. Trends in CO2 exchange in a high Arctic tundra heath, 2000–2010. J. Geophys. Res. 2012, 117, G02001. [Google Scholar] [CrossRef]
- Hickman, J. Carbon sinks and sinking tundra. Nat. Geosci. 2014, 7, 784. [Google Scholar] [CrossRef]
- Euskirchen, E.S.; Bret-Harte, M.S.; Shaver, G.R.; Edgar, C.W.; Romanovsky, V.E. Long-term release of carbon dioxide from Arctic tundra ecosystems in Alaska. Ecosystems 2017, 20, 960–974. [Google Scholar] [CrossRef]
- Commane, R.; Lindaas, J.; Benmergui, J.; Luus, K.A.; Chang, R.Y.-W.; Daube, B.C.; Euskirchen, E.S.; Henderson, J.M.; Karion, A.; Miller, J.B.; et al. Carbon dioxide sources from Alaska driven by increasing early winter respiration from Arctic tundra. Proc. Natl. Acad. Sci. USA 2017, 114, 5361–5366. [Google Scholar] [CrossRef] [PubMed]
- Lüers, J.; Westermann, S.; Piel, K.; Boike, J. Annual CO2 budget and seasonal CO2 exchange signals at a high Arctic permafrost site on Spitsbergen, Svalbard archipelago. Biosciences 2014, 16, 6307–6322. [Google Scholar] [CrossRef]
- Euskirchen, E.S.; Bret-Harte, M.S.; Scott, G.J.; Edgar, C.; Shaver, G.R. Seasonal patterns of carbon dioxide and water fluxes in three representative tundra ecosystems in northern Alaska. Ecosphere 2012, 3, 1–19. [Google Scholar] [CrossRef]
- Belshe, E.F.; Schuur, E.A.; Bolker, B.M. Tundra ecosystems observed to be CO2 sources due to differential amplification of the carbon cycle. Ecol. Lett. 2013, 16, 1307–1315. [Google Scholar] [CrossRef]
- Virkkala, A.-M.; Virtanen, T.; Lehtonen, A.; Rinne, J.; Luoto, M. The current state of CO2 flux chamber studies in the Arctic tundra: A review. Prog. Phys. Geog. 2018, 42, 162–184. [Google Scholar] [CrossRef]
- Fletcher, B.J.; Gornall, J.L.; Poyatos, R.; Press, M.C.; Stoy, P.C.; Huntley, B.; Baxter, R.; Phoenix, G.K. Photosynthesis and productivity in heterogeneous arctic tundra: Consequences for ecosystem function of mixing vegetation types at stand edges. J. Ecol. 2012, 100, 441–451. [Google Scholar] [CrossRef]
- Virtanen, T.; Ek, M. The fragmented nature of tundra landscape. Int. J. Appl. Earth Obs. Geoinf. 2014, 27, 4–12. [Google Scholar] [CrossRef]
- Aalto, J.; le Roux, P.C.; Luoto, M. Vegetation mediates soil temperature and moisture in Arctic-Alpine environments. AAAR 2013, 45, 429–439. Available online: http://www.jstor.org/stable/24551600 (accessed on 4 March 2024). [CrossRef]
- Post, E.; Forchhammer, M.C.; Bret-Harte, M.S.; Callaghan, T.V.; Christensen, T.R.; Elberling, B.; Fox, A.D.; Gilg, O.; Hik, D.S.; Høye, T.T.; et al. Ecological dynamics across the Arctic associated with recent climate change. Science 2009, 325, 1355–1358. [Google Scholar] [CrossRef] [PubMed]
- Virkkala, A.-M.; Natali, S.M.; Rogers, B.M.; Watts, J.D.; Savage, K.; Connon, S.J.; Mauritz, M.; Schuur, E.A.G.; Peter, D.; Minions, C.; et al. The ABCflux database: Arctic–boreal CO2 flux observations and ancillary information aggregated to monthly time steps across terrestrial ecosystems. Earth Syst. Sci. Data 2022, 14, 179–208. [Google Scholar] [CrossRef]
- Sachs, T.; Giebels, M.; Boike, J.; Kutzbach, L. Environmental controls on CH4 emission from polygonal tundra on the microsite scale in the Lena River delta, Siberia. Glob. Change Biol. 2010, 16, 3096–3110. [Google Scholar] [CrossRef]
- Göckede, M.; Kwon, M.J.; Kittler, F.; Heimann, M.; Zimov, N.; Zimov, S. Negative feedback processes following drainage slow down permafrost degradation. Glob. Change Biol. 2019, 25, 3254–3266. [Google Scholar] [CrossRef] [PubMed]
- Juutinen, S.; Aurela, M.; Tuovinen, J.-P.; Ivakhov, V.; Linkosalmi, M.; Rasanen, A.; Virtanen, T.; Mikola, J.; Nyman, J.; Vaha, E.; et al. Variation in CO2 and CH4 fluxes among land cover types in heterogeneous Arctic tundra in northeastern Siberia. Biogeosciences 2022, 19, 3151–3167. [Google Scholar] [CrossRef]
- Panov, A.; Prokushkin, A.; Kübler, K.R.; Korets, M.; Urban, A.; Bondar, M.; Heimann, M. Continuous CO2 and CH4 observations in the coastal arctic atmosphere of the western Taimyr peninsula, Siberia: The first results from a new measurement station in Dikson. Atmosphere 2021, 12, 876. [Google Scholar] [CrossRef]
- Panov, A.; Prokushkin, A.; Semiletov, I.; Kübler, K.; Korets, M.; Putilin, I.; Urban, A.; Bondar, M.; Heimann, M. Atmospheric CO2 and CH4 fluctuations over the continent-sea interface in the Yenisei River sector of the Kara Sea. Atmosphere 2022, 13, 1402. [Google Scholar] [CrossRef]
- Tulp, I.; Bruinzeel, L.; Jukema, J.; Stepanova, O. Breeding waders at Medusa Bay, Western Taimyr, in 1996. In WIWO Report 57; WIWO: Zeist, The Netherlands, 1997; Volume 57, pp. 7–8. [Google Scholar]
- McKnight, T.L.; Hess, D. Climate Zones and Types: The Köppen System, Physical Geography: A Landscape Appreciation; Prentice Hall: Hoboken, NJ, USA, 2000; pp. 235–237. [Google Scholar]
- Walker, D.A.; Raynolds, M.K.; Daniëls, F.J.A.; Einarsson, E.; Elvebakk, A.; Gould, W.A.; Katenin, A.E.; Kholod, S.S.; Markon, C.J.; Melnikov, E.S.; et al. The Circumpolar Arctic vegetation map. J. Veg. Sci. 2005, 16, 267–282. [Google Scholar] [CrossRef]
- Jenkins, G. A comparison between two types of widely used weather stations. Weather 2014, 69, 105–110. [Google Scholar] [CrossRef]
- Schimel, J.; Mikan, C. Changing microbial substrate use in Arctic tundra soils through a freeze-thaw cycle. Soil Biol. Biochem. 2005, 37, 1411–1418. [Google Scholar] [CrossRef]
- Meyer, N.; Welp, G.; Amelung, W. The temperature sensitivity (Q10) of soil respiration: Controlling factors and spatial prediction at regional scale based on environmental soil classes. Glob. Biogeochem. Cycles 2018, 32, 306–323. [Google Scholar] [CrossRef]
- Zamolodchikov, D.G.; Karelin, D.V.; Ivaschenko, A.I.; Oechel, W.C.; Hastings, S.J. CO2 flux measurements in Russian Far East tundra using eddy covariance and closed chamber techniques. Tellus B Chem. Phys. Meteorol. 2003, 55, 879–892. [Google Scholar] [CrossRef]
- Elberling, B. Annual soil CO2 effluxes in the High Arctic: The role of snow thickness and vegetation type. Soil Biol. Biochem. 2007, 39, 646–654. [Google Scholar] [CrossRef]
- Cannone, N.; Ponti, S.; Christiansen, H.; Christensen, T.R.; Pirk, N.; Guglielmin, M. Effects of active layer seasonal dynamics and plant phenology on CO2 land-atmosphere fluxes at polygonal tundra in the High Arctic, Svalbard. Catena 2019, 174, 142–153. [Google Scholar] [CrossRef]
- Seppälä, O. Spatial and Temporal Drivers of Soil Respiration in a Tundra Environment. Master’s Thesis, University of Helsinki, Helsinki, Finland, 2020. Available online: http://hdl.handle.net/10138/313261 (accessed on 4 March 2024).
- Bradley-Cook, J.I.; Virginia, R.A. Landscape variation in soil carbon stocks and respiration in an Arctic tundra ecosystem, west Greenland. AAAR. 2018, 50, S100024. [Google Scholar] [CrossRef]
- Wagner, J.; Hung, J.; Neil, A.; Scott, N. Net greenhouse gas fluxes from three High Arctic plant communities along a moisture gradient. Arct. Sci. 2019, 5, 185–201. [Google Scholar] [CrossRef]
- Watts, J.; Natali, S.; Minions, C.; Risk, D.; Arndt, K.; Zona, D.; Euskirchen, E.; Rocha, A.; Sonnentag, O.; Helbig, M.; et al. Soil respiration strongly offsets carbon uptake in Alaska and Northwest Canada. Environ. Res. Lett. 2021, 16, 084051. [Google Scholar] [CrossRef]
- Virkkala, A.-M.; Niittynen, P.; Kemppinen, J.; Marushchak, M.; Voigt, C.; Hensgens, G.; Kerttula, J.; Happonen, K.; Tyystjärvi, V.; Biasi, C.; et al. High-resolution spatial patterns and drivers of terrestrial ecosystem carbon dioxide, methane, and nitrous oxide fluxes in the tundra. Biogeosciences 2024, 21, 335–355. [Google Scholar] [CrossRef]
- Heitman, J.L.; Horton, R. Coupled heat and water transfer in soil. In Encyclopedia of Agrophysics; Gliński, J., Horabik, J., Lipiec, J., Eds.; Encyclopedia of Earth Sciences Series; Springer: Dordrecht, The Netherlands, 2011. [Google Scholar] [CrossRef]
- Wickland, K.; Jorgenson, M.; Koch, J.; Kanevskiy, M.; Striegl, R. Carbon dioxide and methane flux in a dynamic Arctic tundra landscape: Decadal-scale impacts of ice wedge degradation and stabilization. Geophys. Res. Lett. 2020, 47, e2020GL089894. [Google Scholar] [CrossRef]
- Johnston, A.S.A.; Sibly, R.M. The influence of soil communities on the temperature sensitivity of soil respiration. Nat. Ecol. Evol. 2018, 2, 1597–1602. [Google Scholar] [CrossRef]
- Zona, D.; Lipson, D.; Paw, U.K.T.; Oberbauer, S.; Olivas, P.; Gioli, B.; Oechel, W. Increased CO2 loss from vegetated drained lake tundra ecosystems due to flooding. Glob. Biogeochem. Cycles 2012, 26, GB2004. [Google Scholar] [CrossRef]
- Hashemi, J.; Zona, D.; Arndt, K.; Kalhori, A.; Oechel, W. Seasonality buffers carbon budget variability across heterogeneous landscapes in Alaskan Arctic Tundra. Environ. Res. Lett. 2021, 16, 035008. [Google Scholar] [CrossRef]
- Arndt, K.; Lipson, D.; Hashemi, J.; Oechel, W.; Zona, D. Snow melt stimulates ecosystem respiration in Arctic ecosystems. Glob. Change Biol. 2020, 26, 5042–5051. [Google Scholar] [CrossRef] [PubMed]
- Watanabe, T.; Matsuoka, N.; Christiansen, H.H.; Cable, S. Soil physical and environmental conditions controlling patterned-ground variability in a continuous permafrost site, Svalbard. Permafr. Periglac. Process. 2017, 28, 433–445. [Google Scholar] [CrossRef]
- Natali, S.M.; Watts, J.D.; Rogers, B.M.; Potter, S.; Ludwig, S.M.; Selbmann, A.K.; Sullivan, P.F.; Abbott, B.W.; Arndt, K.A.; Birch, L.; et al. Large loss of CO2 in winter observed across the northern permafrost region. Nat. Clim. Change 2019, 9, 852–857. [Google Scholar] [CrossRef]
- Singh, S.; Mayes, M.A.; Kivlin, S.N.; Jagadamma, S. How the Birch effect differs in mechanisms and magnitudes due to soil texture. Soil Biol. Biochem. 2023, 179, 108973. [Google Scholar] [CrossRef]
- McCrystall, M.R.; Stroeve, J.; Serreze, M.; Forbes, B.C.; Screen, J.A. New climate models reveal faster and larger increases in Arctic precipitation than previously projected. Nat. Commun. 2021, 12, 6765. [Google Scholar] [CrossRef] [PubMed]
- Makhnykina, A.; Vaganov, E.A.; Panov, A.; Koshurnikova, N.; Prokushkin, A. The pulses of soil CO2 emission in response to rainfall events in Central Siberia: Revisiting the overall frost-free season CO2 flux. Forests 2024, 15, 355. [Google Scholar] [CrossRef]
- Neumann, R.; Moorberg, C.; Lundquist, J.; Turner, J.; Waldrop, M.; McFarland, J.; Euskirchen, E.; Edgar, C.; Turetsky, M. Warming efects of spring rainfall increase methane emissions from thawing permafrost. Geophys. Res. Lett. 2019, 46, 1393–1401. [Google Scholar] [CrossRef]
- Frost, G.; Epstein, H.; Walker, D.; Matyshak, G.; Ermokhina, K. Patterned-ground facilitates shrub expansion in Low Arctic tundra. Environ. Res. Lett. 2013, 8, 015035. [Google Scholar] [CrossRef]


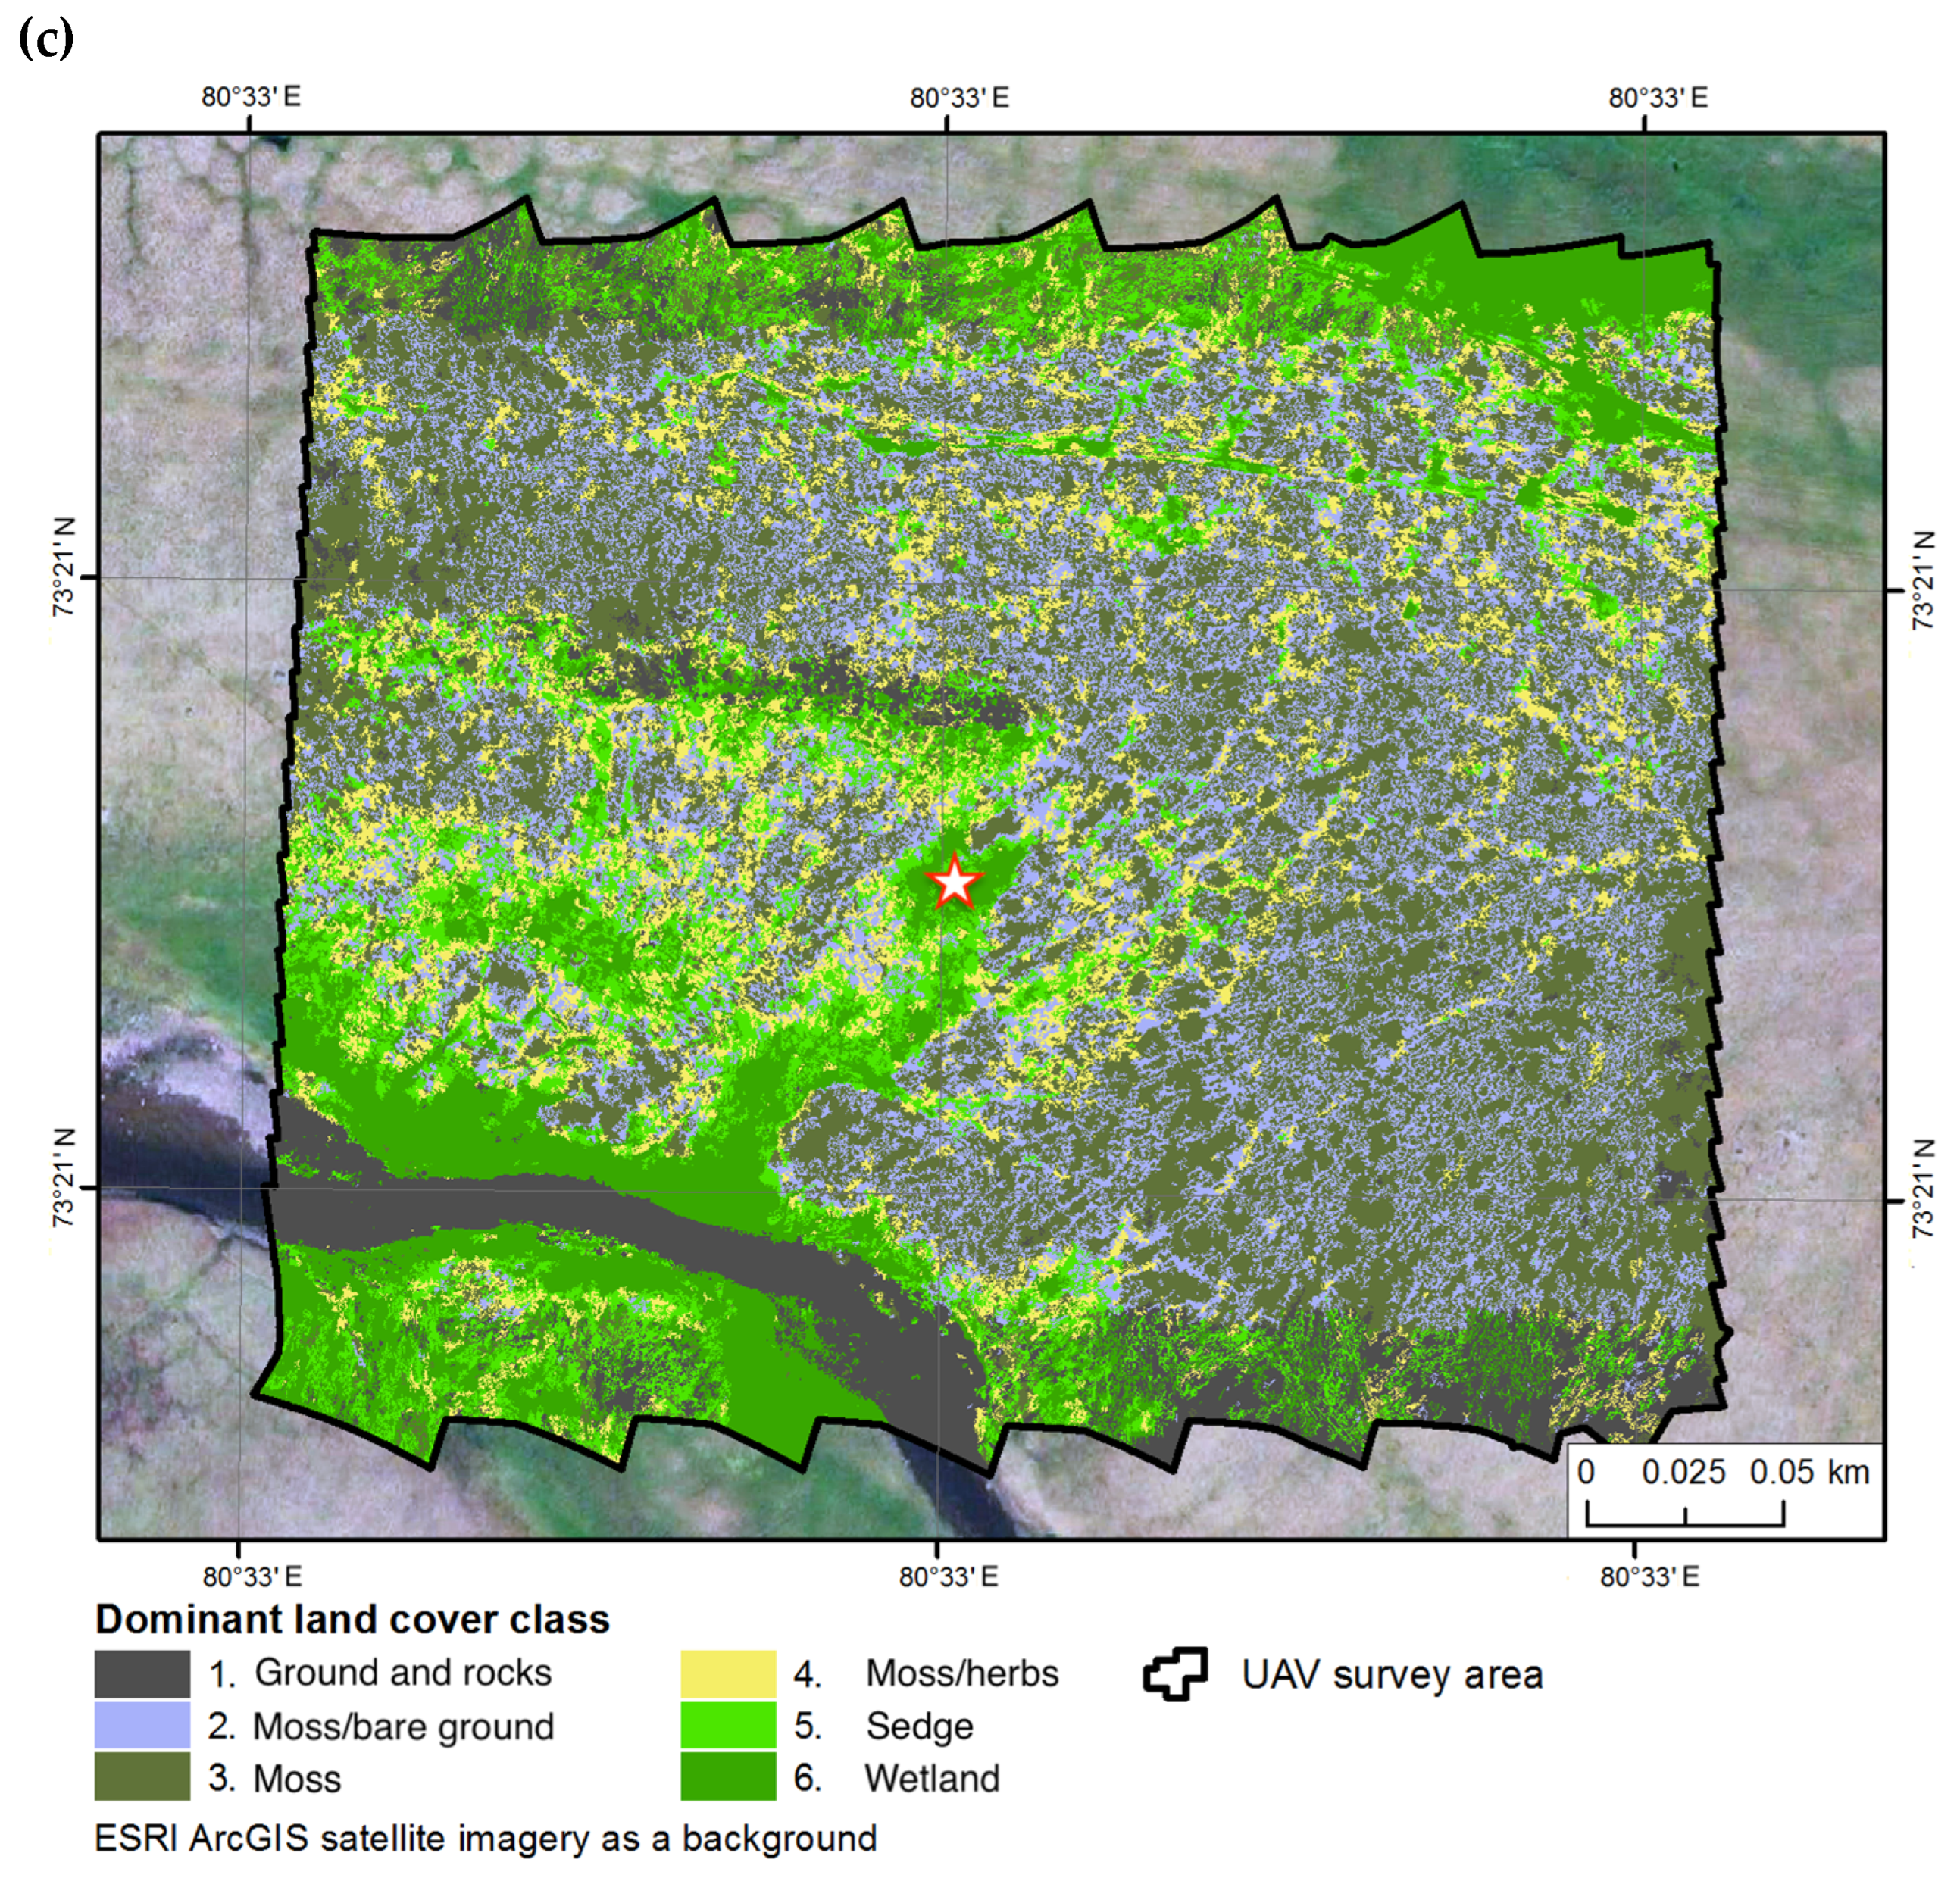
| Site 1 | Site 2 | Site 3 | ||||
|---|---|---|---|---|---|---|
| Land Cover Class | Area, m2 | % | Area, m2 | % | Area, m2 | % |
| 1. Ground and rocks | 8165 | 9.1 | 12,332 | 11.0 | 9990 | 9.0 |
| 2. Moss/Bare ground | 11,342 | 12.6 | 15,706 | 14.1 | 22,860 | 20.6 |
| 3. Moss | 28,147 | 31.2 | 37,052 | 33.2 | 39,241 | 35.3 |
| 4. Moss/Herbs | 28,614 | 31.8 | 29,284 | 26.2 | 11,938 | 10.8 |
| 5. Sedge | 9986 | 11.1 | 11,867 | 10.6 | 12,419 | 11.2 |
| 6. Wetland | 3836 | 4.3 | 5372 | 4.8 | 14,601 | 13.1 |
| 90,090 | 100 | 111,614 | 100 | 111,049 | 100 | |
Disclaimer/Publisher’s Note: The statements, opinions and data contained in all publications are solely those of the individual author(s) and contributor(s) and not of MDPI and/or the editor(s). MDPI and/or the editor(s) disclaim responsibility for any injury to people or property resulting from any ideas, methods, instructions or products referred to in the content. |
© 2024 by the authors. Licensee MDPI, Basel, Switzerland. This article is an open access article distributed under the terms and conditions of the Creative Commons Attribution (CC BY) license (https://creativecommons.org/licenses/by/4.0/).
Share and Cite
Panov, A.; Prokushkin, A.; Korets, M.; Putilin, I.; Zrazhevskaya, G.; Kolosov, R.; Bondar, M. Variation in Soil CO2 Fluxes across Land Cover Mosaic in Typical Tundra of the Taimyr Peninsula, Siberia. Atmosphere 2024, 15, 698. https://doi.org/10.3390/atmos15060698
Panov A, Prokushkin A, Korets M, Putilin I, Zrazhevskaya G, Kolosov R, Bondar M. Variation in Soil CO2 Fluxes across Land Cover Mosaic in Typical Tundra of the Taimyr Peninsula, Siberia. Atmosphere. 2024; 15(6):698. https://doi.org/10.3390/atmos15060698
Chicago/Turabian StylePanov, Alexey, Anatoly Prokushkin, Mikhail Korets, Ilya Putilin, Galina Zrazhevskaya, Roman Kolosov, and Mikhail Bondar. 2024. "Variation in Soil CO2 Fluxes across Land Cover Mosaic in Typical Tundra of the Taimyr Peninsula, Siberia" Atmosphere 15, no. 6: 698. https://doi.org/10.3390/atmos15060698
APA StylePanov, A., Prokushkin, A., Korets, M., Putilin, I., Zrazhevskaya, G., Kolosov, R., & Bondar, M. (2024). Variation in Soil CO2 Fluxes across Land Cover Mosaic in Typical Tundra of the Taimyr Peninsula, Siberia. Atmosphere, 15(6), 698. https://doi.org/10.3390/atmos15060698