Abstract
Bioaerosols are a potential risk of infection in densely populated indoor sites at university campuses. In this study, indoor bioaerosols from the canteen, classroom, and dormitory on campus were sampled and analyzed in the summer of 2021 to investigate the harmful risk. The results showed that bacteria are the predominant microbes, and the total number of bacteria detected in the classroom during no lesson in the morning (33% of samples) and in the canteen during meal times (55% of samples) was greater than the World Health Organization’s recommended value (1000 CFU/m3). The ranges of respirable bioaerosol (<3.3 µm) contributions in the classroom, dormitory, and canteen were 50–75%, 57–70%, and 64–80%, respectively. Bacteroidetes and Firmicutes were the most dominant phyla in all three indoor environments, with a relative abundance of both above 20%. At the family level, Muribaculaceae, Lachnospiraceae, and Bacteroidaceae had high relative abundance in all indoor sites. Some of the microbes carried by bioaerosols were conditionally pathogenic bacteria, such as Micrococcaceae and Enterococcaceae, which may have a harmful risk of causing various inflammatory infections. The results of this study provide basic data to improve indoor environments and control indoor bioaerosol pollution on campus.
1. Introduction
Since the coronavirus pandemic that struck the world in 2020, bioaerosols, one of the most important indicators of indoor air quality (IAQ), have received increasing attention for their impact on human health. Indoor bioaerosols are generally defined as aerosols which originate from organisms and are suspended in indoor air or grow in the indoor environment [1], such as bacteria, viruses, fungi, pollens, and their fragments and products [2]. In general, indoor bioaerosols come from the emission of moldy materials, human activities, and indoor and outdoor air exchange, and their particle sizes are in the range of 0.3–100 μm, and, bioaerosols with particle sizes of 1–10 μm have a greater impact on human health due to their strong retention ability in the air [3,4,5].
Indoors provide a suitable environment for the growth and propagation of bioaerosols, e.g., low airflow rates, appropriate humidity, and temperature, and many studies comparing indoor and outdoor bioaerosols have found that indoor bioaerosol concentrations are significantly higher than those of indoor bioaerosols [6,7,8]. Several studies have shown that the concentration of bioaerosols significantly affects human health and that exposure to indoor environments with high concentrations of bioaerosols not only reduces a person’s productivity at work and school, but also increases the risk of infections, respiratory sensitization, toxic effects, and cancers in the population, especially in children and the elderly [9,10,11,12,13]. Therefore, it is necessary to monitor and control indoor bioaerosols from an occupational and public safety point of view, since humans spend nearly 80–90% of their time in indoor places such as classrooms, dormitories, shopping malls, offices, and stadiums [14,15,16].
Educational buildings have received more attention due to the specificity and sensitivity of their occupants, and many studies have been reported worldwide on the risk assessment of indoor bioaerosol exposures on campuses, in which bioaerosols from indoor campus sites such as cafeterias, laboratories, classrooms, dormitories, gymnasiums, and libraries are collected and analyzed more frequently [17,18,19,20,21,22,23,24,25]. The risk of high concentrations of bioaerosols and the presence of pathogenic bacteria in indoor spaces on campuses, especially in public indoor spaces with high levels of activity, has been reported in many studies [26,27]. Still, systematic comparisons of bioaerosols in different indoor spaces on campuses and at different times of day in the same indoor space are lacking, and need to further investigate indoor locations on campus whether any risks of bioaerosol exposure and, how these risks are formed, what measures may do to better prevent. In addition, many studies have focused on the particle size distribution characteristics of indoor bioaerosols to assess their inhalation risk [28,29,30,31], but most have analyzed them only in terms of concentration, and whether there are differences in the community structure of microorganisms in bioaerosols of different particle sizes has not yet received sufficient attention.
Therefore, we monitored the concentrations and analyzed the community composition of bacterial, fungal, and actinomycete aerosols in three indoor sites during different periods, namely, classroom, dormitory, and canteen, on a university campus in Guilin, China, focusing on the differences of bioaerosols in different indoor environments and during different periods in the same indoor environment. Unlike previous studies, we also compared the community composition of bioaerosols with different particle sizes. This study aims to provide basic data for risk assessment and the prevention of indoor bioaerosol hazards on campus.
2. Materials and Methods
2.1. Sampling Sites
This study was conducted during the summer months on a university campus in Guilin, China (25°06′33.43″ N 110°29′93.12″ E). Three indoor places on the university campus, namely, a classroom, a dormitory, and a canteen, were selected for sampling. Culturable bioaerosol sampling was carried out for three days each month from 6 to 8 in the summer, and particulate matter sampling was carried out on one day in July. Each sample was taken separately for the periods of few personnel activities (UP) and the periods of personnel activities (OP) on the same day. The UP and OP for the classroom are from 7:00 to 8:30 (no lesson in the morning) and 10:00 to 11:30 (lesson time), respectively; for the dormitory, from 10:00 to 11:30 (personnel away time) and 13:00 to 14:30 (rest time for personnel), respectively; and for the canteen, from 9:30 to 11:00 (non-meal time) and 11:30 to 13:00 (meal time), respectively. Specific information for each sampling site is shown in Table 1.

Table 1.
Environmental parameters and description of the analyzed sampling sites.
2.2. Sampling and Analytical Methods
Bioaerosol samples were collected using a six-stage Andersen (FA-1, Qingdao Polytron China) impactor with retention diameters of 7.0, 4.7, 3.3, 2.1, 1.1, and 0.65 µm and an airflow rate of 28.3 L/min. The sampling time was 5 min for culturable bioaerosols and 60 min for particulate matter samples, and the sampler was set up in the center of the chamber at the point of use, with a sample height set at 1.5 m.
Culturable bacteria were collected on nutrient agar dishes (Huankai Microbial, Guangzhou, China), culturable fungi were tested on sand agar dishes (Huankai Microbial, Guangzhou, China), and culturable actinomycetes were tested on modified Koch’s 1 medium dishes (Huankai Microbial, Guangzhou, China). Bacterial samples were incubated at 37 °C for 2 days, fungal samples were incubated at 28 °C for 3 days, and actinomycetes were incubated at 28 °C for 7 days. The concentration of living microorganisms was counted as the number of colony-forming units in the volume of air (CFU/m3). Quartz filter membranes (80 mm diameter, 0.3 µm pore size, Xingya Shanghai, China) were used to collect samples of bioaerosol particulate matter, which were stored in a refrigerator at −20 °C after collection and analyzed for microbial community characterization on the particulate matter using high-throughput sequencing. Sequencing Methods:
- (1)
- Sample DNA purification. Sample gDNA purification was performed using the Zymo Research BIOMICS DNA Microprep Kit (Cat# D4301). gDNA integrity was detected using 0.8% agarose electrophoresis, followed by nucleic acid concentration detection (PicoGreen dye method) using a Tecan F200.
- (2)
- PCR amplification. According to the sequenced region, specific primers with index sequences were synthesized to amplify the 16S rDNA V4 region of the samples, and the amplification primer sequences were as follows: Primer5′-3′: 515F (5′-GTGYCAGCMGCCGCGGTAA-3′) and 806R (5′- GGACTACHVGGGTWTCTAAT-3′).
- (3)
- PCR product detection, purification, and quantification. PCR products were mixed with a 6-fold sampling buffer, followed by the electrophoretic detection of the target fragments using a 2% agarose gel. Samples that passed the assay were taken for the recovery of the destination bands, and the recovery was performed using Zymoclean Gel Recovery Kit (D4008); quantification was performed using Qubit@ 2.0 Fluorometer (Thermo Scientific); and, finally, equimolar amounts were mixed.
- (4)
- Library construction. Library construction was performed using the NEBNext Ultra II DNA Library Prep Kit for Illumina (NEB#E7645L) from NEW ENGLAND BioLabs.
- (5)
- High-throughput sequencing. PE250 sequencing was used, and the sequencing kit was Hiseq Rapid SBS Kit v2 (FC-402-4023 500 Cycle) for Illumina.
A total of 324 Petri dish samples were collected and analyzed, including 108 each of bacteria, fungi, and actinomycetes. A total of 36 samples of Quartz filter membranes were collected and analyzed.
2.3. Statistical Analysis
Independent-samples t-tests and one-way ANOVA were performed using SPSS software (R263.0.0.0, 64bit). Statistically significant differences were determined when the probability p-value was lower than 0.05. Graphing was performed using Origin (2021 64bit) and TBtools.
3. Results and Discussion
3.1. Bioaerosol Concentrations in Indoor Environments
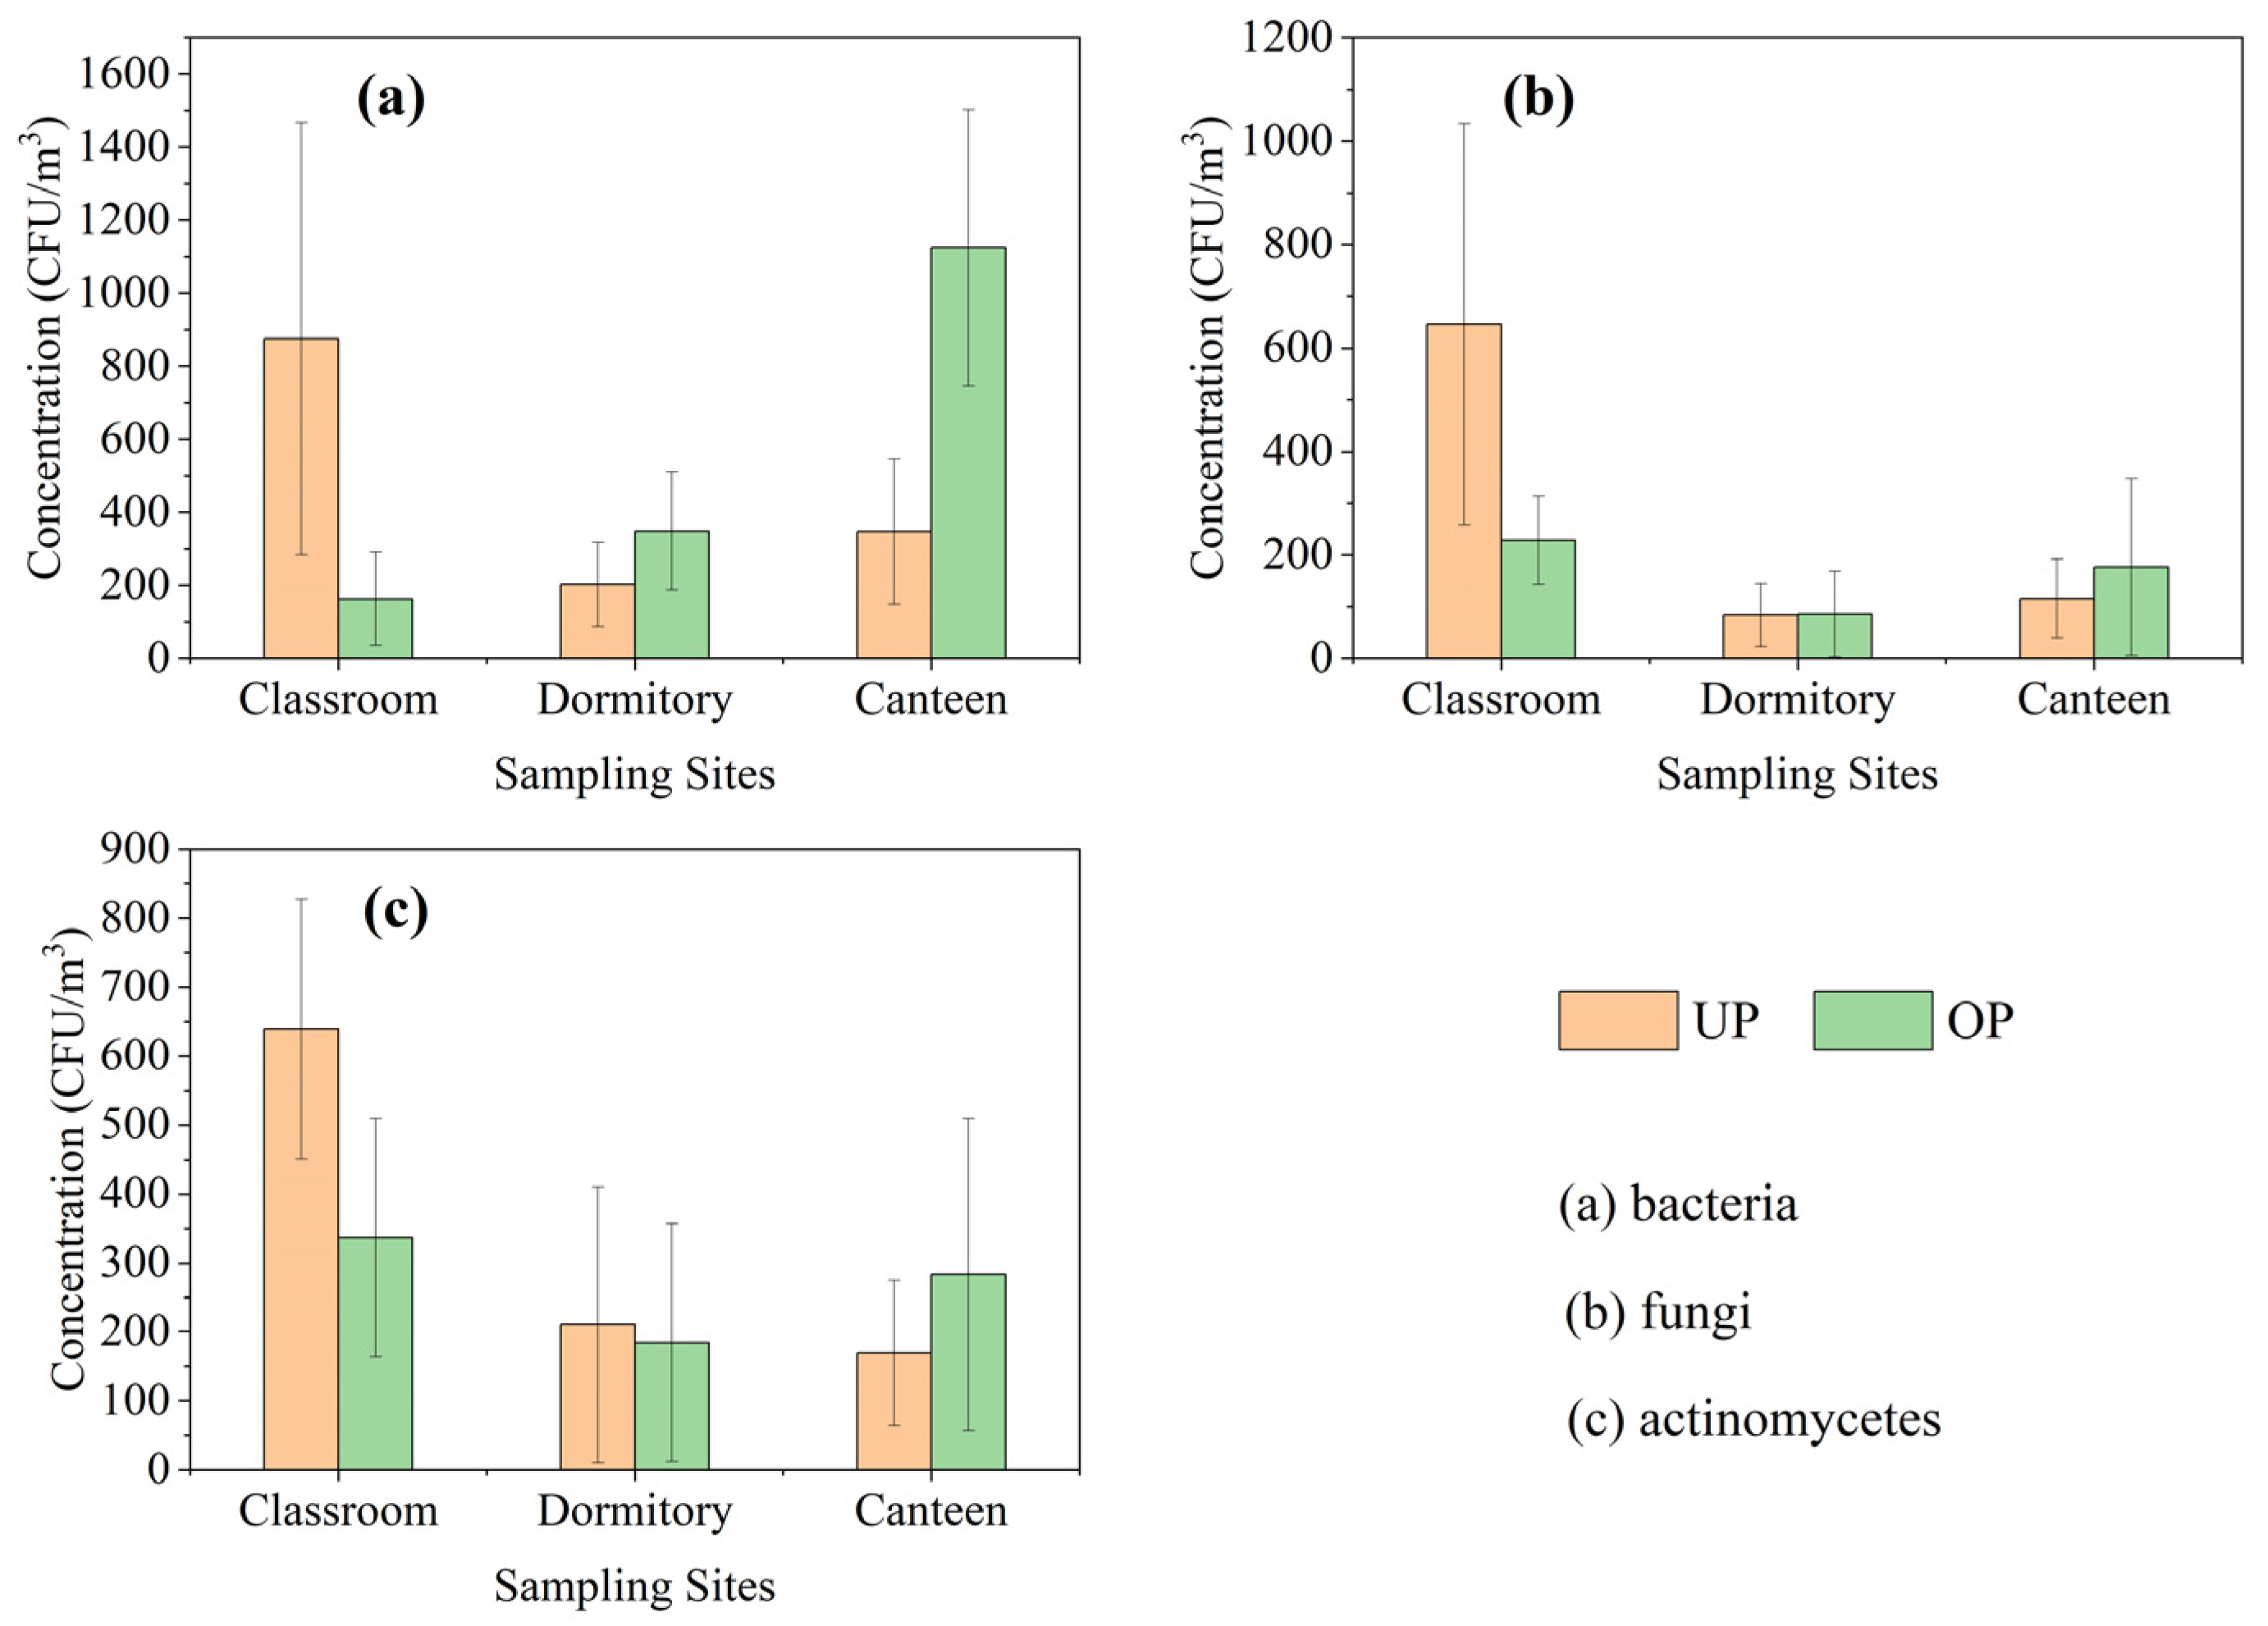
The mean concentrations of airborne bacteria, fungi, and actinomycetes in the classroom (Figure 1a) were 876 CFU/m3, 646 CFU/m3, and 639 CFU/m3 during UP, and 163 CFU/m3, 228 CFU/m3, and 336 CFU/m3 during OP. The mean concentrations of airborne bacteria, fungi, and actinomycetes in the dormitory (Figure 1b) were 202 CFU/m3, 84 CFU/m3, and 210 CFU/m3 during UP, and 348 CFU/m3, 85 CFU/m3, and 184 CFU/m3 during OP. The mean concentrations of airborne bacteria, fungi, and actinomycetes in the canteen (Figure 1c) were 347 CFU/m3, 116 CFU/m3, and 169 CFU/m3 during UP, and 1124 CFU/m3, 176 CFU/m3, and 283 CFU/m3 during OP, respectively.
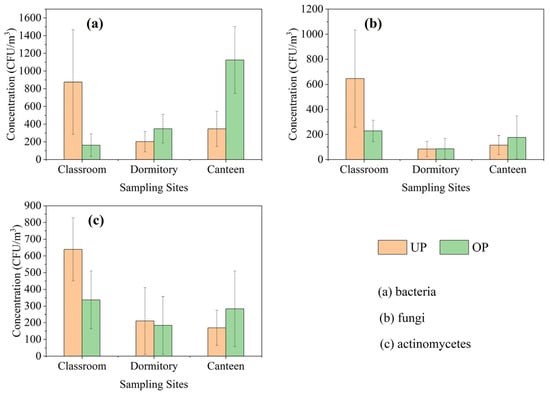
Figure 1.
Mean concentrations of bacterial, fungal, and actinomycete aerosols.
Airborne bacteria concentrations in the canteen and dormitory significantly increased (p < 0.05) after the increase in personnel activity, and the increase was greater in the canteen with a large increase in personnel activity (about 2.4 times), while fungi and actinomycetes did not show significant change in concentration. Changes in bioaerosol concentrations attributed to personnel activities primarily involved bacteria, and this is consistent with the findings of most relevant reports.
The concentrations of bacteria, fungi, and actinomycetes in the classroom reached a high level during UP (7:00~8:30) before the activities of the people, and significantly decreased during OP (10:00~11:30), even though the number of activities in the classroom increased. The significant decrease in the concentrations of bioaerosols from morning to midday is more consistent with the changes in the concentrations of bioaerosols in the outdoor environment [32]. Ventilation conditions are the key to the difference in the indoor bioaerosol concentration characteristics of the classroom from those of the dormitory and canteen, where the windows and doors are closed and the air conditioners are turned on during the hours of use; the windows and doors of the classroom are open throughout the day and the fans are turned on to assist in the ventilation of the classroom during class hours.
In most cases, the concentrations of airborne bacteria were higher than fungi and actinomycetes in the three indoor campus environments. The total count of airborne bacteria also serves as a crucial indicator of microbial contamination in indoor air. The World Health Organization (WHO) recommends that the total bacterial loads not exceed 1000 CFU/m3 in indoor environments. Total airborne bacterial counts greater than 1000 CFU/m3 were found in the classroom during UP (33% of samples) and in the canteen during OP (55% of samples). This reminds us of the need to improve ventilation or install equipment that can effectively reduce the total number of airborne bacteria during OP (meal time) in the canteen, and to reduce ventilation in the morning and at night when outdoor bioaerosol concentrations are relatively high, in order to avoid high concentrations of bioaerosols that could be hazardous to human health.
3.2. Bioaerosol Particle Size Distribution Characteristics
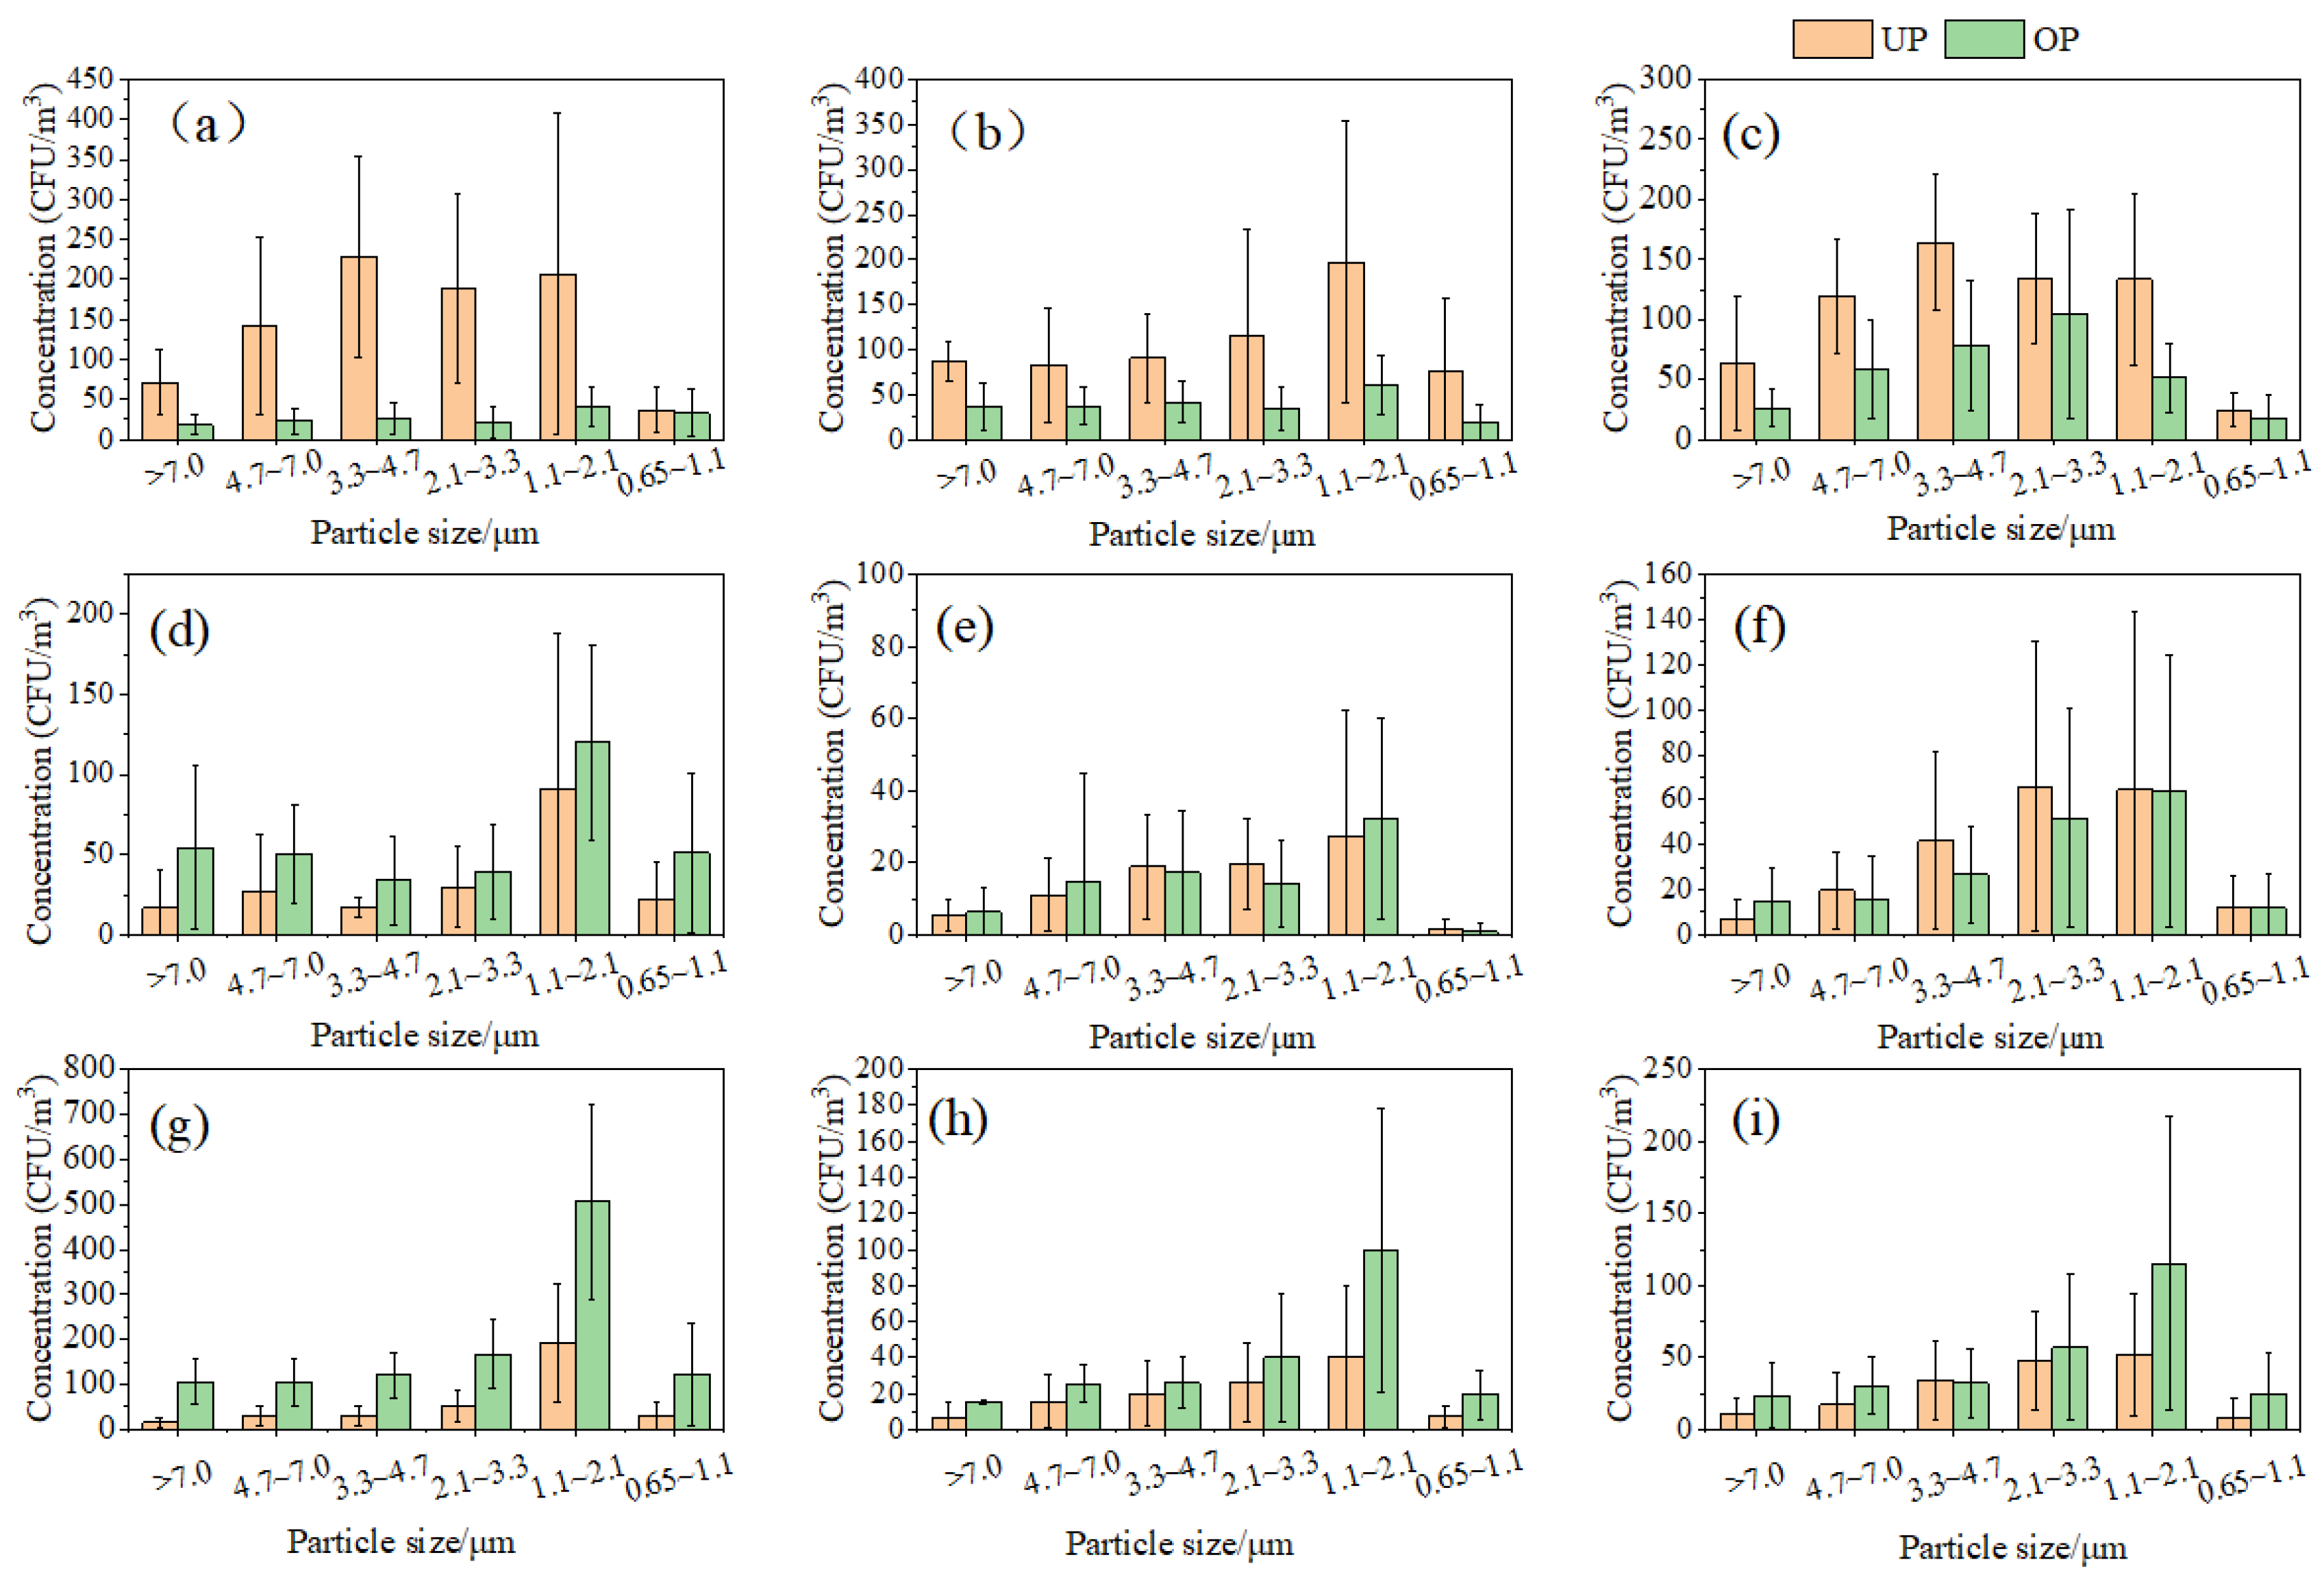
The particle size distribution of aerosol particles carrying microbes at the various sample sites is illustrated in Figure 2. In the classroom, the aerosol particle sizes of bacteria exhibited a bimodal distribution in both UP and OP (Figure 2a). During UP, bacteria were predominantly enriched on aerosol particles ranging from 1.1 to 4.7 μm, while smaller aerosol particles with sizes ranging from 0.65 to 2.1 μm were more prevalent during OP. The distribution of aerosol particle sizes for fungal particles is depicted in Figure 2b, demonstrating a skewed normal distribution during UP and OP. The peak aerosol particle sizes for fungal enrichment ranged from 1.1 to 2.1 μm. Similarly, Figure 2c displays the aerosol particle size distribution for actinomycete attachment, showcasing a normal distribution during UP and OP. The peak aerosol particle sizes for actinomycete enrichment were within the ranges of 3.3 to 4.7 μm and 2.1 to 3.3 μm, respectively.
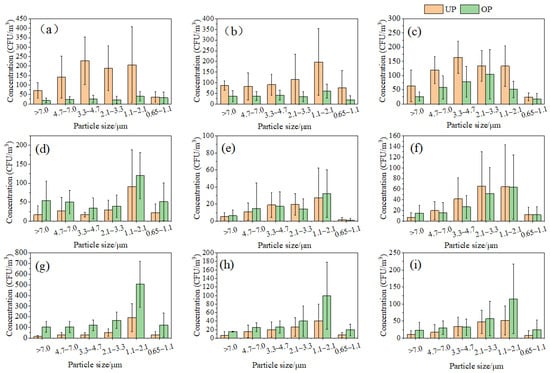
Figure 2.
Particle size distribution of bacteria, fungi, and actinomycetes. (a) Classroom bacteria, (b) classroom fungi, (c) classroom actinomycetes, (d) dormitory bacteria, (e) dormitory fungi, (f) dormitory actinomycetes, (g) canteen bacteria, (h) canteen fungi, and (i) canteen actinomycetes.
In the dormitory, the concentrations of bacteria, fungi, and actinomycetes attached to indoor bioaerosol particles exhibited a consistent distribution during UP and OP (Figure 2d–f). Both bacteria and fungi displayed a bimodal distribution of particle sizes during both periods, with the main enriched particles ranging from 1.1 to 2.0 μm. Bacterial concentrations were higher during OP, while fungal concentration distributions varied between UP and OP. The concentration of actinomycetes demonstrated a skewed normal distribution in both periods, with attached aerosol particles mainly ranging from 2.1 to 3.3 μm.
In the canteen, the concentrations of bacteria, fungi, and actinomycetes attached to indoor bioaerosol particles exhibited a skewed normal distribution during both UP and OP (Figure 2g–i), with peak concentrations corresponding to aerosol particle sizes ranging from 1.1 to 2.1 μm.
It is important to determine the size distribution of bioaerosols alongside concentrations, as the aerodynamic diameters of bioaerosols govern their ability to infiltrate the respiratory system. Respirable particles (less than 3.3 µm) can reach the trachea, bronchi, and alveoli, and contribute to adverse respiratory symptoms [18]. The proportion of respirable particles of bacterial fungi, bacteria, and actinomycete aerosols in the dormitory ranged from 57 to 70% during UP and OP. The proportion of respirable particles of bacterial fungi, bacteria, and actinomycete aerosols in the canteen was relatively high (64–80%) during UP and OP. The classroom had a high percentage (75%) of respirable bacteria only during OP, and the rest remained around 50%. The particle size distribution characteristics of bioaerosols from the different types of indoor environments showed differences, which is consistent with the findings of Nasir and Colbeck [33]. Most reports [34,35] on the particle size distribution of indoor bioaerosols show a higher predominance of respirable particles, especially in public indoor places with a high number of activities, and in this study, the proportion of respirable particles in indoor bioaerosols in the canteen reached up to 80%, which presents a greater risk of infection.
3.3. Bioaerosol Bacterial Community Structure
Table 2 displays the α-diversity indices of bacterial aerosol samples. The Chao1 index takes into account the abundance of observed species, as well as the rarest of them. The Shannon and Simpson indices emphasize the richness and evenness of the bacterial species, while the PD index is calculated as the sum of the lengths of the branches connecting groups of organisms on the phylogenetic tree. The Chao 1 and PD indices of the samples from the classroom during OP time were slightly higher than those during UP, which implies that the classroom’s bacterial aerosol had a low number of species and mostly proximate species during UP, while its bacterial species abundance and developmental diversity were elevated by increased personnel activities during OP. The Chao 1, Shannon, Simpson, and PD indices of the samples during different periods in the dormitory and canteen were relatively close to each other.
Table 2.
α-diversity indices of bacterial aerosol samples.
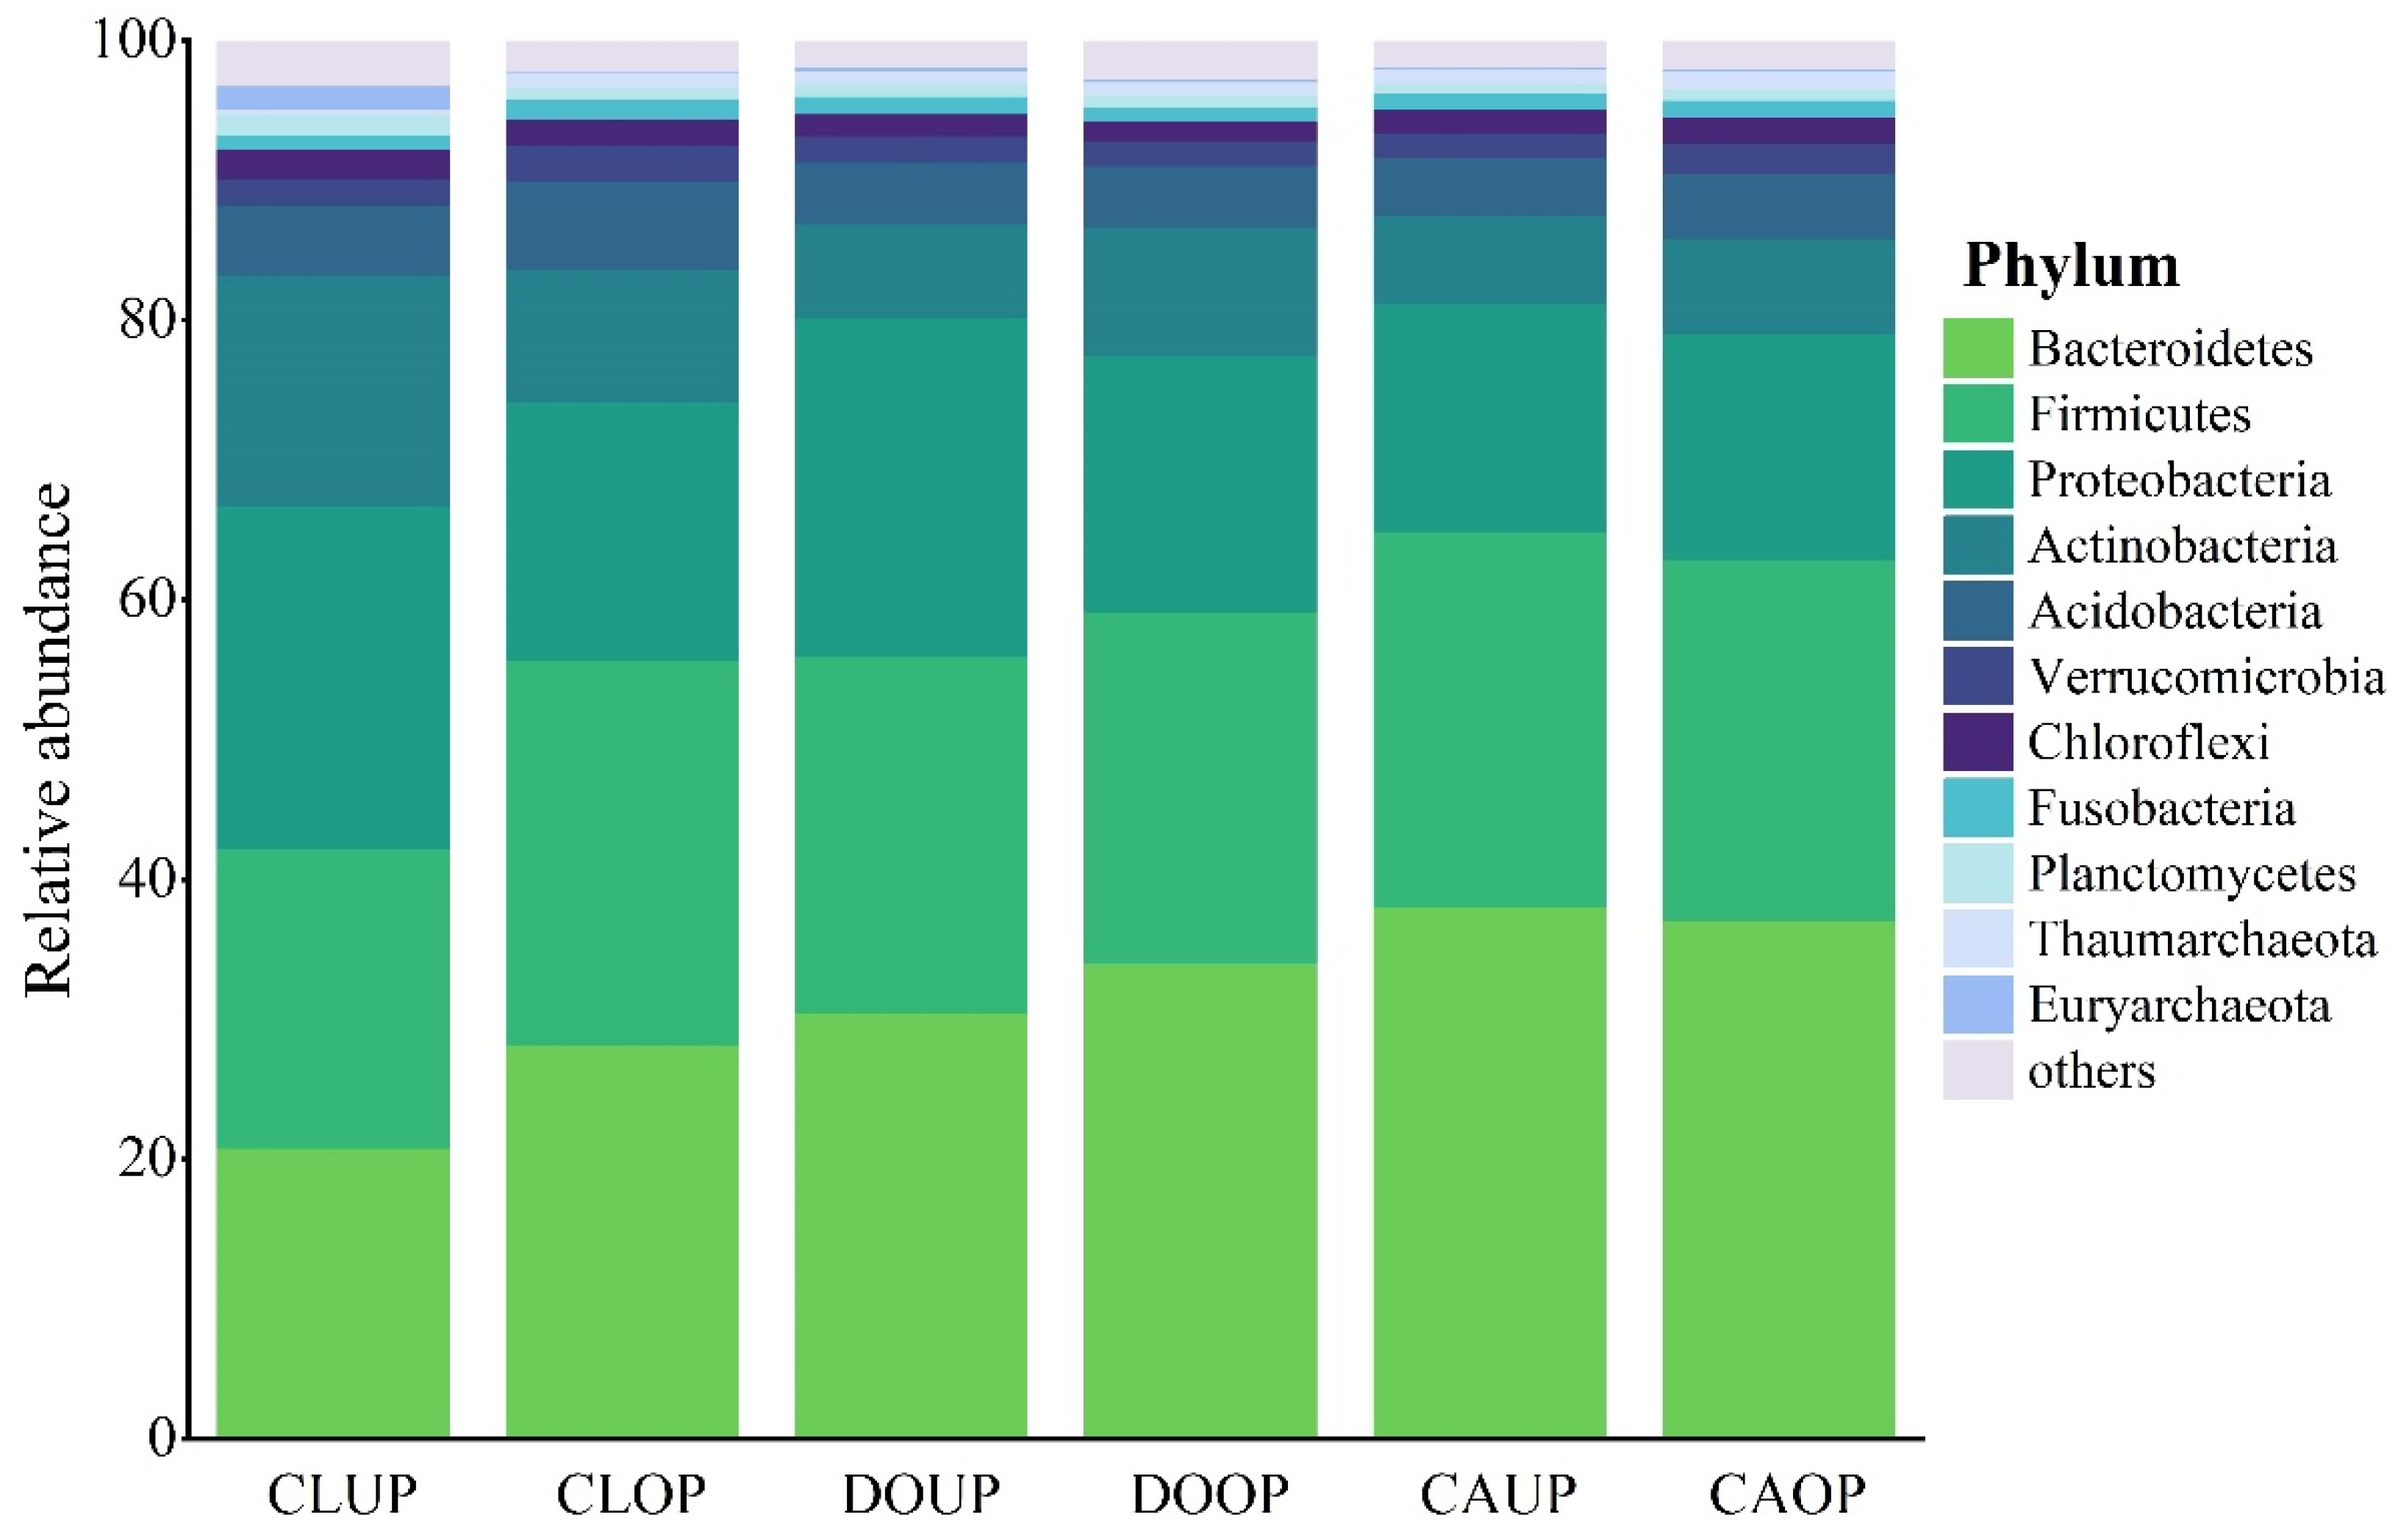
A total of 50 bacterial phyla were identified across the three indoor environments. The top 11 phyla in terms of relative abundance, namely, Bacteroidetes, Firmicutes, Proteobacteria, Actinobacteria, Acidobacteria, Verrucomicrobia, Chloroflexi, Fusobacteria, Planctomycetes, Thaumarchaeota, and Euryarchaeota, were analyzed (Figure 3). Bacteroidetes, Firmicutes, Proteobacteria, and Actinobacteria emerged as dominant species (with a relative abundance exceeding 5%) across all three sites, while Acidobacteria stood out as a dominant species only in the classroom.

Figure 3.
Relative abundance distribution of bacterial phyla.
Bacteroidetes, Firmicutes, Proteobacteria, and Actinobacteria are ubiquitous airborne microbes found worldwide, and whose representatives have also been detected in high relative abundance in previous works about indoor bioaerosols [36,37,38]. Acidobacteria, Verrucomicrobia, Chloroflexi, Fusobacteria, and Planctomycetes are common in urban air but not as widely distributed. Chloroflexi are predominantly present in bioaerosols from urban wastewater treatment areas, while Thaumarchaeota and Euryarchaeota are seldom detected in bioaerosols [13,39,40,41]. The relative abundance of Thaumarchaeota and Euryarchaeota in the bioaerosols of the three indoor environments was around 1% during both UP and OP, showing relatively higher levels than other regions. This observation might be associated with the unique karst geology of the Guilin area because these bacteria are usually detected in soil and water in karst areas [42,43].
Bacteroidetes and Firmicutes constituted over 20% of the relative abundance at each site, emerging as the predominant phyla. Their prevalence surpassed that of Proteobacteria and Actinobacteria, except in the classroom during UP. This pattern contrasts with much of the research on outdoor bioaerosols, indicating a distinction in the structure of airborne microbial communities indoors and outdoors [44]. Since most Bacteroidetes, Firmicutes, and Proteobacteria can thrive in the human oral cavity or intestinal tract [45,46,47], this is also consistent with previous works that microorganisms associated with humans are major members of indoor bacterial aerosols [48,49].
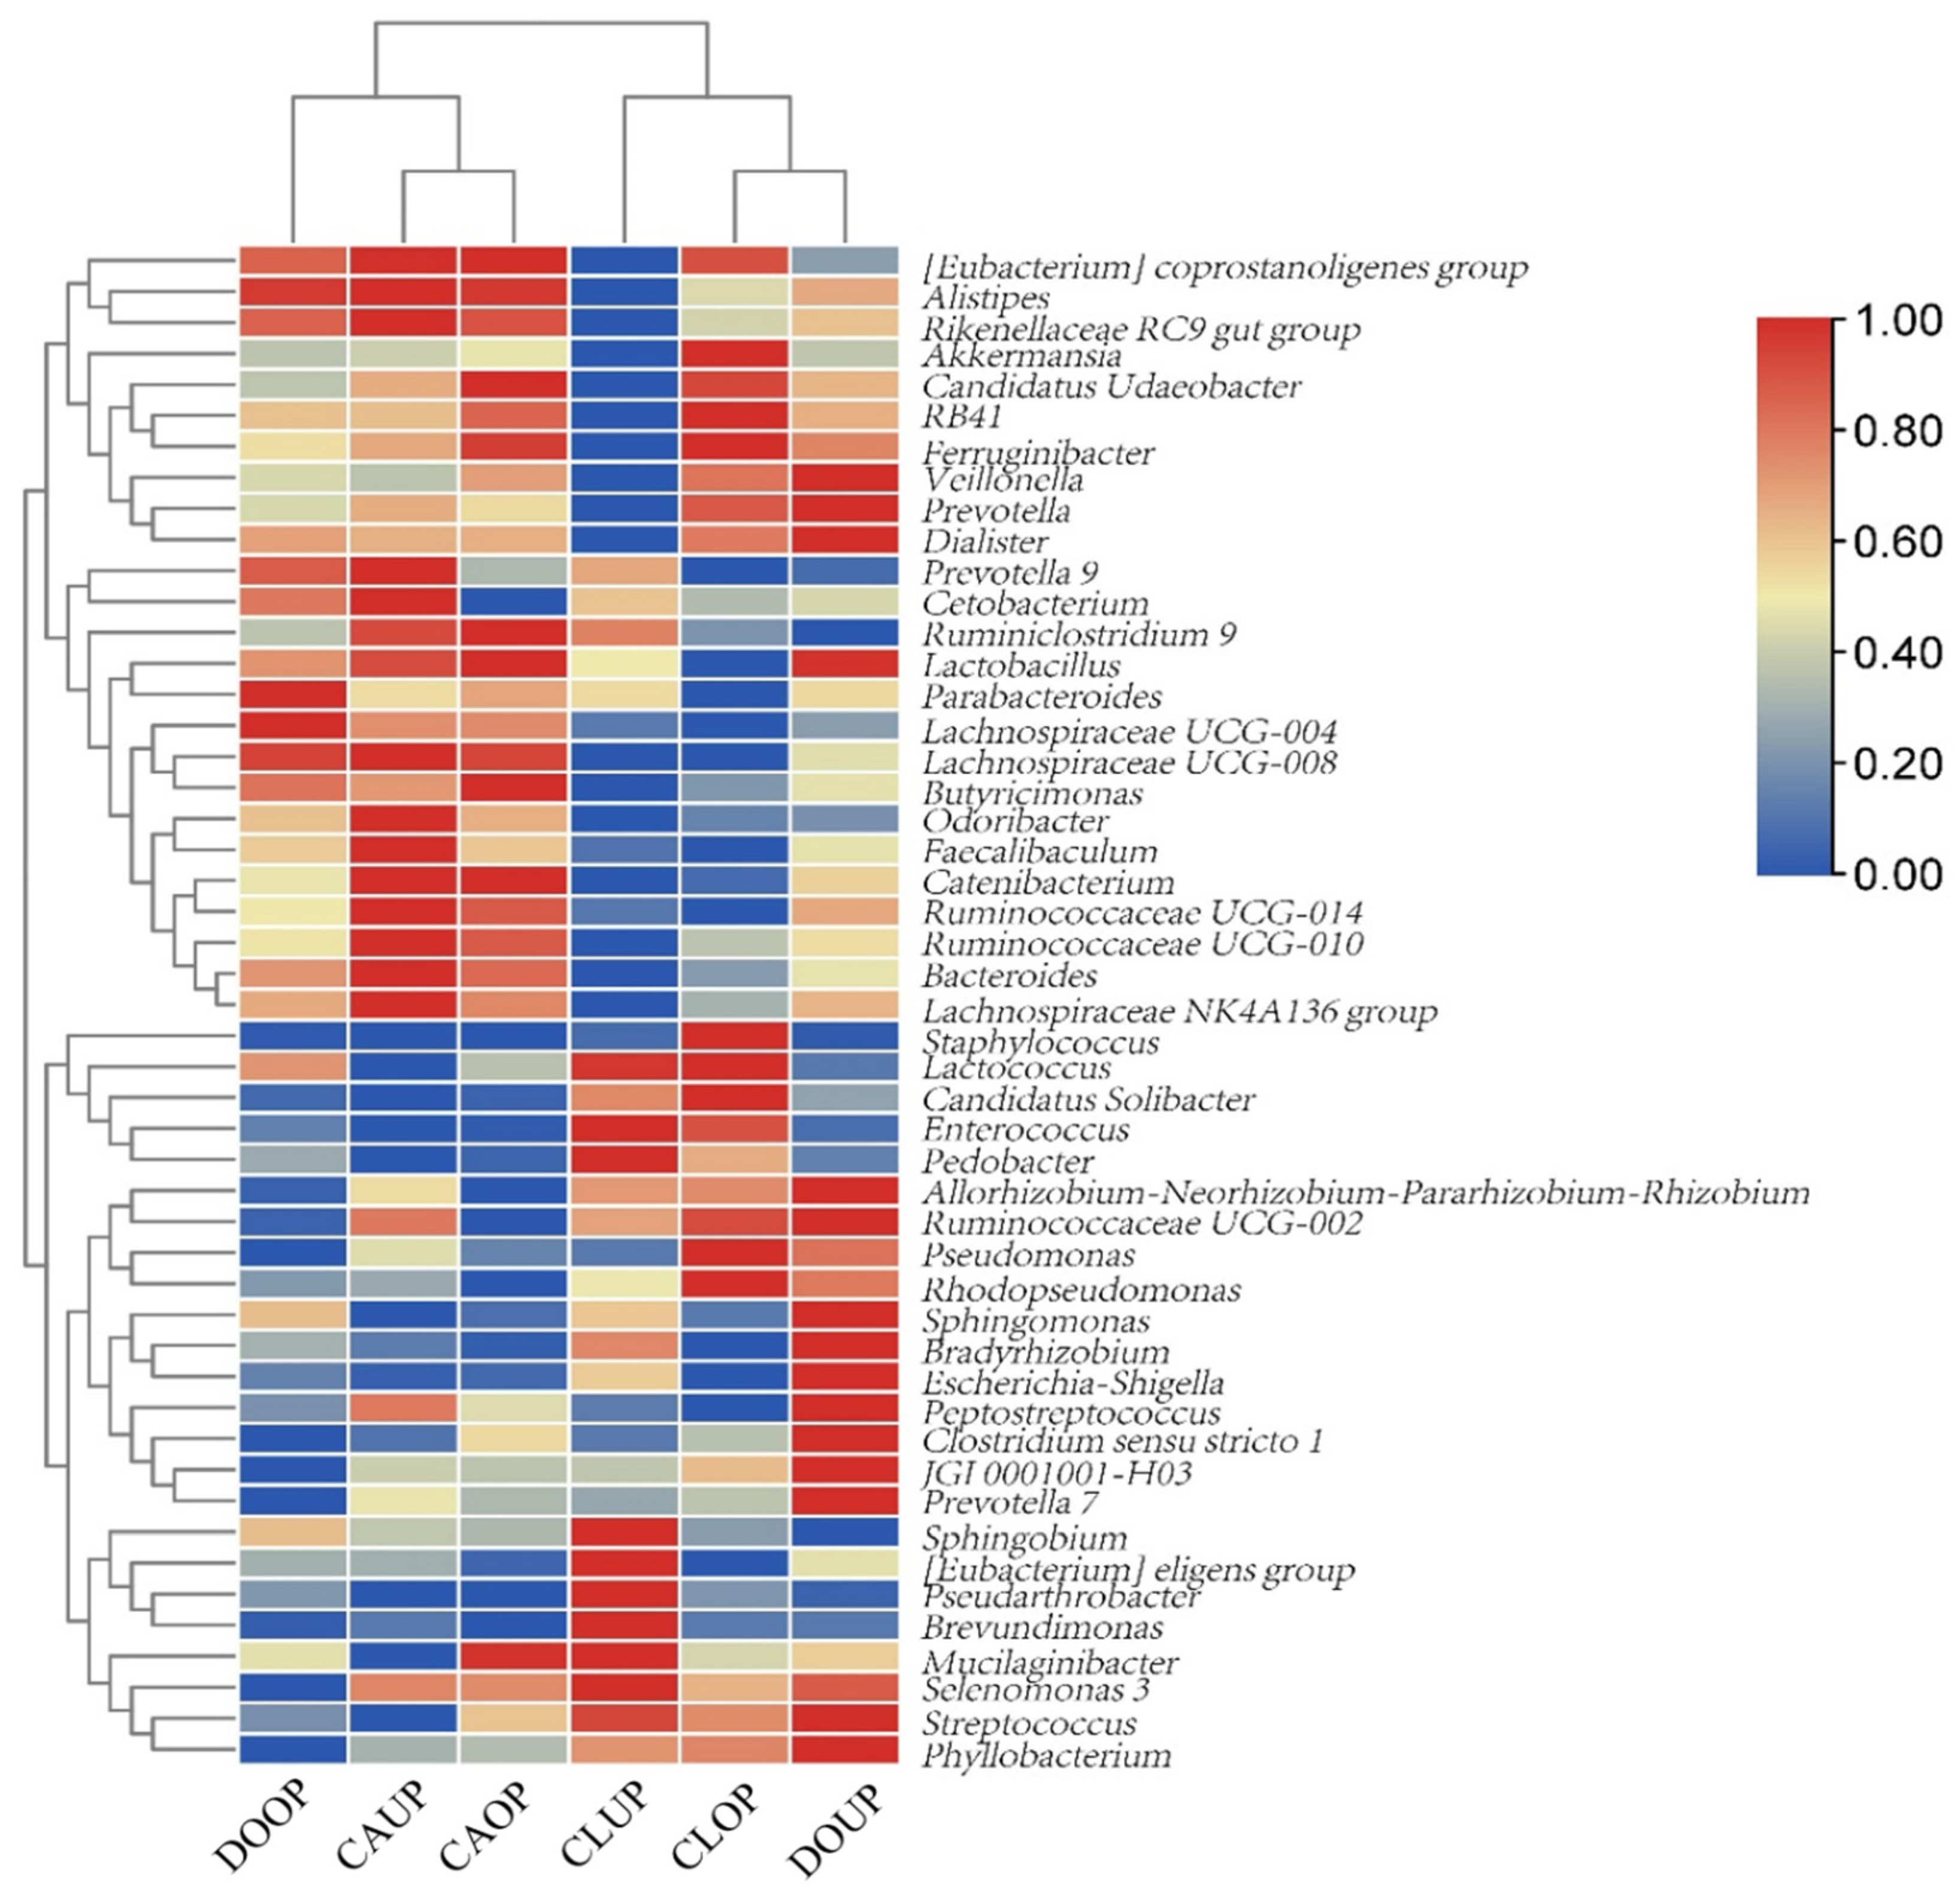
A clustering heat map of the top 50 bacterial genera in terms of bioaerosol relative abundance is shown in Figure 4. It can be seen that DOOP, CAOP, and CAUP were categorized in a group with the higher relative abundance of genera that can be parasitized in the personnel body such as Odoribacter, Alistipes, and Bacteroides [50,51,52]. CLUP, CLOP and DOUP were categorized in another group, where, in addition to human-associated bacteria, bacteria from outdoor environments, such as Phyllobacterium, Sphingobium, and Pseudarthrobacter [53], were found in high relative abundance.
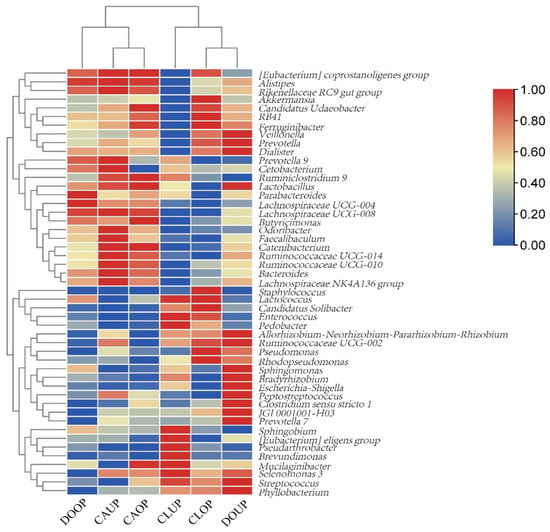
Figure 4.
Heat map of relative abundance of bacterial genera.
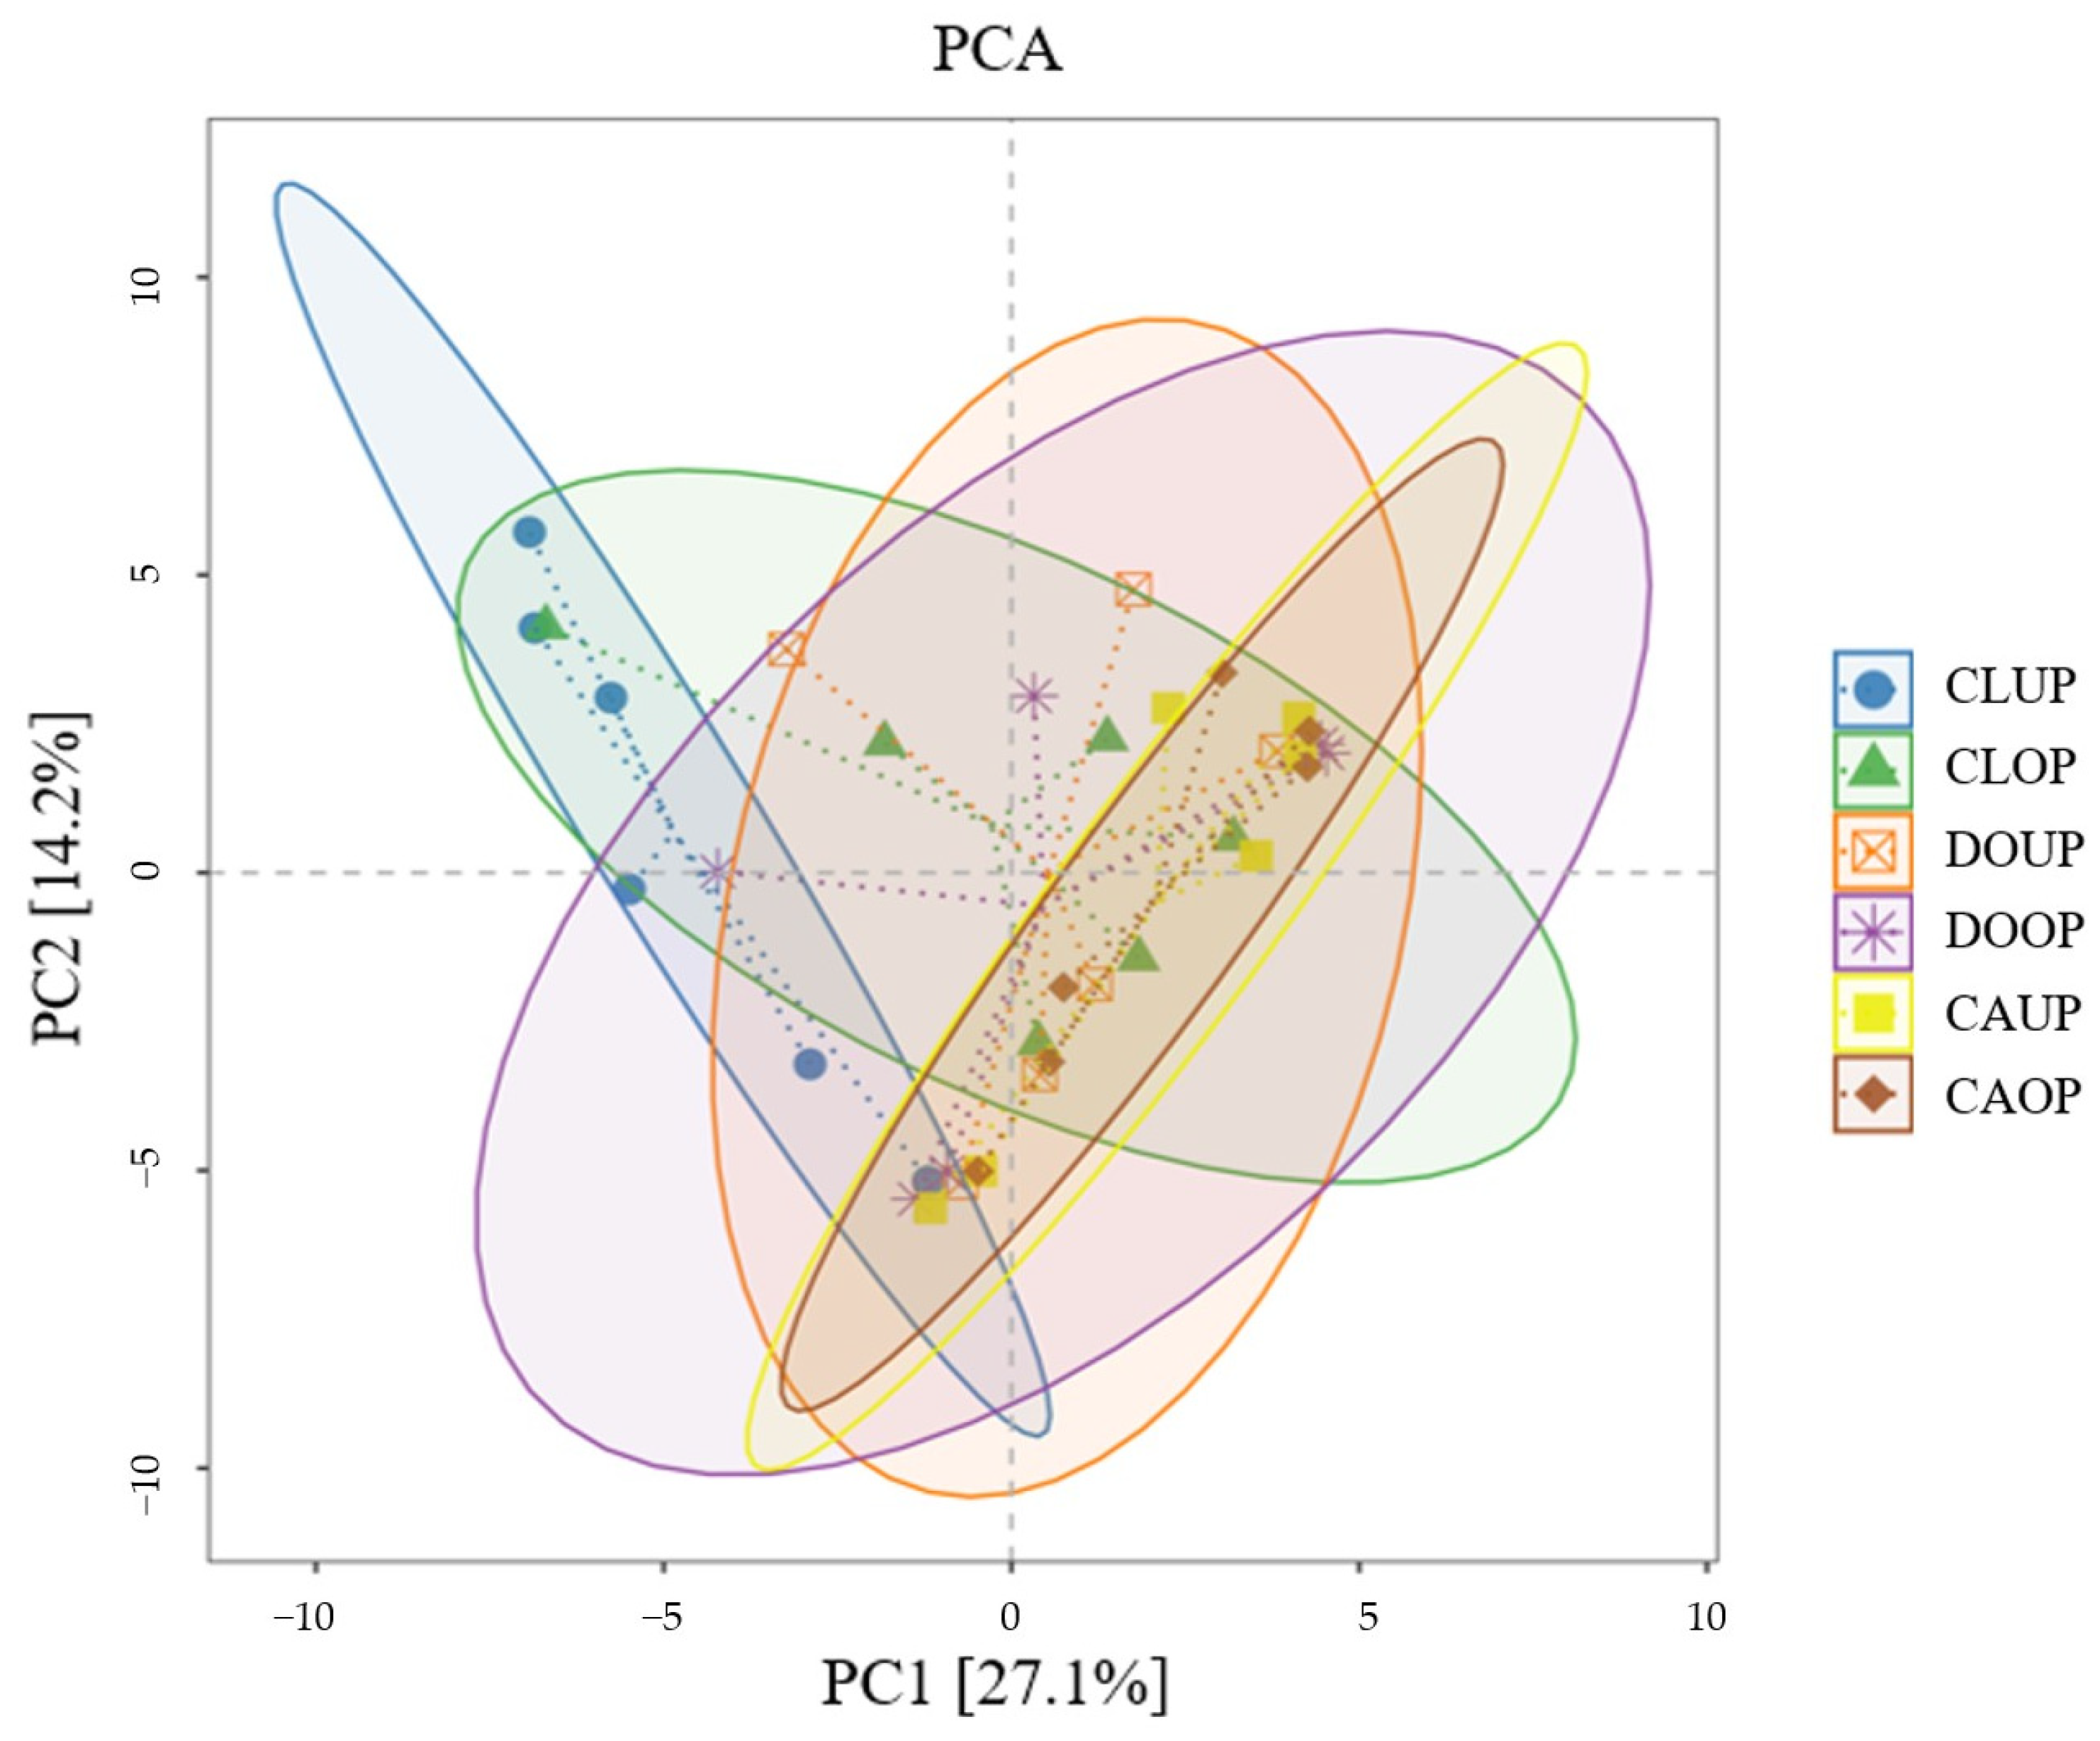
Principal component analysis (PCA) was conducted based on the species richness matrix, and confidence ellipses were generated for the same group of samples (Figure 5). The first principal component (PC1) explained 27.1% of total data variability and the second principal component (PC2) explained 14.2% of total data variability. The distances between the different samples were small and the DOOP, DOUP, CAUP, CAOP, and CLOD sample confidence ellipses overlapped well, analyzing the community composition of bacterial aerosols in the indoor sites of the three campuses as similar from the perspective of β-diversity.

Figure 5.
Principal component analysis (PCA).
Similar to the findings of related studies [36,54,55], ventilation through window opening can change the community structure of indoor bioaerosols to some extent, but this effect is relatively limited because human-related microorganisms always have a high contribution to indoor bioaerosols if there is current human activity indoors.
3.4. Analysis of the Bacterial Community Structure of Bioaerosols of Different Particle Sizes
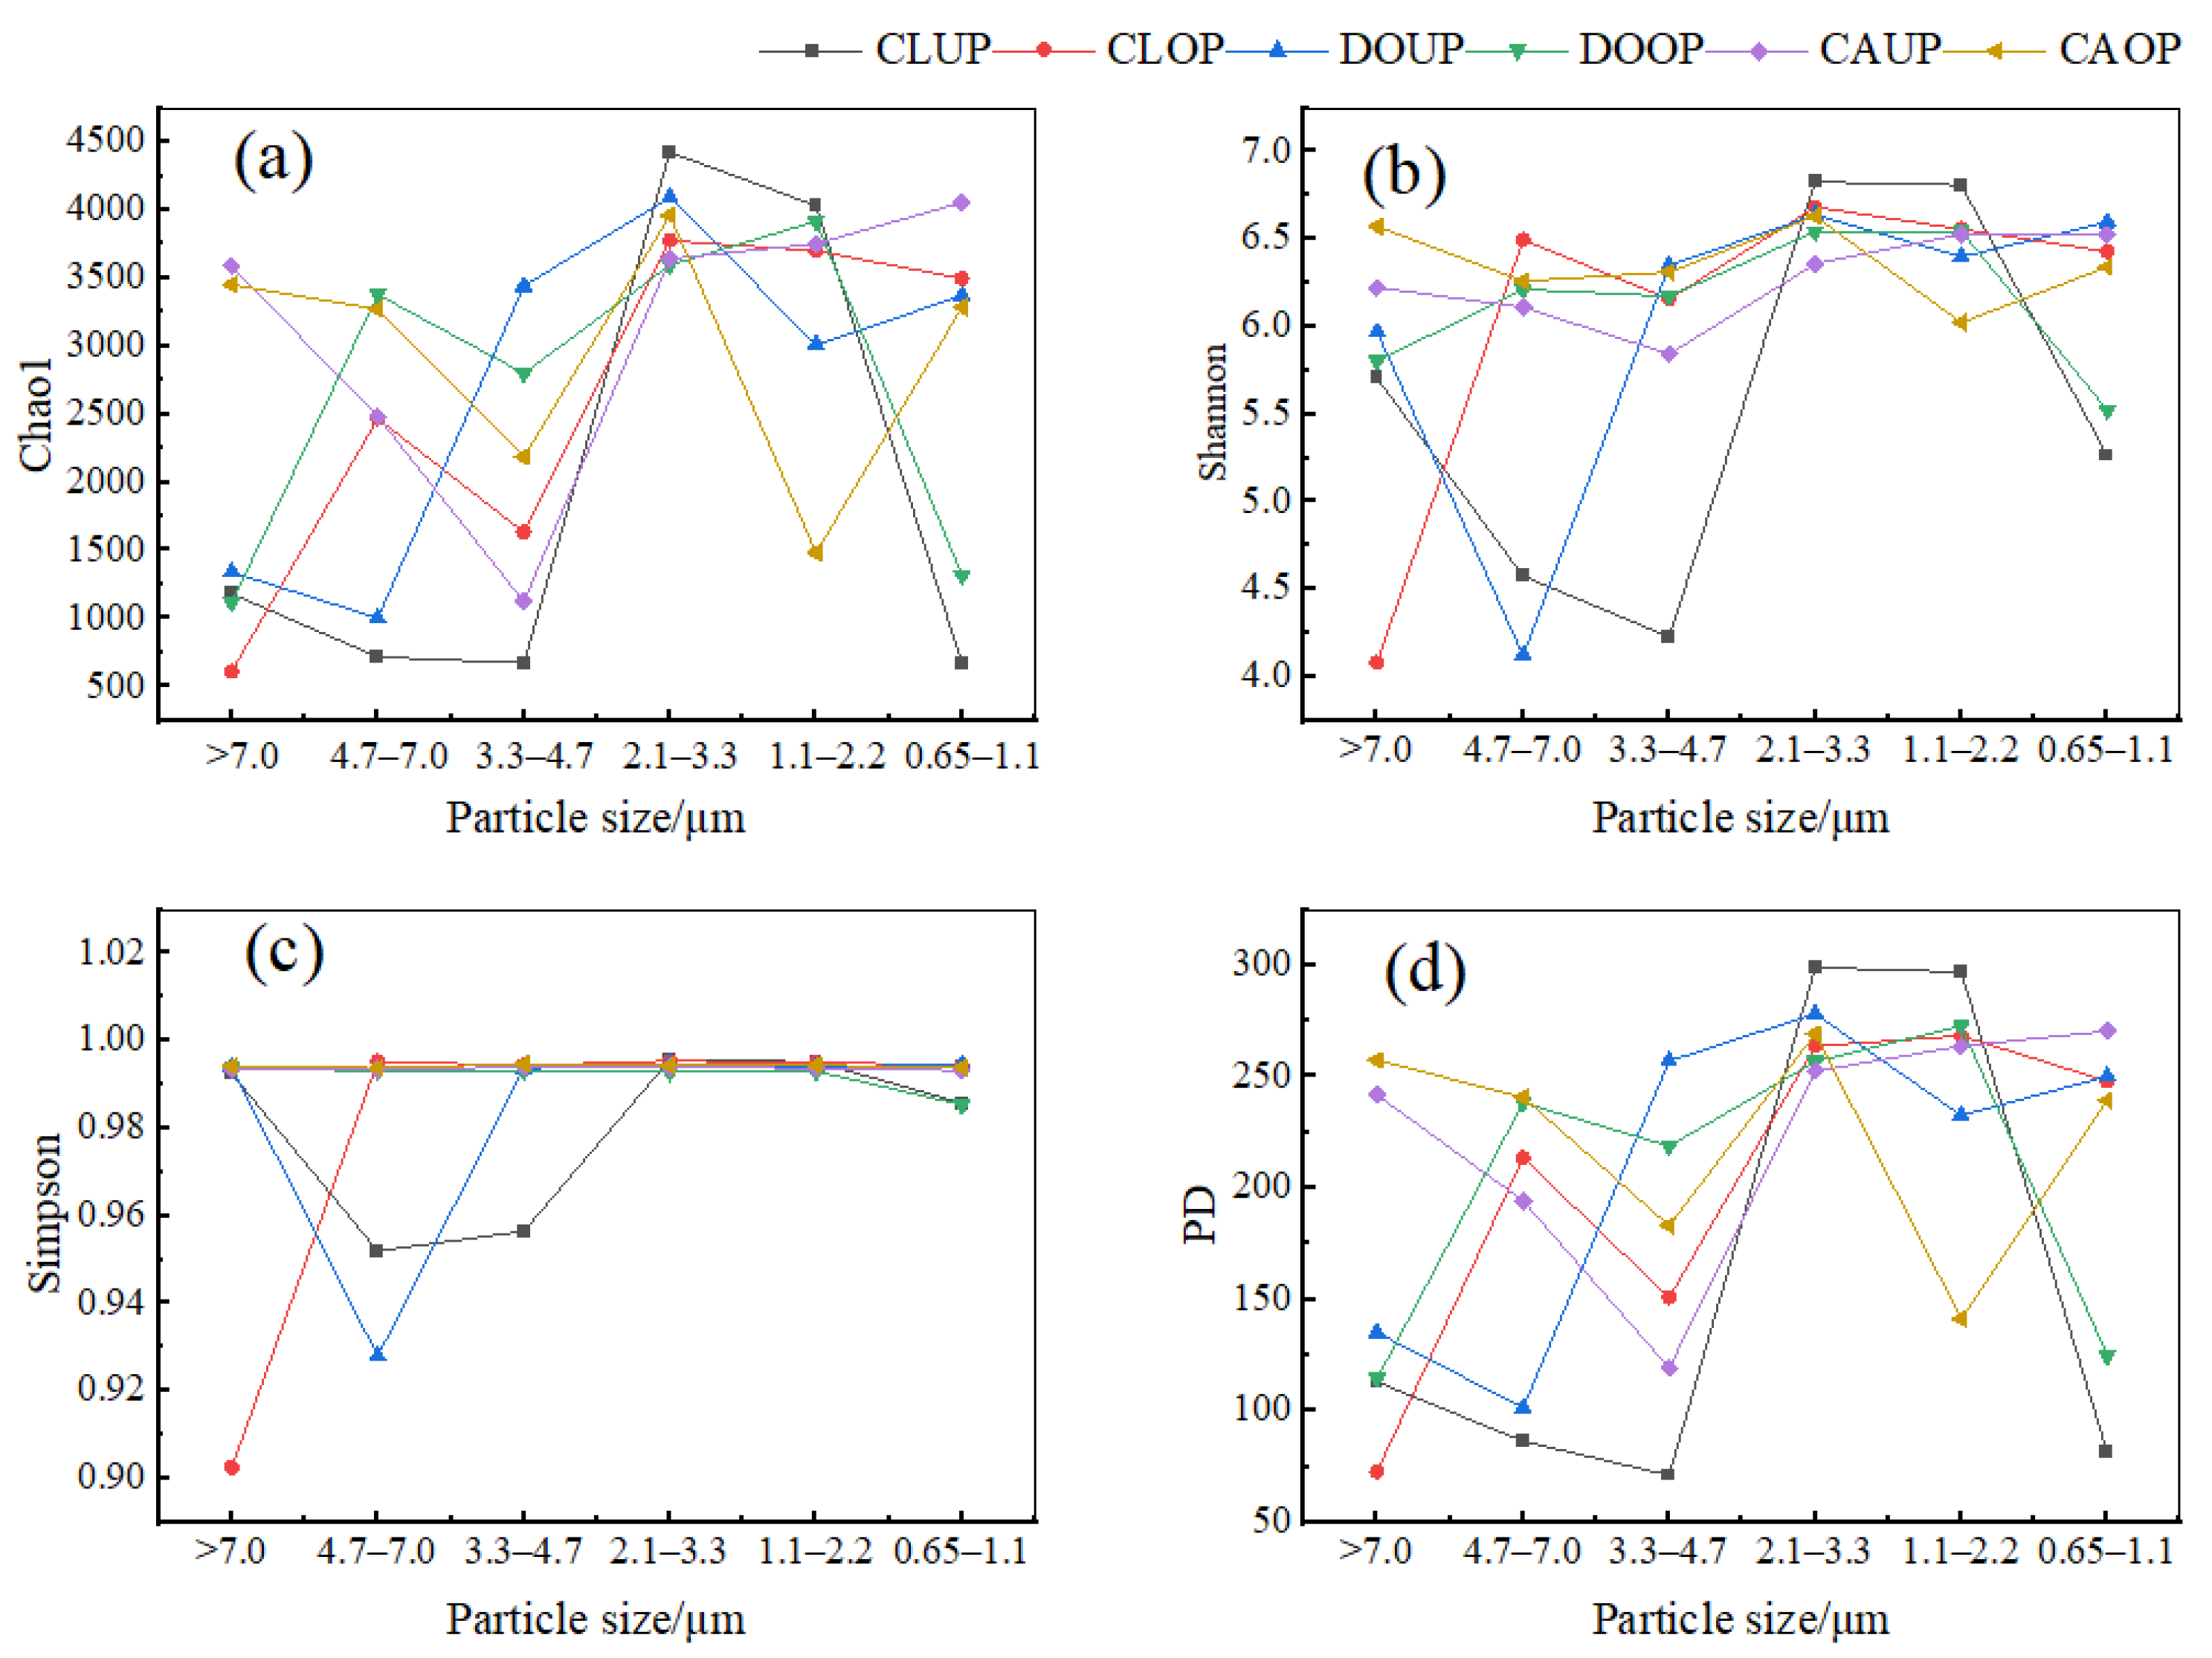
The distribution of α-diversity indices (Chao 1, Shannon, Simpson, and PD) for bioaerosols of different particle sizes is shown in Figure 6. The Chao 1, Shannon, Simpson, and PD indices were significantly higher (p < 0.05) for 1.1–3.3 μm bacterial aerosols than for 3.3–4.7 μm bacterial aerosols in the classroom during UP, and this difference decreased during OP due to an increase in the diversity index of 3.3–4.7 μm bacterial aerosols. The differences in the diversity indices of bacterial aerosols of different particle sizes in the dormitory and canteen were insignificant. On the other hand, the Chao 1, Shannon, Simpson, and PD indices for bacterial aerosols of 2.1–3.3 μm were consistently high in all three indoor environments.
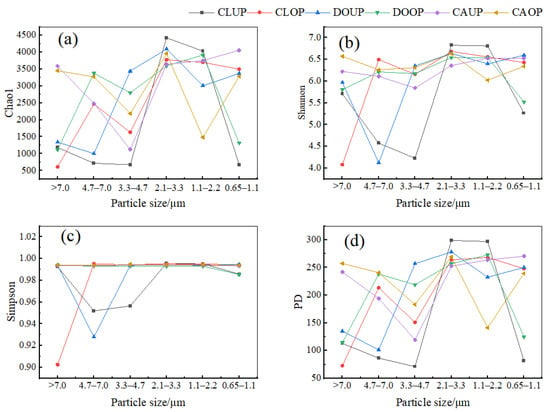
Figure 6.
Folded distribution of the four α-diversity indices (Chao 1, Shannon, Simpson, and PD) of bacterial communities on bioaerosols of different sizes. (a) Chao 1 index; (b) Simpson index; (c) Shannon index; (d) PD index.
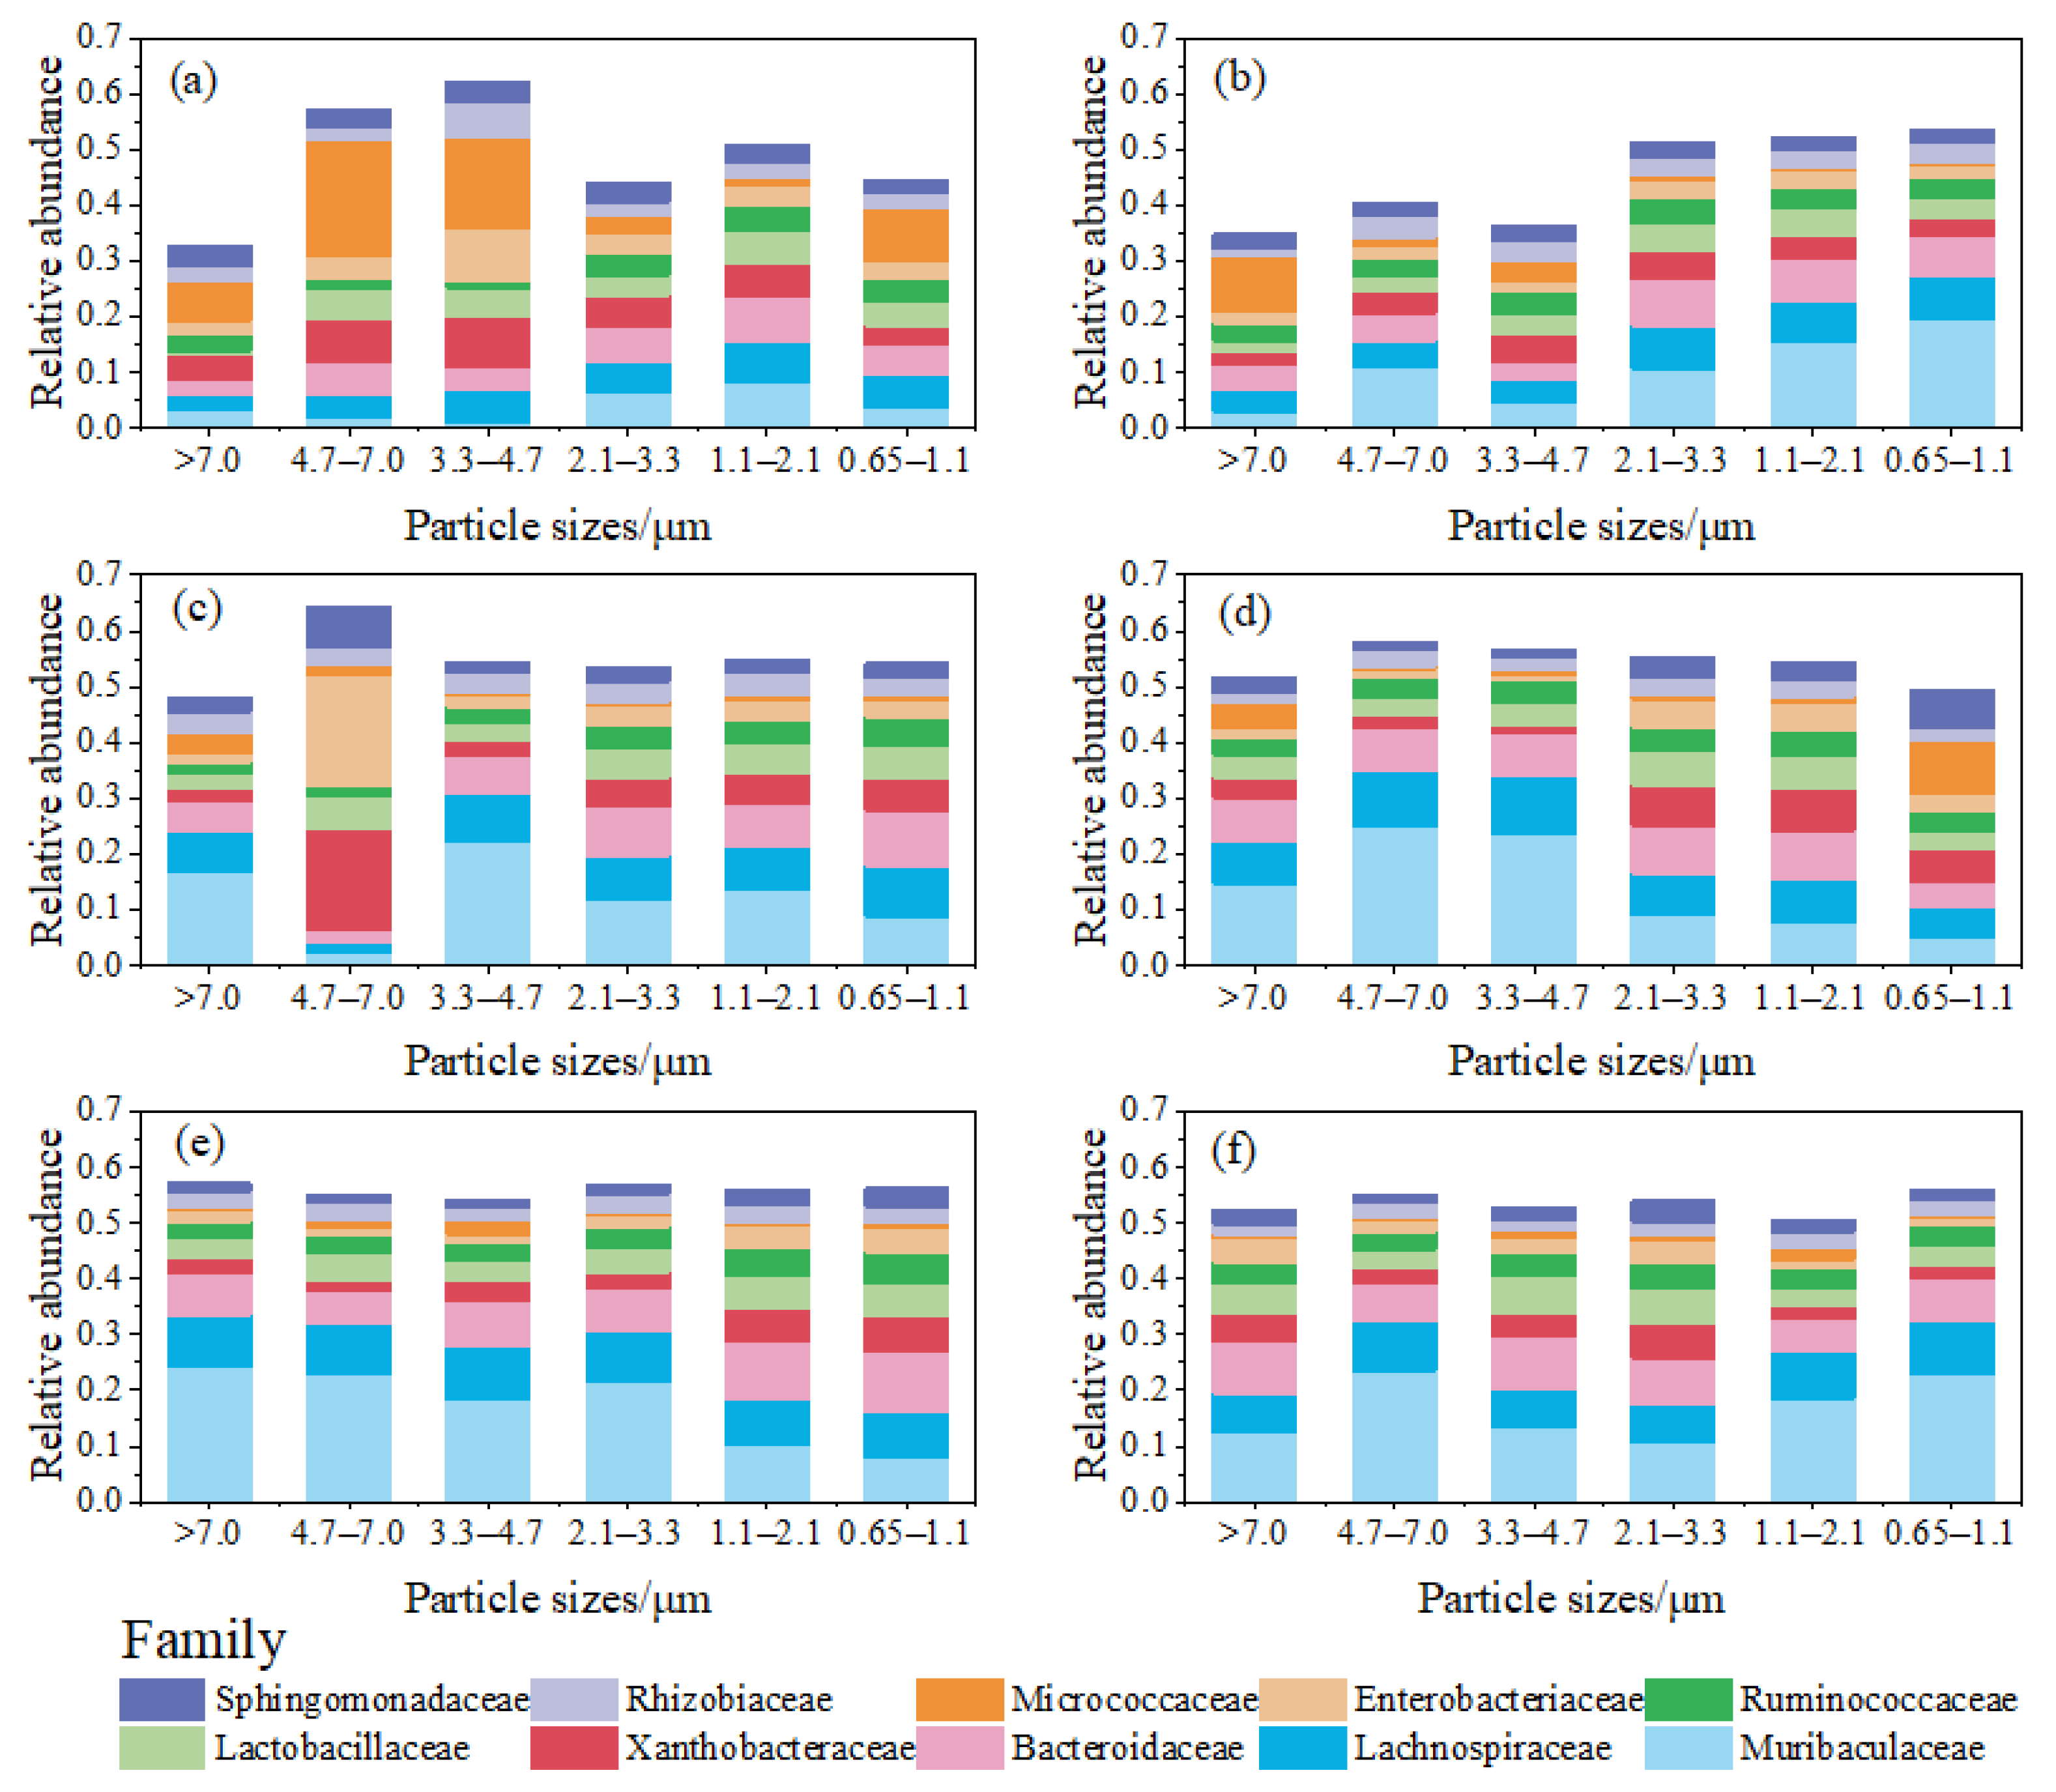
Figure 7 illustrates the relative abundance distribution of bacterial families on bioaerosols of different particle sizes. The relative abundance of Micrococcaceae on bacterial aerosols with particle sizes ranging from 3.3 to 7.0 μm was significantly (p = 0.015) higher than that on bacterial aerosols in the other particle size ranges in the classroom during UP (Figure 7a). Microorganisms originating from soil and water environments such as Micrococcaceae [56,57] were mostly concentrated on bioaerosols with particle sizes larger than 3.3 μm (Figure 7a,b), whereas microorganisms associated with humans, such as Muribaculaceae, Lachnospiraceae, and Bacteroidaceae [58,59,60] had high relative abundance in all particle size ranges; this was more pronounced in the dormitory and canteen (Figure 7c–f). This shows that bioaerosol sources are an important factor in the differences in the composition of bioaerosol communities of different particle sizes.
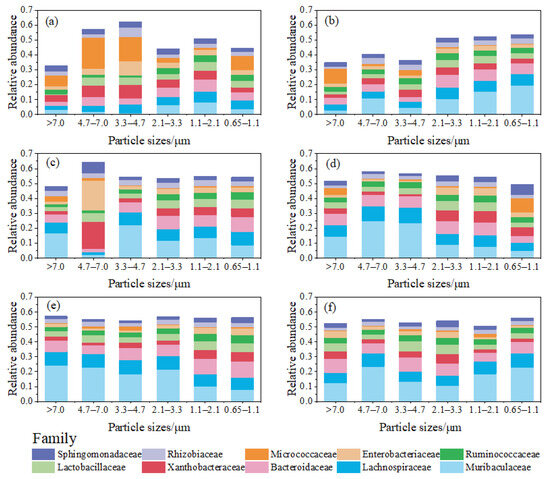
Figure 7.
Relative abundance distribution of bacterial families on aerosol particles of different particle sizes. (a) The classroom during periods of few personnel activities; (b) the classroom during periods of personnel activities; (c) the dormitory during periods of few personnel activities; (d) the dormitory during periods of personnel activities; (e) the canteen during periods of few personnel activities; and (f) the canteen during periods of personnel activities.
Micrococcaceae, Gram-positive bacteria that thrive in aerobic conditions, can lead to various infections, particularly in individuals with compromised immune systems. These infections may manifest as respiratory pneumonia, meningitis, endocarditis, soft-tissue abscesses, septic arthritis, urinary tract infections, and, in severe cases, infectious shock resulting in death [61]. Enterobacteriaceae, Gram-negative bacteria encompassing commensal organisms, as well as primary and opportunistic pathogens, include specific species like Escherichia coli, Enterobacter cloacae, and Klebsiella pneumoniae. These bacteria can cause a diverse range of illnesses, such as pneumonia, urinary tract infections, soft-tissue skin infections, and bacteremia, contributing significantly to global morbidity and mortality [62]. The detection of Micrococcaceae and Enterobacteriaceae in particulate matter across all particle size ranges at the three sample sites suggests that bioaerosols in indoor campus venues can potentially be pathogenic to personnel. However, this pathogenicity is likely to pose a greater risk to immunocompromised populations. Particularly noteworthy is the high relative abundance of Enterobacteriaceae on particles within the 4.7–7.0 μm size range in the dormitory during UP, reaching an unusually high level of 20% (Figure 7c). This observation may be linked to toilet flushing and the escape of human feces in the dormitory [63,64], emphasizing the need to prevent health risks associated with infectious bioaerosols emitted from personnel excreta in indoor spaces equipped with toilets.
4. Conclusions
We studied the bioaerosol characteristics of a dormitory, a classroom, and a canteen during different periods on a university campus. Bacteria were the predominant microorganisms in all three indoor sites, and there was a risk of total bacterial counts greater than 1000 CFU/m3 in the classroom in the morning and during meal times in the canteen. The percentage of respirable bioaerosols (<3.3 μm) was greater than 50% in all three indoor sites. Indoor human activity significantly increases airborne bacterial aerosol concentrations, and good ventilation reduces the impact of human activities on bacterial aerosol concentrations, but the ventilation of the room should be avoided in the mornings when outdoor bioaerosol concentrations are high. Ventilating indoor places can change the community structure of indoor bioaerosols, but this effect is relatively limited because human-related microorganisms such as Lachnospiraceae, and Bacteroidaceae always have a high contribution to indoor bioaerosols if there is current human activity indoors. The community structure of bioaerosols with different particle sizes showed some differences: the four α-diversity indices (Chao 1, Shannon, Simpson, and PD) for bioaerosols of 2.1–3.3 μm were consistently high at all three sampling sites; Micrococcaceae had high relative abundance only for bioaerosols with particle sizes >3.3 μm. Micrococcaceae and Enterobacteriaceae were conditionally pathogenic bacteria present at all sampling sites, with Micrococcaceae in higher relative abundance in the classroom and the relative abundance of Enterobacteriaceae having unusually high values in the dormitory. The overall assessment is that all three campus sampling sites are at risk of bioaerosol hazards and that precautionary measures are needed based on the specific causes contributing to the risk.
Author Contributions
Conceptualization, X.Z. and L.L.; methodology, X.Z.; validation, X.Z. and W.X.; formal analysis, L.L.; investigation, Y.F.; data curation, X.Z.; writing—original draft preparation, X.Z.; writing—review and editing, A.Q. and L.L.; visualization, X.Z.; supervision, S.M.; project administration, L.L.; funding acquisition, L.L. All authors have read and agreed to the published version of the manuscript.
Funding
This research was funded by the National Natural Science Foundation of China (51468011), and the Central Guiding Local Development of Science and Technology Plan Project in Guigang City, Guangxi, China ([2023] No. 2).
Institutional Review Board Statement
Not applicable.
Informed Consent Statement
Not applicable.
Data Availability Statement
The data presented in this study are available on request from the corresponding author. The data were not directly appended to this document, as the statistical methods employed, as well as the datasets utilized to derive the results, are comprehensively described in the manuscript.
Conflicts of Interest
The authors declare no conflicts of interest.
Nomenclature
| UP | the periods of few personnel activities |
| OP | the periods of personnel activities |
| CFU | colony-forming units |
| IAQ | indoor air quality |
| WHO | the World Health Organization |
| CLUP | the classroom during periods of few personnel activities |
| CLOP | the classroom during periods of personnel activities |
| DOUP | the dormitory during periods of few personnel activities |
| DOOP | the dormitory during periods of personnel activities |
| CAUP | the canteen during periods of few personnel activities |
| CAOP | the canteen during periods of personnel activities |
References
- Zhang, X.; Li, H. Feasibility Analysis for Control of Bioaerosol Concentration at Indoor Corner via Airflow from Ventilation Outlet with Energy Optimization. J. Clean. Prod. 2020, 248, 119289. [Google Scholar] [CrossRef]
- Kim, K.-H.; Kabir, E.; Jahan, S.A. Airborne Bioaerosols and Their Impact on Human Health. J. Environ. Sci. 2018, 67, 23–35. [Google Scholar] [CrossRef]
- Heo, K.J.; Lim, C.E.; Kim, H.B.; Lee, B.U. Effects of Human Activities on Concentrations of Culturable Bioaerosols in Indoor Air Environments. J. Aerosol Sci. 2017, 104, 58–65. [Google Scholar] [CrossRef]
- Nazaroff, W.W. Indoor Bioaerosol Dynamics. Indoor Air 2016, 26, 61–78. [Google Scholar] [CrossRef]
- Heyder, J.; Gebhart, J.; Rudolf, G.; Schiller, C.F.; Stahlhofen, W. Deposition of Particles in the Human Respiratory Tract in the Size Range 0.005–15 Μm. J. Aerosol Sci. 1986, 17, 811–825. [Google Scholar] [CrossRef]
- Jo, W.-K.; Seo, Y.-J. Indoor and Outdoor Bioaerosol Levels at Recreation Facilities, Elementary Schools, and Homes. Chemosphere 2005, 61, 1570–1579. [Google Scholar] [CrossRef]
- Jabeen, R.; Kizhisseri, M.I.; Mayanaik, S.N.; Mohamed, M.M. Bioaerosol Assessment in Indoor and Outdoor Environments: A Case Study from India. Sci. Rep. 2023, 13, 18066. [Google Scholar] [CrossRef]
- Mosalaei, S.; Amiri, H.; Rafiee, A.; Abbasi, A.; Baghani, A.N.; Hoseini, M. Assessment of Fungal Bioaerosols and Particulate Matter Characteristics in Indoor and Outdoor Air of Veterinary Clinics. J. Environ. Health Sci. Eng. 2021, 19, 1773–1780. [Google Scholar] [CrossRef]
- van Drooge, B.L.; Rivas, I.; Querol, X.; Sunyer, J.; Grimalt, J.O. Organic Air Quality Markers of Indoor and Outdoor PM2.5 Aerosols in Primary Schools from Barcelona. Int. J. Environ. Res. Public Health 2020, 17, 3685. [Google Scholar] [CrossRef]
- Humbal, C.; Gautam, S.; Trivedi, U. A Review on Recent Progress in Observations, and Health Effects of Bioaerosols. Environ. Int. 2018, 118, 189–193. [Google Scholar] [CrossRef]
- Zemouri, C.; de Soet, H.; Crielaard, W.; Laheij, A. A Scoping Review on Bio-Aerosols in Healthcare and the Dental Environment. PLoS ONE 2017, 12, e0178007. [Google Scholar] [CrossRef]
- Mbareche, H.; Morawska, L.; Duchaine, C. On the Interpretation of Bioaerosol Exposure Measurements and Impacts on Health. J. Air Waste Manag. Assoc. 2019, 69, 789–804. [Google Scholar] [CrossRef]
- Nair, A.T. Bioaerosols in the Landfill Environment: An Overview of Microbial Diversity and Potential Health Hazards. Aerobiologia 2021, 37, 185–203. [Google Scholar] [CrossRef]
- Wu, C.; Xu, B.; Shi, S.; Zhao, B. Time-Activity Pattern Observatory from Mobile Web Logs. Int. J. Embed. Syst. 2015, 7, 71. [Google Scholar] [CrossRef]
- Xie, Y.; Fajardo, O.A.; Yan, W.; Zhao, B.; Jiang, J. Six-Day Measurement of Size-Resolved Indoor Fluorescent Bioaerosols of Outdoor Origin in an Office. Particuology 2017, 31, 161–169. [Google Scholar] [CrossRef]
- Narayanan, S.R.; Yang, S. Airborne Transmission of Virus-Laden Aerosols inside a Music Classroom: Effects of Portable Purifiers and Aerosol Injection Rates. Phys. Fluids 2021, 33, 033307. [Google Scholar] [CrossRef]
- Marcovecchio, F.; Perrino, C. Bioaerosol Contribution to Atmospheric Particulate Matter in Indoor University Environments. Sustainability 2021, 13, 1149. [Google Scholar] [CrossRef]
- Brągoszewska, E.; Biedroń, I.; Mainka, A. Microbiological Air Quality in a Highschool Gym Located in an Urban Area of Southern Poland—Preliminary Research. Atmosphere 2020, 11, 797. [Google Scholar] [CrossRef]
- Brauer, M.; Hrubá, F.; Mihalíková, E.; Fabiánová, E.; Miskovic, P.; Plziková, A.; Lendacká, M.; Vandenberg, J.; Cullen, A. Personal Exposure to Particles in Banská Bystrica, Slovakia. J. Expo. Anal. Environ. Epidemiol. 2000, 10, 478–487. [Google Scholar] [CrossRef]
- Zavieh, F.S.; Mohammadi, M.J.; Vosoughi, M.; Abazari, M.; Raesee, E.; Fazlzadeh, M.; Geravandi, S.; Behzad, A. Assessment of Types of Bacterial Bio-Aerosols and Concentrations in the Indoor Air of Gyms. Environ. Geochem. Health 2021, 43, 2165–2173. [Google Scholar] [CrossRef]
- Macedo, A.; Magalhães, O.; Brito, A.; Mayan, O. Characterization of Indoor Environmental Quality in Primary Schools in Maia: A Portuguese Case Study. Hum. Ecol. Risk Assess. Int. J. 2013, 19, 126–136. [Google Scholar] [CrossRef]
- Karimpour Roshan, S.; Godini, H.; Nikmanesh, B.; Bakhshi, H.; Charsizadeh, A. Study on the Relationship between the Concentration and Type of Fungal Bio-Aerosols at Indoor and Outdoor Air in the Children’s Medical Center, Tehran, Iran. Environ. Monit. Assess. 2019, 191, 48. [Google Scholar] [CrossRef]
- Lenart-Boroń, A.; Drab, D.; Chrobak, J. Microbiological Aerosol, Particulate Matter Concentrations and Antibiotic Resistant Staphylococcus Spp. in the Premises of Poland’s Oldest Agricultural School. Atmosphere 2021, 12, 934. [Google Scholar] [CrossRef]
- Zhang, G.; Li, Y.; Song, Z.; Hao, Y. Population Characteristics and Source Analysis of Microorganisms in a Regularly Disinfected Library. Indoor Built Environ. 2022, 31, 2007–2016. [Google Scholar]
- Kallawicha, K.; Chao, H.J.; Kotchasatan, N. Bioaerosol Levels and the Indoor Air Quality of Laboratories in Bangkok Metropolis. Aerobiologia 2019, 35, 1–14. [Google Scholar] [CrossRef]
- Chen, H.H.; Lin, T.S.; Lin, C.S.; Hung, H.F. Characteristics of Bioaerosols in Kindergarten Classrooms in Miaoli City. In Proceedings of the ISEE 2023: 35th Annual Conference of the International Society of Environmental Epidemiology, Kaohsiung, Taiwan, 17–21 September 2023; ISEE Conference Abstracts. Volume 2023. [Google Scholar] [CrossRef]
- Kadaifciler, D.G. Bioaerosol Assessment in the Library of Istanbul University and Fungal Flora Associated with Paper Deterioration. Aerobiologia 2017, 33, 151–166. [Google Scholar] [CrossRef]
- Castro, A.; Calvo, A.I.; Alves, C.; Alonso-Blanco, E.; Coz, E.; Marques, L.; Nunes, T.; Fernández-Guisuraga, J.M.; Fraile, R. Indoor Aerosol Size Distributions in a Gymnasium. Sci. Total Environ. 2015, 524–525, 178–186. [Google Scholar] [CrossRef]
- Bhangar, S.; Huffman, J.A.; Nazaroff, W.W. Size-Resolved Fluorescent Biological Aerosol Particle Concentrations and Occupant Emissions in a University Classroom. Indoor Air 2014, 24, 604–617. [Google Scholar] [CrossRef]
- Su, C.; Lau, J.; Gibbs, S.G. Student Absenteeism and the Comparisons of Two Sampling Procedures for Culturable Bioaerosol Measurement in Classrooms with and without Upper Room Ultraviolet Germicidal Irradiation Devices. Indoor Built Environ. 2016, 25, 551–562. [Google Scholar] [CrossRef]
- Yang, Z.; Chen, L.-A.; Yang, C.; Gu, Y.; Cao, R.; Zhong, K. Portable Ultrasonic Humidifier Exacerbates Indoor Bioaerosol Risks by Raising Bacterial Concentrations and Fueling Pathogenic Genera. Indoor Air 2022, 32, e12964. [Google Scholar] [CrossRef]
- Huang, Z.; Yu, X.; Liu, Q.; Maki, T.; Alam, K.; Wang, Y.; Xue, F.; Tang, S.; Du, P.; Dong, Q.; et al. Bioaerosols in the Atmosphere: A Comprehensive Review on Detection Methods, Concentration and Influencing Factors. Sci. Total Environ. 2024, 912, 168818. [Google Scholar] [CrossRef]
- Nasir, Z.A.; Colbeck, I. Winter Time Concentrations and Size Distribution of Bioaerosols in Different Residential Settings in the UK. Water Air Soil Pollut. 2012, 223, 5613–5622. [Google Scholar] [CrossRef]
- Li, J.; Wan, M.P.; Schiavon, S.; Tham, K.W.; Zuraimi, S.; Xiong, J.; Fang, M.; Gall, E. Size-Resolved Dynamics of Indoor and Outdoor Fluorescent Biological Aerosol Particles in a Bedroom: A One-Month Case Study in Singapore. Indoor Air 2020, 30, 942–954. [Google Scholar] [CrossRef]
- Brągoszewska, E.; Biedroń, I. Efficiency of Air Purifiers at Removing Air Pollutants in Educational Facilities: A Preliminary Study. Front. Environ. Sci. 2021, 9, 709718. [Google Scholar] [CrossRef]
- Núñez, A.; García, A.M. Effect of the Passive Natural Ventilation on the Bioaerosol in a Small Room. Build. Environ. 2022, 207, 108438. [Google Scholar] [CrossRef]
- Lee, B.G.; Yang, J.I.; Kim, E.; Geum, S.W.; Park, J.; Yeo, M. Investigation of Bacterial and Fungal Communities in Indoor and Outdoor Air of Elementary School Classrooms by 16S rRNA Gene and ITS Region Sequencing. Indoor Air 2021, 31, 1553–1562. [Google Scholar] [CrossRef]
- Zhou, Y.; Lai, Y.; Tong, X.; Leung, M.H.Y.; Tong, J.C.K.; Ridley, I.A.; Lee, P.K.H. Airborne Bacteria in Outdoor Air and Air of Mechanically Ventilated Buildings at City-Scale in Hong Kong across Seasons. Environ. Sci. Technol. 2020, 54, 11732–11743. [Google Scholar] [CrossRef]
- Degois, J.; Simon, X.; Clerc, F.; Bontemps, C.; Leblond, P.; Duquenne, P. One-Year Follow-up of Microbial Diversity in Bioaerosols Emitted in a Waste Sorting Plant in France. Waste Manag. 2021, 120, 257–268. [Google Scholar] [CrossRef]
- Liu, M.; Nobu, M.K.; Ren, J.; Jin, X.; Hong, G.; Yao, H. Bacterial Compositions in Inhalable Particulate Matters from Indoor and Outdoor Wastewater Treatment Processes. J. Hazard. Mater. 2020, 385, 121515. [Google Scholar] [CrossRef]
- Pollegioni, P.; Mattioni, C.; Ristorini, M.; Occhiuto, D.; Canepari, S.; Korneykova, M.V.; Gavrichkova, O. Diversity and Source of Airborne Microbial Communities at Differential Polluted Sites of Rome. Atmosphere 2022, 13, 224. [Google Scholar] [CrossRef]
- Cheng, X.; Xiang, X.; Yun, Y.; Wang, W.; Wang, H.; Bodelier, P.L.E. Archaea and Their Interactions with Bacteria in a Karst Ecosystem. Front. Microbiol. 2023, 14, 1068595. [Google Scholar] [CrossRef]
- Jia, A.; Yancheng, L.; Yang, L.; Xiong, Z.; Jiang, L.; Aijiang, Y. Study on Microbes and Antibiotic Resistance Genes in Karst Primitive Mountain Marshes—A Case Study of Niangniang Mountain in Guizhou, China. Ecotoxicol. Environ. Saf. 2022, 247, 114210. [Google Scholar] [CrossRef]
- Hanson, B.; Zhou, Y.; Bautista, E.J.; Urch, B.; Speck, M.; Silverman, F.; Muilenberg, M.; Phipatanakul, W.; Weinstock, G.; Sodergren, E.; et al. Characterization of the Bacterial and Fungal Microbiome in Indoor Dust and Outdoor Air Samples: A Pilot Study. Environ. Sci. Process. Impacts 2016, 18, 713–724. [Google Scholar] [CrossRef]
- Houtman, T.A.; Eckermann, H.A.; Smidt, H.; De Weerth, C. Gut Microbiota and BMI throughout Childhood: The Role of Firmicutes, Bacteroidetes, and Short-Chain Fatty Acid Producers. Sci. Rep. 2022, 12, 3140. [Google Scholar] [CrossRef]
- Mariat, D.; Firmesse, O.; Levenez, F.; Guimarăes, V.; Sokol, H.; Doré, J.; Corthier, G.; Furet, J.-P. The Firmicutes/Bacteroidetes Ratio of the Human Microbiota Changes with Age. BMC Microbiol. 2009, 9, 123. [Google Scholar] [CrossRef]
- Oliva, G.G.J.; Itzel, L.O.I.; Lizeth, R.M.I.; Alejandra, M.H.; Antonio, E.F.J.; Claudia, M.Y. Relationship Among Blastocystis, the Firmicutes/Bacteroidetes Ratio and Chronic Stress in Mexican University Students. Curr. Microbiol. 2022, 79, 72. [Google Scholar] [CrossRef]
- Zhang, S.; Liang, Z.; Wang, X.; Ye, Z.; Li, G.; An, T. Bioaerosols in an Industrial Park and the Adjacent Houses: Dispersal between Indoor/Outdoor, the Impact of Air Purifier, and Health Risk Reduction. Environ. Int. 2023, 172, 107778. [Google Scholar] [CrossRef]
- Ruiz-Gil, T.; Acuña, J.J.; Fujiyoshi, S.; Tanaka, D.; Noda, J.; Maruyama, F.; Jorquera, M.A. Airborne Bacterial Communities of Outdoor Environments and Their Associated Influencing Factors. Environ. Int. 2020, 145, 106156. [Google Scholar] [CrossRef]
- Mishra, A.K.; Gimenez, G.; Lagier, J.-C.; Robert, C.; Raoult, D.; Fournier, P.-E. Genome Sequence and Description of Alistipes Senegalensis Sp. Nov. Stand. Genom. Sci. 2012, 6, 304–314. [Google Scholar] [CrossRef]
- Porter, N.T.; Luis, A.S.; Martens, E.C. Bacteroides Thetaiotaomicron. Trends Microbiol. 2018, 26, 966–967. [Google Scholar] [CrossRef]
- Lara-Taranchenko, Y.; Corona, P.S.; Rodríguez-Pardo, D.; Salmerón-Menéndez, P.; Ciurans, M.V.; García-Martínez, M.C.; Calderer, L.C. Prosthetic Joint Infection Caused by an Atypical Gram-Negative Bacilli: Odoribactersplanchnicus. Anaerobe 2023, 82, 102740. [Google Scholar] [CrossRef]
- Shin, Y.; Lee, B.-H.; Lee, K.-E.; Park, W. Pseudarthrobacter Psychrotolerans Sp. Nov., a Cold-Adapted Bacterium Isolated from Antarctic Soil. Int. J. Syst. Evol. Microbiol. 2020, 70, 6106–6114. [Google Scholar] [CrossRef]
- Meadow, J.F.; Altrichter, A.E.; Kembel, S.W.; Kline, J.; Mhuireach, G.; Moriyama, M.; Northcutt, D.; O’Connor, T.K.; Womack, A.M.; Brown, G.Z.; et al. Indoor Airborne Bacterial Communities Are Influenced by Ventilation, Occupancy, and Outdoor Air Source. Indoor Air 2014, 24, 41–48. [Google Scholar] [CrossRef]
- Shin, S.-K.; Kim, J.; Ha, S.; Oh, H.-S.; Chun, J.; Sohn, J.; Yi, H. Metagenomic Insights into the Bioaerosols in the Indoor and Outdoor Environments of Childcare Facilities. PLoS ONE 2015, 10, e0126960. [Google Scholar] [CrossRef]
- Kuo, V.; Shoemaker, W.R.; Muscarella, M.E.; Lennon, J.T. Whole-Genome Sequence of the Soil Bacterium Micrococcus Sp. KBS0714. Genome Announc. 2017, 5, e00697-17. [Google Scholar] [CrossRef]
- Luca, F.; Donatella, C.; Antonio, Z.; Filomena, L.; Aurelio, B.S.; Laura, S.; Andrés, S.; Serge, C.; Monica, B. Comparison of Sunlight-AOPs for Levofloxacin Removal: Kinetics, Transformation Products, and Toxicity Assay on Escherichia coli and Micrococcus flavus. Environ. Sci. Pollut. Res. Int. 2022, 29, 58201–58211. [Google Scholar] [CrossRef]
- Chen, H.; Liu, Y.; Huang, K.; Yang, B.; Zhang, Y.; Yu, Z.; Wang, J. Fecal Microbiota Dynamics and Its Relationship to Diarrhea and Health in Dairy Calves. J. Anim. Sci. Biotechnol. 2022, 13, 132. [Google Scholar] [CrossRef]
- Davies, M.; Galazzo, G.; van Hattem, J.M.; Arcilla, M.S.; Melles, D.C.; de Jong, M.D.; Schultsz, C.; Wolffs, P.; McNally, A.; Schaik, W.V.; et al. Enterobacteriaceae and Bacteroidaceae Provide Resistance to Travel-Associated Intestinal Colonization by Multi-Drug Resistant Escherichia coli. Gut Microbes 2022, 14, 2060676. [Google Scholar] [CrossRef]
- Vacca, M.; Celano, G.; Calabrese, F.M.; Portincasa, P.; Gobbetti, M.; De Angelis, M. The Controversial Role of Human Gut Lachnospiraceae. Microorganisms 2020, 8, 573. [Google Scholar] [CrossRef]
- Odeberg, G.; Bläckberg, A.; Sunnerhagen, T. Infection or Contamination with Rothia, Kocuria, Arthrobacter and Pseudoglutamicibacter—A Retrospective Observational Study of Non-Micrococcus Micrococcaceae in the Clinic. J. Clin. Microbiol. 2023, 61, e01484-22. [Google Scholar] [CrossRef]
- Sassone-Corsi, M.; Nuccio, S.-P.; Liu, H.; Hernandez, D.; Vu, C.T.; Takahashi, A.A.; Edwards, R.A.; Raffatellu, M. Microcins Mediate Competition among Enterobacteriaceae in the Inflamed Gut. Nature 2016, 540, 280–283. [Google Scholar] [CrossRef]
- Hatayama, K.; Oikawa, Y.; Ito, H. Bacterial Community Structures in Air Conditioners Installed in Japanese Residential Buildings. Antonie Van Leeuwenhoek 2018, 111, 45–53. [Google Scholar] [CrossRef]
- Erb, S.; D’Mello-Guyett, L.; Malebo, H.M.; Njee, R.M.; Matwewe, F.; Ensink, J.; Hinic, V.; Widmer, A.; Frei, R. High Prevalence of ESBL-Producing E. coli in Private and Shared Latrines in an Informal Urban Settlement in Dar Es Salaam, Tanzania. Antimicrob. Resist. Infect. Control. 2018, 7, 3. [Google Scholar] [CrossRef]
Disclaimer/Publisher’s Note: The statements, opinions and data contained in all publications are solely those of the individual author(s) and contributor(s) and not of MDPI and/or the editor(s). MDPI and/or the editor(s) disclaim responsibility for any injury to people or property resulting from any ideas, methods, instructions or products referred to in the content. |
© 2024 by the authors. Licensee MDPI, Basel, Switzerland. This article is an open access article distributed under the terms and conditions of the Creative Commons Attribution (CC BY) license (https://creativecommons.org/licenses/by/4.0/).