Abstract
This study aims to examine the particle number (PN) emissions of a retrofitted heavy-duty spark ignition (HD-SI) engine powered by liquefied petroleum gas (LPG) under both steady-state and transient conditions. The engine was tested under seven steady-state operating points to investigate the PN behavior and particle size distribution (PSD) upstream and downstream of the three-way catalyst (TWC). This analysis intends to assess the impact of including particles with diameters ranging from 10 nm to 23 nm on the total particle count, a consideration for future regulations. The study employed the World Harmonized Transient Cycle (WHTC) for transient conditions to encompass the same engine working region as is used in the steady-state analysis. A Dekati FPS-4000 diluted the exhaust sample to measure the PSD and PN for particle diameters between 5.6 nm and 560 nm using the TSI-Engine Exhaust Particle Sizer (EEPS) 3090. The findings indicate that PN levels tend to increase downstream of the TWC under steady-state conditions in operating points with low exhaust gas temperatures and flows (equal to or less than 500 °C and 120 kg/h). Furthermore, the inclusion of particles with diameters between 10 nm and 23 nm leads to an increase in PN emissions by 17.70% to 40.84% under steady conditions and by an average of 40.06% under transient conditions, compared to measurements that only consider particles larger than 23 nm. Notably, in transient conditions, most PN emissions occur during the final 600 s of the cycle, linked to the most intense phase of the WHTC.
1. Introduction
Technological advancements in key sectors like agriculture, manufacturing, and transportation have significantly improved global quality of life in recent decades. Yet, the dependency on non-renewable energy sources to fulfill the energy demands of these industries has led to several environmental issues worldwide [1]. The rise in carbon dioxide (CO2) emissions and other greenhouse gases, mainly from burning fossil fuels, has resulted in a temperature increase per decade of 0.34 °C in North America, 0.25 °C in South America, 0.47 °C in Europe, 0.28 °C in Africa, 0.41 °C in Asia, 0.19 °C in Oceania, and 0.02 °C in Antarctica since 1982 [2]. Additionally, urban air pollution was linked to nearly six and seven million premature deaths in 2019 [3]. The transportation sector, in particular, is a major source of urban air pollution, contributing to 56% of carbon monoxide (CO) emissions, 44% of nitrogen oxides (NOx), 31% of unburned hydrocarbons (UHC) [4], and 41% of ultrafine particle numbers (PN) [5], whose formation includes stages like pyrolysis, nucleation, coagulation agglomeration, and oxidation [6], which at the same time are affected by interactions with the environment when the particles are flowing in the near-wall region, as well as in the whole flow field [7]. In response, governments worldwide have established regulations to limit emissions from combustion engines in vehicles using standards like the Euro for the European Union, EPA for the USA, PNLT for Japan, BSES for India, and China for China [8].
In response, the automotive industry has adapted to legislative requirements and developed various strategies to minimize the environmental impact of propulsion systems as a response to the standards implemented worldwide to reduce pollutant emissions. These strategies include optimizing fuel injection [9] and air management systems [10], using pre-chamber devices [11], introducing innovative piston geometries [12], and applying zero-dimensional models of the combustion process [13] to reduce pollutant formation. Despite the success of these measures in lowering emissions, stringent emission thresholds necessitate the use of advanced aftertreatment systems (ATS) to meet regulatory limits before exhaust gases are released into the environment [14]. Furthermore, the industry is exploring using low-carbon and cleaner-burning alternative fuels like ethanol, methanol, and LPG [15], with a special interest in carbon-free fuels like hydrogen [16]. In this context, retrofitting old engines to operate on low-carbon fuels is a medium-term solution during the energy transition [17]. This approach first reduces the environmental impact associated with the production of new engines [18] and, secondly, reduces CO2 emissions, which are directly related to the carbon content of the fuel [19].
The current standard employed in Europe to regulate emissions of heavy-duty (HD) engines is the Euro VI, and one version of Euro VII has been proposed recently [14]. Euro VII implementation will have aspects designed to make current limits for allowed levels of CO, UHC, and NOx emission more restrictive, implementing NH3 and N2O regulations in specific emissions and keeping the limit for PN emission, but assessing them from particles larger than 10 nm [11]. Specifically, PN assessment in a new measurement range may involve changes in the experimental setup regarding the exhaust treatment based on the volatile particles remover (VPR), whose work is to dilute the sample and delete volatile particles before transferring the sample to a particle counter according to the Particle Measurement Program (PMP) protocol, which established three components for the VPR: (i) a hot diluter allowing dilution of at least 10:1 at temperatures above 150 °C, (ii) an evaporation tube maintained at a fixed wall temperature between 300 °C and 400 °C, and (iii) a second diluter operating at ambient temperature to cool down the thermally treated sample, and at the same time further reduce the vapor pressures of the evaporated material, so as to reduce the risk of homogeneous nucleation [20].
Among the main aspects to be considered for the VPR system is the use of new configurations applying an evaporation tube (ET), catalysts stripper (CS), or thermodenuder to remove volatiles from the exhaust gas sample based on combustion aerosols made up of hydrocarbons such as C7H8 and C10H22 [21], with others in the range C24-C40 as representative compounds of unburned oil, as well as sulfur oxides like SO2 and SO3 [22] that are promoters of the formation of volatile particles in exhaust emissions from gasoline and diesel engines. Tests have been performed both in laboratories and vehicles, with the objective of improving the performance of the measurement system and methodology. These results have demonstrated how the CS is a device that effectively oxidizes UHC and traps sulfur oxides, resulting in lower levels of, or zero, volatile particle nucleation with respect to the evaporation tubes currently employed in the PMP protocol [23]. For this reason, the use of catalyzed tubes is currently recommended when measuring particle sizes above 23 nm, without being mandatory, while for the measurement of particles above 10 nm, the use is specified as mandatory by the Global Technical Regulation (GTR) 15 [24], which would imply that Euro VII will also make it mandatory during type approval testing.
Regarding using alternative fuels as a medium- and short-term solution, CNG and LPG can be implemented in the operation of retrofitted spark-ignition (SI) engines. The viability of this application arises from the adaptability of conventional gasoline engines to utilize either CNG or LPG with minimal modifications [25], resulting in a reduction in CO2 emissions due to the high hydrogen/carbon ratio inherent in both fuels [26], and the temperatures during combustion of these fuels are relatively lower than those of conventional petrol combustion, which translates into lower NOx and PN emissions [27]. All these aspects led the automobile and gas industries to affirm that CNG-powered engines do not contaminate the air with toxic particles, as diesel and gasoline do. However, studies carried out by the scientific community have focused explicitly on the PN emission of these engines [28], demonstrated their high PN emission, and made more recent regulations, such as Euro VI, which will begin to regulate PM and PN emissions in engines powered by gaseous fuels, highlighting the PFs’ importance for this type of engine [29].
From this perspective, Napolitano et al. [30] conducted a comparative analysis of PN emissions in an HD engine powered by CNG and LPG under cold and hot start transient conditions for particles with diameters between 23 nm and 1000 according to the Euro VI protocol, highlighting that PN emissions were comparable for both fuels, with the highest emission in particles with diameters between 80 and 120 nm and lower emission of particles below 23 nm. However, Toumasatos et al. [31] focused on analyzing PN emissions with diameters from 10 nm and 23 nm using a dual-fuel vehicle (CNG/gasoline) equipped with a three-way catalyst (TWC), finding that its operations result in substantially lower PN emissions compared to gasoline during both steady-state and transient tests, finding that PN from 23 nm only presents a 43% of PN from 10 nm with a reduced difference between both fuels in this measuring range, which means that research focused on this measuring range will be relevant for gaseous fuels as well. Finally, other studies, such as that conducted by Lähde and Giechaskiel [32], have compared PN emissions of 23 nm, 10 nm, and 4 nm in vehicles powered by bi-fuel systems (CNG/gasoline or LPG/gasoline) at various ambient temperatures. They concluded that PN emission depends on the vehicle type, with PN emission from gasoline being 100 times higher than from gaseous fuels, followed by CNG, whose emissions were 2 and 10 times higher than LPG. In contrast, LPG emissions were lower in all conditions assessed.
Moreover, other studies have been focused on studying the effects of ATS on PN emissions. Ditaso et al. [33] investigated the changes in soot PN, mass, and particle size distribution (PSD) throughout the exhaust line of an HD engine powered by CNG. Their investigation revealed that PN varies along the exhaust line, influenced by exhaust properties such as temperature and composition, as well as the presence of ATS devices. These variations are attributed to competing processes, including fragmentation, agglomeration, oxidation, and vaporization. Napolitano et al. [34] explored the PN and PSD in an HD engine fueled by natural gas, aiming to evaluate the benefits of different catalyzed particle filters and their potential compliance with the forthcoming EURO VII regulations. Their findings suggest that such filters could be a promising technology for meeting future PN emissions standards.
Therefore, the present work focused on analyzing PN emissions during both steady-state and dynamic operating conditions of an HD engine fueled with LPG in order to characterize such emissions for this specific fuel and define the impact of measuring the range from 10 nm, which has not been studied previously. All of the above was conducted by employing a system for VPR and sample dilution according to the PMP protocol, as the studies conducted so far have been based on promotors of volatile particle formation with a high carbon (upper than C7) and sulfur content that are not present in the LPG composition. Firstly, seven steady-state modes with different speeds and torque were selected based on the temperature at the inlet of a TWC, aiming to analyze the effects of engine operating parameters and the catalyst on PN emissions. To achieve this, particle size distribution (PSD) upstream and downstream of the TWC and PN concentrations downstream of the catalyst were compared and measured from 23 nm (current Euro VI standard) and 10 nm (proposed Euro VII standard) [11]. A statistical analysis using the p-value was employed to determine the relationship between engine speed, torque, and PN emissions, along with the numerical concentration changes due to TWC usage. Lastly, the WHTC cycle was used to assess the impact of dynamic changes in engine operation on PN emissions and the geometric mean diameter (GMD) as a function of engine load, considering measurement ranges from 23 nm and 10 nm during the homologation cycle. The findings offer significant insights into the regulatory and environmental implications of modifying the measurement threshold, contributing to a deeper understanding of emission characteristics under various operational scenarios.
2. Materials and Methods
The research utilized a V8-cylinder engine with a total displacement of 7.2 L. This engine has two cylinder banks with independent exhaust lines. The engine meets the Euro VI standards when it is powered by LPG with a propane content of around 90%, and it is equipped with an ATS comprising a TWC and a particle filter in each of the exhaust lines, as previously demonstrated by Bermudez et al. [35]. The experimental setup employed was identical to that described in [17], which was focused on analyzing gaseous raw emissions from the engine and TWC performance, measuring the exhaust composition upstream and downstream of the catalyst. Table 1 presents the main characteristics of the engine regarding power, torque, injection system, number of cylinders, and TWC characteristics.

Table 1.
Main characteristics of the engine.
The main properties of the LPG are presented in Table 2. LPG composition is commonly employed in the US in the automotive sector and some European countries during the winter season according to the fuel blends regulated by the normative EN 589 [36].
Table 2.
Properties of the LPG.
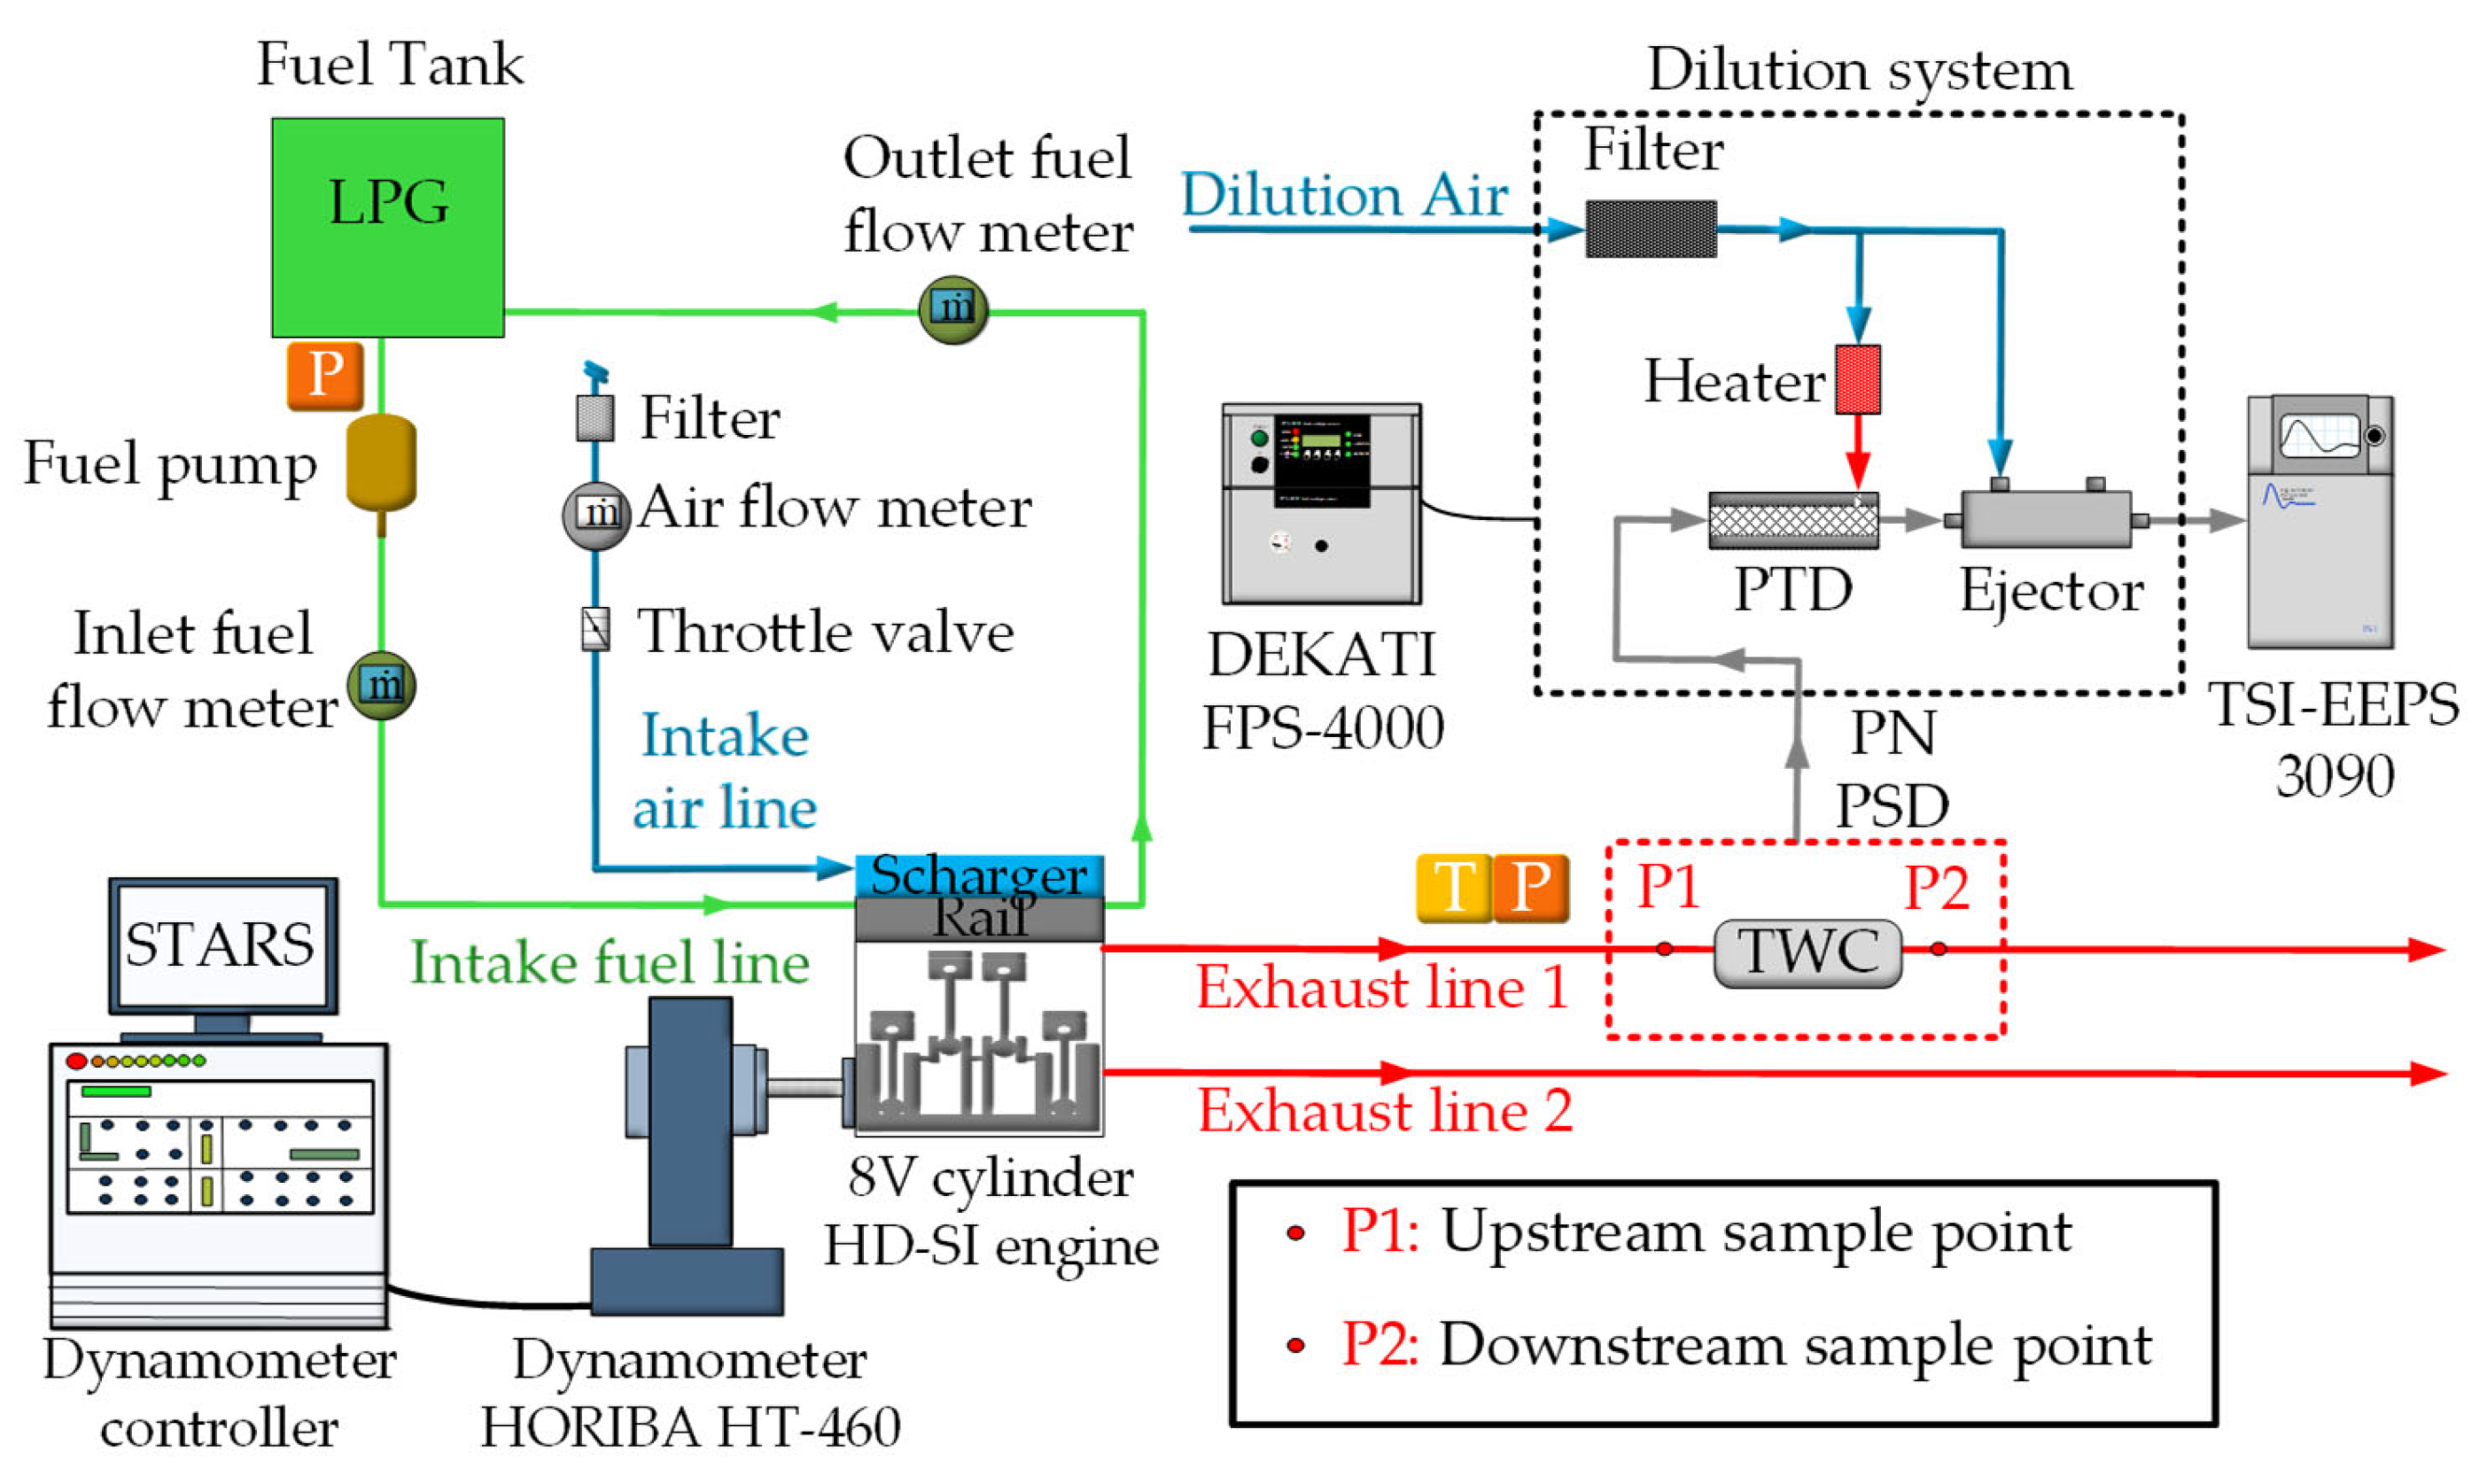
Figure 1 shows the experimental setup used during the tests. The engine was connected and controlled using a Horiba HT-460 dynamometer, which allows for the instant control of engine speed and torque using the STARS software V 1.9.48.617. The fuel was supplied to the port injection system with a line that connects the fuel tank with the engine inlet. Another line diverts unused fuel from the engine back to the fuel tank. The fuel consumption is calculated using two flowmeters, one arranged upstream of the engine and the other downstream. Likewise, a parallel line equipped with a flow meter supplied air to the engine. The engine features two exhaust lines, each corresponding to a cylinder bank. A TWC is installed within one of these lines. Additionally, two sampling points facilitate the measurement of PN and PSD both upstream (P1) and downstream (P2) of the catalyst.
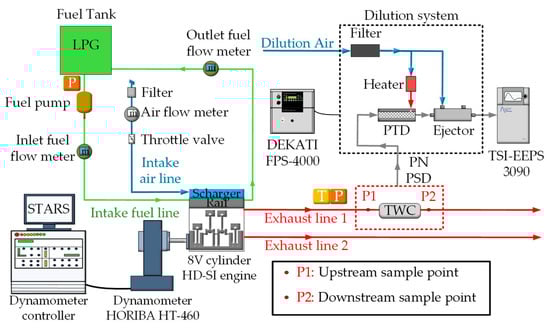
Figure 1.
Experimental setup.
Two devices were employed sequentially to measure the PN concentration. Firstly, a partial dilution mini-tunnel DEKATI FPS-4000 served as the exhaust gas sample conditioning system before introduction into the measuring equipment. Secondly, a TSI-EEPS 3090 spectrometer was utilized to measure the particle concentration of the sample.
It is essential to highlight that one of the main focuses in measuring engine-emitted PN is the precision of the measuring instrument. In this regard, the most accurate option is the condensation particle counters (CPC) used in combustion engine homologation. However, these instruments provide a total concentration without discretizing particle sizes. For this reason, instruments like the scanning mobility particle sizer (SMPS) are used in research settings because they allow PSD analysis with good precision, albeit with the disadvantage of the time required to perform the measurement (90 s). On the other hand, devices like the EEPS measure the PSD with a higher frequency (1 s), but with lower precision, than the SMPS, as outlined in the TSI report [37].
This report also summarizes some authors’ views regarding implementing inversion matrices in the EEPS to reduce discrepancies between measurements taken by both devices. In some cases, the EEPS has underestimated concentrations, especially in particles with diameters larger than 75 nm, resulting in differences of up to 40% between the measurements of both devices. Therefore, it is clarified that we did not employ any of those inversion matrices in our experimental campaign. Instead, we followed the methodology of Desantes et al. [38], who compared EEPS measurements with those of the SMPS, and observed that the difference between both devices for internal combustion engines did not exceed 10% under low, medium, and high engine load conditions.
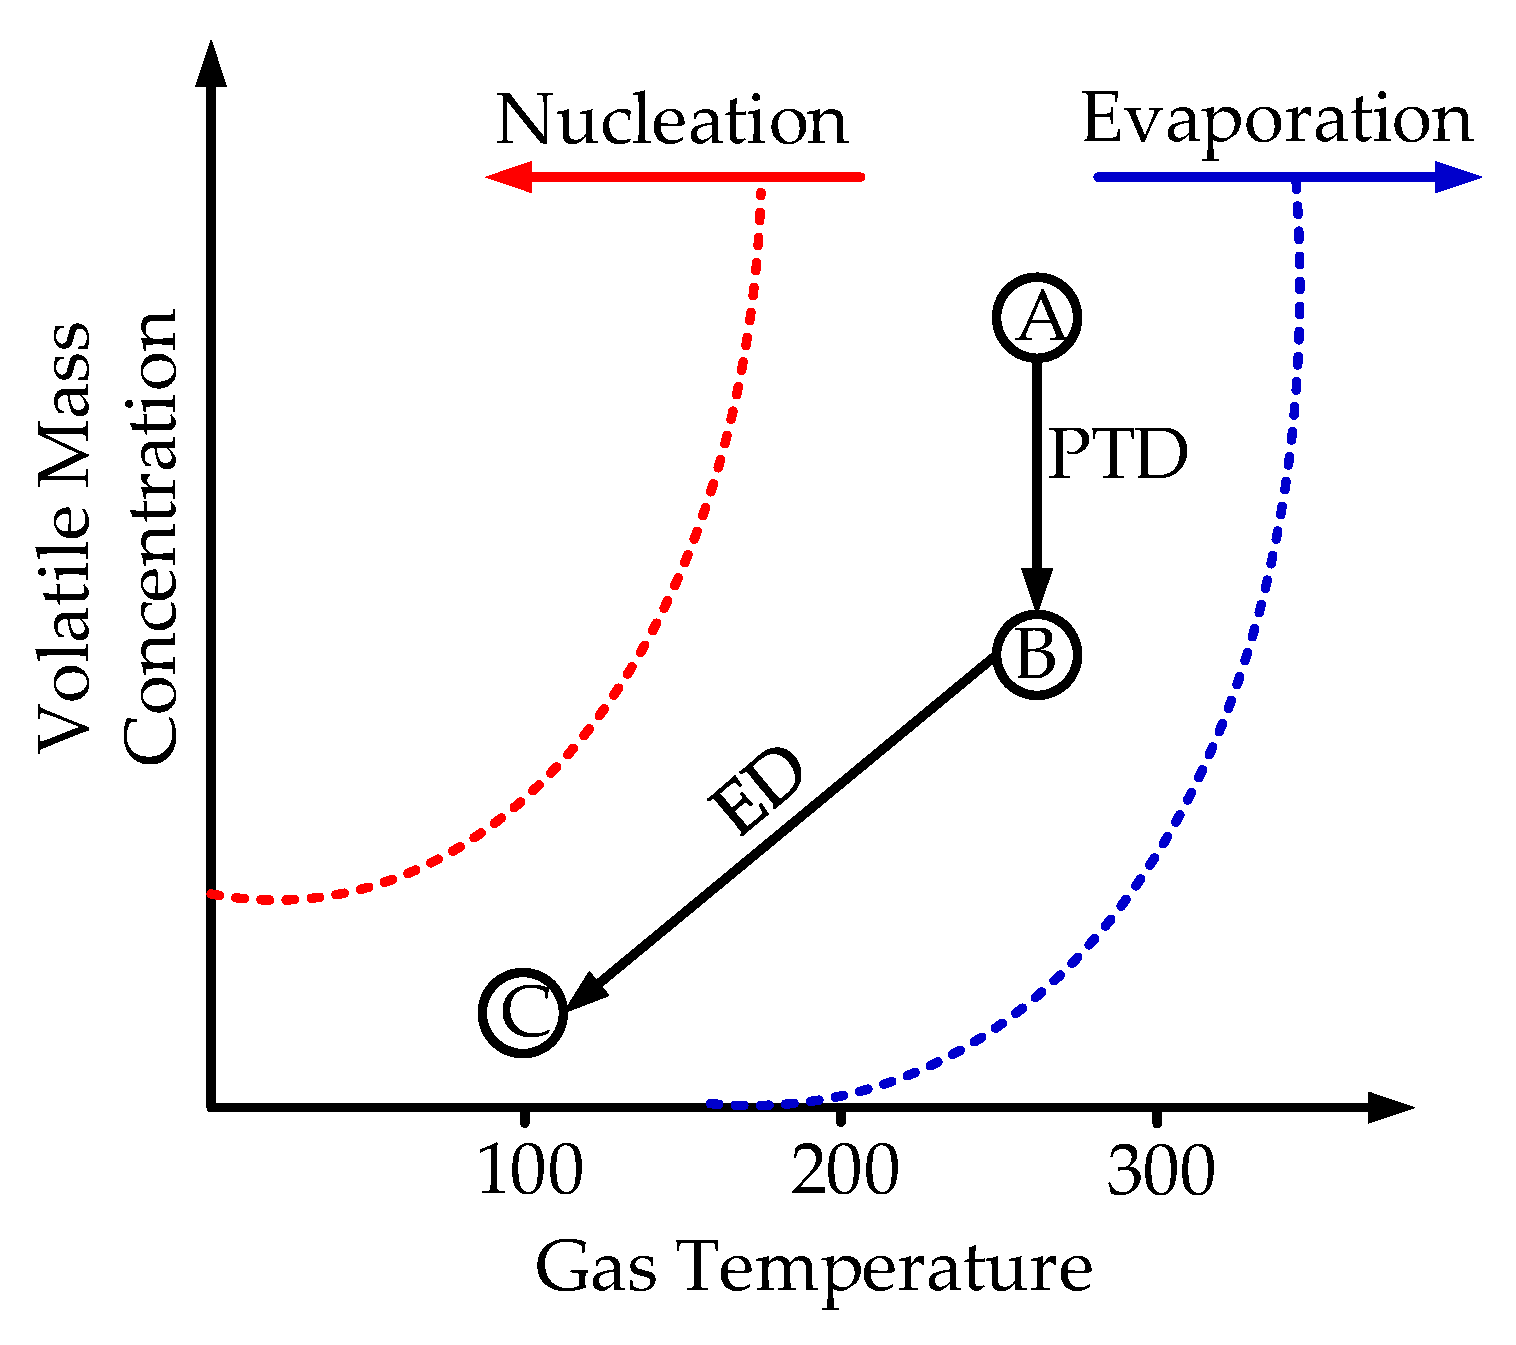
In addition, the measurement of PSD is greatly influenced by the conditions under which the exhaust gas is diluted, and it may result in the generation of new particles or the removal of existing ones. The methodology developed by Desantes [38] and used later by Campos [39] for exhaust gas sampling was followed. Figure 2 illustrates the path taken by the exhaust gas sample from the entry to the exit of the dilution system. Initially, the primary dilution temperature was selected to be similar to the exhaust gas temperature at the sampling point, allowing an isothermal reduction with the extracted gas sample (from A to B in Figure 2) meeting with a dilution air temperature higher than 150 °C, as established in the PMP protocol conditions, with a heater system employed for heating the PTD walls at 350 °C and reducing the volatile material without a CS, because our experimental setup was based on the PMP protocol and the CS has been demonstrated to be helpful in exhausts where the volatile material is composed of C7 or a higher content of carbon and sulfur oxides [23], which are not present in the LPG used. Subsequently, in the ejector, the air gas is mixed with a second dilution at ambient temperature to reduce the sample temperature and particle concentration (from B to C in Figure 2). At this point, the sample is conditioned to be introduced into the EEPS 3090.

Figure 2.
Theoretical phase diagram of the aerosol at the different stages of the dilution system.
Table 3 presents a detailed overview of the main features of all instrumentation used in the experimental facility regarding the pressure and temperature sensors, air mass flow and fuel mass flows, asynchronous brake torque, and PN concentration, with their respective measure range and sensitivity.
Table 3.
Characteristics of facility instrumentation.
The TSI-EEPS employs 32 channels to measure PN concentration simultaneously, covering a range from 5.6 nm to 560 nm, and all measurements were included in the particle size distribution (PSD) results. The default matrix was used to quantify the PN concentration due to numerous studies reporting insignificant discrepancies in PN measurements of particles with diameters below 75 nm between the EEPS and other spectrometers, such as the scanning mobility particle sizer (SMPS) [37,40,41]. However, the SMPS has a longer response time than the EEPS, which poses a challenge for studies focusing on transient analysis—a key aspect of the current study.
The total PN concentration was calculated using Equation (1), which is a sum of concentrations measured by each channel according to the measured range used for the analysis. In this study, two different measured ranges were used. The first one (PN23) was calculated using Equation (1), applied to the channel with an average diameter of 22.1 nm as dp(lower) and to the channel with an average diameter of 523.30 nm as dp(upper). In contrast, the second one (PN10) was calculated using Equation (1), ranging from the channel with an average diameter of 10.8 nm as dp(lower) to the channel with an average diameter of 523.30 nm as dp(upper), according to the methodology described in Seinfeld and Pandis [42] for the calculation of PN concentration.
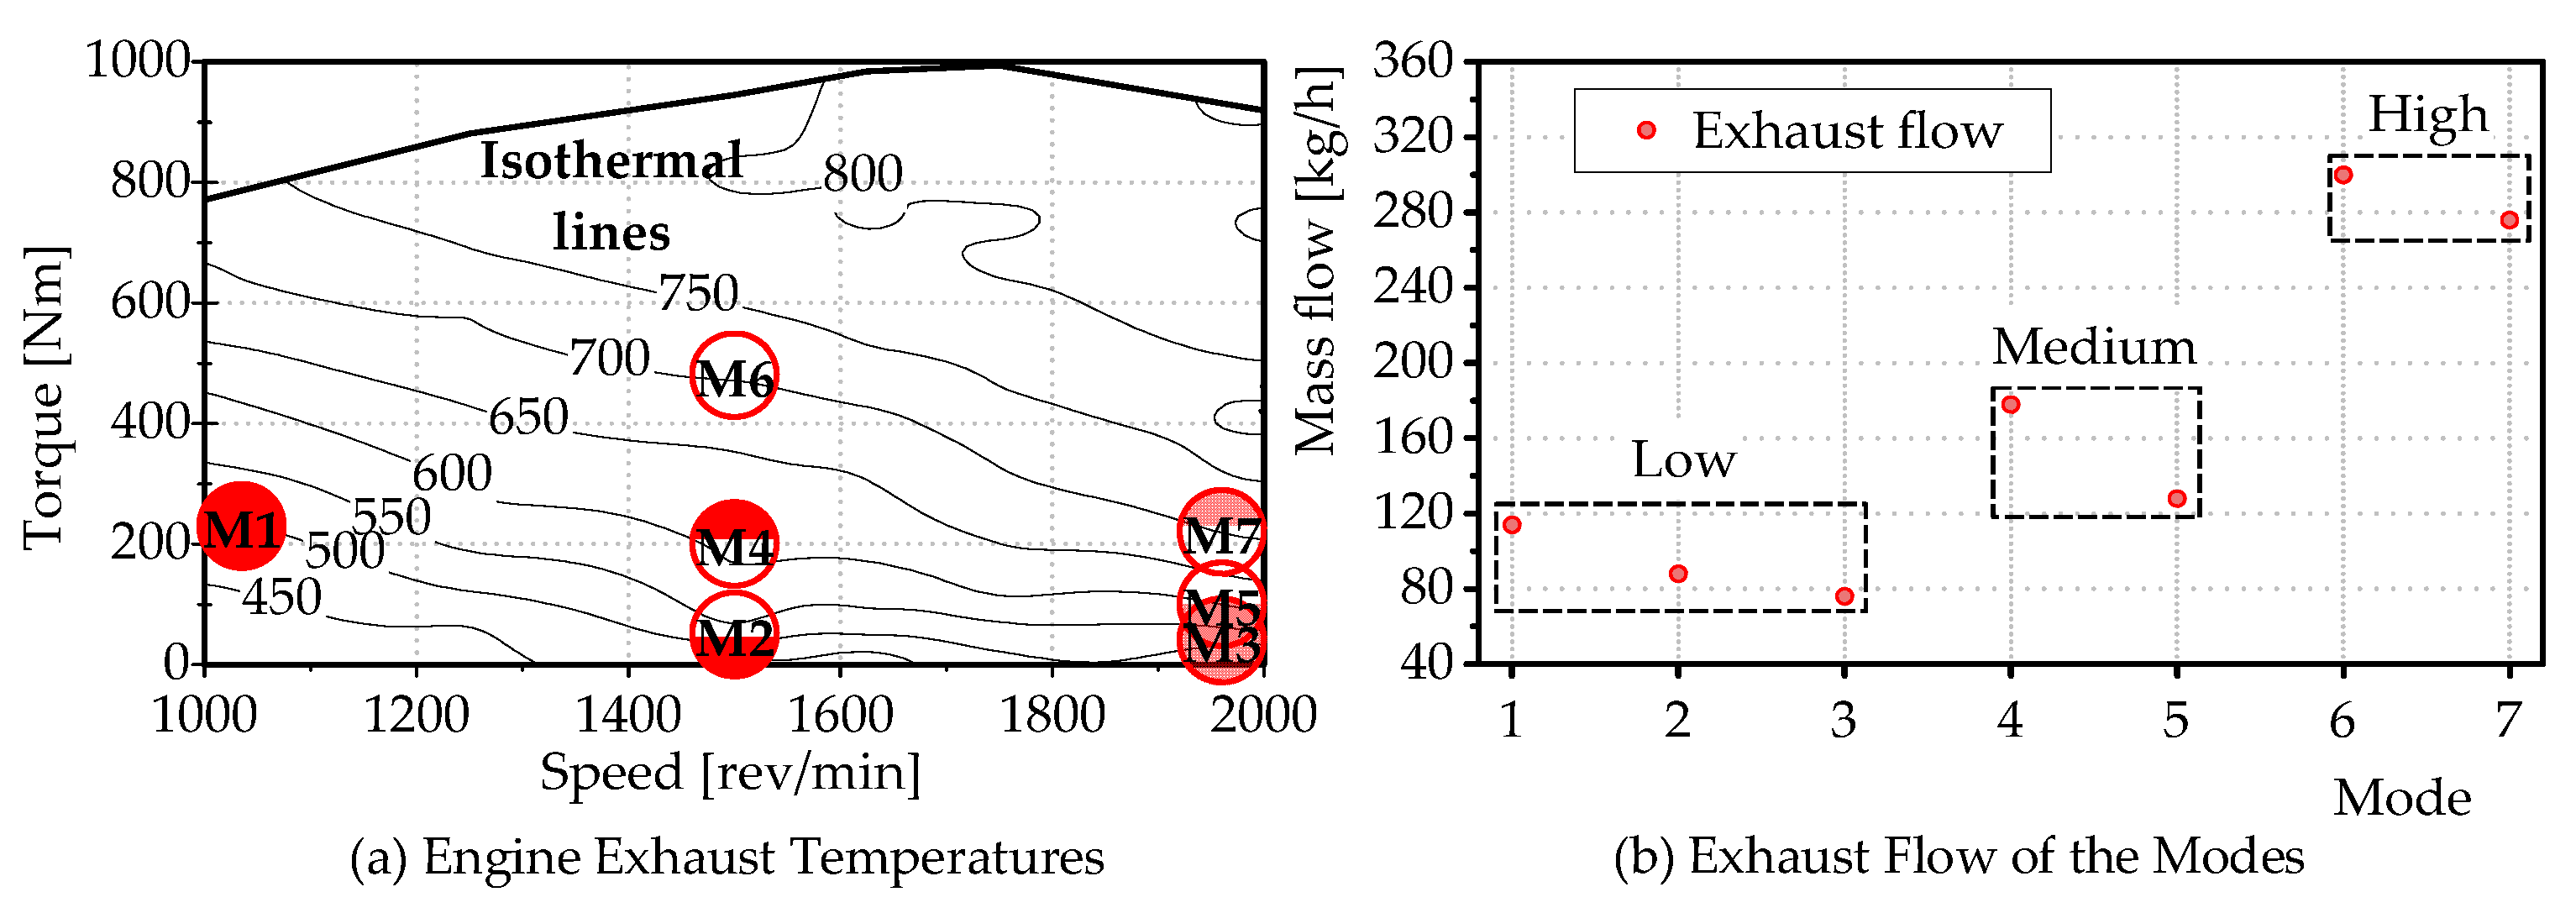
The experiments conducted had two main focuses. The first focused on analyzing PN emissions under steady-state engine operating conditions, while the second focused on dynamic conditions. The steady-state analysis employed seven steady-state modes, which were selected based on the temperature map at the inlet of the TWC concerning engine speed and torque. The selection criterion for the modes focused on obtaining representative temperature values for the catalyst (between 500 °C and 700 °C) and a wide range of engine speeds (between 1000 rpm and 2000 rpm). For this reason, engine speeds of 1000 rpm, 1500 rpm, and 2000 rpm were selected, adjusting the engine torque to achieve isothermal conditions (500 °C, 600 °C, and 700 °C) in some of the modes, allowing for grouping them according to operating parameters and reducing sources of uncertainty. Figure 3a presents an engine map of exhaust temperature at the TWC inlet as a function of the engine speed and torque, with their respective isothermal lines, and Figure 3b presents the exhaust gas flow for each mode grouped into three groups according to their values—low, medium, and high exhaust flows.

Figure 3.
Parameters of the steady-state modes. (a) Engine exhaust temperature as a function of the engine speed and torque with the location of each mode; (b) exhaust flow for each mode.
The operating modes were stabilized for ten minutes before measuring the PN concentration to guarantee steady-state conditions regarding the engine, ATS, and dilution system. The PN concentration was measured three times for 60 s to take the average values between the three samples, and the EEPS measured all particle sizes with a frequency of 1 Hz. All measured channels were considered for the PSD analysis, and concentrations from 22.1 nm to 560 nm (PN23) and 10.8 nm to 560 nm (PN10) were calculated using Equation (2) as a function of PN concentration (PN23 or PN10), exhaust mass flow (ṁ), and exhaust density (ρ). Additionally, Equation (3) was used to calculate the PN increase (%PNT) when PN was measured from 10 nm instead of 23 nm.
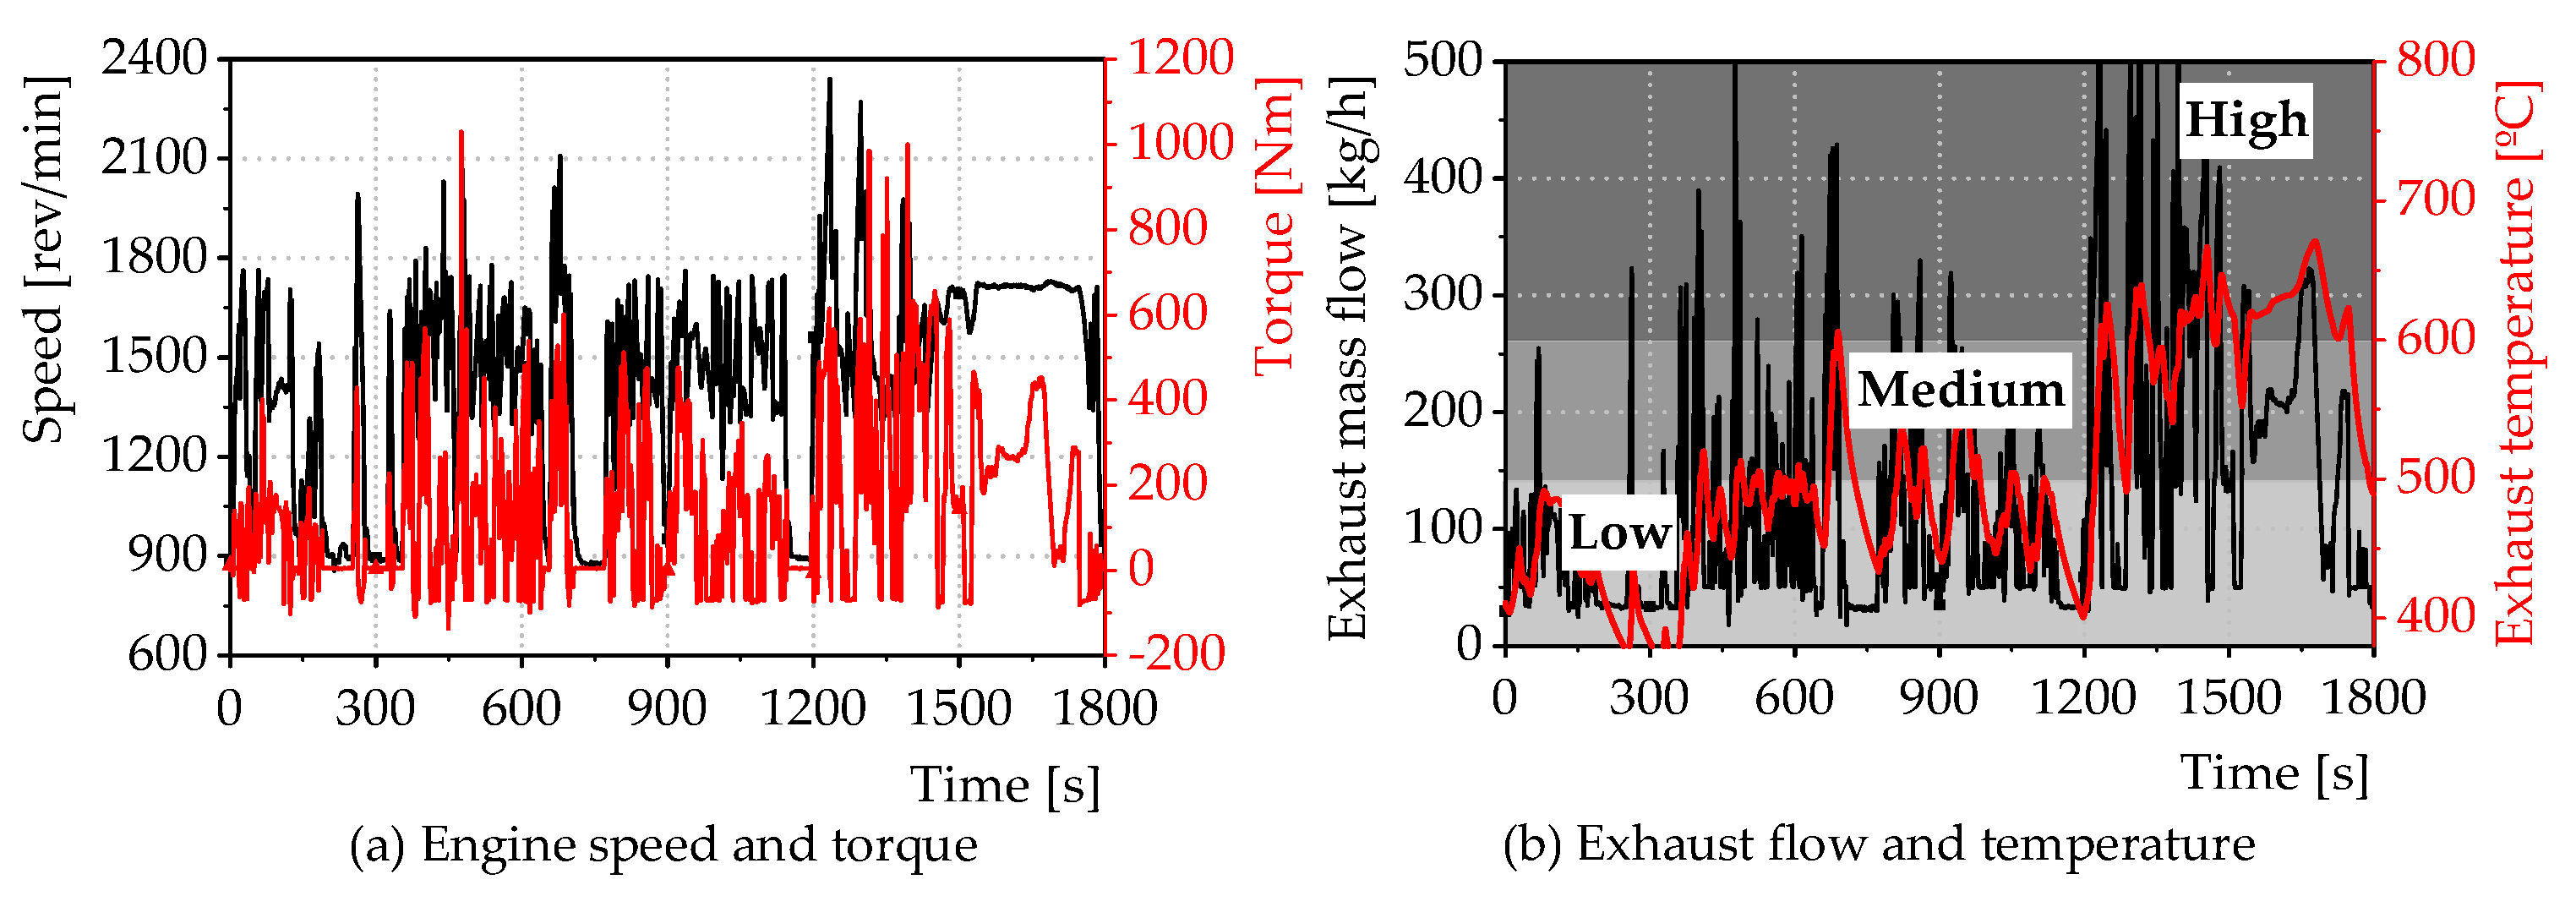
The transient conditions were established based on the homologation cycle WHTC to define the engine speed and torque profiles shown in Figure 4a; the duration of this cycle has to be 1800 s, according to Euro VI standards, and the engine top load was limited to 50% to analyze the same work region of the engine that was employed for the analysis under steady-state conditions. Figure 4b shows the three regions of the cycle, reflecting low, medium, and high values of engine exhaust flow and temperature. The analysis quantified the specific PN concentration in units of #/kWh, employing Equation (4). This calculation was based on the PN emissions and engine work (W) over a duration of 1800 s, aligning with Euro VI standards for evaluating engines in HD applications.

Figure 4.
Parameters of the transient conditions.
Additionally, the geometric mean diameter (GMD) was also calculated using Equation (5) to conduct a transient analysis of PN emission during the WHTC homologation cycle, because this parameter allows for analyzing the global behavior of PN emissions and defining their relationship with engine load changes and the effects of measuring PN23 and PN10.
3. Results and Discussion
3.1. Steady-State Conditions
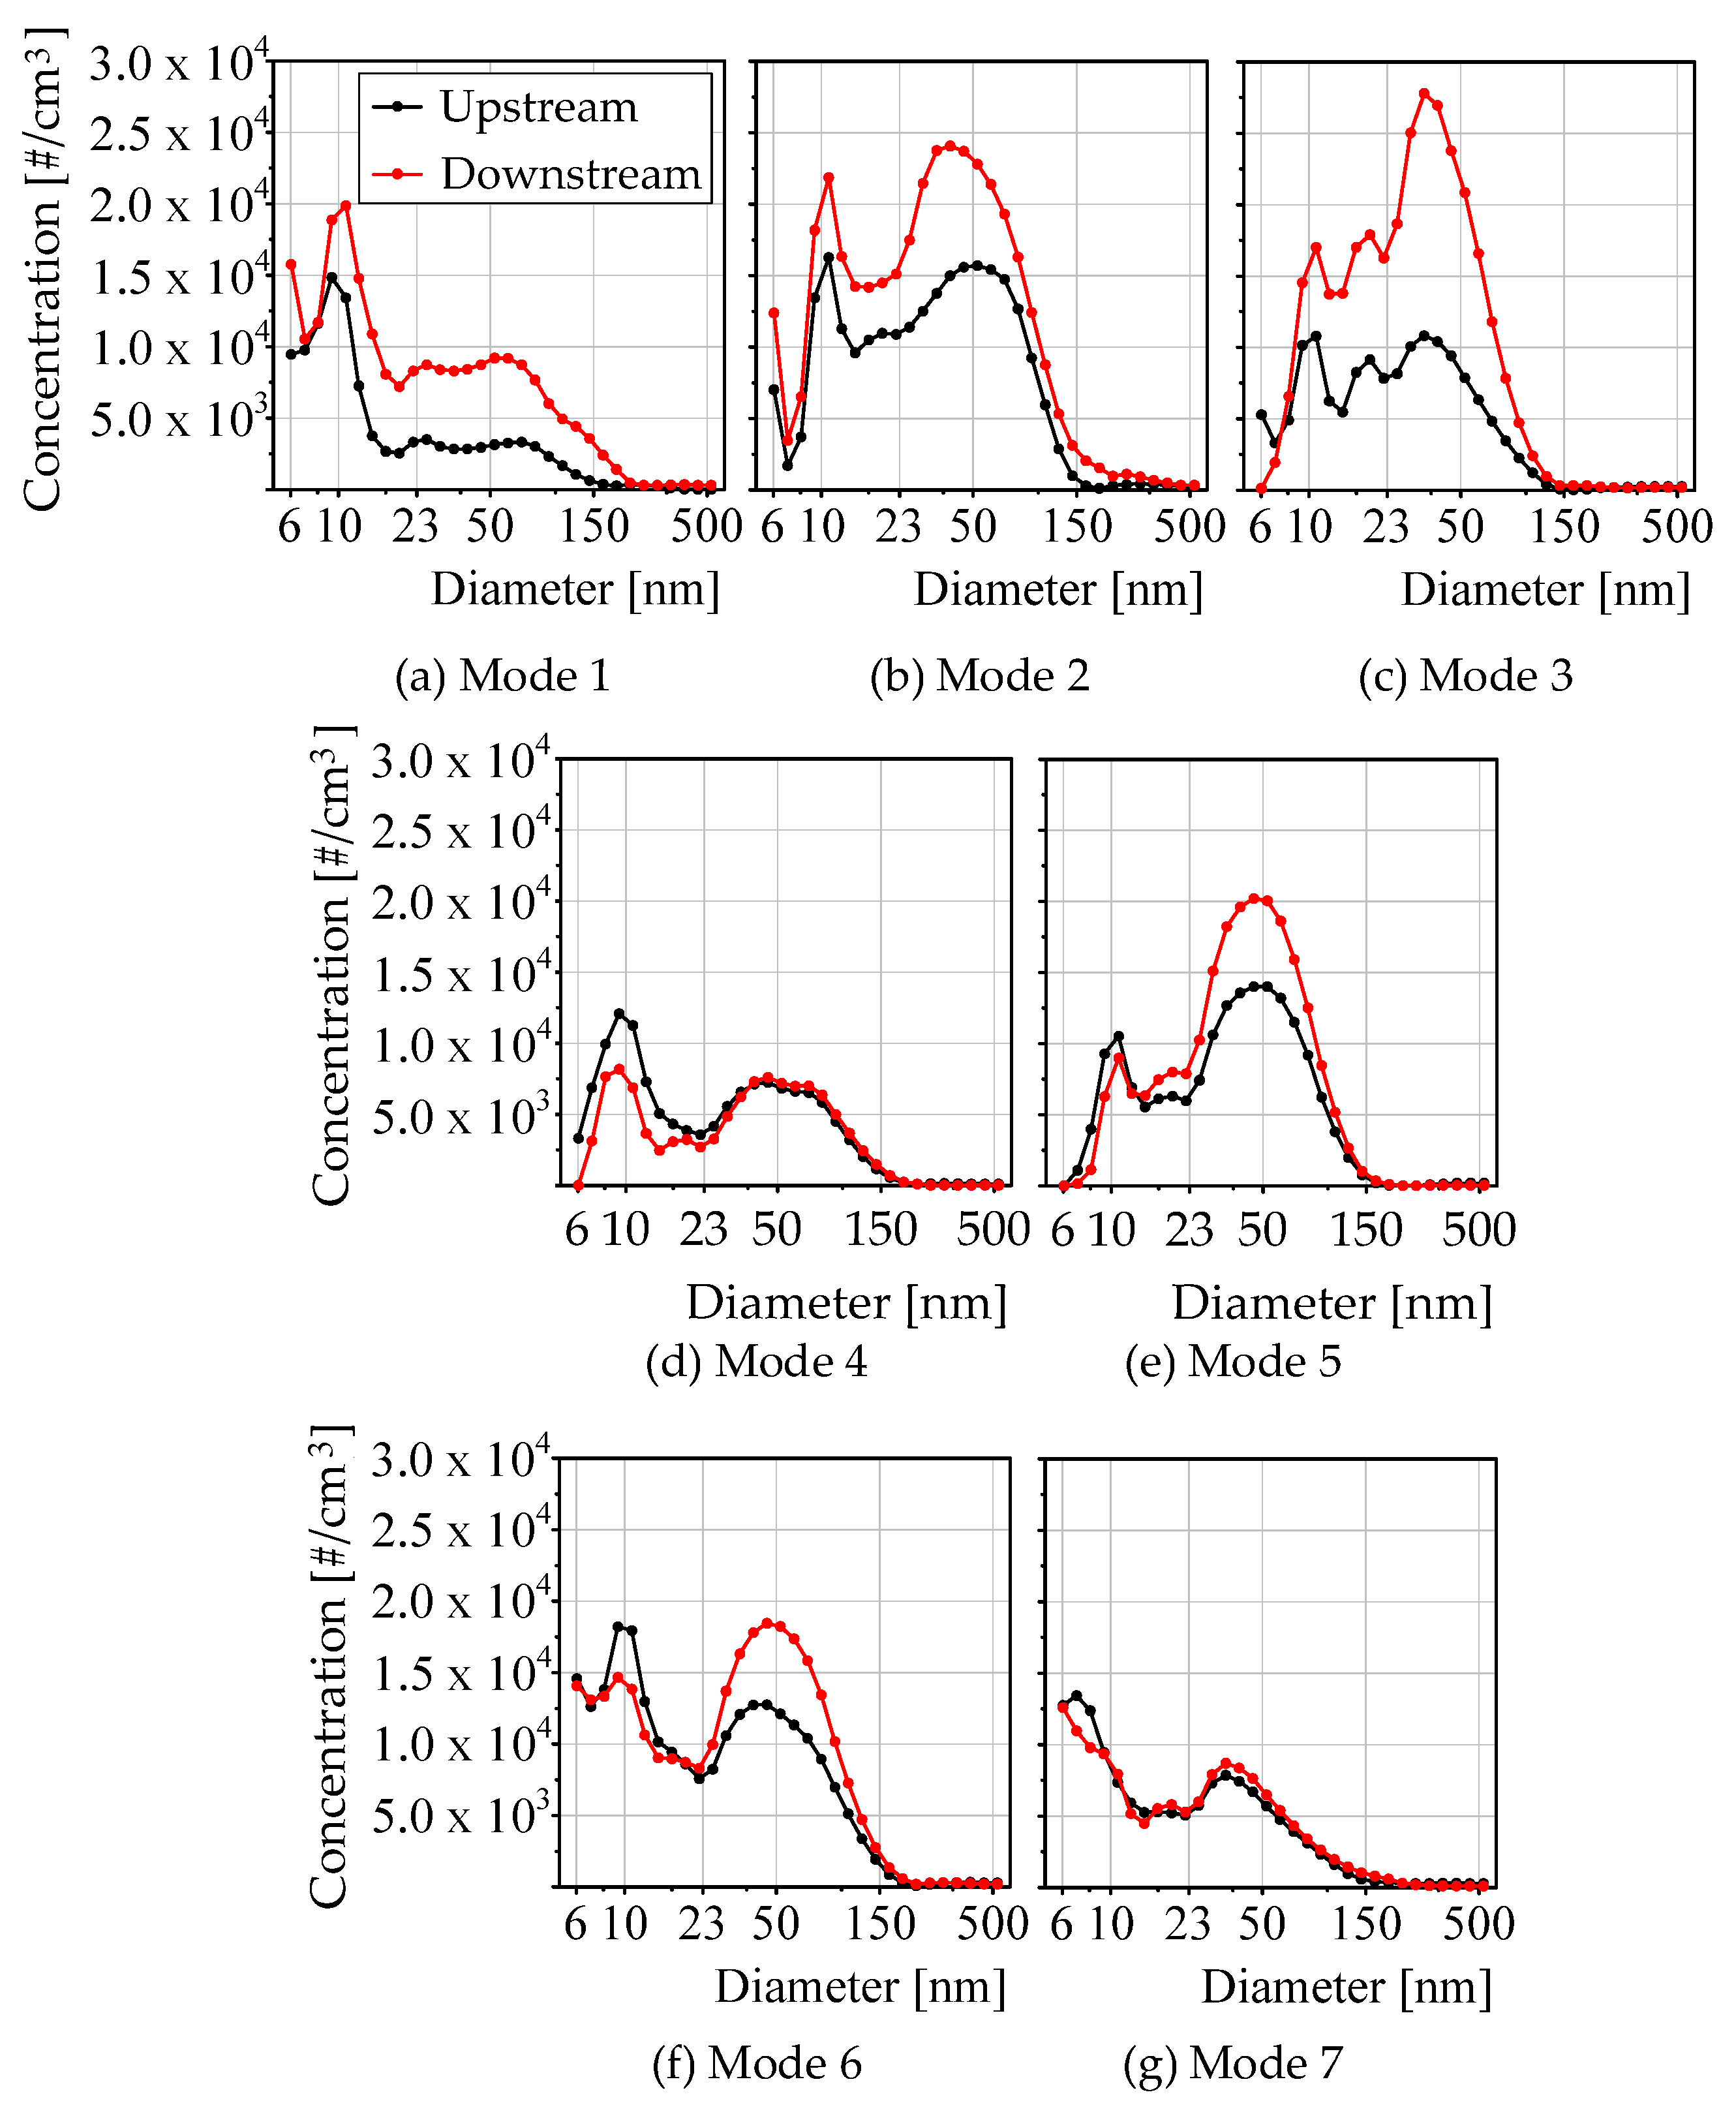
The results of analyzing the PSDs of all steady-state modes upstream and downstream of the TWC are grouped and presented in Figure 5. Modes M1 (Figure 5a), M2 (Figure 5b), and M3 (Figure 5c) showed downstream PN concentrations that were higher than those upstream of the TWC, in contrast to the behavior observed in modes M4 (Figure 5d), M5 (Figure 5e), M6 (Figure 5f), and M7 (Figure 5g), wherein the PN concentrations both upstream and downstream were similar. This phenomenon can be linked to the variables influencing the operation of the TWC, such as exhaust composition, temperature, and flow across each steady-state mode. Typically, PN is anticipated to decrease or remain stable downstream of the TWC compared to upstream measurements [35,43]. This observation is based on conditions where adequate temperature and residence time enable the conversion efficiency of the TWC to surpass 90% for all targeted gaseous pollutants, facilitating soot and organic particle oxidation [32]. However, some investigations indicate an increase in PN downstream of the TWC, associating it with the formation of nucleation particles from UHC, CO, and lubricating oil residues when the TWC does not present high conversion efficiencies of these species [33]. Furthermore, variations in PSD may result from diverse phenomena, some of which are opposing in nature. These include the coalescence of smaller particles to form larger aggregates [44], the fragmentation of large particles into smaller ones [22], and the oxidation of small particles by the catalyst [45].
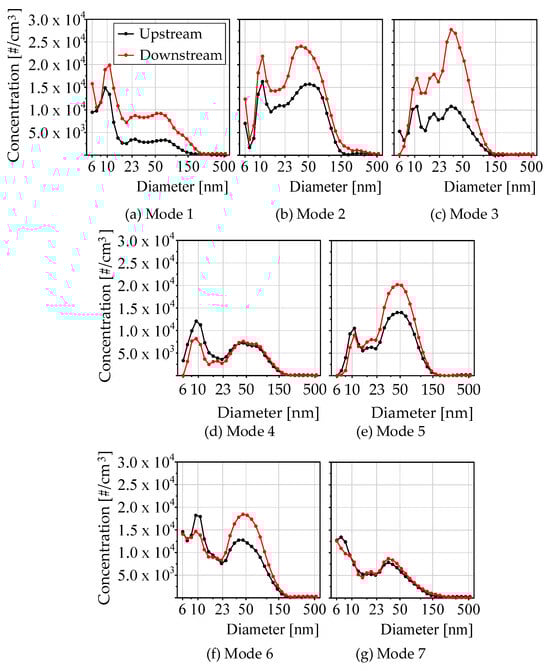
Figure 5.
Particle size distribution for each steady-state mode upstream and downstream of the TWC.
On the basis of the above, the PN increase downstream of the TWC observed in modes M1, M2, and M3 was mainly presented because of the relatively low exhaust temperature (around 500 °C). In these modes, the behavior of the TWC resembles that described for the pre-catalyst in the study by Ditaso et al. [22], displaying a general increase in PN across the entire measurement range. This increase is primarily ascribed to the dominance of PN generation phenomena. Specifically, it involves the fragmentation of larger particles, which are beyond the measurement capability of the instrument, into smaller particles that are detectable, and with the generation of particles from UHC. This process is not counterbalanced by oxidation within the TWC, which is minimal under the low-temperature conditions previously outlined.
For modes M4 (Figure 5d) and M5 (Figure 5e), characterized by exhaust and temperature values in the intermediate range with temperatures of approximately 600 °C and exhaust flow rates between 120 kg/h and 250 kg/h, no significant differences were observed upstream and downstream of the TWC. Similarly, for modes M6 (Figure 5f) and M7 (Figure 5g), with temperature values around 700 °C and exhaust flows exceeding 250 kg/h, the outcomes were comparable. In these scenarios, the particle formation from UHC was found to be lower than in modes M1 to M3. This reduction is attributed to the high conversion efficiency of UHC, thereby preventing particle formation and enhancing the oxidation of small organic particles [17]. Additionally, this capacity to oxidize small particles, coupled with potential agglomeration processes, led to a decrease in particles smaller than 23 nm, as previously documented in research under similar operating conditions [46,47]. This agglomeration process, particularly evident in modes M4 and M7, resulted in a slight increase in particles approximately 50 nm in diameter. This increase may also be partly due to the fragmentation of larger particles, ranging from 500 nm to 1000 nm in diameter.
The complexity involved in analyzing steady-state modes becomes evident when evaluating PSD, as in some cases, isothermal conditions are maintained among the evaluated modes, achieved by varying engine torque relative to speed. For this reason, it was necessary to conduct a statistical analysis using the p-value, which allowed for defining the influence of a parameter—in this case, speed or engine torque—on mass flow rate, exhaust gas temperature, PN23, and PN10 emissions along the exhaust line, and the influence of TWC on such emissions.
The p-value is a statistical metric that measures the strength of evidence against a null hypothesis. It is computed using Equation (6) for the t-distribution table with n−1 degrees of freedom. This equation is a function of the sample mean (), hypothesized mean (μ0), sample standard deviation (σ), and sample size (n), and it was implemented using the commercial software Statgraphics to indicate the probability of obtaining the observed results, assuming the null hypothesis is true [48]. In this case, a p-value lower than 0.05 indicates more robust evidence against the null hypothesis, with a higher level of statistical significance of the effect of speed or torque on exhaust mass flow, exhaust temperature, PN23 and PN10 upstream (up) and downstream (down) of TWC, as well as differences (diff) in both PN concentration ranges.
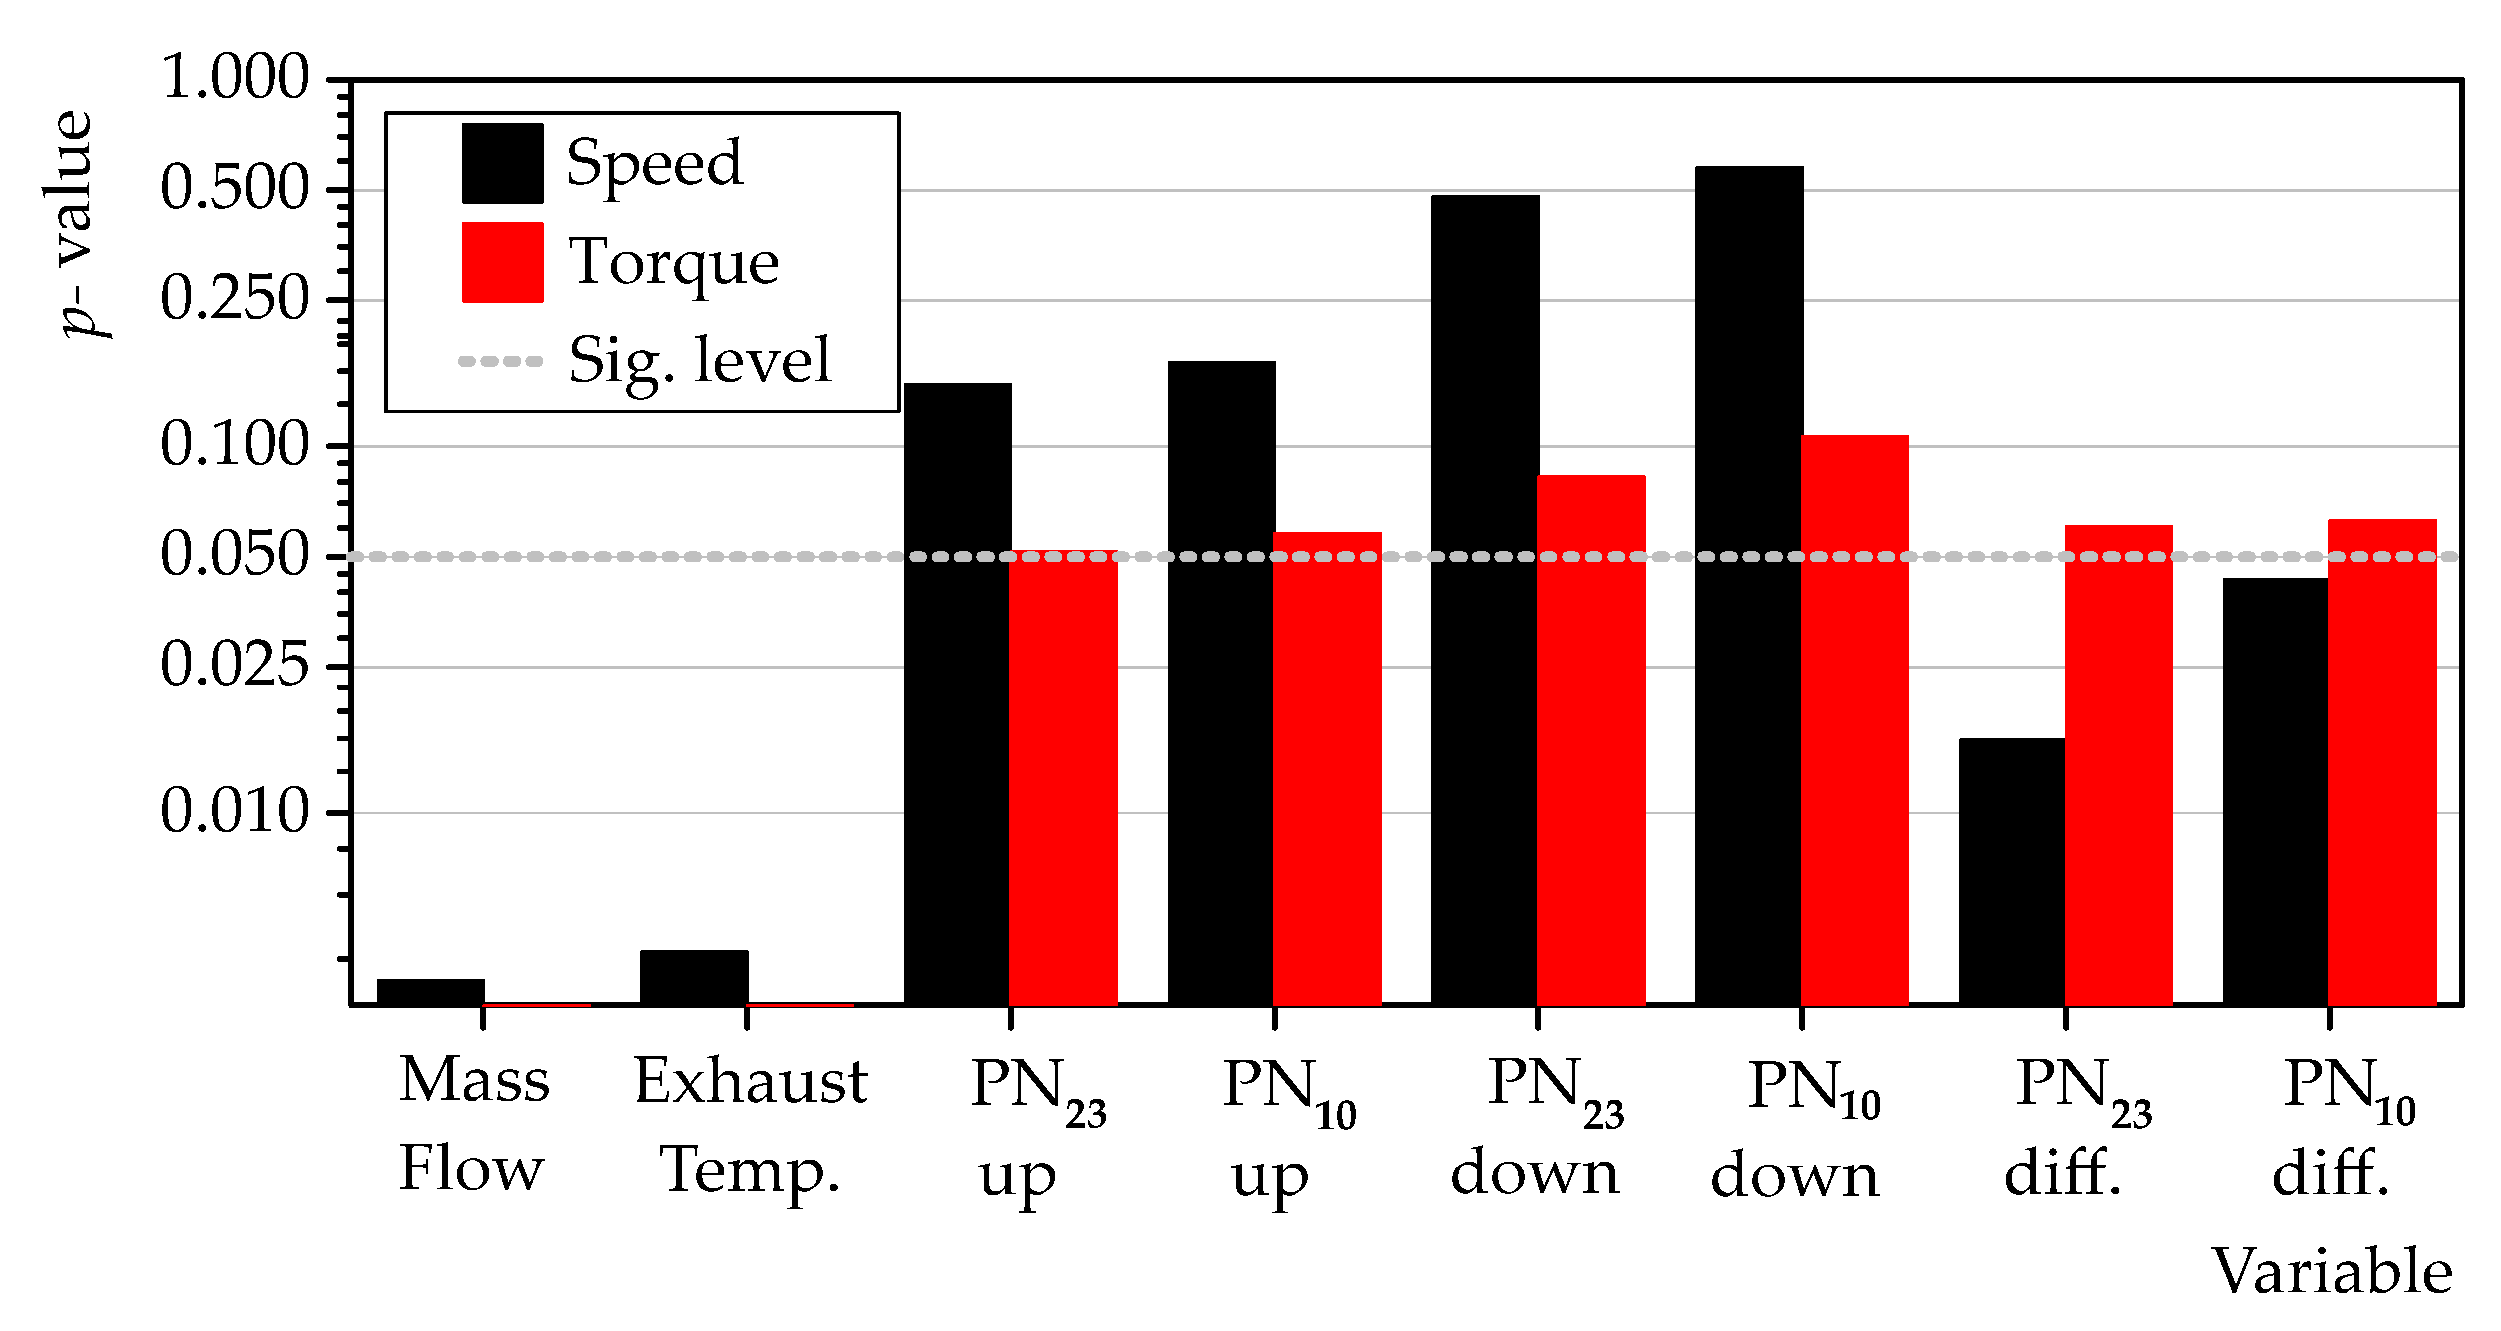
Figure 6 presents the results obtained for the significance level of engine speed and torque as a function of the p-value, incorporating mass flow, temperature, and concentrations of PN23 and PN10 before and after the TWC for all evaluated steady-state modes. Firstly, it is observed that both parameters are directly correlated with the mass flow rate and exhaust gas temperature, as evidenced by their p-values being lower than 0.05. Engine torque appears slightly more influential, with a p-value closer to zero. This outcome was expected because engine torque adjustments were employed to achieve isothermal conditions among some selected modes.

Figure 6.
The significance level of the effects of speed and torque on mass flow, PN23 and PN10 emissions upstream and downstream of TWC, and differences between them according to p-value.
Regarding the p-value analysis performed to assess the influence of engine speed and torque on PN10 and PN23 emissions, the results suggest that the impact of torque on the behavior of both PN concentration ranges can be ruled out, as all p-values were higher than 0.05. However, when analyzing the influence of engine speed, although no significant impact of this parameter on PN23 and PN10 emissions is demonstrated, it is true that when evaluating the difference between both concentrations before and after the catalyst, the p-value was less than 0.05 in both cases. This suggests that the difference between the PSD values in Figure 6 is mainly due to engine speed. For this reason, the most significant changes were observed in the first three modes, which correspond to the lowest mass flows and, therefore, longer residence times, which increase the probability of physicochemical phenomena occurring in the TWC.
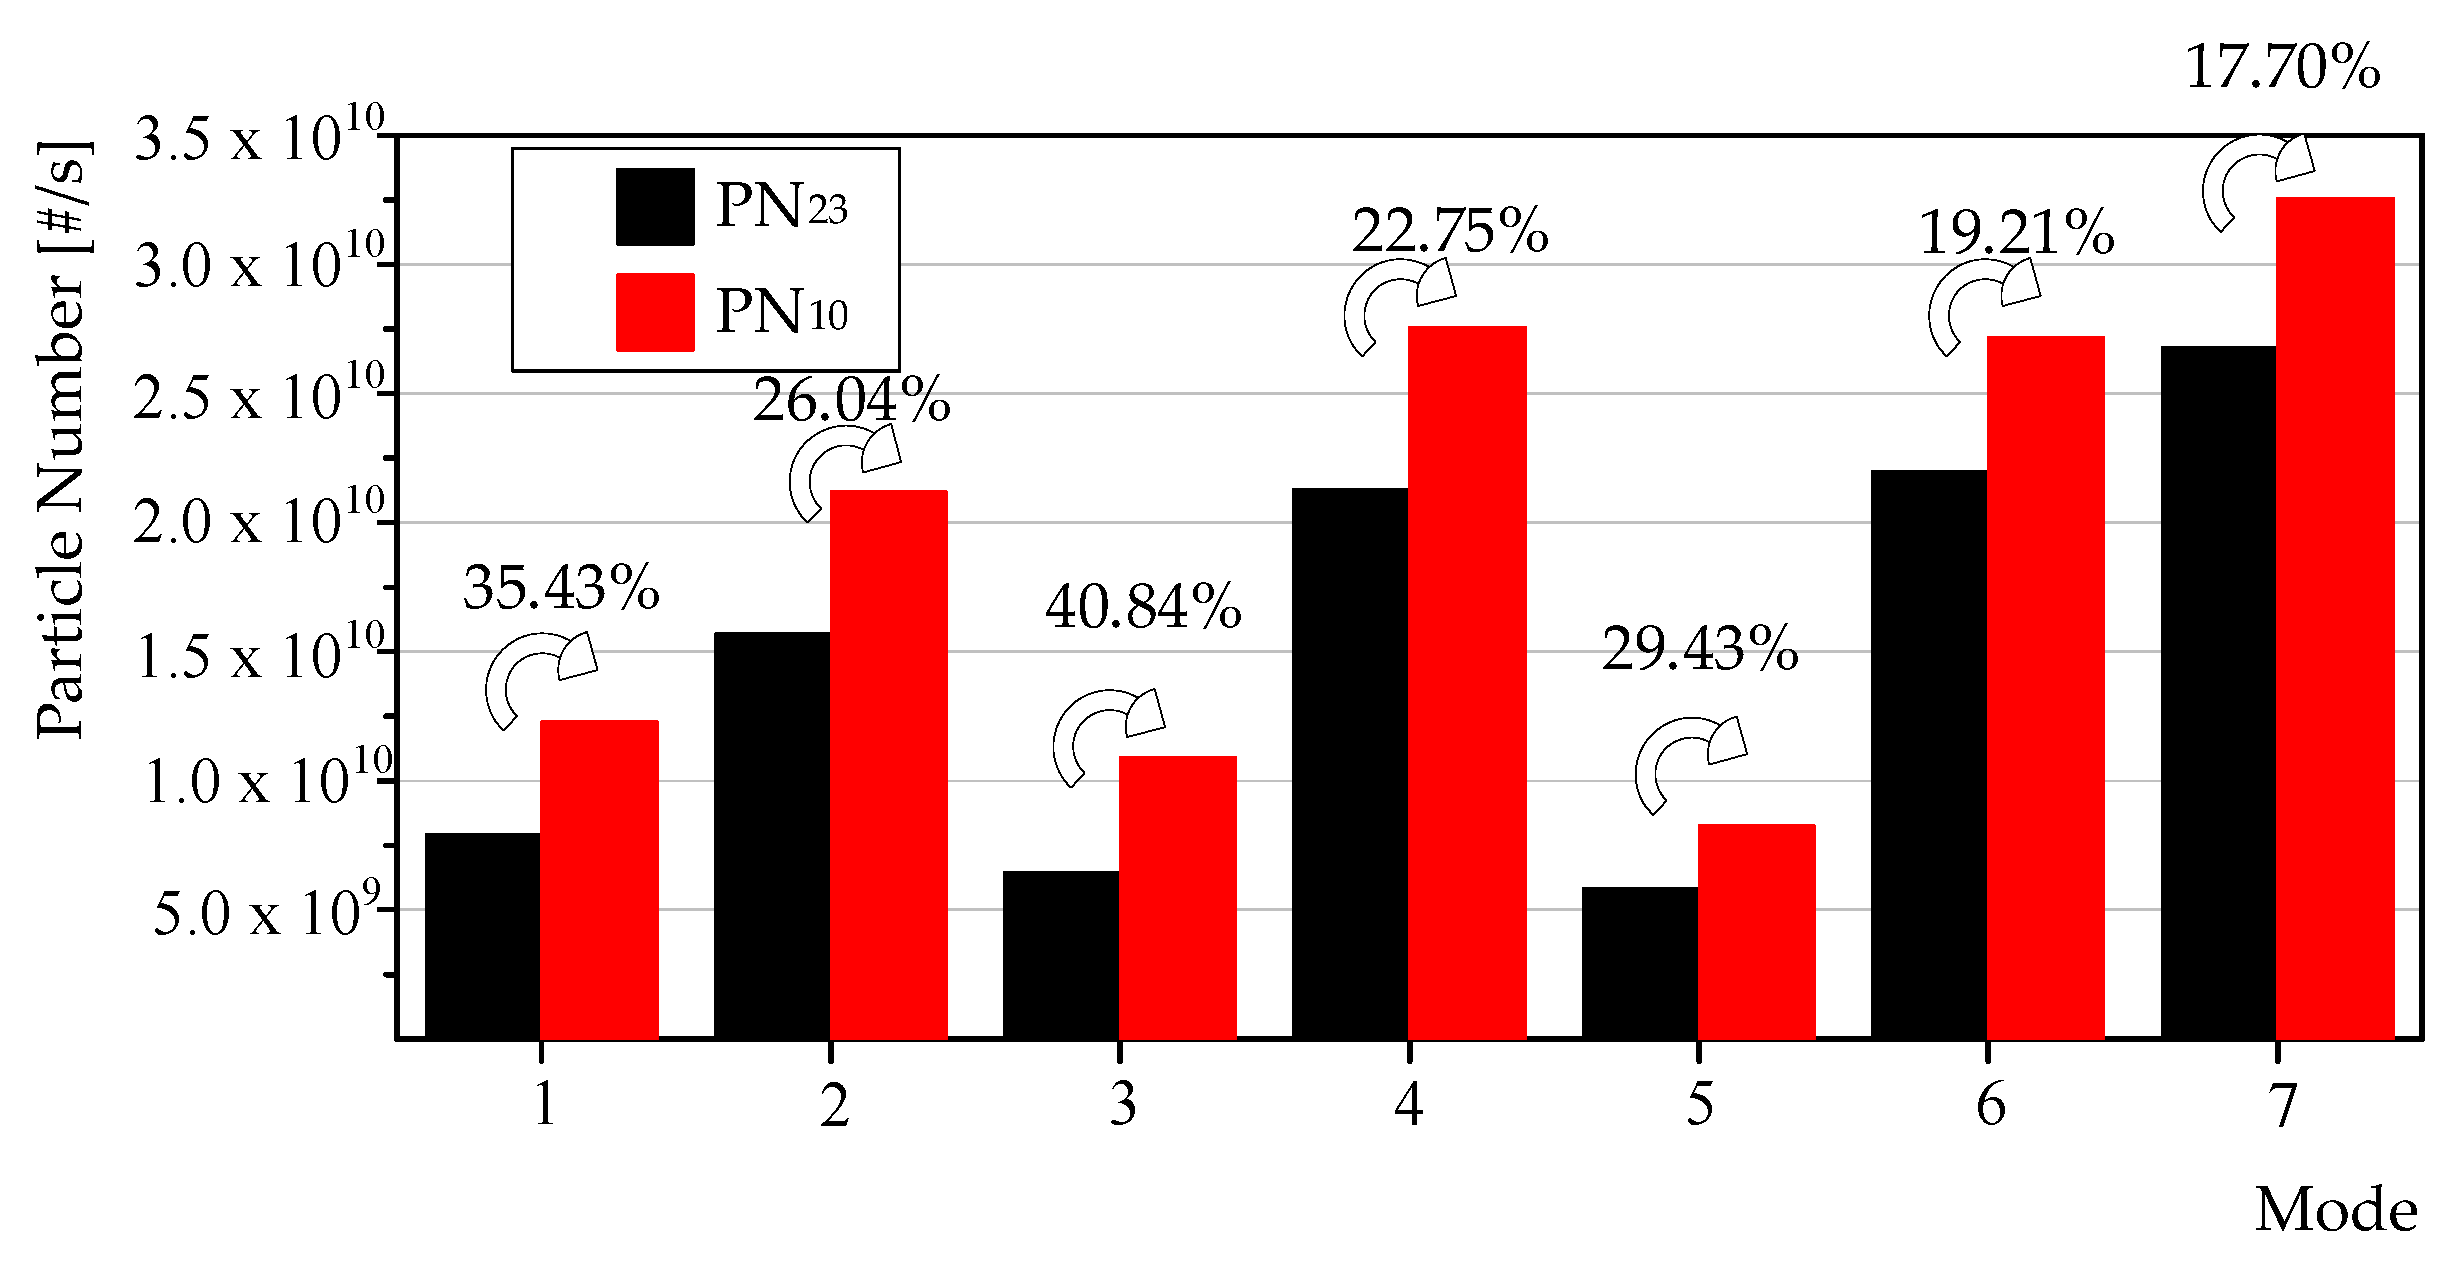
Finally, Figure 7 shows the tailpipe PN of all modes after TWC to compare emission levels between them, as well as the impact of measured particles with diameters of 10 nm instead of 23 nm. It was observed that modes M3 and M5, the operating conditions of which were similar mainly in terms of engine speed and torque, as Figure 3 shows, had the lowest values regarding all assessed modes. However, M3 presented the highest increase, with a value of 40.84% when PNS included particles with diameters between 10 nm and 23 nm, followed by M1, whose increase was 35.43%, similar to the behavior mentioned by Samaras et al. [49] for light-duty gasoline vehicle and Napolitano et al. [34] for natural gas HD engines. For the other modes, it was observed that including particles with diameters from 10 nm increases the PN by between 17.70% (at an exhaust gas temperature of 700 °C) and 29.43% (at 600 °C), which means particle filters shall remain mandatory in internal combustion engines powered by gaseous fuels [50]. Interestingly, the increase in PN tailpipe emissions when accounting for particles between 10 and 23 nm diminishes as exhaust temperature rises. This observation is consistent with the findings presented in Figure 4, illustrating the enhanced capacity of the TWC to eliminate smaller-sized particles with increasing temperatures.

Figure 7.
PN emissions after TWC with diameters of 10 nm and 23 nm, and the percent increases between them.
3.2. Transient Conditions
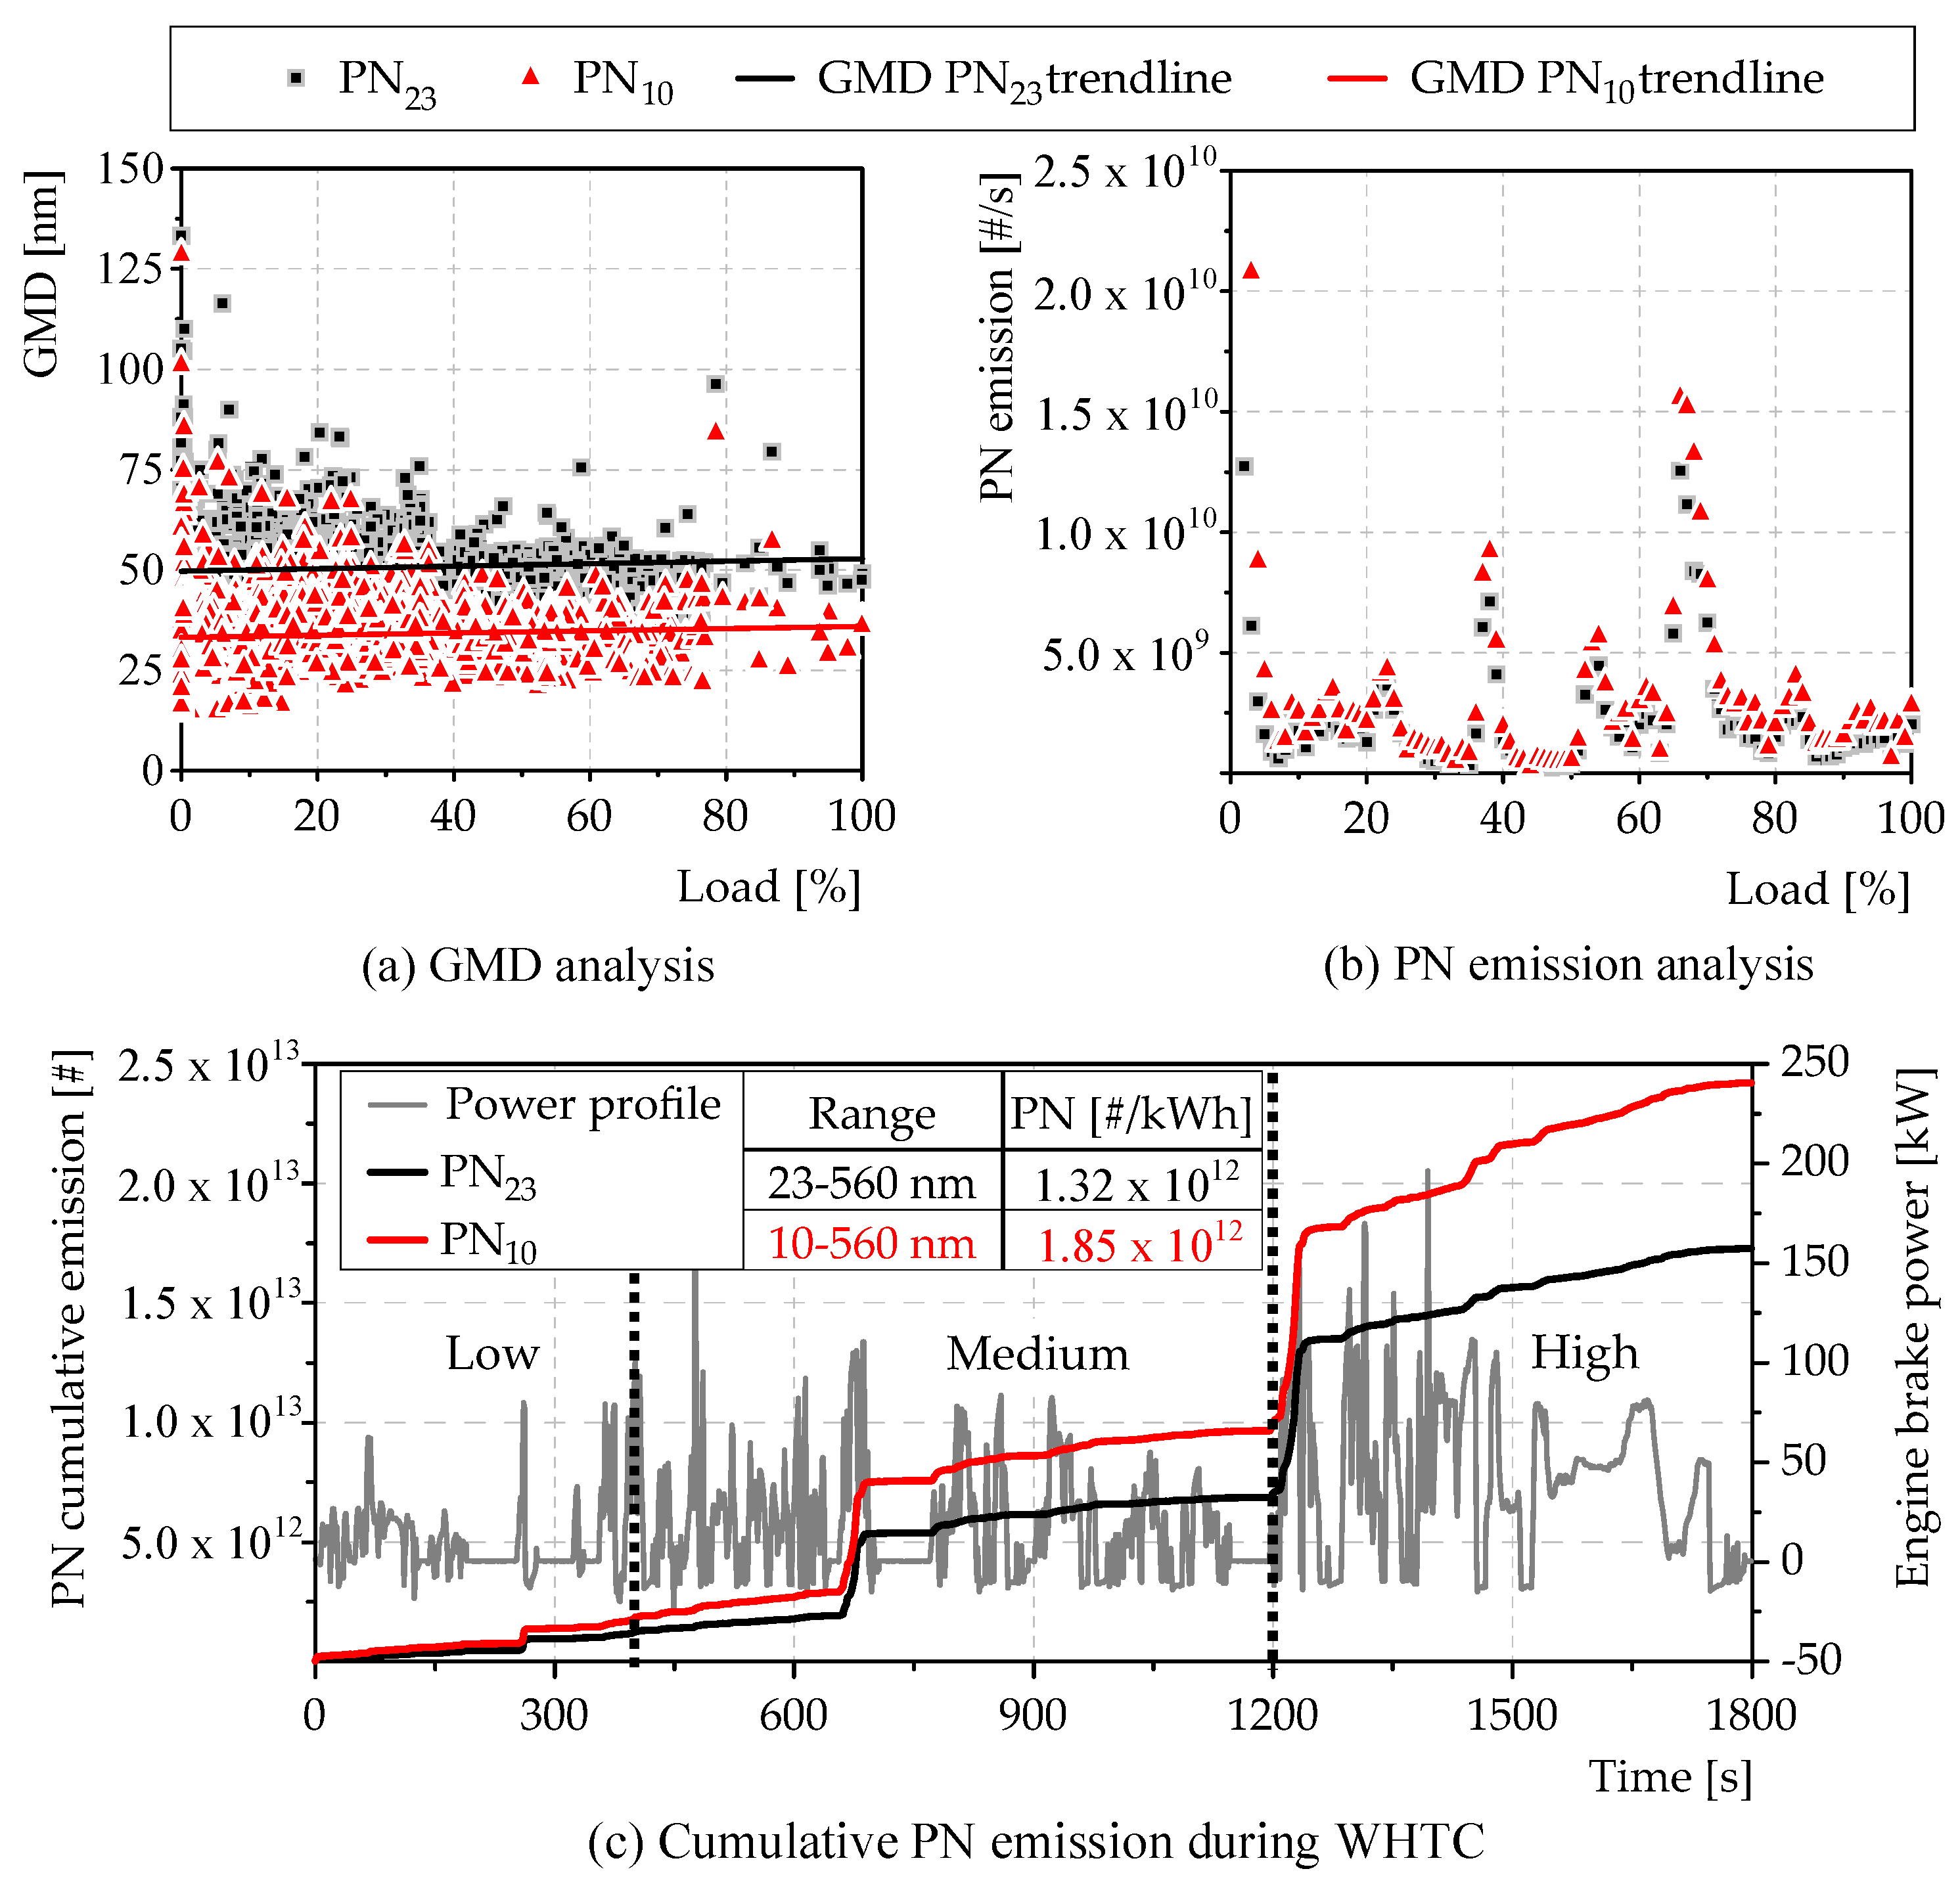
The results of the assessment of PN with dynamic variations in engine operation parameters are presented in Figure 8, and are addressed with three specific approaches focused on the behavior of the GMD as a function of engine load for PN23 and PN10 concentrations, with their respective trendlines (Figure 8a), particle emissions per second as a function of engine load for PN23 and PN10 concentrations (Figure 8b), and cumulative particle emission during the 1800 s of the WHTC cycle (Figure 8c), which also shows the total specific particle emission when PN23 and PN10 are evaluated.

Figure 8.
Results under transient conditions. (a) GMD considering PN23 and PN10 as a function of the engine load, (b) PN23 and PN10 emissions as a function of the engine load, and (c) cumulative PN emissions after TWC with diameters of 10 and 23 nm, with the total emission values for both measurement ranges during the WHTC.
Figure 8a shows that the GMD reaches its highest values (around 130 nm) when the engine operates at load levels close to 0% for both concentrations (PN23 and PN10) due to the shift to the central mode under low fuel consumption conditions. This behavior is similar to that shown in the results of Toumasatos et al. [31] for a vehicle powered by CNG as the primary fuel and gasoline as the secondary fuel. Furthermore, the low carbon content of LPG prevents the formation of particles from soot depending on the engine operating load. This is due to the gaseous nature of the fuel when supplied using a port fuel injection system, which reduces the possibility of wet walls and excessively rich air–fuel mixture zones. Therefore, the trendline in both measurement ranges remains constant as a function of engine load. However, it is necessary to highlight that when evaluating the trend line for PN23, the GMD remains around 50 nm. Still, when considering PN10, the GMD decreases to 30 nm, indicating the high concentration of ultrafine particles included in this new measurement range.
Figure 8b depicts the particle emission per second when evaluating PN23 and PN10 emissions as a function of engine load during the WHTC cycle. Overall, there are few variations in the total particle emissions for both concentration ranges evaluated, with emissions remaining below 5 × 10⁹ #/s. Exceptions occur primarily around 0%, 40%, 50%, and 70%, likely corresponding to the most abrupt load variations during the homologation cycle to reach the highest engine loads, or reduce them until idle conditions are reached.
Finally, the results of the transient analysis of PN cumulative emissions are presented in Figure 8c as a function of time during the 1800 s of the WHTC duration. This figure also presents the power profile as a function of the engine speed and torque, and the test was divided into three sections (low, medium, and high) according to the variation in the engine work during the cycle to elucidate the impacts of transient states of the engine on PN emission. The first part presents a low and stable PN emission with little differences between PN23 and PN10. However, when the engine works with steady-state power (between 200 s and 280 s) and undergoes high variations in power (285 s), an increase in the PN emission is seen, manifesting a difference in emissions of PN23 and PN10.
A similar behavior can be observed in the second part (between 680 s and 770 s), where increases in both PN emissions were notable, with a greater difference between PN23 and PN10. Nevertheless, the greatest variation took place from the second 1200, when the engine was working under high transient variations, and it is here evident how dynamic states after short steady states increase the particle emission [45]—so much so that the specific PN emissions of the engine for PN23 and PN10 are two (1.32 × 10¹² #/kWh) and three times (1.85 × 10¹²) higher than the limit regulated by the current Euro 6 (6 × 10¹¹ #/kWh). Therefore, it is concluded that the use of particulate filters remains obligatory for engines operating on gaseous fuels to meet regulatory standards. This necessity stems from the significant impact of engine dynamic variations on PN emissions. Additionally, incorporating particles with diameters between 10 nm and 23 nm is expected to result in up to a 40% increase in emission levels, a finding that aligns with the results reported by Gerner et al. [51] for engines powered by alternative fuels in HD applications.
4. Conclusions
This work analyzed the PN emissions of an HD-SI powered by LPG under different operating conditions, and the main conclusions of the steady-state and dynamic analysis are presented below:
- The PN emissions increased after TWC when the conditions of the steady-state modes included temperatures around 500 °C and exhaust gas flows lower than 120 kg/h (high residence time), facts that increased the formation of PN from UHC conversion and the division of particles with diameters between 500 nm and 1000 nm. Steady-state modes with temperatures around 600 °C and 700 °C and medium and high exhaust flows showed negligible differences in PN and a slight shift towards larger particles in PSD, both upstream and downstream of the TWC;
- It was observed that total PN, when measured in particles with diameters of 10 nm instead of 23 nm, increased by between 17.70% and 40.84%. Modes characterized by lower exhaust temperatures and mass flow rates exhibited the greatest increases;
- Transient states of the engine had an effect on PN emission, because these emissions increased due to variations in the engine power, and the most critical parts showed dynamic variations under quasi-steady state conditions. Additionally, the PN emissions were two times and three times higher than the current Euro VI limit (6 × 10¹¹ #/kWh) when the particles measured sized 23 nm and 10 nm, respectively;
- The GMD analysis exhibited certain variations as a function of the engine load. However, its overall trend indicated relatively consistent emission levels, presenting an advantage for LPG owing to its inherent physical properties and the utilization of port fuel injection systems. In general, it is observed that the trend in GMD during dynamic engine conditions decreases from 50 nm to 30 nm when accounting for particle concentrations between 10 nm and 23 nm. This underscores a notable concentration of these particles, deemed the most hazardous due to their size, thus emphasizing the imperative for their regulation in forthcoming regulatory frameworks;
- Future research on the application of particulate filters should focus on evaluating the effects of these devices on particles sized between 10 nm and 23 nm, under both steady-state and transient conditions. This approach aims to determine whether current technologies are adequate for meeting forthcoming regulatory requirements, or if there is a need to develop new technologies. Furthermore, it is proposed that catalyzed particulate filters be analyzed in future studies to enable the integration of different technologies to meet future regulations while reducing the complexity of the aftertreatment system architecture.
Author Contributions
Conceptualization, V.B., P.P. and E.J.S.; methodology, V.B. and B.C.; software, V.B. and B.C.; formal analysis, P.P., E.J.S. and B.C.; data curation, E.J.S. and B.C.; writing—original draft preparation, E.J.S. and B.C.; writing—review and editing, V.B. and P.P. visualization, E.J.S. and B.C.; supervision, V.B. and P.P.; project administration, V.B. and P.P.; funding acquisition, V.B. and P.P. All authors have read and agreed to the published version of the manuscript.
Funding
This research was supported by Grant PID2020-114289RB-I00 funded by the Spanish Ministerio de Ciencia e Innovación, Agencia Estatal de Investigación (MCIN/AEI/10.13039/5011000 11033).
Institutional Review Board Statement
Not applicable.
Informed Consent Statement
Not applicable.
Data Availability Statement
The original contributions presented in the study are included in the article, due to privacy further inquiries can be directed to the corresponding author.
Conflicts of Interest
The authors declare no conflicts of interest.
Nomenclature
| ATS | aftertreatment systems |
| CNG | compressed natural gas |
| CO | carbon monoxide |
| CO2 | carbon dioxide |
| CS | catalyst stripper |
| CPC | condensation particle counters |
| EEPS | engine exhaust particle sizer |
| ET | evaporation tube |
| GMD | geometric mean diameter |
| GTR | global technical report |
| HD | heavy-duty |
| LPG | liquefied petroleum gas |
| NOx | nitrogen oxides |
| PMP | particle measurement program |
| PN | particle number |
| PN10 | particle number with diameters equal to or larger than 10 nm |
| PN23 | particle number with diameters equal to or larger than 23 nm |
| PTD | porous tube diluter |
| PSD | particle size distribution |
| RON | research octane number |
| Scharger | supercharger |
| SI | spark-ignition |
| TWC | three-way catalyst |
| UHC | unburned hydrocarbons |
| VPR | volatile particle remover |
| WHTC | world harmonized transient cycle |
References
- IEA (International Energy Agency). Key World Energy Statistics 2020. Int. Energy Agency 2020, 33, 4649. [Google Scholar]
- NOAA National Centers for Environmental Information. Monthly Report January 2024 Global Climate Report. Available online: https://www.ncei.noaa.gov/access/monitoring/monthly-report/global/202401 (accessed on 10 April 2024).
- Fuller, R.; Landrigan, P.J.; Balakrishnan, K.; Bathan, G.; Bose-O’Reilly, S.; Brauer, M.; Caravanos, J.; Chiles, T.; Cohen, A.; Corra, L.; et al. Pollution and Health: A Progress Update. Lancet Planet Health 2022, 6, e535–e547. [Google Scholar] [CrossRef]
- EEA Monograph Assessment and Management of Urban Air Quality in Europe. Available online: https://www.eea.europa.eu/publications/environmental_monograph_2006_5/file (accessed on 12 April 2024).
- Li, F.; Schnelle-Kreis, J.; Cyrys, J.; Karg, E.; Gu, J.; Abbaszade, G.; Orasche, J.; Peters, A.; Zimmermann, R. Organic Speciation of Ambient Quasi-Ultrafine Particulate Matter (PM0.36) in Augsburg, Germany: Seasonal Variability and Source Apportionment. Sci. Total Environ. 2018, 615, 828–837. [Google Scholar] [CrossRef]
- Li, D.D.; Wang, C.; Chan, Q.N.; Yeoh, G.H. Soot: A Review of Computational Models at Different Length Scales. Exp. Comput. Multiph. Flow 2023, 5, 1–14. [Google Scholar] [CrossRef]
- Zhou, L.; Zhang, X.; Yu, Y. Experimental and Numerical Studies on the Wall-Roughness Effect to Particle Dynamics in Various Gas-Particle Flows. Exp. Comput. Multiph. Flow 2023, 1, 1–8. [Google Scholar] [CrossRef]
- Climate Change Authority of Australian Government. International Implementation of Vehicle Emissions Standards. Available online: http://www.climatechangeauthority.gov.au/reviews/light-vehicle-emissions-standards-australia/international-implementation-vehicle-emissions (accessed on 8 April 2024).
- Catapano, F.; Di Iorio, S.; Sementa, P.; Vaglieco, B.M. Optimization of the Compressed Natural Gas Direct Injection in a Small Research Spark Ignition Engine. Int. J. Engine Res. 2017, 18, 118–130. [Google Scholar] [CrossRef]
- Payri, R.; Gimeno, J.; Marti-Aldaravi, P.; Mendoza Alvarez, V. Study of the Hydraulic Characteristics of Two Injectors Fed with Different Fuels in a GDI System. Fuel 2022, 317, 123196. [Google Scholar] [CrossRef]
- General Secretariat of the European Union Council Regulation (EU) 2024/1257. Available online: https://eur-lex.europa.eu/legal-content/EN/TXT/HTML/?uri=OJ:L_202401257 (accessed on 6 June 2024).
- Pastor, J.V.; Micó, C.; Lewiski, F.; Tejada, F.J.; Tornatore, C. A Synergic Application of High-Oxygenated E-Fuels and New Bowl Designs for Low Soot Emissions: An Optical Analysis. Appl. Sci. 2023, 13, 8560. [Google Scholar] [CrossRef]
- Milojević, S.; Glišović, J.; Savić, S.; Bošković, G.; Bukvić, M.; Stojanović, B. Particulate Matter Emission and Air Pollution Reduction by Applying Variable Systems in Tribologically Optimized Diesel Engines for Vehicles in Road Traffic. Atmosphere 2024, 15, 184. [Google Scholar] [CrossRef]
- Boger, T.; Rose, D.; He, S.; Joshi, A. Developments for Future EU7 Regulations and the Path to Zero Impact Emissions—A Catalyst Substrate and Filter Supplier’s Perspective. Transp. Eng. 2022, 10, 100129. [Google Scholar] [CrossRef]
- Lou, D.; Qi, B.; Zhang, Y.; Fang, L. Research on the Emission Characteristics of a Passenger Car Powered by Ethanol, Methanol, and Liquefied Petroleum Gas Under Real-World Running Conditions. J. Energy Resour. Technol. Trans. ASME 2023, 145, 042303. [Google Scholar] [CrossRef]
- Pastor, J.V.; García-Oliver, J.M.; Micó, C.; García-Carrero, A.A.; Gómez, A. Experimental Study of the Effect of Hydrotreated Vegetable Oil and Oxymethylene Ethers on Main Spray and Combustion Characteristics under Engine Combustion Network Spray A Conditions. Appl. Sci. 2020, 10, 5460. [Google Scholar] [CrossRef]
- Bermúdez, V.; Ruiz, S.; Sanchis, E.J.; Conde, B. Assessment of Exhaust Raw Emissions and Aftertreatment Performance in a Retrofitted Heavy Duty-Spark Ignition Engine Operating with Liquefied Petroleum Gas. J. Clean. Prod. 2024, 434, 140139. [Google Scholar] [CrossRef]
- Yeo, S.J.; Kim, J.; Lee, W.J. Potential Economic and Environmental Advantages of Liquid Petroleum Gas as a Marine Fuel through Analysis of Registered Ships in South Korea. J. Clean. Prod. 2022, 330, 129955. [Google Scholar] [CrossRef]
- García-Oliver, J.M.; Novella, R.; Micó, C.; De Leon-Ceriani, D. Numerical Analysis of the Combustion Process of Oxymethylene Ethers as Low-Carbon Fuels for Compression Ignition Engines. Int. J. Engine Res. 2023, 24, 2175–2186. [Google Scholar] [CrossRef]
- Robin, R.; Martini, G.; Particle Measurement Programme. Volatile Particle Remover Calibration. Available online: https://publications.jrc.ec.europa.eu/repository/handle/JRC73454 (accessed on 20 May 2024).
- Amanatidis, S.; Ntziachristos, L.; Giechaskiel, B.; Katsaounis, D.; Samaras, Z.; Bergmann, A. Evaluation of an Oxidation Catalyst (“catalytic Stripper”) in Eliminating Volatile Material from Combustion Aerosol. J. Aerosol Sci. 2013, 57, 144–155. [Google Scholar] [CrossRef]
- Melas, A.D.; Koidi, V.; Deloglou, D.; Daskalos, E.; Zarvalis, D.; Papaioannou, E.; Konstandopoulos, A.G. Development and Evaluation of a Catalytic Stripper for the Measurement of Solid Ultrafine Particle Emissions from Internal Combustion Engines. Aerosol Sci. Technol. 2020, 54, 704–717. [Google Scholar] [CrossRef]
- Giechaskiel, B.; Melas, A.D.; Lähde, T.; Martini, G. Non-Volatile Particle Number Emission Measurements with Catalytic Strippers: A Review. Vehicles 2020, 2, 342–364. [Google Scholar] [CrossRef]
- Global Registry. Created on 18 November 2004, Pursuant to Article 6 of the Agreement Concerning the Establishing of Global Technical Regulations for Wheeled Vehicles, Equipment and Parts which Can Be Fitted and/or be Used on Wheeled Vehicles (ECE/TRANS/132 and Corr.1) Done at Geneva on 25 June 1998. Addendum 15: Global Technical Regulation No. 15. United Nations Global Technical Regulation on Worldwide Harmonized Light Vehicles Test Procedures (WLTP); United Nations: Geneva, Switzerland, 2020; Volume 00596, pp. 1–23. [Google Scholar]
- Fosudo, T.; Kar, T.; Windom, B.; Olsen, D. Low-Carbon Fuels for Spark-Ignited Engines: A Comparative Study of Compressed Natural Gas and Liquefied Petroleum Gas on a CFR Engine with Exhaust Gas Recirculation. Fuel 2024, 360, 130456. [Google Scholar] [CrossRef]
- Giechaskiel, B.; Lähde, T.; Clairotte, M.; Suarez-Bertoa, R.; Valverde, V.; Melas, A.D.; Selleri, T.; Bonnel, P. Emissions of Euro 6 Mono-and Bi-Fuel Gas Vehicles. Catalysts 2022, 12, 651. [Google Scholar] [CrossRef]
- Ramalingam, S.; Mahalakshmi, N.V. Influence of High Pressure Fuel Injection System on Engine Performance and Combustion Characteristics of Moringa Oleifera Biodiesel and Its Blends. Fuel 2020, 279, 118461. [Google Scholar] [CrossRef]
- Giechaskiel, B.; Lähde, T.; Drossinos, Y. Regulating Particle Number Measurements from the Tailpipe of Light-Duty Vehicles: The next Step? Environ. Res. 2019, 172, 1–9. [Google Scholar] [CrossRef] [PubMed]
- European Commission. COMMISSION REGULATION (EU) 2019/1939 of 7 November 2019 Amending Regulation (EU) No 582/2011 as Regards Auxiliary Emission Strategies (AES), Access to Vehicle OBD Information and Vehicle Repair and Maintenance Information, Measurement of Emissions during Cold Engine Start Periods and Use of Portable Emissions Measurement Systems (PEMS) to Measure Particle Numbers, with Respect to Heavy Duty Vehicles (Text with EEA Relevance). Off. J. Eur. Union 2018, 2016, 48–119. [Google Scholar]
- Napolitano, P.; Alfè, M.; Guido, C.; Gargiulo, V.; Fraioli, V.; Beatrice, C. Particle Emissions from a HD SI Gas Engine Fueled with LPG and CNG. Fuel 2020, 269, 117439. [Google Scholar] [CrossRef]
- Toumasatos, Z.; Kontses, A.; Doulgeris, S.; Samaras, Z.; Ntziachristos, L. Particle Emissions Measurements on CNG Vehicles Focusing on Sub-23nm. Aerosol Sci. Technol. 2021, 55, 182–193. [Google Scholar] [CrossRef]
- Lähde, T.; Giechaskiel, B. Particle Number Emissions of Gasoline, Compressed Natural Gas (Cng) and Liquefied Petroleum Gas (Lpg) Fueled Vehicles at Different Ambient Temperatures. Atmosphere 2021, 12, 893. [Google Scholar] [CrossRef]
- Distaso, E.; Amirante, R.; Calò, G.; De Palma, P.; Tamburrano, P. Evolution of Soot Particle Number, Mass and Size Distribution along the Exhaust Line of a Heavy-Duty Engine Fueled with Compressed Natural Gas. Energies 2020, 13, 3993. [Google Scholar] [CrossRef]
- Napolitano, P.; Di Maio, D.; Guido, C.; Merlone Borla, E.; Torbati, R. Experimental Investigation on Particulate Filters for Heavy-Duty Natural Gas Engines: Potentialities toward EURO VII Regulation. J. Environ. Manag. 2023, 331, 117204. [Google Scholar] [CrossRef] [PubMed]
- Bermúdez, V.; Ruiz, S.; Conde, B.; Soto, L. Analysis of the Aftertreatment Performance in HD-SI Engine Fueled with LPG. Int. J. Engine Res. 2023, 24, 16–28. [Google Scholar] [CrossRef]
- Fosudo, T.; Kar, T.; Marchese, A.; Windom, B.; Olsen, D. The Impact of LPG Composition on Performance, Emissions, and Combustion Characteristics of a Pre-Mixed Spark-Ignited CFR Engine. SAE Tech. Pap. 2022. [Google Scholar] [CrossRef]
- TSI Updated Inversion Matrices for Engine Exhaust Particle SizerTM (EepsTM) Spectrometer Model 3090—Application Note EEPS-005 (A4). Available online: https://tsi.com/getmedia/292f97f4-74e1-4cb6-90d4-7e315f27ccca/Updated_Inversion_Matrices_EEPS-005-US-web?ext=.pdf (accessed on 8 April 2024).
- Desantes, J.M.; Bermdez, V.; Molina, S.; Linares, W.G. Methodology for Measuring Exhaust Aerosol Size Distributions Using an Engine Test under Transient Operating Conditions. Meas. Sci. Technol. 2011, 22, 115101. [Google Scholar] [CrossRef]
- Navarro, D.C. Estudio de Las Emisiones de Escape En Motores de Combustión Interna Alternativos Utilizando Diferentes Sistemas de Control de Contaminantes. Ph.D. Thesis, Universitat Politècnica de València, Valencia, Spain, 2016. [Google Scholar]
- Jeong, C.H.; Evans, G.J. Inter-Comparison of a Fast Mobility Particle Sizer and a Scanning Mobility Particle Sizer Incorporating an Ultrafine Water-Based Condensation Particle Counter. Aerosol Sci. Technol. 2009, 43, 364–373. [Google Scholar] [CrossRef]
- Zimmerman, N.; Godri Pollitt, K.J.; Jeong, C.H.; Wang, J.M.; Jung, T.; Cooper, J.M.; Wallace, J.S.; Evans, G.J. Comparison of Three Nanoparticle Sizing Instruments: The Influence of Particle Morphology. Atmos. Environ. 2014, 86, 140–147. [Google Scholar] [CrossRef]
- Seinfeld, J.H.; Pandis, S.N. Atmospheric Chemistry and Physics: From Air Pollution to Climate Change; John Wiley & Sons: Hoboken, NJ, USA, 2016; ISBN 1118947401. [Google Scholar]
- Liu, H.; Li, Z.; Xu, H.; Ma, X.; Shuai, S. Nucleation Mode Particle Evolution in a Gasoline Direct Injection Engine with/without a Three-Way Catalyst Converter. Appl. Energy 2020, 259, 114211. [Google Scholar] [CrossRef]
- Xing, J.; Shao, L.; Zheng, R.; Peng, J.; Wang, W.; Guo, Q.; Wang, Y.; Qin, Y.; Shuai, S.; Hu, M. Individual Particles Emitted from Gasoline Engines: Impact of Engine Types, Engine Loads and Fuel Components. J. Clean. Prod. 2017, 149, 461–471. [Google Scholar] [CrossRef]
- Yang, Z.; Ge, Y.; Thomas, D.; Wang, X.; Su, S.; Li, H.; He, H. Real Driving Particle Number (PN) Emissions from China-6 Compliant PFI and GDI Hybrid Electrical Vehicles. Atmos. Environ. 2019, 199, 70–79. [Google Scholar] [CrossRef]
- Napolitano, P.; Di Domenico, D.; Di Maio, D.; Guido, C.; Golini, S. Ultra-Fine Particle Emissions Characterization and Reduction Technologies in a NG Heavy Duty Engine. Atmosphere 2022, 13, 1919. [Google Scholar] [CrossRef]
- Liu, H.; Li, Z.; Zhang, M.; Xu, H.; Ma, X.; Shuai, S. Exhaust Non-Volatile Particle Filtration Characteristics of Three-Way Catalyst and Influencing Factors in a Gasoline Direct Injection Engine Compared to Gasoline Particulate Filter. Fuel 2021, 290, 120065. [Google Scholar] [CrossRef]
- Nau, R. STATGRAPHICS V.5: Overview & Tutorial Guide. 2005. Available online: http://www.duke.edu/~rnau/sgwin5.pdf (accessed on 4 April 2024).
- Samaras, Z.; Rieker, M.; Papaioannou, E.; van Dorp, W.F.; Kousoulidou, M.; Ntziachristos, L.; Andersson, J.; Bergmann, A.; Hausberger, S.; Keskinen, J.; et al. Perspectives for Regulating 10 nm Particle Number Emissions Based on Novel Measurement Methodologies. J. Aerosol Sci. 2022, 162, 105957. [Google Scholar] [CrossRef]
- Giechaskiel, B.; Grigoratos, T.; Dilara, P.; Karageorgiou, T.; Ntziachristos, L.; Samaras, Z. Light-Duty Vehicle Brake Emission Factors. Atmosphere 2024, 15, 1–20. [Google Scholar] [CrossRef]
- Gelner, A.D.; Rothe, D.; Kykal, C.; Irwin, M.; Sommer, A.; Pastoetter, C.; Härtl, M.; Jaensch, M.; Wachtmeister, G. Particle Emissions of a Heavy-Duty Engine Fueled with Polyoxymethylene Dimethyl Ethers (OME). Environ. Sci. Atmos. 2022, 2, 291–304. [Google Scholar] [CrossRef]
Disclaimer/Publisher’s Note: The statements, opinions and data contained in all publications are solely those of the individual author(s) and contributor(s) and not of MDPI and/or the editor(s). MDPI and/or the editor(s) disclaim responsibility for any injury to people or property resulting from any ideas, methods, instructions or products referred to in the content. |
© 2024 by the authors. Licensee MDPI, Basel, Switzerland. This article is an open access article distributed under the terms and conditions of the Creative Commons Attribution (CC BY) license (https://creativecommons.org/licenses/by/4.0/).