
Study on Spatial-Temporal Evolution, Decoupling Effect and Influencing Factors of Tourism Transportation Carbon Emissions: Taking North China as an Example

Abstract
:1. Introduction
2. Materials and Methods
2.1. Study Area
2.2. Data
2.3. Methods
2.3.1. Carbon Emission Calculation Models for Tourism Traffic
2.3.2. Tapio Decoupling Model
2.3.3. LMDI Decomposition Model
3. Result
3.1. Analysis of the Spatial and Temporal Evolution of Carbon Emissions from Tourism Transportation in North China
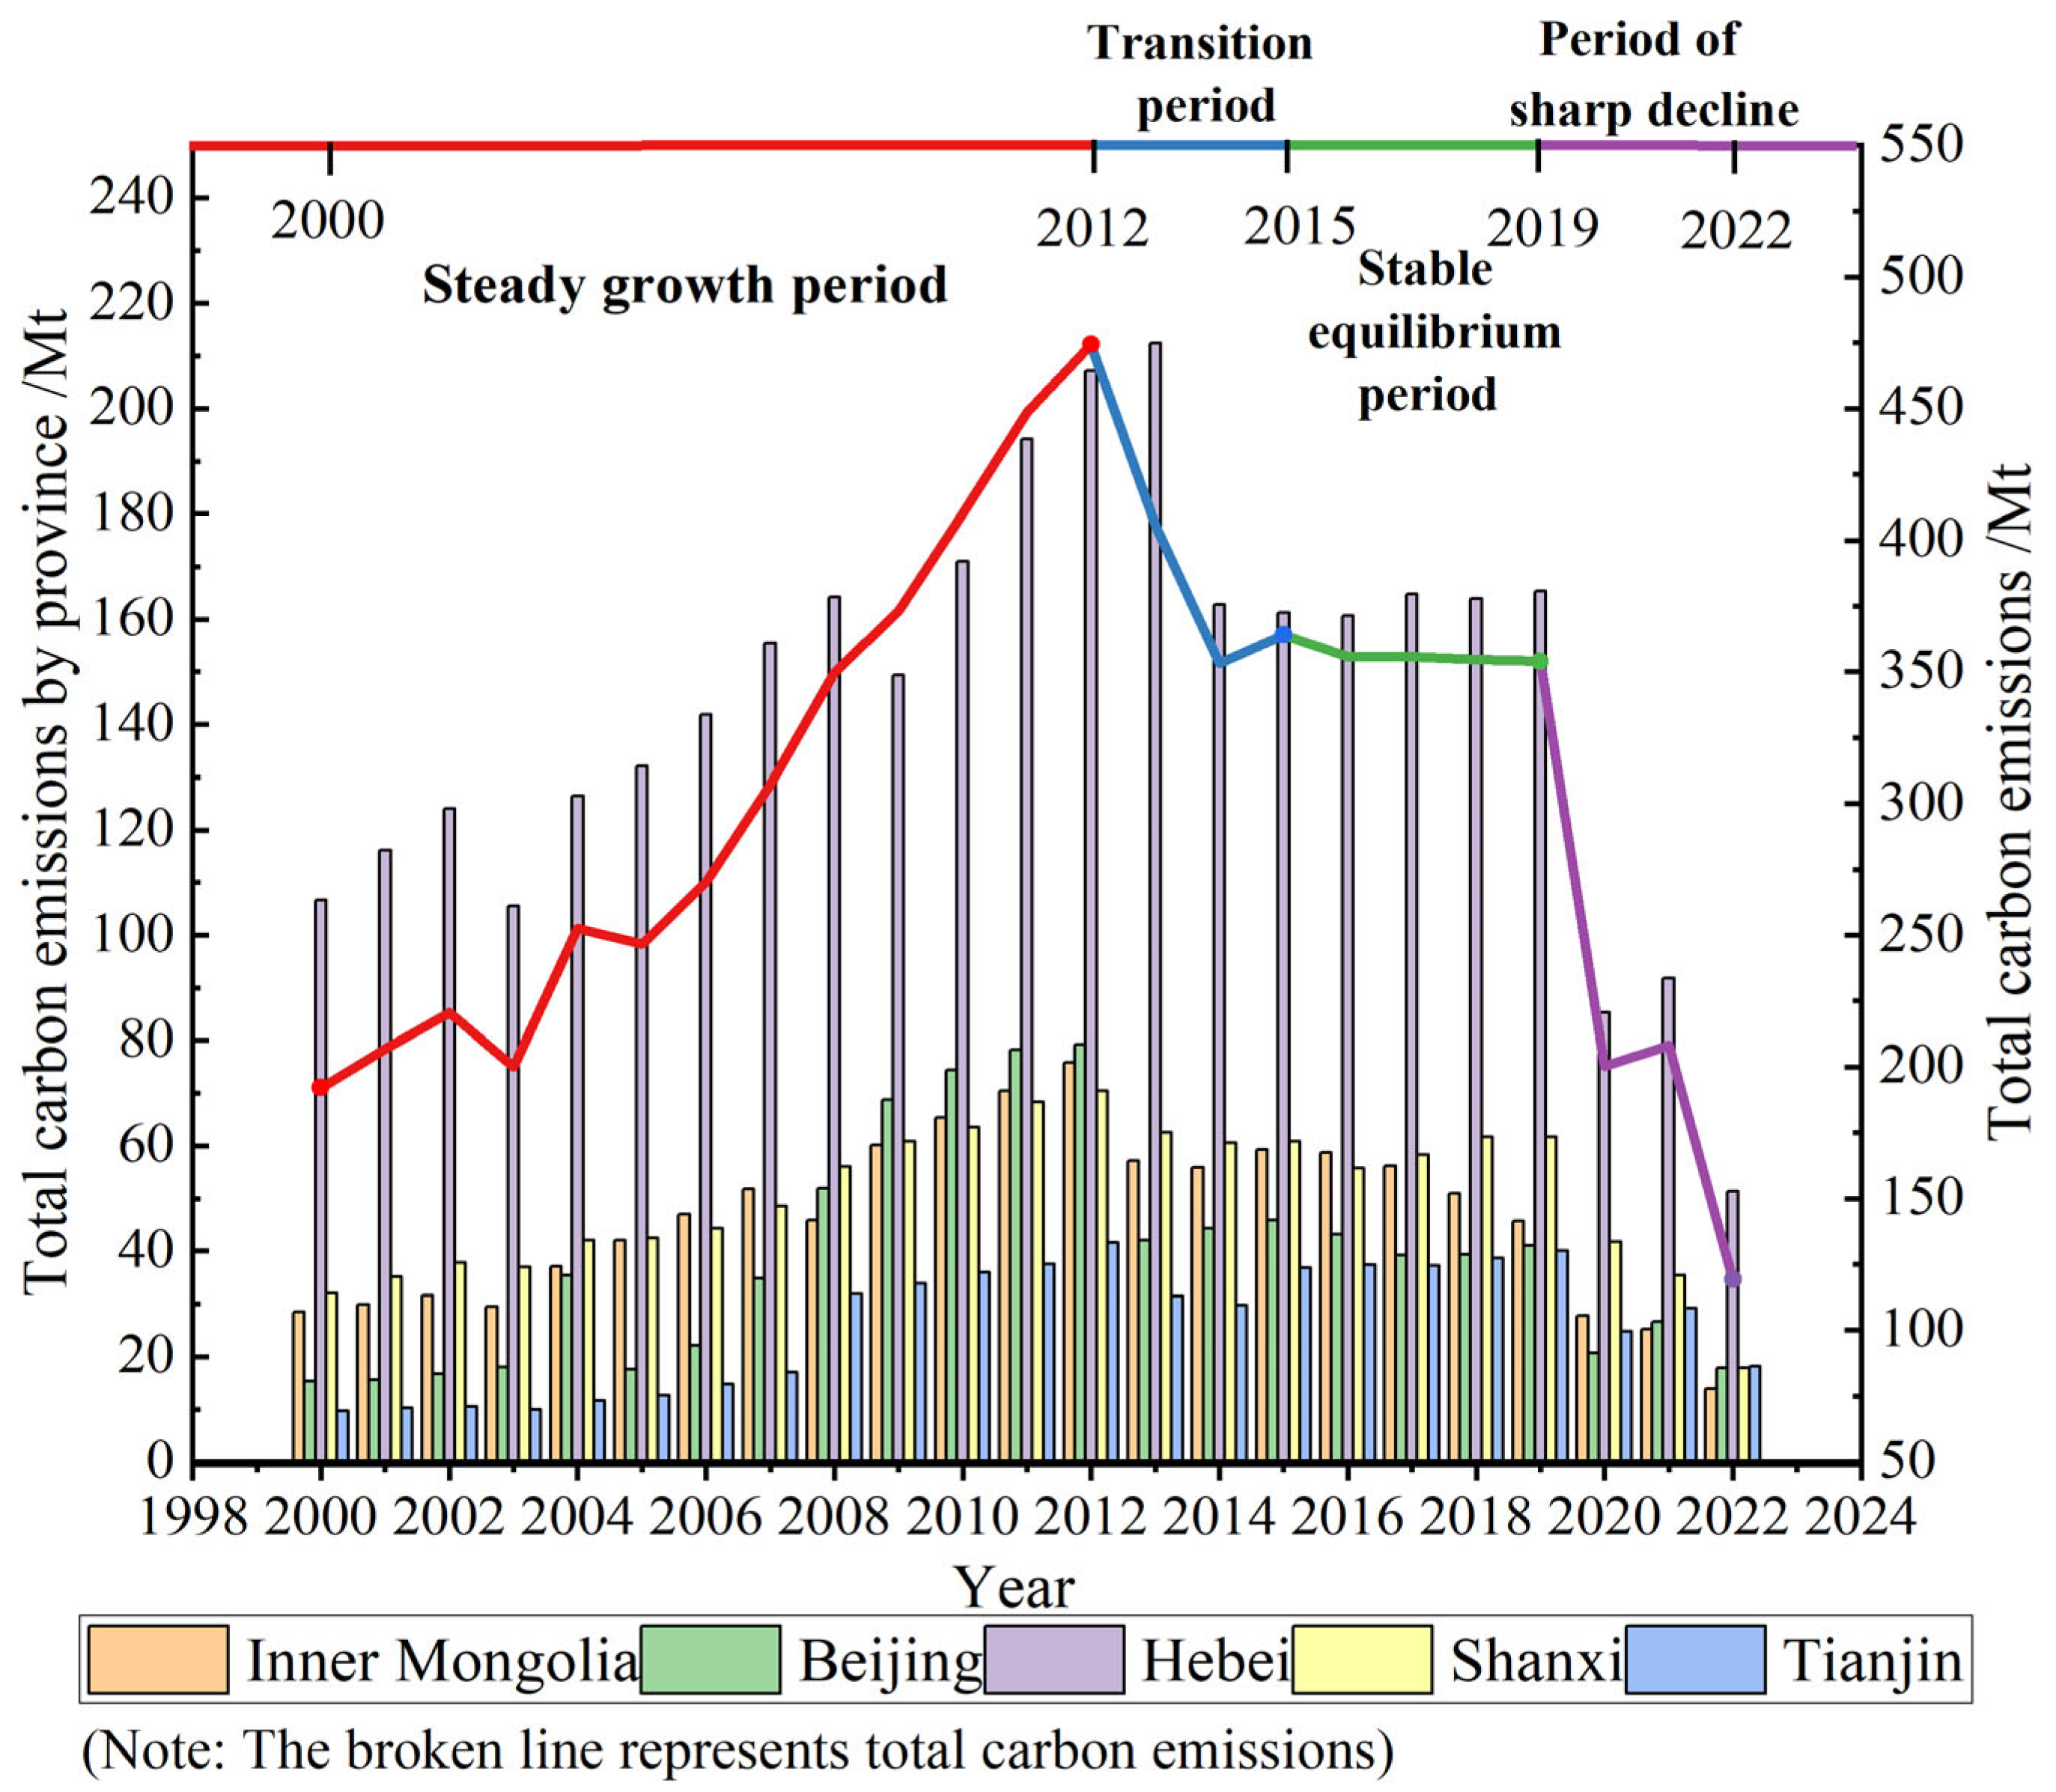
3.1.1. Analysis of Time Evolution Characteristics
- (1)
- Stable growth period (2000–2012): During this period, tourism was not yet a dominant industry in North China at this stage, which led to a low level of overall carbon emissions and a slow growth rate. While the economy of North China grew steadily, the transportation network became more and more perfect, and its carrying capacity gradually increased. The hosting of the Beijing Olympic Games has boosted the prosperity of tourism in North China and at the same time brought about an increase in carbon emissions. In 2012, carbon emissions from tourism transportation peaked for the first time.
- (2)
- Transitional adaptation period (2013–2015): During this period, the concept of low-carbon tourism gradually took root, the government’s attention to environmental protection increased, and the tourism industry began to implement low-carbon development modes such as green tourism within the industry. To reduce carbon emissions, the state has introduced a series of emission reduction policies and the Tourism Law of the People’s Republic of China, a special tourism law, that is of great significance to the transformation of China’s tourism industry and the optimization of the industrial structure.
- (3)
- Stable equilibrium stage: (2016–2019): Mass tourism, economic development, and transportation infrastructure provide good environmental conditions for its rising carbon emissions, but at the same time, emission reduction driven by the green economy has become a common concern, so the carbon emissions of the tourism industry in North China have been maintaining a relatively stable equilibrium state.
- (4)
- Dramatic decline phase (2020–2022): In 2020, due to the impact of the COVID-19 pandemic, the tourism industry was hit hard, tourism carbon emissions dropped significantly, and signs of recovery were beginning to emerge in 2021. Then, the second new crown epidemic broke out again in late 2021, restricting the development of the tourism industry, coupled with the target of carbon peaking and carbon neutrality put forward in the “Outline of the Fourteenth Five-Year Plan for the National Economic and Social Development of the People’s Republic of China and the Visionary Goals for the Year 2035” in the same year; the carbon emissions from tourism transportation were significantly lower [43] (Figure 3).
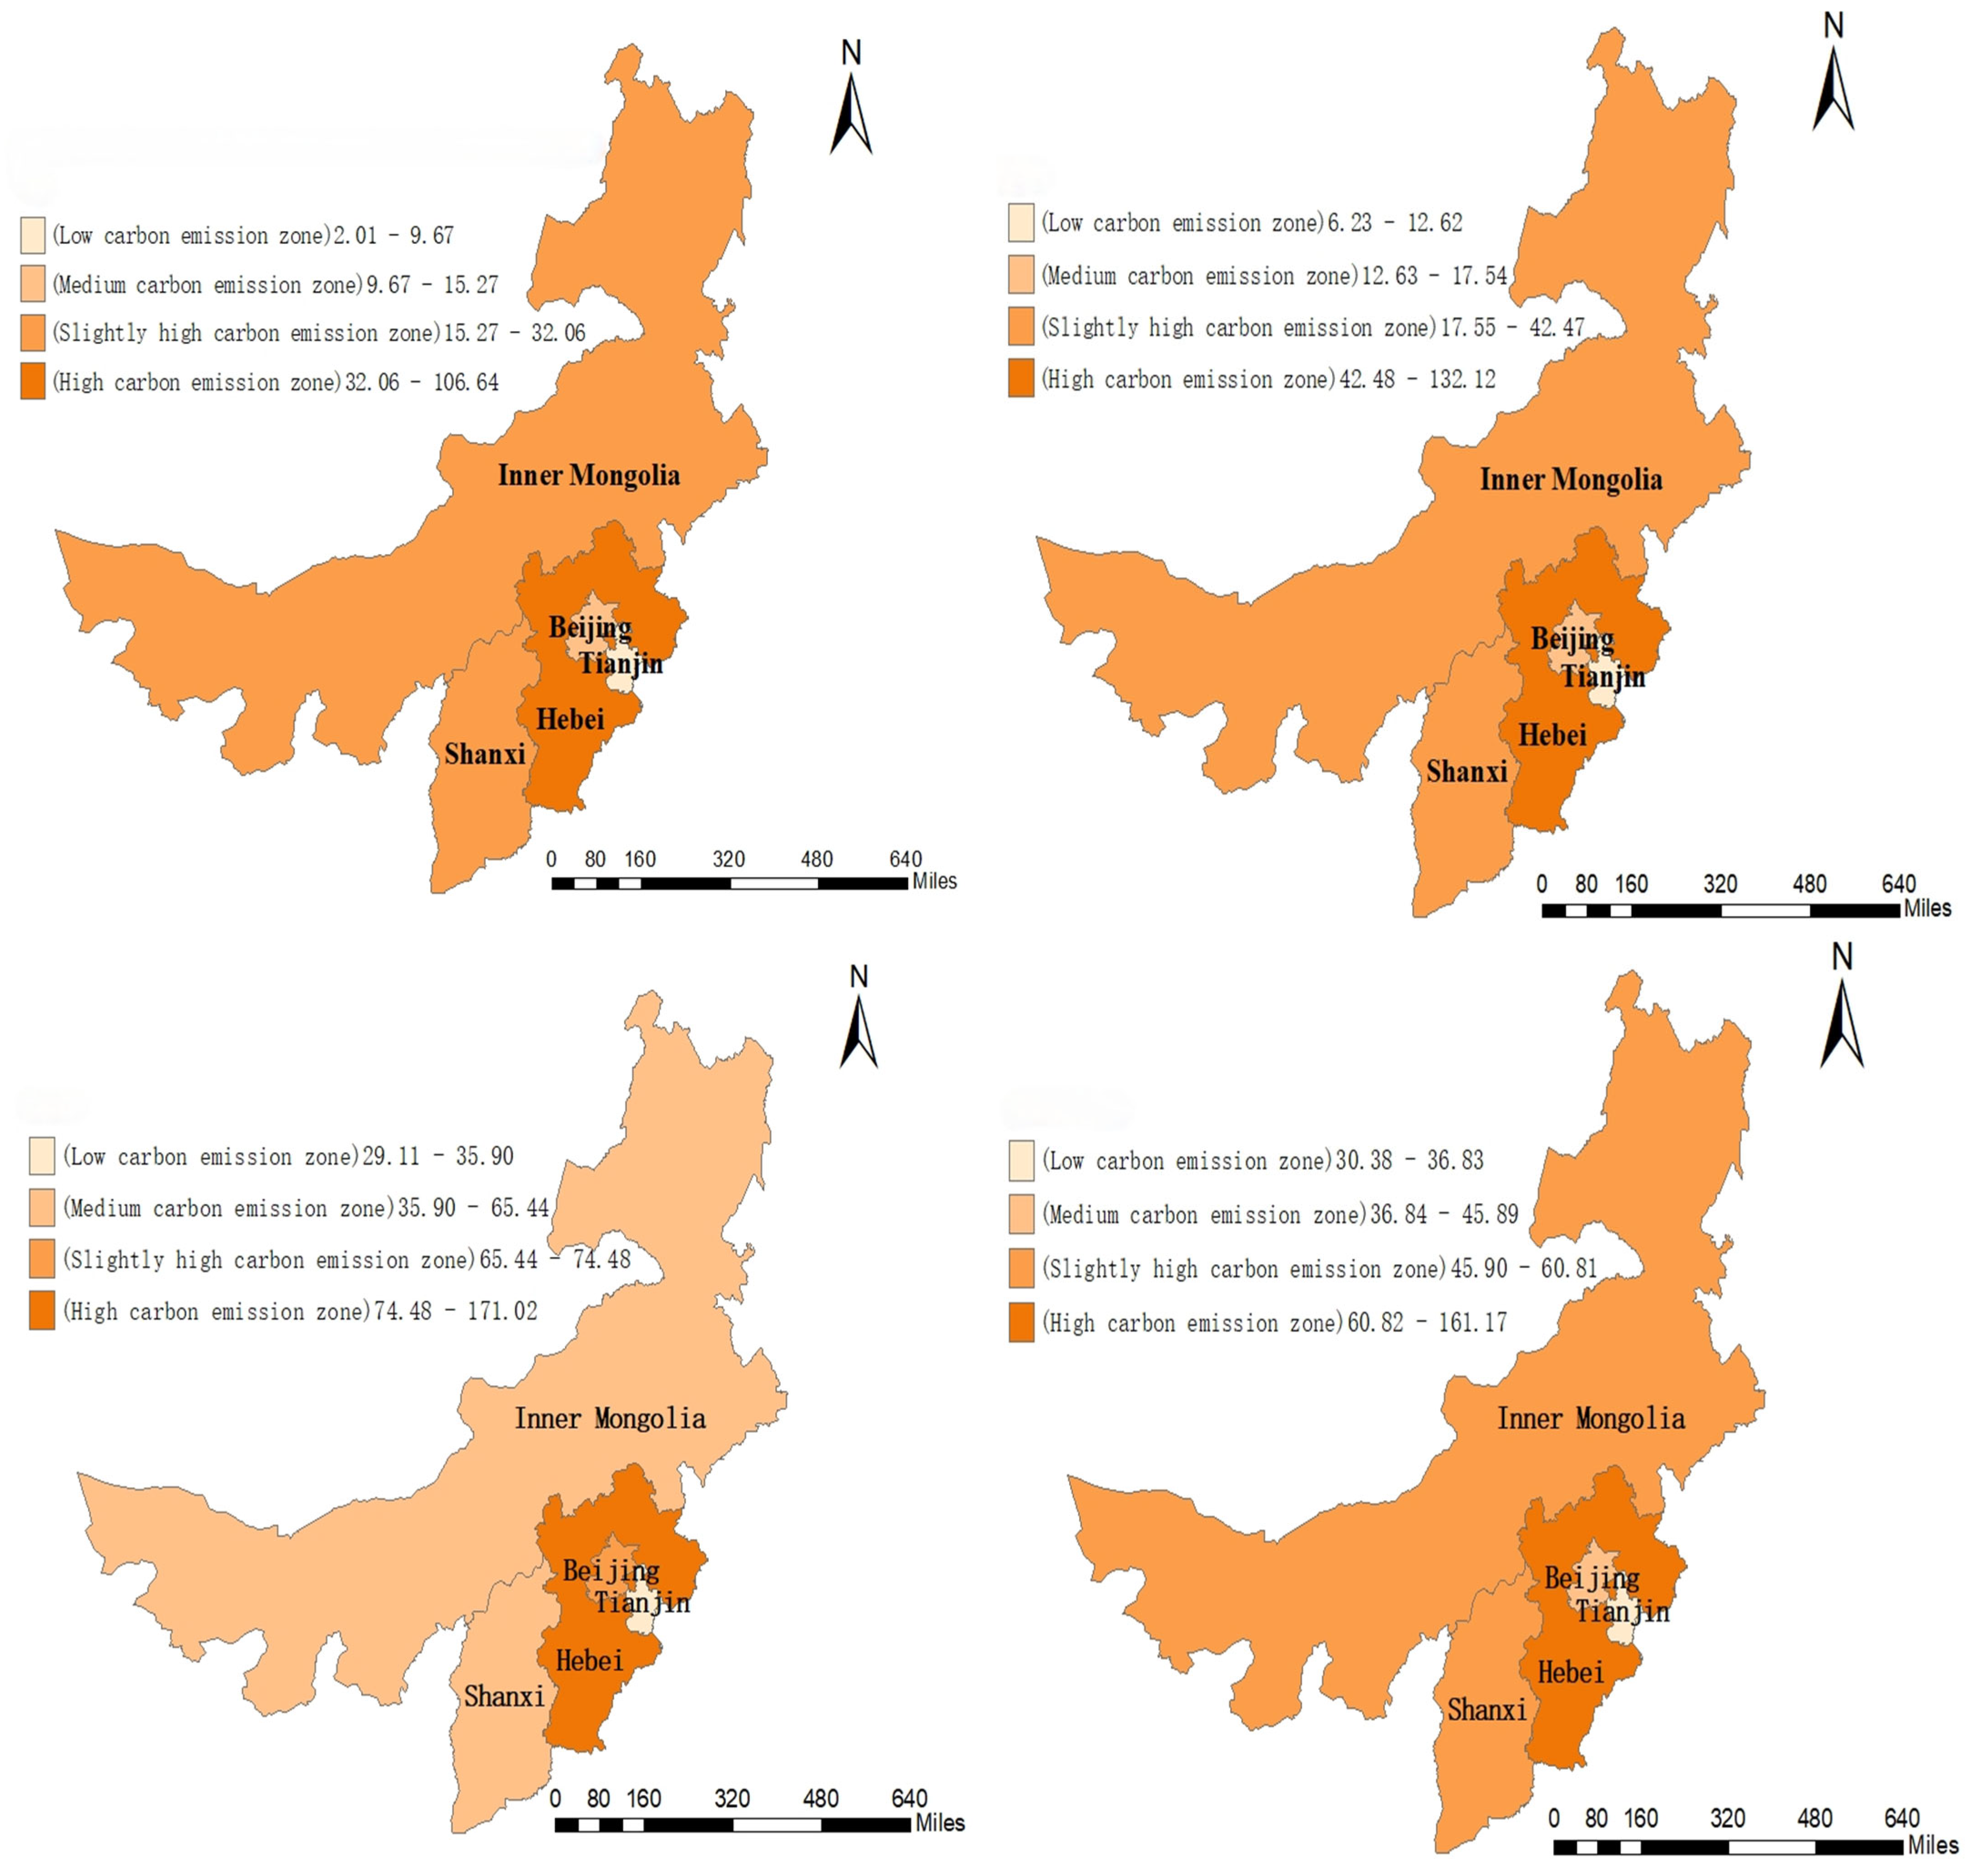
3.1.2. Analysis of Spatial Evolution Characteristics
- (1)
- In 2000 and 2005, the carbon emissions of transportation activities in different regions are significantly different. The results show that the carbon emissions of the tourism industry in Hebei and Tianjin are significantly different. Hebei is a high-carbon-emission zone, while Tianjin is a low-carbon-emission zone.
- (2)
- In 2010, Hebei was still a high-carbon-emission zone, while Beijing was converted to a high-carbon-emission zone. Other provinces and cities made the transition from high to low, such as Shanxi and Inner Mongolia from high-emission areas to medium-emission areas. The 2008 Beijing Olympics increased the city’s popularity, attracted many tourists, and significantly increased carbon emissions. In 2010, the National Development and Reform Commission launched a pilot program for “low-carbon cities”, followed by emission reduction measures in Shanxi and Inner Mongolia.
- (3)
- In 2015, the spatial distribution pattern of “Hebei first, followed by Shanxi and Inner Mongolia” was again presented. In 2013, the country introduced a series of policies and policies to mitigate climate change, making Beijing’s tourism carbon emission level relatively low.
- (4)
- In 2020 and 2022, Tianjin was planned to be transformed from a low-carbon-emission zone to a high-carbon-emission zone. In order to implement the decision-making and deployment of the Party Central Committee and The State Council on promoting the integration of culture and tourism and the development of all-region tourism and promote the high-quality development of the city’s tourism industry, Tianjin has formulated and promulgated the Two-year Action Plan for Promoting the Development of Tourism in Tianjin (2019–2020) [44]. In order to implement the spirit of the Guiding Opinions of The State Council on Accelerating the Establishment and Improvement of the Green, low-carbon and Circular Development Economic System (Guo fa [2021] No. 4), build and improve the economic system of green, low-carbon, and sustainable development in the Inner Mongolia Autonomous Region, and promote high-quality development, a series of measures have been proposed [45]. As a result, Inner Mongolia has been transformed from a medium-carbon-emission area to a low-carbon-emission area.
3.2. North China Tourism Decoupling of Economic Development and Carbon Emissions Effectiveness Analysis
- (1)
- The “W-shaped” stage is in the “Tenth Five-Year Plan” planning period. The “Outline of the Tenth Five-Year Plan for National Economic and Social Development of the People’s Republic of China” clearly indicates that in the “Tenth Five-Year Plan” period, the overall goals of China’s national economic and social development are as follows: ① Continue to develop at high speed; ② optimize the economic structure; and ③ improve the quality and efficiency of economic development [46]. The growth of tourism income, which develops together with the national economy, is more obvious, and its growth rate is faster than the growth rate of tourism and transportation carbon emissions, so this stage is mainly manifested as weak decoupling. The strong decoupling period from 2002 to 2003 and 2004 to 2005 was due to the impact of SARS, the stampede in Beijing, and the large-scale mining accident and air crash in Inner Mongolia and other places, the tourism traffic volume decreased, and correspondingly, carbon emissions decreased.
- (2)
- The “M” shape stage is mainly the weak decoupling stage. This stage is the “eleventh Five-Year” and “Twelfth Five-Year”, the national economy is stable and rapidly developing, and tourism income and transportation carbon emissions are steadily increasing. In 2007–2008, due to the economic crisis, the growth rate of tourism income slowed down, the traditional means of tourism transportation were mainly used, and the carbon emissions increased significantly so that there was expansionary negative decoupling.
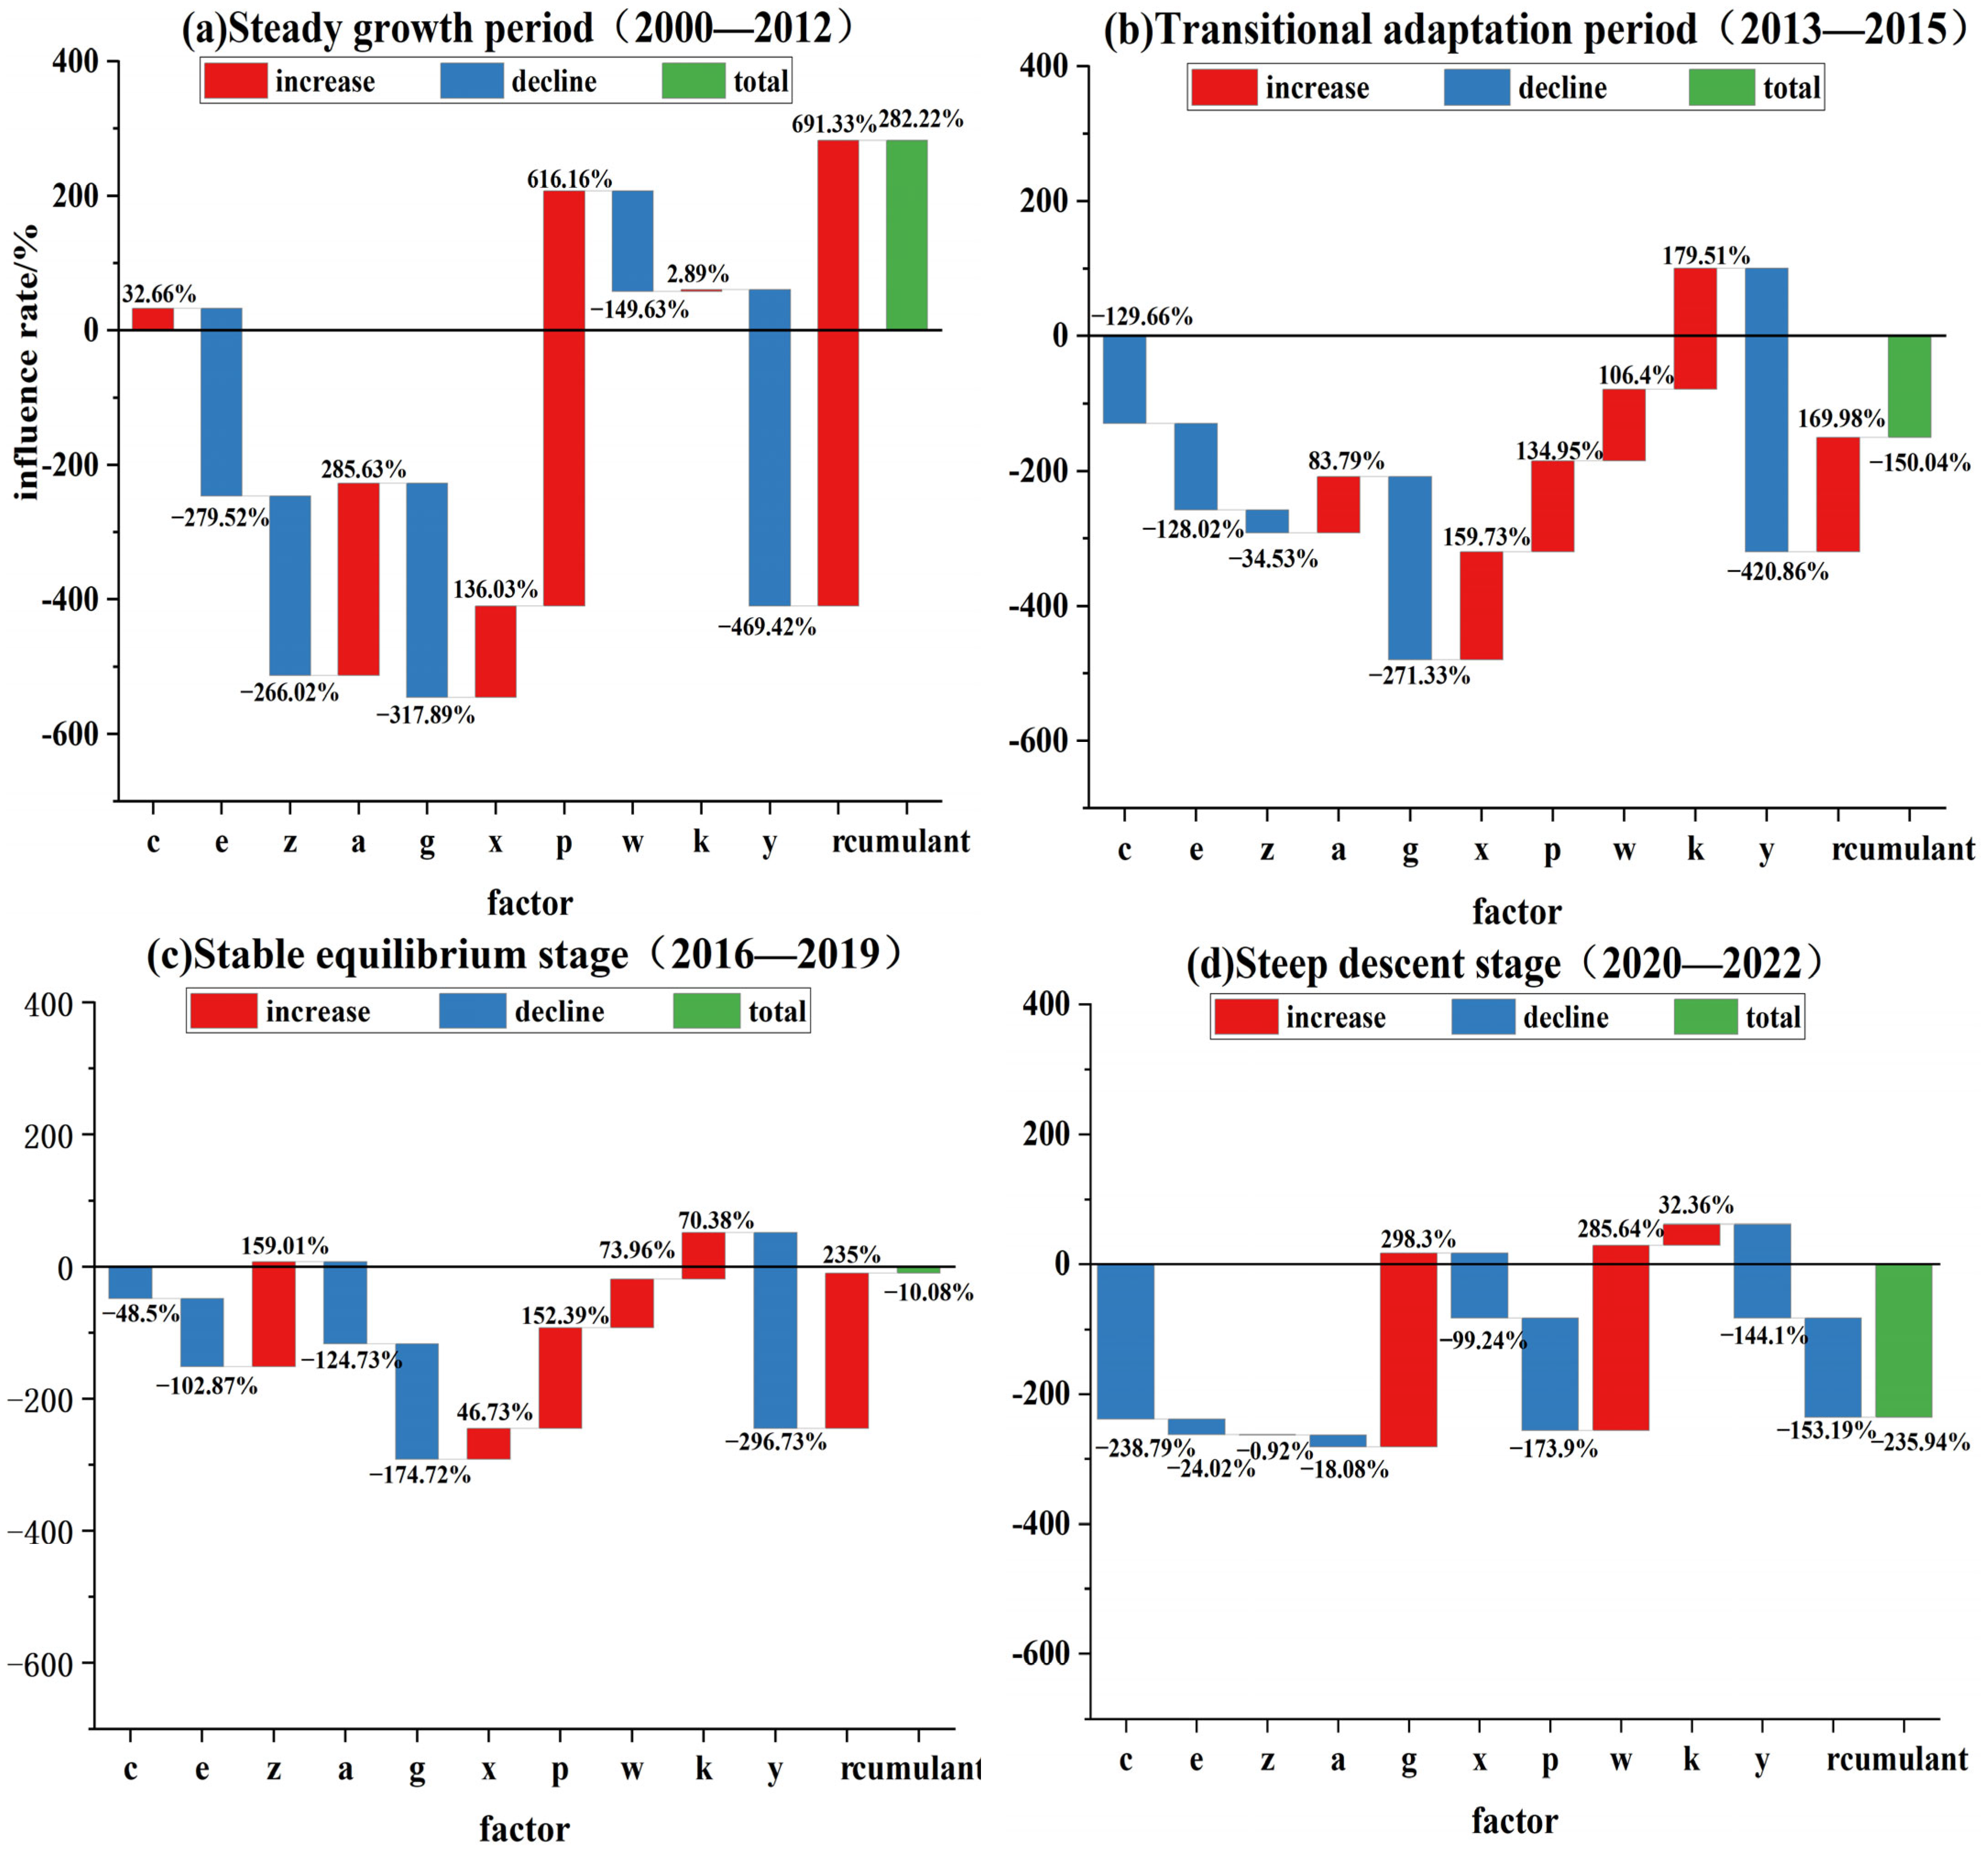
3.3. Analysis of Factors Affecting Carbon Emissions from Tourism Transportation in North China
- (1)
- In the steady growth period, the energy mix showed a slight increase effect, but the overall performance restrained carbon emissions, and it showed fluctuations under the influence of technological progress, energy optimization, economic growth, policy regulation, market mechanism, and natural emergencies. This trend reflects the complexity and uncertainty of tourism development.
- (2)
- Energy intensity in the four stages showed an inhibition effect, and according to the calculation results of the formula in Table 3, the inhibition effect showed a trend of increasing first and then decreasing and reached the peak of inhibition in 2010–2011. The negative energy intensity reflects the improvement of energy utilization efficiency in North China, which benefits from technological progress and the optimization of energy structure. This reduces energy demand per unit of output, which in turn inhibits carbon emissions from tourist transportation. At the same time, government policies, such as energy conservation and emission reduction and the promotion of new energy vehicles, also significantly affected energy consumption and tourism and transportation carbon emissions in 2010–2011, making this period have the most prominent inhibition effect.
- (3)
- The capital input–output ratio, tourism investment rate, utilization rate of cultural facilities, and patronage rate have all changed by a small margin, with a weak impact effect.
- (4)
- Tourism intensity has changed from the main inhibiting factor to the promoting factor. The reasons include the following: The rapid growth of tourism leads to an increase in transportation demand and carbon emission. The change in tourism consumption structure, such as the increase in self-driving trips and the use of private cars, leads to the rise of carbon emissions. With the improvement of tourism infrastructure construction, energy consumption and carbon emission increase. Changes in policy and market mechanisms, such as prioritizing tourism development policies over economic benefits, may diminish the focus on environmental benefits. This shift reflects the tradeoff between economic and environmental benefits in tourism development.
- (5)
- Tourism consumption level, tourist reception of cultural facilities, and tourist scale reflect the scale, activity, and development level of the tourism market from different angles, all showing the promoting effect. Among them, tourist scale and tourist reception of cultural facilities have the most obvious promoting effect on the carbon emission of tourism transportation in North China. It reflects the importance of cultural factors and the results of the in-depth development of cultural and tourism integration.
- (6)
- Passenger density significantly reduces tourism transportation carbon emissions due to the efficient use of transportation resources to reduce fuel consumption, promoting public transportation use to reduce emissions from private vehicles, optimizing transportation networks to improve public transportation accessibility, and promoting intelligent transportation to reduce congestion. These factors together promote the development of North China’s transportation system in an environmentally friendly and sustainable direction.
4. Discussion
5. Conclusions
5.1. Conclusion Summary
- (1)
- The characteristics of the spatial and temporal evolution of carbon emissions from tourism transportation. In North China, between 2000 and 2022, carbon emissions from tourism traffic reached the maximum peak at 4,743,500 tons, which can be roughly divided into four phases: a period of steady growth (2000–2012), a period of transitional adaptation (2013–2015), a period of stable equilibrium (2016–2019), and a period of dramatic decline (2020–2022). In 2020, carbon emissions from tourism traffic fell sharply to the starting level of 2000 due to the impact of the new crown epidemic. In the whole study year, the level of carbon emissions from tourism traffic is shown as Hebei Province > Shanxi Province > Inner Mongolia Autonomous Region > Beijing City > Tianjin City.
- (2)
- The decoupling effect of carbon emissions from tourism transportation and economic development. The decoupling coefficient between carbon emissions from tourism traffic and economic development in North China fluctuates but mainly shows a weak decoupling state, which means that carbon emissions from the tourism industry grow at a slower rate than the tourism industry’s economic growth rate, reflecting the fact that the tourism industry is in a sustainable development stage.
- (3)
- Analysis of factors affecting carbon emissions from tourism transportation. The first facilitator is the size of the traveling public, with an impact of 42.92 percent, and the first impediment is the density of passenger traffic, with an impact of −60.51 percent. In addition, it can also be seen that the number of tourists received by cultural facilities has a strong driving effect on carbon emissions from tourism transportation. In the context of the rapid development of culture and tourism, it is of great significance to study the mechanism of cultural factors on the carbon emission of tourism.
5.2. Proposal
- (1)
- Fine-tuning and optimizing travel routes. The results show that traveling by rail and road is the mainstay of tourism in North China, with its carbon emissions accounting for about 99.8 percent of total emissions. The reason for this is that the provinces in North China are relatively close to each other, and travelers mostly choose self-driving tours, high-speed railways, and other modes of travel, and the routes of some tourist attractions are not reasonably planned, resulting in unnecessary carbon dioxide emissions. Hence, the government and pertinent departments must undertake comprehensive optimization of tourism routes. To begin with, it is important to employ big data analysis techniques to comprehend tourists’ travel behavior patterns and preferences. This will establish a scientific foundation for the creation of more rational and effective tourist routes. Furthermore, it is imperative to enhance collaboration with other regions to foster the development of cross-regional tourism routes, thereby offering travelers more convenient and environmentally sustainable modes of transportation. Furthermore, supplementary points of interest, stations, and attractions, as well as alternative bus and subterranean joint convenient bus routes, can be established to diminish tourists’ inclination to opt for taxis or drive themselves.
- (2)
- Formulate carbon emission reduction strategies for tourism transportation according to local conditions. There are obvious regional differences in carbon emissions from tourism transportation among provinces and cities in North China. Hebei’s cumulative carbon emissions from 2000 to 2022 amount to 33,135,700 tons, which is about 5.5 times the total carbon emissions of Tianjin. In order to mitigate the issue of disparities, each province must implement a tailored emission reduction strategy that aligns with its unique circumstances. Beijing and Tianjin hold significant importance as transportation hubs within China. To effectively leverage their social, economic, and technological advantages, it is imperative to enhance research and development efforts in the areas of clean energy and environmental monitoring. This will enable these cities to take the lead in promoting the low-carbon development of the tourism industry in North China. Inner Mongolia should actively encourage the merger of “tourism + ecology”, build an ecotourism product system, and adapt the existing tourism business, leveraging its unique characteristics. Shanxi and Hebei provinces ought to consider adapting their economic growth strategies to align with local circumstances, fostering environmentally sustainable development, capitalizing on emerging prospects, initiating the digital economy as a new driving force, and achieving a harmonious integration of economic growth and ecological preservation.
- (3)
- Promote the research, development, and application of new energy transportation. The expansion of carbon emissions from tourism transportation is hindered by energy intensity and passenger density. To achieve a fundamental improvement in energy efficiency and a reasonable increase in passenger density, technical innovation is necessary. The optimization of traffic flow and reduction in ineffective driving can be achieved by the implementation of intelligent transportation systems, which encompass intelligent traffic lights, intelligent navigation, and real-time road condition monitoring. The implementation of sustainable energy sources, such as hydrogen fuel cells and solar energy, in local transportation systems has the potential to mitigate carbon dioxide emissions. The marketing of electric vehicles holds equal significance to the establishment of charging infrastructure, particularly in regions characterized by significant tourism routes and picturesque locations. Autonomous cars have the potential to mitigate human error and enhance traffic efficiency. The utilization of big data and artificial intelligence technologies for the analysis of road traffic data has the potential to establish a scientific foundation for the governance and strategic planning of urban traffic. Furthermore, the utilization of ecologically sustainable construction materials and technology is imperative for the development of tourist attractions and transportation systems. The findings of this study have the potential to offer robust technical assistance for the promotion of low-carbon tourism development in the northern region of China.
- (4)
- Enhance public awareness of environmental protection. The impact of traveler volume and tourist influx at cultural establishments in North China significantly influences the promotion of carbon emissions from tourism and transportation. This highlights the crucial role of public participation and support in effectively reducing emissions. Hence, it is advisable to augment public consciousness regarding environmental preservation by means of publicity, education, and public welfare initiatives. By facilitating environmental protection information lectures, exhibitions, and other related events, the general public can gain a comprehensive understanding of the significance and strategies employed in reducing emissions. Simultaneously, it is possible to initiate publicity efforts focused on low-carbon tourism with the aim of motivating tourists to mitigate carbon emissions during their travels. Furthermore, there is potential for enhancing real-time headcount broadcasting and implementing reservation quota restrictions at certain attractions.
- (5)
- Strengthen regional cooperation and promote coordinated development. There are large regional differences in North China, and the horizontal coordination degree is low, so there is no complete and reasonable carbon emission monitoring mechanism. All provinces and cities should strengthen exchanges and cooperation with local governments, strengthen top-level design, study and formulate corresponding normative measures, and formulate corresponding normative documents. At the same time, it is necessary to strengthen the cooperation between regions, give play to the correlation role between regions, and realize the balanced development of green transportation between regions [50].
Author Contributions
Funding
Institutional Review Board Statement
Informed Consent Statement
Data Availability Statement
Conflicts of Interest
Appendix A

| Variate | Interpretation | Unit |
|---|---|---|
| T | Added value of the tertiary industry | CNY 100 million |
| A | Investment in fixed assets | CNY 100 million |
| G | Gross regional product | CNY 100 million |
| I | Tourism income | CNY 100 million |
| K | Tourist turnover | 100 million passenger kilometers |
| P | Tourist number | 10,000 people |
| Y | Passenger volume | 10,000 people |
| W | Number of cultural facilities | 10,000 |
| C | Carbon emissions from tourism transportation | 10,000 tons |
| E | Total energy consumption | 10,000 tons |
| c | Energy mix | - |
| e | Energy intensity | Ton per CNY 10,000 |
| z | Capital input–output ratio | - |
| a | Tourism investment rate | - |
| g | Tourism intensity | - |
| x | Tourism consumption level | CNY 10,000 per person |
| p | Visitor Reception of Cultural Facilities | Person per facility |
| w | Utilization of cultural facilities | One per 10,000 person kilometers |
| k | Occupancy (the proportion of passengers traveling on a bus or train) | 10,000 km |
| y | Passenger density | - |
| r | Passenger size | 10,000 people |
References
- Ng, T.; Lye, C.T.; Lim, Y. A decomposition analysis of CO2 emissions: Evidence from Malaysia’s tourism industry. Int. J. Sustain. Dev. World Ecol. 2016, 23, 266–277. [Google Scholar] [CrossRef]
- Khanal, A.; Rahman, M.M.; Khanam, R.; Velayutham, E. Does tourism contribute towards zero-carbon in Australia? Evidence from ARDL modeling approach. Energy Strategy Rev. 2022, 43, 100907. [Google Scholar] [CrossRef]
- Patterson, M.; Mcdonald, G. How Clean and Green is New Zealand Tourism?: Lifecycle and Future Environmental Impacts; Manaaki Whenua Press: Lincoln, New Zealand, 2004. [Google Scholar]
- Kuo, N.; Chen, P. Quantifying energy use, carbon dioxide emission, and other environmental loads from island tourism based on a life cycle assessment approach. J. Clean. Prod. 2009, 17, 1324–1330. [Google Scholar] [CrossRef]
- Becken, S.; Simmons, D.G.; Frampton, C. Energy use associated with different travel choices. Tour. Manag. 2003, 24, 267–277. [Google Scholar] [CrossRef]
- Shi, P.H.; Wu, P. Preliminary estimation of energy consumption and CO2 emissions from tourism in China. J. Geogr. 2011, 66, 235–243. [Google Scholar]
- Ji, X.F.; Huang, H.Q.; Chen, F.; Li, M.J.; Li, J. Hot spots and frontier trends of domestic and international tourism traffic research. Econ. Geogr. 2024, 44, 209–220. [Google Scholar]
- Wang, D.G. A review of new propositions for tourism geography research in the era of high-speed rail networking. Geogr. Res-Aust. 2016, 35, 403–418. [Google Scholar]
- Wu, P.; Yue, S. Progress of research on energy demand and carbon dioxide emission in tourism. Tour. Trib. 2013, 28, 64–72. [Google Scholar]
- Tao, Y.G.; Huang, Z.F.; Shi, C.Y. Carbon emission calculation of regional tourism transportation based on alternative bottom-up method. Acta Ecol. Sin. 2015, 35, 4224–4233. [Google Scholar]
- Liu, J.H.; Liu, Y.X.; Huang, L. Calculation of carbon emissions from tourism transportation and analysis of driving factors in East China. Res. Environ. Sci. 2023. [Google Scholar]
- Guo, X.Y.; Mu, X.Q.; Ming, Q.Z.; Ding, Z.S. Analysis of Carbon Emission Patterns and Influencing Factors of Tourism Traffic in China. Geogr. Geogr. Inf. Sci. 2022, 38, 129–136. [Google Scholar]
- Dwyer, L.; Forsyth, P.; Spurr, R.; Hoque, S. Estimating the carbon footprint of Australian tourism. J. Sustain. Tour. 2010, 18, 355–376. [Google Scholar] [CrossRef]
- Jones; Calvin Scenarios for greenhouse gas emissions reduction from tourism: An extended tourism satellite account approach in a regional setting. J. Sustain. Tour. 2013, 21, 458–472. [CrossRef]
- Sun, Y.Y. Estimation of carbon emissions from tourism in Shanghai and its effect decomposition. Reg. Res. Dev. 2020, 39, 122–126. [Google Scholar]
- Wang, K.; He, J.; Gan, C.; Xi, J.C. Spatial spillover effects of structural change in China’s tourism industry on the carbon emission efficiency of tourism. China Soft Sci. 2022, 15, 50–60. [Google Scholar]
- Lin, T. Carbon dioxide emissions from transportation in Taiwan’s national parks. Tour. Manag. 2010, 31, 285–290. [Google Scholar] [CrossRef]
- Yorucu, V. Growth impact of CO2 emissions caused by tourist arrivals in Turkey: An econometric approach. Int. J. Clim. Chang. Str. 2016, 8, 19–37. [Google Scholar] [CrossRef]
- Hu, C.; Ding, Z.S.; Mu, X.Q.; Guo, X.Y.; Du, Z.J. Spatial and temporal evolution of carbon emissions from tourism traffic in the Yangtze River Economic Belt and the driving factors. J. Nanjing Norm. Univ. (Nat. Sci. Ed.) 2022, 45, 40–48. [Google Scholar]
- Li, J.M.; Li, M.; Yuan, M.L.; Li, M. Study on the spatial and temporal evolution of carbon emissions from tourism traffic and influencing factors in provinces along the Grand Canal Cultural Belt. Sustainability 2023, 15, 6563. [Google Scholar]
- Wang, L.G.; Zhu, H. A multi-scenario study on the evolution of carbon emissions from tourism in Jiangxi Province under the “dual-carbon” goal (in English). J. Resour. Ecol. 2023, 14, 265–275. [Google Scholar]
- Zhang, M.; Li, H.; Zhou, M.; Mu, H. Decomposition analysis of energy consumption in the Chinese transportation sector. Appl. Energ. 2011, 88, 2279–2285. [Google Scholar] [CrossRef]
- Lin, Y.; Ma, L.; Li, Z.; Ni, W. The carbon reduction potential by improving technical efficiency from energy sources to final services in China: An extended Kaya identity analysis. Energy 2023, 263, 125963. [Google Scholar] [CrossRef]
- Eskander, S.M.S.U.; Nitschke, J. Energy use and CO2 emissions in the UK universities: An extended Kaya identity analysis. J. Clean. Prod. 2021, 309, 127199. [Google Scholar] [CrossRef]
- Ling, L.W.; Zhang, D.B. EKC curve test and Influencing factors of “three wastes” in Guangdong Province: Based on Kaya identity and LMDI decomposition method. Ecol. Econ. 2017, 33, 161–166. [Google Scholar]
- Wang, W.; Yang, Y. Spatial-temporal differentiation characteristics and driving factors of China’s energy eco-efficiency based on geographical detector model. J. Clean. Prod. 2024, 434, 140153. [Google Scholar] [CrossRef]
- Guan, Y.H.; Wu, J.M.; He, Y.Q. Enterprise innovation type, non-farm employment, and farmers’ income. Res. Financ. Econ. Issues 2020, 29, 121–129. [Google Scholar]
- Lundquist, S. Explaining events of strong decoupling from CO2 and NOx emissions in the OECD 1994–2016. Sci Total Env. 2021, 793, 148390. [Google Scholar] [CrossRef] [PubMed]
- Liu, F.; Kang, Y.; Guo, K. Is electricity consumption of Chinese counties decoupled from carbon emissions? A study based on the Tapio decoupling index. Energy 2022, 251, 123879. [Google Scholar] [CrossRef]
- Wang, Z.; Lv, D.; Li, M.S. Analysis of Agricultural CO 2 Emissions in Henan Province, China, Based on EKC and Decoupling. Sustainability 2022, 14, 1931. [Google Scholar] [CrossRef]
- Liu, J.Y.; Xie, J. Environmental regulation and export quality upgrading of manufacturing industry—A perspective based on heterogeneity of factor input structure. China’s Popul. Resour. Environ. 2018; 28, 158–167. [Google Scholar]
- Climate Change and Tourism? Responding to Global Challenges; World Tourism Organization: Madrid, Spain, 2008; p. 268.
- Wei, Y.X.; Sun, G.N.; Ma, L.J.; Li, J. Preliminary estimation of carbon emissions from tourism transportation and regional differences in China. J. Shaanxi Norm. Univ. (Nat. Sci. Ed.) 2012, 40, 76–84. [Google Scholar]
- Peeters, P.; Dubois, G. Tourism travel under climate change mitigation constraints. J. Transp. Geogr. 2010, 18, 447–457. [Google Scholar] [CrossRef]
- Nikfar, S.; Mozaffari, S. Organization for Economic Cooperation and Development (OECD). In Encyclopedia of Toxicology, 4th ed.; Wexler, P., Ed.; Academic Press: Oxford, UK, 2024; pp. 157–165. [Google Scholar]
- Sun, R. Improvement of Tapio decoupling index calculation method and its application. Res. Tech. Econ. Manag. 2014, 7–11. [Google Scholar]
- Tapio, P. Towards a theory of decoupling: Degrees of decoupling in the EU and the case of road traffic in Finland between 1970 and 2001. Transp. Policy 2005, 12, 137–151. [Google Scholar] [CrossRef]
- Long, K.L. Analysis of Time-Varying Factors and Spatial Difference Drivers of Carbon Intensity in China’s Logistics Industry. Master’s Thesis, Tianjin University of Technology, Tianjin, China, 2023. [Google Scholar]
- Li, K.; Wang, Q. Decomposition of carbon emission changes in Chinese industries by integrating consumption and value-added perspectives. China Popul.-Resour. Environ. 2020, 30, 37–48. [Google Scholar]
- Ang, B.W. Decomposition analysis for policymaking in energy: Which is the preferred method? Energ. Policy 2004, 32, 1131–1139. [Google Scholar] [CrossRef]
- Zhao, X.C.; Teng, J. Decomposition of factors affecting tourism carbon emissions in Hunan Province based on LMDI. Environ. Sci. Technol. 2018, 41, 192–199. [Google Scholar]
- Wang, J.; Xue, J.J. Calculation of carbon emissions from tourism transportation and analysis of influencing factors. Stat. Decis. Mak. 2016, 61–64. [Google Scholar]
- Qian, S. Programme for Improving the Dual Control System of Energy Consumption Intensity and Total Volume Released. China Pap. 2021, 42, 3. [Google Scholar]
- Zheng, X. A study on the Calculation and Evolution Logic of Cultural Tourism Integration Policies in Tianjin. Master’s Thesis, Tianjin University of Commerce, Tianjin, China, 2022. [Google Scholar]
- Letter from the General Office of the Ministry of Commerce on Recommending Key Contacts of Recycling Enterprises. Renew. Resour. Circ. Econ. 2021, 14, 6.
- Zhang, S.L. The Four “Fifth Plenums” Since the Reform and Opening Up: An Analysis of the Themes of the Fifth Plenum of the Seventeenth Central Committee of the Communist Party of China. Climbing 2011, 30, 3–8. [Google Scholar]
- Xue, J.N. Research on the Relationship between Energy Prices, Technological Progress, and Carbon Emissions in China. Ph.D. Thesis, Shandong University, Jinan, China, 2015. [Google Scholar]
- Huang, L. Game and Econometric Analysis of Carbon Market Trading Price and Compliance Regulation. Master’s Thesis, Capital University of Economics and Business, Beijing, China, 2017. [Google Scholar]
- Guo, X.Q. Opening a new journey of ecological civilization construction with green development concept. J. Yinchuan Munic. Party Coll. C.P.C. 2016, 18, 73–76. [Google Scholar]
- Li, Y.; Li, C.; Feng, D. Study on Transportation Green Efficiency and Spatial Correlation in the Yangtze River Economic Belt. Sustainability 2024, 16, 3686. [Google Scholar] [CrossRef]


| Period | αi | |||
|---|---|---|---|---|
| Railways | Motorway | Aeronautical | Waterborne | |
| 2000–2008 | 31.6 | 13.8 | 64.7 | 10.6 |
| 2009–2014 | 36.9 | 16.7 | 60.4 | 7.1 |
| 2015–2019 | 38.7 | 17.5 | 59.1 | 5.8 |
| 2020–2022 | 43.9 | 21.3 | 50.6 | 5.2 |
| Degree of Decoupling | Norm | Descriptions | |||
|---|---|---|---|---|---|
| %ΔC | %ΔI | t | |||
| Negative decoupling | Weak-negative decoupling | <0 | <0 | 0 < t < 0.8 | Economic downturn, CO2 emissions decrease, and the economy slows down faster than carbon emissions. |
| Strong-negative decoupling | >0 | <0 | t < 0 | Economic downturn and increased CO2 emissions. | |
| Expansion negative decoupling | >0 | >0 | t > 1.2 | The economy grows, CO2 emissions increase, and carbon emissions grow faster than the economy. | |
| Connection | Growing connection | >0 | >0 | 0.8 < t < 1.2 | Economic growth, increased CO2 carbon emissions. |
| Recession connection | <0 | <0 | 0.8 < t < 1.2 | Economic downturn reduces CO2 emissions. | |
| Decoupling | Weak decoupling | >0 | >0 | 0 < t < 0.8 | Economy grows, CO2 emissions increase, carbon emissions grow slower than economic growth. |
| Strong decoupling | <0 | >0 | t < 0 | Economic growth and reduced CO2 emissions. | |
| Recessionary decoupling | <0 | <0 | t > 1.2 | Economic downturn, CO2 emissions decrease, and economic slowdown is slower than carbon slowdown. | |
| Considerations | Interpretation | Markings | Magnitude of Change |
|---|---|---|---|
| Energy mix | C/E | c | |
| Energy intensity | E/T | e | |
| Capital input–output ratio | T/A | z | |
| Tourism investment rate | A/G | a | |
| Tourism intensity | G/I | g | |
| Tourism consumption level | I/P | x | |
| Visitor Reception of Cultural Facilities | P/W | p | |
| Utilization of cultural facilities | W/K | w | |
| Occupancy (i.e., the proportion of passengers traveling on a bus or train) | K/Y | k | |
| Passenger density | Y/P | y | |
| Passenger size | P | r |
| Factor | Contribution Degree (%) |
|---|---|
| Energy mix | −17.46 |
| Energy intensity | −22.49 |
| Capital input–output ratio | −6.48 |
| Tourism investment rate | 10.30 |
| Tourism intensity | −21.17 |
| Tourism consumption level | 11.06 |
| Visitor Reception of Cultural Facilities | 33.16 |
| Utilization of cultural facilities | 14.38 |
| Occupancy (i.e., the proportion of passengers traveling on a bus or train) | 12.96 |
| Passenger density | −60.51 |
| Passenger size | 42.92 |
| Equation | Model Summary | Coefficient | ||||||
|---|---|---|---|---|---|---|---|---|
| R2 | Adjusted R2 | F | Significance | a1 | a2 | a3 | Constant | |
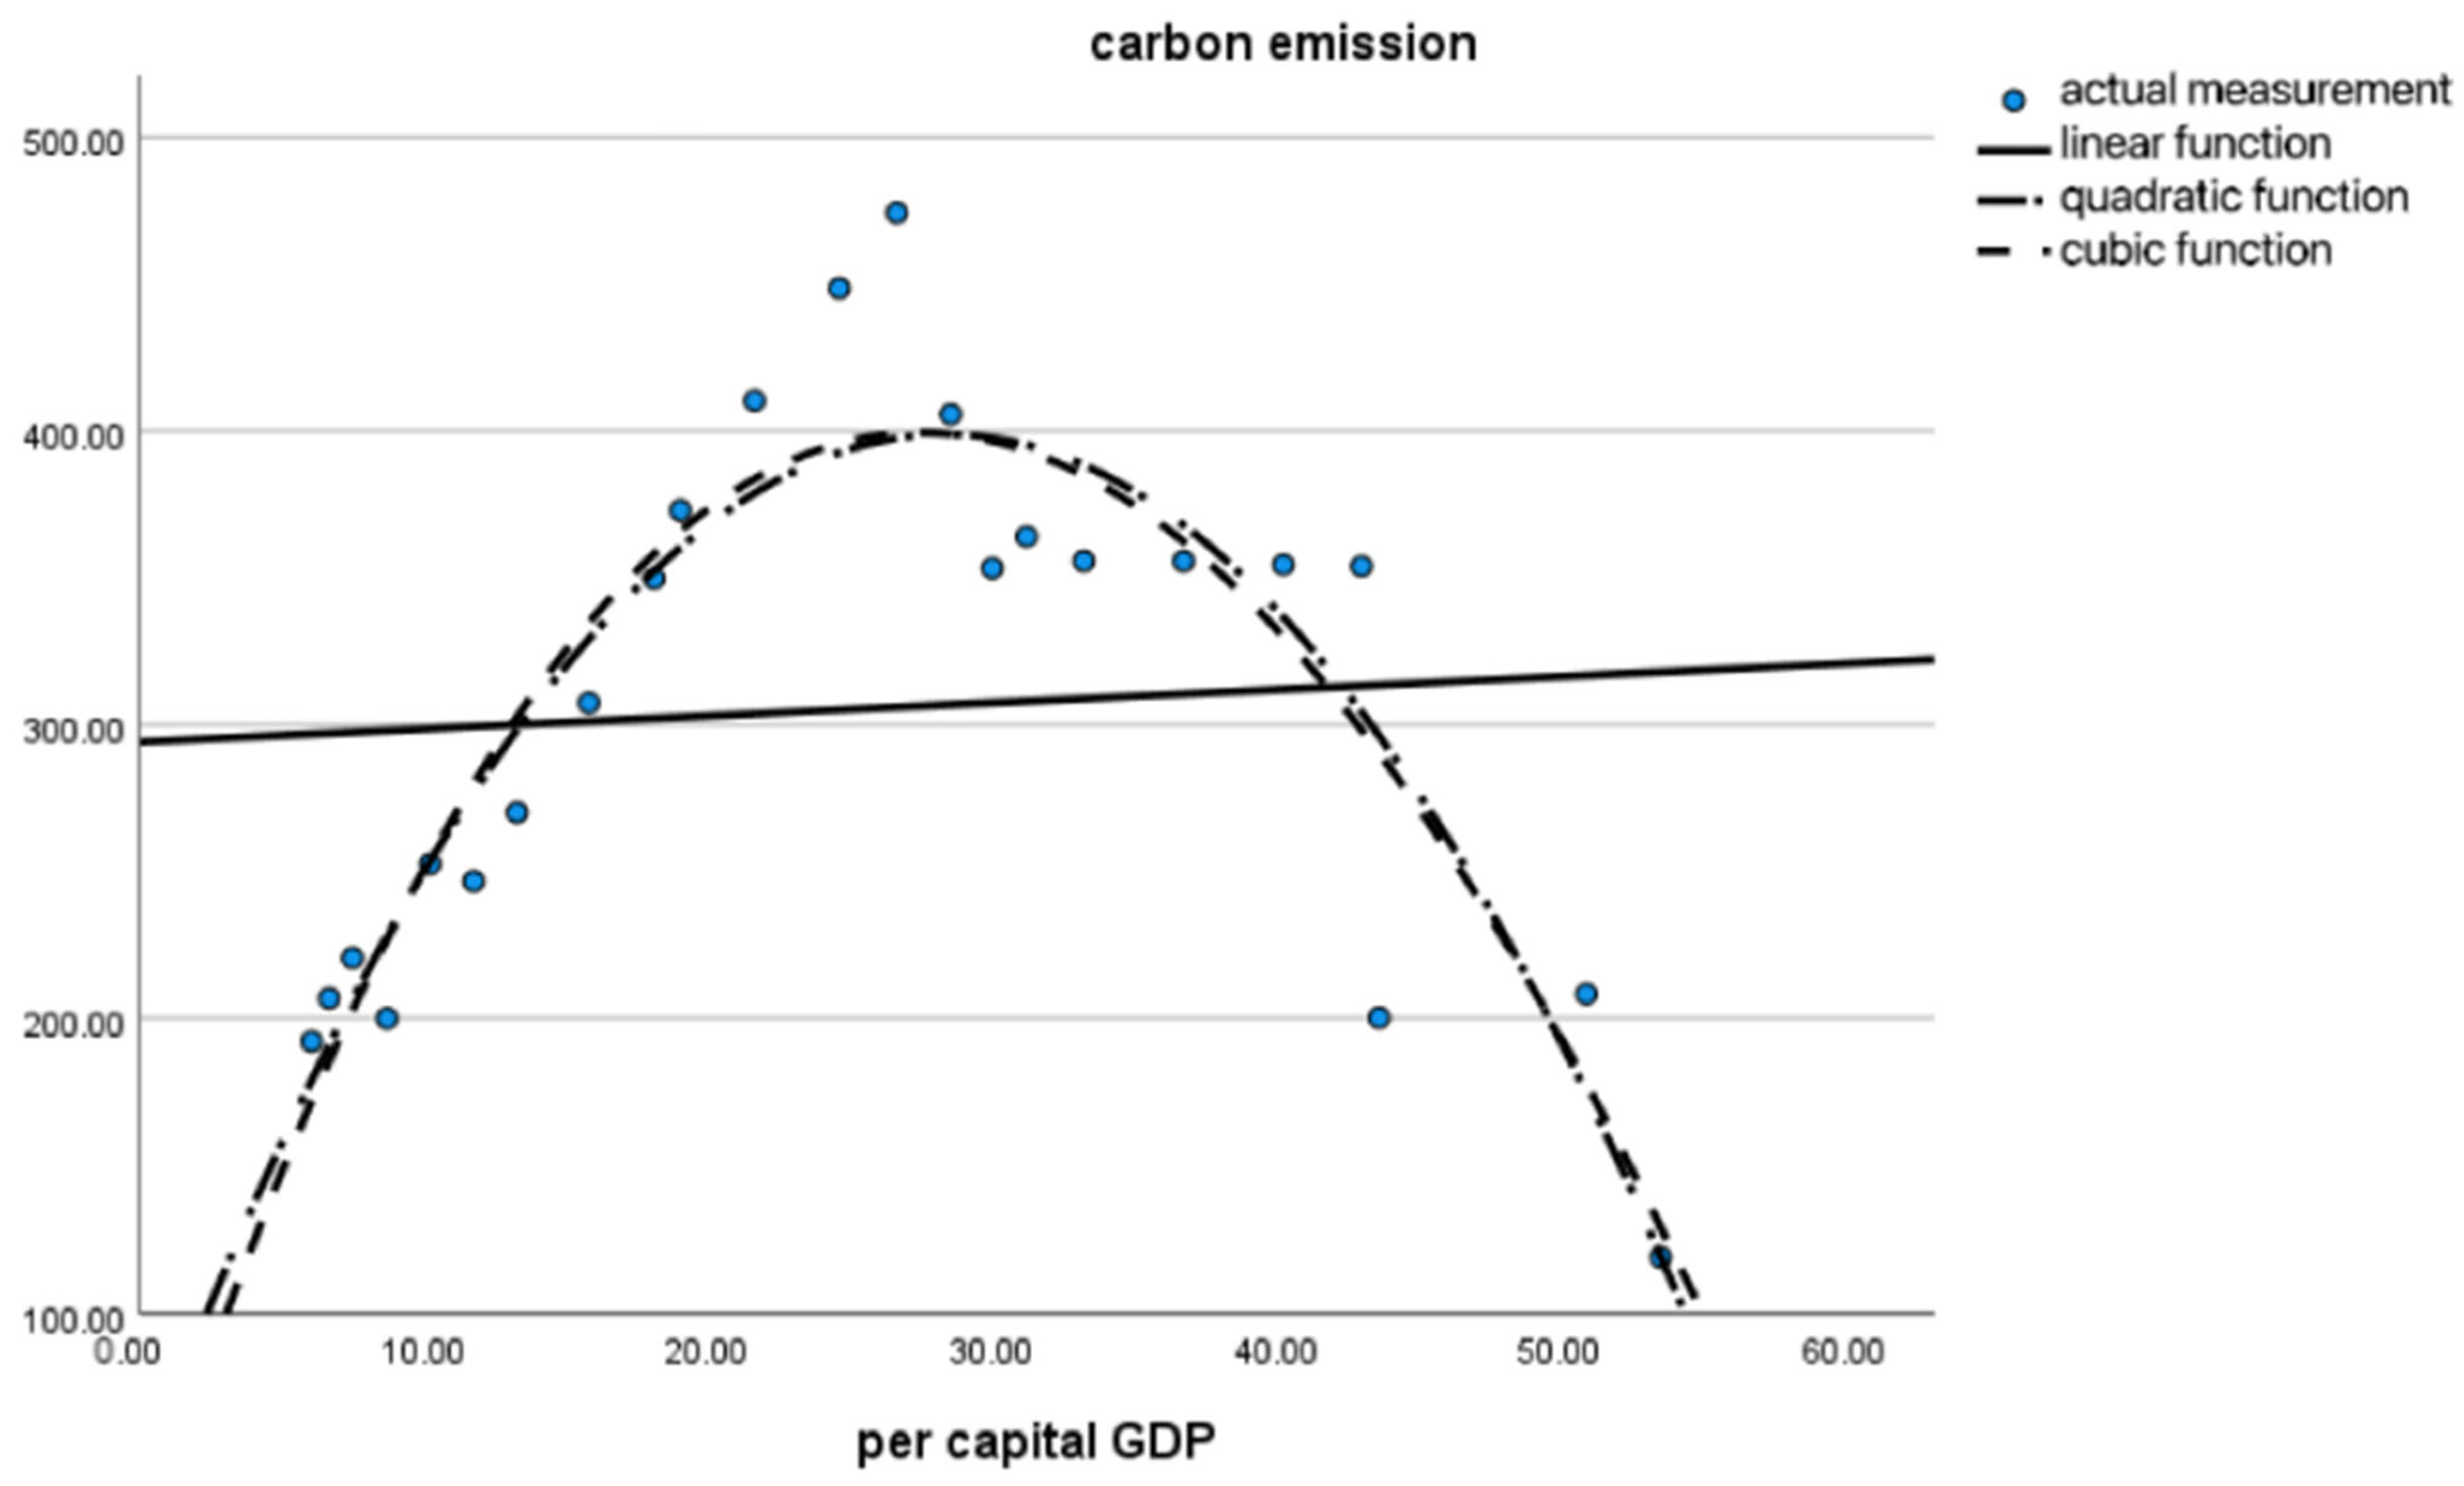
| Linear function | 0.005 | −0.043 | 0.099 | 0.756 | 0 | 0 | 0.445 | 294.105 |
| Quadratic function | 0.841 | 0.825 | 52.891 | <0.001 | 0 | −0.441 | 25.038 | 43.717 |
| Cubic function | 0.844 | 0.819 | 34.185 | <0.001 | 0.002 | −0.622 | 29.476 | 16.07 |
Disclaimer/Publisher’s Note: The statements, opinions and data contained in all publications are solely those of the individual author(s) and contributor(s) and not of MDPI and/or the editor(s). MDPI and/or the editor(s) disclaim responsibility for any injury to people or property resulting from any ideas, methods, instructions or products referred to in the content. |
© 2024 by the authors. Licensee MDPI, Basel, Switzerland. This article is an open access article distributed under the terms and conditions of the Creative Commons Attribution (CC BY) license (https://creativecommons.org/licenses/by/4.0/).
Share and Cite
Feng, D.; Li, C.; Li, Y. Study on Spatial-Temporal Evolution, Decoupling Effect and Influencing Factors of Tourism Transportation Carbon Emissions: Taking North China as an Example. Atmosphere 2024, 15, 720. https://doi.org/10.3390/atmos15060720
Feng D, Li C, Li Y. Study on Spatial-Temporal Evolution, Decoupling Effect and Influencing Factors of Tourism Transportation Carbon Emissions: Taking North China as an Example. Atmosphere. 2024; 15(6):720. https://doi.org/10.3390/atmos15060720
Chicago/Turabian StyleFeng, Dongni, Cheng Li, and Yangzhou Li. 2024. "Study on Spatial-Temporal Evolution, Decoupling Effect and Influencing Factors of Tourism Transportation Carbon Emissions: Taking North China as an Example" Atmosphere 15, no. 6: 720. https://doi.org/10.3390/atmos15060720