Article

Associations between Indoor and Outdoor Size-Resolved Particulate Matter in Urban Beijing: Chemical Compositions, Sources, and Health Risks

1
Beijing City University, Beijing 100083, China
2
Institute of Analysis and Testing (Beijing Center for Physical and Chemical Analysis), Beijing Academy of Science and Technology, Beijing 100089, China
3
Beijing Municipal Pollution Source Management Center, Beijing 100089, China
4
College of Biology and the Environment, Nanjing Forestry University, Nanjing 210037, China
5
Department of Chemistry, Capital Normal University, Beijing 100048, China
*
Authors to whom correspondence should be addressed.
Atmosphere 2024, 15(6), 721; https://doi.org/10.3390/atmos15060721
Submission received: 29 April 2024 / Revised: 5 June 2024 / Accepted: 12 June 2024 / Published: 16 June 2024
(This article belongs to the Special Issue New Insights into Exposure and Health Impacts of Air Pollution)

Abstract

:
Ventilation may lead to a deterioration in indoor air quality in urban environments located close to roads. Understanding the differences in the chemical compositions of size-resolved particulate matter (PM) in indoor air and outdoor air could aid in assessing the health impacts of air in these settings and establishing relevant regulation policies. In this study, indoor and outdoor size-resolved PM was collected from an office in Beijing in summer (between 5 and 25 July 2020) and winter (between 5 and 31 January 2021). Its chemical components, including sulfate, nitrate, ammonium, chlorine, organic matter (OM), elemental carbon (EC), crustal materials (CM), and heavy metals (HM), were analyzed. The mean levels of indoor and outdoor PM2.1 and PM9 were found to be much higher than those in the guidelines for PM2.5 and PM10 outlined by the National Ambient Air Quality Standard. Moreover, the levels of PM2.1 and PM2.1–9 mass were higher outdoors than they were indoors. The size distributions of mass concentrations were shown to be bimodal, peaking at 0.43–0.65 μm and 4.7–5.8 μm, respectively. The most abundant chemicals were OM, nitrate, and sulfate for PM2.1 and OM, CM, and nitrate for PM2.1–9. We found higher percentages of sulfate, nitrate, ammonium, EC, and HM in smaller-size fractions of PM. Additionally, positive matrix factorization showed that biomass burning, secondary inorganic aerosol, coal combustion, dust, traffic, and industrial pollution were the main sources of PM during the study period. The greatest non-carcinogenic and carcinogenic hazards were found at 0.43–0.65 μm in summer and 2.1–3.3 μm in winter. Our results indicate that size-resolved PM of ambient origin may infiltrate buildings near roads to varying degrees, resulting in negative health effects.

1. Introduction

Particulate matter (PM) is considered one of the major pollutants in the air, with a negative influence on public health and air quality [1,2]. Some studies have found associations between short-term exposure to PM pollution and increased rates of negative health outcomes, including the induction of lung cancer morbidity and cardiopulmonary mortality [3,4,5,6,7,8]. Comprehensive information on size distributions and associated chemical compositions is essential in assessing the health effects of PM [9,10]. Large-size particles can dominate the deposition fraction of PM over different sections of the respiratory air passage [11]. Close links between chemical components and the toxicity of PM have been documented [12]. Heavy metals are one of the main PM components associated with adverse health effects [13]. Past findings have proven that metals on the surface of airborne particles can cause mitochondrial damage and oxidative stress [14]. The determination of chemical species in size-resolved fractions of PM is central in evaluating the health impacts associated with exposure to airborne particles [15].
For urban populations, indoor environments represent one of the largest factors in daily inhalation exposure to PM, even at low levels, because people spend approximately 90% of their time indoors [6,7]. Natural and artificial ventilation may negatively influence indoor air quality through the process of air movement in close proximity to a road [16,17]. In urban environments, researchers have investigated PM sources and associated health risks outdoors [8], but the possible impacts of outdoor air pollution on indoor air quality are not yet well understood. Regarding the potential health risks associated with the ventilation of outdoor air pollution [18,19], two questions should be addressed separately. Firstly, we must distinguish the differences in the size fractions and chemical components of indoor and outdoor PM, as they may originate from different sources [17]. Then, since the size fractions for indoor and outdoor PM may vary, assessments of potential health effects can guide the development of air pollution control policies for indoor and outdoor environments [20].
In addition, understanding the quantitative source contributions to size-resolved PM could aid in managing emission sources for remediation of indoor and outdoor air, separately [21]. Although outdoor sources of air pollution are under regulatory control in urban environments, the lack of regulated control over indoor air pollution has become a rising public health issue [20]. Therefore, apportioning the sources of size-resolved PM data collected from indoor air with a receptor model can provide insights into quantitative source contributions to size-resolved PM [22]. Positive matrix factorization (PMF) is a receptor model [23,24,25] that has been widely used worldwide to estimate the source contributions of PM in the absence of inputs from a local source profile. Prior studies have focused on the estimation of source contributions to indoor and outdoor PM in single-size fractions, but there have been an inadequate number of quantitative studies on source contributions to size-resolved PM collected from indoor and outdoor air.
Accordingly, this study evaluates the mass concentrations and chemical compositions of indoor and outdoor size-segregated aerosols and their sources and possible health implications in an urban area of Beijing during summer and winter. The unique datasets include the chemical components, sources, and health effects of indoor and outdoor size-resolved aerosols, which may provide new insights into the impacts of outdoor air on indoor air quality and aid in simultaneously exploring emission remediation strategies for indoor and outdoor air.

2. Materials and Methods

2.1. Sampling Site

Indoor/outdoor size-segregated airborne particle mass concentrations and their chemical components were investigated in an office in Beijing. The sampling sites were located near a residential area in northwest Beijing near the 3rd Ring Road. The outdoor sampling site was located at the top of the office building at a height of approximately 15 m above the ground. The indoor sampling site was inside a 10-square-meter office near the outdoor sampling location. There were four computers, one printer, one refrigerator, and one air conditioner in the office. There were four people working in the office every weekday. The windows were open in summer, and the air conditioner was in working condition during the day on weekdays in summer. The sampling locations were in residential areas with no neighboring industrial pollution sources. We collected samples in two individual sampling periods: between 5 and 25 July 2020 (summer) and between 5 and 31 January 2021 (winter).

2.2. Sample Collection

Two nine-stage particle samplers (Andersen Series 20-800, Cleves, OH, USA) were employed to collect indoor and outdoor size-segregated airborne particles simultaneously. The samplers were operated at 28.3 L min−1 to collect nine size-segregated airborne particles (0.43, 0.65, 1.1, 2.1, 3.3, 4.7, 5.8, and 9.0 μm). To prevent the sampler from becoming blocked by particles during sampling, the samplers were cleared using an ultrasonic bath for 30 min before each sampling. In addition, the sampling flow rates were calibrated before each sample was collected and were monitored using a flow meter during each sampling. We used quartz fiber filters and cellulose filters as substrates in the Andersen samplers. The quartz fiber filters were used to collect particles for measuring water-soluble ions, organic carbon, and elemental carbon. The cellulose filters were adopted for quantifying elemental concentrations. For each size-segregated sample, the collection of samples proceeded for 24–48 h. In total, 14 and 18 sets of samples were collected in summer and winter, respectively. Before sample collection, the quartz fiber filters in aluminum foil were heated at 550 °C for 4 h to remove all organic material. Then, the filters were kept in a dryer at a temperature of 25 °C and a humidity of 23% for 72 h. The mass measurement of exposed quartz filters was carried out using a microbalance (±0.01 mg). After mass measurement of the exposed quartz filters, we divided them into different portions with clear scissors before the chemical analysis. For each filter, the mass was weighed three times to obtain the average level. Field blank filters were collected according to the same protocols as were used for the ambient samples, with the sampling pump off. Approximately 10% of the ambient samples were field blank and duplicate filters. Additionally, the levels of PM2.5, SO2, PM10, NO2, CO, and O3 used in this study were collected on the website https://www.aqistudy.cn/historydata/ (accessed on 22 July 2023) from the observation network of the Ministry of Ecology and Environment of China.

2.3. Chemical Analyses

We added one quarter (7 cm2) of each quartz filter to 25 mL of de-ionized water (Millipore, 18.2 MΩ). An ultrasonic extraction was performed at room temperature for 30 min. The extraction was then filtered through a 0.22 μm filter before measuring the levels of water-soluble ions including Na+, NH4+, K+, Mg2+, Ca2+, Cl, NO3, and SO42− using an ICS-90 ion chromatograph (Thermo Fisher Scientific Inc, Waltham, MA, USA). For the ion analyses, the instrument is equipped with a separation column (Ionpac CS12A 4 × 250 mm for cations and Ionpac AS14A 4 × 250 mm for anions) and a suppressor (CSRS 300–4 mm for cations and ASRS 300–4 mm for anions); the eluent for cations and anions was 22 mmol L−1 MSA and 3.5 mmol L−1 Na2CO3/1 mmol L−1 NaHCO3, respectively. Ions were quantified using external standard curves every week, and the curve for one trace calibration standard solution was checked every day. The ions’ limits of detection were less than 0.02 μg m−3 when the injection volume was 100 μL.
We used a DRI Model 2001A thermal/optical carbon aerosol analyzer (Desert Research Institute, Reno, NV, USA) to determine the levels of organic carbon (OC) and elemental carbon (EC) in samples. The temperature program for the thermal analysis followed the Interagency Monitoring of Protected Visual Environments (IMPROVE_A) protocol. A punch aliquot (0.50 cm2) holding a quartz fiber filter sample was heated stepwise in an oven at 140 °C (OC1), 280 °C (OC2), 480 °C (OC3), and 580 °C (OC4) in a pure helium atmosphere for OC volatilization, and 580 °C (EC1), 740 °C (EC2), and 840 °C (EC3) in a 2% oxygen-contained helium atmosphere for EC oxidation.
We measured the levels of 19 trace elements (TEs) by digesting 7 cm2 of the cellulose membrane with a mixture of HNO3, H2O2, and HF. The cellulose membrane was mixed with 6 mL of HNO3, 2 mL of H2O2, and 0.2 mL of HF in a vessel and digested with an MARS5 microwave digestion system (CEM Corporation, Matthews, NC, USA). The 19 trace elements included Na, Mg, Al, K, Ca, V, Cr, Mn, Fe, Co, Ni, Cu, Zn, Mo, As, Cd, Sb, Ba, and Pb. The levels of 19 trace elements in the digestion solution were measured using an Agilent 7500ce inductively coupled plasma mass spectrometer (Agilent Technologies, Santa Clara, CA, USA). Quantitative analysis was carried out to external calibration standards at concentration levels close to those of the samples, and internal standard elements (45Sc, 73Ge, 115In, and 209Bi) were added online during the metallic element analysis. Detailed information on the instruments, including detection limit, precision, and calibration, as well as the quality control of data, can be found in the prior work [17]. The extraction and measurement methods for the measured species are also documented in [22].

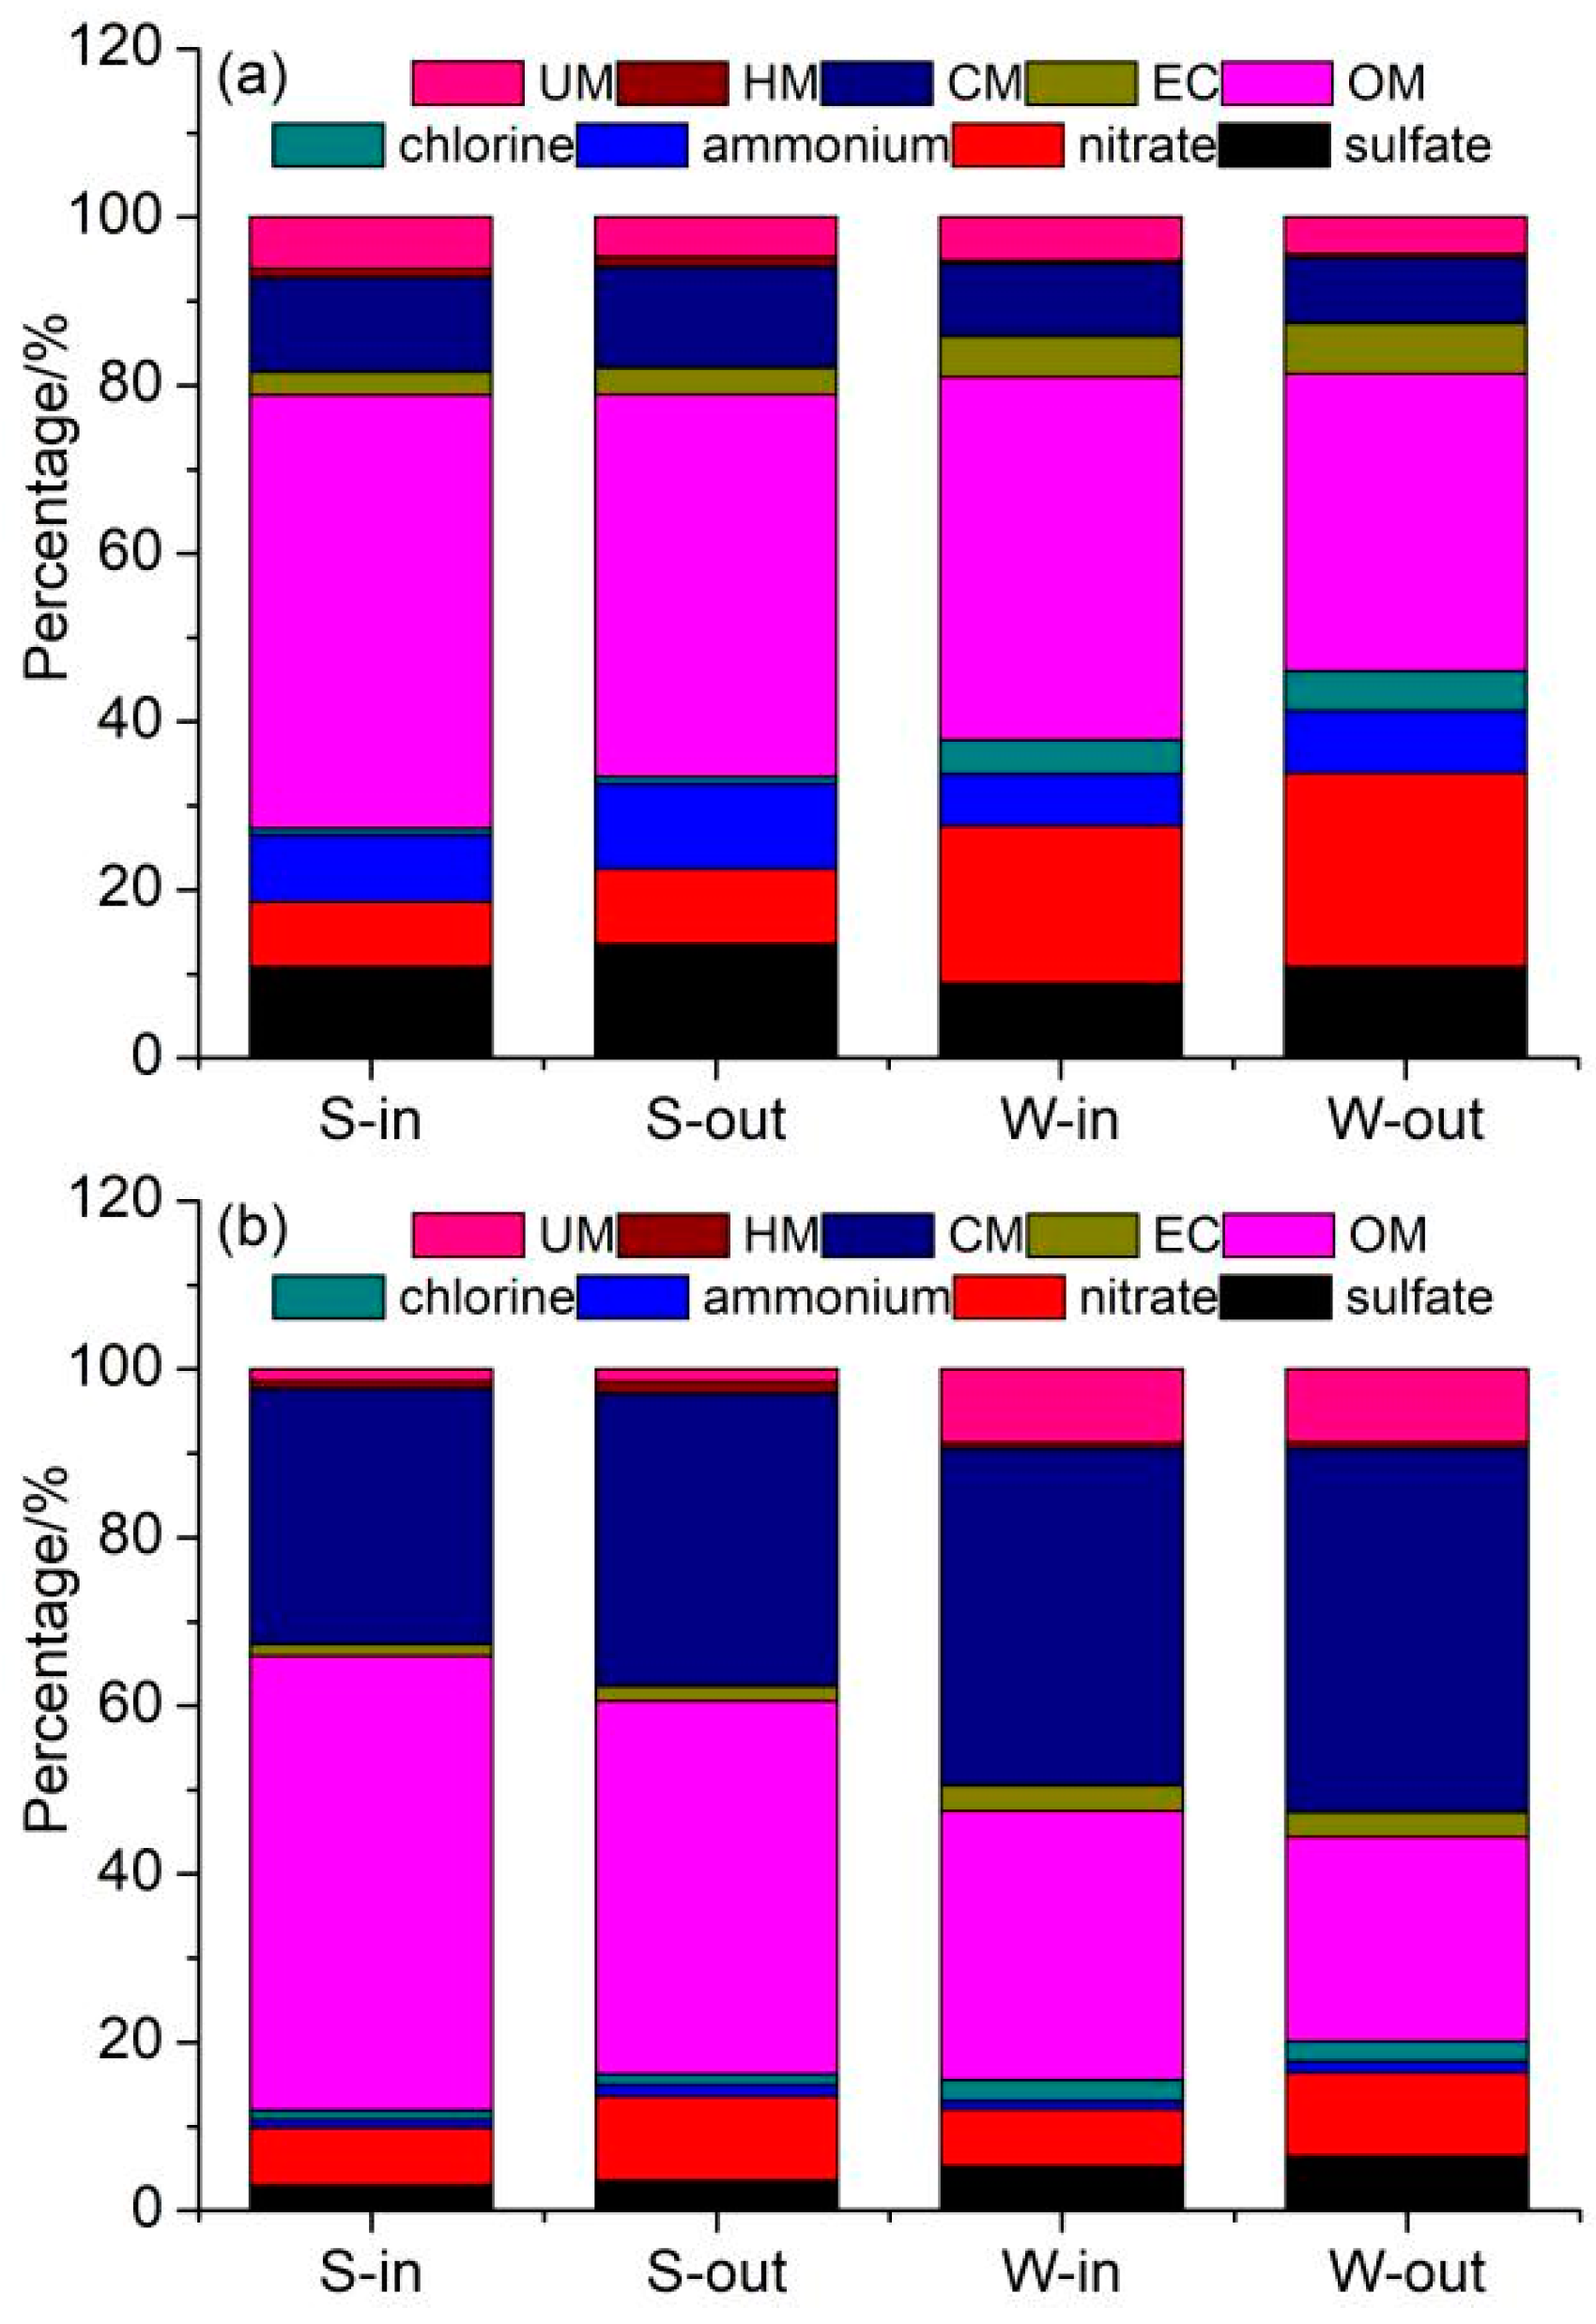
2.4. Chemical Mass Closure

We used a mass closure method to estimate the contributions from the major components to the PM. According to [22], the chemical components were grouped into the following eight categories: organic matter (OM), EC, sulfate, nitrate, ammonium, chlorine, crustal materials (CM), and heavy metals (HM). We calculated the unidentified matter (UM) based on the differences between the weighted mass of the quartz filter and the reconstructed mass using the mass concentrations of these eight major components.

2.5. Acidity Evaluation

We used the equivalent ratio of cations to anions (RC/A) in the acidity analysis of aerosols calculated using Equation (1):
RC/A = ([Na+] + [NH4+] + [ K+] + 2 × [Mg2+] + 2 × [Ca2+])/(2 × [SO42−] + [NO3] + [Cl])
where all listed species indicate the concentrations of their equivalent charges.

2.6. PMF Model

A receptor model was used to estimate the source contribution to PM in this study. Among various receptor models, positive matrix factorization (PMF) exhibits an excellent performance in the estimation of source contribution with no local source profile [26]. EPA-PMF 5.0 was employed to apportion sources for PM, with concentrations and uncertainty of the above chemical species in size fractions of <0.43, 0.43–0.65, 0.65–1.1, 1.1–2.1, 2.1–3.3, 3.3–4.7, 4.7–5.8, and 5.8–9 μm as input. We calculated the uncertainty of the concentration data using the following equations.
We used Equation (2) to calculate the uncertainty when the measured level was lower than or equal to the detection limit (MDL) for the analytical method.
Uncertainty = 5/6 × MDL
We used the following calculation Equation (3) when the concentration was higher than the detection limit (MDL) for the analytical method.
Unc = Errorfraction × concentration 2 + 0.5 × MDL 2
In the base run, the data were run 20 times to acquire a different number of factors and obtain the optimal solution. After a solution had been observed in which each factor had a clear source profile, we used a bootstrapping technique to optimize each factor to obtain the most optimal solution. We ran 100 bootstraps to map a base solution in every run to acquire a stable source solution.

2.7. Health Risk Assessment

We estimated the human health risks for trace elements associated with non-carcinogenic and carcinogenic risks using the method recommended by the United States Environmental Protection Agency [15]. First, the measured metals were divided into two groups: those with non-carcinogenic but toxic effects (Al, Mn, Ni, Co, and Cd), and those with carcinogenic effects (Pb, Ni, Co, and Cd). Then, we used the reference concentration (RfC) of the non-carcinogenic species and the inhalation unit risk (IUR) of the carcinogenic species to calculate the health risks. The RfCs of Al, Mn, Ni, Co, and Cd were 0.005, 0.00005, 0.00005, 0.000006, and 0.00001 μg m−3; the IURs of Pb, Ni, Co, and Cd were 0.00008, 0.00024, 0.009, and 0.0018 m3μg−1. Subsequently, we estimated the exposure concentration (EC) of elements with the following computed Equation (4).
E C = C × E T × E F × E D A T
where C refers to the level of the element (μg m−3), ET refers to the exposure time (20 and 4 h per day) for indoor and outdoor environments, EF refers to the frequency of exposure (365 days per year), ED refers to the exposure duration (24 years), and AT refers to the average time: ED × 24 × 365 h for non-carcinogenic species and 70 × 24 × 365 h for carcinogenic effects.
Finally, we characterized the non-carcinogenic and carcinogenic risks with the dose–response and exposure assessments. The hazard quotient (HQ) was applied in this study to estimate the non-carcinogenic elements using the following equations:
HQ = EC/(RfC × 1000 μg mg−1)
CR = IUR × EC
The acceptable risk range for carcinogenic risk varies from 1.0 × 10⁻⁶ to 1.0 × 10⁻⁴ based on the risk management guidelines of the United States Environmental Protection Agency. In the evaluation of non-carcinogenic risks, an HQ above or below unity is indicative of elevated health risks from non-carcinogenic or other effects.

3. Results and Discussion

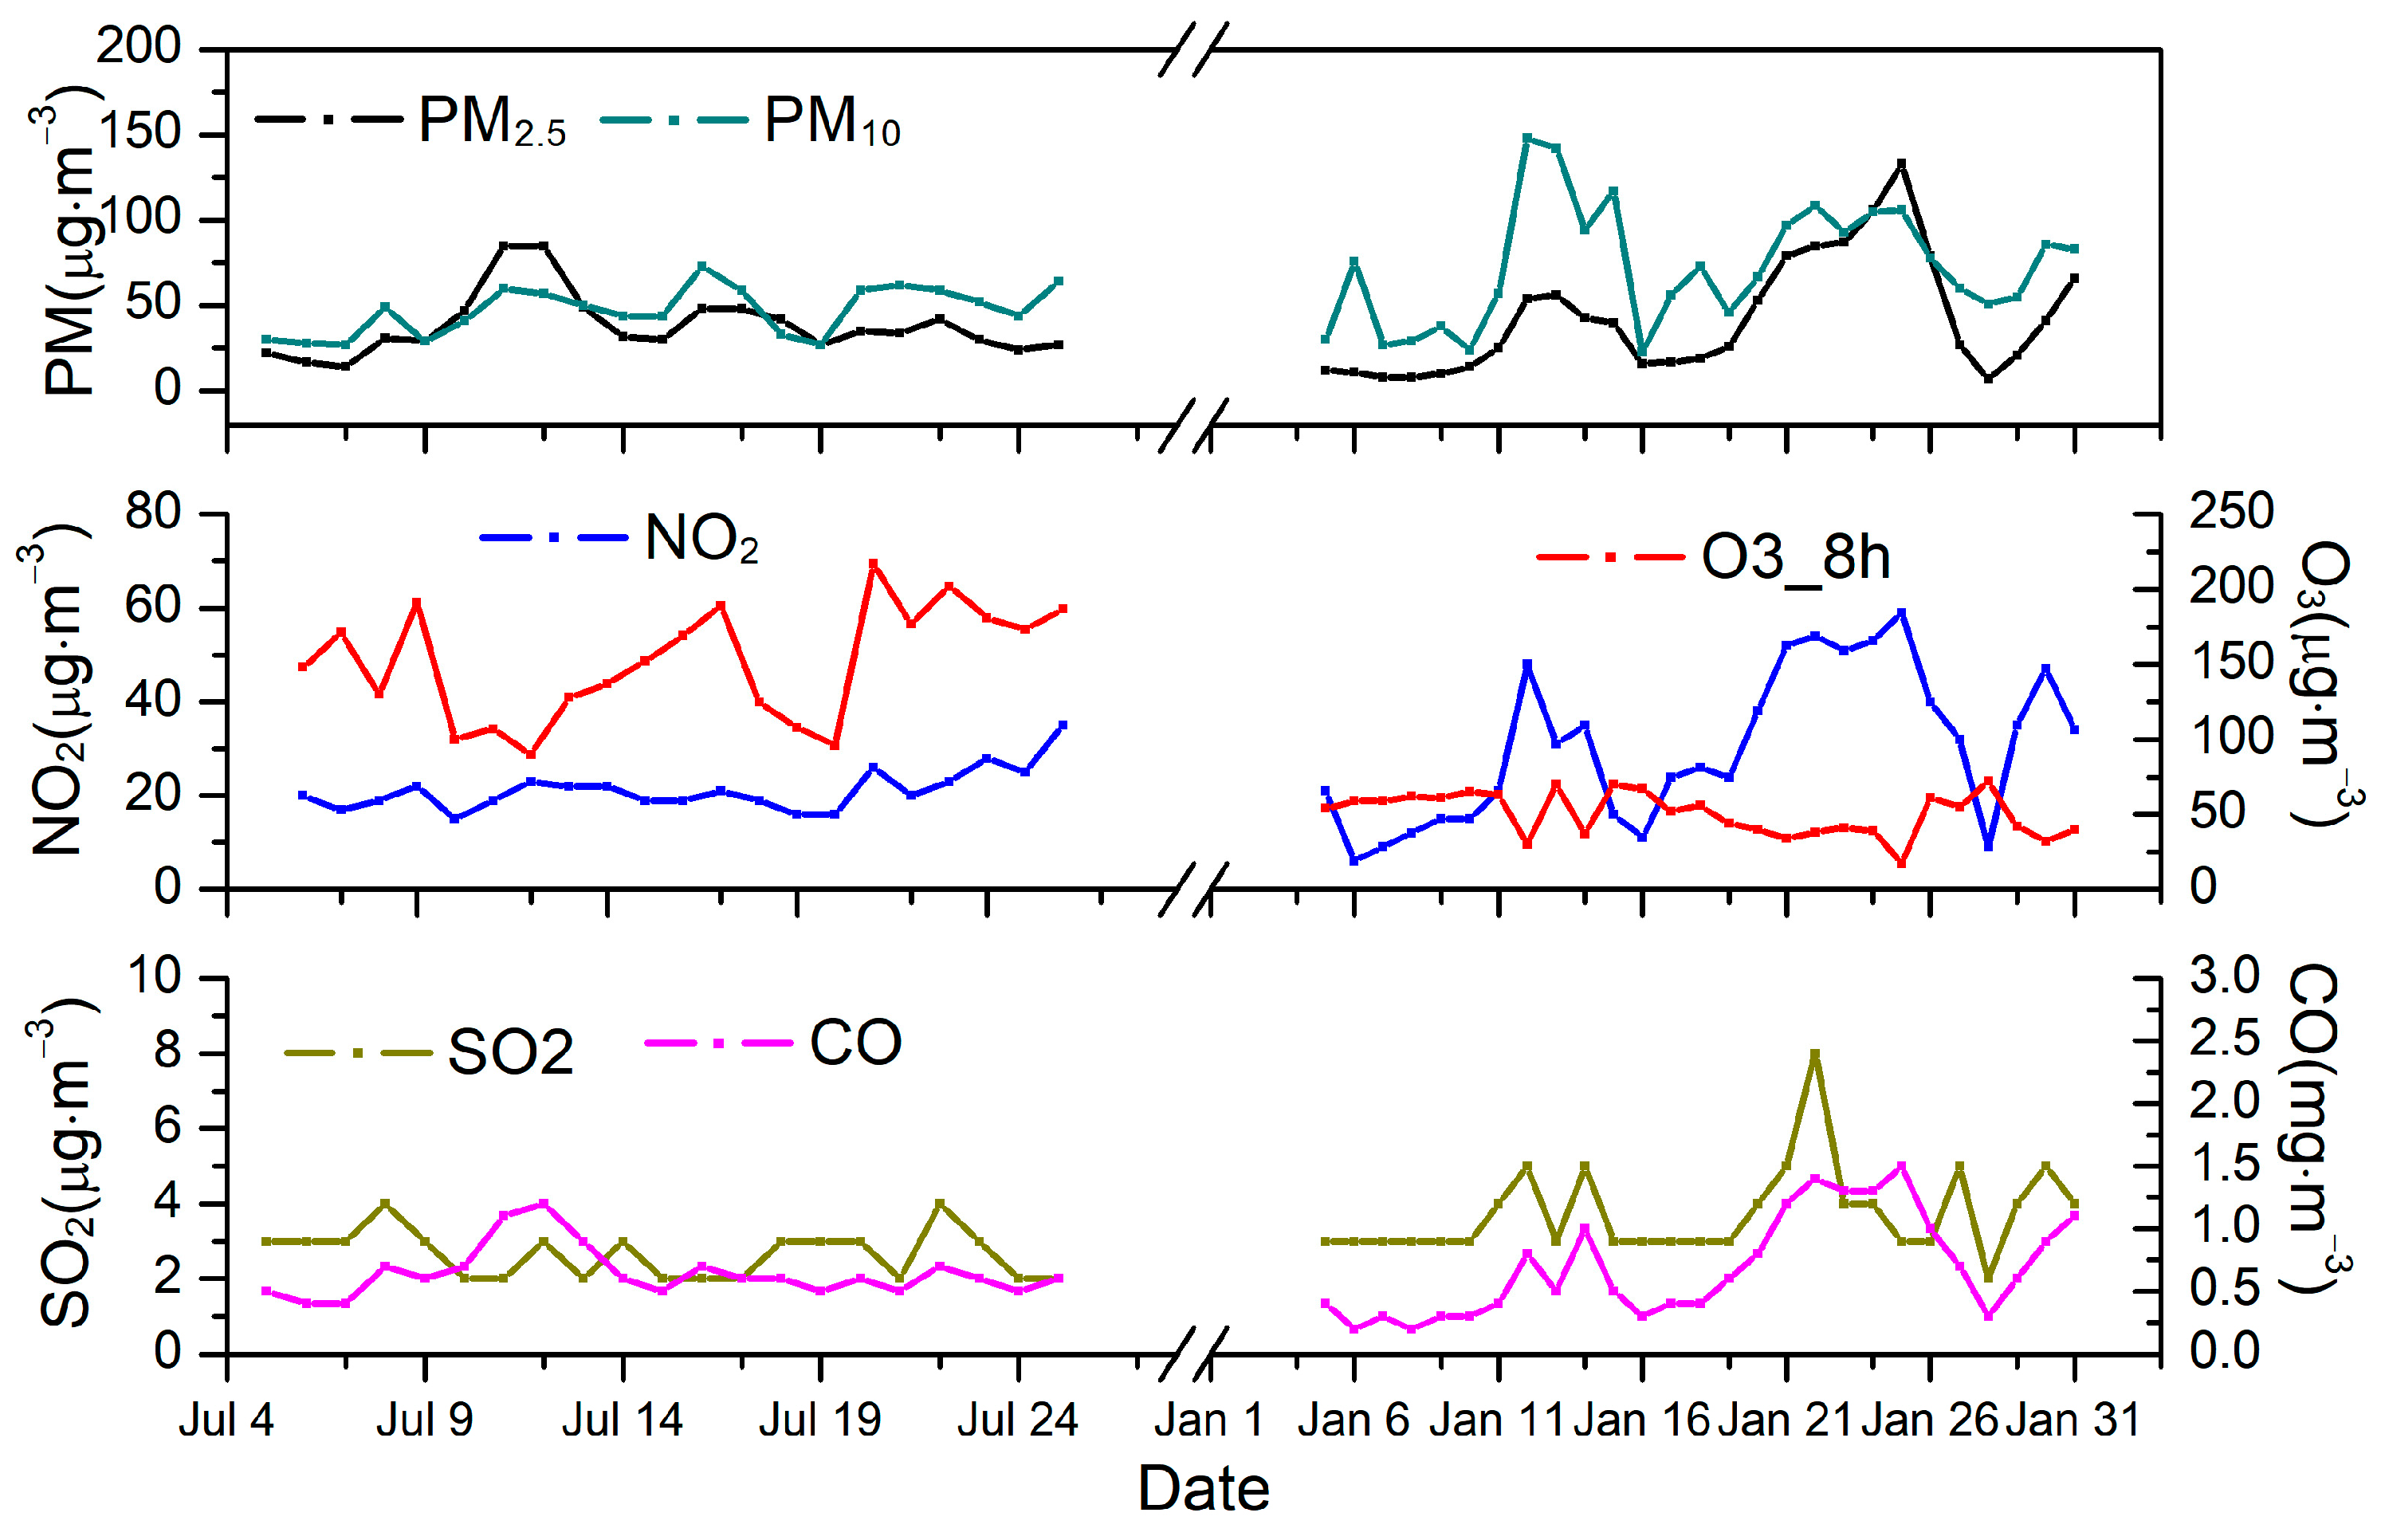
3.1. Mass Concentrations

Figure 1 demonstrates the temporal trends in outdoor PM2.5, PM10, and gaseous pollutants during the summer and winter study periods. The average concentrations of PM2.5 during summer and winter were 38.0 and 42.3 μg m−3, respectively. Compared to those measured in 2013–2014 [22], the average concentrations of PM2.5 were found to be significantly lower, but still twice the annual average PM2.5 limit of 15 μg m−3 (GB3095-2012, Grade I) recommended by the National Ambient Air Quality Standard (NAAQS) [27]. Additionally, the average concentrations of PM10 were 47.2 and 73.0 μg m−3, which were approximately one to two times greater than the annual average PM10 limits of 40 μg m−3 (GB3095-2012, Grade I) recommended by the National Ambient Air Quality Standard (NAAQS).
PM2.5 and PM10 exhibited a similar trend with NO2 and CO, which were mostly affected by the traffic source, indicating that mobile sources are a major contributor of PM2.5 and PM10 in Beijing. However, PM2.5 and PM10 showed the opposite trend with O3 in winter, which was mainly due to high PM pollution reducing light radiation and further reducing the generation of O3. On the contrary, PM increased with the increase in O3 in summer; this was mainly related to the high concentrations of O3 leading to the generation of secondary aerosols [28].
Table 1 describes the concentrations of the indoor and outdoor size-resolved mass and chemical components during summer and winter. Since the size-resolved sampler is incapable of having cut-off sizes of 2.5 and 10 μm, ambient particles with sizes smaller than 2.1 μm and in the size range from 2.1 to 9.0 μm were regarded as fine and coarse particles, respectively. A significant linear correlation was observed between PM2.1 and PM2.5 (R2 = 0.89, p < 0.05). The concentration of PM9 was found to be significantly in line with the concentration of PM10 (R2 = 0.87, p < 0.05). The PM2.1 and PM2.1−9 mass concentrations were usually lower inside the office than they were outside, both in summer and winter, with the exception of PM2.1−9 in summer, showing that major indoor sources different from those outdoors were dominantly responsible for the coarse particles measured in summer offices [29]. These results are consistent with the results derived from previous studies [7,30]. The PM2.1 mass concentrations were high in winter (35.2 μg m−3 for indoors and 41.4 μg m−3 for outdoors) in comparison to summer (29.4 μg m−3 and 38.1 μg m−3) in both indoor and outdoor environments. However, the concentrations of both indoor and outdoor PM2.1−9 in winter (23.0 μg m−3 and 23.1 μg m−3) were lower than those in summer (32.8 μg m−3 and 30.3 μg m−3).
To compare the differences in the levels of mass and chemical compositions during the process of haze evolution in summer and winter, the studied sampling days were grouped into two categories according to the mass concentration of PM2.5. Haze days (H) were defined as having a mass concentration higher than 35 μg m−3, while clear days (C) were regarded as having a mass concentration lower than 35 μg m−3. Based on the selection criteria, four and three sets of the total size-resolved aerosol sample set in summer were collected on haze days, while five and four sets of the total size-resolved aerosol sample set from winter were collected on clear days. In summer, the mean level of PM2.1 inside and outside the office, respectively, on haze days was 37.3 and 53.4 μg m−3, which was approximately 1.6 and 2 times the mean levels on clear days (23.9 and 29.6 μg m−3). Similar to trends in PM2.1, the mean level of PM2.1−9 (35.8 and 36.2 μg m−3) on haze days was approximately 1.2~1.3 times the average concentration on clear days (30.5 and 27.2 μg m−3). In winter, the average PM2.1 concentration inside and outside the office, respectively, on haze days was 45.2 and 53.9 μg m−3, approximately twice the average concentrations on clear days (20.1 and 25.2 μg m−3). Like the trends in PM2.1, the mean levels of PM2.1−9 (25.4 and 25.6 μg m−3) on haze days were approximately 1.6 times the mean level on clear days (15.8 and 16.5 μg m−3). Thus, it is obvious that both inside and outside particles substantially contribute to the accumulation in the period of haze days [10].

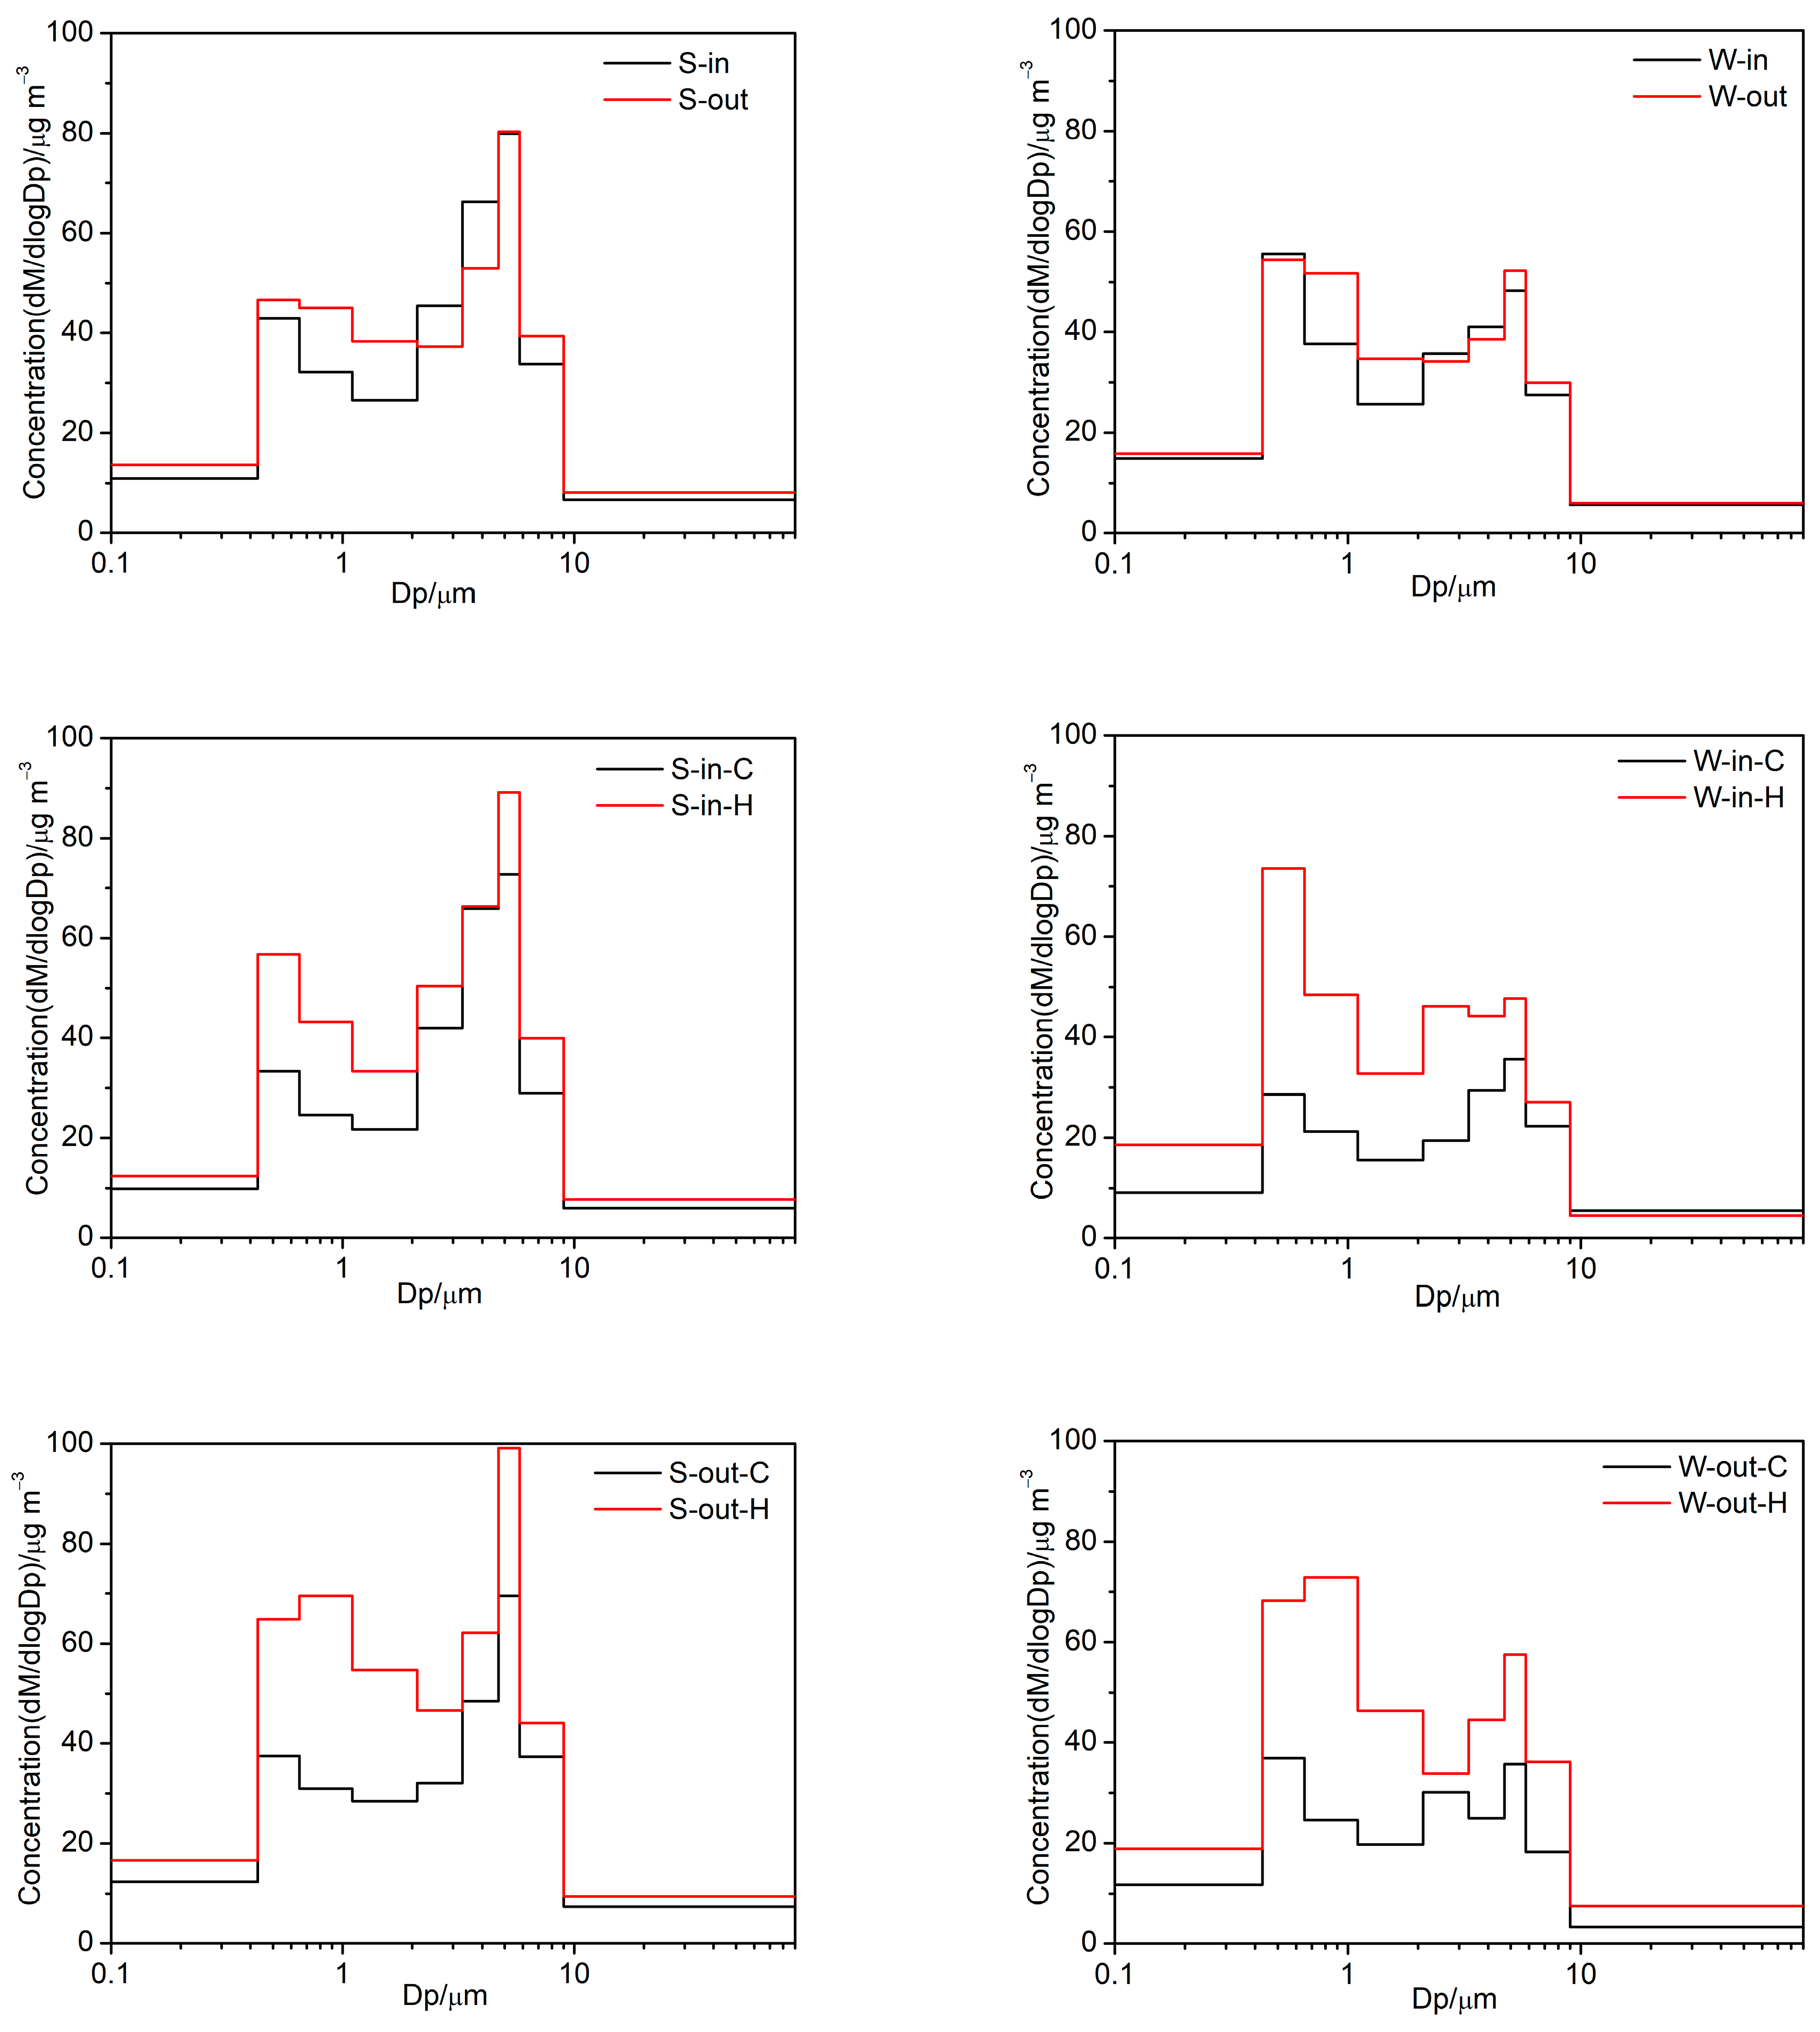
3.1.1. Size Distribution

The size-resolved mass concentration for both inside and outside particles is depicted in Figure 2. During every season, a bimodal distribution of mass concentration was observed. The mass concentration peaked at 0.43–0.65 μm in the fine modes, while the mass concentration exhibited its maxima at a size in the range of 4.7–5.8 μm across all of the seasons. It is notable that for outdoor particles, the fine-mode peak shifted from particle sizes in the range of 0.43–0.65 μm on clear days to particle sizes ranging from 0.65 to 1.1 μm on haze days in both summer and winter.

3.1.2. Indoor/Outdoor Ratios

Once indoor levels are dominated by major indoor sources of PM, the ratios of indoor/outdoor (I/O) levels are higher than 1. In contrast, the ratios of I/O are smaller than 1, and the indoor concentration is the result of the emissions from outdoor sources [31]. In this study, we performed I/O analysis across all the size ranges in each season. Overall, the I/O ratio was observed to be lower than 1 across all size ranges in both summer and winter, except for the some coarse-size fractions (2.1–3.3 μm and 3.3–4.7 μm). The I/O ratio in the size ranges lower than 0.65 μm and higher than 2.1 μm was found to be greater than that in the size fractions of 0.65–1.1 μm, which was probably a result of the significant emission sources from human indoor activities [32]. The I/O ratio for a size range of >4.7 μm being lower than that for a size range of 2.1–4.7 μm was attributed to not only the particles’ higher penetration efficiency but to the fact that they protected the building envelope structures from the influence of coarser particles from outside [31]. The I/O ratios were found to be highest in the size range of 2.1–4.7 μm, which can be explained by the elevated level of human activity indoors [33]. The improvements in the ventilation conditions could reduce the indoor concentration of particles resulting from significant indoor sources.

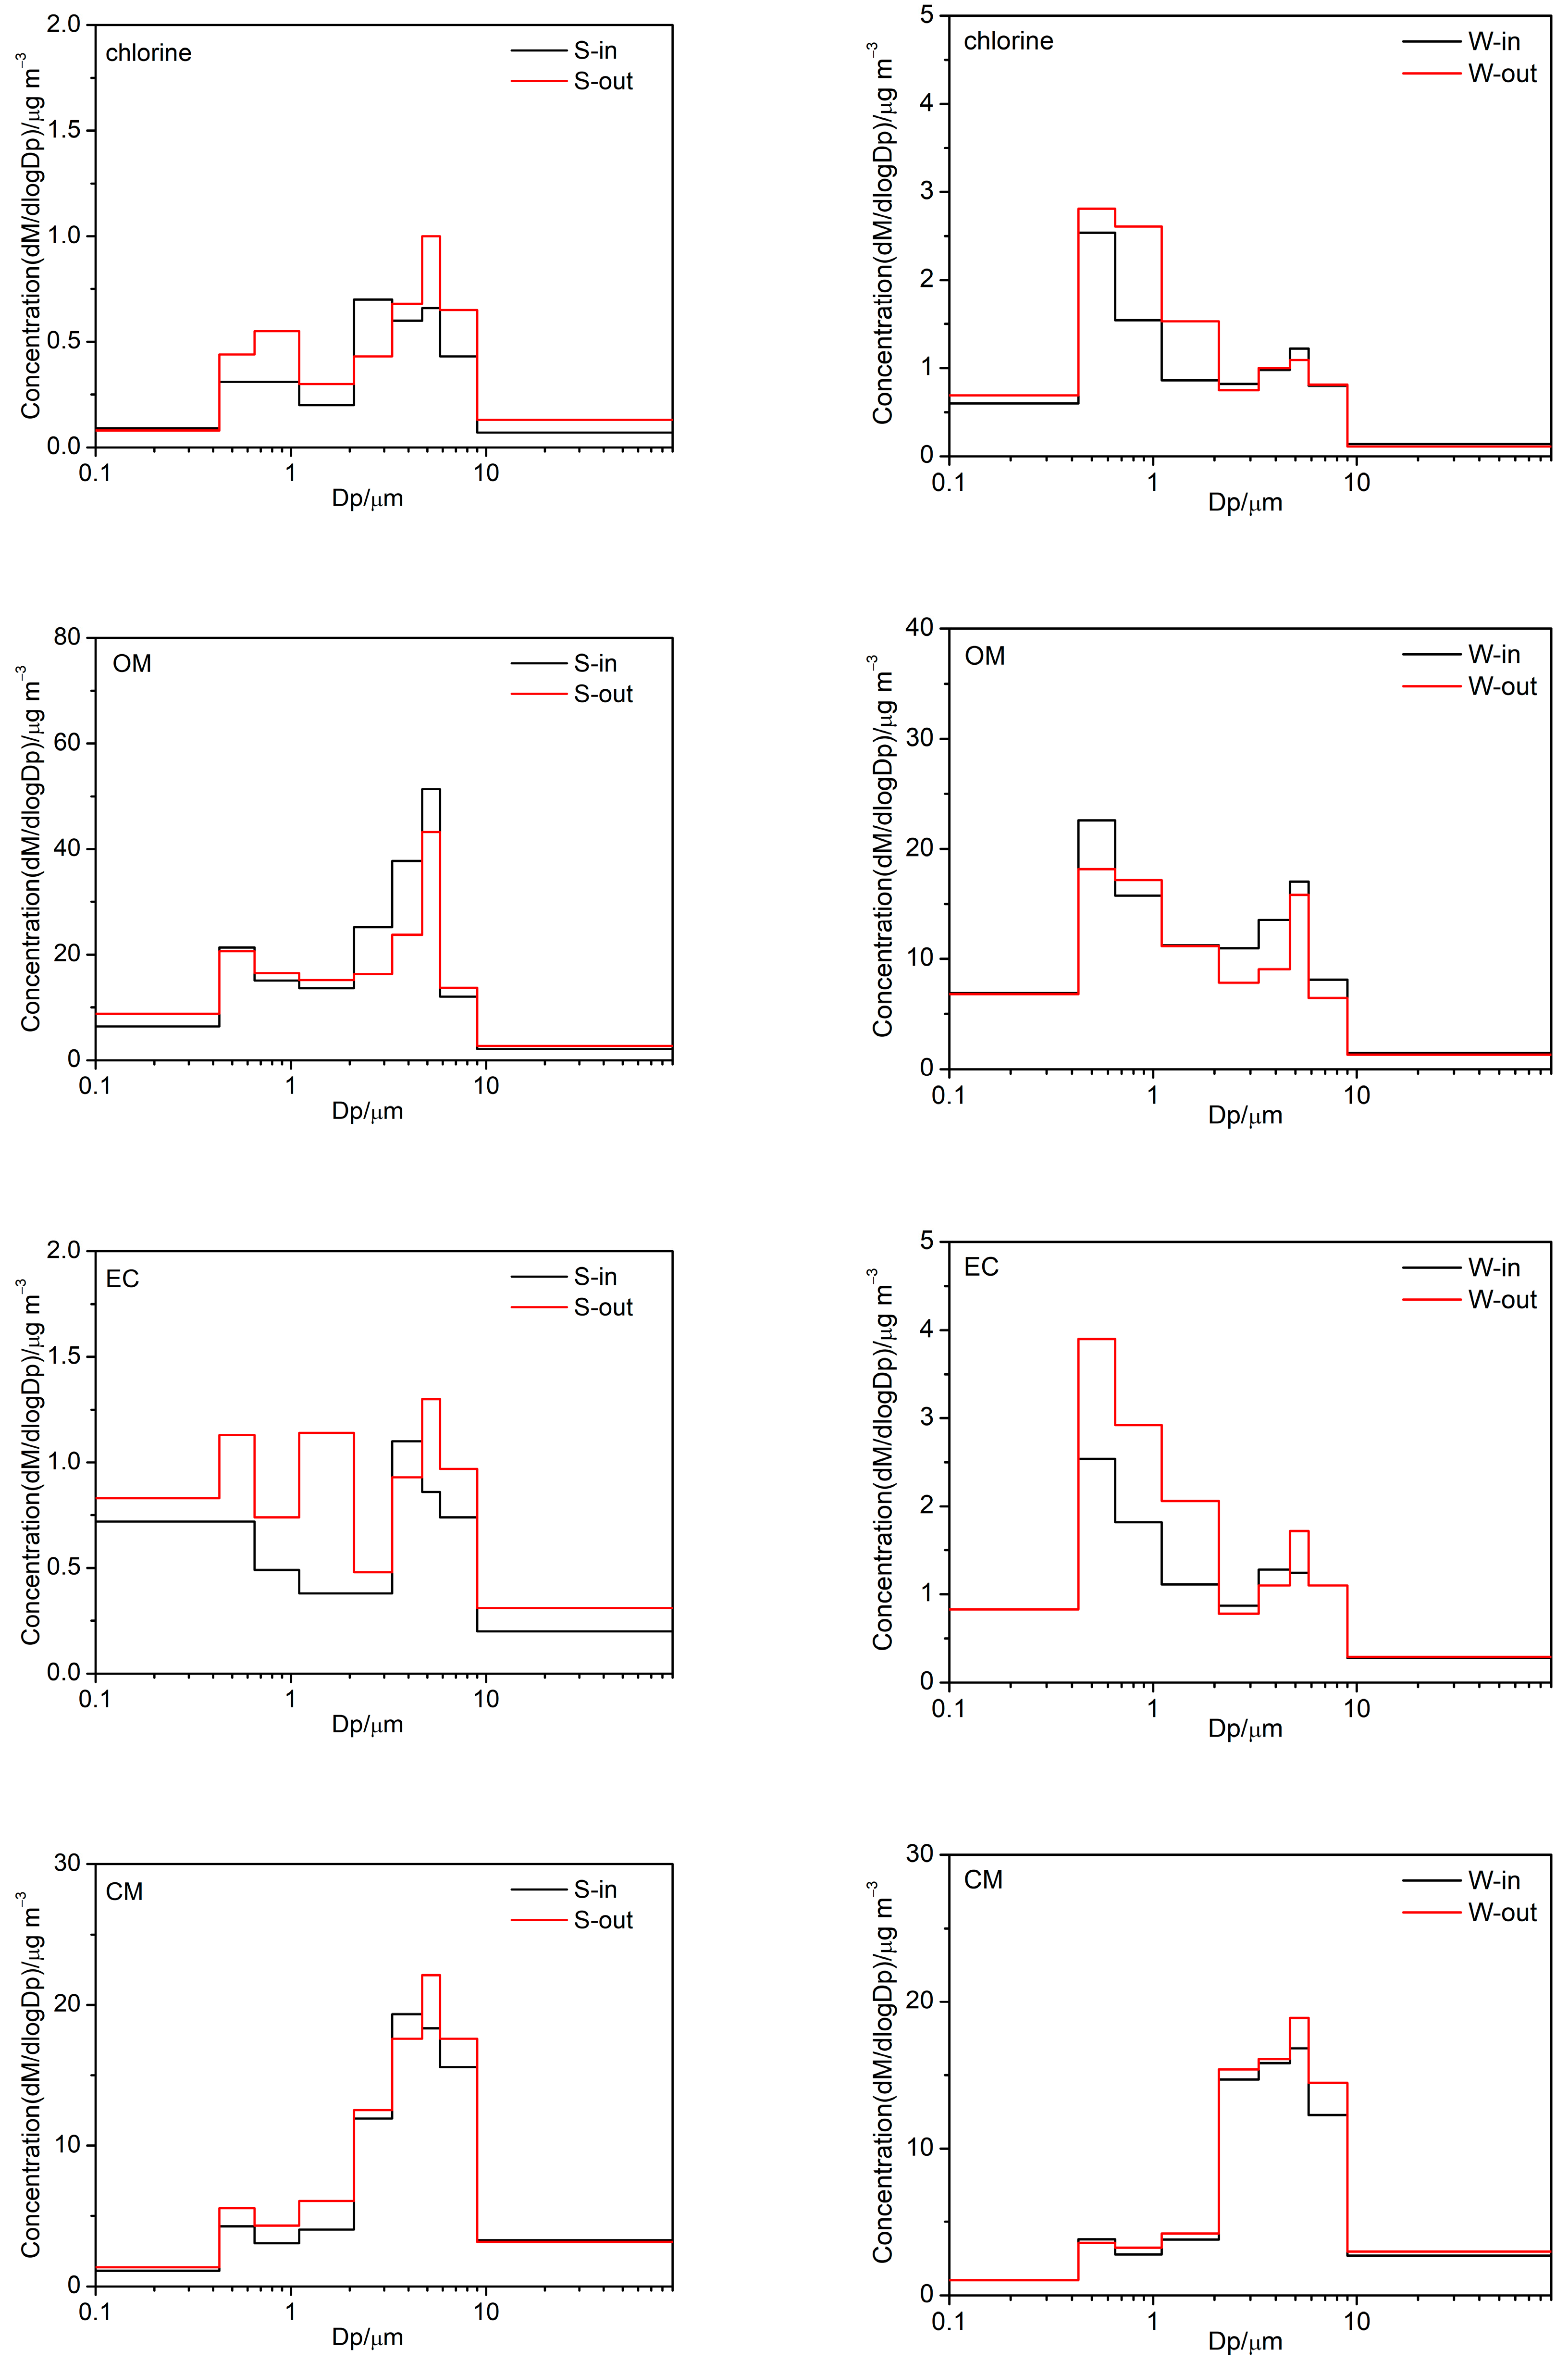
3.2. Chemical Components of PM

The size-resolved chemical compositions of the indoor and outdoor PM are displayed in Table 1. Figure 3 depicts the average mass closure for the indoor and outdoor PM2.1 and PM2.1−9. The chemical components of PM were grouped into the following eight categories: sulfate, nitrate, ammonium, chlorine, OM, EC, CM, and HM. OM and sulfate–nitrate–ammonium (SNA) dominated the PM2.1 mass, which accounted for more than 76.6% of the PM2.1 mass in total. The fraction of SNA accounting for the PM2.1 mass was much higher in outdoor environments than it was for indoor environments in both summer and winter, which suggests that more secondary particles were generated in outdoor PM2.1. However, the fraction of OM accounting for the PM2.1 mass was lower in outdoor environments than in indoor ones in both summer and winter, indicating that there were indoor sources of OM. High contributions of CM and OM were observed in PM2.1−9, accounting for 30.3~40.2% and 24.3~54.0% of the total PM2.1-9 mass, respectively. The undetermined fraction for the PM2.1 and PM2.1−9 mass varied between 1.4% and 8.8%. These undetermined fractions can be attributed to the existence of oxide species, heteroatoms in carbonaceous compounds, water molecules (moisture, formation, and crystallization water), and undetermined mineral components, such as carbonates [22].
The size distributions of indoor and outdoor PM chemical components on both clear and haze days are shown in Figure 4 and Figure S1. Sulfate, ammonium, nitrate, chlorine, and EC in winter primarily accumulated in the fine mode, with particle sizes ranging from 0.65 to 2.1 μm, as well as showing a minor presence in the coarse mode, with particle sizes ranging from 4.7 to 5.8 μm. Obvious bimodal distributions were observed in OM and HM, as well as nitrate, chlorine, and EC, in summer. Moreover, the amplitude in the fine mode coincided with that in the coarse mode. CM were primarily accumulated in the coarse mode, with particle sizes ranging from 4.7 to 5.8 μm, as well as showing a minor presence in the fine mode, with particle sizes ranging from 0.65 to 1.1 μm.

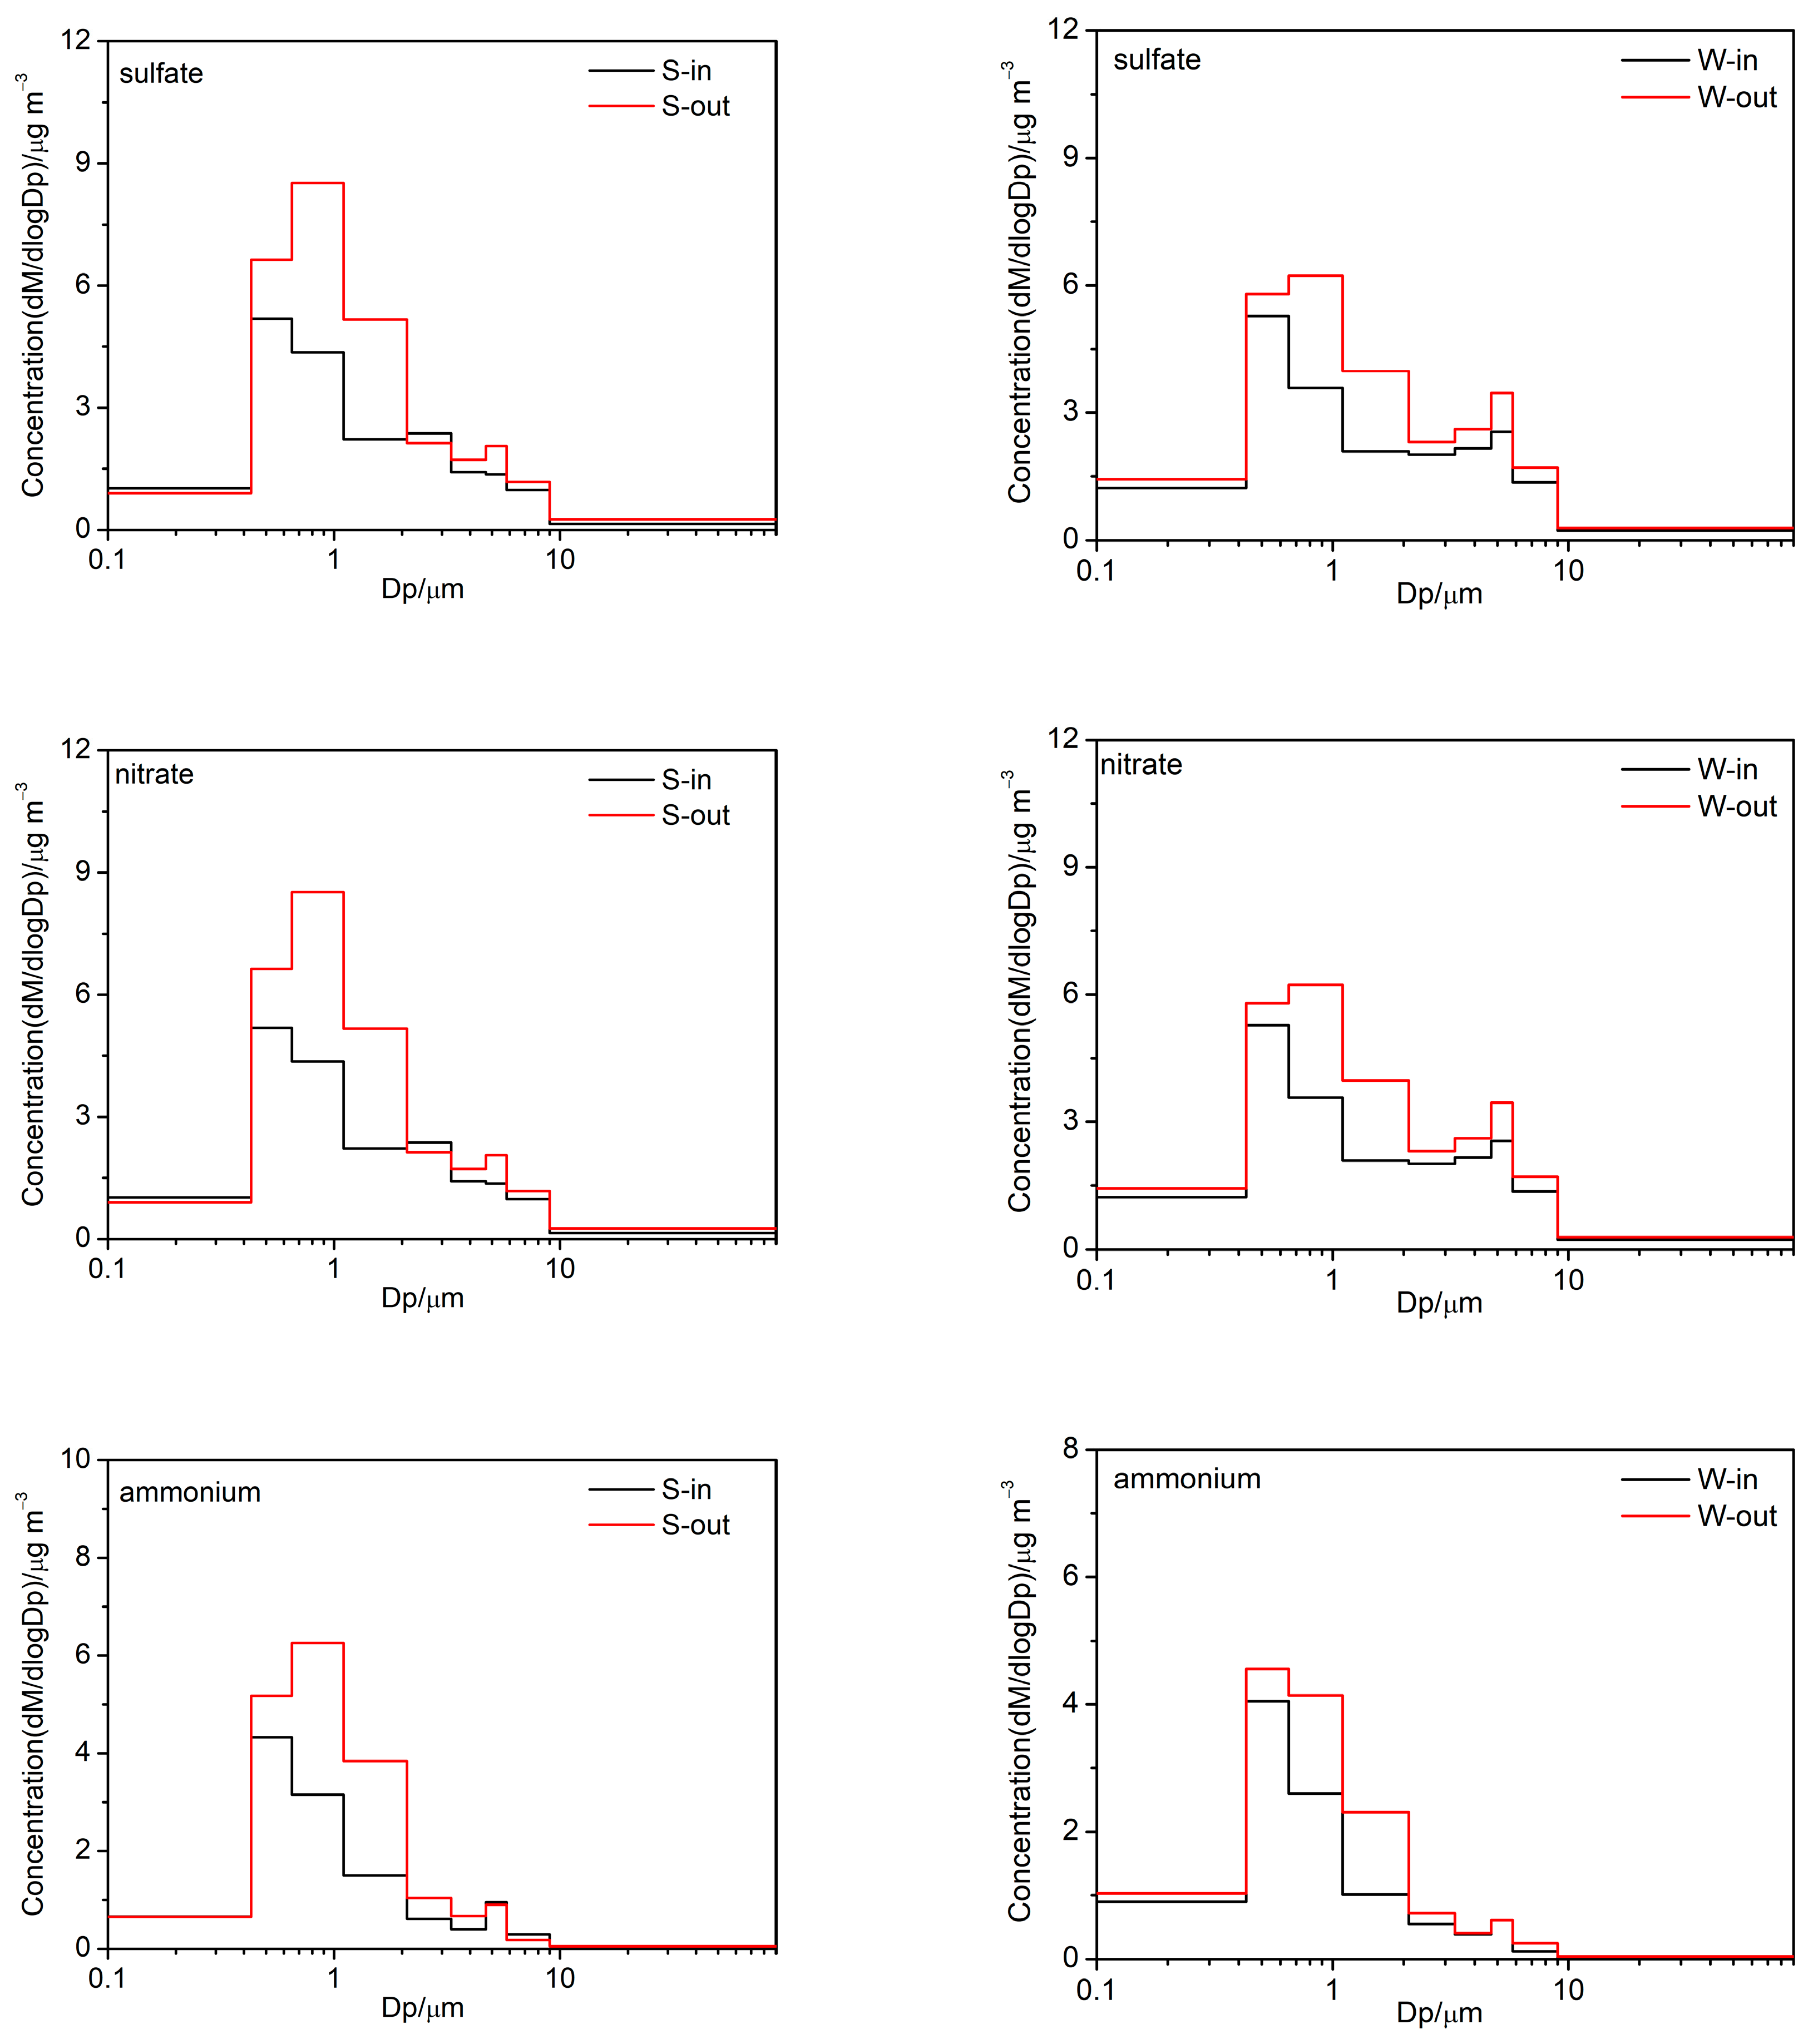
3.2.1. Water-Soluble Ions

Table 1 shows the levels of water-soluble ions (Na+, NH4+, K+, Mg2+, Ca2+, Cl, NO3, and SO42−) collected from indoor and outdoor size-resolved particles in summer and winter. The mean concentrations of water-soluble ions were 18.8 and 25.0 μg m−3 in summer and 28.8 and 36.9 μg m−3 during winter for the ambient indoor and outdoor environments, respectively. SNA (SO42−, NO3, and NH4+) contributed to 69.5~74.4% WSII in PM2.1 and 25.7~48.4% of water-soluble ions in PM2.1-9, respectively. Meanwhile, SNA was mainly found in fine particulate matter; SNA in PM2.1 accounted for 68.7~80.7% of SNA in PM9.
The concentrations of SO42−, NO3, and NH4+ in indoor PM2.1 and PM2.1−9 were all higher than those in outdoor particles. Moreover, from clear to haze days, SO42− accumulated most in PM2.1 in indoor environments in summer, as the RH/C for SO42− in PM2.1 was 4.1, followed by NO3 (3.0) and NH4+ (2.7) in PM2.1. However, NO3 accumulated in PM2.1 most in the outdoor environment in summer, as the RH/C for NO3 in PM2.1 was 4.5, followed by SO42− (3.7) and NH4+ (2.8) in PM2.1. Meanwhile, NO3 accumulated in PM2.1 most in winter, and the RH/C for NO3 in PM2.1 was 3.6 and 3.4 in the indoor and outdoor environment, respectively. Thus, it is apparent that the accumulation of SNA occurred in both inside and outside environments during the evolution of haze pollution. As the concentrations of SO2 and NO2 on haze days (2.7 and 24.0 μg m−3) in summer were lower than those on clear days (2.7 and 20.1 μg m−3), the accumulation of SO42− and NO3 on haze days in summer was mainly due to higher sulfur oxidation ratios (SORs) and nitrogen oxidation ratios (NORs) on haze days. In winter, the concentrations of SO2 and NO2 on haze days (3.2 and 17.8 μg m−3) were higher than those on clear days (4.2 and 40.3 μg m−3). In addition, a higher SOR and NOR was exhibited in higher RH conditions on hazy days. The SOR (R2 = 0.76, p < 0.05) and NOR (R2 = 0.69, p < 0.05) exhibited a positive correlation with RH in winter.
Figure S1 shows the size distribution of SNA on clear and haze days in both the indoor and outdoor environments. The distributions of SNA in size form were bimodal. In general, the fine modes commonly peaked at 0.43–0.65 μm and 0.65–1.1 μm, while the coarse modes exhibited their maxima at the particle size in the range of 4.7–5.8 μm. It can be concluded that the fine-mode maximum of SNA in outdoor particles shifted from 0.43–0.65 μm on clear days to 0.65–1.1 μm on haze days, which could be explained by the hygroscopic growth in ultrafine particles and the secondary formation of SNA. However, this size shift was not observed in indoor environments.
The acidity and alkalinity of PM in both indoor and outdoor environment were evaluated based on RC/A. The RC/A values of outdoor PM were slightly lower than those of indoor PM, indicating the stronger acidity of outdoor PM. The RC/A values in different size fractions ranged from 0.9 to 3.3, with the lowest ratios occurring in the 1.1–2.1 μm size fraction, which is consistent with the results of previous studies [34]. The ratio was typically near unity over most of the accumulation mode (0.65–2.1 μm), indicating that these particles were close to neutral or only slightly acidic, and that there was usually more ammonium than sulfate, allowing the formation of ammonium nitrate. The ratios increased toward the small sizes and toward the large sizes; ratios higher than 2 were even observed in size fractions larger than 4.7 μm, possibly because of particles containing water-soluble anions (CO32−, HCO3, or organic acids) that were not detected in our chemical analysis [35]. The high RC/A values in PM1.1 were likely caused by the presence of water-soluble organic anions that were not detected or included in our chemical analysis. Organic acids generally contribute more to submicron aerosols than to droplet mode particles or coarse particles.

3.2.2. Carbonaceous Components

Carbonaceous aerosols include two main fractions, i.e., OC and EC. The concentrations of indoor and outdoor size-resolved OC and EC during summer and winter were studied (Table 1). In summer, the concentrations of OC and EC in indoor PM2.1 and PM2.1−9 were slightly lower than those in outdoor particles; however, the opposite trend was found for OC in PM2.1−9. In winter, concentrations of OC in indoor particles were slightly higher than in outdoor particles; however, the opposite trend was found for EC.
In summer, the average concentrations of OC in PM2.1 and PM2.1−9 inside and outside the office on haze days were approximately 1.1~1.3 times and 1.3~2.0 times the average concentrations on clear days in summer and winter, respectively. Similarly, the average EC concentrations in PM2.1 and PM2.1−9 inside and outside the office on haze days were approximately 0.9~1.9 times and 1.1~1.7 times the average concentrations on clear days. The RH/C for OC and EC in PM2.1 was always slightly higher than that in PM2.1−9, indicating that fine-mode carbonaceous constituents accumulated more than they did in the coarse mode during the haze pollution period.
The size distributions of carbonaceous constituents on clear and haze days in both indoor and outdoor environments are shown in Figure S1 and are considered to exhibit bimodal or trimodal distributions, and the fine modes commonly peaked at 0.43–0.65 μm, 0.65–1.1 μm and 1.1–2.1 μm; the coarse modes exhibited their maxima at 4.7–5.8 μm. It can be concluded that the fine-mode maximum for OC in outdoor particles shifted from 0.43–0.65 μm on clear days to 0.65–1.1 μm on haze days, which could be attributed to the hygroscopic growth of ultrafine particles and the secondary formation of secondary organic carbon (SOC). This result is confirmed by the OC/EC ratios, which exhibited the highest value in the 0.65–1.1 μm size fraction on a haze day. Because EC primarily arises from primary combustion emissions, the OC/EC ratios were used to evaluate the contributions from SOC. However, the size shift was not observed for OC or EC in the indoor environment.

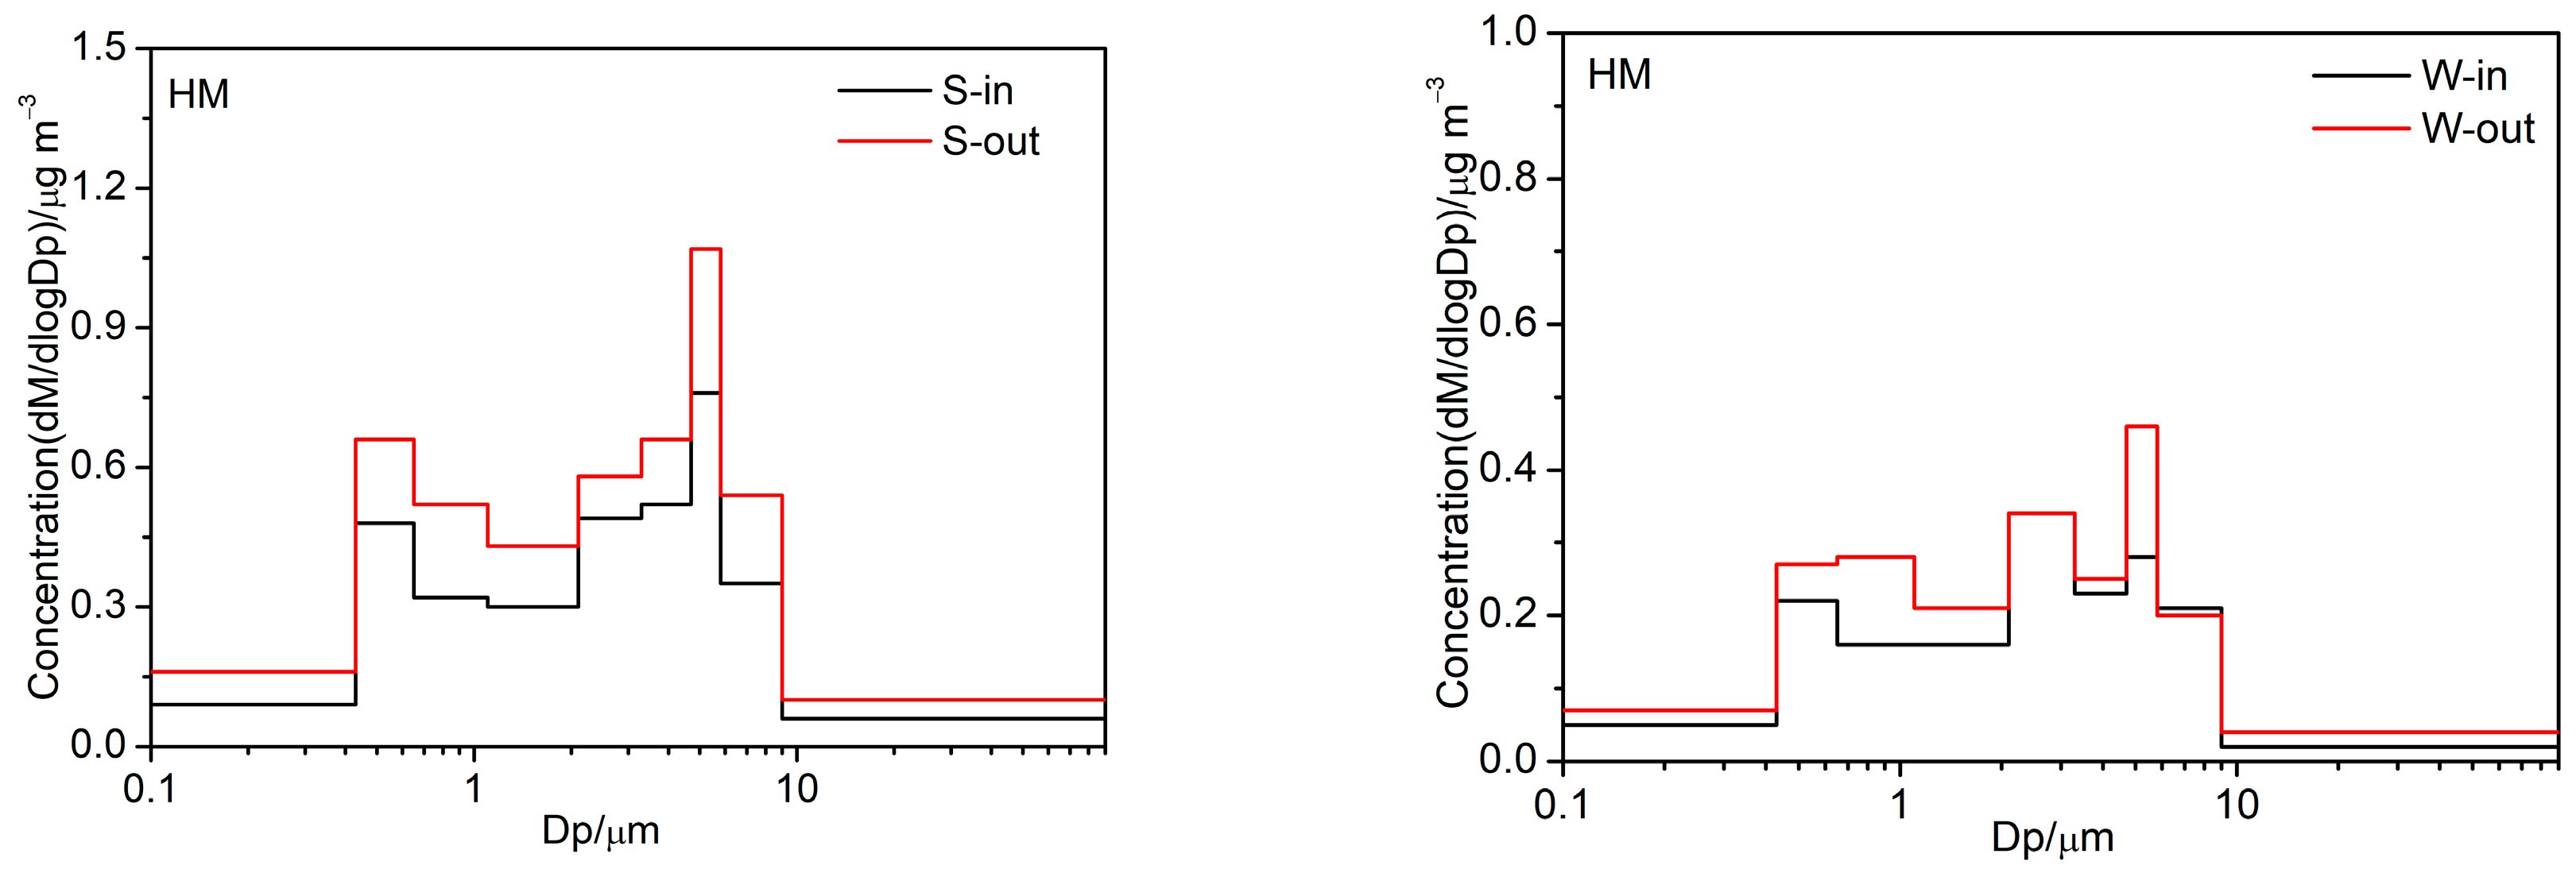
3.2.3. Trace Elements

The trace elements can be divided into mineral elements and heavy metals. Mineral metals, including Na, Mg, Al, K, Ca, Mn, Fe, and Ba, are defined as CM, while heavy metals, including V, Cr, Co, Ni, Cu, Zn, Mo, As, Cd, Sb, and Pb, are defined as HM.
The I/O ratios for CM in both fine and coarse particles were 0.73 and 0.95 in summer and 0.92 and 0.95 in winter. The I/O ratio of almost all mineral elements was lower than 1, which indicates that the contribution of outdoor pollution is relatively larger than that of indoor pollution. Similarly, the I/O ratios for HM in both fine and coarse particles were 0.66 and 0.75 in summer and 0.73 and 0.91 in winter. For all the mineral elements and heavy metals, the I/O ratio was lower than the unity. This finding reveals that outdoor pollution makes a relatively greater contribution to indoor air.
The average concentrations of CM on haze days were slightly higher than those on clear days; the RH/C for CM in PM2.1 and PM2.1−9 ranged from 1.28 to 2.30 and from 1.11 to 1.84, respectively. This indicated that fine-mode crustal materials accumulated more than those in coarse mode during the haze pollution period. Similarly, the average concentrations of HM on haze days were higher than those on clear days; the RH/C for HM in PM2.1 and PM2.1−9 ranged from 1.30 to 1.61 and from 1.35 to 2.11, respectively. This indicated that heavy metals in both the fine mode and the coarse mode exhibited accumulation during the period of haze pollution.
The size distribution of CM and HM on clear and haze days in indoor and outdoor environments are shown in Figure S1 and are considered to exhibit bimodal distributions; the fine modes commonly peaked at 0.43–0.65 μm or 0.65–1.1 μm, and the coarse modes exhibited their maxima at 3.3–4.7 μm or 4.7–5.8 μm. It can be concluded that the fine-mode maximum of HM in outdoor particles shifted from 0.43–0.65 μm on clear days to 0.65–1.1 μm on haze days, which can be explained by the hygroscopic growth in ultrafine particles and the secondary formation of particles. However, the size shift was not observed for HM or CM in the indoor environment.

3.3. Source Apportionment

We determined six sources of PM through PMF analysis. Figure 5 displays the profile of each source and the percentages of apportioned species in each source. The sources were biomass burning, secondary inorganic aerosols (SIA), coal combustion, dust, traffic, and industrial pollution. Together, these sources represented 91.3~99.0% and 90.7~98.4% of PM2.1 and PM2.1−9, respectively.
The first source, biomass burning, was represented by the high Cl (61.1%), K (54.7%), which is an excellent tracer of aerosols from biomass burning, and OC (20.6%) contents [36]. Their contributions to indoor and outdoor PM2.1 in winter were 4.9% and 5.2%, which were slightly higher than their 3.6% and 3.3% contributions to PM2.1−9. This finding is consistent with previous studies [22,37]. The greater contributions to PM2.1 and PM2.1−9 were found in summer (6.6% and 6.9% to indoor and outdoor PM2.1 and 7.5% and 7.7% to PM2.1−9), demonstrating an obvious seasonality.
The second source was SIA, which was characterized by significant amounts of SO42− (74.4%), NO3 (73.1%), and NH4+ (75.7%). SNA represented the dominant composition of secondary inorganic aerosols. SNA was mainly formed through the photochemistry and heterogeneous processes of gaseous precursors (SO2, NOx, and NH3). Their contributions to indoor and outdoor PM2.1 in winter were 32.1% and 39.2%, which were significantly greater than their 13.7% and 18.6% contributions to PM2.1−9. The contributions of SIA to both PM2.1 and PM2.1−9 revealed significant seasonal trends, with lower concentrations observed in summer (27.8% and 34.2% to indoor and outdoor PM2.1 and 13.0% and 15.4% to PM2.1−9).
The third source, coal combustion, was represented by elevated As (72.4%), Pb (42.2%), Cd (40.1%), EC (40.5%), Zn (37.8%), Mo (35.8%), Co (27.5%), and OC (30.0%) concentrations [3,38]. As is an excellent tracer of aerosols from coal combustion. Coal combustion is one of the main sources of primary OC and EC. Moreover, Pb, Cd, Zn, Mo, and Co are present in coal combustion. The contributions of this source to indoor and outdoor PM2.1 in winter were 19.3% and 20.6%. Besides the contribution to PM2.1, coal combustion contributed significantly to PM2.1−9 (21.4% and 21.9% to indoor and outdoor PM2.1-9). The contributions of coal combustion to PM2.1 and PM2.1−9 showed the obvious seasonal pattern of winter > summer (17.2% and 17.4% to indoor and outdoor PM2.1 and 20.1% and 20.5% to PM2.1−9).
The fourth source was dust, which were characterized by significant amounts of crustal elements, such as Al (83.9%), Mg (80.9%), Ca (77.9%), Ba (60.4%), Fe (54.3%), Na (52.7%), and Mn (40.3%) [39]. The OC content was close to 15.2%, and these high levels suggest resuspended dust. Thus, this source possibly mixes desert/loess dust, anthropogenic construction dust, fugitive dust, and resuspended road dust [40]. The contributions of this source to indoor and outdoor PM2.1 in winter were 8.6% and 7.8%, which were significantly lower than the 32.0% and 35.2% contributions to PM2.1−9. Its fraction of both PM2.1 and PM2.1−9 showed significant seasonal trends, with lower concentrations found in summer (9.2% and 9.9% to indoor and outdoor PM2.1 and 26.3% and 29.8% to PM2.1−9).
The fifth source, traffic, was characterized by elevated EC (52.7%), Cd (46.3%), Mo (34.4%), OC (34.2%), Pb (32.7%), Fe (23.9%), Zn (21.9%), and Mn (21.2%) concentrations [41,42]. The contributions of this source to indoor and outdoor PM2.1 in winter were 22.6% and 21.8%. These aerosol species are all enriched in vehicular and/or waste incineration emissions. EC primarily arises from engines; Zn, Fe, and Mn are found in tailpipe emissions; and OC, Pb, Cd, and Mo are present in motor and fuel oil combustion. In addition to its contributions to PM2.1, traffic significantly contributed to PM2.1−9 (17.5% and 16.6% to indoor and outdoor PM2.1−9). The contributions of traffic to PM2.1 and PM2.1−9 exhibited the similar seasonal pattern of winter < summer (24.5% and 22.9% to indoor and outdoor PM2.1 and 19.2% and 18.7% to PM2.1−9).
The sixth source was industrial pollution, which were characterized by significant amounts of V (62.6%), Cr (61.8%), Ni (61.1%), Cu (53.6%), Co (48.6%), and Zn (22.6%) [23,43]; this source may be related to smelters and the metallurgical industries. The contributions of this source to indoor and outdoor PM2.1 in winter were 4.2% and 4.4%, which were slightly higher than the 2.5% and 2.8% contributions to PM2.1−9. Its fractions of both PM2.1 and PM2.1−9 indicated significant seasonal trends, with higher contributions found in summer (5.9% and 6.2% to indoor and outdoor PM2.1 and 4.6% and 3.9% to PM2.1−9).
Zhu et al. [44] summarized the source apportionment results of PM in China based on the 239 previous studies conducted from 1982 to 2017. The most used approaches for estimating source contributions to PM in these studies included chemical mass balance (CMB), positive matrix factorization (PMF), and principal component analysis (PCA). The dominant sources of outdoor air pollution in Beijing were found to be combustion, secondary sources, and dust [44]. In contrast, estimations of the source contributions to size-resolved PM in indoor air in Beijing are scarce [44]. In this study, we used the PMF model to apportion the sources of size-resolved PM in indoor and outdoor air to address the precision performance sufficiency of the operating specifications of PMF [45]. The identified sources were consistent with those in prior studies by Zhu et al. The source contributions may differ from those in other prior studies due to the differences in some factors across different studies, including sampling locations and periods.

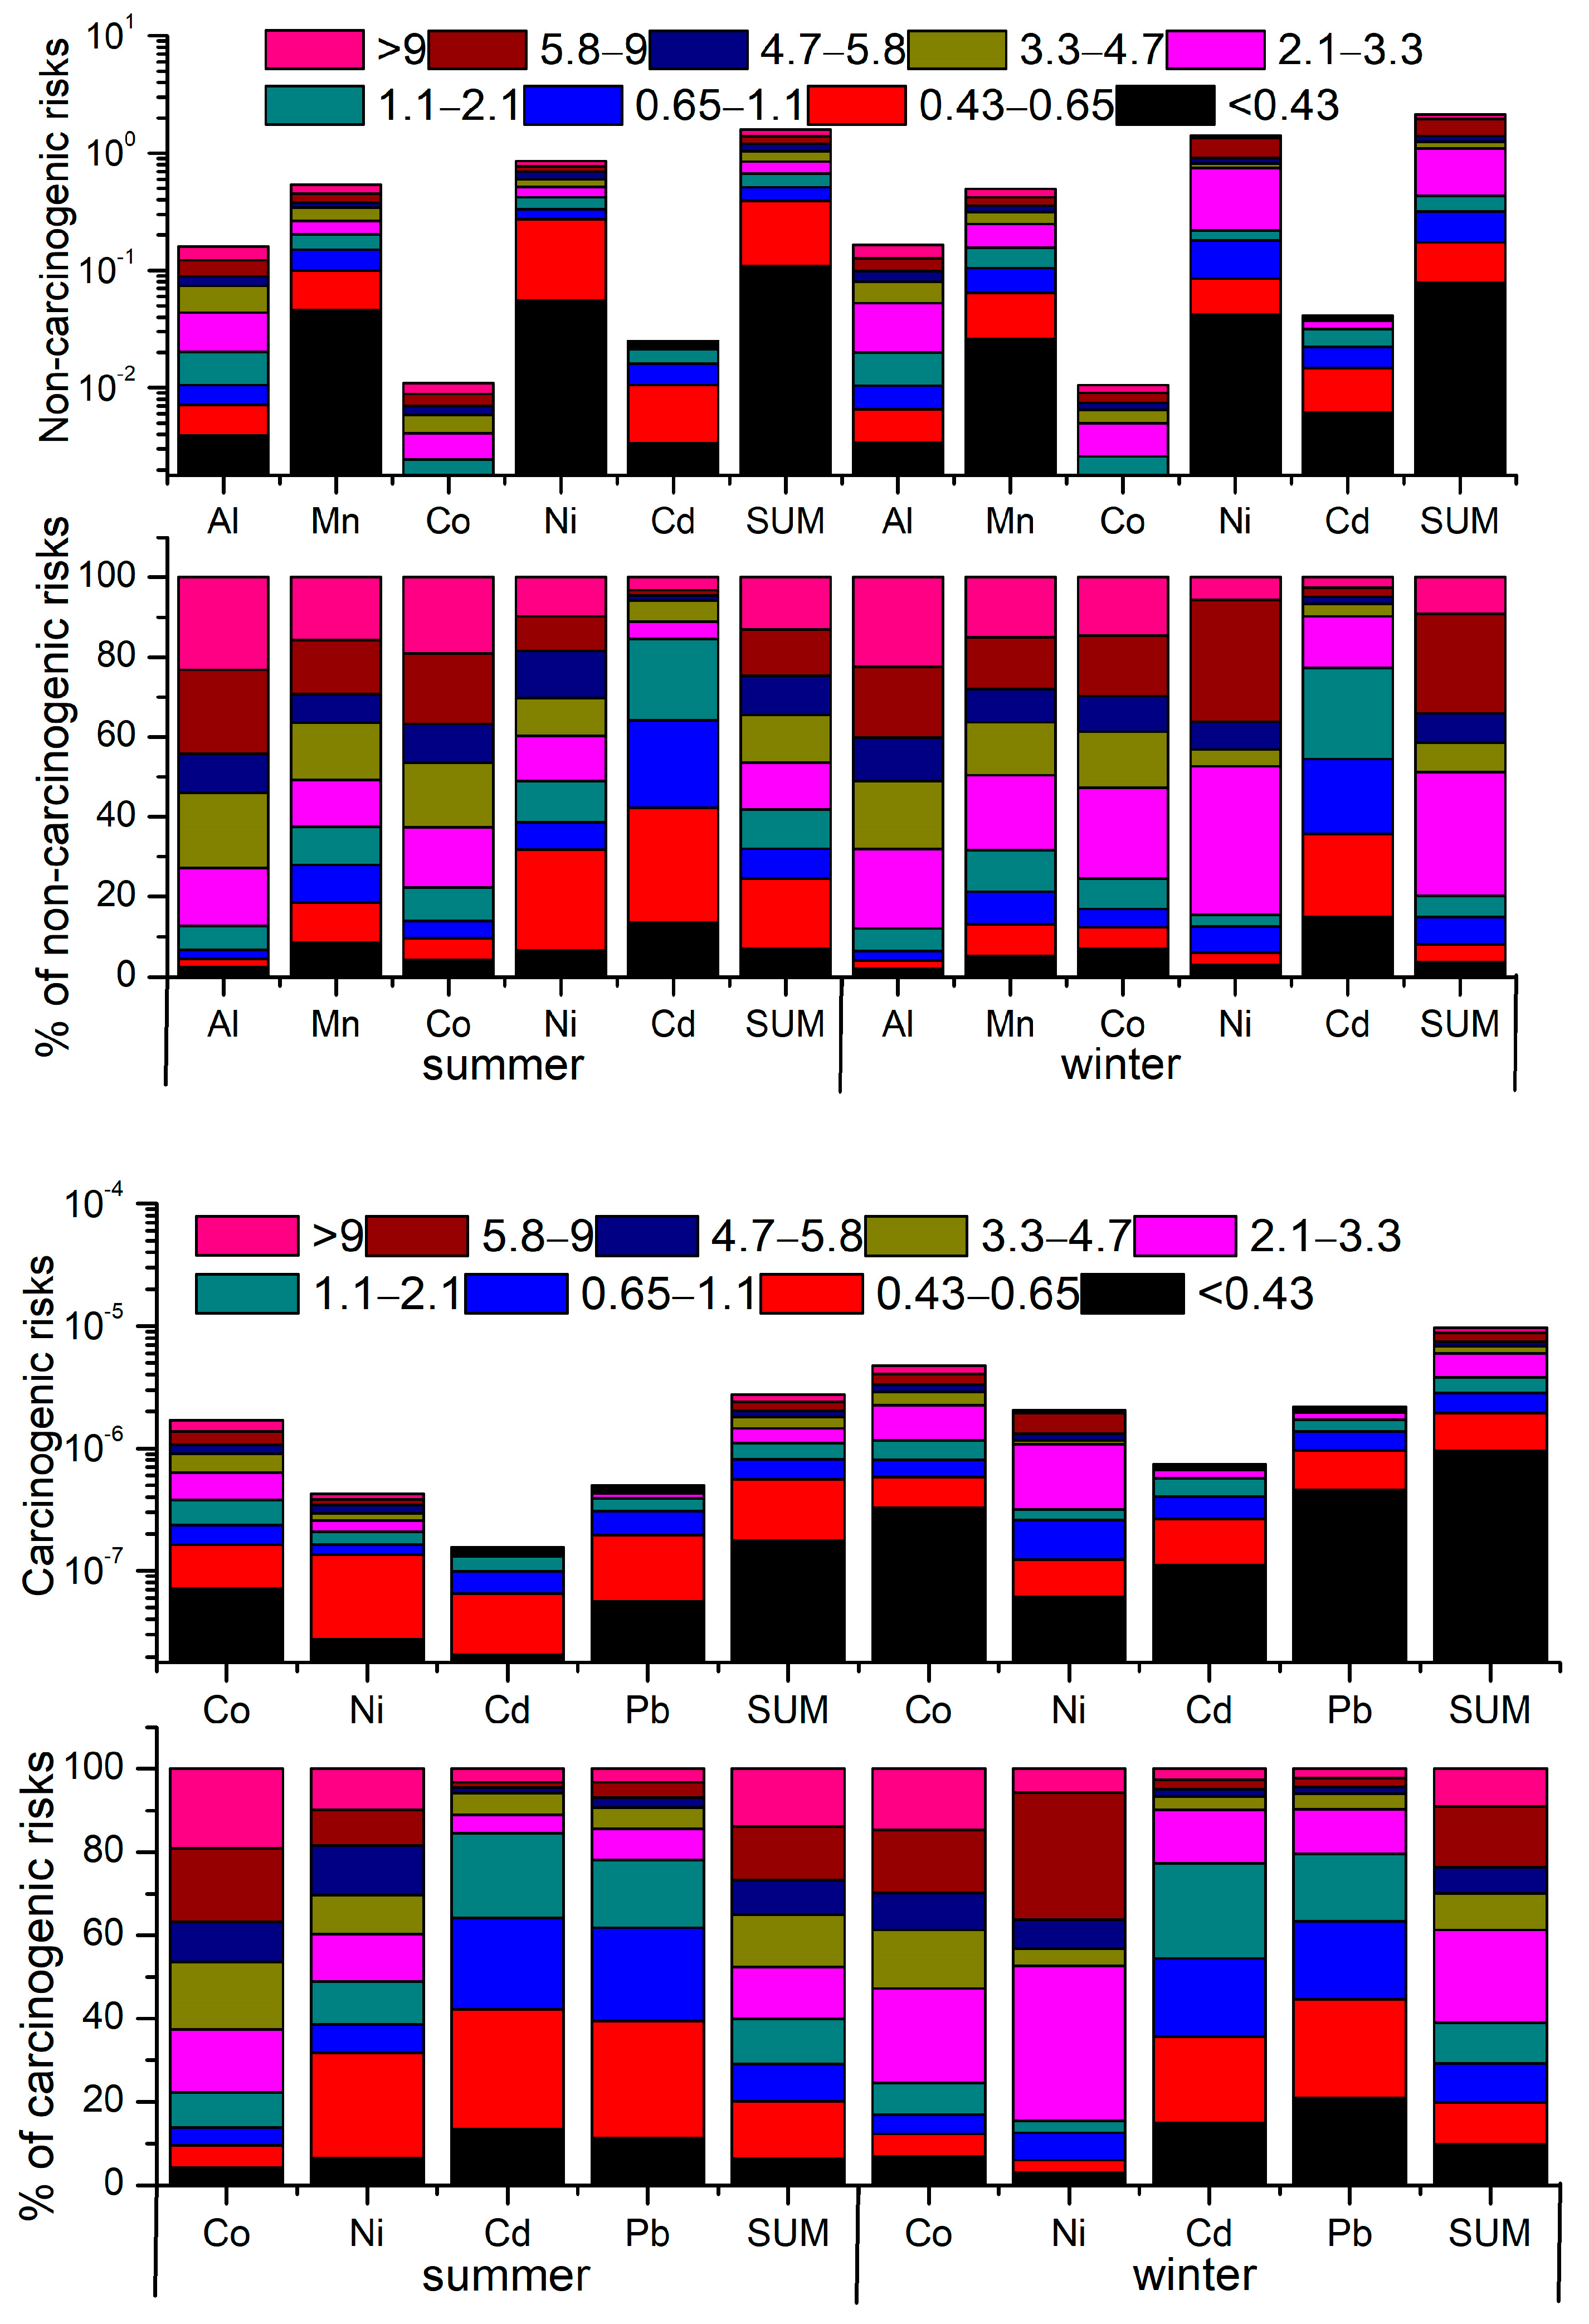
3.4. Possible Human Health Implications

The non-carcinogenic and carcinogenic risks of toxic elements were calculated, considering both indoor and outdoor exposures. Table 2 presents the non-carcinogenic and carcinogenic risks of toxic elements in PM2.1, PM9, and TSP in summer and winter. The total HQ values in PM9 and TSP during both summer and winter were higher than unity, indicating notable non-carcinogenic risks from these elements. For estimating the risks of individual elements, the HQ values for Ni were found to be greater than those of other elements, and the HQ values for Ni in PM9 and TSP in winter were higher than 1. This indicates that Ni in PM9 and TSP poses significant non-carcinogenic risks to human health during winter. Similarly, the total CR values in PM2.1, PM9, and TSP during both summer and winter were greater compared with the acceptable limit of 1.0 × 10⁻⁶, indicating the potential carcinogenic risks caused by these elements. Additionally, the CR values of Co in PM9 and TSP in summer, Co and Ni in PM9 and TSP in winter, and Pb in PM2.1, and PM9 and TSP during winter were located between 1.0 × 10⁻⁶ and 1.0 × 10⁻⁴, indicating potential the carcinogenic risks caused by these elements.
Figure 6 shows the non-carcinogenic and carcinogenic risks and relative proportions of toxic elements in different size fractions. The HQ values of different elements follow the order Ni > Mn > Al > Cd > Co in both summer and winter. Generally, the highest non-carcinogenic risks were observed at 0.43–0.65 μm in summer and 2.1–3.3 μm in winter. The CR values of different elements follow the order Co > Pb > Ni > Cd in both summer and winter. The highest carcinogenic risks were also observed at 0.43–0.65 μm in summer and 2.1–3.3 μm in winter. These results indicate that we cannot ignore the non-carcinogenic and carcinogenic risks caused by coarse particles [15].

4. Conclusions

Our study presents a comprehensive comparison of the indoor versus outdoor mass levels and chemical components of size-resolved particles in urban Beijing, as outdoor air pollution may persist in indoor air. The PM2.1 mass and PM2.1−9 concentrations were usually lower inside the office than they were outside during summer and winter; concentrations both inside and outside the office substantially accumulated during the haze pollution period. The size distribution of the mass concentrations was observed to be bimodal, with the fine-mode maxima in the range of 0.43–0.65 μm and the coarse-mode maxima in the range of 4.7–5.8 μm. Additionally, OM and SNA dominated the PM2.1 mass, which accounted for more than 76.6% of the total PM2.1 mass. High contributions of CM and OM were observed in PM2.1−9, accounting for 30.3~40.2% and 24.3~54.0% of the total PM2.1−9 mass, respectively. The source apportionment results indicated that biomass burning (4.9~6.9% to PM2.1 and 3.3~7.7% to PM2.1-9), SIA (4.9~6.9% to PM2.1 and 3.3~7.7% to PM2.1−9), coal combustion (4.9~6.9% to PM2.1 and 3.3~7.7% to PM2.1−9), dust (4.9~6.9% to PM2.1 and 3.3~7.7% to PM2.1−9), traffic (4.9~6.9% to PM2.1 and 3.3~7.7% to PM2.1−9), and industrial pollution (4.9~6.9% to PM2.1 and 3.3~7.7% to PM2.1−9) were the main sources of PM during the study period. Finally, toxic elements in PM9 and TSP exhibited notable non-carcinogenic risks in both summer and winter, and the elements in PM2.1, PM9, and TSP during both summer and winter showed potential carcinogenic risks to human health. The highest non-carcinogenic and carcinogenic risks were observed at 0.43–0.65 μm in summer and 2.1–3.3 μm in winter. However, our study faced some limitations. Firstly, the findings were derived from a single sampling location with a relatively small sampling volume. In addition, the fixed sampling duration provides a sufficient assessment for the comparison of indoor versus outdoor size-resolved particles in urban environments. Future studies should aim to further elucidate the associations between indoor and outdoor size-resolved particles in urban environments.

Supplementary Materials

The following supporting information can be downloaded at: https://www.mdpi.com/article/10.3390/atmos15060721/s1, Figure S1: Size distributions of indoor and outdoor PM chemical components on clear and haze days in summer and winter.

Author Contributions

Conceptualization, S.T., B.W. and Y.L.; methodology, S.T., L.W., Q.L., L.L. and C.Q.; validation, S.T.; formal analysis, S.T.; investigation, S.T.; resources, B.W. and Y.L.; data curation, S.T., L.W., L.L. and C.Q.; writing—original draft preparation, S.T. and Q.L.; writing—review and editing, S.T. and Q.L.; visualization, S.T.; supervision, Y.L. All authors have read and agreed to the published version of the manuscript.

Funding

This study was supported by Beijing Natural Science Foundation (8222044 and 8232025), the National Natural Science Foundation of China (No. 41807311) and the Beijing Academy of Science and Technology Innovation Foster (24CB003-05).

Institutional Review Board Statement

Not applicable.

Informed Consent Statement

Not applicable.

Data Availability Statement

The data presented in this study are available in the main text.

Conflicts of Interest

The authors declare no conflicts of interest.

Abbreviations

DefinitionAbbreviation DefinitionAbbreviation
1Particulate matter PM12Clear daysC
2Organic matterOM13Summer indoorS-in
3Elemental carbonEC14Summer outdoorS-out
4Crustal materialsCM15Winter indoorW-in
5Heavy metalsHM16Winter outdoorW-out
6Unidentified matterUM17Ratios of indoor/outdoorI/O
7Positive matrix factorizationPMF18Sulfate–nitrate–ammoniumSNA
8Reference concentrationRfC19Secondary organic carbonSOC
9Inhalation unit riskIUR20Secondary inorganic aerosolSIA
10Hazard quotientHQ21Carcinogenic risksCR
11Haze daysH22Total suspended particulatesTSP

References

  1. Weber, R. A map of potentially harmful aerosols in Europe. Nature 2020, 587, 369–370. [Google Scholar] [CrossRef] [PubMed]
  2. Zhang, Q.; Jiang, X.J.; Tong, D.; Davis, S.J.; Zhao, H.Y.; Geng, G.N.; Feng, T.; Zheng, B.; Lu, Z.F.; Streets, D.G.; et al. Transboundary health impacts of transported global air pollution and international trade. Nature 2017, 543, 705. [Google Scholar] [CrossRef] [PubMed]
  3. Carvalho, J.S.; do Nascimento, R.D.S.; Cintra, J.; da Rosa, N.L.C.; Grosseli, G.M.; Fadini, P.S.; Urban, R.C. Source apportionment and health impact assessment of atmospheric particulate matter in the city of Sao Carlos, Brazil. Chemosphere 2023, 326, 138450. [Google Scholar] [CrossRef] [PubMed]
  4. Adhikary, M.; Mal, P.; Saikia, N. Exploring the link between particulate matter pollution and acute respiratory infection risk in children using generalized estimating equations analysis: A robust statistical approach. Environ. Health 2024, 23, 12. [Google Scholar] [CrossRef] [PubMed]
  5. Jiang, G.; Song, X.; Xie, J.; Shi, T.; Yang, Q. Polycyclic aromatic hydrocarbons (PAHs) in ambient air of Guangzhou city: Exposure levels, health effects and cytotoxicity. Ecotoxicol. Environ. Saf. 2023, 262, 115308. [Google Scholar] [CrossRef] [PubMed]
  6. Loupa, G.; Zarogianni, A.-M.; Karali, D.; Kosmadakis, I.; Rapsomanikis, S. Indoor/outdoor PM2.5 elemental composition and organic fraction medications, in a Greek hospital. Sci. Total Environ. 2016, 550, 727–735. [Google Scholar] [CrossRef] [PubMed]
  7. Zhu, Y.; Yang, L.; Meng, C.; Yuan, Q.; Yan, C.; Dong, C.; Sui, X.; Yao, L.; Yang, F.; Lu, Y. Indoor/outdoor relationships and diurnal/nocturnal variations in water-soluble ion and PAH concentrations in the atmospheric PM2.5 of a business office area in Jinan, a heavily polluted city in China. Atmos. Res. 2015, 153, 276–285. [Google Scholar] [CrossRef]
  8. Zhu, Y.; Yang, L.; Meng, C.; Yuan, Q.; Yan, C.; Dong, C.; Sui, X.; Yao, L.; Yang, F.; Lu, Y. PM2.5 Concentrations Indoors and Outdoors in Heavy Air Pollution Days in Winter. Procedia Eng. 2015, 121, 1902–1906. [Google Scholar]
  9. Ni, X.; Pan, Y.P.; Shao, P.; Tian, S.L.; Zong, Z.; Gu, M.N.; Liu, B.W.; Liu, J.; Cao, J.; Sun, Q. Size distribution and formation processes of aerosol water-soluble organic carbon during winter and summer in urban Beijing. Atmos. Environ. 2021, 244, 117983. [Google Scholar] [CrossRef]
  10. Tian, S.; Pan, Y.; Liu, Z.; Wen, T.; Wang, Y. Size-resolved aerosol chemical analysis of extreme haze pollution events during early 2013 in urban Beijing, China. J. Hazard. Mater. 2014, 279, 452–460. [Google Scholar] [CrossRef]
  11. Behera, S.N.; Cheng, J.; Huang, X.; Zhu, Q.; Liu, P.; Balasubramanian, R. Chemical composition and acidity of size-fractionated inorganic aerosols of 2013-14 winter haze in Shanghai and associated health risk of toxic elements. Atmos. Environ. 2015, 122, 259–271. [Google Scholar] [CrossRef]
  12. Swietlik, R.; Trojanowska, M. Chemical Fractionation in Environmental Studies of Potentially Toxic Particulate-Bound Elements in Urban Air: A Critical Review. Toxics 2022, 10, 124. [Google Scholar] [CrossRef] [PubMed]
  13. Kim, B.K.; Kim, C.; Cho, J.L. Association between exposure to heavy metals in atmospheric particulate matter and sleep quality: A nationwide data linkage study. Environ. Res. 2024, 247, 118217. [Google Scholar] [CrossRef] [PubMed]
  14. Enyoh, C.E.; Verla, A.W.; Qingyue, W.; Ohiagu, F.O.; Chowdhury, A.H.; Enyoh, E.C.; Chowdhury, T.; Verla, E.N.; Chinwendu, U.P. An overview of emerging pollutants in air: Method of analysis and potential public health concern from human environmental exposure. Trends Environ. Anal. Chem. 2020, 28, e00107. [Google Scholar] [CrossRef]
  15. Wang, J.; Pan, Y.P.; Tian, S.L.; Chen, X.; Wang, L.; Wang, Y.S. Size distributions and health risks of particulate trace elements in rural areas in northeastern China. Atmos. Res. 2016, 168, 191–204. [Google Scholar] [CrossRef]
  16. Tong, Z.; Chen, Y.; Malkawi, A.; Adamkiewicz, G.; Spengler, J.D. Quantifying the impact of traffic-related air pollution on the indoor air quality of a naturally ventilated building. Environ. Int. 2016, 89–90, 138–146. [Google Scholar] [CrossRef] [PubMed]
  17. Morawska, L.; Ayoko, G.A.; Bae, G.N.; Buonanno, G.; Chao, C.Y.H.; Clifford, S.; Fu, S.C.; Hänninen, O.; He, C.; Isaxon, C.; et al. Airborne particles in indoor environment of homes, schools, offices and aged care facilities: The main routes of exposure. Environ. Int. 2017, 108, 75–83. [Google Scholar] [CrossRef]
  18. Chen, L.; Wang, H.; Wang, Z.; Dong, Z. Estimating the mortality attributable to indoor exposure to particulate matter of outdoor origin in mainland China. Sci. Total Environ. 2023, 872, 162286. [Google Scholar] [CrossRef]
  19. Liu, X.; Xue, Q.; Tian, Y.; Jia, B.; Chen, R.; Huo, R.; Wang, X.; Feng, Y. Potential toxic components in size-resolved particles and gas from residential combustion: Emission factor and health risk. Environ. Int. 2024, 185, 108551. [Google Scholar] [CrossRef]
  20. Nassikas, N.J.; McCormack, M.C.; Ewart, G.; Balmes, J.R.; Bond, T.C.; Brigham, E.; Cromar, K.; Goldstein, A.H.; Hicks, A.; Hopke, P.K.; et al. Indoor Air Sources of Outdoor Air Pollution: Health Consequences, Policy, and Recommendations: An Official American Thoracic Society Workshop Report. Ann. Am. Thorac. Soc. 2024, 21, 365–376. [Google Scholar] [CrossRef]
  21. Huang, R.J.; Zhang, Y.L.; Bozzetti, C.; Ho, K.F.; Cao, J.J.; Han, Y.M.; Daellenbach, K.R.; Slowik, J.G.; Platt, S.M.; Canonaco, F.; et al. High secondary aerosol contribution to particulate pollution during haze events in China. Nature 2014, 514, 218–222. [Google Scholar] [CrossRef] [PubMed]
  22. Tian, S.L.; Pan, Y.P.; Wang, Y.S. Size-resolved source apportionment of particulate matter in urban Beijing during haze and non-haze episodes. Atmos. Chem. Phys. 2016, 16, 1–19. [Google Scholar] [CrossRef]
  23. Huang, R.J.; Zhang, Y.L.; Bozzetti, C.; Ho, K.F.; Cao, J.J.; Han, Y.M.; Daellenbach, K.R.; Slowik, J.G.; Platt, S.M.; Canonaco, F. Source apportionment of fine particulate matter at a megacity in China, using an improved regularization supervised PMF model. Sci. Total Environ. 2023, 879, 163198. [Google Scholar]
  24. Dao, X.; Di, S.; Zhang, X.; Gao, P.; Wang, L.; Yan, L.; Tang, G.; He, L.; Krafft, T.; Zhang, F. Composition and sources of particulate matter in the Beijing-Tianjin-Hebei region and its surrounding areas during the heating season. Chemosphere 2022, 291, 132779. [Google Scholar] [CrossRef]
  25. Yang, X.; Zheng, M.; Liu, Y.; Yan, C.; Liu, J.; Liu, J.; Cheng, Y. Exploring sources and health risks of metals in Beijing PM2.5: Insights from long-term online measurements. Sci. Total Environ. 2022, 814, 151954. [Google Scholar] [CrossRef] [PubMed]
  26. Karanasiou, A.A.; Siskos, P.A.; Eleftheriadis, K. Assessment of source apportionment by Positive Matrix Factorization analysis on fine and coarse urban aerosol size fractions. Atmos. Environ. 2009, 43, 3385–3395. [Google Scholar] [CrossRef]
  27. An, X.; Hou, Q.; Li, N.; Zhai, S. Assessment of human exposure level to PM10 in China. Atmos. Environ. 2013, 70, 376–386. [Google Scholar]
  28. Chen, L.; Pang, X.B.; Li, J.J.; Xing, B.; An, T.C.; Yuan, K.B.; Dai, S.; Wu, Z.T.; Wang, S.Q.; Wang, Q.; et al. Vertical profiles of O3, NO2 and PM in a major fine chemical industry park in the Yangtze River Delta of China detected by a sensor package on an unmanned aerial vehicle. Sci. Total Environ. 2022, 845, 157113. [Google Scholar] [CrossRef] [PubMed]
  29. Manojkumar, N.; Srimuruganandam, B. Size-segregated particulate matter characteristics in indoor and outdoor environments of urban traffic and residential sites. Urban Clim. 2022, 44, 101232. [Google Scholar] [CrossRef]
  30. Hassanvand, M.S.; Naddafi, K.; Faridi, S.; Nabizadeh, R.; Sowlat, M.H.; Momeniha, F.; Gholampour, A.; Arhami, M.; Kashani, H.; Zare, A.; et al. Characterization of PAHs and metals in indoor/outdoor PM10/PM2.5/PM1 in a retirement home and a school dormitory. Sci. Total Environ. 2015, 527–528, 100–110. [Google Scholar] [CrossRef]
  31. Hassanvand, M.S.; Naddafi, K.; Faridi, S.; Arhami, M.; Nabizadeh, R.; Sowlat, M.H.; Pourpak, Z.; Rastkari, N.; Momeniha, F.; Kashani, H.; et al. Indoor/outdoor relationships of PM10, PM2.5, and PM1 mass concentrations and their water-soluble ions in a retirement home and a school dormitory. Atmos. Environ. 2014, 82, 375–382. [Google Scholar] [CrossRef]
  32. Sangiorgi, G.; Ferrero, L.; Ferrini, B.; Porto, C.L.; Perrone, M.; Zangrando, R.; Gambaro, A.; Lazzati, Z.; Bolzacchini, E. Indoor airborne particle sources and semi-volatile partitioning effect of outdoor fine PM in offices. Atmos. Environ. 2013, 65, 205–214. [Google Scholar] [CrossRef]
  33. Andretta, M.; Coppola, F.; Seccia, L. Investigation on the interaction between the outdoor environment and the indoor microclimate of a historical library. J. Cult. Herit. 2016, 17, 75–86. [Google Scholar] [CrossRef]
  34. Tian, S.; Pan, Y.; Wang, Y. Ion balance and acidity of size-segregated particles during haze episodes in urban Beijing. Atmos. Res. 2018, 201, 159–167. [Google Scholar] [CrossRef]
  35. Zhao, X.; Wang, X.; Ding, X.; He, Q.; Zhang, Z.; Liu, T.; Fu, X.; Gao, B.; Wang, Y.; Zhang, Y.; et al. Compositions and sources of organic acids in fine particles (PM2.5) over the Pearl River Delta region, south China. J. Environ. Sci. 2014, 26, 110–121. [Google Scholar] [CrossRef] [PubMed]
  36. Du, H.; Kong, L.; Cheng, T.; Chen, J.; Du, J.; Li, L.; Xia, X.; Leng, C.; Huang, G. Insights into summertime haze pollution events over Shanghai based on online water-soluble ionic composition of aerosols. Atmos. Environ. 2011, 45, 5131–5137. [Google Scholar] [CrossRef]
  37. Cheng, Y.; Engling, G.; He, K.-b.; Duan, F.-k.; Du, Z.-y.; Ma, Y.-l.; Liang, L.-l.; Lu, Z.-f.; Liu, J.-m.; Zheng, M.; et al. The characteristics of Beijing aerosol during two distinct episodes: Impacts of biomass burning and fireworks. Environ. Pollut. 2014, 185, 149–157. [Google Scholar] [CrossRef] [PubMed]
  38. Gupta, L.; Bansal, M.; Nandi, P.; Habib, G.; Raman, R.S. Source apportionment and potential source regions of size-resolved particulate matter at a heavily polluted industrial city in the Indo-Gangetic Plain. Atmos. Environ. 2023, 298, 119614. [Google Scholar] [CrossRef]
  39. Luo, L.; Bai, X.; Liu, S.; Wu, B.; Liu, W.; Lv, Y.; Guo, Z.; Lin, S.; Zhao, S.; Hao, Y.; et al. Fine particulate matter (PM2.5/PM1.0) in Beijing, China: Variations and chemical compositions as well as sources. J. Environ. Sci. 2022, 121, 187–198. [Google Scholar] [CrossRef] [PubMed]
  40. Si, R.; Xin, J.; Zhang, W.; Wen, T.; Li, S.; Ma, Y.; Wu, X.; Cao, Y.; Xu, X.; Tang, H.; et al. Environmental and health benefits of establishing a coal banning area in the Beijing-Tianjin-Hebei region of China. Atmos. Environ. 2021, 247, 118191. [Google Scholar] [CrossRef]
  41. Tian, Y.; Li, Y.; Liang, Y.; Xue, Q.; Feng, X.; Feng, Y. Size distributions of source-specific risks of atmospheric heavy metals: An advanced method to quantify source contributions to size-segregated respiratory exposure. J. Hazard. Mater. 2020, 407, 124355. [Google Scholar] [CrossRef]
  42. Dai, Q.L.; Bi, X.H.; Huangfu, Y.Q.; Yang, J.M.; Li, T.K.; Khan, J.Z.; Song, C.B.; Xu, J.; Wu, J.H.; Zhang, Y.F.; et al. A size-resolved chemical mass balance (SR-CMB) approach for source apportionment of ambient particulate matter by single element analysis. Atmos. Environ. 2019, 197, 45–52. [Google Scholar] [CrossRef]
  43. Pan, Y.P.; Liu, J.; Zhang, L.; Cao, J.; Hu, J.B.; Tian, S.L.; Li, X.Y.; Xu, W. Bulk Deposition and Source Apportionment of Atmospheric Heavy Metals and Metalloids in Agricultural Areas of Rural Beijing during 2016–2020. Atmosphere 2021, 12, 13. [Google Scholar] [CrossRef]
  44. Zhu, Y.; Huang, L.; Li, J.; Ying, Q.; Zhang, H.; Liu, X.; Liao, H.; Li, N.; Liu, Z.; Mao, Y.; et al. Sources of particulate matter in China: Insights from source apportionment studies published in 1987–2017. Environ. Int. 2018, 115, 343–357. [Google Scholar] [CrossRef] [PubMed]
  45. Liu, Q.; Liu, Y.; Yang, Z.; Qi, X.; Schauer, J.J. High loadings of carbonaceous aerosols from wood smoke in the atmosphere of Beijing from 2015 to 2017: Implications for energy transition policy. Environ. Pollut. 2024, 344, 123240. [Google Scholar] [CrossRef] [PubMed]
Figure 1. The time series for outdoor PM2.5, PM10, NO2, O3, SO2, and CO during summer and winter.
Atmosphere 15 00721 g001
Figure 2. Size distributions of the mass concentrations of both inside and outside particles.
Atmosphere 15 00721 g002
Figure 3. Average mass closure for the indoor and outdoor samples of (a) PM2.1 and (b) PM2.1−9.
Atmosphere 15 00721 g003
Figure 4. Size distributions of indoor and outdoor PM chemical components in summer and winter.
Atmosphere 15 00721 g004aAtmosphere 15 00721 g004bAtmosphere 15 00721 g004c
Figure 5. The profiles of each source and the apportioned percentages of species for each source.
Atmosphere 15 00721 g005
Figure 6. Non-carcinogenic and carcinogenic risks and relative proportions of toxic elements in different-sized fractions.
Atmosphere 15 00721 g006
Table 1. Concentrations of the indoor and outdoor size-resolved mass and chemical compositions during summer and winter (μg m−3).
S-inS-outW-inW-out
PM2.1PM2.1-9PM2.1PM2.1-9PM2.1PM2.1-9PM2.1PM2.1-9
MeanRangeMeanRangeMeanRangeMeanRangeMeanRangeMeanRangeMeanRangeMeanRange
PM29.4 19.1–44.732.8 24.4–43.0 38.1 23.7–64.1 30.3 21.8–43.4 35.2 16.1–54.2 23.0 12.7–30.5 41.4 20.2–64.7 23.1 13.2–30.8
OC9.47 6.98–12.2511.08 8.42–13.84 10.81 8.06–14.78 8.38 6.23–11.50 9.48 4.67–13.94 4.59 2.83–6.10 9.14 4.91–13.85 3.50 2.38–4.71
EC0.80 0.50–1.140.46 0.33–0.56 1.22 0.88–1.48 0.54 0.30–0.86 1.71 1.13–2.89 0.69 0.56–1.03 2.47 1.64–4.24 0.69 0.65–1.06
Na+0.25 0.16–0.400.37 0.26–0.49 0.31 0.20–0.50 0.34 0.19–0.61 0.50 0.32–0.68 0.64 0.42–0.85 0.63 0.42–0.84 0.67 0.42–0.94
NH4+2.34 0.95–3.880.32 0.20–0.47 3.85 1.57–6.48 0.42 0.22–0.67 2.18 0.78–3.71 0.25 0.15–0.35 3.07 1.11–5.29 0.31 0.17–0.46
K+0.14 0.11–0.210.11 0.09–0.16 0.22 0.16–0.33 0.10 0.07–0.14 0.46 0.34–0.78 0.18 0.14–0.29 0.58 0.41–0.98 0.20 0.16–0.33
Mg2+0.44 0.35–0.630.75 0.59–1.02 0.48 0.39–0.65 0.58 0.42–0.87 0.36 0.23–0.47 0.68 0.42–0.95 0.33 0.25–0.42 0.66 0.37–0.99
Ca2+1.61 1.25–1.883.14 2.35–3.91 1.89 1.44–2.45 3.41 2.56–4.48 2.47 1.66–3.67 6.57 4.61–9.24 3.19 2.64–4.03 6.99 4.72–9.96
Cl0.24 0.17–0.350.37 0.28–0.48 0.34 0.24–0.51 0.40 0.21–0.81 1.42 0.71–2.53 0.57 0.39–0.91 1.97 1.06–3.40 0.56 0.41–0.87
NO32.26 1.02–4.542.24 1.18–3.96 3.39 1.17–7.85 3.01 1.63–5.54 6.59 1.89–10.14 1.53 0.89–1.83 9.51 2.98–15.432.29 1.05–3.15
SO42−3.20 1.33–8.090.99 0.95–1.44 5.16 2.47–13.63 1.10 0.73–2.59 3.13 1.10–5.28 1.22 0.60–1.75 4.49 1.64–7.50 1.50 0.72–2.27
Na0.5525 0.4259–0.80610.6736 0.5185–0.9847 0.6821 0.4883–1.0687 0.6843 0.5281–1.0098 0.3865 0.1945–0.5496 0.4833 0.2653–0.6550 0.4209 0.2496–0.5349 0.5135 0.2761–0.6949
Mg0.1756 0.1179–0.21860.5426 0.3582–0.6880 0.1888 0.1106–0.2887 0.4452 0.3269–0.5324 0.1503 0.0684–0.2181 0.4234 0.2043–0.5927 0.1247 0.0723–0.1608 0.3486 0.1760–0.4889
Al0.0937 0.0616–0.13600.5062 0.3871–0.6480 0.1392 0.0775–0.2542 0.5427 0.4272–0.6712 0.0996 0.0383–0.1907 0.5309 0.2666–0.8567 0.0986 0.0722–0.1264 0.5769 0.3239–0.8573
K0.1852 0.1165–0.25420.2128 0.1482–0.2706 0.2446 0.1405–0.3742 0.2235 0.1617–0.2723 0.2845 0.0991–0.5148 0.2358 0.1298–0.3352 0.3155 0.1558–0.4946 0.2737 0.1333–0.4311
Ca0.6098 0.4822–0.77091.8422 1.4379–2.3587 0.9028 0.5331–1.4901 2.0038 1.6071–2.5326 0.4989 0.3128–0.7386 1.2514 0.8256–1.7930 0.5665 0.4675–0.7178 1.3817 0.9664–1.9301
V0.0003 0.0001–0.00050.0008 0.0005–0.0013 0.0005 0.0002–0.0013 0.0008 0.0006–0.0011 0.0003 0.0001–0.0006 0.0010 0.0005–0.0013 0.0005 0.0003–0.0007 0.0011 0.0006–0.0015
Cr0.0039 0.0021–0.00590.0042 0.0025–0.0056 0.0048 0.0027–0.0073 0.0068 0.0035–0.0108 0.0051 0.0028–0.0082 0.0066 0.0032–0.0114 0.0038 0.0031–0.0058 0.0118 0.0040–0.0217
Mn0.0095 0.0056–0.01580.0123 0.0083–0.0181 0.0128 0.0073–0.0224 0.0138 0.0091–0.0202 0.0078 0.0038–0.0139 0.0127 0.0089–0.0187 0.0082 0.0067–0.0110 0.0158 0.0098–0.0243
Fe0.2663 0.1659–0.35380.6707 0.3937–0.9452 0.3849 0.1825–0.6526 0.7874 0.4789–1.0579 0.2553 0.1350–0.4349 0.8596 0.5417–1.3227 0.2868 0.2437–0.3758 1.0331 0.6716–1.5598
Co0.0001 0.0001–0.00020.0003 0.0002–0.0004 0.0002 0.0001–0.0003 0.0004 0.0002–0.0006 0.0001 0.0001–0.0002 0.0003 0.0002–0.0004 0.0002 0.0001–0.0002 0.0004 0.0002–0.0006
Ni0.0025 0.0018–0.00370.0021 0.0013–0.0038 0.0027 0.0017–0.0049 0.0024 0.0017–0.0042 0.0008 0.0007–0.0026 0.0072 0.0028–0.0135 0.0038 0.0015–0.0067 0.0045 0.0010–0.0125
Cu0.0117 0.0079–0.02040.0074 0.0049–0.0131 0.0172 0.0084–0.0346 0.0095 0.0085–0.0133 0.0066 0.0060–0.0167 0.0285 0.0125–0.0559 0.0251 0.0217–0.0340 0.0153 0.0059–0.0461
Zn0.0487 0.0351–0.09460.0266 0.0205–0.0490 0.0599 0.0428–0.1181 0.0248 0.0232–0.0352 0.0444 0.0273–0.0632 0.0232 0.0139–0.0333 0.0490 0.0371–0.0612 0.0328 0.0149–0.0530
As0.0012 0.0005–0.00230.0006 0.0004–0.0010 0.0021 0.0008–0.0037 0.0003 0.0004–0.0007 0.0013 0.0006–0.0019 0.0005 0.0003–0.0007 0.0013 0.0007–0.0019 0.0007 0.0003–0.0011
Mo0.0003 0.0002–0.00040.0003 0.0002–0.0004 0.0006 0.0003–0.0010 0.0005 0.0004–0.0006 0.0002 0.0001–0.0004 0.0003 0.0002–0.0004 0.0003 0.0002–0.0004 0.0005 0.0002–0.0007
Cd0.0002 0.0001–0.00040.0000 0.0000–0.0001 0.0003 0.0002–0.0006 0.0000 0.0000–0.0001 0.0003 0.0001–0.0005 0.0001 0.0000–0.0001 0.0003 0.0002–0.0004 0.0001 0.0000–0.0002
Sb0.2177 0.1558–0.30930.2500 0.1794–0.3545 0.3435 0.2377–0.5302 0.3476 0.2442–0.5308 0.0707 0.0426–0.0903 0.0836 0.0486–0.1087 0.1004 0.0585–0.1318 0.0967 0.0547–0.1269
Ba0.0045 0.0036–0.00540.0156 0.0119–0.0193 0.0074 0.0042–0.0122 0.0184 0.0137–0.0232 0.0047 0.0028–0.0072 0.0126 0.0076–0.0194 0.0064 0.0035–0.0104 0.0130 0.0094–0.0186
Pb0.0130 0.0080–0.02000.0033 0.0019–0.0054 0.0204 0.0109–0.0353 0.0036 0.0026–0.0049 0.0214 0.0111–0.0329 0.0044 0.0027–0.0064 0.0225 0.0136–0.0350 0.0075 0.0026–0.0136
Table 2. HQ and CR of toxic elements in PM2.1, PM9, and TSP in summer and winter.
SummerWinter
PM2.1PM9TSPPM2.1PM9TSP
HQAl0.02 0.12 0.16 0.02 0.13 0.16
Mn0.20 0.45 0.54 0.16 0.42 0.50
Co0.00 0.01 0.01 0.00 0.01 0.01
Ni0.42 0.77 0.86 0.22 1.34 1.42
Cd0.02 0.02 0.03 0.03 0.04 0.04
Sum0.67 1.38 1.59 0.43 1.94 2.14
CRCo3.78 × 10−71.37 × 10−61.69 × 10−61.17 × 10−64.05 × 10−64.75 × 10⁻⁶
Ni2.07 × 10−73.82 × 10−74.24 × 10−73.18 × 10−71.93 × 10−62.05 × 10⁻⁶
Cd1.31 × 10−71.50 × 10−71.55 × 10−75.73 × 10−77.22 × 10−77.40 × 10⁻⁷
Pb3.90 × 10−74.82 × 10−74.99 × 10−71.73 × 10−62.12 × 10−62.17 × 10⁻⁶
Sum1.11 × 10−62.38 × 10−62.77 × 10−63.78 × 10−68.83 × 10−69.71 × 10⁻⁶
Disclaimer/Publisher’s Note: The statements, opinions and data contained in all publications are solely those of the individual author(s) and contributor(s) and not of MDPI and/or the editor(s). MDPI and/or the editor(s) disclaim responsibility for any injury to people or property resulting from any ideas, methods, instructions or products referred to in the content.

