Abstract
In this study, the new data of experimental studies of the atmospheric particulate matter (PM) on the south-eastern coast of Lake Baikal (station Boyarsky) were analyzed in summer 2021. High-altitude measuring sites were arranged in the forest massif (mast, 16 m) and above the meadow vegetation (mast, 30 m). By the Giardina M. model and based on the measurements data the calculations of the deposition flux density of aerosol particles on forest and meadow vegetation were made. Our preliminary results of prediction obtained by Giardina M. model good agrees with measured dry deposition velocities across particle sizes. In the forest, the mass concentration of aerosol particles differs slightly from the mass concentrations in the grasslands and is equal on average 7.9 × 10⁻³ mg m−3 for the size particles below 200 nm (PM0.2) and 6.7 × 10⁻⁴ mg m−3 for particles in the size range from 0.2 to 10 μm (PM0.2–10). However, we found that mass flux density of aerosol particle is almost 4.8 times higher under forest canopy than in meadow vegetation. In addition, the leaf area index (LAI), which characterize the effective area of particle deposition, is also significantly higher in the tree canopy (5.6) compared to the grassland vegetation (2.4).
1. Introduction
Aerosol particles are among the key climate forcing factors and public health risks. The mechanisms and factors determining the processes of particle formation and their further transformation in the atmosphere are still not entirely clear [1,2]. In spite of the increased interest in experimental investigations of atmospheric particles in various regions, information on their spatial and temporal dynamics in the atmosphere is still very scarce. Such studies in the Lake Baikal region are particularly important and relevant, both in terms of assessing the state of the air environment over a unique natural object—Lake Baikal, and in general, for understanding the mechanisms of aerosol interaction with atmospheric processes, both in the drive layer and in the surface atmosphere, where particles are formed from different sources [3].
One of the major sources of ambient aerosol and gas emissions and simultaneously sinks for atmospheric impurities, including anthropogenic substances, are forest and grassland ecosystems. Without taking into account the natural sources of emissions/drainage of atmospheric impurities it is impossible to give an objective assessment of the state and forecast of atmospheric air quality in the Lake Baikal region. The systems of estimation and forecasting of emissions and especially flows of aerosol and gaseous impurities are currently based mainly on the methods of mathematical modeling, in particular [1,2,3].
Despite the fact that studies of atmospheric particulate matter (PM) are actively conducted in various regions of the world, there are still many problems that need to be solved in order to understand the processes that determine their variability. One of the main problems is to identify the features of the chemical and physical mechanisms of formation, transformation, and transfer of the fine aerosol fraction in various natural and climatic conditions, especially in those regions where such studies have not been conducted before. In this regard, the Baikal region is of particular interest as an ideal location characterized by a unique natural environment. Simultaneously, periods of anthropogenic impact are observed in the Baikal region due to the orographic isolation of the Baikal basin and the specific nature of air flow circulation over the lake. Forest and meadow ecosystems are one of the major sources of emissions of natural aerosols and gases and at the same time are runoffs for atmospheric impurities, including anthropogenic substances. Without taking into account natural sources of emission/runoff of atmospheric impurities, it is impossible to give an objective assessment of the state and forecast of atmospheric air quality in the Baikal region.
Current knowledge of fluctuations in aerosol parameters, including count and mass concentrations, is fragmentary in many respects.
The patterns of turbulent fluctuations in the components of wind velocity and air temperature in the surface and near-water layers cannot be considered fully studied, especially in the border zone of «water-land». The current situation determines the need to set up new special experiments to study fluctuations in atmospheric aerosol parameters, together with turbulent pulsations of wind velocity and air temperature components and their relationship with convective and advective processes in the atmosphere.
Such complex special experiments aimed at studying the spatial and temporal variability of atmospheric aerosols in interaction with atmospheric processes on Lake Baikal have not been held before.
From the increasing anthropogenic load, extreme natural phenomena such as wildfires an assessment of environmental damage to the ecosystem of Lake Baikal still remains an unsolved problem due to the lack of observational data.
There are insufficient data on observations of the composition of chemically active gas impurities, aerosols, and the inclusion of various factors affecting the composition and quality of atmospheric air, including runoff/emission of impurities in natural ecosystems (forest, soil, water).
A large number of models can be found in the literature [1,4,5,6,7,8,9,10]; however, none of them are able to deal exhaustively with most of the phenomenological phenomena associated with the deposition of contaminants due to the many complex processes involved. With regard to dry deposition of particles, the proposed calculation models for estimating dry deposition velocities and fluxes are far from complete due to the complex dependence of deposition on particle size, density, terrain, vegetation, meteorological conditions, and chemical species of aerosol particles. Giardina et al. [11] proposed a new model which is based on an electrical analogy to calculate the deposition velocity of particles to modify the laminar sublayer resistivity parameterization. New relations were obtained supposing that resistances which affect particle flow in quasilaminar sublayer can be combined taking into account local features of mutual in-fluence of inertial and turbulent interaction processes of particles.
A comparative study, which was carried out using significant experimental material [12,13,14,15,16,17], makes it possible to verify the correctness of the proposed approach. In this paper, the proposed approach is applied to quantify the deposition fluxes of atmospheric particulate matter on different types of underlying surface in Lake Baikal region. Based on our experimental data and Giardina et al.’s (2018) model [11] we calculated the deposition flux density of atmospheric particulate matter (PM0.2 and PM0.2–10 particles) on the underlying surface with forest and meadow vegetation.
The focus of this paper is to present preliminary data of deposition of atmospheric particulate matter in terrestrial ecosystems in the Baikal region and to make an attempt to apply the accumulated experience from such studies to other regions of the world.
2. Materials and Methods
2.1. Experimental Conditions and Measurement Methods
To investigate spatial and temporal peculiarities of aerosol admixtures transfer and distribution processes, in order to estimate particle deposition fluxes on the underlying surface, high-altitude measuring sites were arranged in the forest massif and above the soil vegetation in the coastal zone of Lake Baikal: (1) mast measurements (30 m) above the meadow vegetation, (2) mast measurements (16 m) in the deciduous forest. Measurements were taken from 27 July 2021 to 27 August 2021. The observation point is located on the territory of the research station “Boyarsky” at a distance of 500 m from the Baikal water surface and at a height of 60 m from the lake level. Station “Boyarsky” is remote from industrial centers and located near the coastal zone of Lake Baikal in a relatively clean area, close to “background” conditions. The masts are installed on concrete platforms. Figure 1 demonstrates the study area and measurement scheme. The forest, mixed on average, is 40–50 years old and consists of birch, poplar, larch, pine and cedar. At the measuring tower, mainly birch trees grow, with a tree crown height of h = 12 m with a peak leaf area index—LAI = 5.6 during the measurement period. LAI was determined by the results of the digital processing of hemispherical photos [18,19]. Air was continuously sampled at the height of 2 m on mast № 1, and at the height of 16 m on mast № 2, to determine counting concentration of particles in the range from 5 nm to 10 μm using diffusion aerosol spectrometer DAS 2702 M developed by company “AeroNanoTech” (Moscow) [20]. The limits of acceptable relative error of measurements of aerosol particle sizes are ±15%. Time of the complete measurement cycle is from 1 to 3 min. The spectrometer has 2 modes of operation: the mode of measurement of parameters of aerosol particles in the size range from 0.005 to 0.2 μm (40 ranges with a step of 5 nm) and the mode of measurement of parameters of aerosol particles in the size range from 0.2 to 10 μm (12 channels). In addition, measurements of meteorological and turbulent atmospheric parameters were carried out using ultrasonic weather stations EXMETEO, AMK-2 [21].
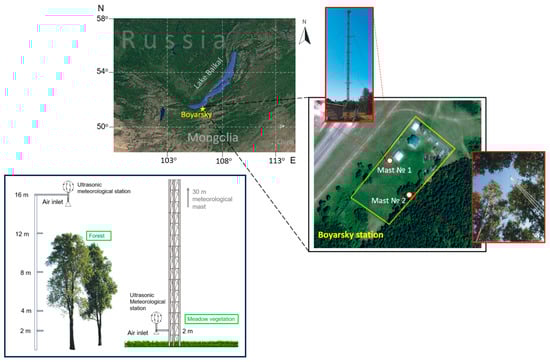
Figure 1.
Observation points, flowchart of measurement of atmospheric particulate matter, velocity and deposition flux at the Boyarsky station.
Based on the results of studies of daily variability of the total concentration of fine particulate matter with the size below 0.2 μm (PM0.2) and the total concentration of particles in the size range from 0.2 to 10 μm (PM0.2–10) at sites with differing types of underlying surface, calculations of the deposition flux density of atmospheric particulate matter on the underlying surface with forest and meadow vegetation were made.
2.2. Deposition Velocity Calculations
The fundamental concept under investigation in the study of the dry deposition process is the deposition velocity (Vd), expressed in meters per second (m s−1). The deposition velocity at a specific height z plays a crucial role in establishing a relationship between the vertical flux of pollutants and the measured concentration of pollutants at height z in comparison to the concentration at ground level:
where F (g (m2 s)−3)—is the flux of pollutant removed from a unit area and C(z) (g m−3) is the concentration of pollutant at height z.
Vd = F/C(z)
According to Stokes’ law, the gravitational settling velocity (Vs) of particles increases proportionally to the square of the particle diameter (dp). This law is applicable to particles with diameters up to 50 µm:
where g is gravitational acceleration; pp is particle density; pa is air density; μa is dynamic viscosity of air; and Cc is Cunningham factor [22]. The Cc parameter can be represented as follows:
where λₐ is the free path length of the molecule.
Vs = (dp2 × g × (pp − pa) × Cc)/18 × μa
Cc = 1 + λₐ/dp × (2.514 + 0.8 × e (−0.55 × dp)/λₐ)
As highlighted in the work by Gallagher et al. [16], the dry deposition rate of particles, when estimated using the electrical analogy approach described earlier, exhibits inconsistencies with the principles of the mass conservation equation. To model the vertical transport of particles, it is proposed that turbulent transport and particle settling can be combined and summarized as follows, as suggested by Venkatram et al. [23]:
where Kp is the vortex diffusivity for mass transfer of species C and Vs is the settling velocity determined from Equation (2). Through the process of integration of the aforementioned equation, an expression for the settling velocity can be derived as follows:
where r(z) is the total transport resistance, (r) can be computed as a function of the particle diameter (dp) and height (z). The novel model, proposed by Giardina et al. [11], is founded upon an electrical analogy. According to this model, the total resistance can be estimated using the following equation:
Kp × dC/dz + Vs × C = F
Vd = Vs/(1 − e−(r(z) × Vs)
r(z) = ra + rql
The resistance (ra) can be ascertained by applying the Monin–Obukhov similarity theory, which establishes the dependence, as described by Seinfeld et al. [20], Venkatram et al. [23], Csanady [24] and Wesely et al. [25]:
where u* is the friction velocity, which is the intensity of atmospheric turbulence; z0 is the surface roughness height above the displacement plane; d is the height of displacement from the zero plane; and k is the von Karman constant (usually equal to 0.4). Roughness length (z0) and displacement height (d) are calculated as a function of plant dome height (forest, grass) and LAI—leaf area index.
ra = 1/ku* × (ln((z − d)/z0)) − ψh
z0 = h (0.215 − LAI0.25/10)
d = h (0.1 + LAI0.2/2)
The following relations for the calculation of the parameter Ψh in Equation (7) were proposed in [3]:
where L is the Monin–Obukhov scale.
ψh = −5 × (z − d)/L for (z − d)/L > 0 (stable atmospheric conditions)
ψh = e(0.5998 + 0.390 × Ln ((z − d)/L) − 0.09 × Ln (−((z − d)/L) × (z − d)/L)) for (z − d)/L < 0
The resistance of the quasi-laminar sublayer rql is estimated by considering a parallel resistance chain rdb, rii and rti. Here, resistance rdb takes into account contribution of Brownian diffusion; resistance rii takes into account effect of inertial compaction for large particles; resistance rti takes into account effect of inertial compaction due to turbulent impact. Based on the aforementioned hypotheses, the resistances ri (associated with inertial impact processes) and rti (related to turbulent impact) are interconnected in series to consider specific local characteristics of their mutual influence. Under these assumptions, the estimated resistance rql is given by the following equation:
1/rql = 1/(rdb + 1/rii + 1/(rii + rti))
In the scientific literature, different models propose a functional relationship between the resistance associated with Brownian diffusion phenomena (rdb) and the Schmidt number (Sc). The general expression for rdb can be represented as follows:
where C and p are constants and Sc is the Schmidt number, which is estimated as follows:
where νa is the kinematic viscosity of air (m2 s−1) and D is the Brownian diffusion of a particle. The Brownian diffusion of air (m2 s−1) determined from the Stokes–Einstein equation:
with Kb being Boltzmann constant (J K−1); T being absolute temperature; μa being the dynamic viscosity of air; and Cc being the Cunningham factor from Equation (3). The parameter p in Equation (13) typically falls within the range of 1/2 to 2/3, with higher values observed for rougher surfaces. For instance, Slinn et al. [2] proposed a value of 1/2 for water surfaces, while Peters et al. [26] suggested a value of 2/3 for vegetated surfaces. In the study by Zhang et al. [1], varying values of p were employed based on land-use categories. However, in the current study, a uniform relationship is adopted for all surface conditions, and it is represented as follows:
rdb = 1/u* × C(Sc)p
Sc = va/D
D = (Kb × T × Cc)/(3 × π × µa × dp)
rdb = 1/u* × C(Sc)−2/3
The transport of particles through Brownian diffusion, as described in Equation (16), has been widely recommended in various studies based on both theoretical and empirical findings [25,27,28]. The resistance associated with the inertial interaction process (rii) is estimated using a ratio that is applicable to both smooth and rough surfaces:
where St is the Stokes number, defined as follows:
rdb = 1/u* × (S2t/(S2t + 400)) (for smooth surfaces)
rii = 1/u* × (S2t/(S2t + 1)) (for rough surfaces)
St = (vs × u*2)/g × va
The settling velocity (vs) is determined from Equation (2). Several authors have suggested these or similar equations for compaction efficiency as a function of smooth and rough surfaces [26]. For instance, Zhang et al. [1] (2001) proposed a compaction efficiency that varies with the land use. The resistance associated with turbulence phenomena (rti) is predicted as a function of the dimensionless particle relaxation time, τ+, in the following manner:
where τ+ is estimated using the following relation:
rti = 1/(u* × m × τ+n) (for all surfaces)
τ+ = τ × (u*2/va)
τ = (dp2 × pp × Cc)/(18 × μa)
The constants m and n in Equation (20) were determined by fitting the experimental data from [29,30] to Equations (5), (12), (16), (17) and (20). The authors of these studies conducted experiments to investigate the deposition of aerosol particles under conditions with comparable values of friction velocities. By analyzing the experimental data and adapting the mentioned equations, they established suitable values for the constants m and n to achieve a good fit between the theoretical predictions and the observed data. In the light of the above considerations, Equation (5) can be written as follows:
where ra, rdb and rti are estimated using Equations (7), (13) and (20), which use constants m = 0.1 and n = 3. The parameter rii is estimated using Equation (17) or Equation (18) for smooth or rough surfaces, respectively.
Vd = vs/(1 − e−vs × ((ra + 1)/(1/rdb + 1/rii + 1/(rii + rti)))
3. Results and Discussions
The atmospheric particles flux variation is influenced by local meteorological parameters, affecting its residence time and chemical behavior in the lower atmosphere [31,32]. The complex interactions between PM deposition and meteorological parameters occur on both spatial and temporal scales. Many studies have highlighted the significant impacts of meteorological factors such as relative humidity, air temperature, wind speed, and precipitation [33,34,35,36,37,38,39].
Based on the equations from the model [11], we performed calculations of the flux density of the count concentration of particles and their mass concentration on meadow and forest vegetation during the experimental period. Meteorological characteristics of the atmosphere (air temperature (T), pressure (P) and wind speed (U)) and turbulence characteristics (Monin–Obukhov scale (L), surface friction velocity (u*)) from high-frequency acoustic meteorological complexes AMK were used as input parameters. Particle deposition velocities (vdi) were calculated for each size range (di) using Equations (7)–(23). Particle flux density (FN), mass flux density (FM) for each fraction (PM0.2, PM0.2–10) were determined by the following equations:
where С1ni, С2nj are the counted concentrations of PM0.2 and PM0.2–10 particles, and С1mi, С2mj are the mass concentrations of PM0.2 and PM0.2–10 particles, respectively.
FNPM0.2 = ∑40i=1 (vdi × C1ni) FNPM0.2–10 = ∑11j=1 (vdi × C2ni)
FNPM0.2 = ∑40i=1 (vdi × C1mi) FNPM0.2–10 = ∑11j=1 (vdi × C2mi)
C1mi = pp × π/6 × d3pi × C1ni C2mi = pp × π/6 × d3pj × C2ni
The calculations have been performed based on the VBA (Visual Basic for Application) macro programming language for working with spreadsheets in Microsoft Excel.
For calculations of particle dry deposition rates and fluxes on meadow and forest vegetation we chose days with approximately the same meteorological conditions for situations with the presence of smoke aerosol (11 August 2021) and with conditions close to background after rainy weather, which contributed to atmospheric washout (22 August 2021, 26 August 2021). The input data for calculations of dry deposition of aerosol particles are presented in Table 1.

Table 1.
Input data for calculating the flux and rate of dry deposition of particles on the underlying surface (grassland, forest).
Under smog conditions (smoke from forest fires) calculations of particle velocity and dry deposition fluxes were performed for 11 August 2021 (00:00–08:00) in forest environment and 11 August 2021 (12:30–24:00) for meadow vegetation.
Figure 2 shows the results of calculation of daily variability of counted and mass concentration, deposition fluxes (mass concentration) of PM0.2 and PM0.2–10 particles on 11 August 2021 (forest) and (grasslands). As can be seen from Figure 2a,b, abnormally high concentrations of smoke aerosol were observed on this day. As can be seen from Figure 2, high concentrations of atmospheric particulate matter, especially PM0.2–10, are observed in smog conditions formed by large-scale forest fires.
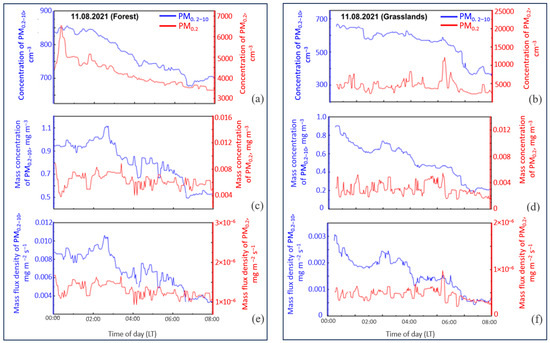
Figure 2.
Diurnal variations of concentration of PM0.2 and PM0.2–10 (a,b); mass concentration of particles of PM0.2 and PM0.2–10 (c,d); mass flux density of particles (e,f) on forest and grasslands vegetation, 11 August 2021.
Under conditions of smoke absence, calculations were made for the measurement 22 August 2021 and 26 August 2021.
Meteorological conditions have a significant effect on particle dispersion and deposition. In order to compare deposition velocities and fluxes of particles at different sites (grassland), (forest) days with synoptic and meteorological conditions close to each other were considered. Table 2 shows the average meteorological parameters for the measurement period of 22 August 2021 (grassland) and 26 August 2021 (forest).
Table 2.
Average meteorological parameters for calculating the flux and rate of dry deposition of particles on the underlying surface (22 August—grassland, 26 August—forest).
Figure 3 shows results of calculation of daily variability of counted and mass concentration, deposition flux density (mass concentration) of PM0.2 and PM0.2–10 particles for the observation period of 22 August 2021 (grasslands) and 26 August 2021 (forest). On the grasslands, the mass concentration of aerosol particles varies in a range from 1.2 × 10⁻³ mg m−3 to 17 × 10−3 mg m−3 for particles PM0.2–10 and in a range 1.1 × 10⁻⁴ mg m−3 to 9.1 × 10⁻⁴ mg m−3 for particles PM10 with average values of 8.7 × 10⁻³ mg m−3 and 4.1 × 10⁻⁴ mg m−3, respectively. In the forest, the mass concentration differs slightly from the mass concentrations in the grasslands and is equal, on average, to 7.9 × 10⁻³ mg m−3 for PM0.2–10 and 6.7 × 10⁻⁴ mg m−3 for PM10. It should be noted that the mass flux density of aerosol particles (Figure 3e,f) is almost 4.8 times higher under the forest canopy than in the meadow vegetation.
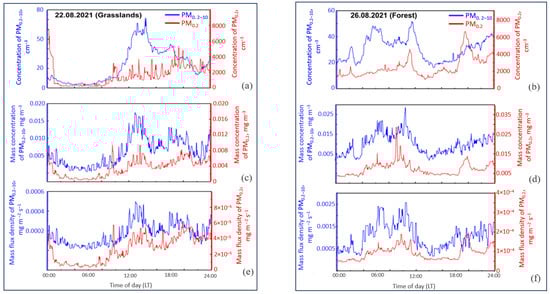
Figure 3.
Diurnal variations of concentration of PM0.2 and PM0.2–10 (a,b); mass concentration of particles of PM0.2 and PM0.2–10 (c,d); mass flux density of particles (e,f) on forest and grasslands vegetation, 22 August 2021 and 26 August 2021.
Friction velocity (u*), which depends on wind speed (V) and roughness parameters (z0, D), with equal wind speeds, is higher over the forest dome than over meadow vegetation and, accordingly, the rate of particle deposition in the forest is greater. In addition, the LAI, which characterizes the effective area of particle deposition, is also significantly higher in the tree canopy compared to the grassland vegetation. As an example, Figure 4 shows the calculated daytime particle deposition rates in the meadow vegetation (u* = 0.6 m s−1, L = −300 for period 14:00–18:00, 22 August 2021) and in the forest (u* = 0.8 m s−1, L = −400 for period 14:00–18:00, 26 August 2021) which indicate higher particle deposition rates in forest. Also, Figure 4 presents a comparison between our predicted deposition velocities (Vd) obtained from the proposed model and the experimental measurements reported in [12,30] for grassland and in [14,17,31] for forest, respectively. The model’s estimations of deposition velocities are plotted alongside the corresponding experimental data for aerosol particle deposition. This graphical representation allows for an assessment of the model’s performance in replicating the observed deposition velocities and provides insights into the model’s accuracy and agreement with experimental findings. Measured aerosol dry deposition velocities from the literature are represented as functions of particle size. Symbols represent the median values and the lines show predictions made by various models.
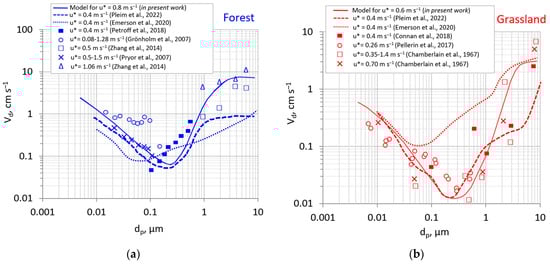
Figure 4.
A comparison between data experimental measurements reported in [14,17,40,41,42,43] for forest and in [12,30,40,41,44] for grassland, respectively with results of deposition velocity predictions, obtained in present work using the proposed model for friction velocities u* = 0.8 m s−1 (a) and 0.6 m s−1 (b).
The size-resolved measurements apply to particles with optical diameters between 5 nm and 10 μm, and are the first ones to be reported above a varying type of underlying surface in the Lake Baikal region. For aerosol particles in the size range 0.005–10 μm, the average value of deposition velocity means of Vd = 0.3 cm s−1 in the grassland and the forest Vd is equal to 1.1 cm s−1.
Deposition velocities are clearly influenced by turbulence, typically characterized by friction velocity (u*), with more turbulent conditions resulting in a stronger flux [14,31,45,46]. The type of land used also affects deposition velocity, with more complex ecosystems having greater surface area, containing more collectors and facilitating more deposition through interception. Consequently, deposition velocities over forests are typically higher than those over grasslands, which are in turn higher than those over lakes or smooth aquatic surfaces. For larger particle sizes (greater than 10 μm in diameter), gravitational settling becomes the dominant factor, causing deposition rates to converge regardless of surface structure.
Confirmation by experimental measurement of the relevance of these Vd parameters remains an issue given the differences that are always found in the literature. For example, the averaged deposition velocity (Vd) in the Yatir forest in southern Israel was 0.38 ± 0.45 cm s−1 for 0.25–0.28 μm particles, which is in agreement with the deposition velocities measured in mid and northern latitude coniferous forests, and is most heavily influenced by the atmospheric stability and turbulence conditions, and to a lesser degree by the particle size [41]. Above a temperate broadleaf forest in central Ontario, Canada by eddy-correlation method the median transfer velocity to size bins (68–292 nm) ranged from +0.13 to −0.27 cm s−1 [42]. For the forest measurement point in Boyarsky, the calculated averaged deposition velocity for the particle concentrations of PM0.2 and PM0.2–10 are equal to 0.29 mm s−1 and 5.38 mm s−1, respectively.
Figure 4b compares the models for grasslands [40,41,44] to measurements. Although there are many measurements for grasslands, there seems to be much less consensus among them, even within the same studies, compared to forests. Due to the degree of scatter in the measurements, there is no clear guidance for parameter selection. While the rationale for microscale impaction may also apply to grass, given that grass leaves often have hairs or trichomes and serrated edges, the measurement evidence is less clear. The large scatter among the reported measurements for grasslands is likely due to the variety of grass species, which can have very different characteristics, including length. For example, the measurements reported by Pellerin et al. (2017) were made in grassland in the range of 0.2–0.5 m tall, while Connan et al. (2018) used artificial grass.
The Pleim et al. model generally fits the Giardina et al. model (present work) very well for grassland and the forest. The Pleim et al. model is a modification of the current model in the Community Multiscale Air Quality (CMAQ) model. The key innovation is the addition of a second inertial impaction term for microscale obstacles such as leaf hairs, microscale ridges, and needleleaf edge effects.
The predictions reported in Figure 4, obtained by the Giardina model [11], provide good agreement with the experimental data. There have been limited recent measurements of aerosol flux and subsequent observations of Vd over vegetated areas. This scarcity of data primarily stems from the difficulties associated with acquiring accurate aerosol flux measurements.
Confirmation of the significance of these Vd parameters through experimental measurements remains a challenge due to the discrepancies that are consistently found in the literature.
In Table 3, we have compiled a comprehensive list of dry deposition particle measurements, which includes our studies report on the deposition velocities in the research station “Boyarsky”. In Table 3, detailed information is provided about the measurement size range, method of measurement, and the specific locations where the experimental data for deposition velocities were obtained. Table 3 is categorized based on general land types, such as grassland and forest. Each category includes relevant data for the deposition velocities measured in various environmental settings corresponding to the specified land types. These tabulated data facilitate a systematic comparison and analysis of deposition velocities across different land-use categories, contributing to a better understanding of aerosol particle deposition behavior in various natural environments. The predictions reported in Figure 4, obtained by the Giardina model [11], applied with Equations (7)–(23), respectively, provide good agreement with the experimental data. It was noted that, while in smoke-free conditions the differences between the mass concentrations of PM0.2 and PM0.2–10 were of no more than one order of magnitude, in smoke-exposed conditions the particle concentrations of PM0.2 and PM0.2–10 differ by two orders of magnitude or more, the depositional flux densities differ by three orders of magnitude or more. Concentrations of particulate matter in forests are higher than in open meadow vegetation and, correspondingly, the densities of particle deposition fluxes are also higher.
Table 3.
Size-resolved particle flux observations, separated by underlying surface (grasslands and forest), method, size range and typical deposition velocity.
4. Conclusions
This study contributed to our understanding of processes deposition of atmospheric particulate matter in terrestrial ecosystems in the Lake Baikal region. For the first time in this geographical region of Lake Baikal, we employed a diffusion aerosol spectrometer Model DAS 2702M to investigate the atmospheric aerosol. The new data of the temporal variations in aerosol distribution based on summer measurements in 2021 in the atmosphere of south-eastern coast of Lake Baikal at the Boyarsky station were received. To investigate the spatial and temporal peculiarities of aerosol admixtures transfer and distribution processes, in order to estimate particles deposition fluxes on the different underlying surface (grasslands and forest), high-altitude measuring sites were arranged in the forest massif and above the soil vegetation in the coastal zone of Lake Baikal: (1) mast measurements (30 m) above the meadow vegetation, (2) mast measurements (16 m) in the deciduous forest. Based on our experimental data and Giardina et al.’s model [11] we calculated the deposition flux density of atmospheric particulate matter (PM0.2 and PM0.2–10 particles) on the underlying surface with forest, meadow vegetation. We found that at relatively equal mass concentrations of particles, mass flux density is almost one order of magnitude higher under the forest canopy than in the meadow vegetation. We noticed that the friction velocity (u*), which depends on the wind speed (V) and roughness parameters (z0, D), with equal wind speeds, is higher over the forest dome than over meadow vegetation and, accordingly, the rate of particle deposition in the forest is greater. In addition, the leaf area index (LAI), which characterized the effective area of particle deposition, is also significantly higher in the tree canopy compared to the grassland vegetation.
Indeed, size-resolved particle flux data over natural surfaces are relatively scarce. However, understanding the process of dry deposition to the surface is of utmost importance since it strongly depends on particle size and significantly influences the mass and number distributions of atmospheric particles. Consequently, this has far-reaching environmental implications, including both direct and indirect climate forcing, impacts on human health, and visibility degradation, especially under conditions of elevated particle concentrations.
Considering the significant environmental consequences, there is a critical need for observational studies that can collect data to aid in the development of accurate dry deposition algorithms. Additionally, these studies can play a crucial role in evaluating mechanistic models concerning size-resolved number fluxes, especially concerning ultrafine particles. Improved understanding of size-dependent deposition patterns will enhance our ability to assess particle transport, deposition, and potential environmental effects, leading to more effective strategies for managing and mitigating the impact of atmospheric particles.
Author Contributions
Conceptualization, A.S.Z., G.S.Z. and T.S.B.; methodology, A.S.Z., G.S.Z. and T.S.B.; data curation, A.S.Z., A.L.D. and V.V.T.; software, V.V.T., T.S.B. and A.L.D.; investigation, A.S.Z., G.S.Z., T.S.B., A.L.D. and V.V.T.; resources, A.S.Z. and G.S.Z.; writing—original draft preparation, T.S.B., G.S.Z. and A.S.Z.; writing—review and editing, A.S.Z., G.S.Z. and V.V.T.; visualization, A.S.Z. and V.V.T.; supervision, G.S.Z. and A.S.Z.; project administration, G.S.Z. and A.S.Z.; funding acquisition, G.S.Z. and A.S.Z. All authors have read and agreed to the published version of the manuscript.
Funding
This research was funded by the Russian Science Foundation (RNF) within the framework of scientific project No. 19-77-20058-P and partially with the Ministry of Science and Higher Education of the Russian Federation (budget funds from the IPMS SB RAS within the framework of State Assignment No. 1023032300005-3-1.5.9) in terms of scientific equipment, analysis and calculations.
Institutional Review Board Statement
Not applicable.
Informed Consent Statement
Not applicable.
Data Availability Statement
The data presented in this study are available on request from the corresponding author. The data are not publicly available due to internal policy of IPMS SB RAS.
Conflicts of Interest
The authors declare no conflicts of interest.
References
- Zhang, L.; Gong, S.; Padro, J.; Barrie, L. A size-segregated particle dry deposition scheme for an atmospheric aerosol model. Atmos. Environ. 2001, 35, 549–560. [Google Scholar] [CrossRef]
- Slinn, S.A.; Slinn, W.G.N. Predictions for particle deposition on natural waters. Atmos. Environ. 1980, 14, 1013–1016. [Google Scholar] [CrossRef]
- Slinn, W.G.N. Predictions for particle deposition to vegetative surfaces. Atmos. Environ. 1982, 16, 1785–1794. [Google Scholar] [CrossRef]
- Zhang, L.; Brook, J.R.; Vet, R. A revised parameterization for gaseous dry deposition in air-quality models. Atmos. Chem. Phys. 2003, 3, 2067–2082. [Google Scholar] [CrossRef]
- Wesely, M.L.; Cook, D.R.; Hart, R.L.; Speer, R.E. Measurements and parametrization of article sulfur deposition over grass. J. Geophys. 1985, 90, 2131–2143. [Google Scholar] [CrossRef]
- Giorgi, F. A particle dry deposition parameterization scheme for use in tracer transport models. J. Geophys. Res. 1986, 91, 9794–9806. [Google Scholar] [CrossRef]
- Padro, J.; Hartog, G.; Neumann, H.H. An investigation of the ADOM dry deposition module using summertime O3 measurements above a deciduous forest. Atmos. Environ. 1991, 25, 1689–1704. [Google Scholar] [CrossRef]
- Erisman, J.W.; Van Pul, A.; Wyers, P. Parametrization of surface resistance for the quantification of mospheric deposition of acidifying pollutants and ozone. Atmos. Environ. 1994, 28, 2595–2607. [Google Scholar] [CrossRef]
- Wesely, M.L.; Doskey, P.V.; Shannon, J. Deposition Parameterizations for the Industrial Source Complex (ISC3) Model; Report to U.S. EPA; Argonne National Laboratory: Du Page County, IL, USA, 2001. [Google Scholar]
- Kor, P.; Kharrat, R. Modelling of asphaltene particle deposition from turbulent oil flow in tubing: Model validation and a parametric study. Petroleum 2016, 2, 393–398. [Google Scholar] [CrossRef]
- Giardina, M.; Buffa, P. A new approach for modelling dry deposition velocity of particles. Atmos. Environ. 2018, 180, 11–22. [Google Scholar] [CrossRef]
- Pellerin, G.; Maro, D.; Damay, P.; Gehin, E.; Connan, O.; Laguionie, P.; Hébert, D.; Solier, L.; Boulaud, D.; Lamaud, E.; et al. Aerosol particle dry deposition velocity above natural surfaces: Quantification according to the particles diameter. J. Aerosol Sci. 2017, 114, 107–117. [Google Scholar] [CrossRef]
- Hofken, K.D.; Gravenhorst, G. Deposition of atmospheric aerosol particles to beech- and spruce forest. In Deposition of Atmospheric Pollutants, 2nd ed.; Georgii, H.W., Pankrath, J., Eds.; D. Reidel Publishing Company: Oberursel/Taunus, Germany, 1982; pp. 191–194. [Google Scholar]
- Pryor, S.C.; Gallagher, M.; Sievering, H.; Larsen, S.E.; Barthelmie, R.J.; Birsan, F.; Nemitz, E.; Rinne, J.; Kulmala, M.; Gronholm, T.; et al. Review of measurement and modelling results of particle atmosphere–surface exchange. Tellus B Chem. Phys. Meteorol. 2007, 60, 42–75. [Google Scholar] [CrossRef]
- Pryor, S. Size-resolved particle deposition velocities of sub-100 nm diameter particles over a forest. Atmos. Environ. 2006, 40, 6192–6200. [Google Scholar] [CrossRef]
- Gallagher, M.W.; Nemitz, E.; Dorsey, J.R.; Fowler, D.; Sutton, M.A.; Flynn, M.; Duyzer, J. Measurements and parameterizations of small aerosol deposition velocities to grassland, arable crops, and forest: Influence of surface roughness length on deposition. J. Geophys. Res. 2002, 107, 287–292. [Google Scholar] [CrossRef]
- Zhang, J.; Shao, Y.; Huang, N. Measurements of dust deposition velocity in a wind tunnel experiment. Atmos. Chem. Phys. 2014, 14, 8869–8882. [Google Scholar] [CrossRef]
- Frazer, G.W.; Canham, C.D.; Lertzman, K.P. Gap Light Analyzer (GLA), Version 2.0: Imaging Software to Extract Canopy Structure and Gap Light Transmission Indices from True-Colour Fisheye Photographs, User’s Manual and Program Documentation; Simon Fraser University: Burnaby, BC, Canada; Institute of Ecosystem Studies: Millbrook, NY, USA, 1999. [Google Scholar]
- Mason, E.G.; Diepstraten, M.; Pinjuv, G.L.; Lasserre, J.P. Comparison of direct and indirect leaf area index measurements of Pinus radiata D. Don. Agric. For. Meteorol. 2012, 166–167, 113–119. [Google Scholar] [CrossRef]
- Julanov, Y.V.; Lushnikov, A.A.; Zagaynov, V.A. Diffusion aerosol spectrometer. Atmos. Res. 2002, 62, 295–302. [Google Scholar] [CrossRef]
- Tikhomirov, A.A. Ultrasonic anemometers and thermometers for measuring fluctuations of air flux velocity and temperature. Review. Opt. Atmos. Okeana Pap. 2010, 7, 585–600. (In Russian) [Google Scholar]
- Seinfeld, J.H.; Pandis, S.N. Atmospheric Chemistry and Physics, 2nd ed.; John Wiley & Sons, Inc. Shapiro: New York, NY, USA, 1998; pp. 154–196. [Google Scholar]
- Venkatram, A.; Pleim, J. The electrical analogy does not apply to modelling dry deposition of particles. Atmos. Environ. 1999, 33, 3075–3076. [Google Scholar] [CrossRef]
- Csanady, G.T. Turbulent Diffusion in the Environment, 3rd ed.; D. Reidel Publisher: Dordrecht, The Netherlands, 1974. [Google Scholar]
- Wesely, M.L.; Hicks, B.B. Some factors that affect the deposition rates of sulfur dioxide and similar gases to vegetation. J. Air Polka. Control Ass. 1977, 27, 1110–1116. [Google Scholar] [CrossRef]
- Peters, K.; Eiden, R. Modelling the dry deposition velocity of aerosol particles to a spruce forest. Atmos. Environ. 1992, 26A, 2555–2564. [Google Scholar] [CrossRef]
- Pryor, S.C.; Barthelmie, R.J.; Spaulding, A.M.; Larsen, S.E.; Petroff, A. Size-resolved fluxes of sub-100-nm particles over forests. J. Geophys. Res. 2009, 114, D18. [Google Scholar] [CrossRef]
- Kumar, R.; Kumari, K.M. Experimental and parameterization method for evaluation of dry Deposition of S Compounds to natural surfaces. Atmos. Clim. Sci. 2012, 2, 492–500. [Google Scholar] [CrossRef]
- Liu, B.Y.H.; Agarwal, J.K. Experimental observation of aerosol deposition in turbulent flow. J. Aerosol Sci. 1974, 5, 145–155. [Google Scholar] [CrossRef]
- Chamberlain, A.C. Transport of Lycopodium Spores and Other Small Particles to Rough Surfaces. Proc. R. Soc. London. Ser. A Math. Phys. Sci. 1967, 296, 45–70. [Google Scholar]
- Bottalico, F.; Chirici, G.; Giannetti, F.; De Marco, A.; Nocentini, S.; Paoletti, E.; Salbitano, F.; Sanesi, G.; Serenelli, C.; Travaglini, D. Air pollution removal by green infrastructures and urban forests in the city of Florence. Agric. Sci. Procedia 2016, 8, 243–251. [Google Scholar] [CrossRef]
- Tiwari, A.; Kumar, P.; Baldauf, R.; Zhang, K.M.; Pilla, F.; Di Sabatino, S.; Brattich, E.; Pulvirenti, B. Considerations for evaluating green infrastructure impacts in microscale and macroscale air pollution dispersion models. Sci. Total Environ. 2019, 672, 410–426. [Google Scholar] [CrossRef] [PubMed]
- Huffman, J.A.; Prenni, A.J.; Demott, P.J.; Pöhlker, C.; Mason, R.H.; Robinson, N.H.; Fröhlich-Nowoisky, J.; Tobo, Y.; Després, V.R.; Garcia, E.; et al. High concentrations of biological aerosol particles and ice nuclei during and after rain. Atmos. Chem. Phys. 2013, 13, 6151–6164. [Google Scholar] [CrossRef]
- Jeanjean, A.; Buccolieri, R.; Eddy, J.; Monks, P.; Leigh, R. Air quality affected by trees in real street canyons: The case of Marylebone neighbourhood in central London. Urban Green 2017, 22, 41–53. [Google Scholar] [CrossRef]
- Kim, J.J.; Hann, T.; Lee, S.J. Effect of flow and humidity on indoor deposition of particulate matter. Environ. Pollut. 2019, 255, 113263. [Google Scholar] [CrossRef]
- Montgomery, J.F.; Rogak, S.N.; Green, S.I.; You, Y.; Bertram, A.K. Structural Change of Aerosol Particle Aggregates with Exposure to Elevated Relative Humidity. Environ. Sci. Technol. 2015, 49, 12054–12061. [Google Scholar] [CrossRef]
- Ryu, J.; Kim, J.J.; Byeon, H.; Go, T.; Lee, S.J. Removal of fine particulate matter (PM2.5) via atmospheric humidity caused by evapotranspiration. Environ. Pollut. 2019, 245, 253–259. [Google Scholar] [CrossRef] [PubMed]
- Shahid, M.; Dumat, C.; Khalid, S.; Schreck, E.; Xiong, T.; Niazi, N. Foliar heavy metal uptake, toxicity and detoxification in plants: A comparison of foliar and root metal uptake. J. Hazard. Mater. 2016, 325, 36–58. [Google Scholar] [CrossRef] [PubMed]
- Zhou, S.; Cong, L.; Liu, Y.; Xie, L.; Zhao, S.; Zhang, Z. Rainfall intensity plays an important role in the removal of PM from the leaf surfaces. Ecol. Indic. 2021, 128, 107778. [Google Scholar] [CrossRef]
- Pleim, J.E.; Ran, L.; Saylor, R.D.; Willison, J.; Binkowski, F.S. A new aerosol dry deposition model for air quality and climate modeling. J. Adv. Model. Earth Syst. 2022, 14, e2022MS003050. [Google Scholar] [CrossRef]
- Emerson, E.W.; Katich, J.M.; Schwarz, J.P.; McMeeking, G.R.; Farmer, D.K. Direct measurements of dry and wet deposition of black carbon over a grassland. J. Geophys. Res. Atmos. 2018, 123, 12277–12290. [Google Scholar] [CrossRef]
- Petroff, A.; Murphy, J.G.; Thomas, S.C.; Geddes, J.A. Size-resolved aerosol fluxes above a temperate broadleaf forest. Atmos. Environ. 2018, 190, 359–375. [Google Scholar] [CrossRef]
- Grönholm, T.; Aalto, P.P.; Hiltunen, V.; Rannik, U.; Rinne, J.; Laakso, L.; HyvöNen, S.; Vesala, I.; Kulmala, M. Measurements of aerosol particle dry deposition velocities using relaxed eddy accumulation technique. Tellus 2007, 59, 381–386. [Google Scholar] [CrossRef]
- Connan, O.; Pellerin, G.; Maro, D.; Damay, P.; Hébert, D. Dry deposition velocities of particles on grass: Field experimental data and comparison with models. J. Aerosol Sci. 2018, 126, 58–67. [Google Scholar] [CrossRef]
- Ahlm, L.; Krejci, R.; Nilsson, E.D.; Martensson, E.M.; Vogt, M.; Artaxo, P. Emission and dry deposition of accumulation mode particles in the Amazon Basin. Atmos. Chem. Phys. 2010, 10, 10237–10253. [Google Scholar] [CrossRef]
- Vong, R.J.; Vong, I.J.; Vickers, D.; Covert, D.S. Size-dependent aerosol deposition velocities during BEARPEX’07. Atmos. Chem. Phys. 2010, 10, 5749–5758. [Google Scholar] [CrossRef]
- Clough, W. The deposition of particles on moss and grass surfaces. Atmos. Environ. 1975, 9, 1113–1119. [Google Scholar] [CrossRef]
- Garland, J.; Cox, L. Deposition of small particles to grass. Atmos. Environ. 1982, 16, 2699–2702. [Google Scholar] [CrossRef]
- Dollard, G.; Unsworth, M. Field measurements of turbulent fluxes of wind-driven fog drops to a grass surface. Atmos. Environ. 1983, 17, 775–780. [Google Scholar] [CrossRef]
- Katen, P.C.; Hubbe, J.M. An evaluation of optical particle counter measurements of the dry deposition of atmospheric aerosol particles. J. Geophys. Res. Atmos. 1985, 90, 2145–2160. [Google Scholar] [CrossRef]
- Hicks, B.; Wesely, M.; Coulter, R.; Hart, R.; Durham, J. An experimental study of sulfur and NOX fluxes over grassland. Bound. Layer Meteorol. 1986, 34, 103–121. [Google Scholar] [CrossRef]
- Gallagher, M.; Choularton, T.; Morse, A.; Fowler, D. Measurements of the size dependence of cloud droplet deposition at a hill site. Q. J. R. Meteorol. Soc. 1988, 114, 1291–1303. [Google Scholar] [CrossRef]
- Fowler, D.; Morse, A.; Gallagher, M.; Choularton, T. Measurements of cloud water deposition on vegetation using a lysimeter and a flux gradient technique. Tellus B Chem. Phys. Meteorol. 1990, 42, 285–293. [Google Scholar] [CrossRef]
- Allen, A.; Harrison, R.; Nicholson, K. Dry deposition of fine aerosol to a short grass surface. Atmos. Environ. A 1991, 25, 2671–2676. [Google Scholar] [CrossRef]
- Nemitz, E.; Gallagher, M.W.; Duyzer, J.H.; Fowler, D. Micrometeorological measurements of particle deposition velocities to moorland vegetation. Q. J. R. Meteorol. Soc. 2002, 128, 2281–2300. [Google Scholar] [CrossRef]
- Vong, R.J.; Vickers, D.; Covert, D.S. Eddy correlation measurements of aerosol deposition to grass. Tellus B Chem. Phys. Meteorol. 2004, 56, 105–117. [Google Scholar] [CrossRef]
- Waraghai, A.; Gravenhorst, G. Dry deposition of atmospheric particles to an old spruce stand. In Proceedings of the Meeting on Mechanisms and Effects of Pollutant-Transfer into Forests, Oberursel, Germany, 24–25 November 1988. [Google Scholar]
- Lorenz, R.; Murphy, C. Dry deposition of particles to a pine plantation. Bound. Layer Meteorol. 1989, 46, 355–366. [Google Scholar] [CrossRef]
- Gallagher, M.; Beswick, K.; Duyzer, J.; Westrate, H.; Choularton, T.; Hummelshøj, P. Measurements of aerosol fluxes to Speulder forest using a micrometeorological technique. Atmos. Environ. 1997, 31, 359–373. [Google Scholar] [CrossRef]
- Buzorius, G.; Rannik, U.; Makela, J.M.; Vesala, T.; Kulmala, M. Vertical aerosol particle fluxes measured by eddy covariance technique using condensational particle counter. J. Aerosol Sci. 1998, 29, 157–171. [Google Scholar] [CrossRef]
- Gaman, A.; Rannik, Ü.; Aalto, P.; Pohja, T.; Siivola, E. Relaxed eddy accumulation system for size-resolved aerosol particle flux measurements. J. Atmos. Ocean. Technol. 2004, 21, 933–943. [Google Scholar] [CrossRef]
- Gordon, M.; Staebler, R.M.; Liggio, J.; Vlasenko, A.; Li, S.M.; Hayden, K. Aerosol flux measurements above a mixed forest at Borden, Ontario. Atmos. Chem. Phys. 2011, 11, 6773–6786. [Google Scholar] [CrossRef]
- Mammarella, I.; Rannik, Ü.; Aalto, P.; Keronen, P.; Vesala, T.; Kulmala, M. Long-term aerosol particle flux observations. Part II: Particle size statistics and deposition velocities. Atmos. Environ. 2011, 45, 3794–3805. [Google Scholar] [CrossRef]
- Lavi, A.; Farmer, D.K.; Segre, E.; Moise, T.; Rotenberg, E. Fluxes of fine particles over a semi-arid pine forest: Possible effects of a complex terrain. Aerosol Sci. Technol. 2013, 47, 906–915. [Google Scholar] [CrossRef][Green Version]


Disclaimer/Publisher’s Note: The statements, opinions and data contained in all publications are solely those of the individual author(s) and contributor(s) and not of MDPI and/or the editor(s). MDPI and/or the editor(s) disclaim responsibility for any injury to people or property resulting from any ideas, methods, instructions or products referred to in the content. |
© 2024 by the authors. Licensee MDPI, Basel, Switzerland. This article is an open access article distributed under the terms and conditions of the Creative Commons Attribution (CC BY) license (https://creativecommons.org/licenses/by/4.0/).