1. Introduction
It is widely accepted that the design rainfall, which is employed for the design of stormwater management infrastructure, is tremendously influenced by climate change. The influence of global climate change on the changing intensity, frequency, and duration of extreme rainfall, including the hydrologic cycle, has been reported by many researchers [
1,
2,
3,
4]. Climate change is expected to have profound impacts on natural phenomena, e.g., increased floods, erosions, landslides, and health impacts [
5]. Damage to property, including loss of life, is significantly impacted by these increased natural hazards [
6,
7]. Therefore, it is essentially important to have a proper understanding of the influence of climate change on design rainfall, which is conventionally used to design flood mitigation structures.
Design rainfalls are traditionally determined from the intensity–frequency–duration (IFD) curve or table. IFD, which is also called intensity–duration–frequency (IDF), usually determines the relationship between extreme rainfall intensity, frequency, and duration. The conventional IDF curve is derived on the basis of historical extreme rainfall data under the stationarity assumption. The IDF curve is used to characterize drought by a few researchers [
8]. However, rainfall is considered a complex atmospheric global phenomenon, and it has the potential to change over time due to changes in the atmospheric components [
9]. As a result, the IDF relationship will change over time due to climate change and variability. Consequently, the adequacy of stormwater management infrastructure, which is constructed to reduce flood effects, will be significantly impacted by the changes in design rainfall [
10,
11,
12,
13].
Historical annual extreme rainfall is typically used to characterize the future extreme rainfall for different recurrence intervals under the assumption of stationarity [
2]. As climate change has profound impacts on the frequency, duration, and magnitude of extreme rainfall, the stationary assumption has the potential to misinterpret future conditions [
14]. Kourtis and Tsihrintzis [
15] and Fowler et al. [
16] also noted that stormwater management infrastructure designed based on historical extreme rainfall will be inadequate to convey the excessive runoff caused by climate change. Consequently, urban drainage systems may fail posing threats to infrastructure and properties including the environment [
17]. Recent trends in extreme rainfall in Australia suggested the fact that there will be changes in future extreme rainfall [
18,
19,
20].
In addition to climate change impacts on rainfall (and design rainfall), Australian rainfall is extremely manipulated by several climate drivers including El-Nino Southern Oscillation (ENSO), Indian Ocean Dipole (IOD), and Southern Annual Mode (SAM) [
21,
22,
23,
24]. Due to the natural variability and changes in the large-scale climatic modes from excessive greenhouse gas emissions, rainfall in the southeast area of Australia has decreased over the last 20 years [
25]. In most parts of NSW, there has been a 12% reduction in rainfall since the late 1990s. Although the intensity of short-duration extreme rainfall increased in the north, the drivers of heavy rainfall declined in the south [
25]. As a result, declined streamflow has been observed in three quarters of the gauge stations in NSW since 1975. Winter and spring rainfall, including surface runoff and streamflow, is projected to decrease significantly in most parts of NSW due to climate change [
26]. Therefore, traditional approaches to drainage design systems impose additional capital and maintenance costs [
27].
The influence of climate change impacts on design rainfall has been examined in many parts of the world. For example, Martel et al. [
28] found that there will be increased extreme rainfall all over the world. Bibi and Tekesa [
9] and Bulti et al. [
11] investigated the influences of climate change on the IDF curve development in Ethiopia and observed that urban flooding will increase due to climate change. In the same region, Meresa et al. [
29] showed that there is potential to increase streamflow by 50% due to climate change. Climate change has the capability to influence design rainfall in the USA by up to 300% [
10]. Hajani [
30] demonstrated that a non-stationary analysis of climate change has better potential to derive the IDF in NSW, Australia. Yazdanfar and Sharma [
27] and Hajani [
30] recognized the importance of considering climate change influences in design rainfall estimation for drainage design.
In Australia, the national guideline of the Australian Bureau of Meteorology (BoM) provides design rainfalls to design flood mitigation structures. However, climate change impacts on design rainfall estimation have not been implemented yet [
31]. Therefore, stormwater management infrastructure designed considering the historical rainfall has the potential to be inefficient, under/over-designed, and uncertain. A few researchers have attempted to develop design rainfall from the projected data in Australia. For example, ref. [
32] developed derived rainfall using the projected rainfall and found 9% to 41% increase in the future design rainfall. A decrease in frequent flooding for the projected rainfall was observed by Wasko et al. [
33]. Nevertheless, the alteration of design rainfall and its estimation due to climate change remains challenging.
The main aim of this research is to identify the impacts of climate change on the probability of the occurrence of extreme rainfall for different recurrence intervals in NSW, Australia. More specifically, the estimation of design rainfalls from the projected extreme rainfall data and their comparison with the current Australian standard is the prime focus of this study. This paper has the potential to contribute to a better understanding of climate change’s influence on design rainfalls, which are essential for the design and construction of new stormwater infrastructure, and the management of existing infrastructure. An improved understanding of climate change impacts on design rainfall has the potential to reduce flood risks and economic losses. This study helps to strengthen the current knowledge regarding the derivation of design rainfall and the future re-development of the IDF table/curve incorporating climate change impacts.
2. Study Area
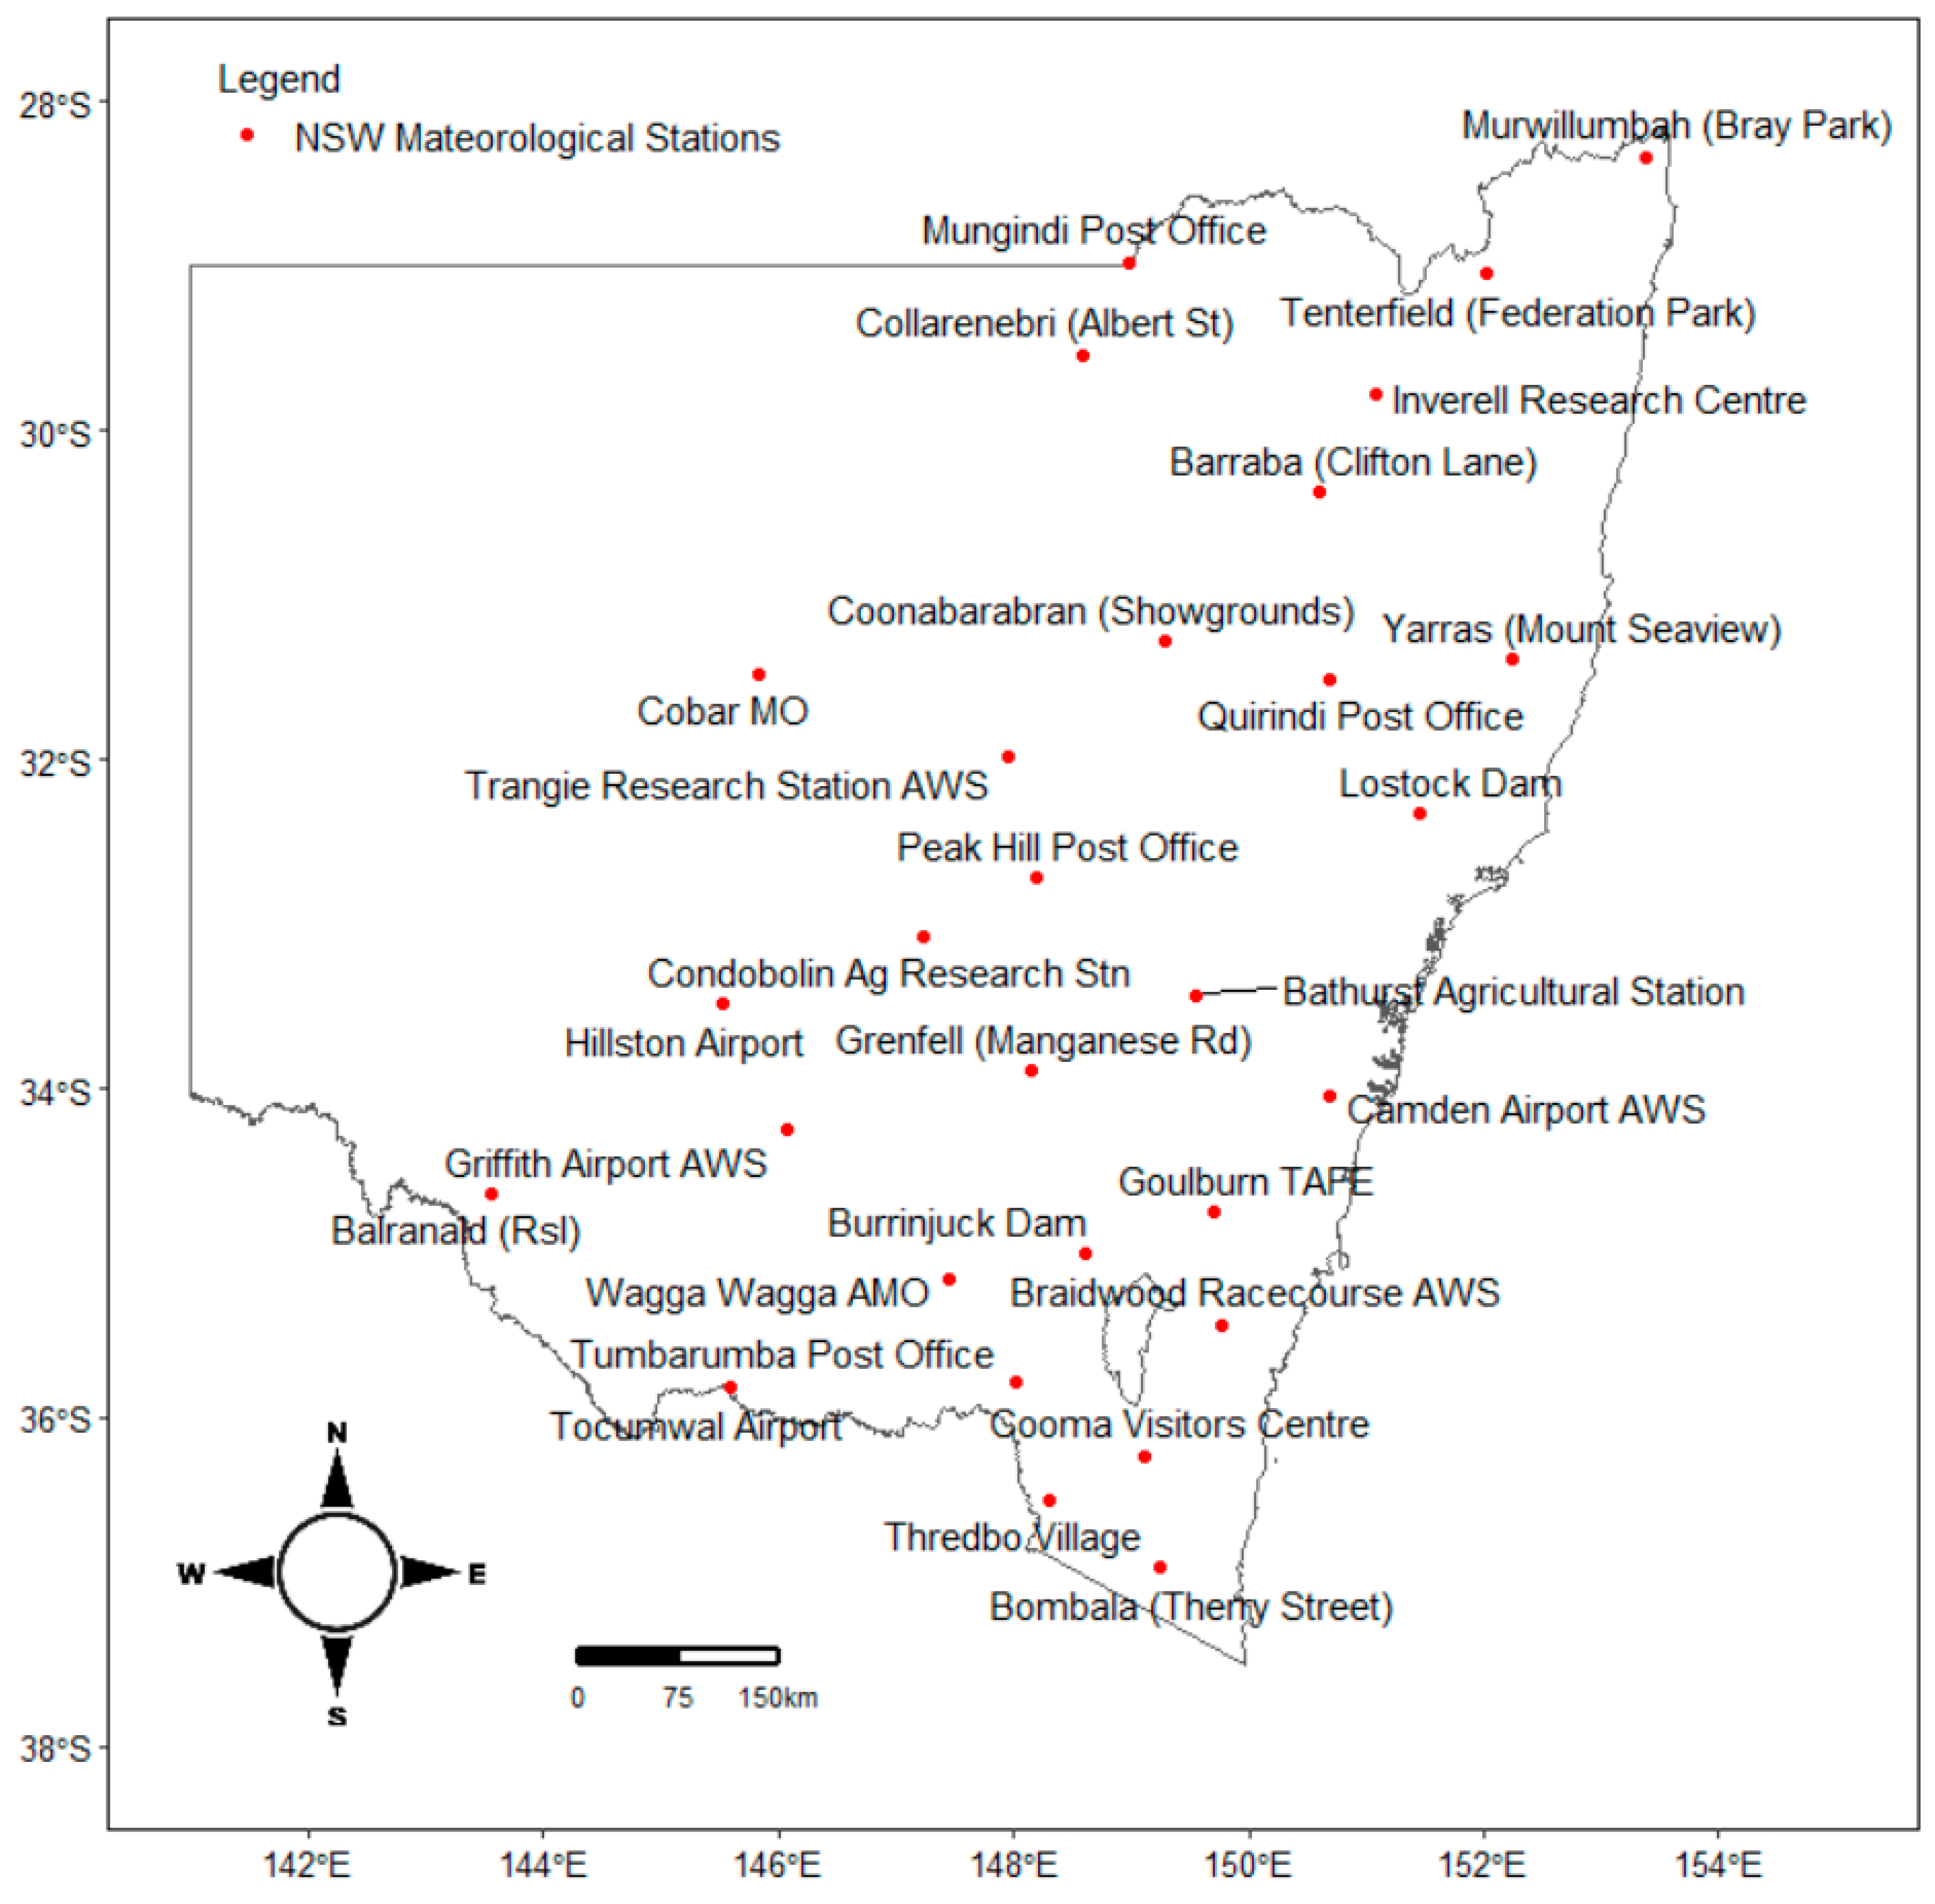
This study is conducted in NSW, Australia. The NSW state is located on the eastern coast of Australia, facing the southwesterly seas of the Pacific Ocean. The GPS coordinates of NSW are 31°50′24.388″ S and 145°36′46.0548″ E. The southern, western, and northern parts of the state are surrounded by land masses, whereas the eastern part of the state overlooks the Sea of Tasmania and the Coral Sea. The state is about 810,000 square kilometers, consisting of residential, industrial, and commercial areas including green and open spaces. The topographic elevation of the state ranges from 1000 m to 2229 m.
The recorded minimum temperature of the state was observed as −23 °C in winter (June), whilst the recorded extreme temperature was noted as 49.7 °C in summer (December). The average maximum and minimum annual rainfall in NSW were between 150 mm and 500 mm, respectively. The highest recorded daily rainfall was observed at 415.2 mm for the study period (1900–2019).
Rainfall Data
Two sets of daily rainfall data (historical rainfall data and future project rainfall data) were collected and applied to fulfill the objectives of this research. Historical daily rainfall data from 1900 to 2019 from 29 meteorological stations were obtained from the SILO database (
https://www.longpaddock.qld.gov.au/silo/, accessed on 1 August 2020). The SILO obtains data from the Australian BoM, which is the executive agency of the Australian government and provides weather service nationwide. A missing value in the SILO data is automatically filled using the interpolation technique.
Table 1 shows the list of the rainfall stations used in this study.
Table 1 shows that the average extreme rainfall across NSW varies from 37.71 mm to 147.3 mm. The geography and climatic pattern of the state have the potential to have a much higher variation in extreme rainfall. The standard deviation of extreme rainfall fluctuates from 16.35 to 67.68, indicating that extreme rainfall varies significantly across the state, as shown in
Table 1.
These stations, which have recorded long-term historical data and are well-spread across the state, were selected for the analysis. The spatial distribution of the selected stations is shown in
Figure 1.
The evaluation of climate change impacts on the designed rainfall depends on the accuracy of the climate model [
34,
35]. Three criteria (availability of long-term projected data, spatially fine resolution of projected data, and authenticity of modeling outcomes applying statistical techniques) are suggested by Smith et al. [
36] in the selection of the Global Climate Model (GCM). Future (projected) daily rainfall data for this research were obtained from the NSW climate data portal (
https://climatedata-beta.environment.nsw.gov.au/, accessed on 1 August 2020). The projected data in the portal apply to the NSW and Australian Regional Climate Modeling (NARCLiM) projections [
37]. NARCLiM is the NSW government-led project for generating detailed climate projections, where internationally recognized techniques are adopted. Although many governments and research organizations provide data for climate projections derived from the GCM, only a few of them are easily accessible and tailored to support regional decision-making. NARCliM is one of the sources of climate projections that provide the most comprehensive and reliable data reliable southeastern Australia, including NSW. Since the projection of the NARCLiM follows the international best practice process for downscaling future data, precipitation data from NARCLiM was collected and applied in this research.
Although NARCliM is capable of generating climatic projection outputs from four separate GCM outputs, bias-corrected daily data from CSIRO ACCESS 3.0 were used in this research. It is worth noting that NARCliM adopts the dynamic downscaling method to generate high-resolution climatic projections. This process helps in capturing regional climatic attributes more precisely and supports the evaluation of localized climate impacts. The spatial resolution of the data set was 10 km.
3. Methods
The probability of the occurrence of daily extreme rainfall for different recurrence intervals has been evaluated in this research. To fulfill the objectives of this research, daily extreme rainfall for the period of 2020 to 2099 is used to derive the daily design rainfall for different recurrence intervals and compared with the current Australian BoM estimates. The overall process applied in this research involves (i) processing the observed rainfall data, (ii) processing the projected rainfall data, (iii) a frequency analysis of the extreme rainfall data, and (iv) a comparison of the outcomes with the current guideline. A graphical representation of the methodological framework is shown in
Figure 2.
Project rainfall data obtained from NARCliM are limited to daily time steps. Therefore, it is required to derive the extreme rainfall from the daily time-series data sets. There are two frequently applied techniques (block maxima approach and peak over threshold or POT approach) to extract the extreme value [
2,
38]. In hydrological applications, the most common technique for extreme data extraction is the block maxima approach, where the maximum value over a period (usually one year) is obtained. On the other hand, all maximum values over a threshold are obtained in the POT approach. The selection of an appropriate threshold value is the most challenging task in the POT technique. Furthermore, too low a threshold violates the assumption of independency in the data sets, and too high a threshold leads the data sets to have high variance, which has the potential to increase uncertainty [
39]. Due to the simplicity and common application in hydrology, the block maxima approach has been adopted in this research to obtain extreme rainfall data sets. In this research, the duration of a calendar year is considered as the block length. The extreme rainfall from the daily records is extracted from each block for further analysis. The extreme is obtained from both the historical and projected rainfall separately.
The probability of the occurrence of severe events is conventionally determined by applying a frequency analysis. To depict the entire spatial and temporal pattern of extreme events, only one or two statistical distributions is not sufficient. Therefore, numerous distributions are examined by hydrologists in different parts of the world [
40]. Although there are different theoretical distributions to fit the extreme data series, the generalized extreme value distribution (GEVD) is the most applied technique in rainfall frequency analysis [
2,
41]. The GEVD is the collective of three statistical distributions that are commonly applied for flood hazard analysis. Rainfall IDF curves/tables are generally used for determining the design rainfall for different recurrence intervals using the GEVD. In this study, the GEVD is adopted for estimating the rainfall depth for standard recurrence intervals.
The GEVD is fitted to the extreme data sets extracted from historical (1900 to 2019) and projected (2020 to 2099) extreme rainfall in NSW, Australia. The three parameters of the GEVD can be expressed according to the probability density function, as shown in Equation (1):
where
,
are defined as the location, scale, and shape parameters, respectively, for the GEVD.
The estimation of the GEVD parameters can be determined by applying numerous techniques. However, the L-moments method is the recommended approach in determining the hydrological extremes [
42,
43,
44,
45]. Therefore, the L-moments method is adopted in this study.
where
is the rainfall depth for a
-year return period, and
, where
p is the non-exceedance probability.
The performance of the analysis is assessed and compared with the Australian Rainfall and Runoff (ARR), which is the national guideline to select design rainfall in Australia. The graphical comparison and percentage change in the daily design rainfall from the ARR are reviewed for the standard recurrence intervals. The evaluation is performed for each of the meteorological locations.
4. Results and Discussion
The main objective of this research was the evaluation of climate change influences on design rainfalls. To achieve the main aim, statistics of extreme rainfall were determined for historical and projected extreme rainfalls.
Table 2 shows the statistics of the extreme rainfall for the selected stations in NSW, Australia.
In comparing with the historical extreme rainfall, the GCM underestimates the extreme rainfall for most of the meteorological stations, as shown in
Table 2. For some stations, the variation is much higher. As such, the observed extreme rainfall at station #60085 is 415.20 mm; however, the projected rainfall for the same station was obtained as 240.75 mm, as evidenced in
Table 2. This argument is valid for the majority of the meteorological stations in NSW. The outcomes of this study oppose the claim made by Feng et al. [
46], who discovered that global daily extreme precipitation will increase by 50%. However, their study adopted extreme rainfall from the CMPI6 model. The overall accuracy of extreme data sets was tested by using the coefficient of variation (CV). It is apparent from
Table 2 that the CV for the extreme data of projected rainfall is lower than that of the historical extreme rainfall for most of the chosen stations. Therefore, the variability of the extreme data from the mean values is relatively low for the projected rainfall. This may be one of the reasons for having a lower extreme value for the projected rainfall.
Table 3 shows the three linear moments of the extreme data sets. As shown in the table, the variances of the extreme data sets are too high, indicating higher variability of both historical and projected extreme rainfall. The skewness of the extreme data sets shows that the distribution of data is not symmetrical; rather, they are highly skewed. Obviously, the distributions of the data are more peaked than the normal distribution, as demonstrated by the high kurtosis values both for the historical and projected extreme rainfall.
The derivation of design rainfall using the GEVD requires the identification of its three parameters (location, scale, and shape). The Australian BoM also adopted this technique for the estimation of the GEVD parameters for design rainfall investigation. Accordingly, the L-moments parameter estimation technique has been applied in this research.
Table 4 shows the estimated GEVD parameters for the selected stations.
As shown in
Table 4, the shape parameter of the GEVD is either zero or positive for the historical rainfall. This indicates that historical extreme rainfall follows either the Fréchet (when the shape parameter is positive) distribution or the Gumbel (when the shape parameter is zero) distribution. A similar observation is found for the projected rainfall. However, the negative shape parameter is found for four stations, where the GEVD is the Weibull type. However, there is no consistency to follow the distribution type between the historical and projected extreme rainfall. For example, Station #48027 follows the Fréchet type distribution for the historical data, whereas it follows the Gumbel distribution for the projected rainfall, as evidenced in
Table 4. This variation may arise from the potential climate change variables used in the projected rainfall estimation.
A comparison of the return level estimations between the projected and historical extremes is presented in
Table 5. The evaluation is performed for 2-year, 5-year, 10-year, 20-year, 50-year, and 100-year return periods for 24 h-duration rainfall depths. Obviously, the design rainfall increases with the increased return periods. For example, the 2-year design rainfall for station #50031 is 51.9 mm, whereas the 100-year design rainfall for the same station is 137.1 mm. However, the magnitude of the design rainfall for a particular recurrence interval varies across NSW. Nevertheless, there are significant variations in the design rainfall developed using the historical rainfall (1900–2019) and projected rainfall (2020–2099), as evidenced in
Table 5. As such, the 100-year design rainfall for station #48027 is 110.3 mm when developed using the historical rainfall. For the same rainfall station, the design rainfall is 131.0 mm when derived using the projected rainfall. The 100-year design rainfall derived from the historical rainfall ranges from 91.1 mm to 371.4 mm. For the same return period, the design rainfall estimated from the projected rainfall is between 58.1 mm and 217.7 mm.
The probability of the occurrence of the design rainfall based on the projected rainfall is lower than that of the historical rainfall for most of the stations. For some meteorological stations, a significant difference is discovered between the design rainfalls derived from the projected rainfall and historical rainfall. Differences in the climatic parameters between historical and projected rainfall formulation have profound impacts to produce such variation. In addition, spatial location, proximity to mountains or the ocean, atmospheric circulation, prevailing wind direction, topographic and orographic effects, urbanization, etc. have the potential to influence extreme rainfall significantly. The estimation of the design rainfall in this research from historical data does not consider the future climate change scenarios. Emission scenarios and the associated climate change impacts are considered in determining the projected rainfall.
The outcomes of this study are aligned with the existing literature where the projected rainfall from the GCM produces different rainfall depths and intensities [
47,
48]. However, higher rainfall depths and intensities were also observed by Simonovic and Peck [
49] from the extreme value of projected rainfall compared with the historical data. Therefore, climate change impacts significantly influence design rainfall, which is the essential element for the design of stormwater management infrastructure. Consequently, these impacts should be considered in the derivation of design rainfall in NSW. The difference in the data length may be attributed to the variation between the historical and projected rainfall [
40,
43,
44]. In this research, historical data are collected for 119 years, whereas the projected rainfall data are collected for 80 years.
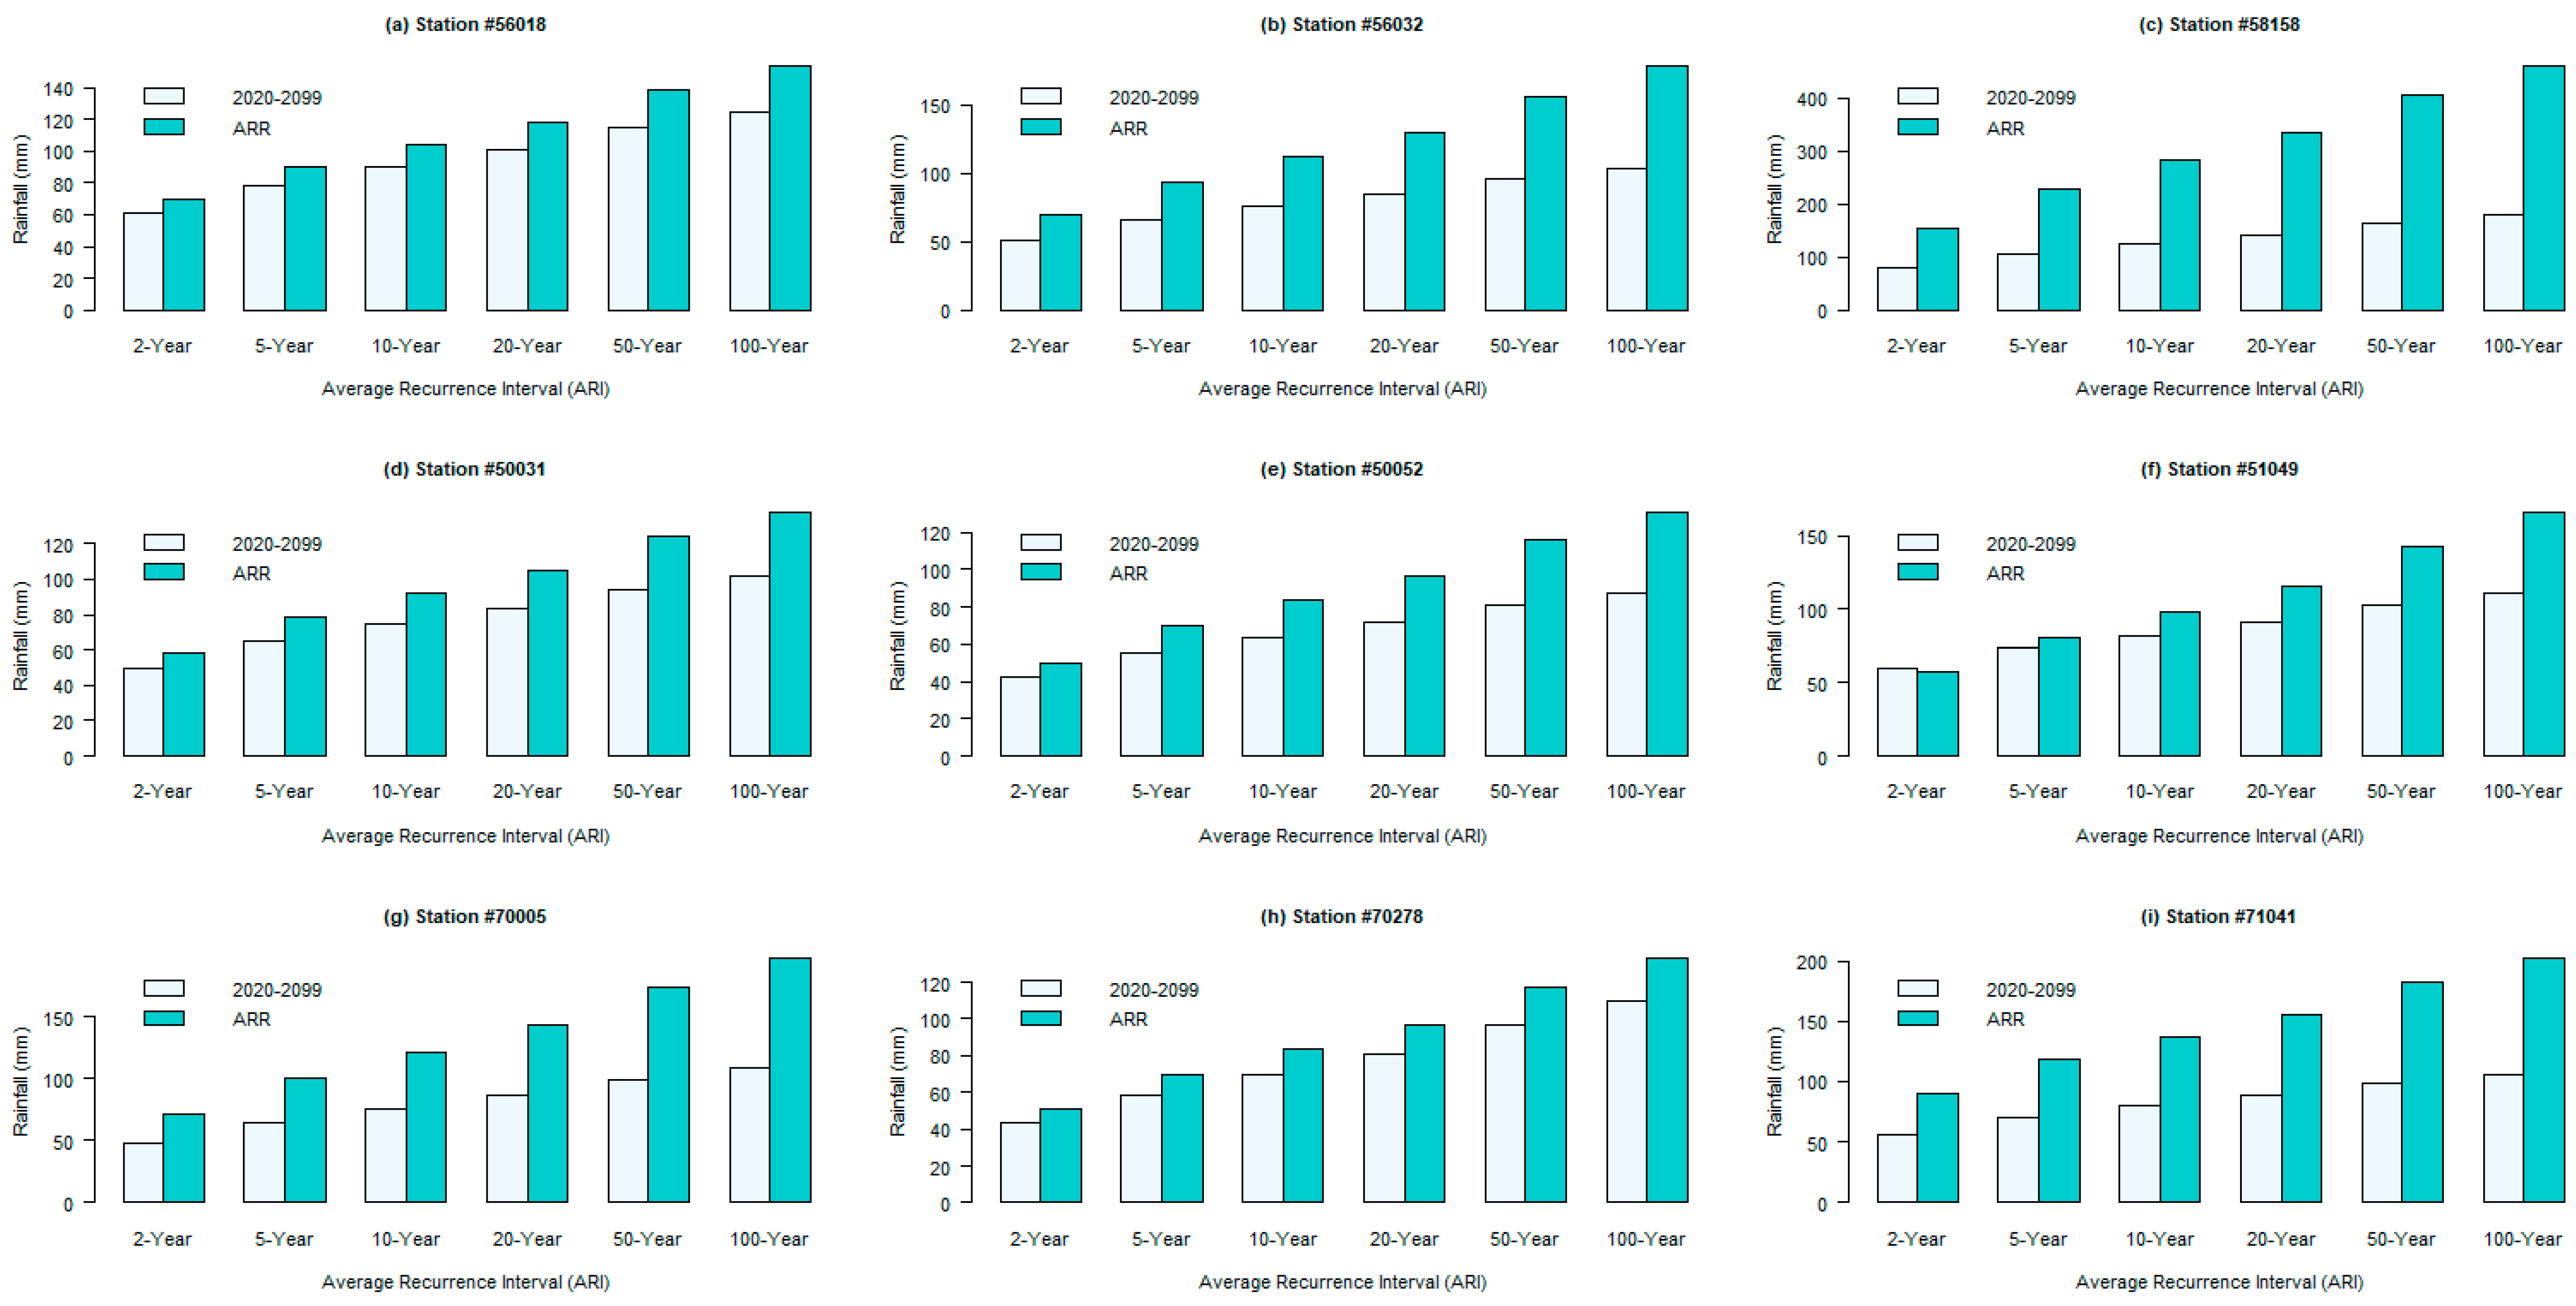
A graphical representation of the investigation of climate change impacts on design rainfall is shown in
Figure 3. The comparison is illustrated between the design rainfall extracted from the Australian BoM and the design rainfall prepared from the extreme rainfall of the projected data for the same stations. It is worth noting that the Australian BoM does not include climate change impacts in the estimation of design rainfall. As demonstrated in
Figure 3, the daily design rainfall will decrease due to potential climate change in NSW for the selected nine meteorological stations in three different regions (northeast, central, and southeast). Other stations also exhibit a similar trend. It is obvious that climate change influence has significant impacts on the design rainfall in NSW, and future daily design rainfall will decrease due to potential climate change impacts. Furthermore, there is a high variation in the magnitude of the high-recurrence intervals and a low variation for the low-recurrence intervals, as shown in
Figure 3. These outcomes are consistent with the results observed by Meresa et al. [
29].
The percentage changes in the daily design rainfall due to climate change in NSW are shown in
Table 6. These changes are estimated considering the design rainfall in the Australian BoM as the base. As discussed, the comparisons show that the probability of the occurrence of future extreme rainfall in NSW will decrease in most of the regions for most of the recurrence intervals. As shown in
Table 6, the daily design rainfall will decrease for 27 out of the 29 meteorological stations for the 100-year recurrence interval. The decrease amount ranges from 4% to 60.8% due to potential changes in the climatic parameters in NSW. The two stations where an increase in the future daily design rainfall is observed ranges from 0.6% to 4.7%, as evidenced in
Table 6. Similar outcomes are observed for all other recurrence intervals. However, other parts of the world have the potential to have different outcomes due to topographic and climatic variability. For example, Yang et al. [
50] observed increased extreme rainfall in summer and a −15.38% to +32.33% change in extreme rainfall in winter in Germany. This research acknowledges the impacts of global warming on the spatial and temporal variability of extreme rainfall.
It should be noted that the derivation of design rainfall in the Australian BoM applies regional smoothing to the outputs from the GEVD. This research considers the application of the GEVD to the projected rainfall without considering regional smoothing. However, there will not be much variation from the output of this research after the application of regional smoothing, as observed by Hossain et al. [
42]. Therefore, potential climate change impacts should be incorporated into the derivation of design rainfall in the Australian BoM.
The findings of this study suggest decreased extreme rainfall in NSW and hence decreased flood potentiality from climate change consequences. It is common practice to design stormwater management infrastructure from design rainfall developed from historical extreme rainfall. This hypothesis seems to be invalid under climate change conditions due to probable shifts in the frequency and magnitude of extreme rainfall. Moreover, the uncertainty of current stormwater management will be increased for the future design rainfall attained from projected rainfall. Nevertheless, contradictory consequences were discovered in other parts of the world. Some researchers [
51,
52,
53] noted higher severity and risks of flood from climate-change-induced extreme rainfall. The probable cause of the conflicting observations may be the changes in the characteristics of the climatic variables. Apparently, the outcomes of this research are compatible with the research outcomes obtained from similar topographic locations [
54]. Consequently, regional investigation into the influences of climate change impacts on design rainfall is crucial for the effective design of stormwater management infrastructure. Risks and uncertainty surrounding inadequate drainage systems can be addressed by the findings of this research. As the currently adopted design rainfall is overestimated, this study has the potential to enhance the current state of knowledge in the cost-effective design of stormwater management infrastructure.


