Abstract
The purpose of this study was to analyze the air quality in Hangzhou and its surrounding areas during the 2023 Asian Games and assess the impact of safeguard measures on air quality. By comparing air quality monitoring data from Hangzhou and nearby cities between 23 September 2023, and 8 October 2023, with the same period in 2022, the analysis focused on the changes in air quality and the impact of PM2.5 and O3 on human health. The results show that during the 2023 Asian Games in Hangzhou, compared to the same period in 2022, the concentrations of pollutants showed the following changes: PM10 and NO2 concentrations decreased by 16.1% and 34.1%, respectively. PM2.5, CO, and O3 concentrations increased by 0.9%, 9.5%, and 14.4%, respectively. Spatially, compared with the same period in 2022, the PM2.5 concentration in Quzhou City decreased the most, reaching 23%, while the PM2.5 concentration in Huzhou City increased the most, reaching 27.1%. The largest decrease in PM10 concentration is in Wenzhou City, which is up to 28.2%, while the largest increase is in Zhoushan City, which is 9.2%. The concentration of NO2 generally decreases in all regions, with the biggest decrease in Zhoushan City, which reaches 36.2%. The concentration of CO only decreases in Shaoxing, and the highest increase is in Huzhou City. In terms of O3, the largest proportion increase is 23% in Ningbo. During the 2023 Asian Games in Hangzhou, the number of deaths from all-cause and cardiovascular diseases caused by short-term exposure to PM2.5 was 1780 and 795, respectively, which was 8.2% lower than the same period in 2022. During the Asian Games, the number of deaths from all-cause and cardiovascular diseases due to short-term exposure to O3 was 7332 and 3177, respectively, an increase of 2.8% compared with the same period in 2022.
1. Introduction
In recent years, unplanned and rapid urbanization has led to an increase in anthropogenic emissions, which have continued to cause air pollution problems [1]. Air pollution is now fully acknowledged to be a significant public health problem [2]. To alleviate air pollution and protect public health from its effects, governments around the world have formulated a series of standards and measures to protect the air environment [3]. For example, the Chinese Ministry of Ecology and Environment (CMEE) has issued the China Ambient Air Quality Standards (CAAQS, GB3095-2012) and the Technical Regulations on Ambient Air Quality Index [4]. In 2013, the State Council of China issued “The Action Plan on Prevention and Control of Air Pollution” [5,6,7,8]. In addition, the U.S. Environmental Protection Agency (EPA) established the National Ambient Air Quality Standards. In 1963, the United States enacted the Clean Air Act (CAA), intended to reduce and control air pollution nationwide. In 1988, Canada passed the Canadian Environmental Protection Act (CEPA).
Although the state has implemented a series of initiatives to effectively control air pollution, the air pollution situation in China still faces many challenges. In the past few decades, the situation and characteristics of air pollution in China have gradually changed from a single type of pollution, such as coal smoke, to complex air pollution [9]. It is worth noting that traditional air pollutants such as sulfur dioxide (SO2) and total suspended particulates (TSP) have been effectively controlled. However, the rapid increase in the number of motor vehicles has led to a continuous increase in nitrogen oxide (NOx) emissions [10]. At the same time, industrial production, energy production, and other human activities release large amounts of pollutants, further exacerbating the regional air pollution problem of high concentrations of PM2.5 and O3 [11]. This situation is particularly serious in economically developed regions, such as the Beijing–Tianjin–Hebei, Yangtze River Delta, and Pearl River Delta regions [12,13].
Among the major air pollutants, PM2.5 and O3 are the two key pollutants of complex air pollution [14]. Atmospheric particulate matter (PM) is one of the most hazardous pollutants leading to the deterioration of urban air quality and public health [15]. PM2.5 refers to particles in the atmosphere with a diameter of less than or equal to 2.5 µm, also known as fine particles, and the sources of PM2.5 mainly include natural and anthropogenic sources. O3, as a typical secondary pollutant, is not emitted directly into the atmosphere but is generated in the atmosphere through a photochemical reaction. This process involves precursor substances, such as nitrogen oxides (NOx) and volatile organic compounds (VOCs), and when these precursor substances undergo a chemical reaction under sunlight irradiation, O3 is formed. Additionally, changes in the VOCs/NO ratio also affect O3 formation [16]. Some studies have shown that in 2018, China’s annual average PM2.5 and ozone daily maximum 8 h average concentration (MDA8 O3 concentration) were both relatively high, at 38.4 µg/m3 and 95.8 µg/m3 [17], respectively. Numerous epidemiological studies have confirmed that PM2.5 and O3 cause respiratory diseases such as dyspnea, bronchitis, and even lung cancer to varying degrees, as well as cardiovascular, neurological, and immune damage, resulting in serious health hazards [18,19]. In addition, PM10 is also an important pollutant. PM10 refers to particulate matter with a diameter of less than or equal to 10 µm. CO is another significant atmospheric pollutant, primarily originating from the combustion of fossil fuels, such as motor vehicle exhaust and industrial emissions. CO can combine with hemoglobin in the human body, obstructing oxygen transport, and leading to carbon monoxide poisoning. It poses significant risks to individuals with cardiovascular diseases, pregnant women, and children.
The 19th Asian Games were held from 23 September 2023 to 8 October 2023 in Hangzhou, Zhejiang Province, China. To ensure air quality during the Asian Games, the Zhejiang Provincial Government developed and implemented a series of improvement programs and control measures. These measures included the adoption of innovative pollution reduction methods like “digital fireworks”, the implementation of carbon-neutral guidelines, the implementation of air pollution inspection and remediation actions, motor vehicle traffic restrictions, the construction of a modern environmental monitoring system, and the development of air quality improvement plans. Specific policies also included “five air controls” and “double control and double reduction”. In recent years, China has hosted many major international conferences, such as the Beijing Olympic Games, the Nanjing 2014 Youth Olympic Games, APEC, the G20 Summit, and others. To ensure good air quality, the relevant departments took a series of temporary measures to guarantee that the conferences were carried out smoothly. Specific measures included banning burning, afforestation, the suspension of construction sites, and vehicle control. To study the practical effects of these measures, many scholars have conducted extensive research on the monitoring, evolution, and assessment of air quality and have achieved certain results. Xin et al. [20] found that the average concentration values of SO2, PM2.5, NO2, and O3 in Beijing and the surrounding areas during the Olympic period were (13 ± 4), (56 ± 28), (23 ± 4), and (114 ± 29) µg/m3, respectively, which decreased by 51%, 43.7%, 12.5%, and 20.2%, respectively, compared with before the Olympic Games. Zhao et al. [21] found that, in addition to NO2, the change characteristics of PM2.5, PM10, SO2, and O3 concentrations showed that the changes after the Youth Olympic Games were greater than before the Youth Olympic Games and during the Youth Olympic Games. Xie et al. [22] indicated that during the Youth Olympic Games, the daily average concentration ranges of the five major pollutants PM2.5, PM10, CO, and NO2 were 23–56 μg/m3, 30–76 μg/m3, 458–1080 μg/m3, and 7–19 μg/m3, respectively, with the 8 h O3 concentration ranging from 36 to 93 μg/m3. Compared to the period before the Youth Olympic Games, these concentrations decreased by 37%, 35.4%, 7.1%, 15.0%, and 50.4%, respectively. This result is attributed to a series of “campaign-style” measures taken by Nanjing during the “Youth Olympic Games”, which effectively alleviated air pollution and significantly improved environmental quality. A study conducted during the 2014 APEC meeting in Beijing pointed out that, due to the implementation of a series of measures such as restrictions on motor vehicles, industrial production suspensions, and production limits, PM2.5 concentrations in the city dropped by about 40% compared with the expected value, which proved the effectiveness of short-term control measures in enhancing air quality [23]. On this basis, Liu et al. [24] further showed that during the APEC meeting, compared to the pre-APEC meeting, the concentrations of PM2.5, PM10, NO2, CO, and SO2 in Beijing decreased by 57%, 50.6%, 35.5%, 31.8%, and 13.1%, respectively, except for O3 concentration that shows an opposite trend. Zhao et al. [25] showed that in 2016, the annual average concentrations of PM2.5, PM10, SO2, NO2, CO, and O3 in Hangzhou were 31.5 µg/m3, 46.6 µg/m3, 8.9 µg/m3, 15.2 µg/m3, 0.6 mg/m3, and 114 µg/m3, respectively. Compared to 2015, they decreased by 40.2%, 37.7%, 26%, 56.3%, and 30.3%, respectively, while the O3 concentration increased by 19.9%. Additionally, during the 2020 COVID-19 pandemic, many countries implemented social distancing and lockdown measures, significantly improving air quality in numerous cities [26]. Xu et al. [27] indicated that during the epidemic control actions in February 2020, the average concentrations of PM2.5, PM10, SO2, CO, and NO2 in Hubei Province decreased by 30.1%, 40.5%, 33.4%, 27.9%, and 61.4%, respectively, to 46.1 µg/m3, 50.8 µg/m3, 0.6 ppm, and 6.7 ppb. However, the average O3 concentration in February 2020 did not show a significant decline; instead, it increased by 14.3%. Similarly, the European Environment Agency found that air pollution in several European cities showed a marked improvement trend [28]. In the previous study, it was generally found that the O3 concentration increased despite the decrease in other pollutants. Therefore, this study aims to investigate in depth the effectiveness of the emission reduction measures implemented during the Hangzhou Asian Games and whether these measures led to similar environmental effects compared to the previous events.
The impact of air pollution on human health has also been one of the hotspots of research worldwide [29]. A large number of studies have shown that different air pollutants cause different morbidity and mortality rates for diseases. For example, Hu et al. [30] used monitoring data to analyze the impact of air pollution on the health of residents, and the results showed that the number of respiratory deaths in Ningbo was significantly positively correlated with PM2.5 and O3 in 2012–2013, and the average daily number of deaths in winter reached 22.45. Zhu et al. [31] showed that in the Yangtze River Delta region, about 360 premature deaths per million people were avoided due to the reduction of PM2.5 and O3 concentrations. Maji et al. [32], based on ground observation data from 388 cities in China, calculated that nearly 964,000 premature deaths occur annually due to atmospheric pollution. In addition, Hu et al. [33] applied the CMAQ model to estimate that in 2013, 1.3 million premature deaths occurred in China due to PM2.5 exposure. These studies suggest that the impact of air pollution on human health is not to be underestimated.
Therefore, conducting an in-depth analysis of the changes in air pollution in Hangzhou and its surrounding areas during the Asian Games, as well as evaluating the impact of air pollution on human health and the effectiveness of air quality improvement measures, is crucial. This analysis not only verifies the effectiveness of air pollution control measures but also has significant scientific and practical implications for various countries in developing future joint safeguard strategies.
2. Date and Research Methods
2.1. Date Collection
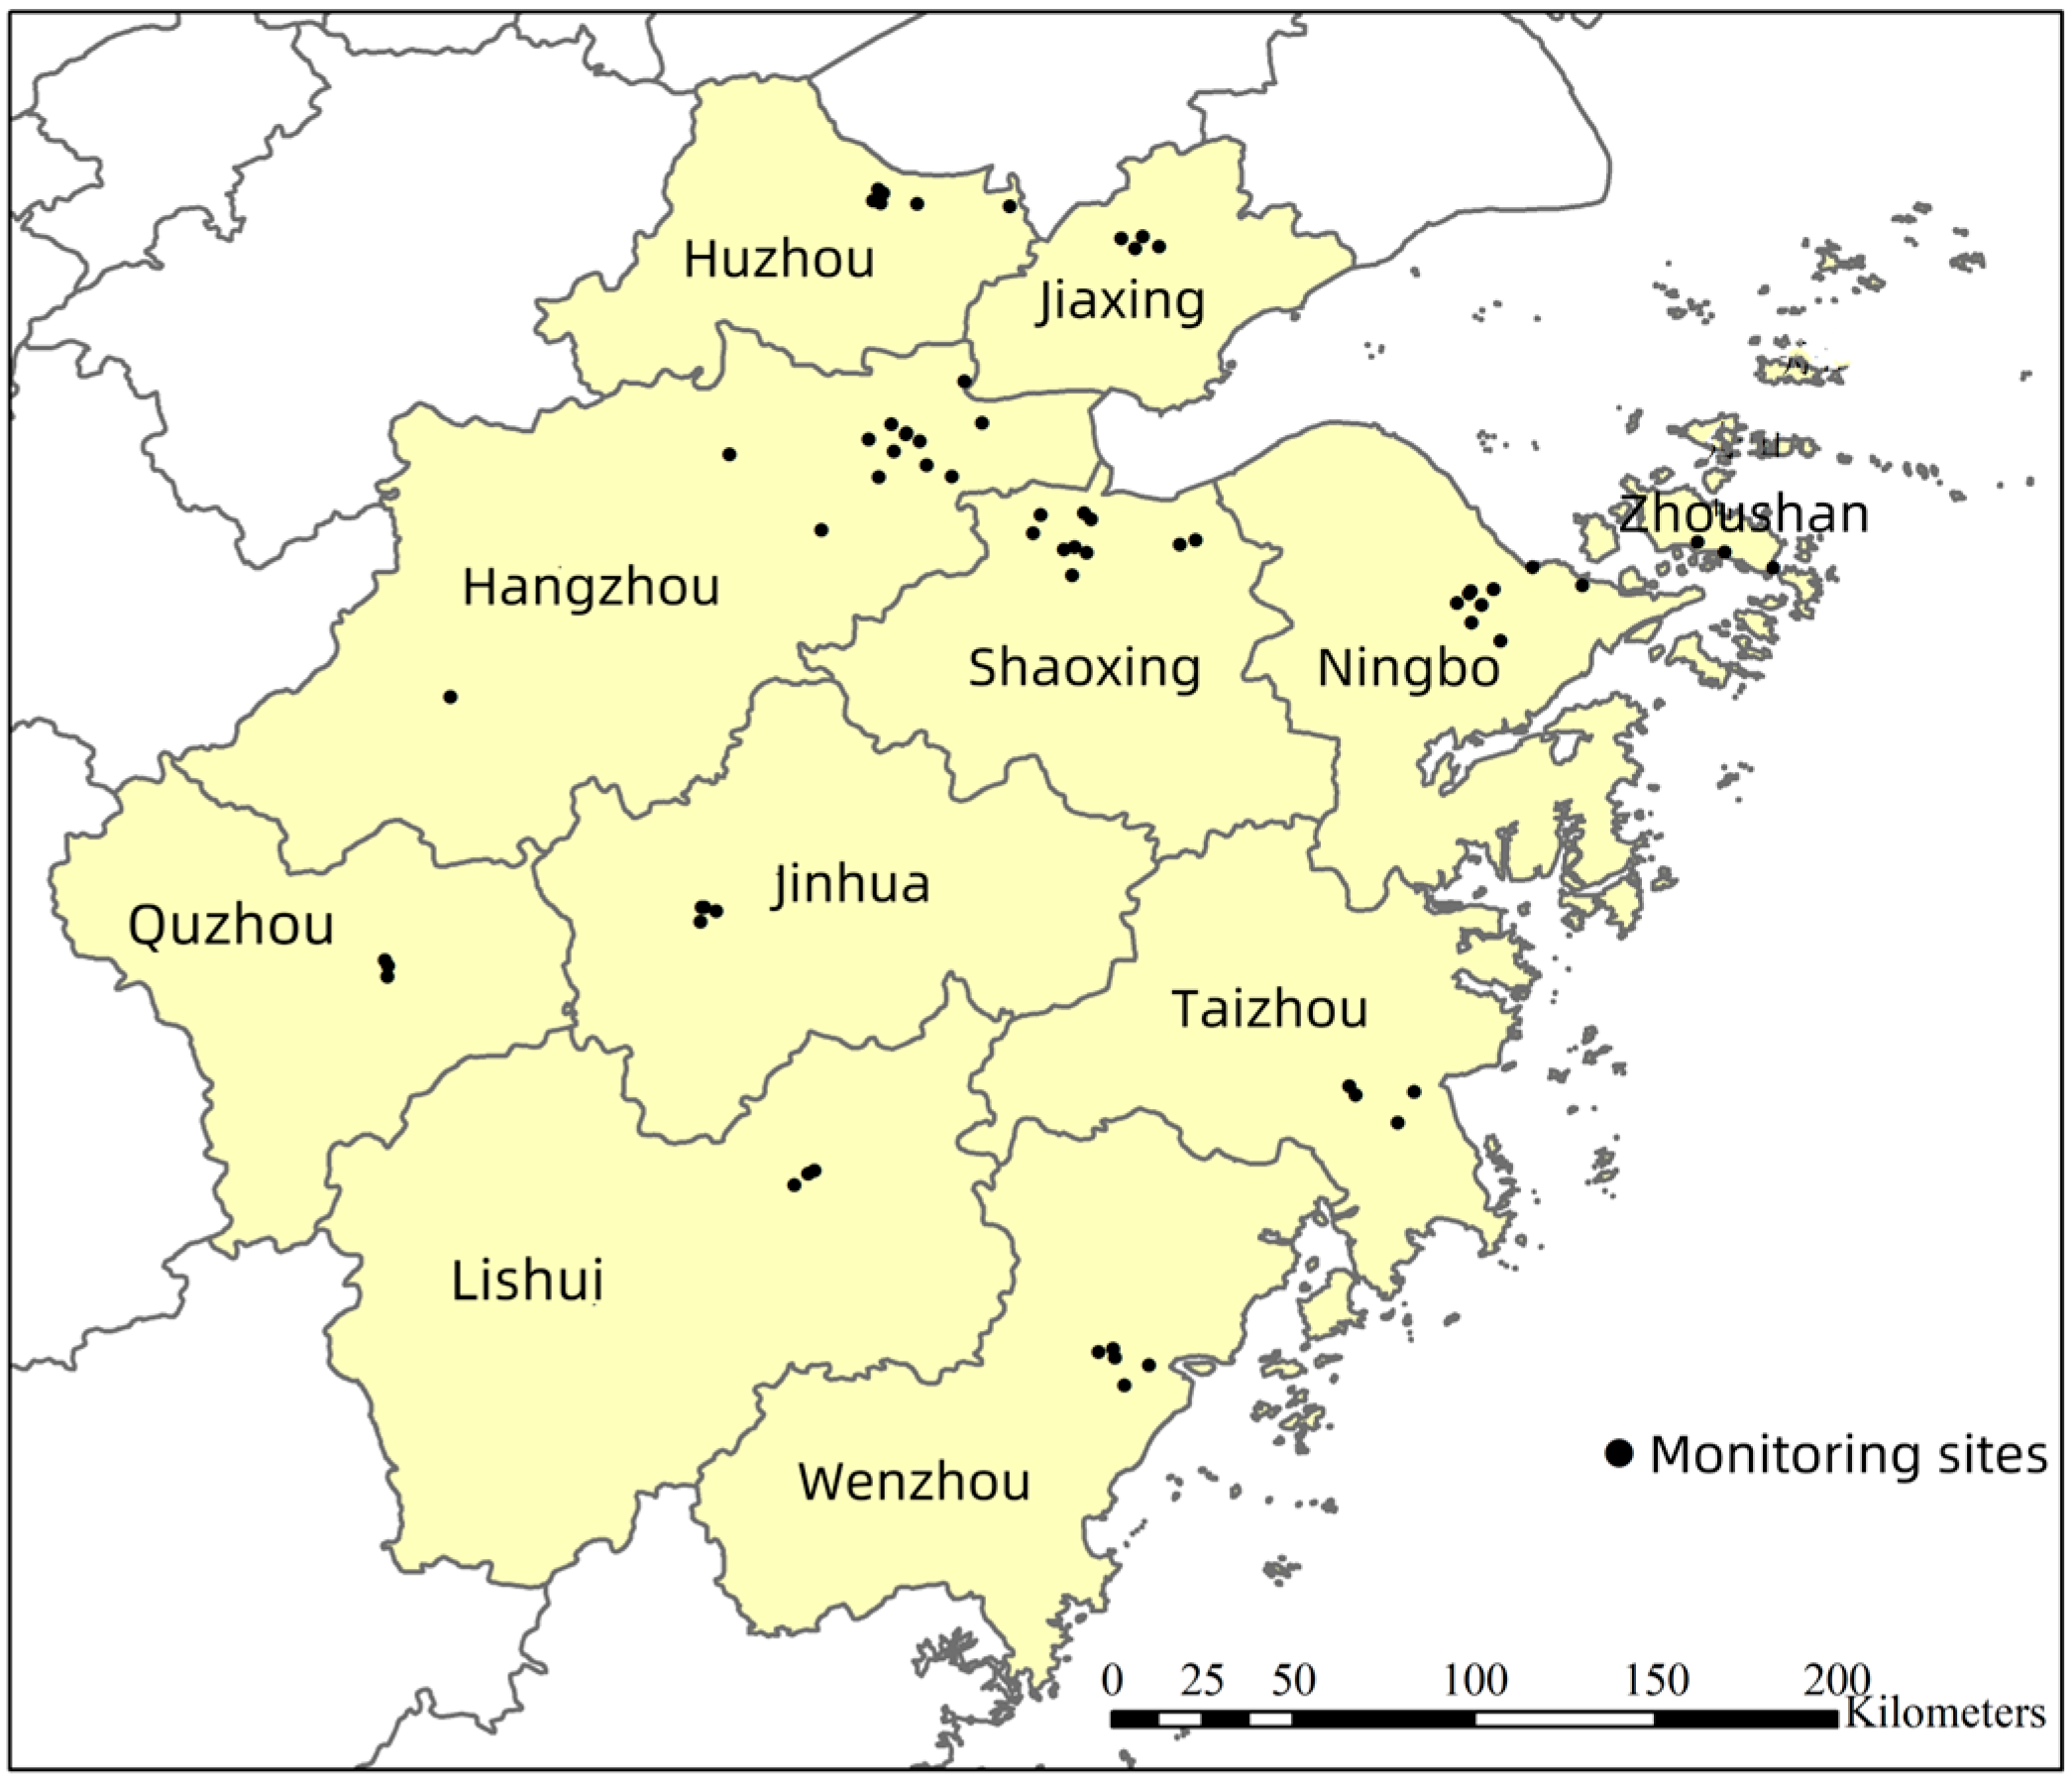
The data for each pollutant, including PM2.5, PM10, NO2, CO, and O3, were obtained from the hourly concentration data released by the National Urban Air Quality Real-time Distribution Platform of the China Environmental Monitoring General Station (CEMG) at https://air.cnemc.cn:18007 (accessed on 23 June 2024). Fourteen monitoring stations in Hangzhou were selected. These are shown in Table 1: Binjiang, Xixi, Qiandao Lake (control point), Xiasha, Wolongqiao, Zhejiang Agricultural University, Zhaohui (five districts), Harmony Primary School, Linping Town, Chengxiang Town, Yunqi, Fuyang No. 2 High School, Municipal Office Building, and Fire Brigade. To assess the effectiveness of the safeguard measures, data on the concentration of pollutants at these 14 stations were also collected for the same period in 2022. Based on this, pollutant data were collected from several neighboring cities, including Ningbo, Wenzhou, Shaoxing, Huzhou, Jiaxing, Taizhou, Zhoushan, Jinhua, Quzhou, and Lishui; the monitoring stations in each city are shown in Figure 1.

Table 1.
Air quality monitoring stations in Hangzhou used in this study.
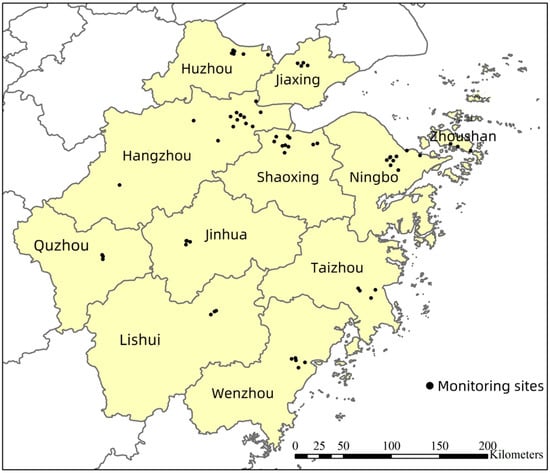
Figure 1.
The spatial distribution of air quality monitoring stations in Hangzhou and its surrounding cities.
2.2. Research Methodology
2.2.1. Air Quality Monitoring
The monitoring period of this study was from 23 September to 8 October 2023. We collected and analyzed daily air quality monitoring data during the Asian Games. Detailed analyses of hourly and daily variations in pollutant concentrations were conducted by plotting time-series diagrams to reveal possible trends and cyclical conditions. Furthermore, to accurately assess the impact of emission reduction measures during the 2023 Hangzhou Asian Games on air quality and public health, this study also compared them with data from the same period in 2022. Considering that the strict COVID-19 control measures implemented in 2020 and 2021 significantly reduced air pollution sources, and China began gradually lifting lockdown measures and returning to normal operations in 2022, this study compared data specifically with 2022 to ensure scientific rigor and accuracy in the analysis.
To ensure the reliability and scientific validity of the data, this study selects representative monitoring stations based on factors such as population density, industrial distribution, and traffic conditions to ensure that the collected air quality data can reflect the pollution situation in different environments. At the same time, this study strictly follows the relevant provisions of the “Ambient Air Quality Standards” (GB 3095-2012), reviews and verifies the collected data, eliminates possible outliers and erroneous data, and ensures the accuracy of the data used in the final analysis.
2.2.2. Health Impact Assessment
The health risks associated with air pollution are multifaceted, including premature death, hospitalization, and outpatient treatment. To quantify this health burden, this study used the following calculation formula:
where EN is the health effect, indicating the number of non-accidental excess deaths or morbidities due to air pollution, Pop is the resident population of each city in Zhejiang Province (the number of air pollution-exposed population or the target population), y0 is the morbidity rate of the health endpoint per unit of population, and the baseline mortality data for each health endpoint were synthesized from a shared dataset from the Global Burden of Disease Assessment Study (GBDAS) [34]. AF is an attributable factor for individual air pollutants used to assess the impact of leakage, assuming that all residents are exposed to the average pollutant concentration in each city. Attributable factors are calculated as follows:
EN = Pop × y0 × AF
AF = RR/(RR − 1) = (ER + 1)/ER
RR stands for relative risk and represents the health risk per unit increase in the concentration of an air pollutant. The excess risk (ER) for each pollutant is calculated as RR minus 1. A higher ER value indicates a greater health risk. The formula for RR is as follows:
where β is the exposure–response coefficient, which represents the excess risk of health effects per unit increase in air pollutant concentration (such as 1 µg/m3 of PM2.5). The β values from previous studies were used in this study, which were derived from a meta-analysis of a large number of studies with high confidence and representativeness. The β values of PM2.5 and O3 for all-cause mortality are 0.038% and 0.048%, respectively. The β values of PM2.5 and O3 for cardiovascular diseases are 0.051% and 0.073%, respectively.
RR = exp [β × (C − C0)]
In Equation (3), C represents the concentration of each air pollutant, and C0 is the threshold concentration of each air pollutant at which an individual air pollutant is considered to have no significant adverse health effects (i.e., RR = 1). It has been shown that there is no threshold concentration for the health effects of airborne particulate matter on human populations and that even at very low exposure concentrations of PM2.5, there are still some health effects. Currently, two methods are considered for the selection of health thresholds: the zero-value method and the natural background concentration method. Although the zero-value method meets the characteristics of no health threshold, it is difficult to implement in practice and is not practical. Therefore, the natural background concentrations of PM2.5 and O3 were used as C0. The values of C0 for PM2.5 and O3 were 5.8 µg/m3 and 0 ppb, respectively.
Finally, by substituting the values into Equation (1), it is possible to estimate the excess number of deaths due to air pollution, EN. This approach contributes to a more comprehensive understanding of the impact of air pollution on human health.
3. Results and Discussion
3.1. Air Pollutants
3.1.1. Analysis of Pollutant Change Characteristics
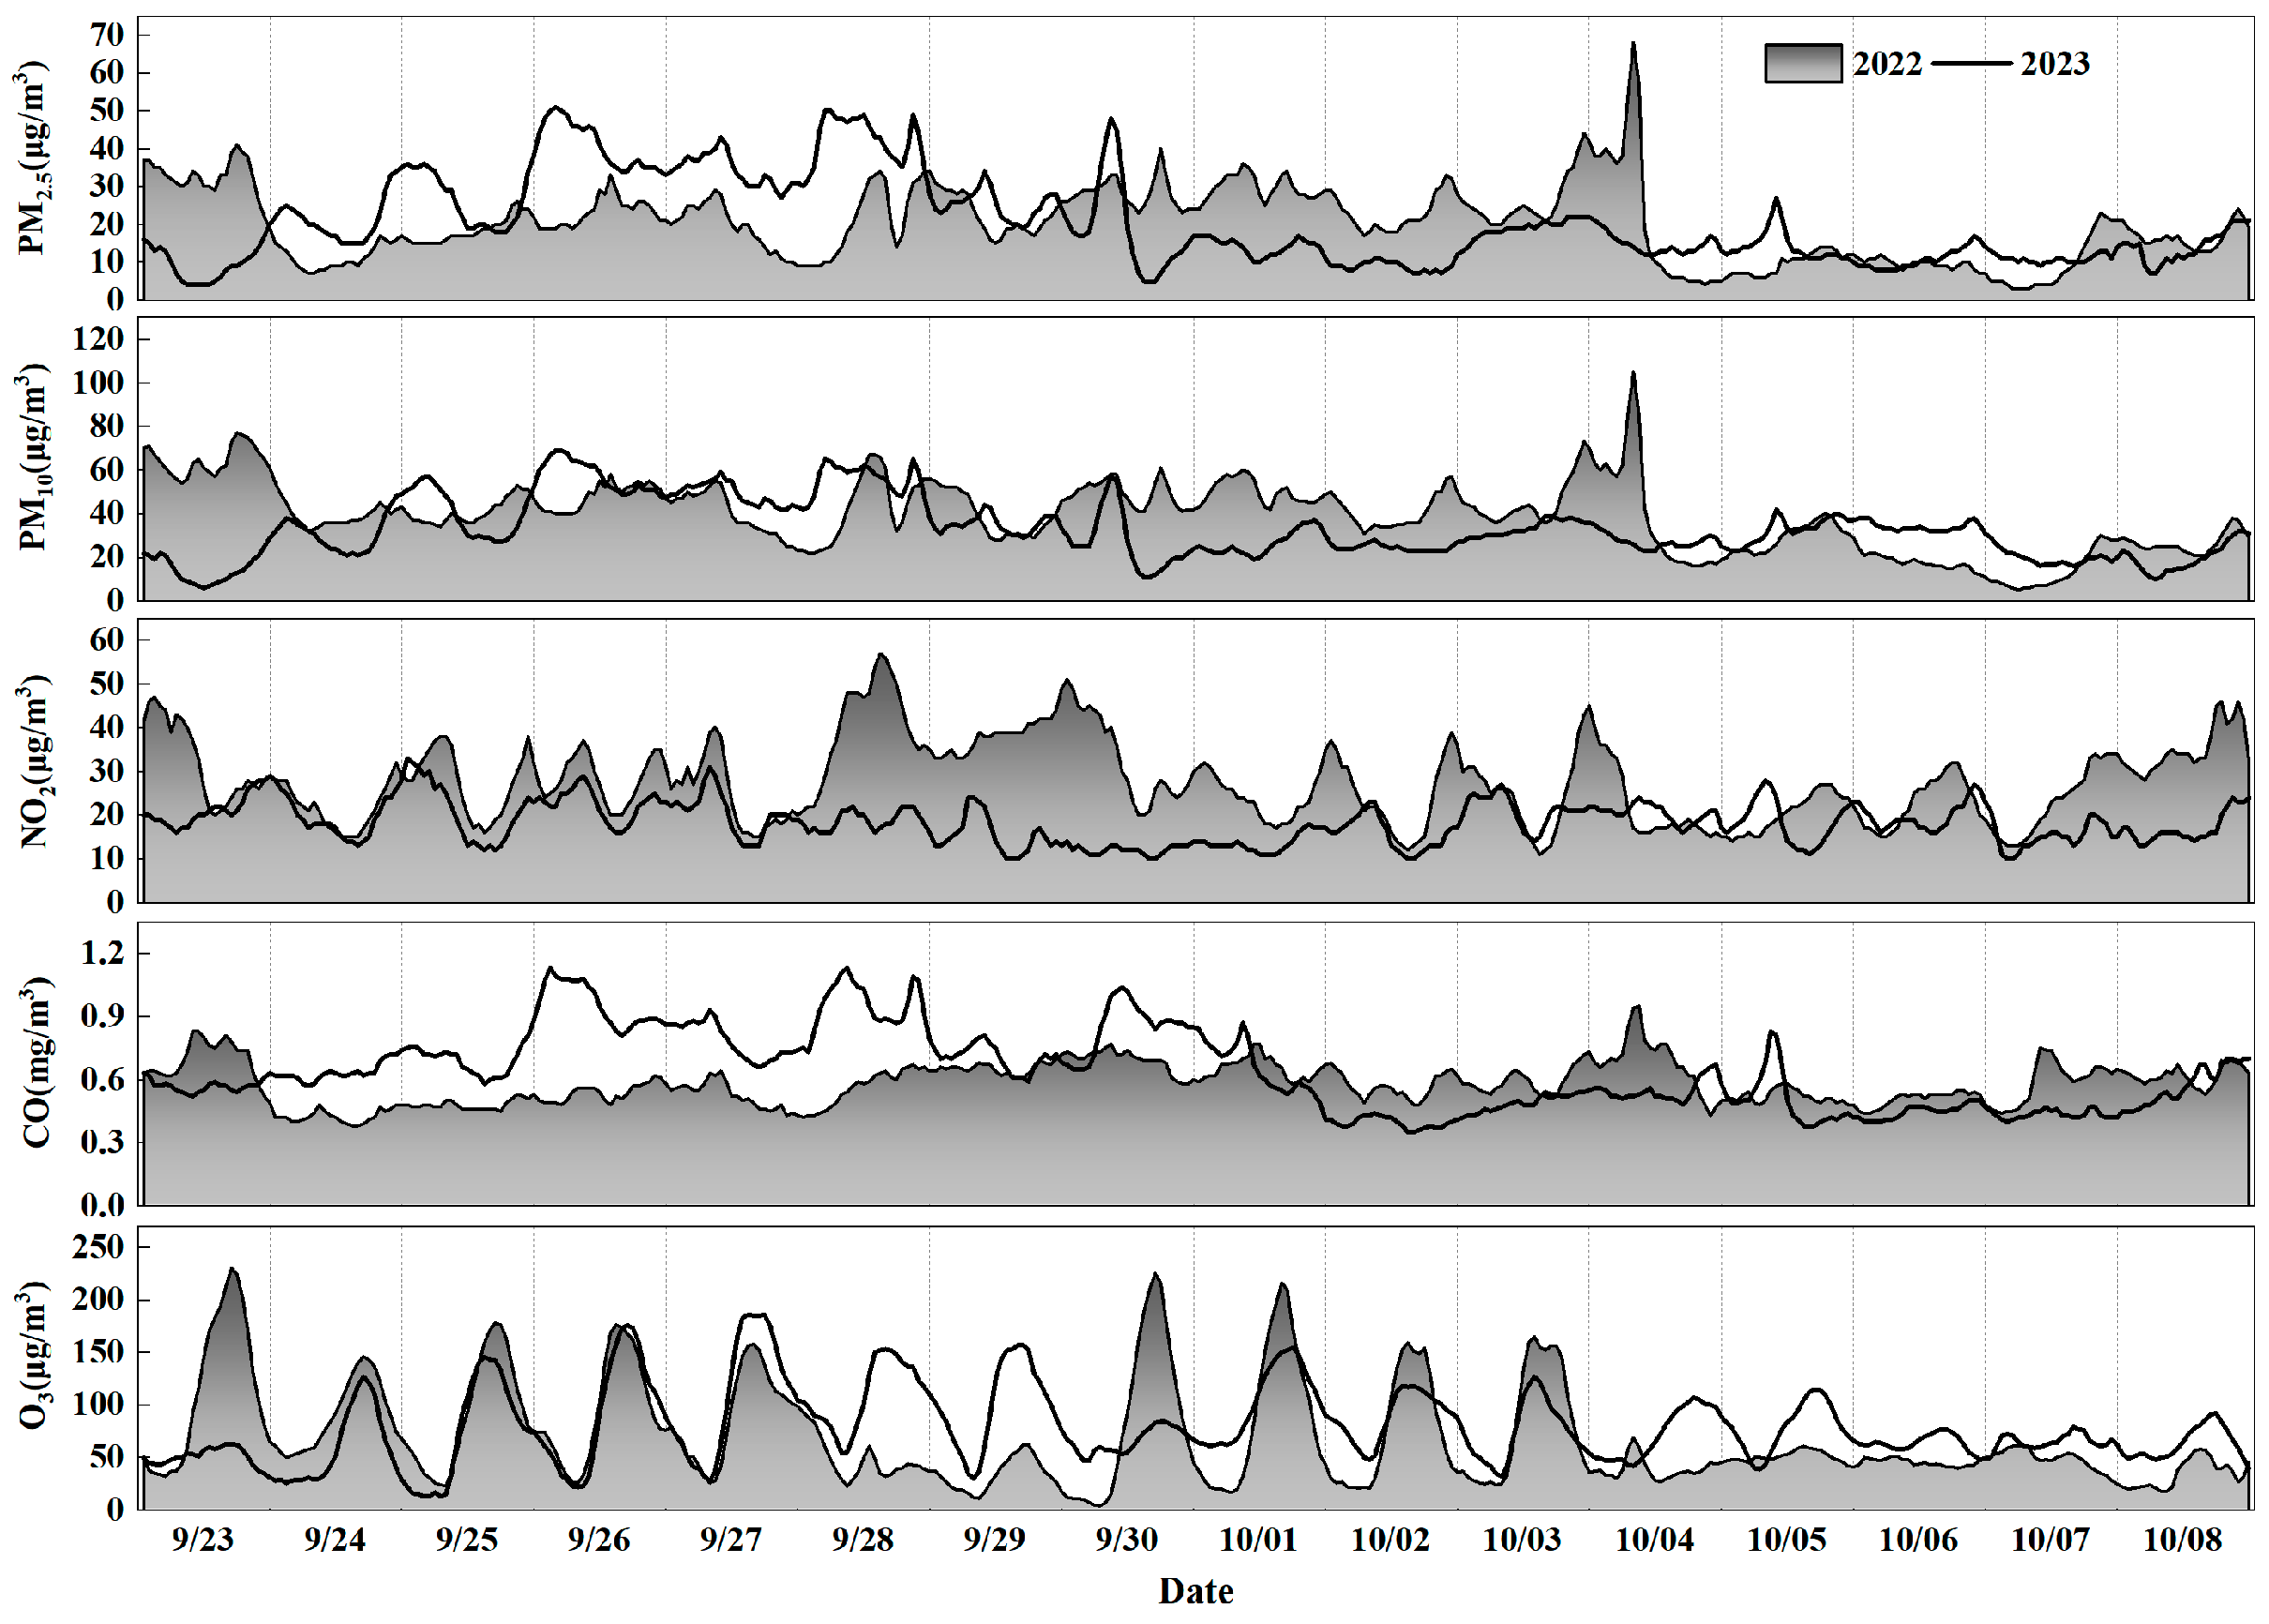
To study the impact of Hangzhou Asian Games safeguard measures on the air quality of Hangzhou, the hourly concentration changes in various pollutants from 23 September to 8 October 2023 were compared with those of 2022, as shown in Figure 2. Referring to the national ambient air quality standard, the 24 h Grade I standard average concentration limits for PM2.5, PM10, NO2, and CO are as follows: 35 µg/m3, 50 µg/m3, 80 µg/m3, and 4 mg/m3, respectively. The 24 h Grade II standard average concentration limits for these pollutants are 75 µg/m3, 150 µg/m3, 80 µg/m3, and 4 mg/m3, respectively. Figure 2 indicates that during the 16 days of the 2023 Hangzhou Asian Games, the average concentration of PM2.5 met the national ambient air quality Grade I standard on 14 days, whereas during the same period in 2022, it met the Grade I standard on all days.
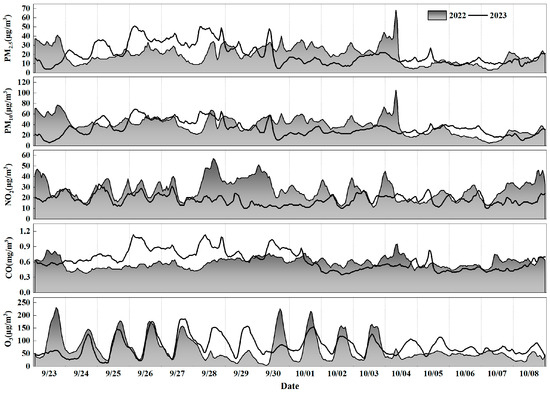
Figure 2.
The hourly variation in concentrations of five pollutants in Hangzhou City.
The hourly variations in PM10 and PM2.5 exhibit similar patterns of peaks and valleys. During the 2023 Asian Games, the daily average of PM10 met the Grade I standard of GB 3095-2012 for 14 days, while the rest of the days were at Grade II. By calculating the ratio of PM2.5 to PM10, we can distinguish the contributions of coarse and fine PM to PM10. When the PM2.5/PM10 ratio is higher (e.g., greater than 0.5), it indicates that fine particles contribute more significantly to PM10. In this study, the average PM2.5/PM10 ratio was 0.51 in 2022 and increased to 0.62 in 2023. This suggests that PM10 concentrations primarily originate from PM smaller than PM2.5. Fine PM typically originates from combustion processes (such as vehicle emissions and industrial activities) or the formation of secondary aerosols (such as sulfates, nitrates, and ammonium salts). Therefore, during the Asian Games period, the higher PM2.5/PM10 ratio may be attributed to increased generation of sulfate and other secondary aerosols due to enhanced photochemical reactions in the summer [35].
During the Asian Games, the NO2 concentrations in Hangzhou were found to be significantly lower than the national Grade I standard for NO2. The average concentration during the 2023 Asian Games period was 18.3 µg/m3, which was lower than the 27.7 µg/m3 recorded during the same period in 2022. The decrease in NO2 concentrations was even more significant compared with the same period in the previous year, which could be related to strict motor vehicle control and possibly to its own seasonal variation.
The average concentration of CO during the 2023 session was 0.6 mg/m3, unchanged from the same period in 2022. In general, the lower CO concentration in summer is mainly due to the higher height of the boundary layer and strong turbulence in summer, which is favorable for CO mixing [36]. In autumn and winter, atmospheric stability is high, causing CO to accumulate at the ground level. This, coupled with unfavorable diffusion conditions, results in higher CO concentrations during these seasons compared to others.
Unlike other pollutants, O3 concentrations in Hangzhou were higher during the 2023 Asian Games, rising by 14.4% compared with the same period in 2022. O3 is mainly derived from the chemical reaction between nitrogen oxides (NOx) and volatile organic compounds (VOCs) under sunlight irradiation, and its concentration is affected by the intensity of solar radiation and precursors. Additionally, its high temperatures may exacerbate O3 levels [1].
3.1.2. Daily Variation Characteristics of Pollutants
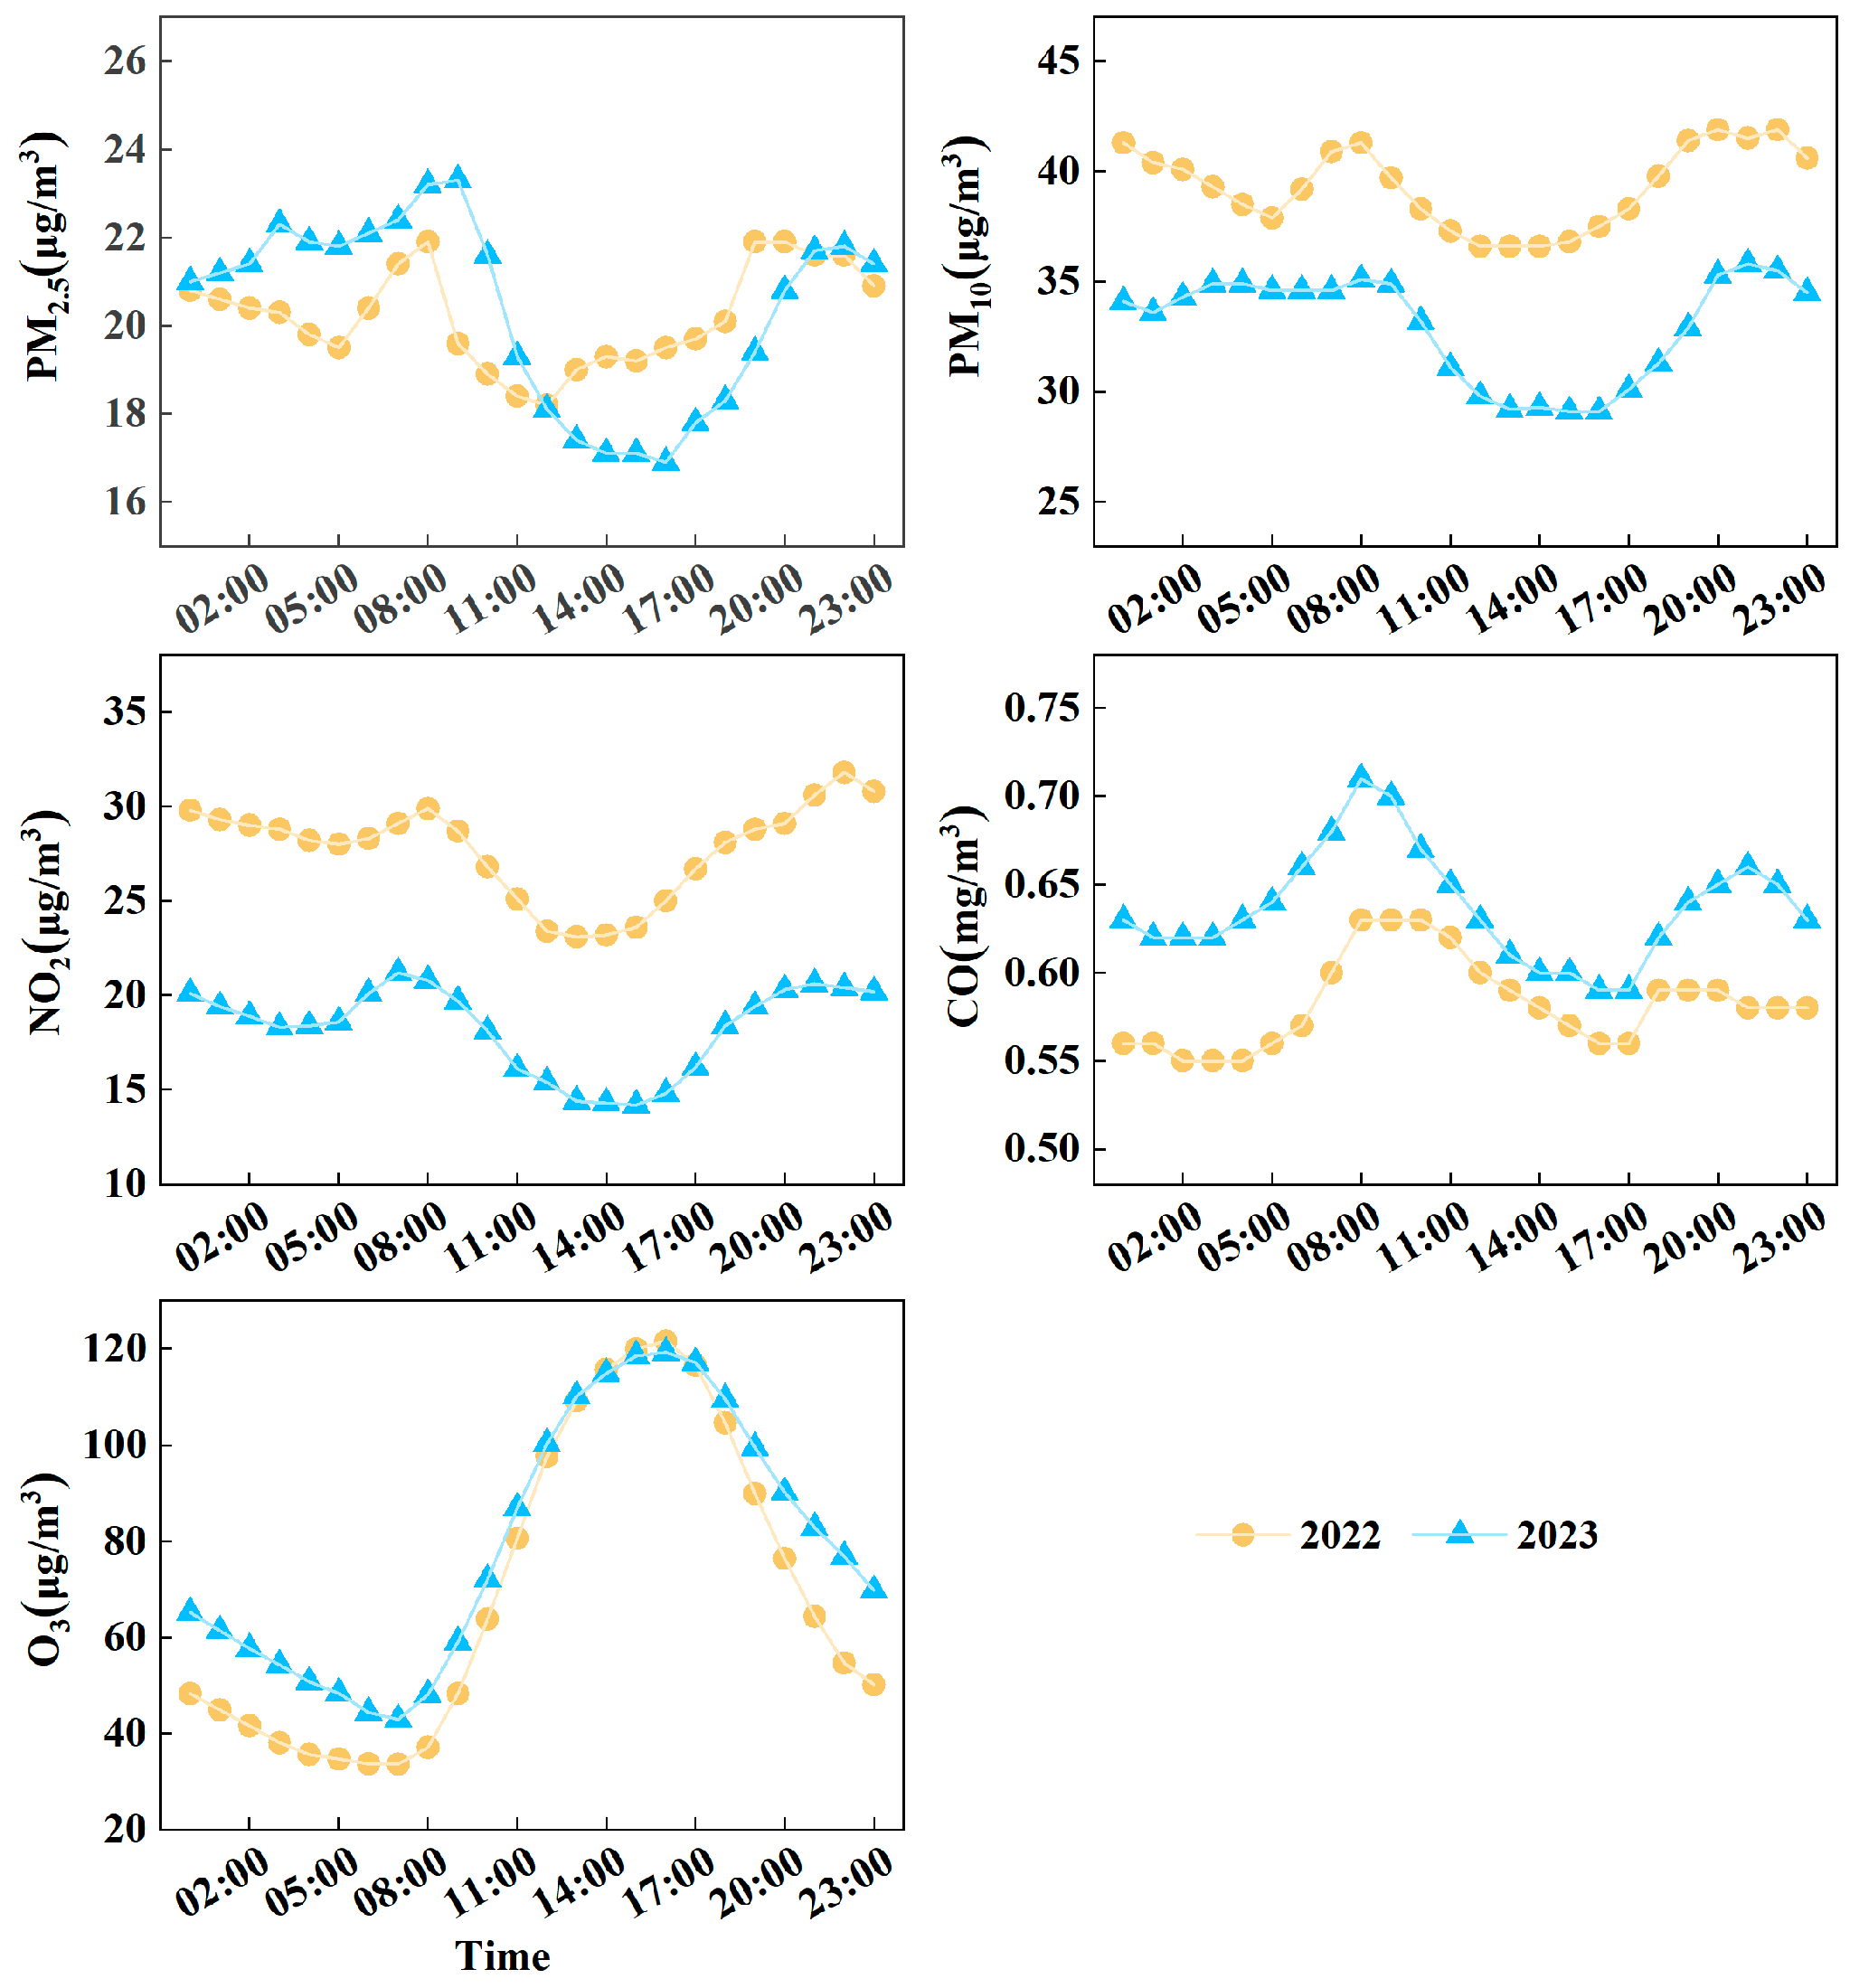
To gain a deeper understanding of the impact of the implementation of safeguards on air pollutant concentrations, the mean values of the concentrations of PM2.5, PM10, NO2, CO, and O3 were analyzed at different moments, as shown in Figure 3. The analysis results indicate that daily trends of these air pollutants exhibit similar patterns, with O3 showing a more pronounced daily variation compared to the other pollutants.
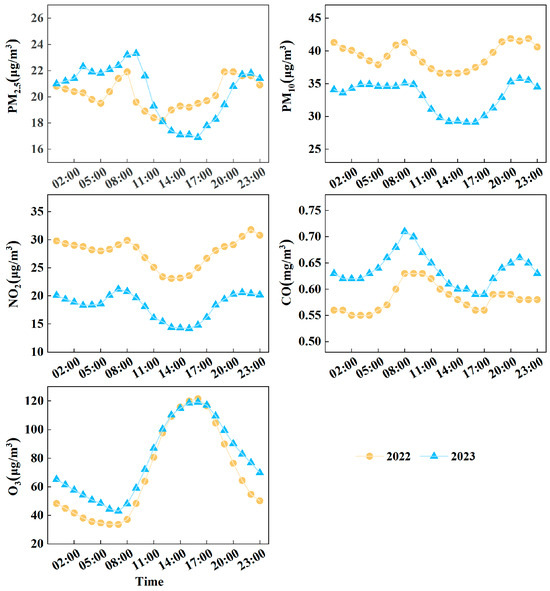
Figure 3.
Daily variation in concentrations of five pollutants in Hangzhou at different time periods.
The diurnal variation trends of PM2.5 and PM10 concentrations are generally similar, with the peaks occurring at 08:00–09:00 in the morning, which may be related to the continuous input of fine PM into the atmosphere by high motor vehicle traffic and road dust [37]. In the afternoon, the boundary layer is unstable and the turbulent exchange capacity is stronger, which leads to a decrease in the concentration of PM. The increase in pollutant concentrations in the evening is associated with a deeper, more stable boundary layer when the atmosphere is stable, which is not conducive to the dispersion and dilution of pollutants.
During the 2023 Asian Games period, the daily variation in NO2 was consistent, showing an overall double-peak and double-trough daily variation. The peaks occurred around 07:00–08:00 in the morning and 21:00–22:00. In the early morning, NO2 concentrations began to rise, reaching the first peak due to traffic congestion and a large number of motor vehicle emissions. Subsequently, with the enhancement of solar radiation, the urban atmospheric boundary layer rose, resulting in enhanced diffusion and dilution of pollutants. The concentration showed a downward trend to 13:00–15:00 around the trough. With the appearance of the evening peak, NO2 concentrations began to increase until 21:00–22:00, the second peak. Compared with the same period in 2022, the daily trend of NO2 was similar, but the overall concentration was higher, primarily due to the lack of safeguard measures during that period.
CO exhibited a bimodal daily variation, with peaks around 08:00 and 21:00. and troughs around 16:00~18:00. The first peak was caused by a short-term large increase in motor vehicle emissions due to traffic congestion. After the morning rush hour, CO concentrations began to decline, reaching a minimum around 16:00–18:00. They then rebounded to a second peak at about 21:00. The evening peak may be attributed to the lowering of the height of the mixed layer, which restricts the diffusion of pollutants. The stable atmospheric stratification further hinders the dispersion and dilution of pollutants, causing CO emitted locally to accumulate in the lower atmosphere, leading to an increase in CO concentration [38].
O3 shows an obvious single peak and single valley change pattern, with the peak value occurring around 16:00, and the valley value around 07:00. The diurnal changes in O3 concentrations are related to the near-surface atmospheric photochemical process. After sunrise, the increased solar radiation intensifies photochemical reactions involving O3 precursors like NOx and VOC, resulting in a continuous rise in O3 concentration. Subsequently, the concentration gradually decreases and reaches its lowest point the following day due to O3 titration and dry deposition [39]. As can be seen from Figure 3, the changing trends of NO2 and O3 are opposite. This may be because NO2 is the precursor of O3, so its concentration changes have a strong correlation with NO2.
3.1.3. Spatial Distribution Characteristics of Pollutants
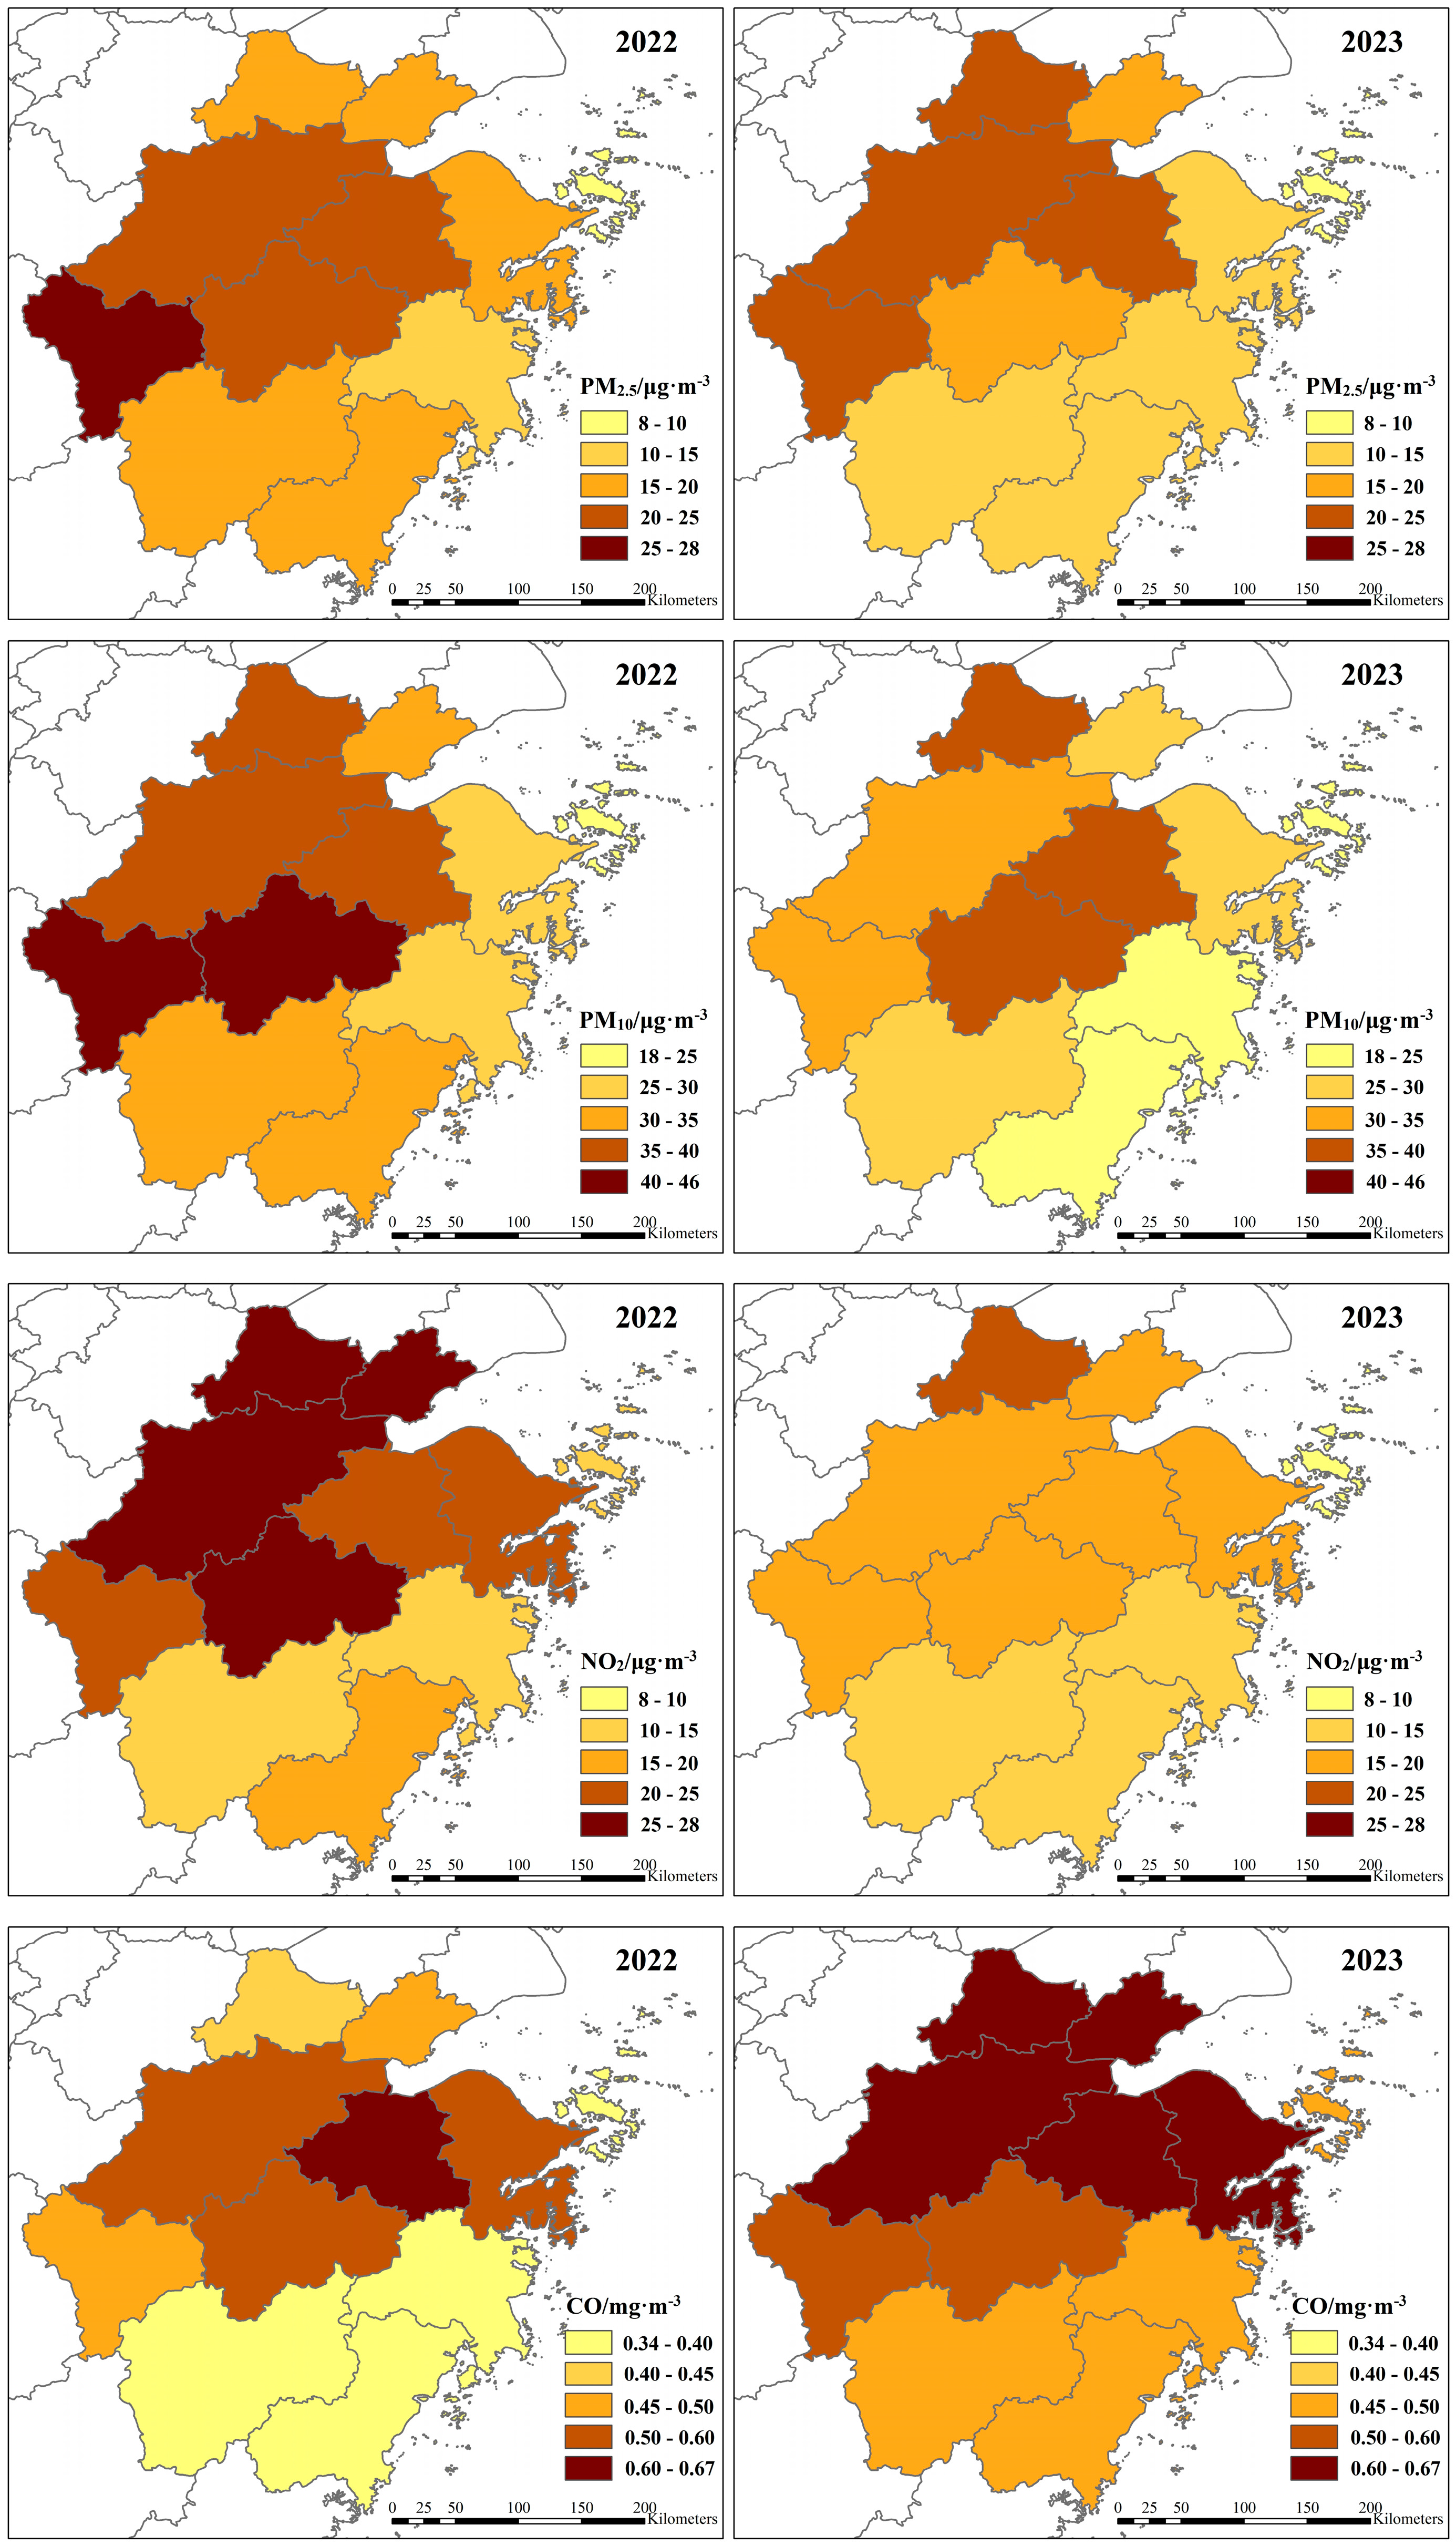
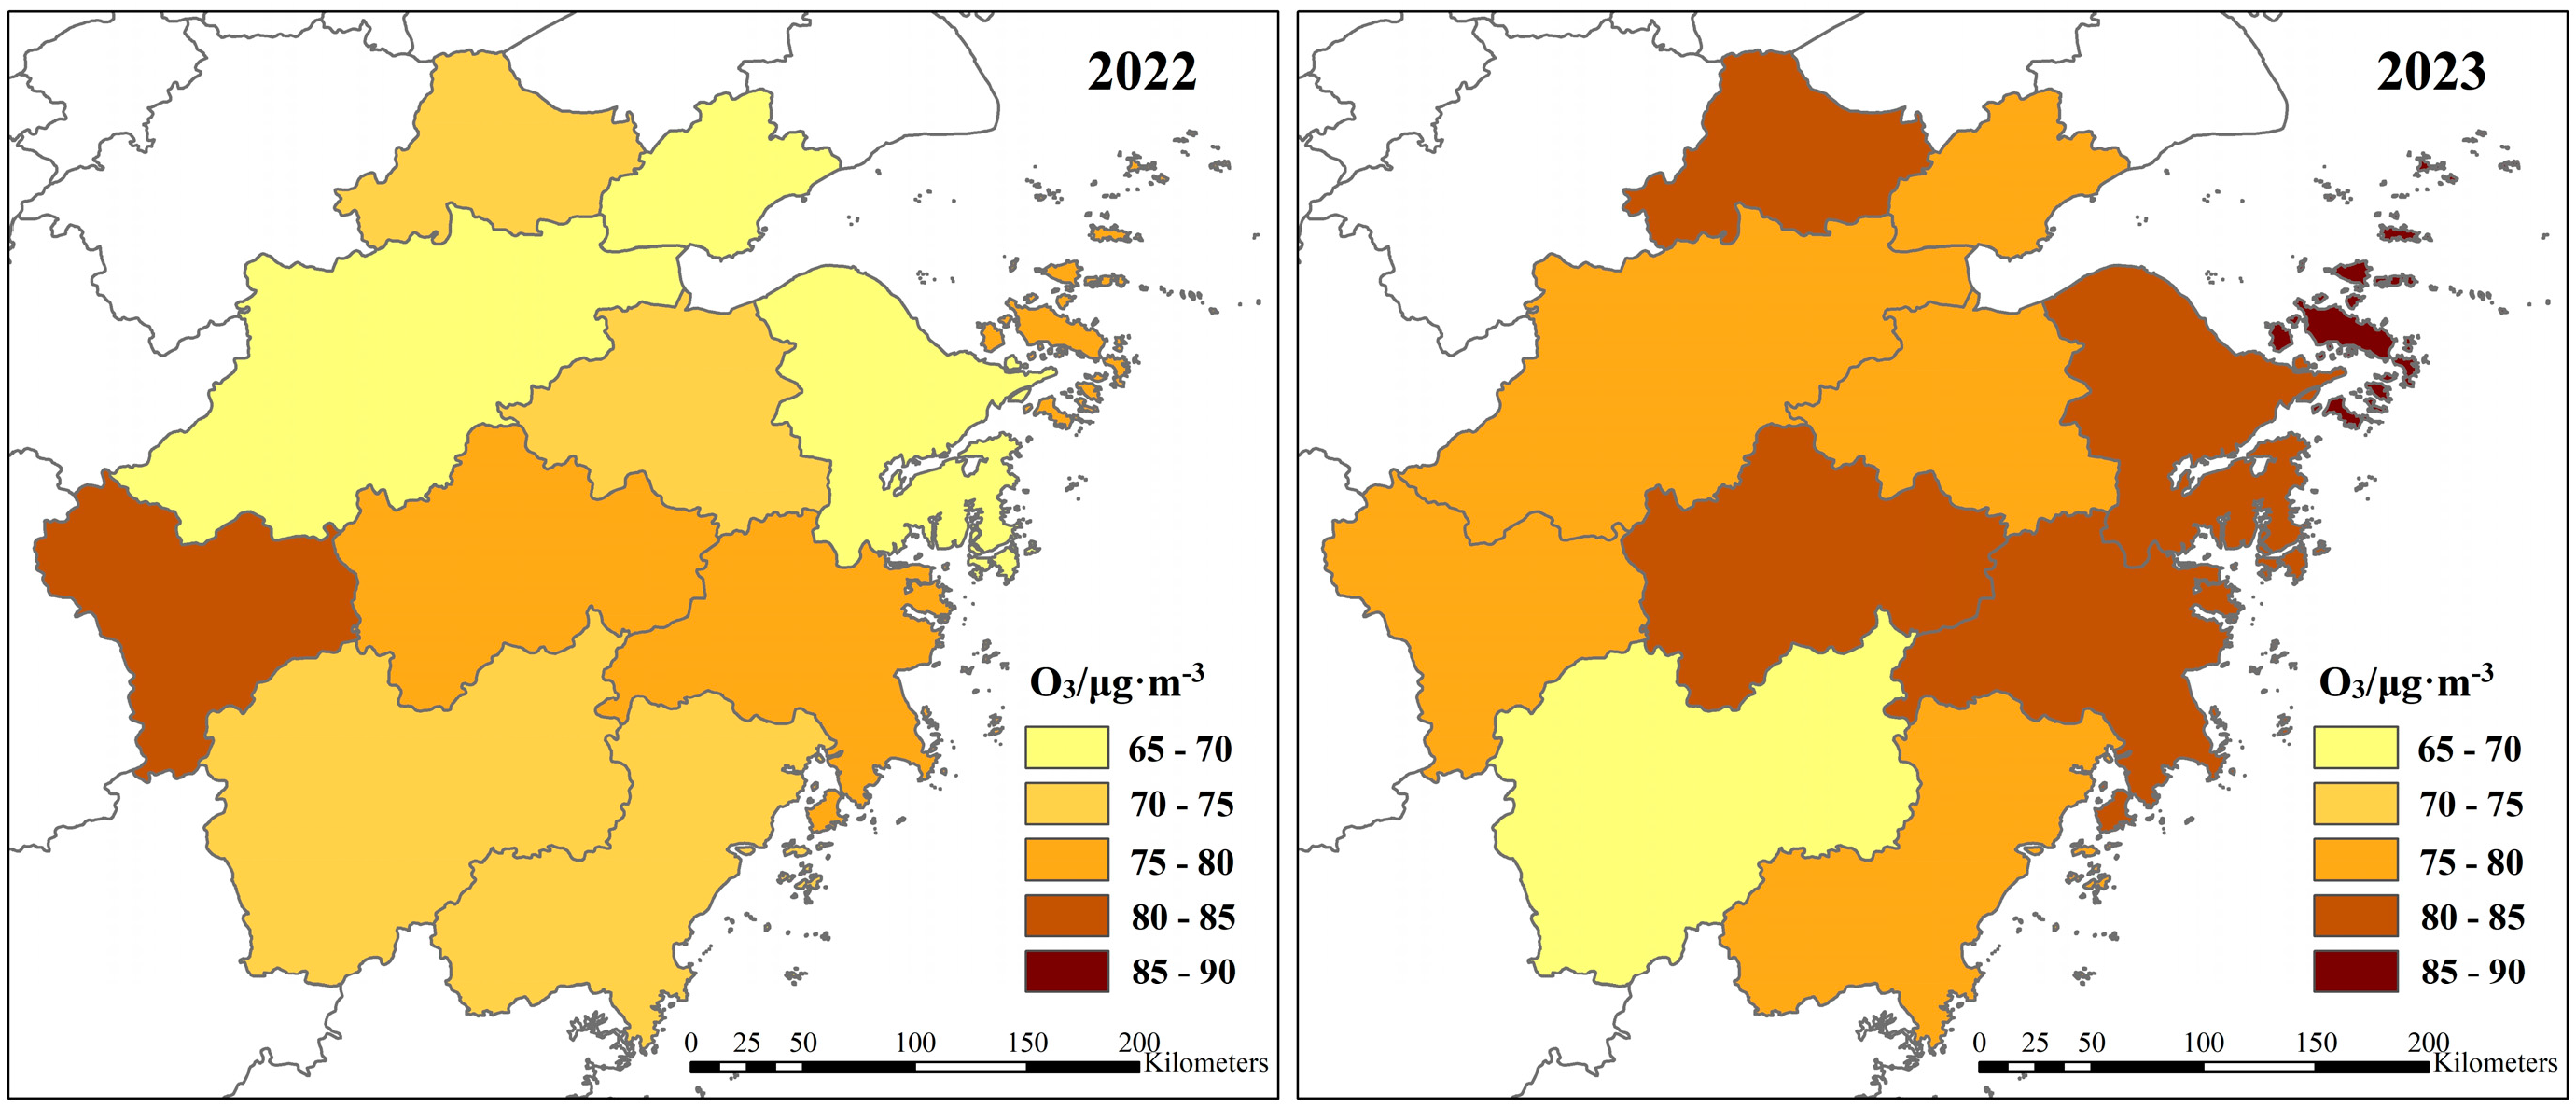
Figure 4 shows the spatial distribution of the concentrations of five pollutants in Hangzhou and its surrounding areas during the Asian Games compared with the same period in 2022. It can be seen from Figure 4 that the spatial distribution of pollutant concentrations varies significantly between the east, west, south, and north. The eastern region of Zhejiang Province generally has lower pollutant concentrations, possibly due to its proximity to the ocean and favorable sea–land breeze convection conditions, which facilitate the dispersion and dilution of pollutants. The western region, characterized by mountains and relatively closed terrain, has higher pollutant concentrations as compared to the eastern coastal areas, where atmospheric circulation is not as favorable. Southern areas such as Lishui and Wenzhou generally have better air quality. In the northern part of Zhejiang Province, air pollution is relatively serious, and its air quality shows a trend of deterioration from south to north. Real-time monitoring data showed that foggy weather had occurred in northern and some parts of central Zhejiang, and the air quality was poor in some areas. This difference may be because northern Zhejiang is more populated and the cities of Hangzhou and Jiaxing are more industrially developed, and the fact that industrial discharge exceeds the carrying capacity of the environment is a significant factor in environmental pollution. From Figure 4, it is clear that although there are still noticeable differences between the northern and southern regions, the overall air quality in Zhejiang Province shows an improving trend in 2023.
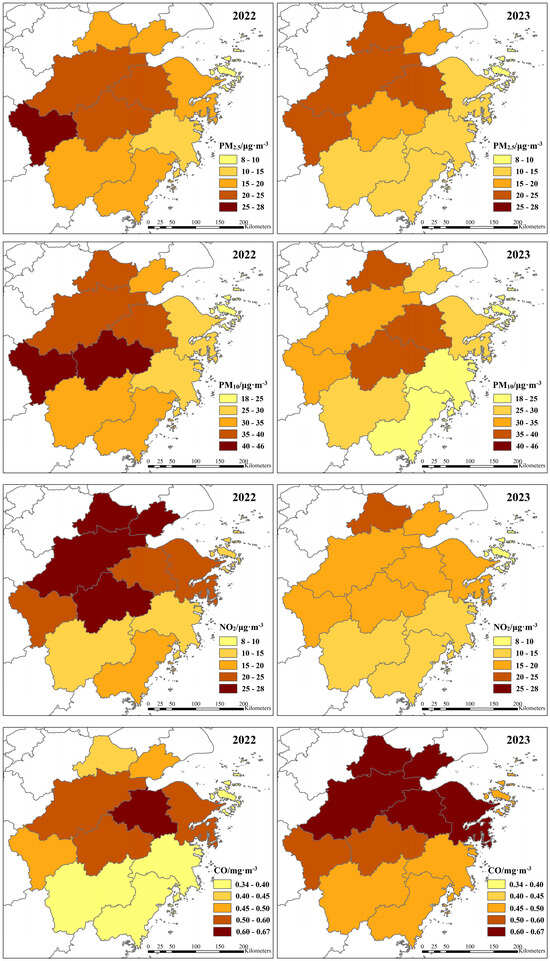
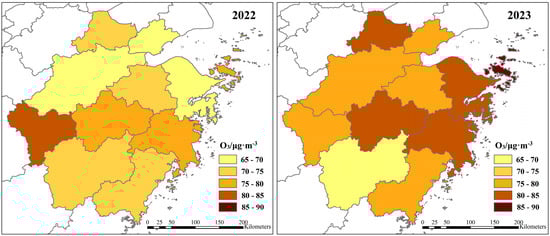
Figure 4.
The spatial distribution of concentrations of five pollutants in Hangzhou and surrounding areas during the Asian Games period (right) compared with the same period in 2022 (left).
During the Asian Games, areas with high PM2.5 concentrations were mainly concentrated in Quzhou and surrounding cities in western Zhejiang. Compared to the entire Zhejiang Province, Zhoushan City in eastern Zhejiang had the lowest PM2.5 concentrations. But compared to the same period in 2022, Quzhou’s PM2.5 concentration decreased most significantly by 23%, while Huzhou City’s PM2.5 increased the most by 27.1%. The situation with PM10 was similar to that of PM2.5, with Quzhou and Jinhua being the high pollutant concentration areas. In 2022, the PM10 concentrations in Quzhou and Jinhua reached 45 µg/m3 and 44.5 µg/m3, respectively. During the Asian Games, their concentrations dropped to 34.7µg/m3 and 37.9 µg/m3, respectively. Meanwhile, a wide range of low-concentration areas below 25 µg/m3 appeared in the southeastern part of the province, with the reduction in PM10 in Wenzhou reaching 28%. The improvement in overall NO2 pollutant concentration was the most significant. In 2022, the cities of Hangzhou, Huzhou, Jinhua, and Jiaxing in northern Zhejiang Province all recorded NO2 concentrations exceeding 25 µg/m3. During the Asian Games, the NO2 concentration in Hangzhou significantly decreased to 18.3 µg/m3, while the average NO2 concentration in the rest of Zhejiang Province also decreased to less than 22 µg/m3, with Zhoushan City showing the largest decrease at 36.2%. The concentration of CO only decreased in Shaoxing, with a reduction of 2.3%, while the largest increase in CO was observed in Huzhou, with a rise of 42.9%. For O3, the largest decrease occurred in Quzhou at 6.6%, while the largest increase was in Ningbo at 23%.
3.1.4. Changes in Pollutant Concentrations in Different Cities in Zhejiang Province
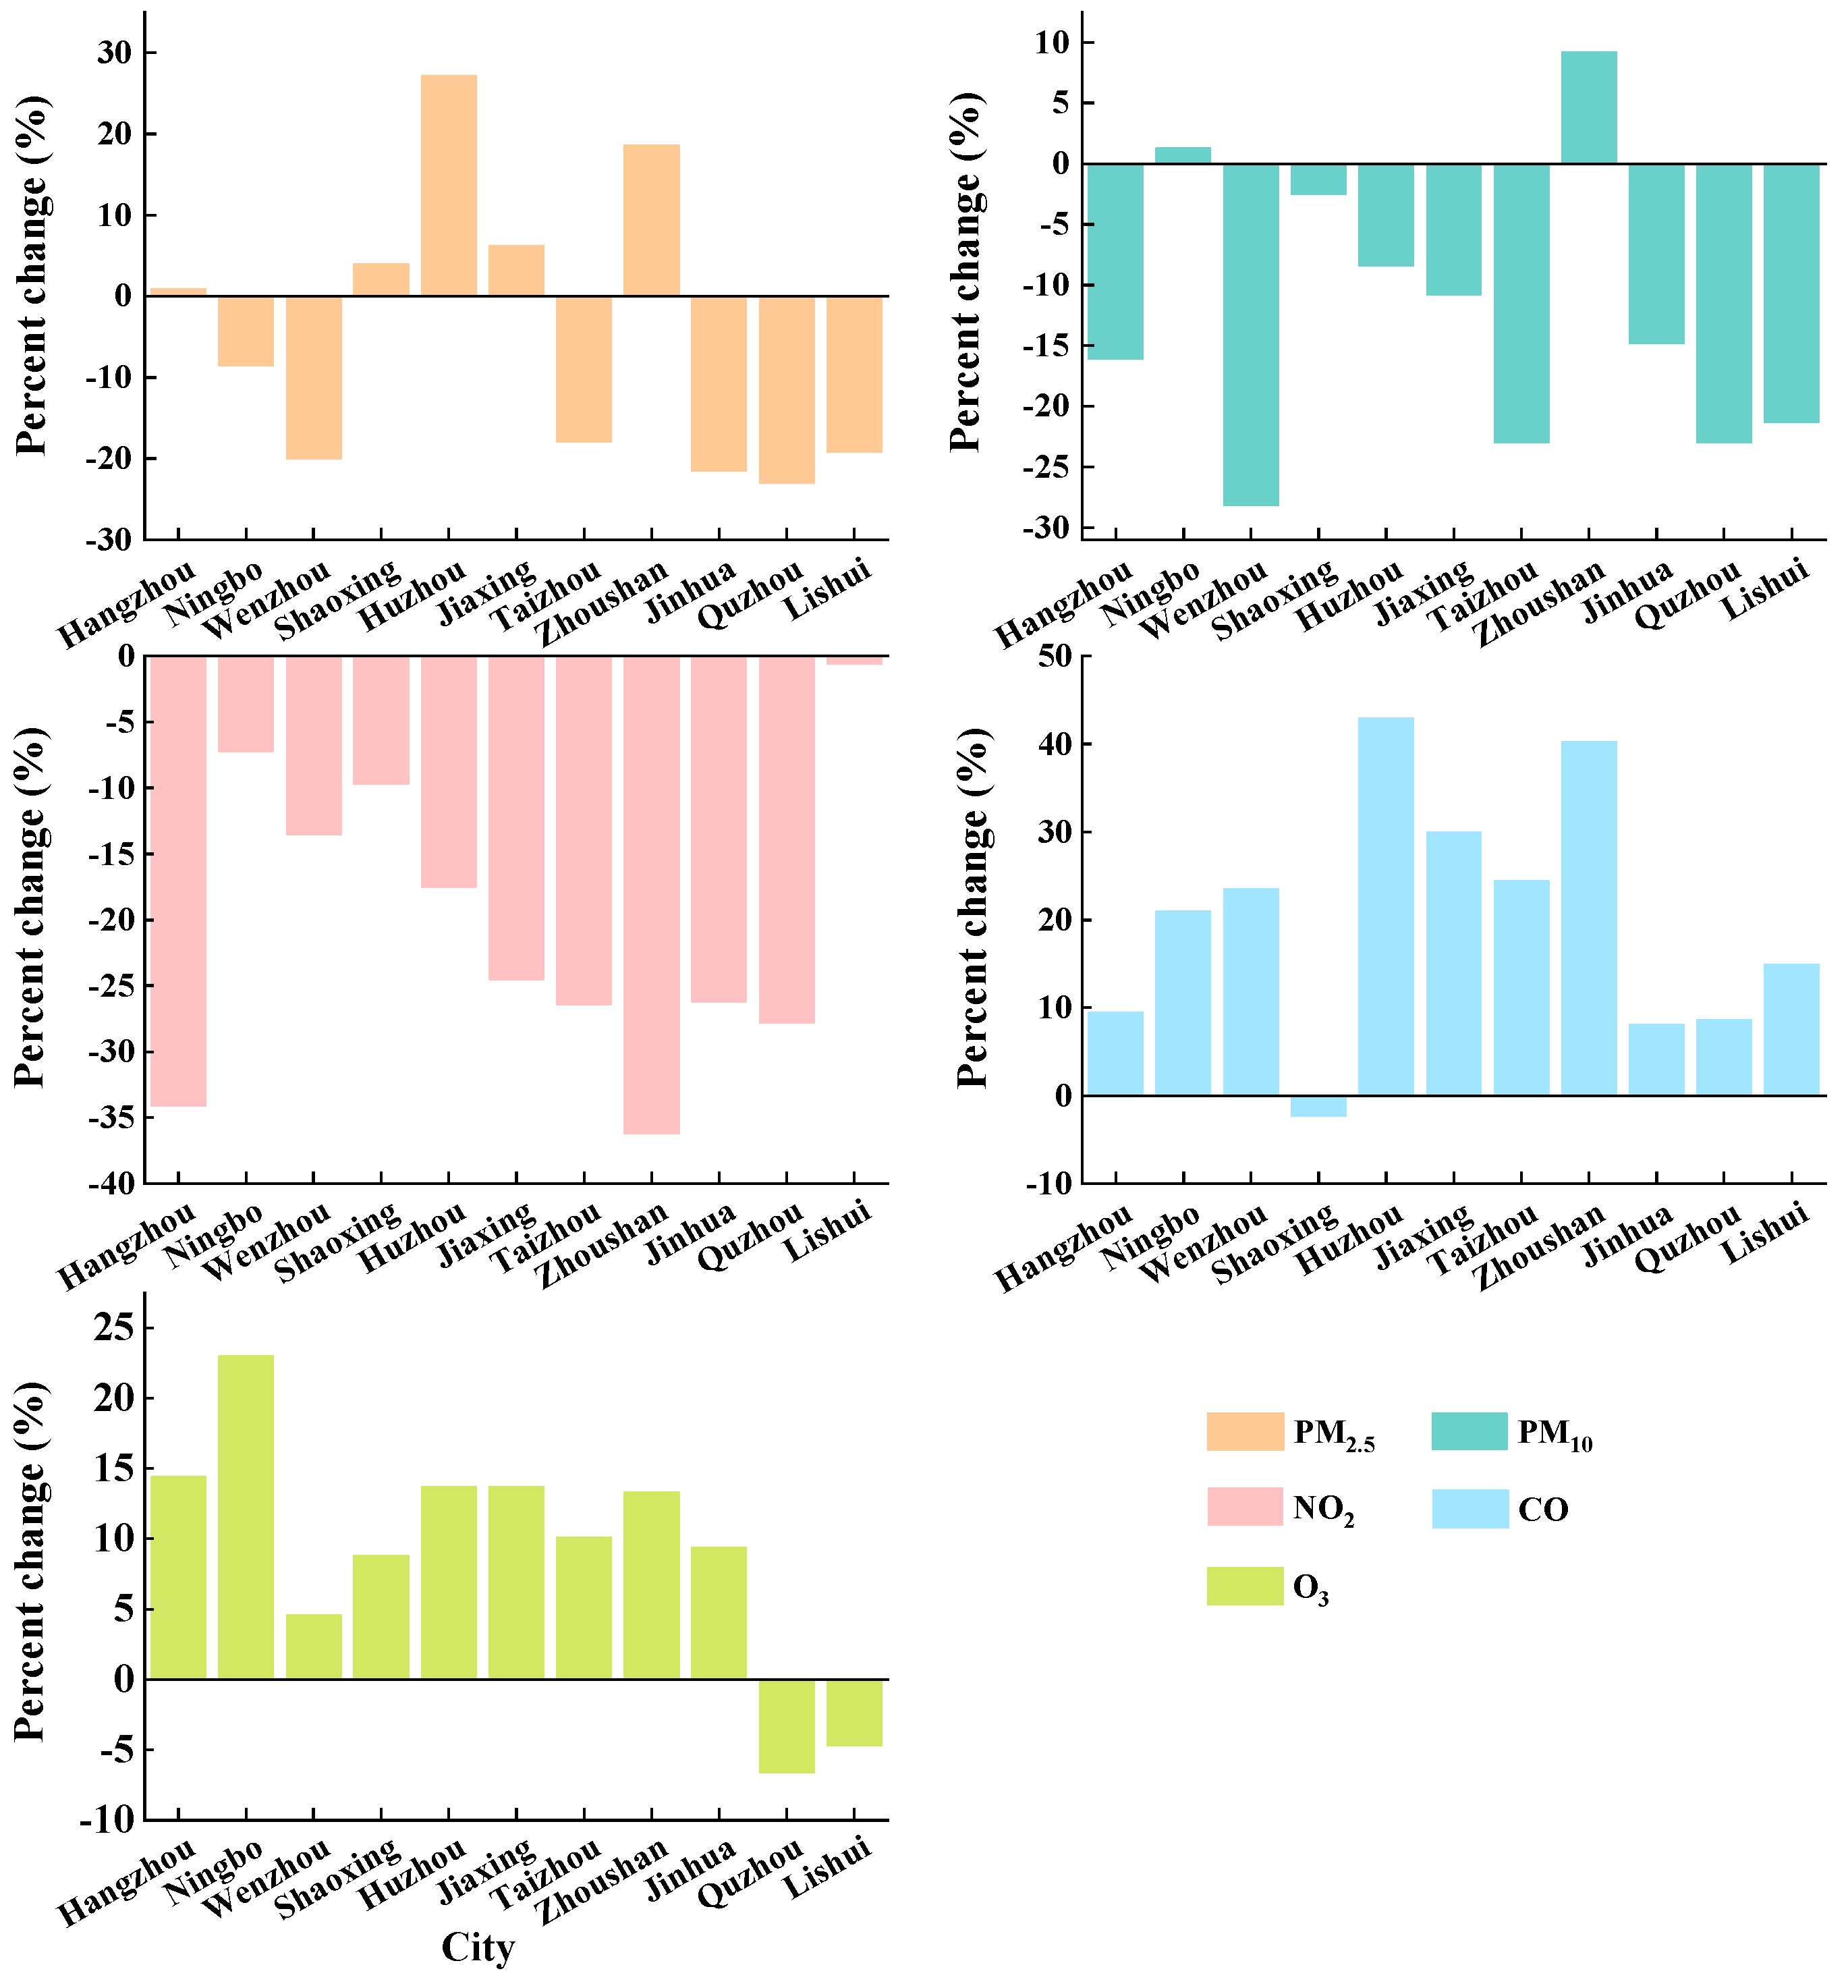
Figure 5 shows the changes in the concentrations of five pollutants in Hangzhou and its neighboring cities during the Asian Games and the same period in 2022. It can be seen that in the 11 cities of Zhejiang Province, the concentrations of the three pollutants, i.e., PM2.5, PM10, and NO2, showed an overall declining trend in 2023. This may be attributed to a series of air quality improvement measures implemented by the local government during the Asian Games around Hangzhou and its surrounding areas, such as restricting industrial emissions and promoting new energy vehicles. The implementation of these measures helped to reduce suspended particles and harmful gases in the atmosphere, thereby improving air quality. Specifically, 11 cities in Zhejiang Province saw reductions in PM2.5 concentrations ranging from −27.1% to 23.0%, PM10 concentrations ranging from −9.2% to 28.2%, and NO2 concentrations ranging from 0.6% to 36.2%. However, during this period, the concentrations of CO and O3 increased to varying degrees. The variation in CO concentration ranged from −42.9% to 2.3%, while the variation in O3 concentration ranged from −23% to 6.6%. These increases may be due to complex environmental factors and chemical reactions.
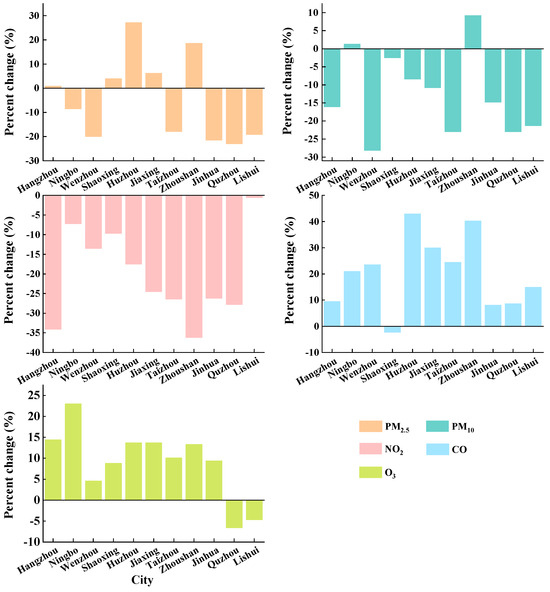
Figure 5.
The magnitude of variation in concentrations of five pollutants during the Asian Games period in Hangzhou and its surrounding areas compared to the same period in 2022.
It is noteworthy to mention that, although there were differences in the reduction of various pollutant concentrations across different cities, the average pollutant concentrations in all 11 cities in Zhejiang Province met the Grade I standard of China Atmospheric Air Quality Standards (CAAQS) during the Asian Games. This suggests that the air quality management measures in Zhejiang Province are effective in the short term, especially during large-scale events or conferences, and that urban air quality can be significantly improved through strict environmental regulation and control. However, the management of pollutants such as CO and O3 still requires further study, and more refined control strategies need to be adopted to ensure long-term air quality improvement.
3.2. Health Risk Assessment
Human exposure to air pollution, especially in heavily polluted areas, is likely to induce respiratory, cardiovascular, reproductive, and immune system diseases and may even lead to death [40,41]. Table 2 summarizes the health effects of PM2.5 and O3 in Hangzhou and its surrounding areas during the Asian Games period and the same period in 2022. Our study primarily focused on the health risk assessment of PM2.5 and O3 and did not involve other pollutants for several reasons. Firstly, research indicates that in recent years, air pollution in China is predominantly characterized by composite pollution led by PM2.5 and O3 [42]. Numerous studies have confirmed that PM2.5 and O3 are closely associated with all-cause and cardiovascular disease mortality, making them key indicators for evaluating the health impacts of air pollution. Secondly, during the study period from 23 September 2023 to 8 October 2023, although other pollutants such as PM10, NO2, and CO were also monitored, their concentrations were generally low and did not reach levels that significantly impact public health. Additionally, there are well-established research methods and models for assessing the health effects of PM2.5 and O3, enabling us to conduct more effective analyses and obtain reliable results.
Table 2.
The human health impacts of PM2.5 and O3 during the Asian Games Period in Hangzhou and its surrounding areas compared to the same period in 2022.
By evaluating the health risks of PM2.5 and O3 during the 2023 Hangzhou Asian Games, we found that the average total number of all-cause premature deaths in Zhejiang Province was 9112, of which 1780 were due to PM2.5 and were 159 fewer than that of the same period in 2022, which may be due to the decrease in the level of exposure of the population in the region or the influence of meteorological conditions. The number of all-cause deaths due to O3 is 7332, up 198 from the same period in 2022, which is correlated with a certain increase in O3 concentrations in 2023. In addition, the impact of air pollution on specific diseases needs to be further analyzed. During the Asian Games, the total number of deaths from cardiovascular diseases was 3972, of which 795 were caused by PM2.5, which is also a percentage decrease compared to 866 in the same period in 2022. On the contrary, the number of cardiovascular deaths caused by O3 increased by 86 cases compared with 3091 cases in the same period in 2022. From the data in the table, it can be seen that O3 has a much greater impact on human health than PM2.5, which may be because O3 is directly related to cardiovascular and neurological diseases. O3 is highly oxidative and generates a large number of reactive oxygen species when it is inhaled, resulting in oxidative damage, which in turn triggers oxidative stress [43]. These reactions can damage vascular endothelial cells. These reactions can damage the endothelial cells of blood vessels and lead to vasoconstriction, thus causing cardiovascular diseases such as thrombosis and atherosclerosis. PM2.5 mainly penetrates the lung defense system to reach the alveolar region, which is more likely to cause respiratory diseases. In a multi-pollutant model. Wang et al. [44] found that combined exposure to PM2.5 and O3 amplifies their individual impacts on cardiovascular mortality, indicating a synergistic effect of these pollutants on health.
Overall, the same pollutant can cause different levels of disease, and the health effects of different pollutants vary. Statistically, it can be observed that an increase of 1 µg/m3 in PM2.5 and O3 leads to a rise in all-cause mortality of 16.1% and 21.9%, respectively. This finding highlights the significant impact of changes in pollutant concentrations on population health and emphasizes the importance of maintaining low pollution levels.
3.2.1. Analysis of Health Effects of PM2.5 and O3 in Different Regions
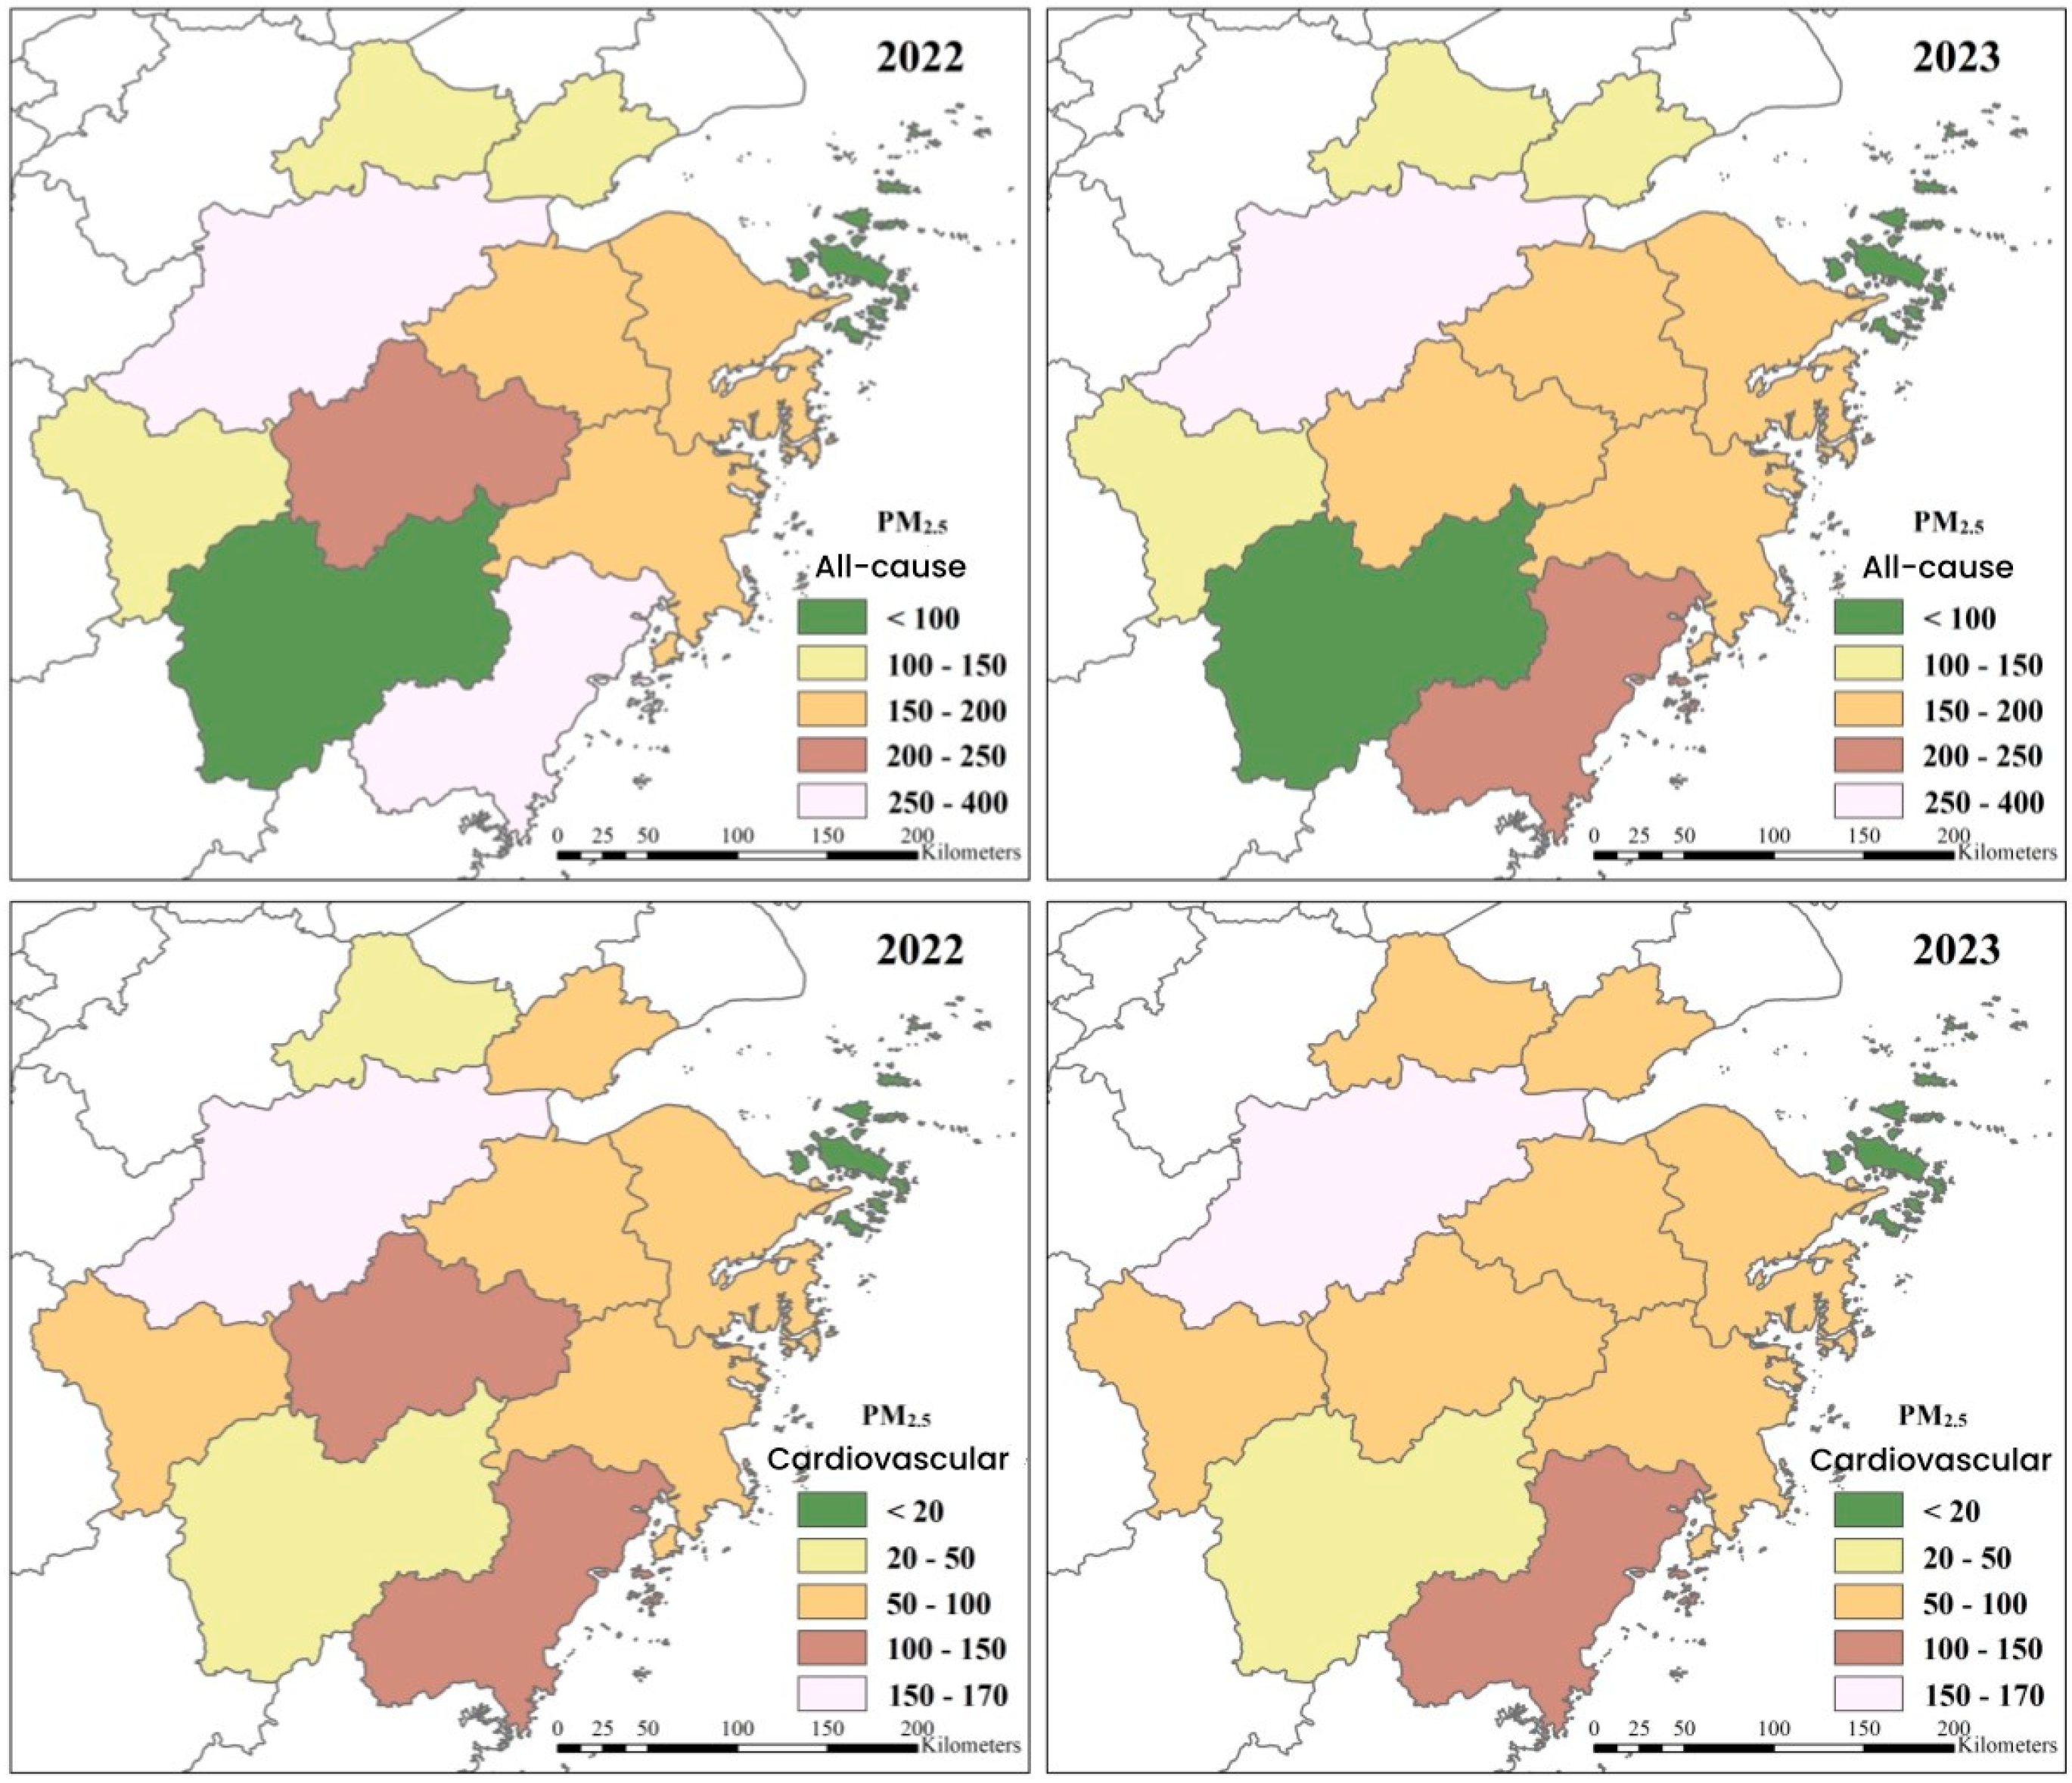
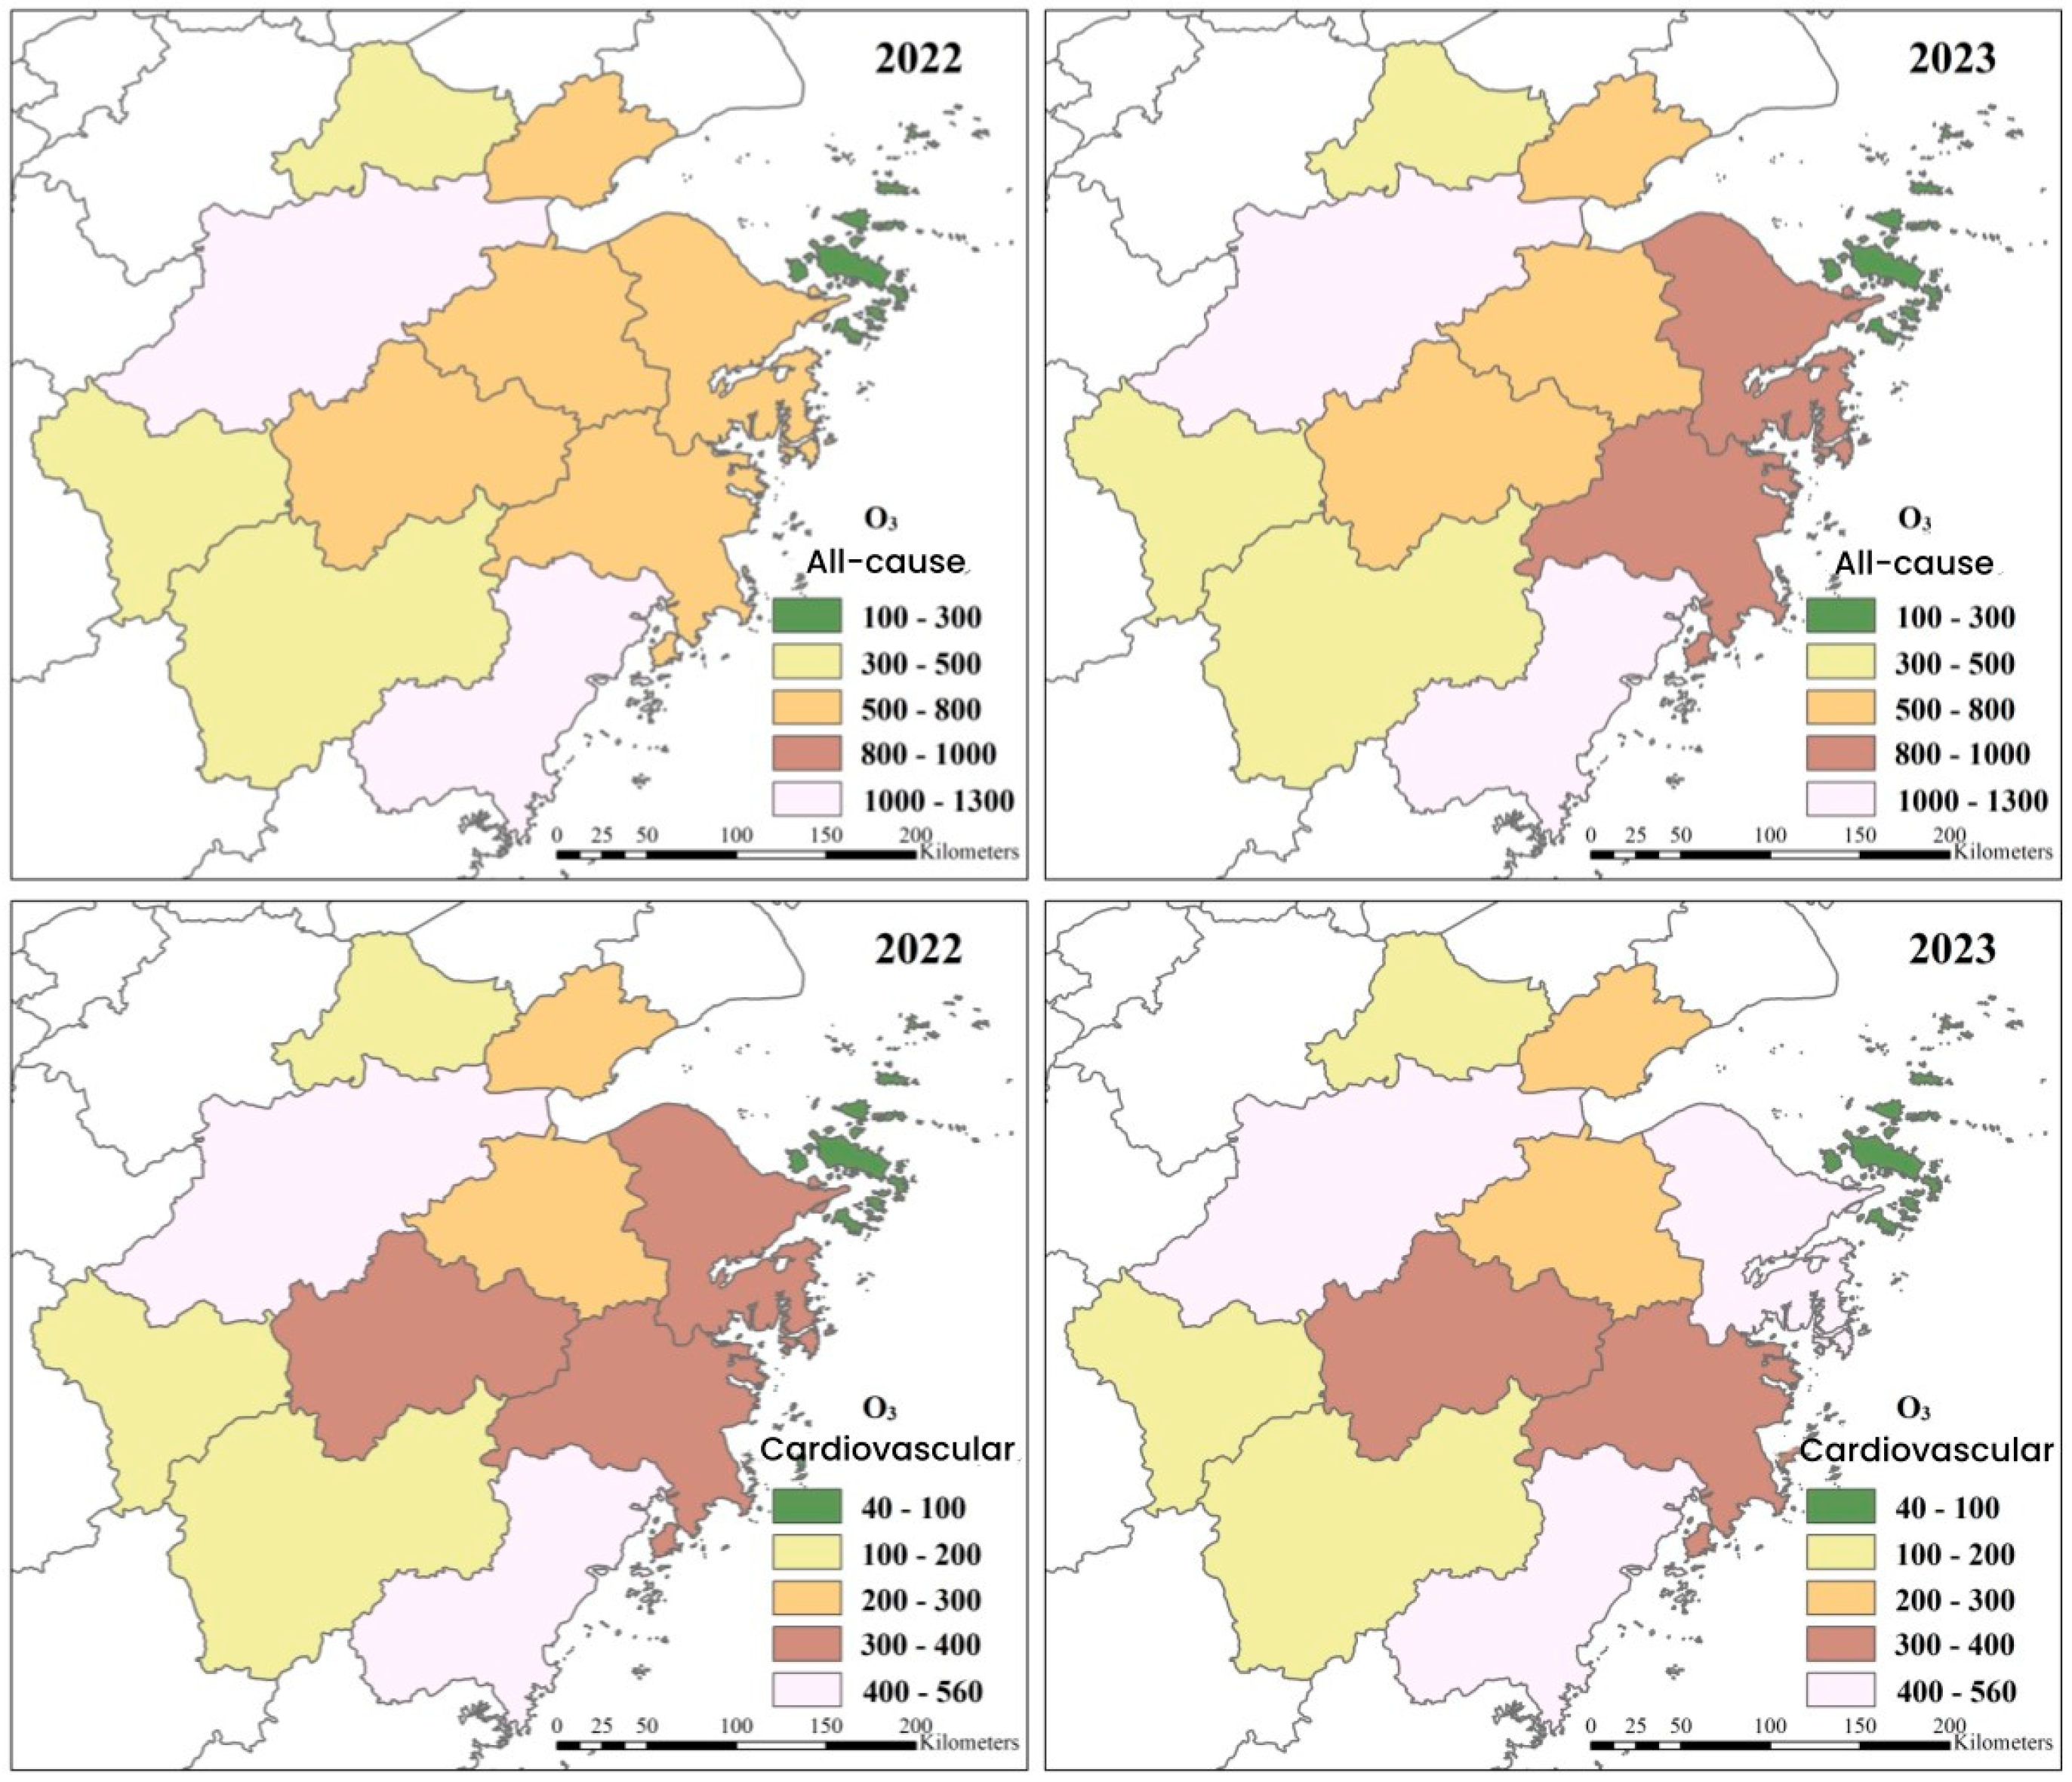
Figure 6 and Figure 7 show the health impacts of PM2.5 and O3 in Hangzhou and its surrounding areas during the Asian Games and the same period in 2022. It is easy to find that mortality caused by O3 generally exceeds that caused by PM2.5 in the 11 cities of Zhejiang Province. Among these, Hangzhou had the highest number of deaths from cardiovascular disease caused by O3 in 2023, totaling 542 deaths, followed by Wenzhou with an average of 491 premature deaths. The city with the least significant impact on population health from air pollution is Lishui, where the number of deaths caused by cardiovascular disease from PM2.5 is less than 50. Hangzhou has the highest mortality rate of all cities, primarily due to its largest exposed population. In addition, as an industrialized city, Hangzhou has high emissions of air pollutants, resulting in relatively severe health damage to its residents from ambient air pollutants.
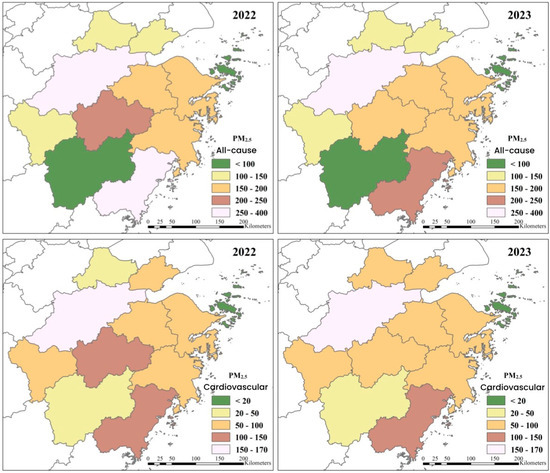
Figure 6.
The health effect of PM2.5 during the Asian Games period in Hangzhou and its surrounding areas compared with the same period in 2022.
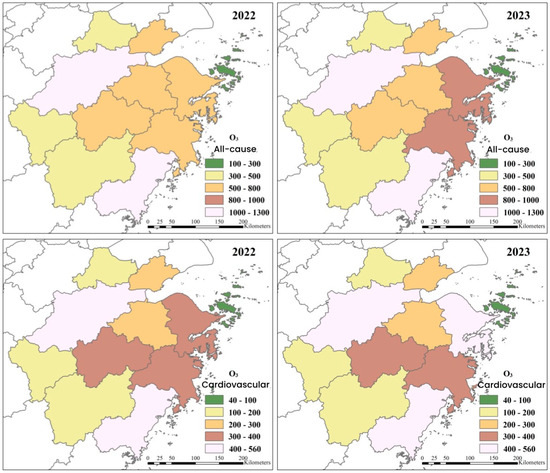
Figure 7.
The health impacts of O3 during the Asian Games period in Hangzhou and its surrounding areas compared with the same period in 2022.
3.2.2. Uncertainty Analysis
In this study, there are some uncertainties in the calculation of health effects, leading to errors in the calculation results. Firstly, there is some uncertainty in selecting the exposure–response coefficient (β). Although the consistency of the exposure–response relationship has been proven in previous studies, the differences in the health status of the population and the characteristics of the population in different regions lead to some bias in establishing the exposure–response relationship. In this study, β values obtained from the meta-analyses of numerous previous studies were used. Different coefficients were chosen for different health effects. In addition to the exposure–response coefficients, other calculation parameters, such as the reference concentration, may also introduce a certain degree of uncertainty into the assessment results. Currently, there is no uniform threshold concentration standard for the health effects of pollutants. In this study, the natural background concentrations of PM2.5 and O3 were used as the threshold concentrations for health risk assessments.
Secondly, the choice of indicators also affects the results of the health risk assessment. In this study, O3 and PM2.5 were chosen as indicator pollutants, but other particulate matter such as PM10 also have health effects. Additionally, all-cause mortality and cardiovascular disease mortality were chosen as health effect indicators, but the long-term effects and other diseases were neglected. Besides mortality, hospitalization rates and consultation rates are also indicators of health effects [45].
Finally, the choice of the exposure–response function is also uncertain. In air pollution exposure–response function modeling, the stability of the model is influenced by the uncertainty in the parameters used, which, in addition to the uncertainty in the coefficients of the relationship between the exposure assessment and the exposure–response, are also affected by the availability of baseline health data for the population, the choice of reference concentrations, etc.
4. Conclusions
- (1)
- During the 2023 Asian Games in Hangzhou, the concentrations of PM10 and NO2 in Hangzhou and the surrounding cities decreased by 16.1% and 34.1%, respectively, compared with the same period in 2022. Although the concentrations of PM2.5, CO, and O3 increased, the overall magnitude was small, and the number of deaths due to short-term exposure to PM2.5 decreased, indicating the effectiveness of air quality management measures.
- (2)
- From a spatial point of view, during the Asian Games period, compared with the same period in 2022, the PM2.5 concentration in Quzhou City decreased most significantly, by 23.0%, and the concentration in Huzhou City increased the most, by 27.1%. For PM10 concentration, Wenzhou city had the highest decrease of 28.2%, and Zhoushan city had the largest increase of 9.2%. NO2 concentration decreased in the whole of Zhejiang Province, and the largest decrease was in Zhoushan City, reaching 36.2%. Shaoxing was the only city where the concentration of CO pollutants decreased, with a reduction of 2.3%, while Huzhou City had the largest increase, with an increase of 42.9%. In terms of O3, the largest decrease was in Quzhou with 6.6%, while the largest increase was in Ningbo with 23%.
- (3)
- The results of the health impact assessment showed that the number of deaths from all-cause and cardiovascular disease due to short-term exposure to PM2.5 during the Asian Games was 1780 and 795, respectively, both of which decreased by 8.2% compared with the same period in 2022. The number of deaths from all-cause and cardiovascular due to exposure to O3 was 7332 and 3177, respectively, both representing an increase of 2.8% compared with the same period in 2022.
- (4)
- This study on the data and results of the air quality and health risks in Hangzhou and surrounding cities during the Asian Games’ emission reduction measures has various practical applications. These include guiding policy formulation, establishing warning systems, and optimizing urban planning and construction projects. This not only contributes to improving environmental quality and public health but also provides valuable experience and references for other cities facing similar challenges.
Author Contributions
Methodology, J.H., J.W., Y.H. and H.Z.; Validation, J.H.; Formal analysis, J.H.; Investigation, J.W.; Data curation, H.Z.; Writing—original draft, J.H., J.W. and H.Z.; Writing—review & editing, J.H., Y.H. and H.Z. All authors have read and agreed to the published version of the manuscript.
Funding
This work was supported by the National Natural Science Fund (No. 42307142) and the Graduate Practical Innovation Program Project of the Jiangsu University of Technology (XSJCX24_97).
Institutional Review Board Statement
Not applicable.
Informed Consent Statement
Not applicable.
Data Availability Statement
The data presented in this study are available upon request from the corresponding author. The data are not publicly available due to privacy.
Conflicts of Interest
The authors declare no conflicts of interest.
References
- Schiavo, B.; Meza-Figueroa, D.; Vizuete-Jaramillo, E.; Robles-Morua, A.; Angulo-Molina, A.; Reyes-Castro, P.A.; Lnguaggiato, C.; Gonzalez-Grijalva, B.; Pedroza-Montero, M. Oxidative potential of metal-polluted urban dust as a potential environmental stressor for chronic diseases. Environ. Geochem. Health 2023, 45, 3229–3250. [Google Scholar] [CrossRef] [PubMed]
- Kelly, F.J.; Fussell, J.C. Air pollution and public health: Emerging hazards and improved understanding of risk. Environ. Geochem. Health 2015, 37, 631–649. [Google Scholar] [CrossRef] [PubMed]
- Tang, J.Y.; McNabola, A.; Misstear, B. The potential impacts of different traffic management strategies on air pollution and public health for a more sustainable city: A modelling case study from Dublin, Ireland. Sustain. Cities Soc. 2020, 60, 102229. [Google Scholar] [CrossRef]
- Du, Y.; You, S.; Liu, W.; Basang, T.; Zhang, M. Spatiotemporal evolution characteristics and prediction analysis of urban air quality in China. Sci. Rep. 2023, 13, 8907. [Google Scholar] [CrossRef] [PubMed]
- Gui, K.; Che, H.Z.; Wang, Y.Q.; Wang, H.; Zhang, L.; Zhao, H.J.; Zheng, Y.; Sun, T.Z.; Zhang, X.Y. Satellite-derived PM2.5 concentration trends over Eastern China from 1998 to 2016: Relationships to emissions and meteorological parameters. Environ. Pollut. 2019, 247, 1125–1133. [Google Scholar] [CrossRef] [PubMed]
- Ma, X.Y.; Jia, H.L.; Sha, T.; An, J.L.; Tian, R. Spatial and seasonal characteristics of particulate matter and gaseous pollution in China: Implications for control policy. Environ. Pollut. 2019, 248, 421–428. [Google Scholar] [CrossRef]
- Gao, M.; Liu, Z.; Zheng, B.; Ji, D.S.; Sherman, P.; Song, S.J.; Xin, J.Y.; Liu, C.; Wang, Y.S.; Zhang, Q.; et al. China’s emission control strategies have suppressed unfavorable influences of climate on wintertime PM2.5 concentrations in Beijing since 2002. Atmos. Chem. Phys. 2020, 20, 1497–1505. [Google Scholar] [CrossRef]
- Tao, M.H.; Wang, L.L.; Chen, L.F.; Wang, Z.F.; Tao, J.H. Reversal of aerosol properties in Eastern China with rapid decline of anthropogenic emissions. Remote Sens. 2020, 12, 523. [Google Scholar] [CrossRef]
- Maji, K.J.; Namdeo, A. Continuous increases of surface ozone and associated premature mortality growth in China during 2015–2019. Environ. Pollut. 2021, 269, 116183. [Google Scholar] [CrossRef]
- Qian, H.Q.; Xu, S.D.; Cao, J.; Ren, F.Z.; Wei, W.D.; Meng, J.; Wu, L.B. Air pollution reduction and climate co-benefits in China’s industries. Nat. Sustain. 2021, 4, 417–425. [Google Scholar] [CrossRef]
- Zhang, X.R.; Xiao, X.; Wang, F.; Brasseur, G.; Chen, S.Y.; Wang, J.; Gao, M. Observed sensitivities of PM2.5 and O3 extremes to meteorological conditions in China and implications for the future. Environ. Int. 2022, 168, 107428. [Google Scholar] [CrossRef] [PubMed]
- Zhang, Y.; Xu, J.M.; Wang, Y.; Su, B.S.; Wu, Y.X.; Hu, T.T.; Liu, R. Characteristics, meteorological impacts and potential sources of persistent ozone pollution events in Beijing-Tianjin-Hebei Region during 2015–2020. China Environ. Sci. 2023, 43, 2714–2721. [Google Scholar]
- He, J.J.; Gong, S.L.; Yu, Y.; Yu, L.J.; Wu, L.; Mao, H.J.; Song, C.B.; Zhao, S.P.; Liu, H.L.; Li, X.Y.; et al. Air pollution characteristics and their relation to meteorological conditions during 2014–2015 in major Chinese cities. Environ. Pollut. 2017, 223, 484–496. [Google Scholar] [CrossRef] [PubMed]
- Wang, M.; Zheng, Y.F.; Liu, Y.J.; Li, Q.P.; Ding, Y.H. Characteristics of ozone and its relationship with meteorological factors in Beijing-Tianjin-Hebei Region. China Environ. Sci. 2019, 39, 2689–2698. [Google Scholar]
- Schiavo, B.; Morton-Bermea, O.; Arredondo-Palacios, T.E.; Meza-Figueroa, D.; Robles-Morua, A.; Robles-Morua, R.; Valera-Fernández, D.; Inguaggiato, C.; Gonzalez-Grijalva, B. Analysis of COVID-19 Lockdown Effects on Urban Air Quality: A Case Study of Monterrey, Mexico. Sustainability 2022, 15, 642. [Google Scholar] [CrossRef]
- Qu, Y.W.; Wang, T.J.; Yuan, C.; Wu, H.; Gao, L.B.; Huang, C.W.; Li, Y.S.; Li, M.M.; Xie, M. The underlying mechanisms of PM2.5 and O3 synergistic pollution in East China: Photochemical and heterogeneous interactions. Sci. Total Environ. 2023, 873, 162434. [Google Scholar] [CrossRef] [PubMed]
- Shen, F.Z.; Zhang, L.; Jiang, L.; Tang, M.Q.; Gai, X.Y.; Chen, M.D.; Ge, X.L. Temporal variations of six ambient criteria air pollutants from 2015 to 2018, their spatial distributions, health risks and relationships with socioeconomic factors during 2018 in China. Environ. Int. 2020, 137, 105556. [Google Scholar] [CrossRef]
- Han, S.J.; Wang, J.; Yan, Q.S.; Yang, L.M.; Zhao, Q.Y.; Wang, S.B.; Li, C.; Zhang, Y.S.; Zhang, R.Q. Health benefit evaluation for PM10 and PM2.5 pollution control in Zhengzhou, China, 2014–2016. Environ. Sci. 2019, 40, 2565–2571. [Google Scholar]
- Li, L.; Lei, Y.L.; Wu, S.M.; Chen, J.B.; Yan, D. The health economic loss of fine particulate matter PM2.5 in Beijing. J. Clean. Prod. 2017, 161, 1153–1161. [Google Scholar] [CrossRef]
- Xin, J.Y.; Wang, Y.S.; Tang, G.Q.; Wang, L.L.; Sun, Y.; Wang, Y.H.; Hu, B.; Song, T.; Ji, D.H.; Wang, W.F. Variability and reduction of atmospheric pollutants in Beijing and its surrounding area during the Beijing 2008 Olympic Games. Chin. Sci. Bull. 2010, 55, 1512–1521. [Google Scholar] [CrossRef]
- Zhao, H.; Zheng, Y.F.; Wu, X.Y.; Wu, J.M. Variation and analysis of air pollutants concentration in Nanjing during the Youth Olympic Games. Environ. Chem. 2015, 34, 824–831. [Google Scholar]
- Xie, F.J.; Li, W.Q.; Mou, Y.Y.; Xie, Y.S. Impact of Pollution Reduction on Air Quality During Nanjing Youth Olympic Games. Environ. Sci. Manag. 2016, 41, 94–98. [Google Scholar]
- Huang, W.; Xie, Y.S.; Li, Z.Q.; Zhang, Y.; Li, D.H.; Li, K.T.; Li, L.; Xu, H. Remotes Sensing Estimation of Aerosol Conmosition during APEC Forum in Beijing 2014. J. Atmos. Environ. Opt. 2015, 10, 278–285. [Google Scholar]
- Liu, Q.C.; Huang, J.; Guo, B.; Guo, X.B. Investigation of emission control measures’impacts on air pollutants in Beijing during the 2014 Asia-Pacific Economic Cooperation. Cap. Public Health 2017, 11, 220–224. [Google Scholar]
- Zhao, H.; Zheng, Y.F.; Wei, L.; Guan, Q.; Wang, Z.S. Evolution and evaluation of air quality in Hangzhou and its surrounding areas during the G20 Summit. China Environ. Sci. 2017, 37, 2016–2024. [Google Scholar]
- Seo, J.H.; Jeon, H.W.; Sung, U.J.; Sohn, J.R. Impact of the COVID-19 outbreak on air quality in Korea. Atmosphere 2020, 11, 1137. [Google Scholar] [CrossRef]
- Xu, K.J.; Cui, K.P.; Young, L.H.; Hsieh, Y.K.; Wang, Y.F.; Zhang, J.J.; Wan, S. Impact of the COVID-19 event on air quality in central China. Aerosol Air Qual. Res. 2020, 20, 915–929. [Google Scholar] [CrossRef]
- Berman, J.D.; Ebisu, K. Changes in US air pollution during the COVID-19 pandemic. Sci. Total Environ. 2020, 739, 139864. [Google Scholar] [CrossRef]
- WHO. Air Quality Guidelines for Particulate Matter, Ozone, Nitrogen Dioxide and Sulfur Dioxide; WHO: Geneva, Switzerland, 2006. [Google Scholar]
- Hu, X.; Yu, K.A.; Zhang, G.C.; Lin, C.S.; Jiang, F.Y.; Xu, L. Analysis of the impact of meteorological factors and air pollution on respiratory mortality in Ningbo region. Zhejiang Meteorol. 2019, 40, 22–27,42. [Google Scholar]
- Zhu, Y.J.; Liu, Y.F.; Liu, X.; Wang, H.K. Carbon mitigation and health effects of fleet electrification in China’s Yangtze River Delta. Environ. Int. 2023, 180, 108203. [Google Scholar] [CrossRef]
- Maji, K.J.; Ye, W.F.; Arora, M.; Nagendra, S.S. PM2.5-related health and economic loss assessment for 338 Chinese cities. Environ. Int. 2018, 121, 392–403. [Google Scholar] [CrossRef] [PubMed]
- Hu, J.L.; Huang, L.; Chen, M.D.; Liao, H.; Zhang, H.L.; Wang, S.X.; Zhang, Q.; Ying, Q. Premature mortality attributable to particulate matter in China: Source contributions and responses to reductions. Environ. Sci. Technol. 2017, 51, 9950–9959. [Google Scholar] [CrossRef] [PubMed]
- GBD 2013 Mortality and Causes of Death Collaborators. Global, regional, and national age-sex specific all-cause and cause-specific mortality for 240 causes of death, 1990–2013: A systematic analysis for the Global Burden of Disease Study 2013. Lancet 2015, 385, 117–171. [Google Scholar] [CrossRef] [PubMed]
- Koçak, M.; Mihalopoulos, N.; Kubilay, N. Contributions of natural sources to high PM10 and PM2.5 events in the eastern Mediterranean. Atmos. Environ. 2007, 41, 3806–3818. [Google Scholar] [CrossRef]
- Tsutsumi, Y.; Mori, K.; Ikegami, M.; Tashiro, T.; Tsuboi, K. Long-term trends of greenhouse gases in regional and background events observed during 1998–2004 at Yonagunijima located to the east of the Asian continent. Atmos. Environ. 2006, 40, 5868–5879. [Google Scholar] [CrossRef]
- Louie, P.K.K.; Watson, J.G.; Chow, J.C.; Chen, A.; Sin, D.W.M.; Lau, A.K.H. Seasonal characteristics and regional transport of PM2.5 in Hong Kong. Atmos. Environ. 2005, 39, 1695–1710. [Google Scholar]
- Ling, H.; Wang, Y.H.; Hu, B.; Zhu, R.H.; Wang, Y.S. Observation and research on carbon monoxide in the atmosphere of beijing during the summer time of 2007. Environ. Chem. 2009, 28, 567–570. [Google Scholar]
- Ma, Z.Q.; Wang, Y.S.; Sun, Y.; Ji, D.S.; Hu, B. Characteristics of ozone and oxides of nitrogen in Beijing and Xianghe County. Environ. Chem. 2007, 26, 832–837. [Google Scholar]
- Li, B.X.; Yang, J.; Dong, H.; Li, M.M.; Cai, D.J.; Yang, Z.; Zhang, C.L.; Wang, H.; Hu, J.L.; Bergmann, S.; et al. PM2.5 constituents and mortality from a spectrum of causes in Guangzhou, China. Ecotoxicol. Environ. Saf. 2021, 222, 112498. [Google Scholar] [CrossRef]
- Zhang, Y.; Wang, S.G.; Fan, X.G.; Ye, X.F. Temperature modulation of the health effects of particulate matter in Beijing, China. Environ. Sci. Pollut. Res. 2018, 25, 10857–10866. [Google Scholar] [CrossRef]
- Zhao, H.; Chen, K.Y.; Liu, Z.; Zhang, Y.X.; Shao, T.; Zhang, H.L. Coordinated control of PM2.5 and O3 is urgently needed in China after implementation of the “Air pollution prevention and control action plan”. Chemosphere 2021, 270, 129441. [Google Scholar] [CrossRef] [PubMed]
- Voter, K.Z.; Whitin, J.C.; Torres, A.; Morrow, P.E.; Cox, C.; Tasi, T.; Utell, M.J.; Frampton, M.W. Ozone exposure and the production of reactive oxygen species by bronchoalveolar cells in humans. Inhal. Toxicol. 2001, 13, 465–483. [Google Scholar] [CrossRef] [PubMed]
- Wang, D.S.; Dong, X.H.; Wang, J.X.; Shi, Y.H.; Zhang, H.Q.; Zhou, S.J.; Zhang, Y.J. Individual and interactive effects of atmospheric PM2.5 and O3 on mortality of circulatory system diseases in Ningxia. Environ. Occup. Med. 2024, 41, 25–33. [Google Scholar]
- Huo, R.; Ye, R.R.; Zhang, F.; Di, Z.L. Meta-analysis of the correlation between short-term exposure to six common air pollutants and the incidence of ischemic stroke. Environ. Occup. Med. 2023, 40, 184–189+195. [Google Scholar]
Disclaimer/Publisher’s Note: The statements, opinions and data contained in all publications are solely those of the individual author(s) and contributor(s) and not of MDPI and/or the editor(s). MDPI and/or the editor(s) disclaim responsibility for any injury to people or property resulting from any ideas, methods, instructions or products referred to in the content. |
© 2024 by the authors. Licensee MDPI, Basel, Switzerland. This article is an open access article distributed under the terms and conditions of the Creative Commons Attribution (CC BY) license (https://creativecommons.org/licenses/by/4.0/).