Article

Study on Mapping and Identifying Risk Areas for Multiple Particulate Matter Pollution at the Block Scale Based on Local Climate Zones

Liaoning Provincial Key Laboratory of Urban and Architectural Digital Technology, JangHo Architecture College, Northeastern University, Shenyang 110819, China
*
Author to whom correspondence should be addressed.
Atmosphere 2024, 15(7), 794; https://doi.org/10.3390/atmos15070794
Submission received: 28 May 2024 / Revised: 25 June 2024 / Accepted: 29 June 2024 / Published: 30 June 2024
(This article belongs to the Special Issue Urban and Regional Nitrogen Cycle and Risk Management)

Abstract

:
As China’s urbanization process accelerates, the issue of air pollution becomes increasingly prominent and urgently requires improvement, based on the fact that environmental conditions such as meteorology and topography are difficult to change. Therefore, relevant optimization studies from the perspective of architectural patterns are operable to mitigate pollution. This paper takes the Wenhua Road block in Shenyang, China, as the research object; obtains the concentration data of three kinds of particulate matter through fixed and mobile monitoring; and analyzes the spatial distribution characteristics of Local Climate Zones ( LCZ) and particulate matter in the block based on the ArcGIS platform, identifies high-risk areas, and excavates the influence of LCZ on the concentrations of three kinds of particulate matter. The results show that the spatial distribution characteristics of PM1, PM2.5, and PM10 under the same pollution level are relatively similar, while the spatial heterogeneity of the distribution of the same particulate matter under different pollution levels is higher. The time-weighted results show that the PM1 pollution level in the block ranges from 44 to 51 μg/m³, PM2.5 ranges from 75 to 86 μg/m³, and PM10 ranges from 87 to 99 μg/m³. The pollution hot spots throughout the year are located in the central, eastern and western parts of the study area. In terms of the relationship between the LCZ and particulate matter, with the increase in the particulate matter diameter, the correlation between the three kinds of particulate matter and LCZ are all enhanced. The built-up LCZ always has a larger average concentration of particulate matter than that of the natural LCZ, and building height and building density are the main factors causing the difference. In the optimal design of the risk area, the proportion of natural vegetation or water surface should be increased and the building height should be properly controlled and the building density should be reduced in the renewal of the urban building form. This study will largely improve the spatial refinement of the optimization of urban architectural patterns oriented to mitigate particulate matter pollution.

1. Introduction

In recent decades, China’s rapid urbanization has changed the urban land use structure and building form characteristics [1], leading to ecological and air quality issues [2]. Among them, the influencing factors of air pollution are intricate and complex [3]. Under the premise that it is difficult to change the objective environmental factors such as topography and meteorology [4], mitigating the effect of particulate matter pollution from the urban design and architectural layout is a practical and feasible solution [5]. Atmospheric particulate matter is one of the main components of haze, and common atmospheric particulate matter is categorized into PM1, PM2.5, and PM10, according to their aerodynamic diameters [6]. These particulate matters of different sizes are harmful to the healthy living environment for people, and the smaller the diameter of the particulate matter, the more damaging it is to human health [7]. The influence of architectural forms on the dispersion of particulate matter has been confirmed [8]. Most of the existing studies are based on large-scale spatial simulation. Due to the high spatial heterogeneity of particulate matter distribution, it is necessary to carry out a small-scale study to obtain particulate matter pollution data at the block scale based on field monitoring. The introduction of the LCZ classification system can better distinguish the land use types in urban areas and better characterize the spatial features of the layout of architectural forms at the block scale [9,10], which is more closely related to the distribution of atmospheric particulate matter [11]. Therefore, it is necessary to explore the influence of 3D architectural forms on particulate matter dispersion from the LCZ perspective and realize the optimization of LCZ classes and architectural patterns based on particulate matter pollution mitigation. This study provides suggestions for the reduction of particulate matter pollution in urban design and building layout and for the regulation of urban construction and building layout. This has theoretical guiding significance for other urban blocks and even other urban construction and is of great significance for promoting the optimal control of neighborhood pollution exposure under the concept of a healthy city, the sustainable development of neighborhood construction, and the improvement of residents’ quality of life and health and well-being.
The coupled research on three-dimensional urban morphology and air pollution needs to consider the issue of scale diversity, and the analytical methods differ for particulate matter pollution studies at different scales. In general, the dispersion of urban particulate pollution occurs in small-scale atmospheric environments but is inevitably affected by large-scale atmospheric motions [12]. On the regional scale, the study of pollutant dispersion mainly adopts the MODIS remote sensing image inversion method, and the data source is mainly from MODIS aerosol products, which covers a wide range and has economic benefits and can realize long-term monitoring, but the spatial resolution of the data is relatively low [13]. On the urban scale, the spatial interpolation methods are often used for simulation. Pollutant concentration data are obtained from urban air quality monitoring stations. This method is simple in principle, easy to operate, and relatively easy to obtain data. However, in underdeveloped cities, the density of its monitoring stations is insufficient, which limits research, and there are fewer factors to consider, which can easily amplify the changes in extreme pollutant concentration values [14]. On the block scale, by obtaining data on pollutant concentration, topography, and pollution emissions, atmospheric numerical simulation methods are often used to simulate pollutant dispersion. The advantages of this method are its simple structure, fast calculation speed, and low requirements for basic data, making it applicable to small- and medium-scale research. However, this small-scale model cannot simulate the composite air pollution process well, and its simulation accuracy needs further consideration [15].
Combining the above research methods, research scales, and data acquisition, the influence of urban morphology on particulate matter dispersion at the current stage mainly focuses on large-scale research, with the model simulation as a main method and the data sources mainly being publicly available data from weather monitoring stations. Lu et al. [16] focused on the Yangtze River Delta (YRD) region in China, acquired a global PM2.5 concentration dataset, and analyzed the effects of different land use types and landscape pattern indicators on PM2.5 concentrations. At the meso-scale, Leen et al. [17] used PM2.5 sensors to collect air quality data in Hanoi, the capital of Vietnam, to assess the spatial distribution of PM2.5 at the urban scale and to explore changes in PM2.5 concentrations associated with urban morphology at the local climate zone scale. McCarty et al. [18] analyzed county-level data from 48 contiguous states in the contiguous U.S. mainland. By using available air quality monitoring data and remotely sensed land cover data, they explored the correlation between urban forms and air quality, particularly how urban morphology affects air quality in different types of county areas. On the micro scale, Jiang et al. [19] carried out a study of the relationship between urban morphology and air quality (wind speed, CO, and PM2.5) in two residential districts in the central area of Beijing. They utilized Computational Fluid Dynamics (CFD) [20] simulation technology to model the changes in microclimate and pollutant dispersion within the districts under different weather conditions and identified five main urban morphology parameters that affect pollutant dispersion and distribution. In summary, in today’s research on particulate matter, the research scale methodology and data acquisition as a whole are seriously affected by the spatial resolution, and the insufficient level of spatial refinement leads to the lack of relevant research results at the block scale. However, field monitoring can solve the above problems, and in recent years, more and more scholars have tended to use mobile monitoring methods to investigate the spatial variations of urban air quality [21,22]. However, field measurements of particle concentrations require significant manpower, resources, and financial investment. As a result, research conducted through field measurements remains few. In view of this research background and its limitations, this study analyzed the correlation between block-scale particulate matter obtained by field measurement and urban morphology, which is of great significance to enrich the high-precision and refined research on block-scale particulate matter pollution prevention and control [23].
Based on the background mentioned above, the correlation between urban morphology and particulate matter has been confirmed in many studies, but the majority of these studies have primarily focused on the urban scale. Due to the high spatial heterogeneity of particulate matter distribution, the results from large-scale studies may not be applicable to small-scale optimization designs. There is a lack of quantitative research at the block scale. In terms of data acquisition, existing studies have mostly investigated the impact of architectural patterns on particulate matter through model simulations. The main reason for the limitation of small-scale studies is that it is difficult to obtain pollution data of high spatiotemporal resolution and high-precision spatial data of environmental factors. Therefore, there is an urgent need for studies that utilize field measurements to obtain particulate matter data at the block scale. In terms of innovation, in the existing studies of the block scale, the introduction of the local climate zones (LCZs) system is not frequent, while the LCZs can visually reflect the architectural differentiation characteristics, so it is necessary to introduce and establish a comprehensive analysis of the LCZs system at the block scale. In conclusion, conducting research on multiple particulate pollution mapping and risk zone identification based on field measurements of pollutants from the LCZ perspective, and elucidating the correlation between LCZ classification and pollutant concentrations, would greatly enhance the spatial refinement of architectural pattern optimization aimed at mitigating particulate pollution.

2. Study Area and Research Methods

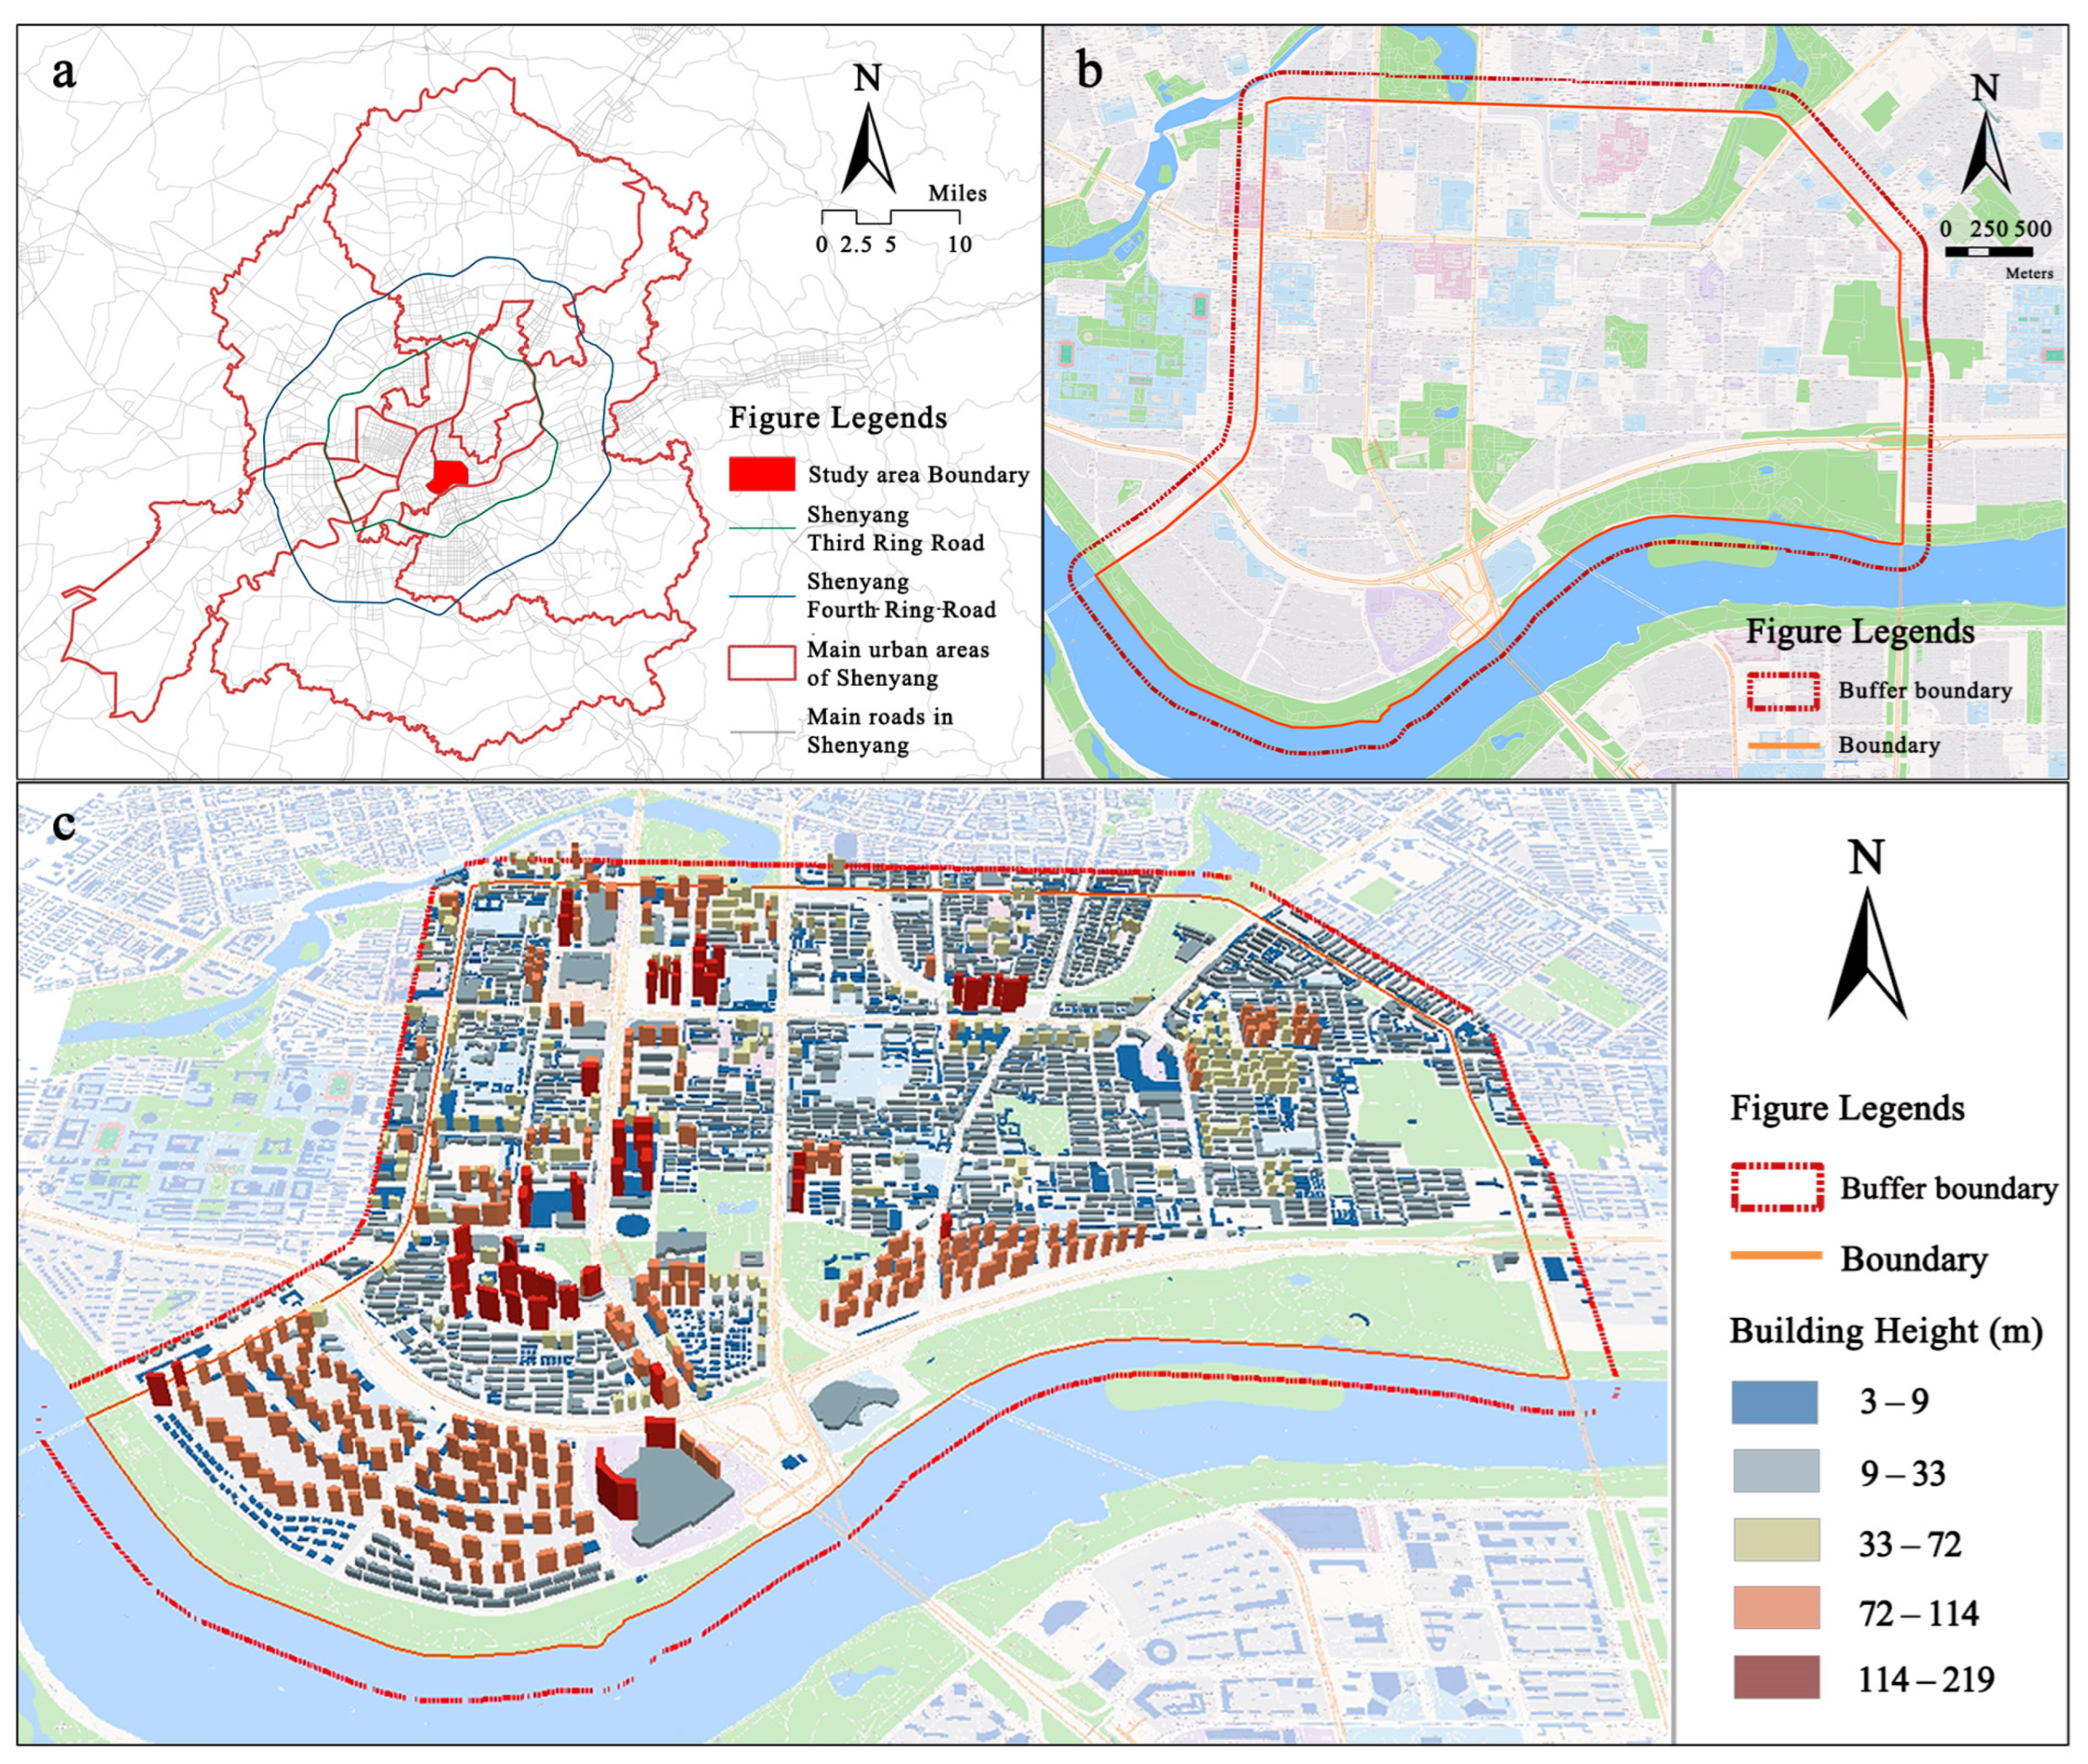
2.1. Overview of the Study Area

The study area is located in Shenyang, capital city of Liaoning Province in China (41°11′51″ N–43°02′13″ N, 122°25′09″ E–123°48′24″ E) (Figure 1a), which has a temperate continental climate with an average annual temperature of 8.4 °C and annual precipitation of 510-680 mm. Shenyang serves as an important heavy industrial base with abundant natural resources and a solid industrial foundation [24]. As the largest central city in Northeast China and one of the most significant industrial bases in the country, the air pollution of Shenyang is mainly caused by vehicle exhaust, fossil fuel combustion, industrial production, and urban construction [25]. As the urbanization progresses quickly and the environmental pollution becomes increasingly serious, air pollution—particulate matter pollution, in particular—urgently needs to be addressed [26]. According to the data, through the kernel density estimation, the PM2.5 in the Shenyang City area from 2000 to 2013 showed an increasing trend, with the annual average concentration up from 58.50 μg/m3 to 72.49 μg/m3; even though the PM2.5 had been curbed to a certain extent in the area from 2013 to 2022 because of the implementation of policies such as the Air Pollution Prevention and Control Action Plan, the annual average concentration remained high, making the situation unfavorable (Figure 2).
The Wenhua Road block in Shenyang has serious particulate matter pollution, and its air pollution index has been continuously high over the years. The land use types of the block are diverse, which are mainly residential land and commercial land, with green space, rivers, and land for education. In addition, the mix of high-, medium-, and low-rise staggered buildings shows its rich three-dimensional architectural form. Boundary 1 of the block (Figure 1b) is delimited by the city’s main roads, covering an area of 11.12 square kilometers. Considering the impact of the buildings on the periphery of Boundary 1 on the particulate matter in the block, existing studies have indicated that an architectural or urban design project can strongly influence air quality within its 200-m radius [27]. Therefore, a 200-m buffer zone was created based on Boundary 1, which serves as the research boundary in this study, with 13.33 square kilometers of total area (as shown in Figure 1c).

2.2. Data Sources and Preprocessing

In this study, air pollution data from 11 air quality monitoring stations in Shenyang during 2000–2022 were used, including 6 kinds of conventional monitoring pollutants concentration data, such as fine particulate matter (PM2.5), inhalable particulate matter (PM10), ozone (O3), nitrogen dioxide (NO2), sulfur dioxide (SO2), and carbon monoxide (CO). Rates are the daily mean values. Air pollution data were provided by the China National Environmental Monitoring Center (https://www.cnemc.cn, accessed on 1 March 2022), the U.S. Consulate General in Shenyang AQI (https://aqicn.org, accessed on 1 March 2022), and the Department of Ecological and Environment of Liaoning Province (https://sthj.ln.gov.cn, accessed on 1 March 2022). The land use data were obtained from the Land Use and Land-Cover Change (LUCC) dataset of Shenyang City in 2018 provided by the Resource and Environmental Science Data Platform (https://www.resdc.cn/, accessed on 1 May 2022). These data have a resolution of 30 m, which contains six main categories and eighteen subcategories.
The building vector data of Shenyang City in 2018 is sourced from the Baidu map (https://map.baidu.com/, accessed on 1 May 2022). The footprint data of buildings are represented in a polygonal vector, including the base outline and floors information. The building height is assumed to be 3 meters multiplied by the number of building floors. This data is verified by reference to Google Maps, supplemented by Baidu Maps panoramic imagery, and augmented by on-site and online research to add missing building footprints. In this case, the drawing of acquired building outlines and building floors is also refined so that more complete and accurate building information data in the study area is finally formed, with a total of 3171 individual buildings acquired.

2.3. Field Measurement

2.3.1. Monitoring Route Design

The data of the street-level particulate matter concentration are obtained by using fixed and mobile monitoring in the field. The monitoring activities were carried out for 7 days, including three typical particulate pollution situations in this area, to ensure the representativeness of the monitoring data. The specific monitoring steps are as follows:
(1)
Instrument setting: The detection instrument is a Sniffer4D Lingxiu V2 atmospheric monitoring system (made by Kefei Technology Co., LTD., Shenzhen, China, purchased from the network official platform), which can record the concentration of PM1, PM2.5, and PM10 particles with a time resolution of 1 s.
(2)
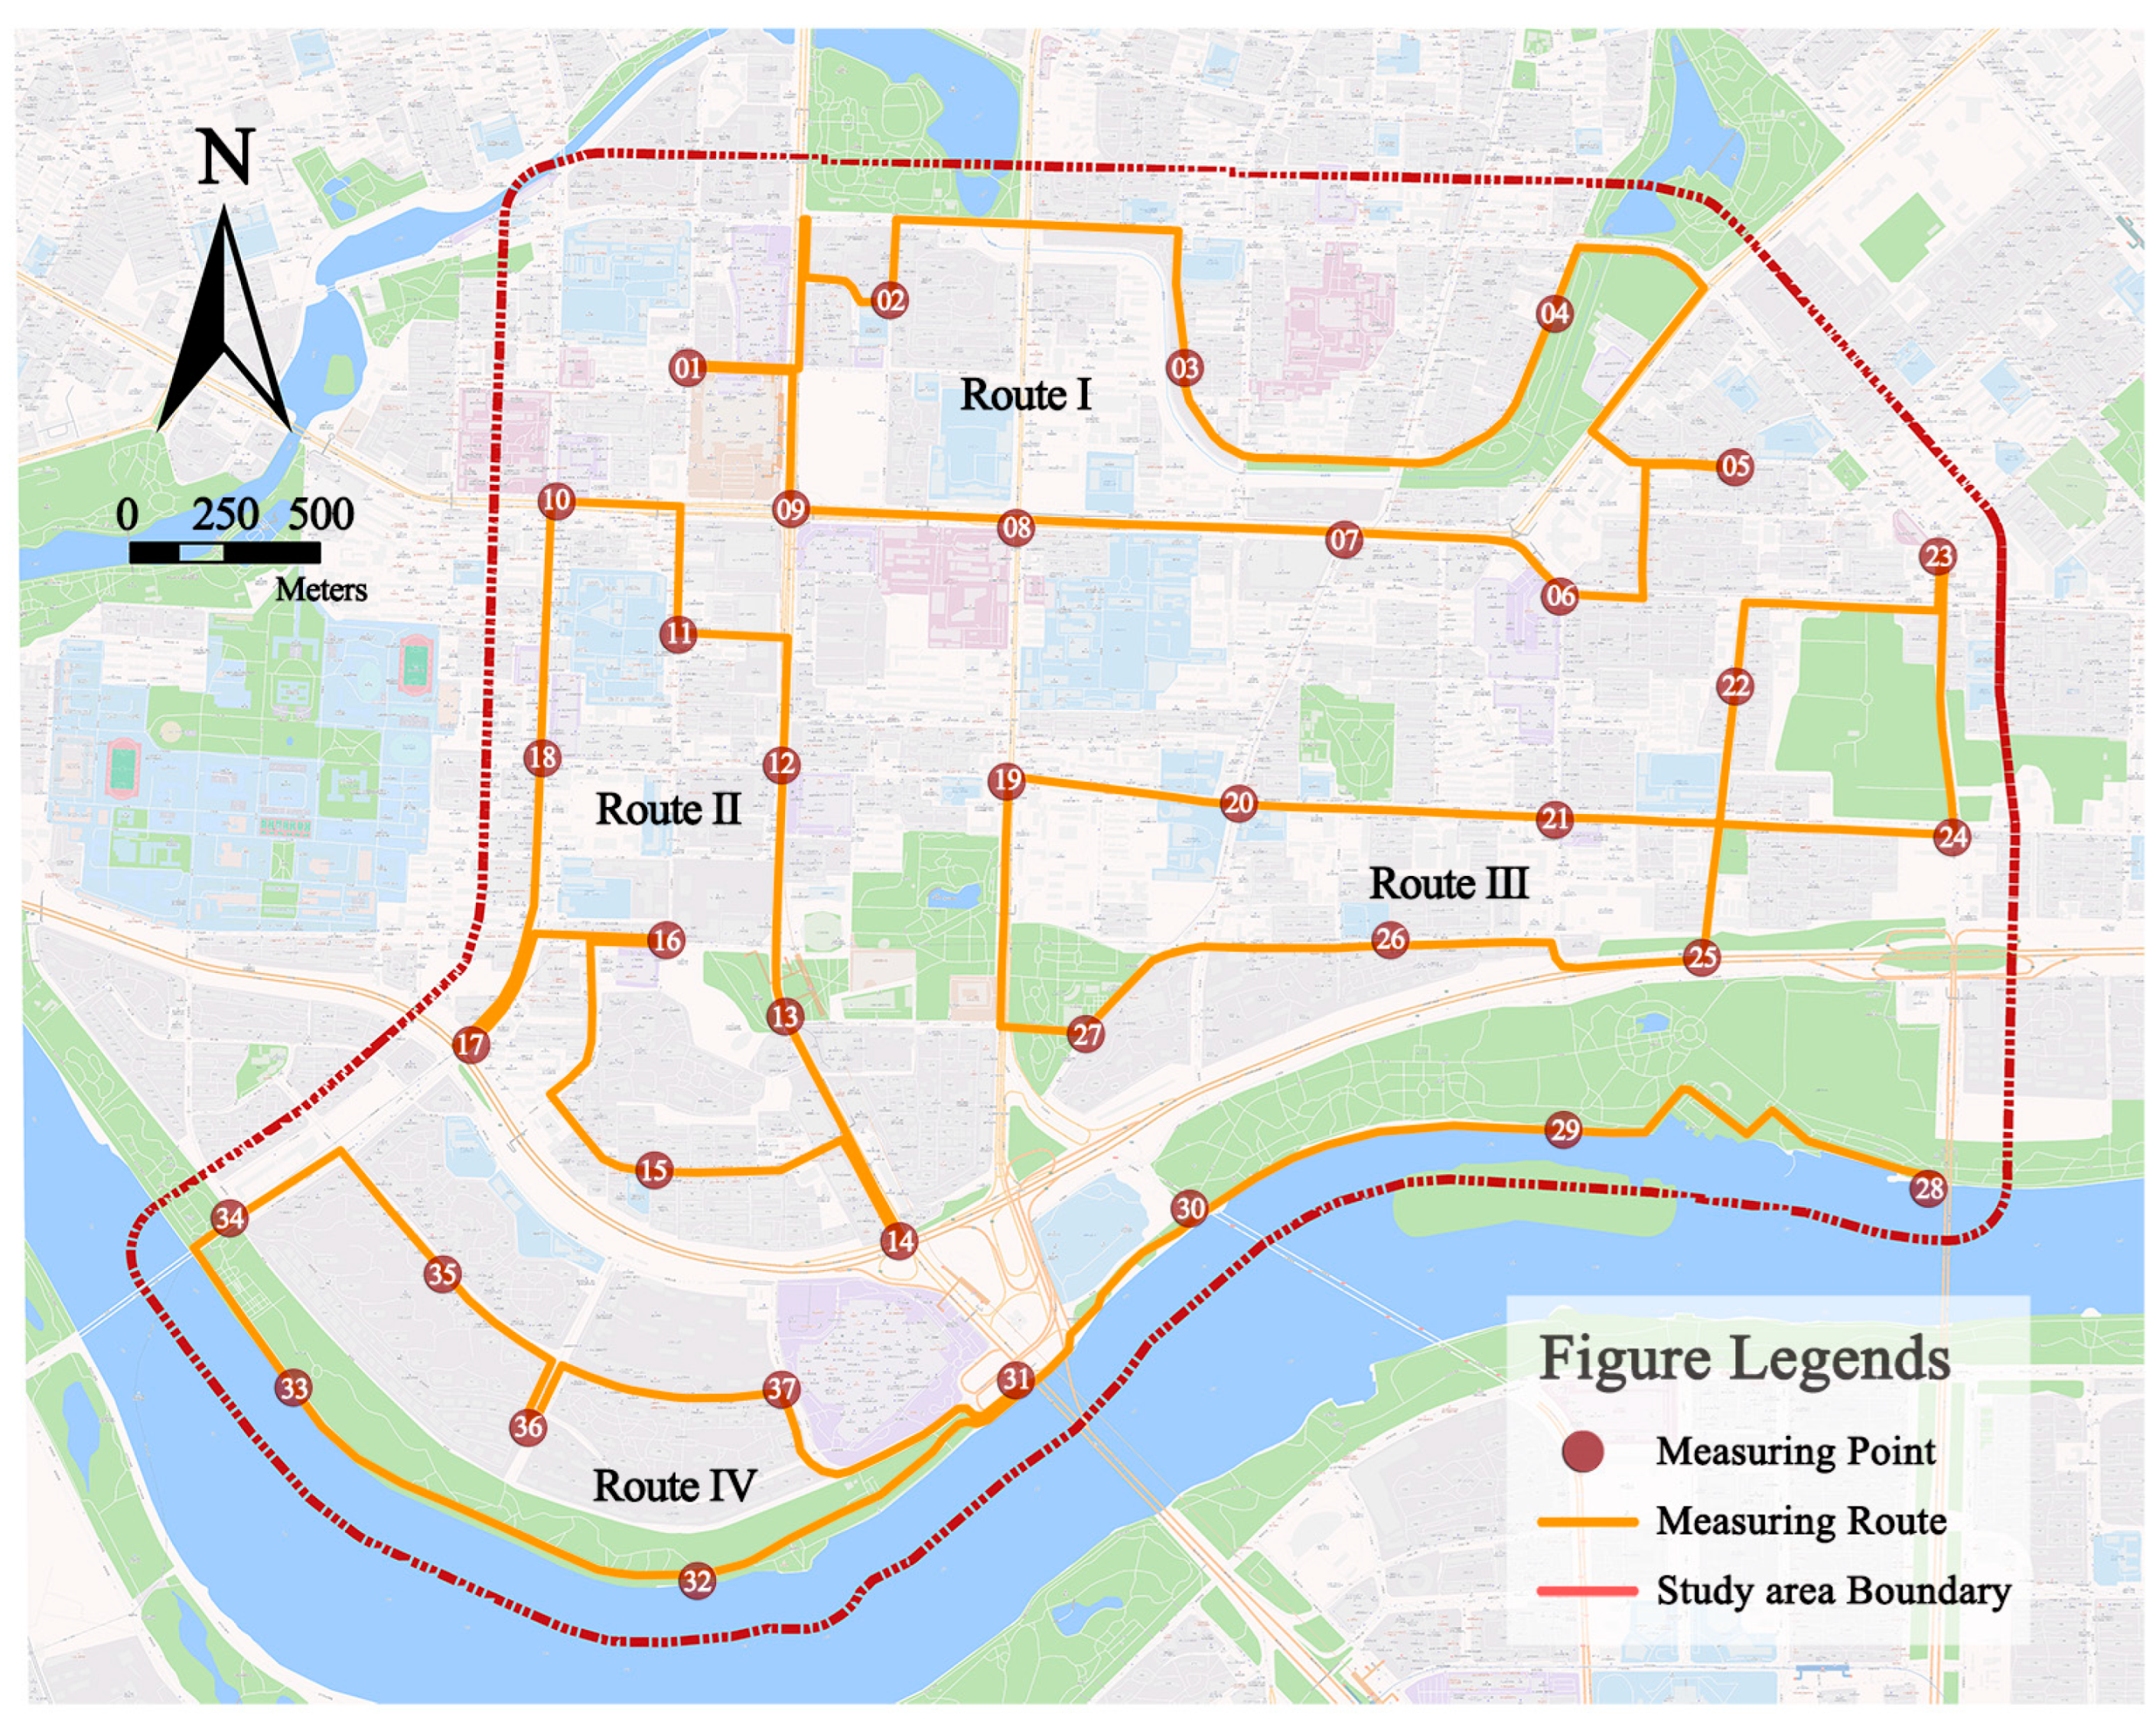
Layout of the monitoring points: Determine the layout of the monitoring points by combining field investigation and remote sensing. Considering the uniformity and representativeness of the distribution, 37 mobile monitoring stations are set up, which cover all LCZ types and are mainly located in the middle of intersections and roads for easy measurement.
(3)
Make the mobile monitoring route: The mobile monitoring is carried out at time intervals. These routes are connected in a series with all the monitoring points. Considering the monitoring length and staffing, four monitoring routes are designed (Figure 3) to ensure that the monitoring data of the particulate matter concentration in different LCZ can be obtained in the same time period.
(4)
Field measurement: The monitoring activity is from October 2022 to March 2023, and the times with good weather conditions are selected for actual measurement. The monitoring height is 1.5 m, and the time resolution is 1 s. The method of multi-cycle continuous repeated measurement is adopted, in which every 1.5 h is designated as a cycle, and the monitoring time is 8:00–11:00 in the morning and 14:00–17:00 in the afternoon, with four cycles measured every day. The specific implementation process is as follows: after the instrument is turned on, let it stand for 5 min to start measuring activities. Fix the monitoring instrument at the front of the electric vehicle, drive on the route during the monitoring period, stay at each monitoring point for 1 min, and repeat the measurement in multiple periods after completing a closed route.

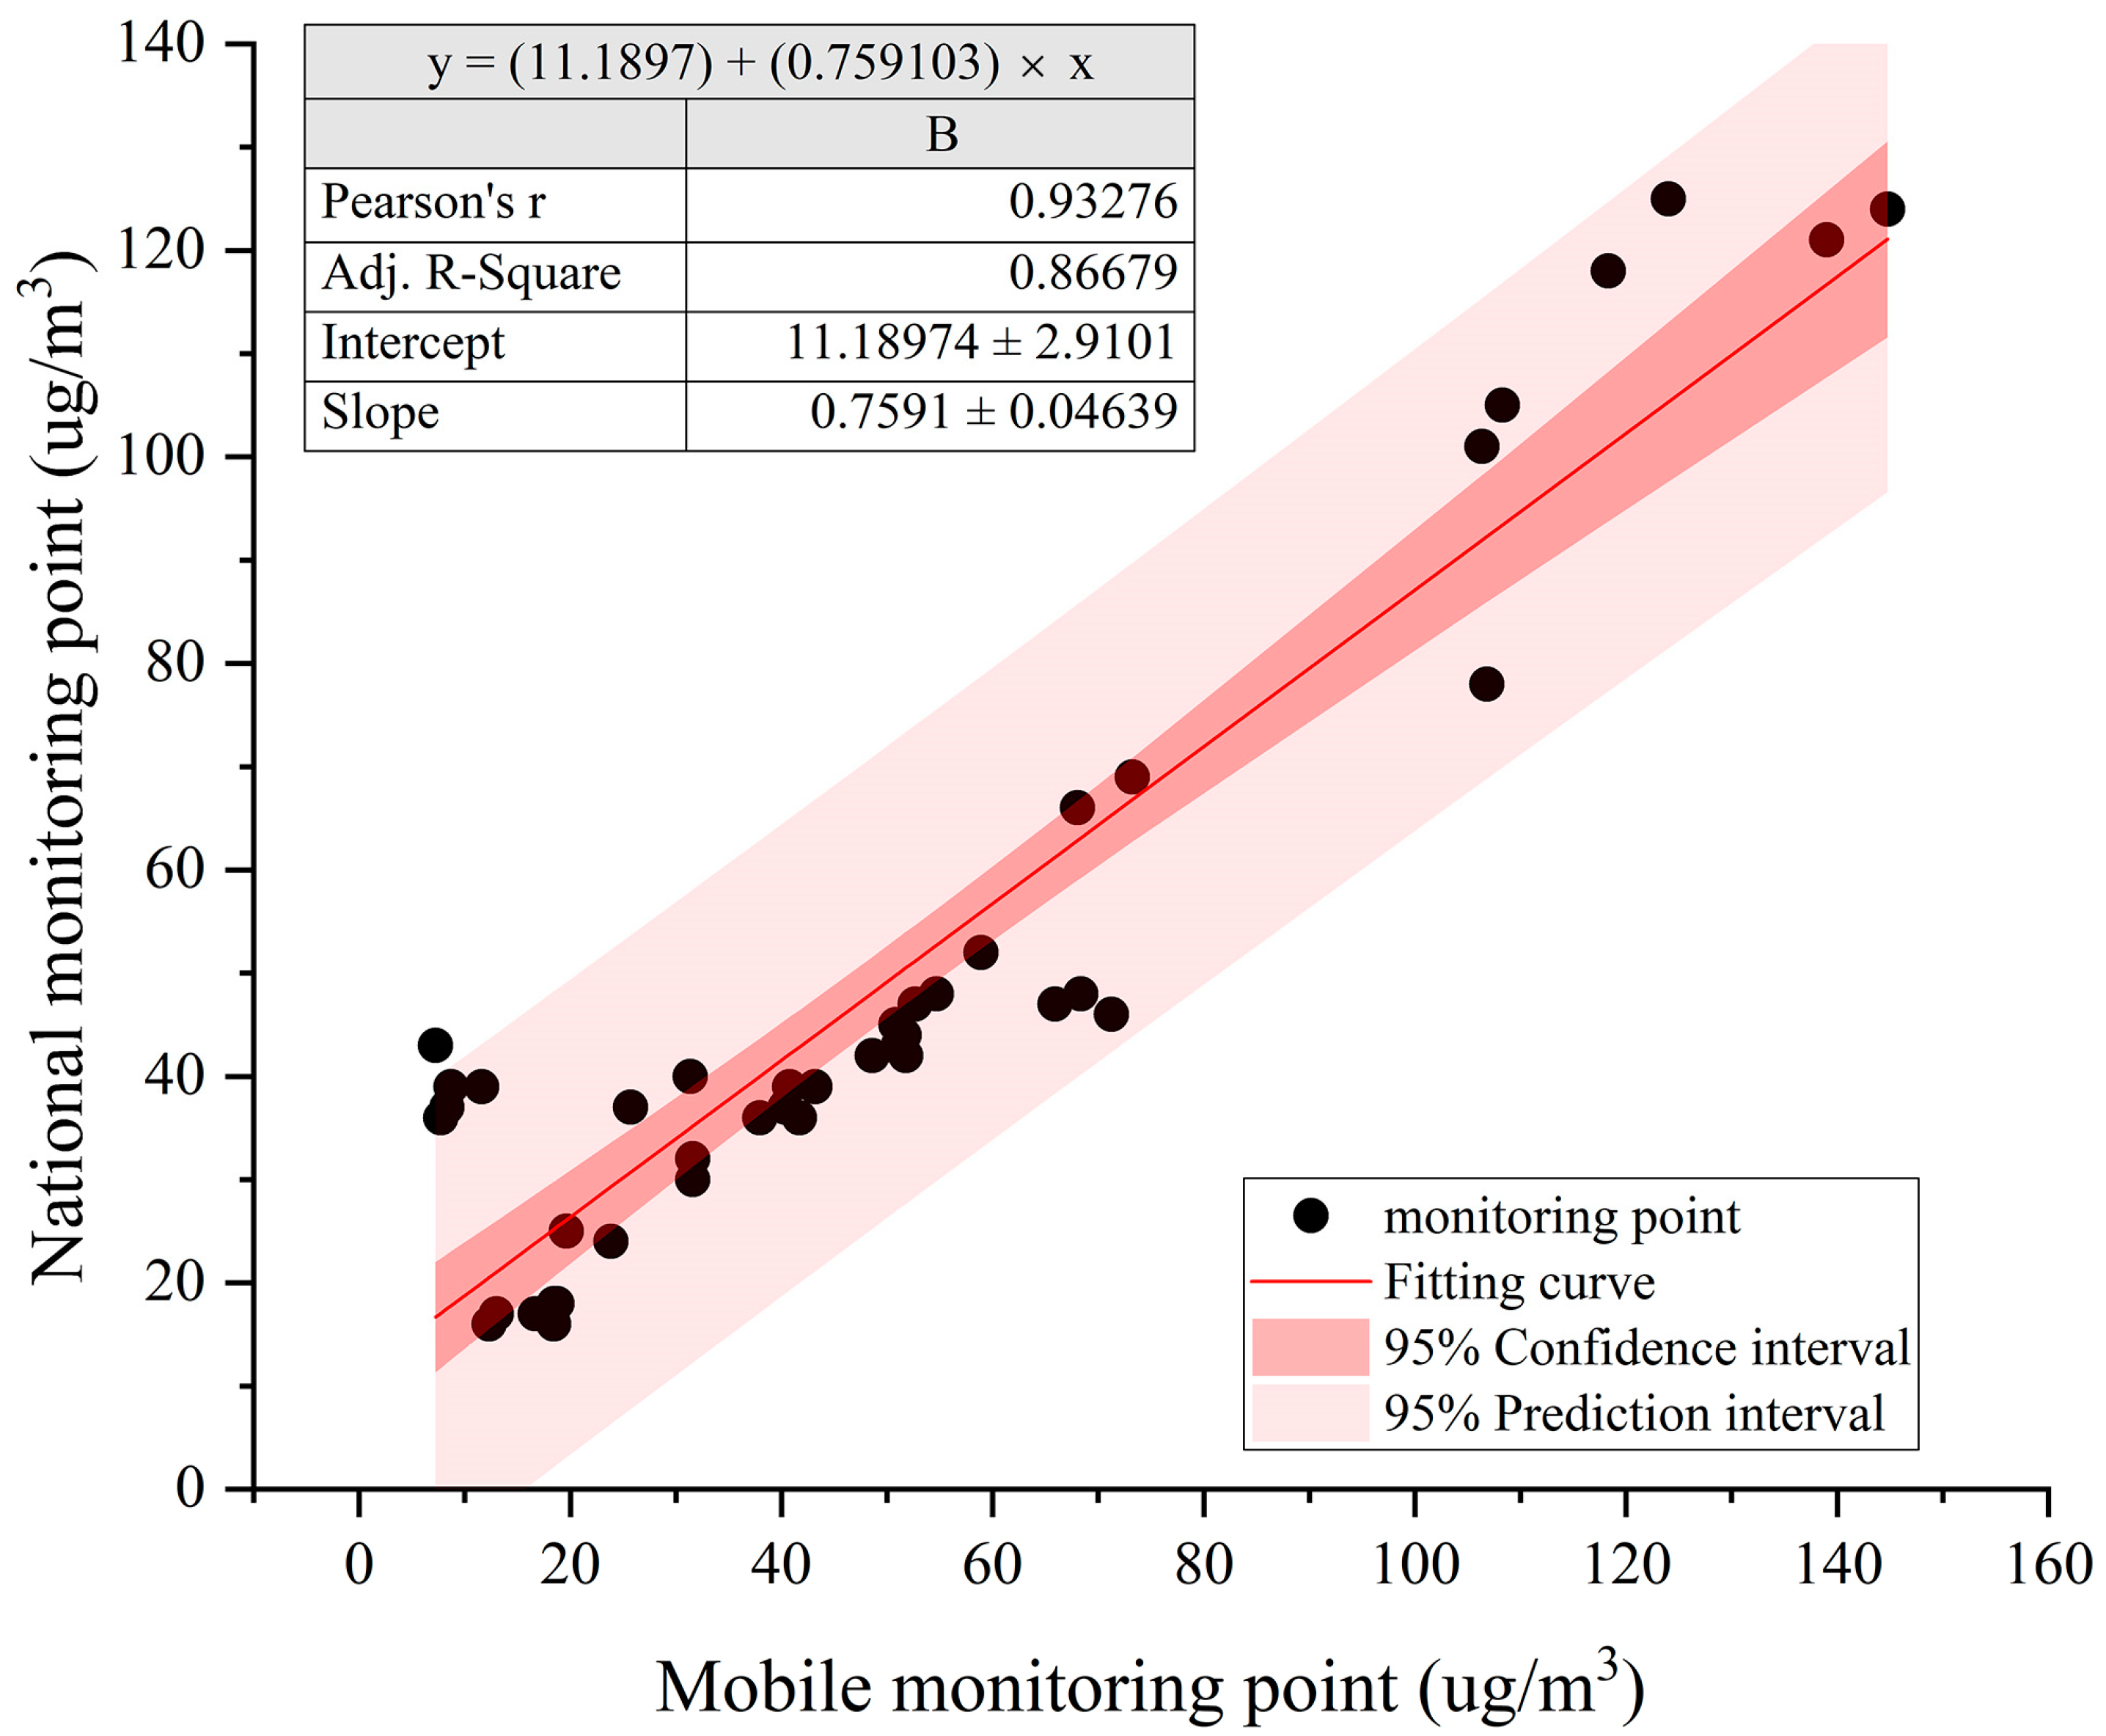
2.3.2. Quality Assurance and Quality Control of Particulate Matter Data

Before the monitoring activity begins, all instruments are placed in the same stable environment for three days for relative calibration. After the monitoring activities, all instruments were placed in the same stable environment for 3 days and absolutely calibrated with the public data of the Wenhua Road Meteorological Monitoring Station in the study area, and the obtained particulate matter concentration was fitted and corrected according to the calibration data. The collected data are visualized through a GIS platform, and the monitoring data within five minutes of startup are eliminated. At the same time, the abnormal high value and abnormal low value of each monitoring route in different time periods are eliminated, and the missing values are interpolated and replaced to ensure the integrity of the data. Overall, given these operations, the data in this study can be considered reliable and valid.

2.4. Research Methods

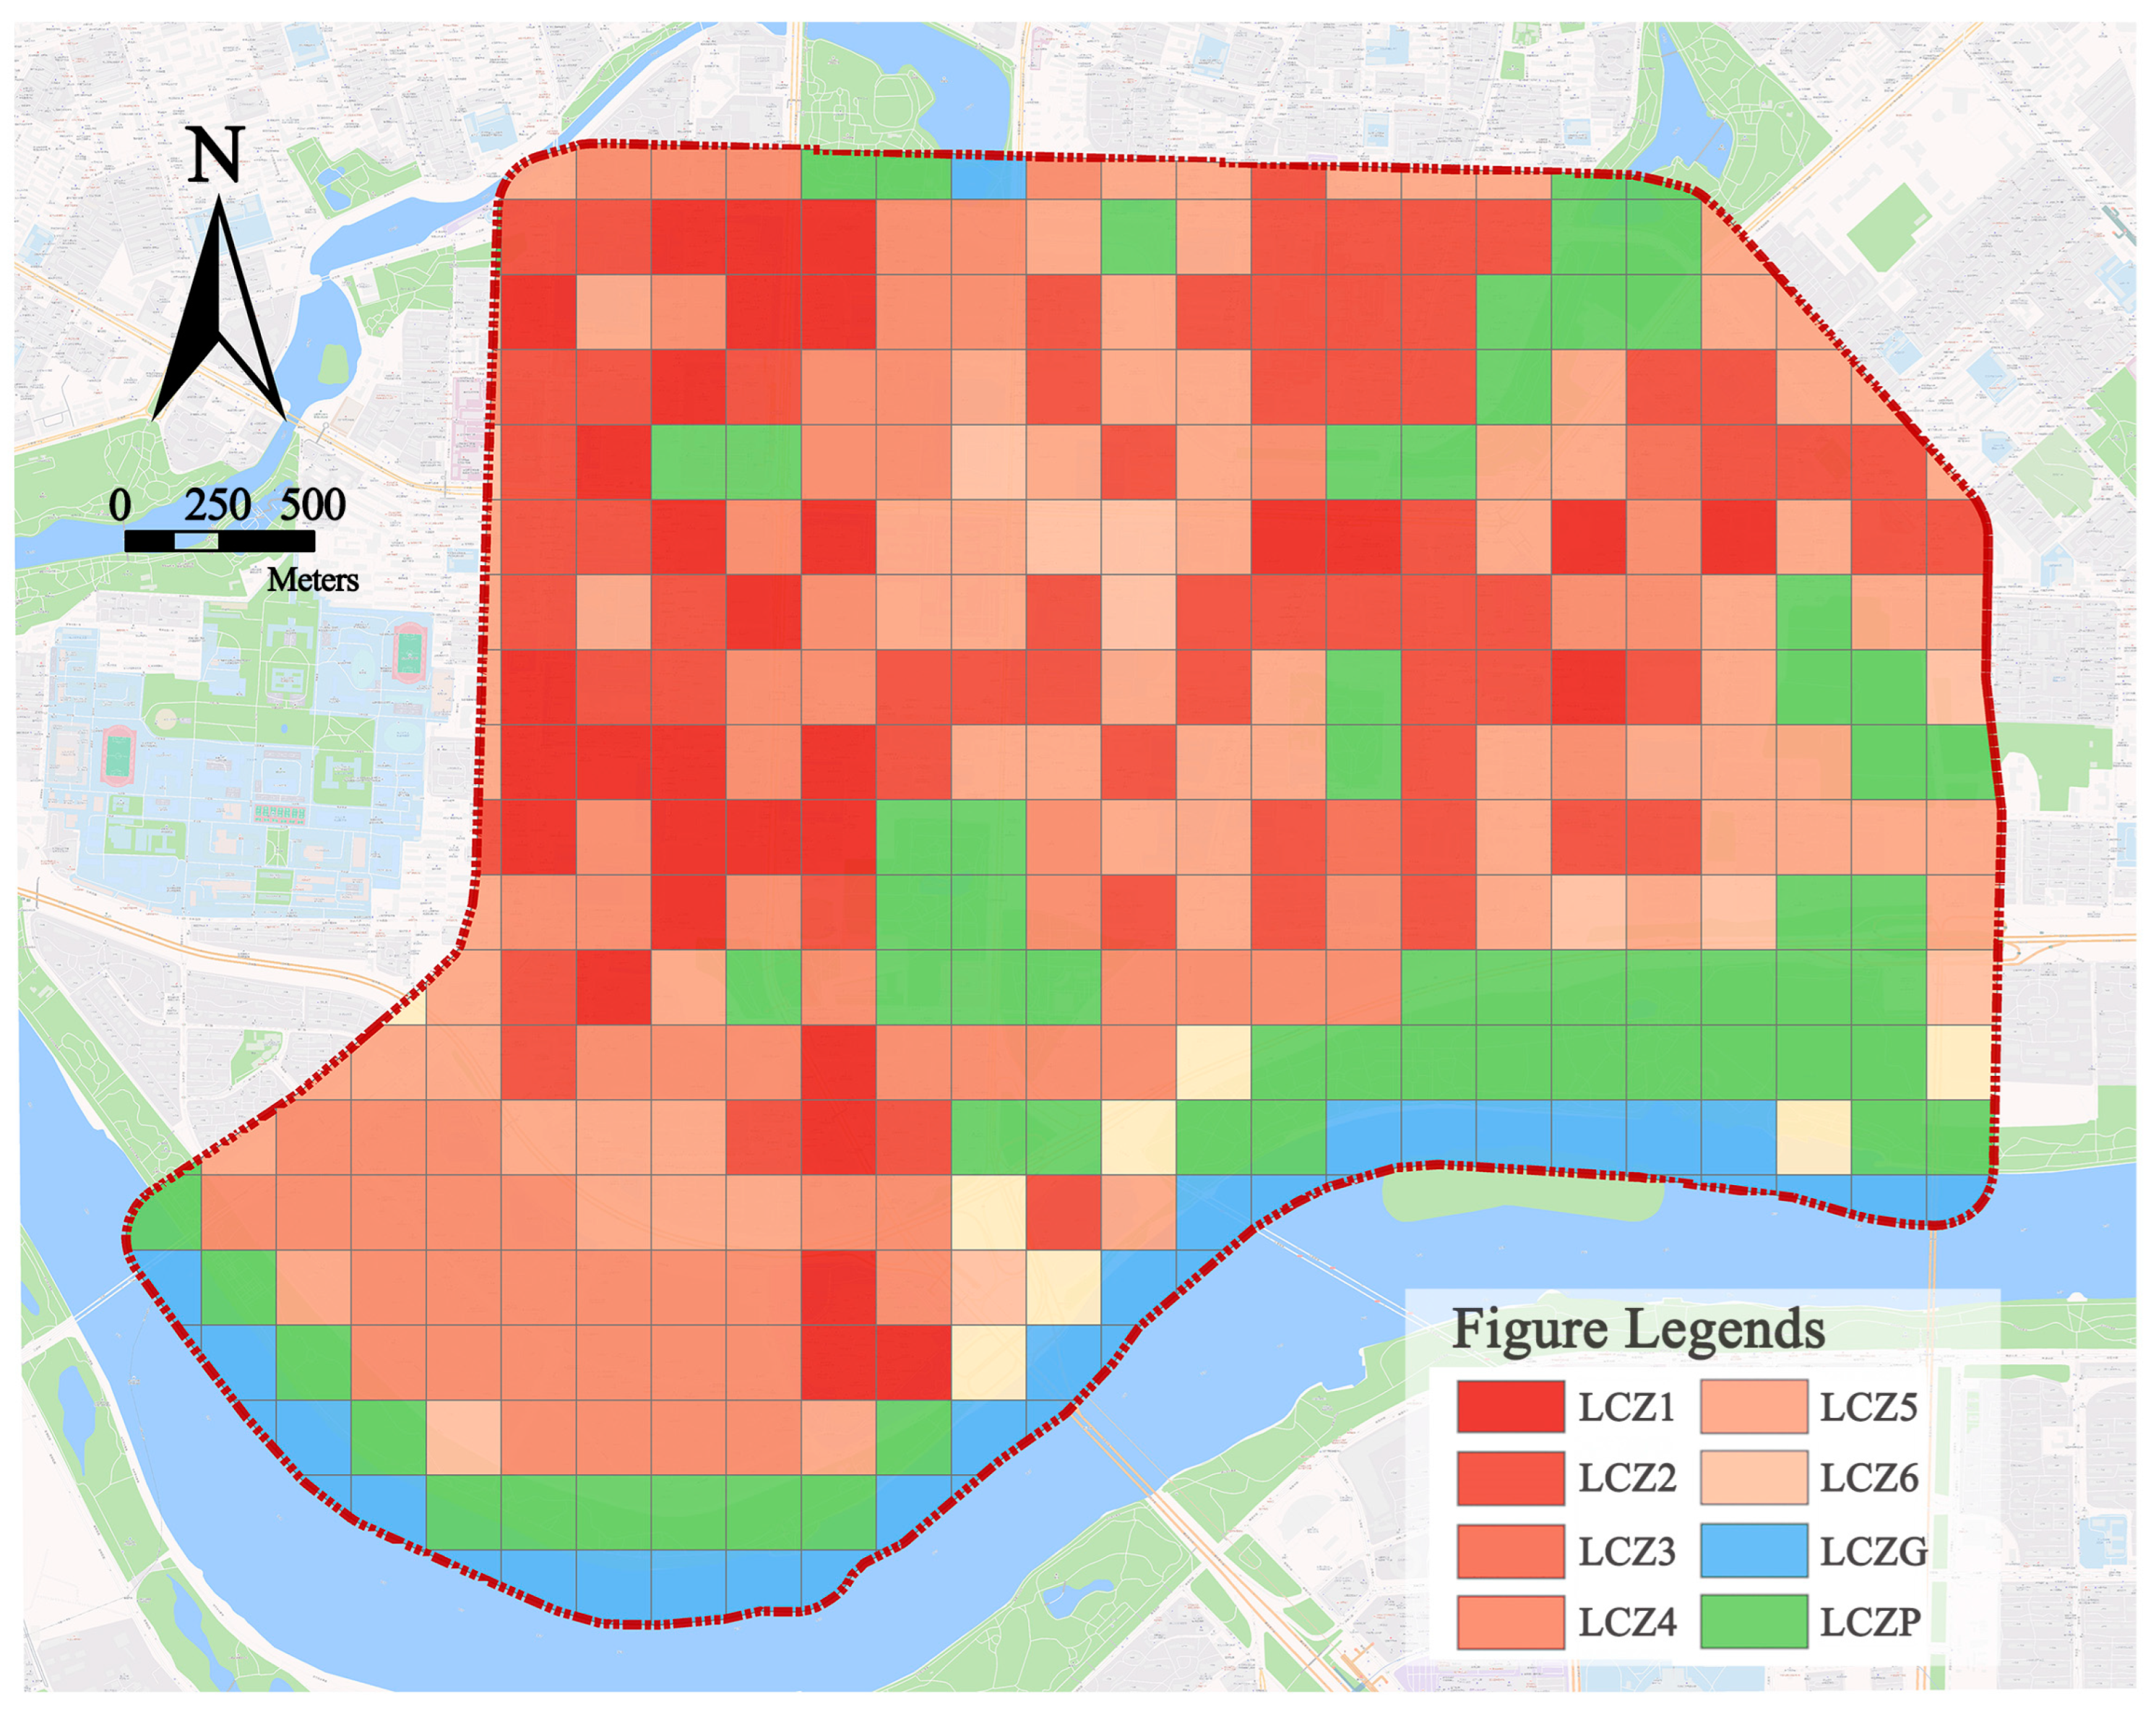
2.4.1. LCZ Construction in the Block

To map the LCZ for the Wenhua Road block, the study processed the acquired 30-m resolution land use data and building vector data of Shenyang City, referring to the LCZ mapping method based on ArcGIS [28] and combining the current status and research requirements of the study area. First, the collected data were integrated into the GIS platform for spatial extraction of the study area data. Second, considering the strongest correlation between the LCZ and PM pollution data at the 200-m grid scale revealed in the subsequent experimental calculations, the research scale was determined to be in a 200-m grid. At this scale, building indicators for the street block were calculated, including average building height and building density. Then, the land use data were categorized into construction land, green space, and water bodies and coupled with the building indicators for LCZ classification. Finally, the block LCZ was classified into six built-up environment types and two natural environment types.

2.4.2. Kriging Interpolation

This method was initially employed by Krige for locating gold resources, then was theorized and systematized by Matheron and was named the Kriging interpolation [29]. It needs to meet the second stationary assumption: (1) the average mean of random variables exists and is independent of the distance, and (2) when the distance between any two points is “h”, the variance of the regional change increment exists and is independent of the coordinates [30]. Through the Kriging interpolation method, the relatively limited monitoring data in this study can be utilized to estimate the PM concentration at unmonitored points in the study area, thereby obtaining continuous spatial distribution maps of the three types of particulate matter concentrations.

2.4.3. Hot Spot Analysis

The Getis-Ord Gi* hot spot analysis model is a spatial analysis tool that detects and analyzes autocorrelation in a local space to identify regions characterized by significant high- or low-value clustering [31]. The model accurately determines where clustering of high- or low-value elements occurs in space by calculating the high-/low-clustering statistics for each data point in the region and determining whether the point belongs to the same class as its neighboring points [32]. The Getis-Ord Gi * statistic is calculated as follows using Equations (1)–(3) [33]:
G = j = 1 n ω i j x j X ¯ j = 1 n ω i j S n j = 1 n ω i j 2 j = 1 n ω i j 2 n 1
X ¯ = j = 1 n x j n
S = j = 1 n x j n X ¯ 2
Among them, S is the standard deviation of the PM concentration in the block, and the G statistic obtained for each element in the dataset is the Z score. Higher G i values indicate a tighter clustering of hot spots, while lower G i values indicate a tighter clustering of cold spots.

2.4.4. Grid Spatial Data Integration

This study utilizes ArcGIS’s Create Fishing Grid function to create a fishing grid matching the study area and integrates three-dimensional building morphology indicators and spatially interpolated particulate matter concentration distribution into the spatial grid through multiple grid units. This allows for the acquisition of the average building indicator values and interpolated particulate matter concentration values at different pollution levels within each grid unit, thus realizing grid-based spatial connectivity and facilitating subsequent spatial analysis tasks. Through iterative experimentation and the comparison of different grid scales concerning the correlation between building indicators and particulate matter concentration, it is found that the spatial correlation is highest at a 200-m grid scale. Hence, the optimal grid scale is established as 200 m × 200 m.

2.4.5. Correlation Analysis

The strength of a monotonic relationship between two variables can be determined using a nonparametric statistic called Spearman’s correlation analysis, or Spearman’s rho [34]. It does not require data to obey a normal distribution; in contrast, it is applied to data on a fixed-order scale—that is, the rank or order information of the categorical variables. It first transforms the data into ranks and then computes the Pearson’s correlation coefficient between the ranks, as shown in Equation (4) below:
r s = 1 6 d i 2 n ( n 2 1 ) n 1
Among those, r s is the Spearman’s rank correlation coefficient, d i is the difference in the rank order of the corresponding observations of the two variables, and n is the total number of observations.

2.5. Overall Research Approach

First, the block LCZs are described based on ArcGIS, and the spatial distribution characteristics of various types of LCZs are analyzed; second, in order to analyze the heterogeneity of the spatial distribution characteristics of the three kinds of particulate matter under different pollution levels, these data obtained from field monitoring are summarized and classified, and spatially continuous particulate matter pollution maps are drawn based on the Kriging interpolation. Then, annual particulate matter pollution exposure maps of the block are developed based on time weighting, and pollution risk zones of the block are identified through hot spot analysis. Finally, to analyze the correlation between LCZs and the three kinds of particulate matter concentrations, Spearman’s rank correlation coefficient is used, and to analyze the results of the differences in the concentrations of particulate matter in the various types of LCZs and the reasons for the differences, the mean values of the three kinds of particulate matter concentrations of different LCZ classes are counted based on the correlation relationship.

3. Results and Discussion

3.1. Description and Analysis of Block LCZ

From the LCZ classification of the Wenhua Road block (Figure 4), it can be seen that the road block as a whole has a rich variety of architectural forms, including LCZ1–LCZ3 with a compact layout and LCZ4–LCZ6 with an open type, and there are also LCZP green areas and LCZG water areas with a natural environment type. The distribution of specific types of LCZs is characterized as follows: In terms of the built environment type, road block LCZ1 is mainly distributed on both sides of Qingnian Street and the commercial area on both sides of Wenhua Road; LCZ2 is mainly distributed on both sides of Wenhua Road, typically represented by dense mid-rise residential buildings; LCZ3 is mainly distributed on the north side of the Hunhe River, which consists of low-rise compact villas; LCZ4 is mainly distributed on both sides of Qingnian Street, which is a high-rise open residential area; LCZ5 is mainly distributed in the residential area on the north side of Nanta Street, which is an open mid-rise residential area; and LCZ6 is a relatively small distribution of open low-rise areas. As for the natural environment type, LCZG waters are represented by the Hunhe River, which appear as a zonal distribution on the south side of the study area; LCZP green spaces include Wulihe Park, Popular Science Park, and Nanta Park on the north side of the Hunhe River.

3.2. Characterization of the Spatial Distribution of Particulate Matter Concentrations in the Block

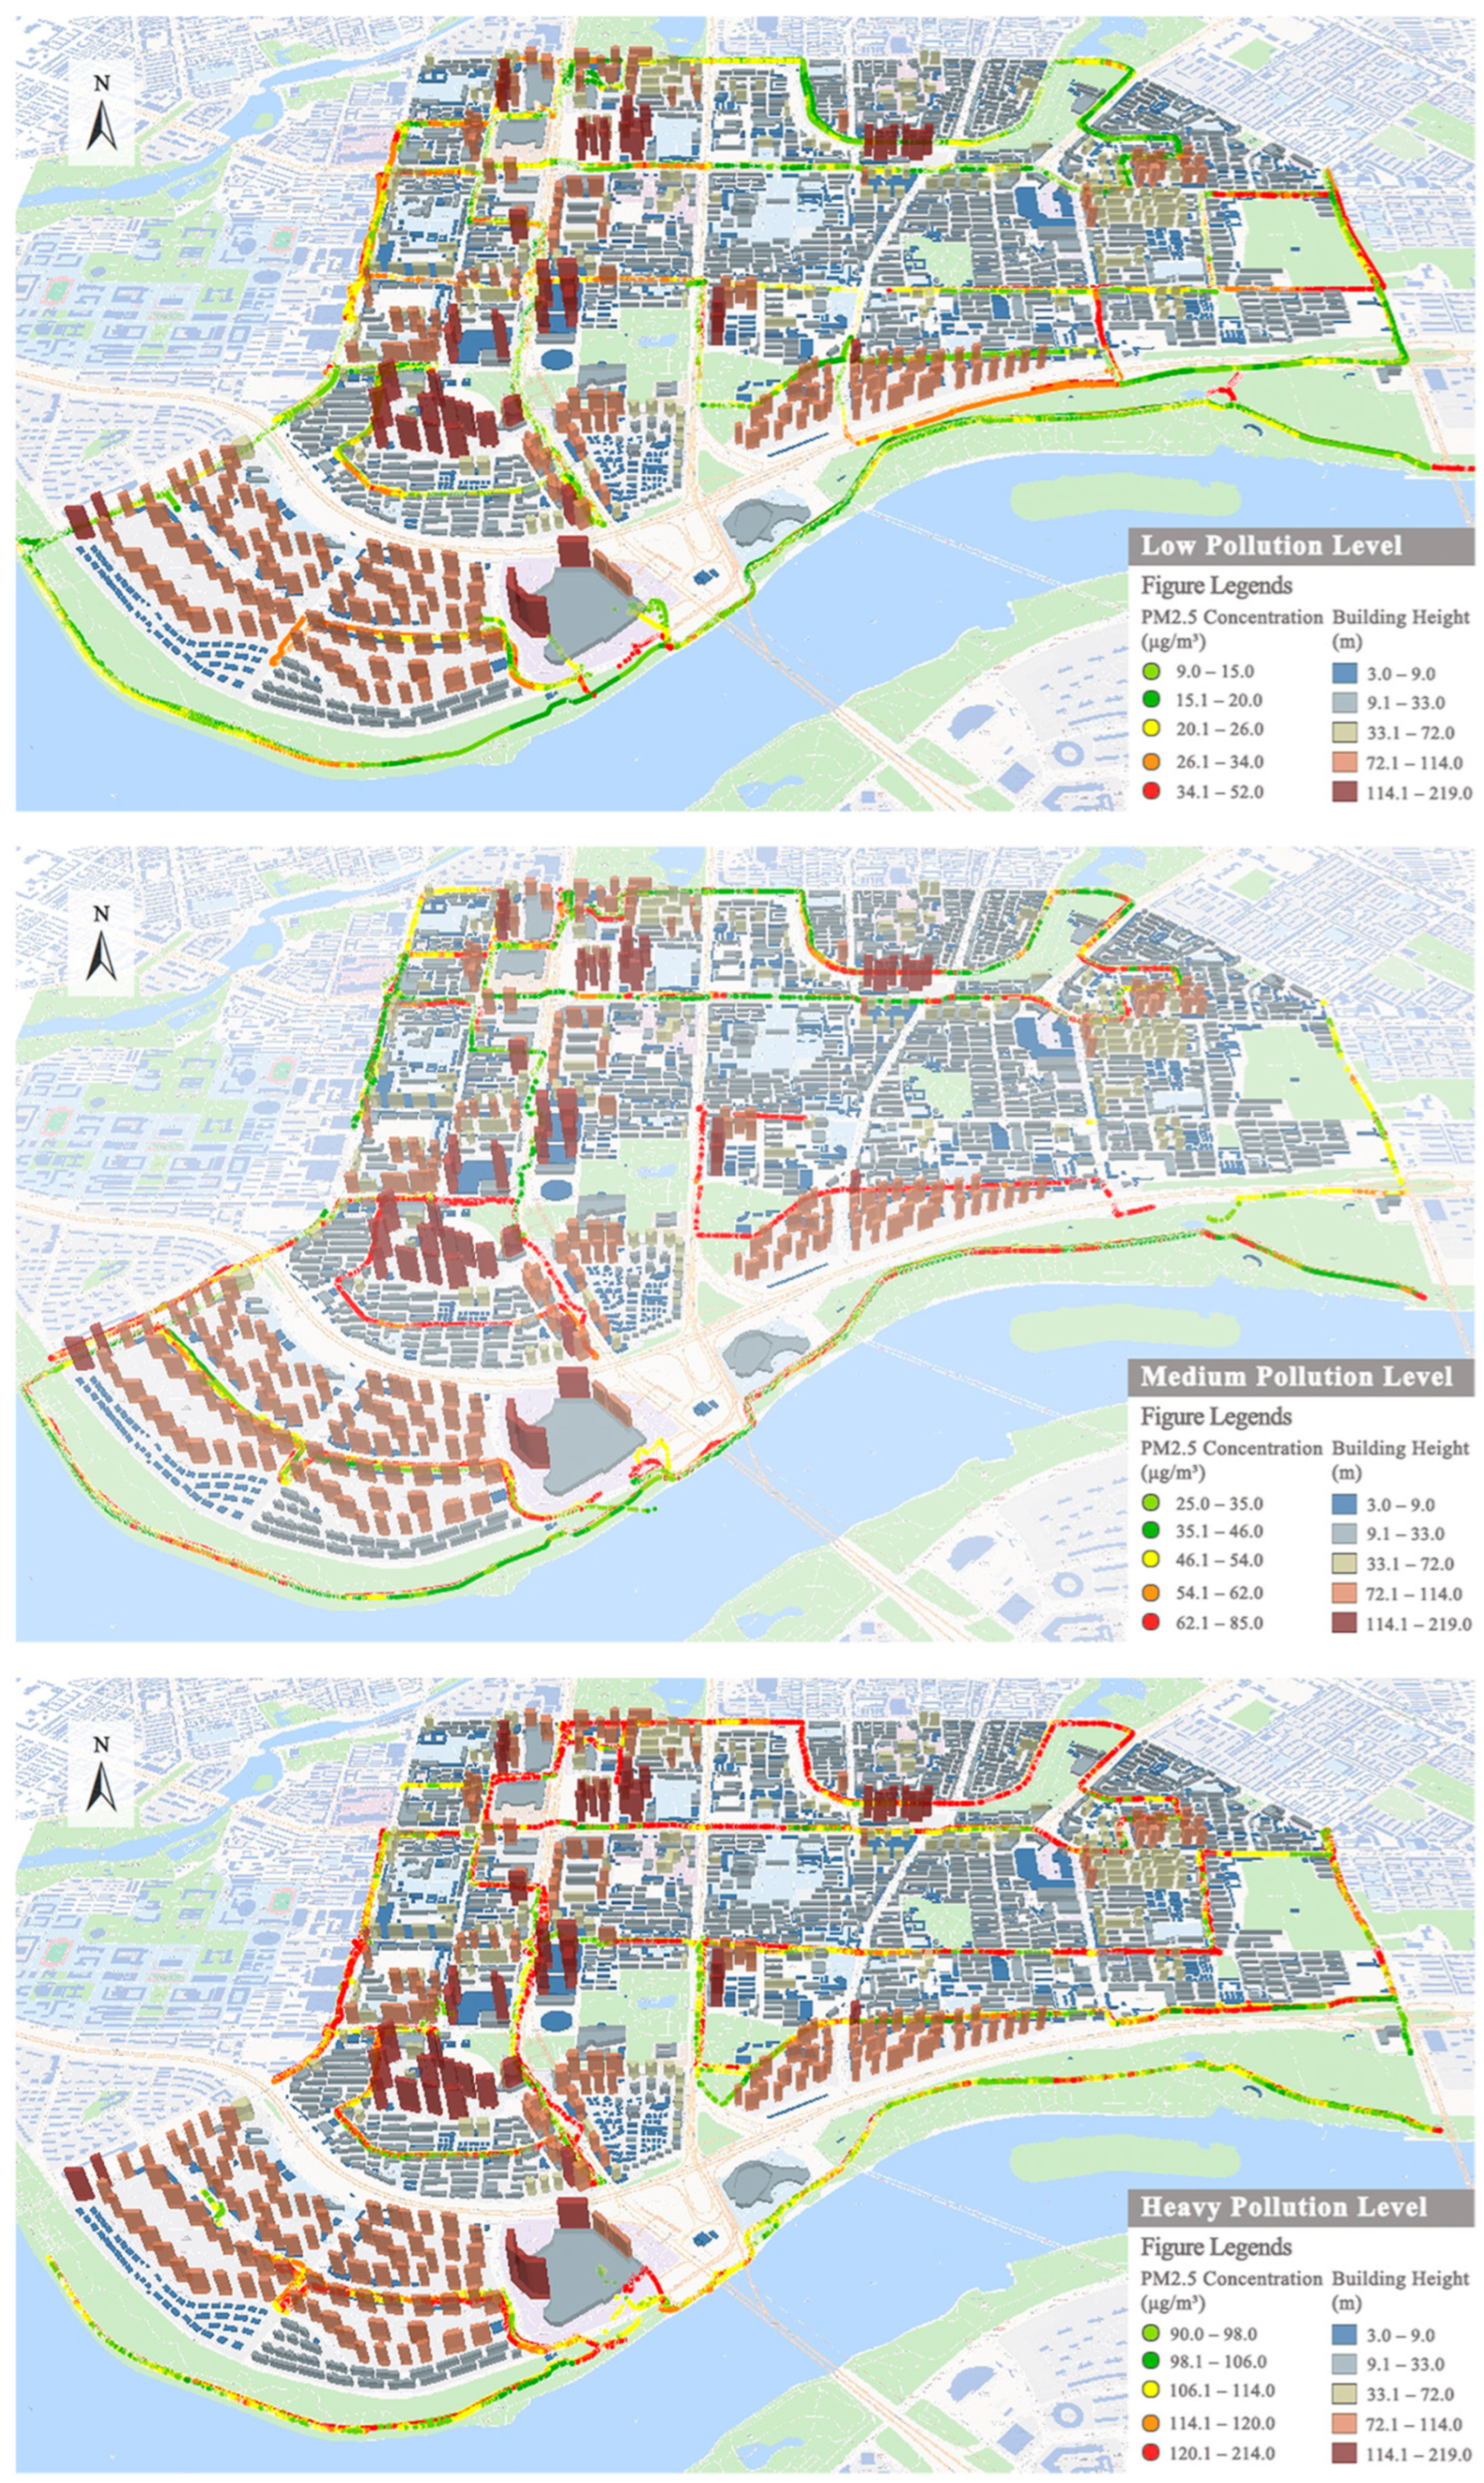
3.2.1. Visualization of Measured Particulate Matter Concentrations in the Block

The particulate matter data obtained from field measurements were preprocessed, and all data within five minutes since startup and outliers were excluded, resulting in a total of more than 650,000 valid data for the three types of particulate matter concentrations obtained in this study. The effective data obtained were processed, and the four-cycle data of each route were superimposed on average to obtain the average daily concentration of three pollutants on the four routes, which was used as the daily average concentration of particulate matter. Combined with the air pollution data of Shenyang over the years, the China Ambient Air Quality Standard (GB3095-2012), and World Health Organization Air Quality Standard, the measured data are divided into pollution levels according to research needs:
PM1, 0 μg/m³ < PM1 pollution level 1 ≤ 20 μg/m³ < pollution level 2 ≤ 50 μg/m³ < pollution level 3;
PM2.5, 0 μg/m³ < PM2.5 pollution level 1 ≤ 50 μg/m³ < pollution level 2≤100 μg/m³ < pollution level 3;
PM10, 0 μg/m³ < PM10 pollution level 1 ≤ 50 μg/m³ < pollution level 2 ≤ 100 μg/m³ < pollution level 3.
The data were combined according to pollution levels, in which the visualization of the measured data of the typical particle matter PM2.5 concentration under three pollution levels is shown in Figure 5.
At the same time, we verified the accuracy of the measured data. By summarizing the hourly average data disclosed by the national monitoring stations, our research also counted the hourly average of the four monitoring routes under the seven-day measurement period. After fitting, it was found that the accuracy was 0.866 (Figure 6), and the fitting effect was good. The field measurement data studied were consistent with the trend of the national public data, and the measurement data had strong confidence. It could represent the concentration level of particulate matter in the study area.
The trend of the field measurement data in the study is consistent with that of the national public site data., and in view of the fact that the reliability of the national monitoring site data has been fully demonstrated in previous research work [35,36], and has been widely used in related studies [37,38], we believe that the mobile measurement data in this study verified with the officially released particulate matter detection data have sufficient confidence to represent the concentration level of particulate matter in the study area.

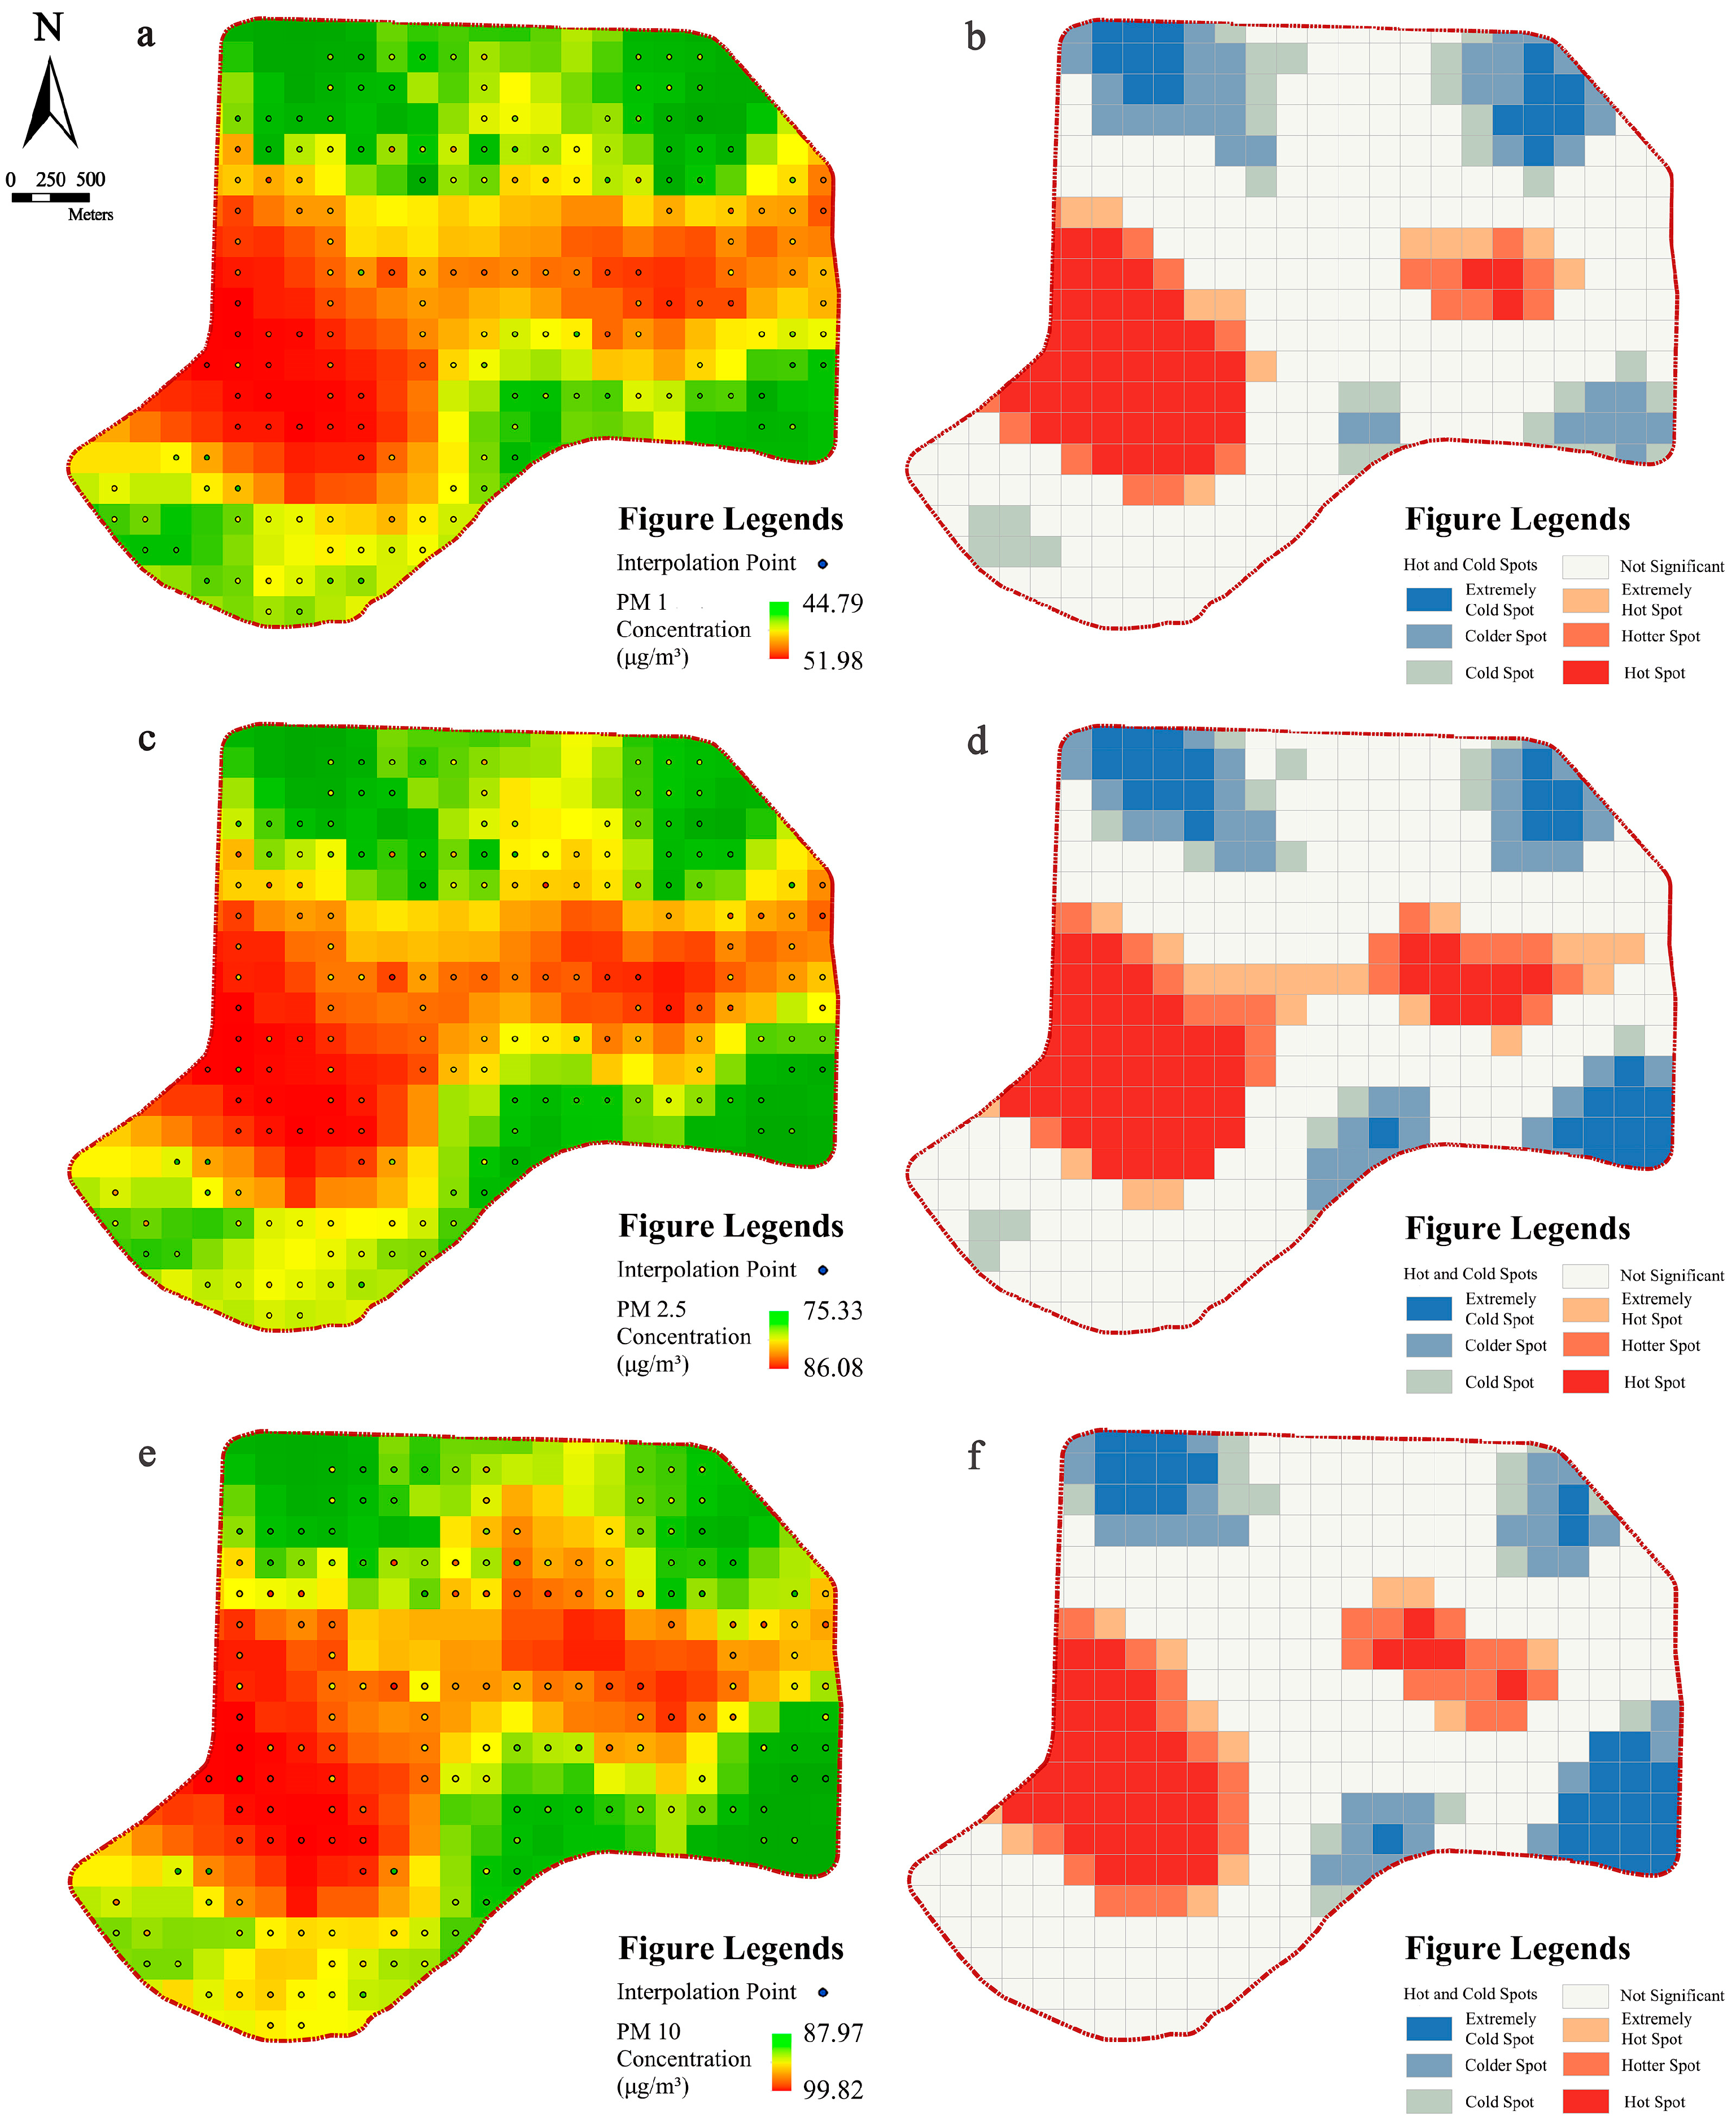
3.2.2. Spatial Interpolation Results of Particulate Matter in the Block

Due to the limited number of measuring points in the field, the acquired point data of three kinds of particulate matter concentrations were spatially interpolated, which generated spatially continuous distribution maps of average particulate matter mass concentrations under different pollution levels (Figure 7). The results showed that the spatial distribution characteristics of the three particulate matter concentrations under the same pollution level were relatively similar, while the spatial heterogeneity of the same particulate matter distribution under different pollution levels was high, but there were also local spatial similarities.
At pollution level 1 (Figure 7a), the concentration of PM1 was in the range of 11–18 μg/m³, concentration of PM2.5 was in the range of 17–28 μg/m³, and the concentration of PM10 was in the range of 21–33 μg/m³. The concentration values were enhanced with the increase in the diameter of particles, and the overall spatial distribution characteristics among the three particles were relatively similar, but the spatial distribution heterogeneity within each particle was high. The high pollution indices of the three pollutants are distributed on the west side of Qingnian Street and the east side of Shenshui District, Xinghuiyunjin District of the Yuexiu Group, and Yijingyuan District on the bank of South Canal, presumably related to the surrounding high-rise buildings shading, and the lower spatial openness leads to local deposition phenomenon. The low pollution index is distributed in the Mixc, Shenyang Pharmaceutical University, Popular Science Park, and Nanta Park, places with better spatial openness, and the parks here are equipped with more greenery, smoothing the transmission of particulate matter.
At pollution level 2 (Figure 7b), the concentration of PM1 was in the range of 25–42 μg/m³, the concentration of PM2.5 was in the range of 53–70 μg/m³, and the concentration of PM10 was in the range of 54–87 μg/m³. The high pollution indices of the three pollutants are located in the central areas of the block, including the Shenyang Conservatory of Music, Shimao Wulihe River Road block, Popular Science Park, and Nanta Road block. The central areas of the block as a whole show a high pollution phenomenon, mainly due to the influence of the Wulihe River Park of Hunhe River in the south and Qingnian Park and South Canal in the north, coupled with the dense construction in the central areas of the block, which makes it difficult for pollutants from the north and the south to be transported outward. The area with a low pollution index is distributed in the southern part of the study area, Wulihe River Park, the business district of the Mixc north of the study area, and the South Canal block; these two blocks are affected by the adsorption of pollutants from the park’s greenery, and coupled with high spatial openness, the pollutants diffuse relatively quickly; thus, the pollution here is relatively low.
Under pollution level 3 (Figure 7c), the concentration of PM1 is in the range of 66–76 μg/m³, the concentration of PM2.5 is in the range of 109–125 μg/m³, and the concentration of PM10 is in the range of 126–144 μg/m³. The high pollution index area is located in the Shenyang Conservatory of Music, Shimao Wulihe block, the interchange of Wanliutang Road and Culture Road, Shenshui District, and the South Canal block. The main reason for this difference is the layout of the building. On the one hand, these areas are built environmental LCZs, often showing higher pollution than natural environmental LCZs. On the other hand, a high building height or high building density in the region are the causes of high pollution, because a high building height and building density hinder the diffusion of particulate matter, making the local building layout not conducive to the diffusion and transmission of particulate matter. The low pollution index area is mainly distributed in the building complexes facing the Hun River and the vicinity of Popular Science Park, mainly due to the reduction and adsorption of particles by the green space and the relatively weak shading of the buildings, which makes the transmission of particles unaffected by the shading.

3.2.3. Identification of Particulate Matter Risk Areas Based on Time Weighting

Due to the high spatial heterogeneity of particulate matter distribution under different pollution levels, this study attempts to construct a time-weighted annual particulate matter pollution distribution map based on the proportion of different pollution levels throughout the year. By statistically categorizing the meteorological data of Shenyang, capital city of Liaoning Province, in 2022, it was found that pollution level 1 accounted for one-tenth of the year, pollution level 2 accounted for five-tenths of the year, and pollution level 3 accounted for four-tenths of the year. According to such a time-weighted ratio, the three kinds of particulate matter pollution data values were weighted and summarized in terms of time share, and the spatial distribution map of particulate matter in the study area for the whole year was obtained by the Kriging interpolation method. Then, the hot spot analysis method based on the GIS platform was used to identify the cold and hot spots analysis map of particulate matter in the study area for the whole year.
The results showed (Figure 8a) that the time-weighted pollution level of PM1 in blocks was in the range of 44–51 μg/m³, PM2.5 was in the range of 75–86 μg/m³, and PM10 was in the range of 87–99 μg/m³, which all belonged to pollution level 2. The distribution of the year-round high-pollution areas for the three particulate matters is relatively similar, and they are all located in the middle of the block, from Culture Road in the north to Shenshui Road in the south. Low-pollution areas are located in the south and north of the block, including Wuli River Park along the Hunhe River, the Mixc near Qingnian Park, South Canal close to Wanliutang Park, and other places that are particulate matter low index areas, and the overall air quality is relatively good.
As can be seen from the three particulate matter cold and hot spots analysis map (Figure 8b), the overall cold and hot spots spatial distribution of the three particulate matters is relatively similar, and the spatial distribution of the high-risk and low-risk zones of particulate matter with different diameters is consistent, which is also consistent with the similarity of the spatial interpolation results. The hot and cold spots of the three kinds of particulate matter are all in a piecewise distribution, which is related to the spatial transmission distribution mode of the particulate matter. Specifically, the hot spots of particulate matter throughout the year are mainly distributed in two major areas: namely, the Dongbei Riza Market and the Shimao Wulihe area; the cold spots are mainly distributed in the Mixc near Qingnian Park, the South Canal, the Shengjing Grand Theater, and the Wulihe Ice and Snow Paradise area. From the difference between the hot and cold spots, it can be seen that the hot spot areas are urban construction land, and the buildings there are compact and dense with a large flow of people, while the cold spot areas are urban parks and the surrounding blocks.

3.3. Effect of LCZ on Particulate Dispersion

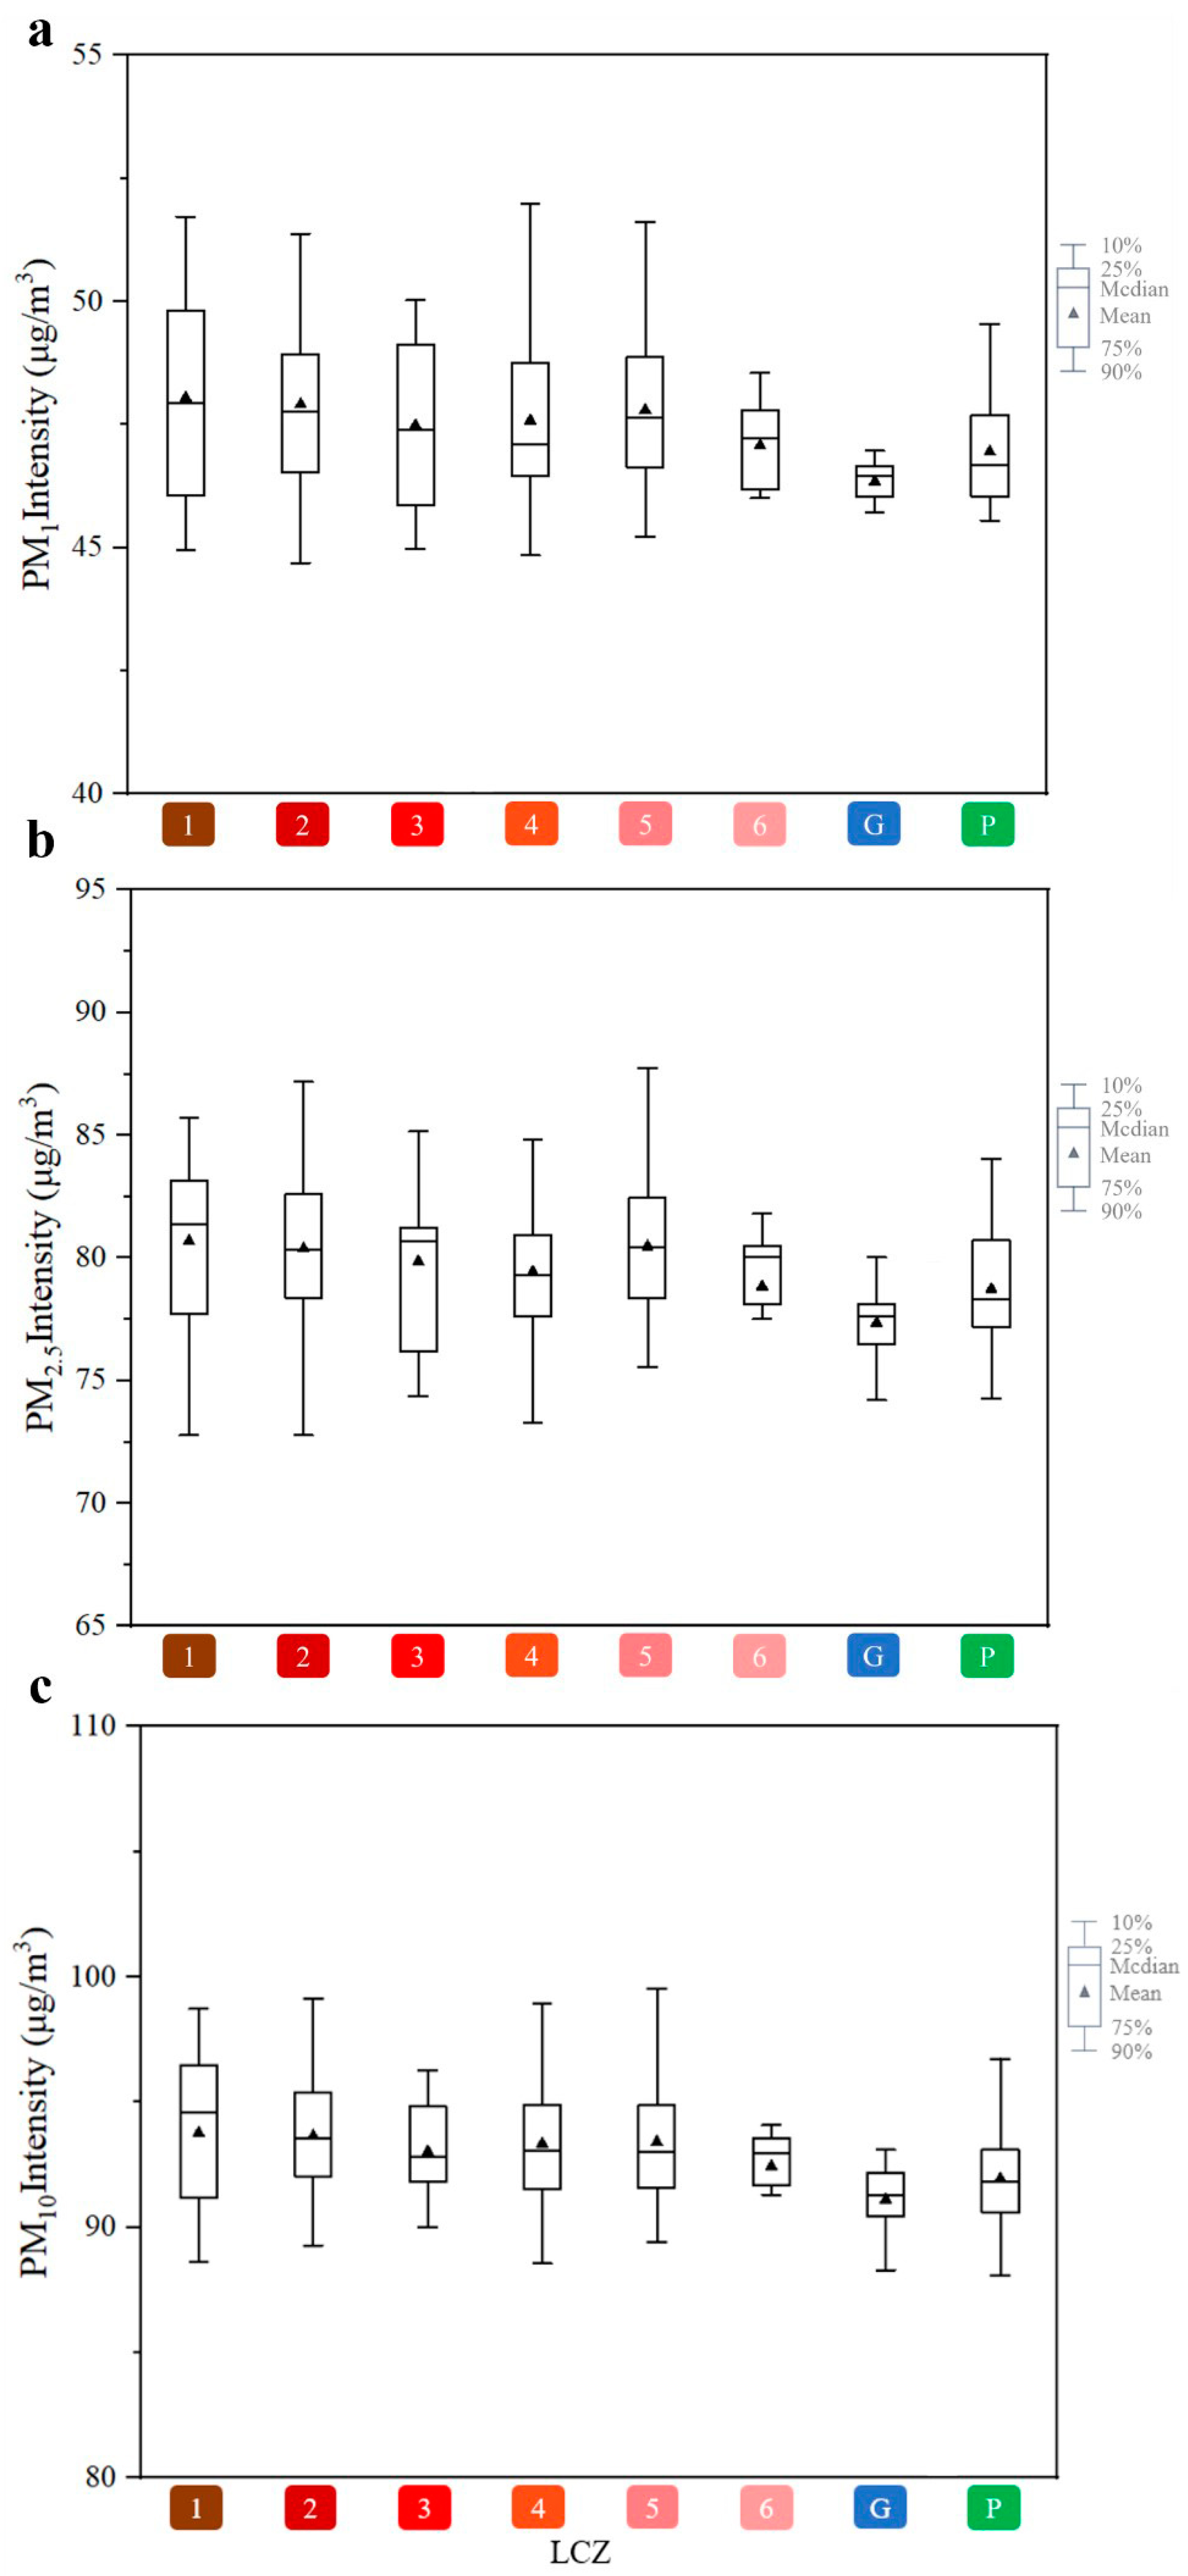
3.3.1. Correlation between LCZ and Particulate Matter

First, based on the data collection of the spatial grid and Spearman’s correlation analysis, the LCZ calculation results and the particulate matter concentration calculation results were coupled on the block grid to calculate the correlation between the LCZ and the concentration of particulate matter of the three diameters. Then, the particulate matter concentrations of different LCZs were counted to excavate the differences in particulate matter concentrations caused by LCZ classification. From Table 1, it can be seen that there is a significant correlation between all three kinds of particulate matter concentrations and LCZs (p < 0.01), and this correlation is enhanced with the increase in particulate matter diameters, but the overall difference is not significant. This difference in correlation caused by the particle diameter is mainly due to the fact that large-diameter particles are more responsive to changes in the LCZ, thus showing a greater correlation between the LCZ and large-diameter particles. On the other hand, PM1, a small-diameter particle, is less sensitive to changes in the LCZ than PM10 because of its smaller diameter compared to PM10; thus, it is affected to a weaker extent, and the overall correlation is lower than that between PM2.5 and PM10.

3.3.2. Correlation between LCZ and Particulate Matter

Based on the correlation between the LCZ and three kinds of particulate matter, the study statistic was the average value of particulate matter concentration under different LCZ land use classifications (Figure 9). The results show that, among the characteristic differences in particulate matter concentrations between LCZ classes, the built-up class always had a larger value of average particulate matter concentration than the natural class environment.
Further, the built environment class LCZs were divided into height-control and density-control groups. In the density-control group, first, the elevation of building heights under the dense building layout had a contributing effect on the concentration of particulate matter for different diameters. In the case of controlling the constant building density, there was LCZ1 > LCZ2 > LCZ3 in building height, and the corresponding particulate matter concentrations showed similar characteristics, which was because the obstruction effect of low-rise buildings on particulate matter transmission was weaker than the obstruction effect of high-rise buildings, and the higher spatial openness under the layout of low-rise buildings was favorable for particulate matter transmission and diffusion. Secondly, the effect of building height increase on particulate matters of different diameters under an open building layout was slightly different from that under a dense building layout. Similarly, in the case of controlling the building density unchanged, the building height was LCZ4 > LCZ5 > LCZ6, but the average particulate concentration showed the result of LCZ5 > LCZ4 > LCZ6, and the particulate concentration at LCZ4 produced a difference and showed a tendency to decrease, which might be due to the fact that the open high-rise building layout made the local wind speed accelerate, and the formation of local ventilation corridors was favorable for the diffusion and transmission of particulates, which, in turn, reduced their concentration. This may be due to the fact that the layout of open high-rise buildings accelerates the local wind speed and forms local ventilation corridors, which is favorable for the diffusion and transmission of particulate matter and thus reduces its concentration.
In the height control group, first, the increase in building density under the high-rise building layout has a contributing effect on the concentration of particulate matter of different diameters. In the case of controlling the constant building height, there is LCZ1 > LCZ4 on the building density, and its corresponding particulate matter concentration shows the same characteristics. Secondly, the building density under the middle- and low-rise building layouts of elevation showed a promoting effect on the concentration of particulate matter of different diameters, but none of these differential effects were significant. Under the condition of controlling the constant building height, there is LCZ2 > LCZ5 and LCZ3 > LCZ6 for the building density, the effect of density on particulate matter is weaker under the same conditions of mid-rise and low-rise building heights, and the difference in particulate matter concentrations under different densities at the same height is not significant.

4. Discussions

4.1. PM2.5 Difference in LCZ Configuration

In the existing research on “urban form particulate matter”, landscape indicators (such as PLAND, the NDVI, and the SEI) are usually used to express different landscape patterns [39,40], and the influence of different landscape configurations on the distribution of urban particulate matter is analyzed. However, landscape classification is often on a coarse-grained scale, and various architectural areas are regarded as a landscape type, often ignoring the change in architectural configuration [41]. The LCZ scheme includes the classification of architecture and landscape, and its research related to particulate matter has just arisen in recent years [42]. This study also supplemented relatively few pieces of literature, a further in-depth research scale, the block scale of three kinds of particles and LCZ scheme, and a comprehensive and intuitive discussion of the LCZ scheme on the impact of building configuration on particulate matter.
Referring to previous related studies, Gao et al. [43] assessed the changes in PM2.5 concentrations in two representative communities in Shanghai by mobile measurements and found that PM2.5 varied drastically at the community level and that this difference was mainly caused by the spatial pattern of PM2.5 background levels and traffic volume. Li et al. [44] found that the Central and Causeway Bay areas in Hong Kong are pollution hot spots. Due to the street canyon effect, traffic intensity and mixing, and ambient meteorological conditions, these areas have high PM2.5 concentrations. Ke et al. [45] conducted field measurements using fixed and mobile monitoring stations in the Xia Sha Economic and Technological Development Zone in Hangzhou, capital city of Zhejiang Province, and found that the spatial variability of the distribution of PM2.5 was closely related to land use types, architectural layout, and building heights. Liu et al. [46] used mobile monitoring methods to collect PM2.5 concentration data in Wuhan, capital city of Hubei Province, and found that the urban morphology factor was an important cause of high PM2.5 concentrations. Combined with the results of established studies, it was found that there was little difference in the ambient meteorological conditions under the general background and industrial pollution emissions at the block level and that, controlling for such variables, the functional differences in the land use and the spatial differences in the way buildings are laid out between this study area, and other similar studies are the main reasons for the spatial heterogeneity of particulate matter in the study area, and thus, it is necessary to dig deeper into the effects of the block based on the LCZs of particulate matter pollution.
Among the differences in particulate matter concentrations caused by the LCZ configuration, it is found that a built environment always has a larger average particulate matter concentration than a natural environment. This is because natural species and built species represent emission sources and absorption/desorption sinks of pollutants, respectively, to a certain extent. In natural LCZs, trees and green spaces can absorb a large amount of air pollutants, thus reducing the concentration of particulate matter, which is consistent with previous research results [47,48]. At the same time, water can absorb particulate matter through evaporation [49,50] and reduce the local particulate matter deposition. In contrast, built-up LCZs often have high-rise, high-density buildings, which have the greatest impact on particulate matter concentrations by affecting the rate of particulate matter transport and diffusion, such as shading by buildings [51]. Similar laws have been found in the literature, for example, the PM2.5 concentration is negatively correlated with the forest area ratio and positively correlated with the built-up area ratio [52,53].
In built-up LCZs, the building height and building density are the important factors causing the difference in particulate matter concentrations. Under the condition of controlling the building density being unchanged, it can be seen that the effect of building height on particulate matter concentrations is complex and may be influenced by a variety of factors, including pollutant emissions from ground-level sources, air flow and diffusion conditions, and the design of the building and the surrounding environment [54]. When the building height is controlled unchanged, the increase in the building density can promote the particulate matter under the layout of high-rise buildings. It is because the low-density building layout facilitates the transport of particulate matter, while the high-density building layout brings about the deposition of localized pollutants, which is in line with the results of the study by Yang et al. This influence is weak under the layout of middle-level and low-rise buildings. This may be due to the fact that the buildings as a whole are low and have little hindering effect on the diffusion of particulate matter, so there is little overall change in the concentrations of the three kinds of particulate matter. Therefore, the building density is related to the density of the building and building size, which can affect the local accumulation of pollutants [55].

4.2. Suggestions for the Optimization of Risk Areas

LCZ interclass optimization strategy: A built environmental LCZ is the most typical feature of a high particulate matter concentration in the block risk area, which is significantly different from the low particulate matter concentration caused by a natural environment in the cold spot area. Therefore, in the optimization of risk areas, increasing the proportion of natural vegetation or water surface and reducing the impermeable surface as much as possible are feasible optimization means [56,57]. The construction area of green space in risk areas can be increased by an appropriate amount, and specific measures can be taken, including building miniature pocket parks, increasing roof greening and vertical greening, etc. [58]. To improve the green area of risk areas, optimize the air quality by using the adsorption effect of green plants on particulate matter, improve the high pollution exposure of risk areas, and promote the construction of healthy blocks in healthy cities. At the same time, small water landscapes can also be introduced in risk areas [59]. Make full use of the advantages of geographical resources adjacent to the Hunhe River in the block and through the connection of the groundwater system. Increase the water coverage area in risk areas, give full play to the evaporation of water bodies [60], and dilute or take away particulate matter with water vapor. Reducing the high-concentration pollution of particulate matter is of great significance for building a comfortable and livable block with fresh air.
However, the introduction and expansion of natural LCZ in risk areas cannot cover a large area, which may not be a sustainable optimization scheme. Facing the background of rapid urbanization, building a built-up LCZ configuration that is conducive to the diffusion of particulate pollution is the key point that should be considered in architectural design and urban planning layout [61]. Therefore, the LCZ build-up optimization strategy: According to the research results, a dense building layout and higher building height will lead to the increase in the particulate matter concentration. Therefore, the optimization of the risk area can start from two aspects: improving the building height and building layout density. Analyzing the characteristics of the building layout in risk areas, it is mainly the high concentration of particulate matter caused by the combination of high and dense, so, in the optimization design, we should consider reducing this high and dense building layout, which is not easy to diffuse pollutants, and adding a more low and scattered building layout design, so as to promote air circulation and diffusion and the transmission of particulate matter. By extension, in the urban construction, because it is impossible to arrange low and scattered buildings on a large scale in China’s urban construction [62], the relationship between building height, building density, and PM2.5 needs to be expanded, and the determination of a key height threshold will help urban and landscape planning achieve a cost-effective state in terms of air pollution [63].

4.3. Limitations

On the whole, the research has carried out a certain depth in spatial-scale and particulate matter species richness, but there are still the following shortcomings: First, the time period of field measurement is still short, so it is considered to increase the amount of field measurement work in the follow-up research to improve the data representativeness. Secondly, the influence of the LCZ on particulate matter has not been quantified, and the threshold of the building height and building density on particulate matter is still unclear. In the follow-up study, we can consider building a relational model to quantify this influence relationship. The research has guiding significance for improving air pollution exposure and promoting the sustainable development of urban blocks.

5. Conclusions

This study conducted the mobile monitoring of three types of particulate pollutants at the block scale. By classifying building LCZ types, particulate pollution maps were generated. Subsequently, hot spot analysis was employed to identify particulate matter risk hot spots and cold spots within the neighborhoods, elucidating the correlation between pollutant distribution and the LCZ. The conclusion is as follows: Regarding the spatial distribution characteristics of the three types of particulate matter, under the same pollution level, the spatial distribution characteristics of the concentrations of the three types of particulate matter are relatively similar, while, under different pollution levels, there is higher spatial heterogeneity in the distribution of the same type of particulate matter. The time-weighted results show that the PM1 pollution level in the block ranges from 44 to 51 μg/m³, PM2.5 ranges from 75 to 86 μg/m³, and PM10 ranges from 87 to 99 μg/m³. All three types of particulate matter pollution fall within pollution level 2. Regarding particulate matter risk areas, the spatial distribution of hot spots and cold spots for particles of different diameters is consistent. Throughout the year, particulate matter hot spots are mainly distributed in two areas: Dongbei Riza Market and the Shimao Wulihe area. There is a certain correlation between LCZs and the dispersion of particulate matter pollution. Built-up LCZs tend to have higher particulate matter concentrations than natural LCZs, while the building height and density are the key factors contributing to higher concentrations of particulate matter of different diameters in built-up LCZs. It is necessary to further investigate their specific mechanisms in subsequent research.

Author Contributions

Conceptualization, W.W. and Y.T.; methodology, Y.T.; software, Y.T.; formal analysis, Y.T.; investigation, R.L. and Y.T.; resources, W.W.; data curation, Y.T.; writing—original draft preparation, R.L. and Y.T.; writing—review and editing, W.W.; supervision, W.W. All authors have read and agreed to the published version of the manuscript.

Funding

This research was funded by the National Natural Science Foundation of China (No. 32101325), the Liaoning Provincial Natural Science Foundation of China (No. 2023-MS-084), and the Fundamental Research Funds for the Central Universities (No. N2211001).

Institutional Review Board Statement

Not applicable.

Informed Consent Statement

Not applicable.

Data Availability Statement

The data presented in this study are available on request from the corresponding author. The data are not publicly available due to privacy.

Conflicts of Interest

The authors declare no conflicts of interest.

References

  1. Wu, D. Hazy weather research in China in the last decade: A review. Acta Sci. Circumstantiae 2012, 32, 257–269. [Google Scholar] [CrossRef]
  2. Song, J.; Li, C.L.; Liu, M.; Hu, Y.M.; Wu, W. Spatiotemporal Distribution Patterns and Exposure Risks of PM2.5 Pollution in China. Remote Sens. 2022, 14, 3173. [Google Scholar] [CrossRef]
  3. Hrdličková, Z.; Michálek, J.; Kolář, M.; Veselý, V. Identification of factors affecting air pollution by dust aerosol PM10 in Brno City, Czech Republic. Atmos. Environ. 2008, 42, 8661–8673. [Google Scholar] [CrossRef]
  4. Liu, H.M.; Fang, C.L.; Zhang, X.L.; Wang, Z.Y.; Bao, C.; Li, F.Z. The effect of natural and anthropogenic factors on haze pollution in Chinese cities: A spatial econometrics approach. J. Cleaner Prod. 2017, 165, 323–333. [Google Scholar] [CrossRef]
  5. Fan, C.J.; Tian, L.; Li, J.W. Research Progress of lmpacts of Urban Form on Air Quality. Urban Dev. Stud. 2017, 24, 92–100. [Google Scholar] [CrossRef]
  6. Gomišček, B.; Hauck, H.; Stopper, S.; Preining, O. Spatial and temporal variations of PM1, PM2.5, PM10 and particle number concentration during the AUPHEP—Project. Atmos. Environ. 2004, 38, 3917–3934. [Google Scholar] [CrossRef]
  7. Wu, W.; Wang, Y.Q.; Liu, M.; Li, C.L. A Review on the Use of Landscape Indices to Study the Effects of Three-Dimensional Urban Landscape Patterns on Haze Pollution in China. Pol. J. Environ. Stud. 2021, 30, 2957–2967. [Google Scholar] [CrossRef]
  8. Clark, P.L.; Millet, B.D.; Marshall, D.J. Air Quality and Urban Form in U.S. Urban Areas: Evidence from Regulatory Monitors. Environ. Sci. Technol. 2011, 45, 7028–7035. [Google Scholar] [CrossRef]
  9. Abougendia, M.S. Investigating surface UHI using local climate zones (LCZs), the case study of Cairo’s River Islands. Alexandria Eng. J. 2023, 77, 293–307. [Google Scholar] [CrossRef]
  10. Lyu, T.; Buccolieri, R.; Gao, Z. A Numerical Study on the Correlation between Sky View Factor and Summer Microclimate of Local Climate Zones. Atmosphere 2019, 10, 438. [Google Scholar] [CrossRef]
  11. Jiang, R.Y.; Xie, C.K.; Man, Z.H.; Afshari, A.; Che, S.Q. LCZ method is more effective than traditional LUCC method in interpreting the relationship between urban landscape and atmospheric particles. Sci. Total Environ. 2023, 869, 161677. [Google Scholar] [CrossRef] [PubMed]
  12. Cui, G.X.; Zhang, Z.S.; Xu, C.X.; Huang, W.X. Research advances in large eddy simulation of urban atmospheric environment. Adv. Mech. 2013, 43, 295–328. [Google Scholar] [CrossRef]
  13. Gong, J.; Hu, Y.; Liu, M.; Bu, R.; Chang, Y.; Bilal, M.; Li, C.; Wu, W.; Ren, B. Land use regression models using satellite aerosol optical depth observations and 3d building data from the central cities of Liaoning province, China. Pol. J. Environ. Stud. 2016, 25, 1015–1026. [Google Scholar] [CrossRef] [PubMed]
  14. Gaines Wilson, J.; Zawar-Reza, P. Intraurban-scale dispersion modelling of particulate matter concentrations: Applications for exposure estimates in cohort studies. Atmos. Environ. 2006, 40, 1053–1063. [Google Scholar] [CrossRef]
  15. Kim, C.H.; Meng, F.; Kajino, M.; Lim, J.; Tang, W.; Lee, J.J.; Kiriyama, Y.; Woo, J.H.; Sato, K.; Kitada, T.; et al. Comparative Numerical Study of PM2.5 in Exit-and-Entrance Areas Associated with Transboundary Transport over China, Japan, and Korea. Atmosphere 2021, 12, 469. [Google Scholar] [CrossRef]
  16. Lu, D.B.; Mao, W.L.; Yang, D.Y.; Zhao, J.N.; Xu, J.H. Effects of land use and landscape pattern on PM2.5 in Yangtze River Delta, China. Atmos. Pollut. Res. 2018, 9, 705–713. [Google Scholar] [CrossRef]
  17. Leen, B.; Vu, G.N.; Kim, C.V.; Han, H.D.; Ben, S.; Bruno, V. Assessment of the impact of local climate zones on fine dust concentrations: A case study from Hanoi, Vietnam. Build. Sci. 2023, 242, 110430. [Google Scholar] [CrossRef]
  18. McCarty, J.; Kaza, N. Urban form and air quality in the United States. Landsc. Urban Plan. 2015, 139, 168–179. [Google Scholar] [CrossRef]
  19. Jiang, Z.W.; Cheng, H.M.; Zhang, P.H.; Kang, T.F. Influence of urban morphological parameters on the distribution and diffusion of air pollutants: A case study in China. J. Environ. Sci. 2021, 105, 163–172. [Google Scholar] [CrossRef]
  20. Zhu, G.; Chen, Y.; Wu, W.; Liu, R.H.; Tang, Y.; Li, P.C.; Xu, A.W. Coupling relationships between urban block spatial morphology and microclimate in severe cold regions. iScience 2023, 26, 108313. [Google Scholar] [CrossRef]
  21. Shiva, N.S.; Pavan, R.Y.; Narayana, M.; Seema, K.; Pooja, R. Mobile monitoring of air pollution using low cost sensors to visualize spatio-temporal variation of pollutants at urban hotspots. Sustain. Cities Soc. 2019, 44, 520–535. [Google Scholar] [CrossRef]
  22. Cummings, E.R.; Stewart, D.J.; Kremer, P.; Shakya, M.K. Predicting citywide distribution of air pollution using mobile monitoring and three-dimensional urban structure. Sustain. Cities Soc. 2022, 76, 103510. [Google Scholar] [CrossRef]
  23. Messier, P.K.; Chambliss, E.S.; Gani, S.; Alvarez, R.; Brauer, M.; Choi, J.J.; Hamburg, P.S.; Kerckhoffs, J.; LaFranchi, B.; Lunden, M.M.; et al. Mapping Air Pollution with Google Street View Cars: Efficient Approaches with Mobile Monitoring and Land Use Regression. Environ. Sci. Technol. 2018, 52, 12563–12572. [Google Scholar] [CrossRef] [PubMed]
  24. Li, P.C.; Chen, J.D.; Li, Y.X.; Wu, W. Using the InVEST-PLUS Model to Predict and Analyze the Pattern of Ecosystem Carbon storage in Liaoning Province, China. Remote Sens. 2023, 15, 4050. [Google Scholar] [CrossRef]
  25. Li, C.L.; Xu, Y.Y.; Liu, M.; Hu, Y.M.; Huang, N.; Wu, W. Modeling the Impact of Urban Three-Dimensional Expansion on Atmospheric Environmental Conditions in an Old Industrial District: A Case Study in Shenyang, China. Pol. J. Environ. Stud. 2020, 29, 3171–3181. [Google Scholar] [CrossRef] [PubMed]
  26. Li, K.M.; Li, C.L.; Liu, M.; Hu, Y.M.; Wang, H.; Wu, W. Multiscale analysis of the effects of urban green infrastructure landscape patterns on PM2.5 concentrations in an area of rapid urbanization. J. Cleaner Prod. 2021, 325, 129324. [Google Scholar] [CrossRef]
  27. Shi, Y.; Xie, X.L.; Fung, C.J.; Ng, E. Identifying critical building morphological design factors of street-level air pollution dispersion in high-density built environment using mobile monitoring. Build. Sci. 2018, 128, 248–259. [Google Scholar] [CrossRef]
  28. Zhang, R.; Yang, J.; Ma, X.Y.; Xiao, X.M.; Xia, J.H. Optimal allocation of local climate zones based on heat vulnerability perspective. Sustain. Cities Soc. 2023, 99, 104981. [Google Scholar] [CrossRef]
  29. Cressie, A.N. The origins of kriging. Math. Geol. 1990, 22, 239–252. [Google Scholar] [CrossRef]
  30. Sampson, D.P.; Richards, M.; Szpiro, A.A.; Bergen, S.; Sheppard, L.; Larson, V.T.; Kaufman, D.J. A Regionalized National Universal Kriging Model Using Partial Least Squares Regression for Estimating Annual PM2.5 Concentrations in Epidemiology. Atmos. Environ. 2013, 75, 383–392. [Google Scholar] [CrossRef]
  31. Ord, J.K.; Getis, A. Local Spatial Autocorrelation Statistics: Distributional Issues and an Application. Geogr. Anal. 1995, 27, 286–306. [Google Scholar] [CrossRef]
  32. Zhang, H.R.; Tripathi, N.K. Geospatial hot spot analysis of lung cancer patients correlated to fine particulate matter (PM2.5) and industrial wind in Eastern Thailand. J. Cleaner Prod. 2018, 170, 407–424. [Google Scholar] [CrossRef]
  33. Tadesse, S.; Enqueselassie, F.; Hagos, S. Spatial and Space-Time Clustering of Tuberculosis in Gurage Zone, Southern Ethiopia. PLoS ONE 2018, 13, 0198353. [Google Scholar] [CrossRef]
  34. Md, F.K.; Yuichiro, S.; Koichiro, H.; Shigeki, M. Characterization of PM2.5, PM2.5–10 and PM>10 in ambient air, Yokohama, Japan. Atmos. Res. 2010, 96, 159–172. [Google Scholar] [CrossRef]
  35. Xie, Y.Y.; Zhao, B.; Zhang, L.; Luo, R. Spatiotemporal variations of PM2.5 and PM10 concentrations between 31 Chinese cities and their relationships with SO2, NO2, CO and O3. Particuology 2015, 20, 141–149. [Google Scholar] [CrossRef]
  36. Kuerban, M.; Waili, Y.; Fan, F.; Liu, Y.; Qin, W.; Dore, J.A.; Peng, J.J.; Xu, W.; Zhang, F.S. Spatio-temporal patterns of air pollution in China from 2015 to 2018 and implications for health risks. Environ Pollut. 2020, 258, 113659. [Google Scholar] [CrossRef] [PubMed]
  37. Zhang, A.Q.; Xia, C.; Li, W.F. Exploring the effects of 3D urban form on urban air quality: Evidence from fifteen megacities in China. Sustain. Cities Soc. 2022, 78, 103649. [Google Scholar] [CrossRef]
  38. Luo, H.Y.; Tang, X.; Wu, H.J.; Kong, L.; Wu, Q.; Cao, Q.; Song, Y.T.; Luo, X.C.; Wang, Y.; Zhu, J.; et al. The Impact of the Numbers of Monitoring Stations on the National and Regional Air Quality Assessment in China During 2013–18. Adv. Atmos. Sci. 2022, 39, 1709–1720. [Google Scholar] [CrossRef] [PubMed]
  39. Southworth, J.; Nagendra, H.; Tucker, M.C. Fragmentation of a landscape: Incorporating landscape metrics into satellite analyses of land-cover change. Landscape. Res. 2002, 27, 253–269. [Google Scholar] [CrossRef]
  40. Kong, F.H.; Yin, H.W.; Nakagoshi, N. Using GIS and landscape metrics in the hedonic price modeling of the amenity value of urban green space: A case study in Jinan City, China. Landsc Urban Plan. 2007, 79, 240–252. [Google Scholar] [CrossRef]
  41. Shi, Y.; Ren, C.; Lau, K.K.L.; Ng, E. Investigating the influence of urban land use and landscape pattern on PM2.5 spatial variation using mobile monitoring and WUDAPT. Landsc Urban Plan. 2019, 189, 15–26. [Google Scholar] [CrossRef]
  42. Yang, H.O.; Leng, Q.M.; Xiao, Y.F.; Chen, W.B. Investigating the impact of urban landscape composition and configuration on PM2.5 concentration under the LCZ scheme: A case study in Nanchang, China. Sustain. Cities Soc. 2022, 84, 104006. [Google Scholar] [CrossRef]
  43. Gao, Y.; Wang, Z.Y.; Liu, C.; Peng, Z.R. Assessing neighborhood air pollution exposure and its relationship with the urban form. Build. Sci. 2019, 155, 15–24. [Google Scholar] [CrossRef]
  44. Li, Z.Y.; Fung, C.H.J.; Lau, K.H.A. High spatiotemporal characterization of on-road PM2.5 concentrations in high-density urban areas using mobile monitoring. Build. Sci. 2018, 143, 196–205. [Google Scholar] [CrossRef]
  45. Ke, B.; Hu, W.H.; Huang, D.M.; Zhang, J.; Lin, X.T.; Li, C.H.; Jin, X.J.; Chen, J. Three-dimensional building morphology impacts on PM2.5 distribution in urban landscape settings in Zhejiang, China. Sci. Total Environ. 2022, 826, 154094. [Google Scholar] [CrossRef]
  46. Liu, M.Y.; Chen, H.; Wei, D.; Wu, Y.N.; Li, C. Nonlinear relationship between urban form and street-level PM2.5 and CO based on mobile measurements and gradient boosting decision tree models. Build. Sci. 2021, 205, 108265. [Google Scholar] [CrossRef]
  47. Maleki, M.; Asadi, M.; Naghadehi, S.Z.; Khosravi, A.; Wang, J.Y.; Stewart, D.I.; Shakeryari, M. Detecting local climate zone change and its effects on PM10 distribution using fuzzy machine learning in Tehran, Iran. Urban Clim. 2023, 49, 101506. [Google Scholar] [CrossRef]
  48. Deng, X.D.; Gao, F.; Liao, S.Y.; Li, S.Y. Unraveling the association between the built environment and air pollution from a geospatial perspective. J. Cleaner Prod. 2023, 386, 135768. [Google Scholar] [CrossRef]
  49. Verma, V.; Fang, T.; Xu, L.; Peltier, E.R.; Russell, G.A.; Ng, L.N.; Weber, R. Organic aerosols associated with the generation of reactive oxygen species (ROS) by water-soluble PM2.5. Environ. Sci. Technol. 2015, 49, 4646–4656. [Google Scholar] [CrossRef] [PubMed]
  50. Liang, D.; Ma, C.; Wang, Y.Q.; Wang, Y.J.; Chen-Xi, Z. Quantifying PM2.5 capture capability of greening trees based on leaf factors analyzing. Environ. Sci. Pollut. 2016, 23, 21176–21186. [Google Scholar] [CrossRef]
  51. Yuan, M.; Song, Y.; Huang, Y.P.; Shen, H.F.; Li, T.W. Exploring the association between the built environment and remotely sensed PM2.5 concentrations in urban areas. J. Cleaner Prod. 2019, 220, 1014–1023. [Google Scholar] [CrossRef]
  52. Wu, J.S.; Li, J.; Peng, J.C.; Peng, J.; Li, W.F.; Xu, G.; Dong, C.C. Applying land use regression model to estimate spatial variation of PM2.5 in Beijing, China. Environ. Sci. Pollut. 2015, 9, 7045–7061. [Google Scholar] [CrossRef] [PubMed]
  53. Feng, H.H.; Zou, B.; Tang, Y.M. Scale-and region-dependence in landscape-PM2.5 correlation: Implications for urban planning. Remote Sens. 2017, 9, 918. [Google Scholar] [CrossRef]
  54. Azimi, P.; Zhao, H.R.; Fazli, T.; Zhao, D.; Faramarzi, A.; Leung, L.; Stephens, B. Pilot study of the vertical variations in outdoor pollutant concentrations and environmental conditions along the height of a tall building. Build. Sci. 2018, 138, 124–134. [Google Scholar] [CrossRef]
  55. Huang, C.Y.; Hu, T.T.; Duan, Y.S.; Li, Q.Y.; Chen, N.; Wang, Q.; Zhou, M.G.; Rao, P.H. Effect of urban morphology on air pollution distribution in high-density urban blocks based on mobile monitoring and machine learning. Build. Sci. 2022, 219, 109173. [Google Scholar] [CrossRef]
  56. Miao, C.P.; Yu, S.; Hu, Y.M.; Liu, M.; Yao, J.; Zhang, Y.; He, X.Y.; Chen, W. Seasonal effects of street trees on particulate matter concentration in an urban street canyon. Sustain. Cities Soc. 2021, 73, 103095. [Google Scholar] [CrossRef]
  57. Bi, S.B.; Dai, F.; Chen, M.; Xu, S. A new framework for analysis of the morphological spatial patterns of urban green space to reduce PM2.5 pollution: A case study in Wuhan, China. Sustain. Cities Soc. 2022, 82, 103900. [Google Scholar] [CrossRef]
  58. Su, T.H.; Lin, C.S.; Lu, S.Y.; Lin, J.C.; Wang, H.H.; Liu, C.P. Effect of air quality improvement by urban parks on mitigating PM2.5 and its associated heavy metals: A mobile-monitoring field study. J. Environ. Man. 2022, 323, 116283. [Google Scholar] [CrossRef] [PubMed]
  59. Yang, S.; Wu, H.T.; Chen, J.; Lin, X.T.; Lu, T. Optimization of PM2.5 Estimation Using Landscape Pattern Information and Land Use Regression Model in Zhejiang, China. Atmosphere 2018, 9, 47. [Google Scholar] [CrossRef]
  60. Jones, A.B.; Fleck, J. Shrinking lakes, air pollution, and human health: Evidence from California’s Salton Sea. Sci. Total Environ. 2020, 712, 136490. [Google Scholar] [CrossRef] [PubMed]
  61. Cai, M.; Ren, C.; Xu, Y.; Dai, W.; Wang, X.M. Local Climate Zone Study for Sustainable Megacities Development by Using Improved WUDAPT Methodology—A Case Study in Guangzhou. Procedia Environ. Sci. 2016, 36, 82–89. [Google Scholar] [CrossRef]
  62. Cao, Q.; Luan, Q.Z.; Liu, Y.P.; Wang, R.Q. The effects of 2D and 3D building morphology on urban environments: A multi-scale analysis in the Beijing metropolitan region. Build Environ. 2021, 192, 107635. [Google Scholar] [CrossRef]
  63. Peng, J.; Chen, S.; Lü, H.L.; Liu, Y.X.; Wu, J.S. Spatiotemporal patterns of remotely sensed PM2.5 concentration in China from 1999 to 2011. Remote Sens. Environ. 2016, 174, 109–121. [Google Scholar] [CrossRef]
Figure 1. Schematic summary of the study area: (a) Location map of Shenyang City. (b) Wenhua Road block map. (c) Block three-dimensional architectural forms diagram.
Atmosphere 15 00794 g001
Figure 2. Change of PM2.5 concentration in Shenyang City from 2000 to 2022.
Atmosphere 15 00794 g002
Figure 3. Design of the mobile monitoring route.
Atmosphere 15 00794 g003
Figure 4. LCZ classification map of the Wenhua Road block.
Atmosphere 15 00794 g004
Figure 5. Visualization of PM2.5 concentration data measurement in the blocks.
Atmosphere 15 00794 g005
Figure 6. Verification of the measurement data accuracy.
Atmosphere 15 00794 g006
Figure 7. Spatial interpolation concentration distribution of three kinds of particulate matter at different pollution levels: (a) pollution level 1; (b) pollution level 2; (c) pollution level 3.
Atmosphere 15 00794 g007
Figure 8. Particulate matter risk area identification map: (a,c,e) annual spatial interpolation results diagram of particulate matter; (b,d,f) particulate matter cold and hot spots analysis map.
Atmosphere 15 00794 g008
Figure 9. Statistical map particulate matter concentration under different LCZ land use classifications: (a) Statistical maps of PM1 concentrations under different LCZ land use classifications; (b) Statistical Map of PM2.5 Concentration under Different LCZ Land Use Classification; (c) Statistical maps of PM10 concentrations under different LCZ land use classifications.
Atmosphere 15 00794 g009
Table 1. Correlation analysis between the LCZ and particulate matter concentration in neighborhoods.
Variables of AnalysisLCZ
Spearman’s Correlation AnalysisSig. (Two-Tailed)
PM1−0.207 **0.000
PM2.5−0.246 **0.000
PM10−0.265 **0.000
Note: ** is a significant correlation at the 0.01 level (two-tailed).
Disclaimer/Publisher’s Note: The statements, opinions and data contained in all publications are solely those of the individual author(s) and contributor(s) and not of MDPI and/or the editor(s). MDPI and/or the editor(s) disclaim responsibility for any injury to people or property resulting from any ideas, methods, instructions or products referred to in the content.

