Abstract
The regional differences in carbon dioxide (CO2) variations from the Orbiting Carbon Observatory-2 (OCO-2) over the Beijing-Tianjin-Hebei (Jing-Jin-Ji) region from 2015 to 2021 are analyzed in this study. This study shows an annual increase and a seasonal cycle; the CO2 annual growth rate was about 2.63 ppm year−1, with the highest value being in spring and the lowest in summer. The spatial distribution is unbalanced, regional differences are prominent, and the CO2 concentration is lower in the north of the Jing-Jin-Ji region (like Zhangjiakou, Chengde, and Qinhuangdao). Land-type structures and population economy distributions are the key factors affecting CO2 concentration. By analyzing the land-type structures over Jing-Jin-Ji in 2020, we find that cropland, woodland, and grassland (CWG) are the main land cover types in Jing-Jin-Ji; the proportion of these three types is about 83.3%. The woodland areas in Zhangjiakou, Chengde, and Qinhuangdao account for about 65% of the total woodland areas in Jing-Jin-Ji; meanwhile, the grassland areas in these three regions account for 62% of the total grassland areas in Jing-Jin-Ji. CO2 concentration variation shows a high negative correlation with CWG land areas (coefficient of determination (R2) > 0.76). The regions with lower population and GDP secondary industry (SI) density also have lower CO2 concentration (like Zhangjiakou, Chengde, and Qinhuangdao), and the regions with higher population and GDP SI density also have higher CO2 concentration (like the southeast of Jing-Jin-Jin).
1. Introduction
Atmospheric carbon dioxide (CO2) is the most significant anthropogenic greenhouse gas in the atmosphere because of its important role in global warming and the carbon cycle [1,2]. According to the World Meteorological Organization (WMO) report, the analysis of observations from the WMO Global Atmosphere Watch (GAW) in situ observational network shows that globally averaged surface mole fractions for CO2 reached new highs in 2021, with CO2 at 415.7 ± 0.2 ppm; the value constitutes 149% of pre-industrial (before 1750) levels [3]. This significant increase in CO2 concentration poses many direct and indirect threats to the climate system with adverse consequences, such as rising sea levels and more extreme weather conditions [4].
The Beijing-Tianjin-Hebei (Jing-Jin-Ji) region is known as the capital economic circle of China, which includes two centrally directly controlled municipalities (Beijing and Tianjin) and Hebei province, which is the biggest urbanized region in Northern China [5]. As an important policy implementation unit, the policy of coping with climate change in the Jing-Jin-Ji region puts forward requirements for carbon emissions. By optimizing the allocation of land resources, the Jing-Jin-Ji region plays a certain role in reducing carbon emissions. Therefore, scientific evaluation of the climate effect of the Jing-Jin-Ji region has a key role to play in reducing pollution and carbon [6].
Satellite observations are widely acknowledged to be important tools for use in quantitatively evaluating the long-term spatial and temporal distribution characteristics of atmospheric composition [7]. A significant event was the launch of the SCanning Imaging Absorption spectroMeter for Atmospheric CHartographY (SCIAMACHY) instrument on board the ENVISAT satellite in March 2002, which enabled the retrieval of CO2 concentration on a global scale [8,9]. SCIAMACHY observations are more sensitive to CO2 concentration changes in the lowest atmospheric layers, where the variability due to sources and sinks is the largest [10], but SCIAMACHY is not a satellite specifically designed for carbon monitoring. In order to develop a more precise understanding of global greenhouse gases, Japan successfully launched the GOSAT satellite in 2009, which was the first satellite specifically designed for detecting the atmospheric greenhouse gases CO2 and CH4 [11]. Subsequently, the GOSAT-2 satellite was successfully launched in 2018, and as the direct successor to GOSAT-1, the GOSAT-2 satellite aims to use higher-performance sensors to detect higher-precision greenhouse gas concentration data. The National Aeronautics and Space Administration (NASA) successfully launched the Orbiting Carbon Observatory-2 (OCO-2) in 2014 and the Orbiting Carbon Observatory-3 (OCO-3) in 2019 [12,13]. And the Chinese carbon dioxide observation satellite (Tansat) launched in 2016 [14]. Of these, the OCO-2 is important for monitoring CO2, and it currently provides a large number of near-surface CO2 data products.
This manuscript focuses on variations in CO2 concentration over Jing-Jin-Ji during 2015–2021. The Jing-Jin-Ji region is an area in northern China that is the focus of increasing scientific attention [15]. The objectives of this study are (1) to analyze variations in CO2 concentration over Jing-Jin-Ji region; (2) to study the change trend of CO2 concentration in different regions; (3) to analyze the correlation between land-type structure and CO2 concentration in different cities, and (4) to determine whether population and GDP density have affected changes in CO2 concentration.
2. Materials and Methods
2.1. Study Area
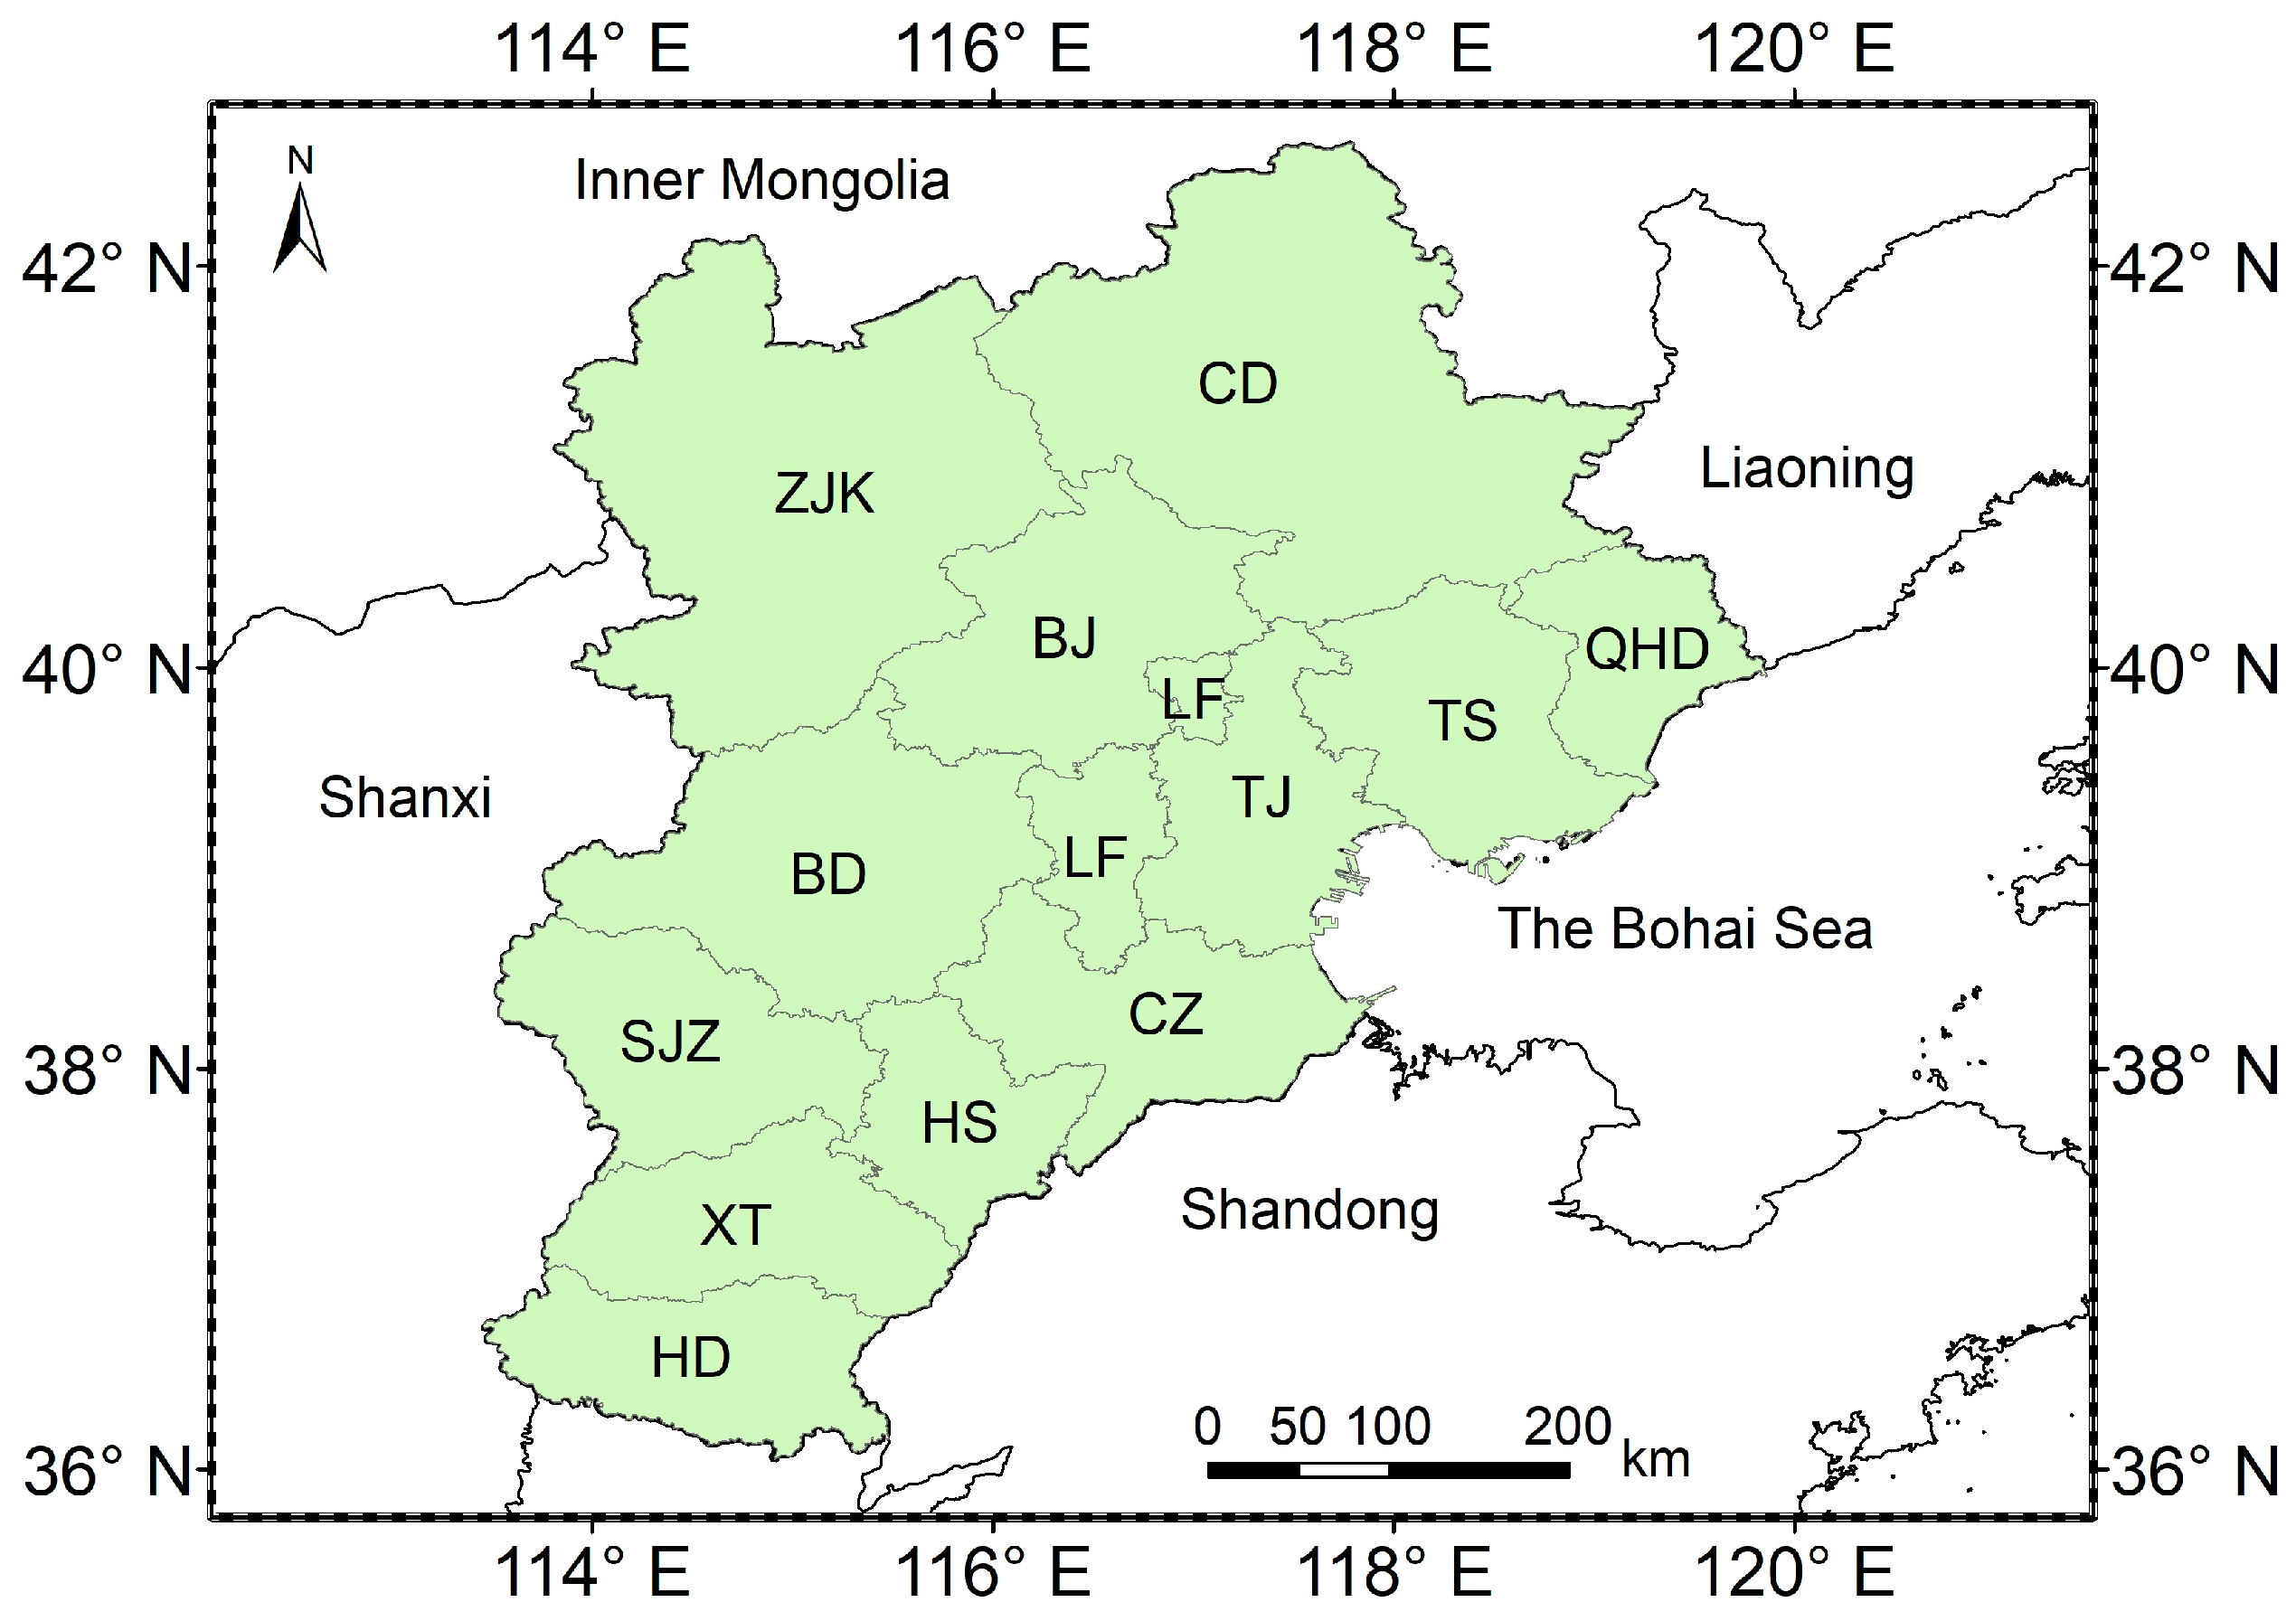
The Jing-Jin-Ji region is located on the eastern coast of China and comprises Beijing, Tianjin, and Hebei (Figure 1). According to the Hebei Economic Yearbook (2022), Jing-Jin-Ji covers an area of about 217,000 km2, has a population of 110 million, and in 2022, it had a GDP of 9636 billion. It has a humid continental climate characterized by hot, humid summers and cold, dry, winters [16]. Figure 1 shows the Jing-Jin-Ji region comprising Beijing (BJ), Tianjin (TJ), Shijiazhuang (SJZ), Tangshan (TS), Qinhuangdao (QHD), Handan (HD), Xingtai (XT), Baoding (BD), Zhangjiakou (ZJK), Chengde (CD), Cangzhou (CZ), Langfang (LF), and Hengshui (HS). As the largest urbanized megalopolis region in northern China, the Jing-Jin-Ji region is under considerable pressure to reduce carbon emissions [17].
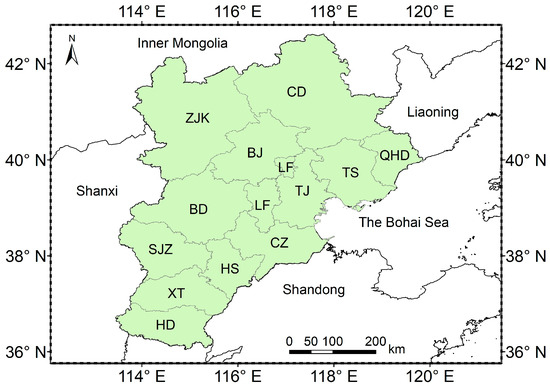
Figure 1.
Location of the study area in this study.
2.2. OCO-2 Satellite Data
The OCO-2 satellite was launched on 2 July 2014 and started collecting data on 4 September 2014, which operates in a sun-synchronous polar orbit at an altitude of about 705 km, nominally crossing the equator at 13:36 local time [18]. The OCO-2 instrument incorporates three high-resolution spectrometers that make coincident measurements of reflected sunlight in the near-infrared CO2 near 1.61 and 2.06 μm and in the molecular oxygen (O2) A-band at 0.76 μm. In the spatial domain, the OCO-2 instrument has a narrow swath; it collects 8 soundings over its 0.8 degree wide swath every 0.333 s, yielding surface footprints with along-track dimensions < 2.25 km and cross-track dimensions that vary from 0.1 to 1.3 km at nadir [19].
The OCO2_GEOS_L3CO2_MONTH data product is used in this study, with a data format of NetCDF-4 and a spatial resolution of 0.5° × 0.625°. This manuscript mainly analyzes the CO2 concentration acquired from 2015 to 2021, and these data are obtained from NASA’s Earth Observing System Data and Information System (EOSDIS) (https://earthdata.nasa.gov/) (accessed on 24 January 2024).
2.3. Land Use Remote Sensing Monitoring Data
The land use remote sensing monitoring data are available from the Resource and Environmental Science Data Platform (https://www.resdc.cn/) (accessed on 1 March 2024). The land use types include cropland, woodland, grassland, water area, built-up land, and unused land. The cropland mainly includes paddy land and dry land; the woodland includes forest, shrubs, woods, and others; the grassland includes dense grassland, moderate grassland, and sparse grassland; the water area includes river and drainage, lakes, reservoirs and ponds, ice and permanent snow, tideland, and bottomland; the built-up land includes urban area, rural area, and other kinds of construction land (such as factory, mine, industrial zone, and so on); and the unused land includes sandy land, gobi, saline land, swampland, bared land, rocky land, and others (such as tundra).
2.4. In Situ Data
The Shangdianzi background CO2 datasets from the surface monitoring station are available from the World Data Centre for Greenhouse Gases (WDCGG) (https://gaw.kishou.go.jp/) (accessed on 1 March 2024). The WDCGG serves to gather, archive, and provide data on greenhouse gases and related gases in the atmosphere and ocean, as observed under global atmosphere watch (GAW) and other programmes. These datasets are monthly CO2 data files from January 2015 to September 2015, and the sampling type is flask.
The Xianghe CO2 datasets are available from the Total Carbon Column Observing Network (TCCON) (https://tccondata.org/) (accessed on 18 May 2024). The TCCON is a network of ground-based Fourier transform spectrometers recording direct solar spectra in the near infrared spectral region. Xianghe CO2 data files from June 2018 to December 2021 are used in this manuscript.
This article also uses statistical datasets relating to population and GDP, which cover the period of 2020 in eastern China and are collected from the China Statistical Yearbook 2021 (https://www.stats.gov.cn/sj/ndsj/) (accessed on 10 March 2024).
2.5. Population and Gross Domestic Product Density Datasets
The population density and gross domestic product (GDP) density datasets in 2020 over Jing-Jin-Ji are also used in this article, which are provided yearly at 1 km spatial resolution. The population density map is generated based on night-time imagery and land-use data; the methods have been described in detail elsewhere [20,21]. The GDP density map is generated based on land use data; the method has been described in detail elsewhere [22].
3. Results and Discussion
3.1. Validation of Satellite Data
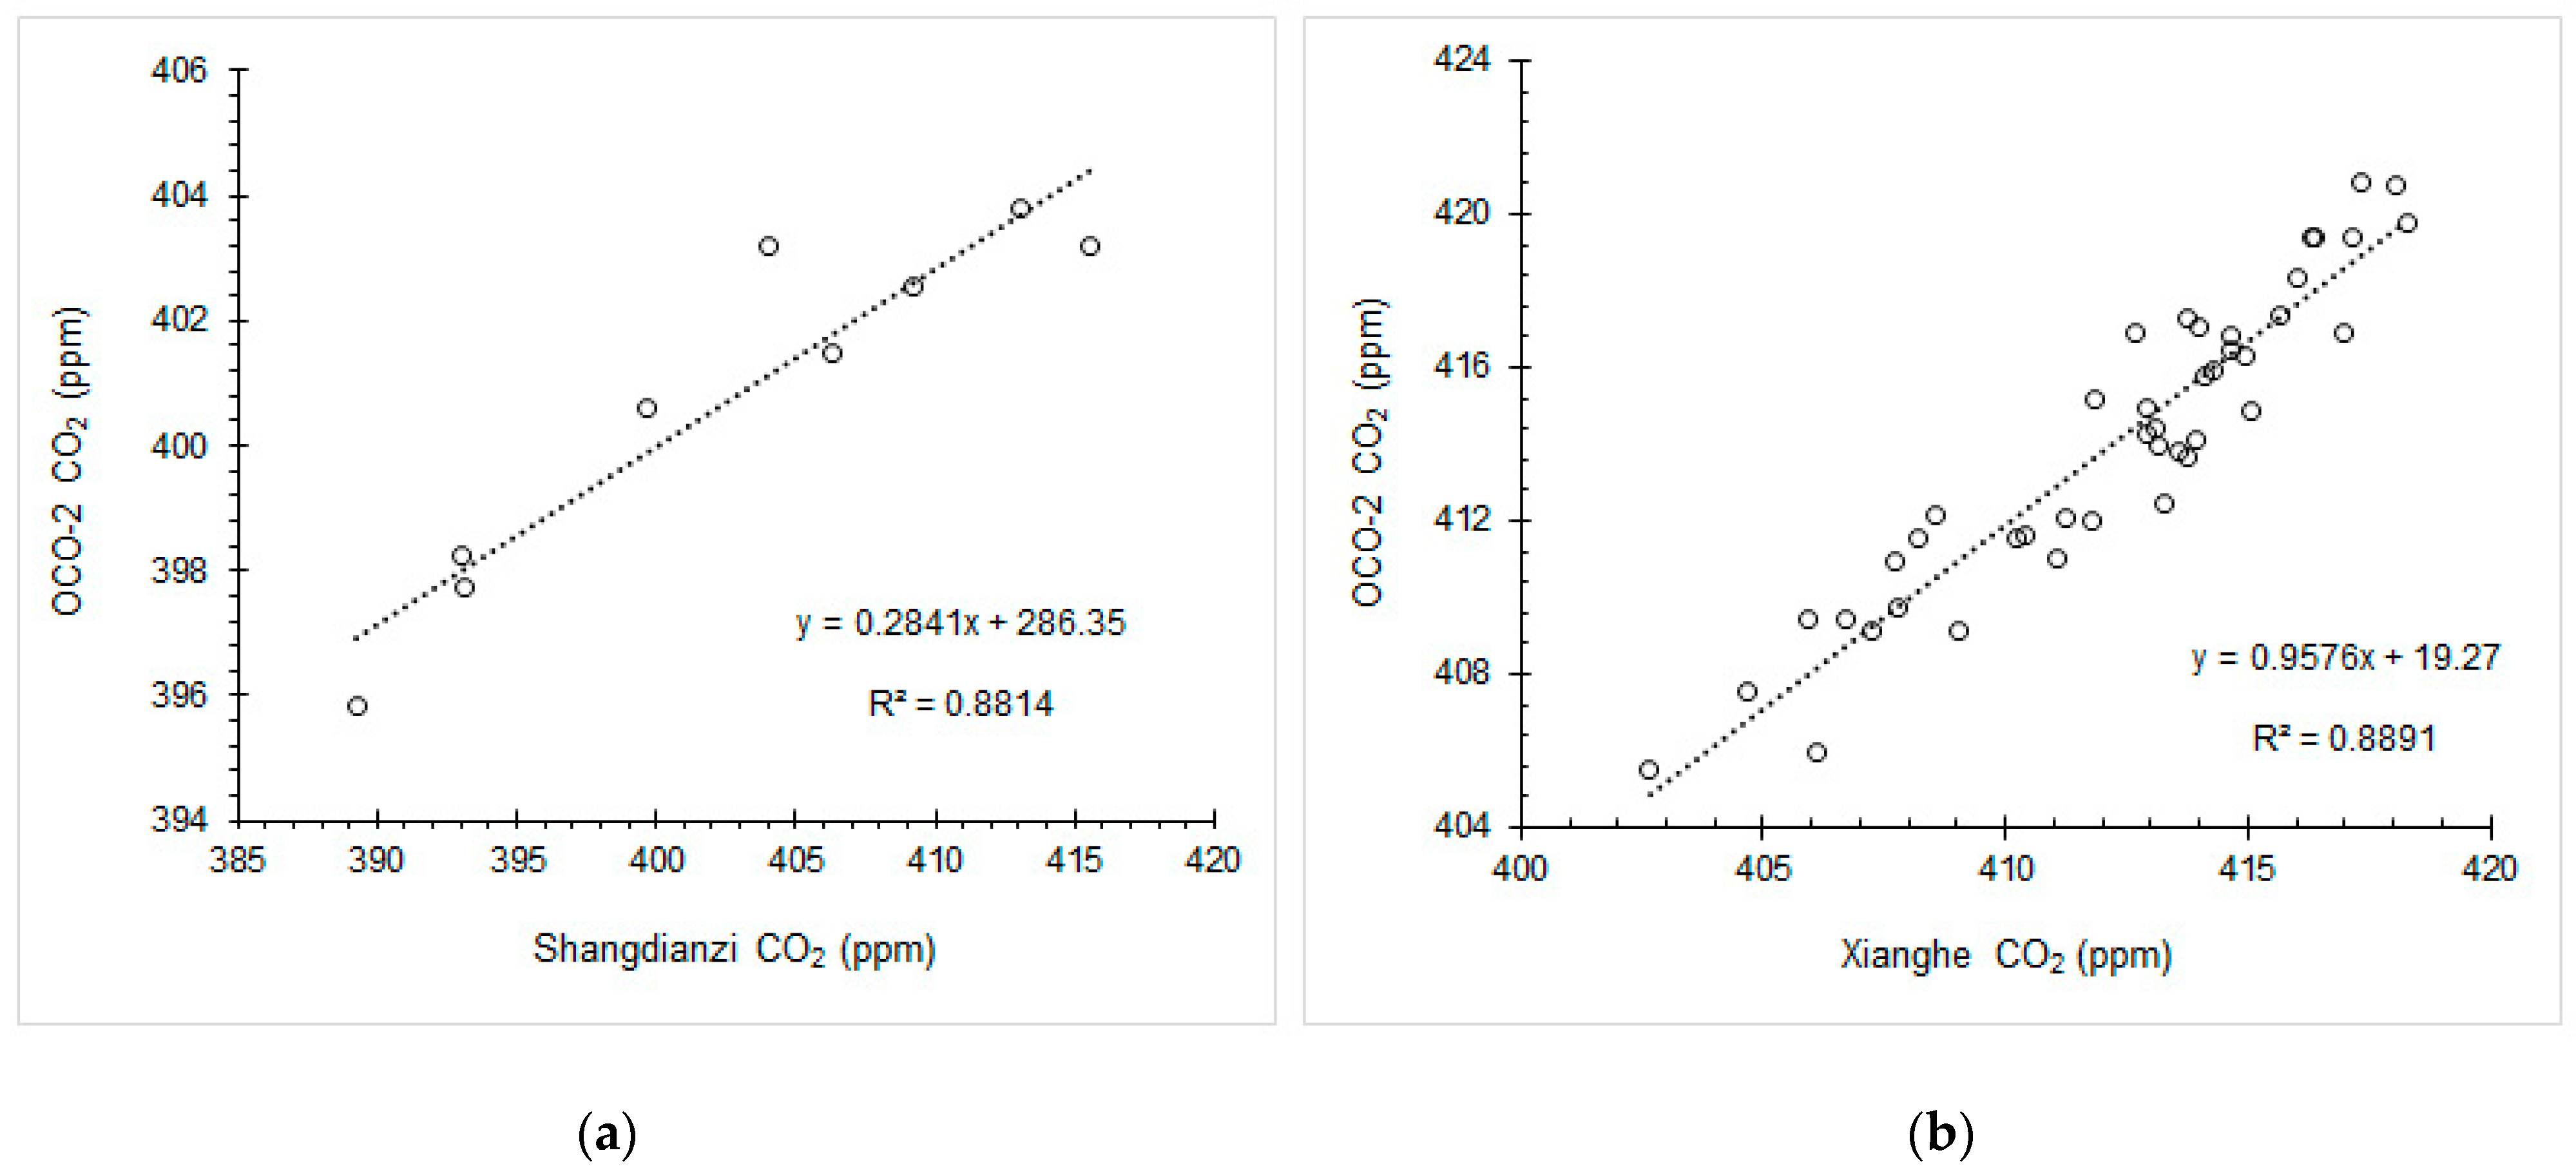
To assess the accuracy of OCO-2 CO2 data in Jing-Jin-Ji region, observations from Shangdianzi and Xianghe surface monitoring station within the region are selected, a comparison is made with monthly mean CO2 retrievals, and data for each monitoring station are compared with those obtained from OCO-2 data derived from the same grid. Figure 2a shows the correlation of monthly mean CO2 from OCO-2 and Shangdianzi station during January 2015 to September 2015. Results reveal that data from OCO-2 are consistent with those of in situ measurements (coefficient of determination R2 = 0.8814). The correlation of monthly mean CO2 from OCO-2 and Xianghe station during June 2018 to December 2021 is shown in Figure 2b, and R2 = 0.8891. Therefore, OCO-2 CO2 data are considered to be reflective of changes in CO2 concentration trends within the Jing-Jin-Ji region.
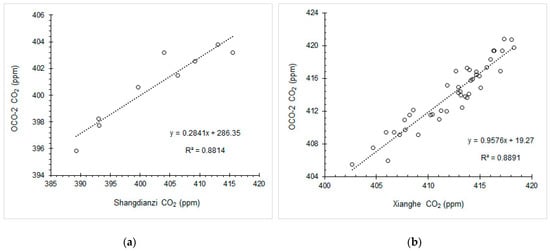
Figure 2.
(a) Correlation of monthly mean CO2 from OCO-2 and Shangdianzi station from January 2015 to September 2015; (b) correlation of monthly mean CO2 from OCO-2 and Xianghe station form June 2018 to December 2021.
3.2. Spatiotemporal Variations of CO2 over Jing-Jin-Ji
Figure 3a shows the spatial distribution of CO2 concentration over Jing-Jin-Ji at the city level during 2015–2021. Regional differences in the CO2 concentration are prominent, the spatial distribution is unbalanced, and the concentration of CO2 is higher in the southeast of the Jing-Jin-Ji region, such as in LF, TJ, CZ, HS, XT, and SJZ. ZJK and CD have lower CO2 concentration. The multi-year seasonal average CO2 over Jing-Jin-Ji derived from OCO-2 for 2015–2021 is presented in Figure 3b (spring: March, April, May; summer: June, July, August; autumn: September, October, November; and winter: January, February, December), with the highest value being in spring and the lowest in summer.
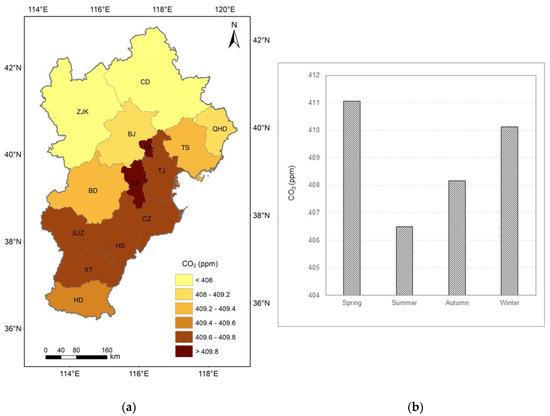
Figure 3.
(a) Spatial distribution of CO2 concentration over Jing-Jin-Ji at the city level during 2015–2021; (b) multi-year seasonal average CO2 over Jing-Jin-Ji derived from OCO-2 for 2015–2021.
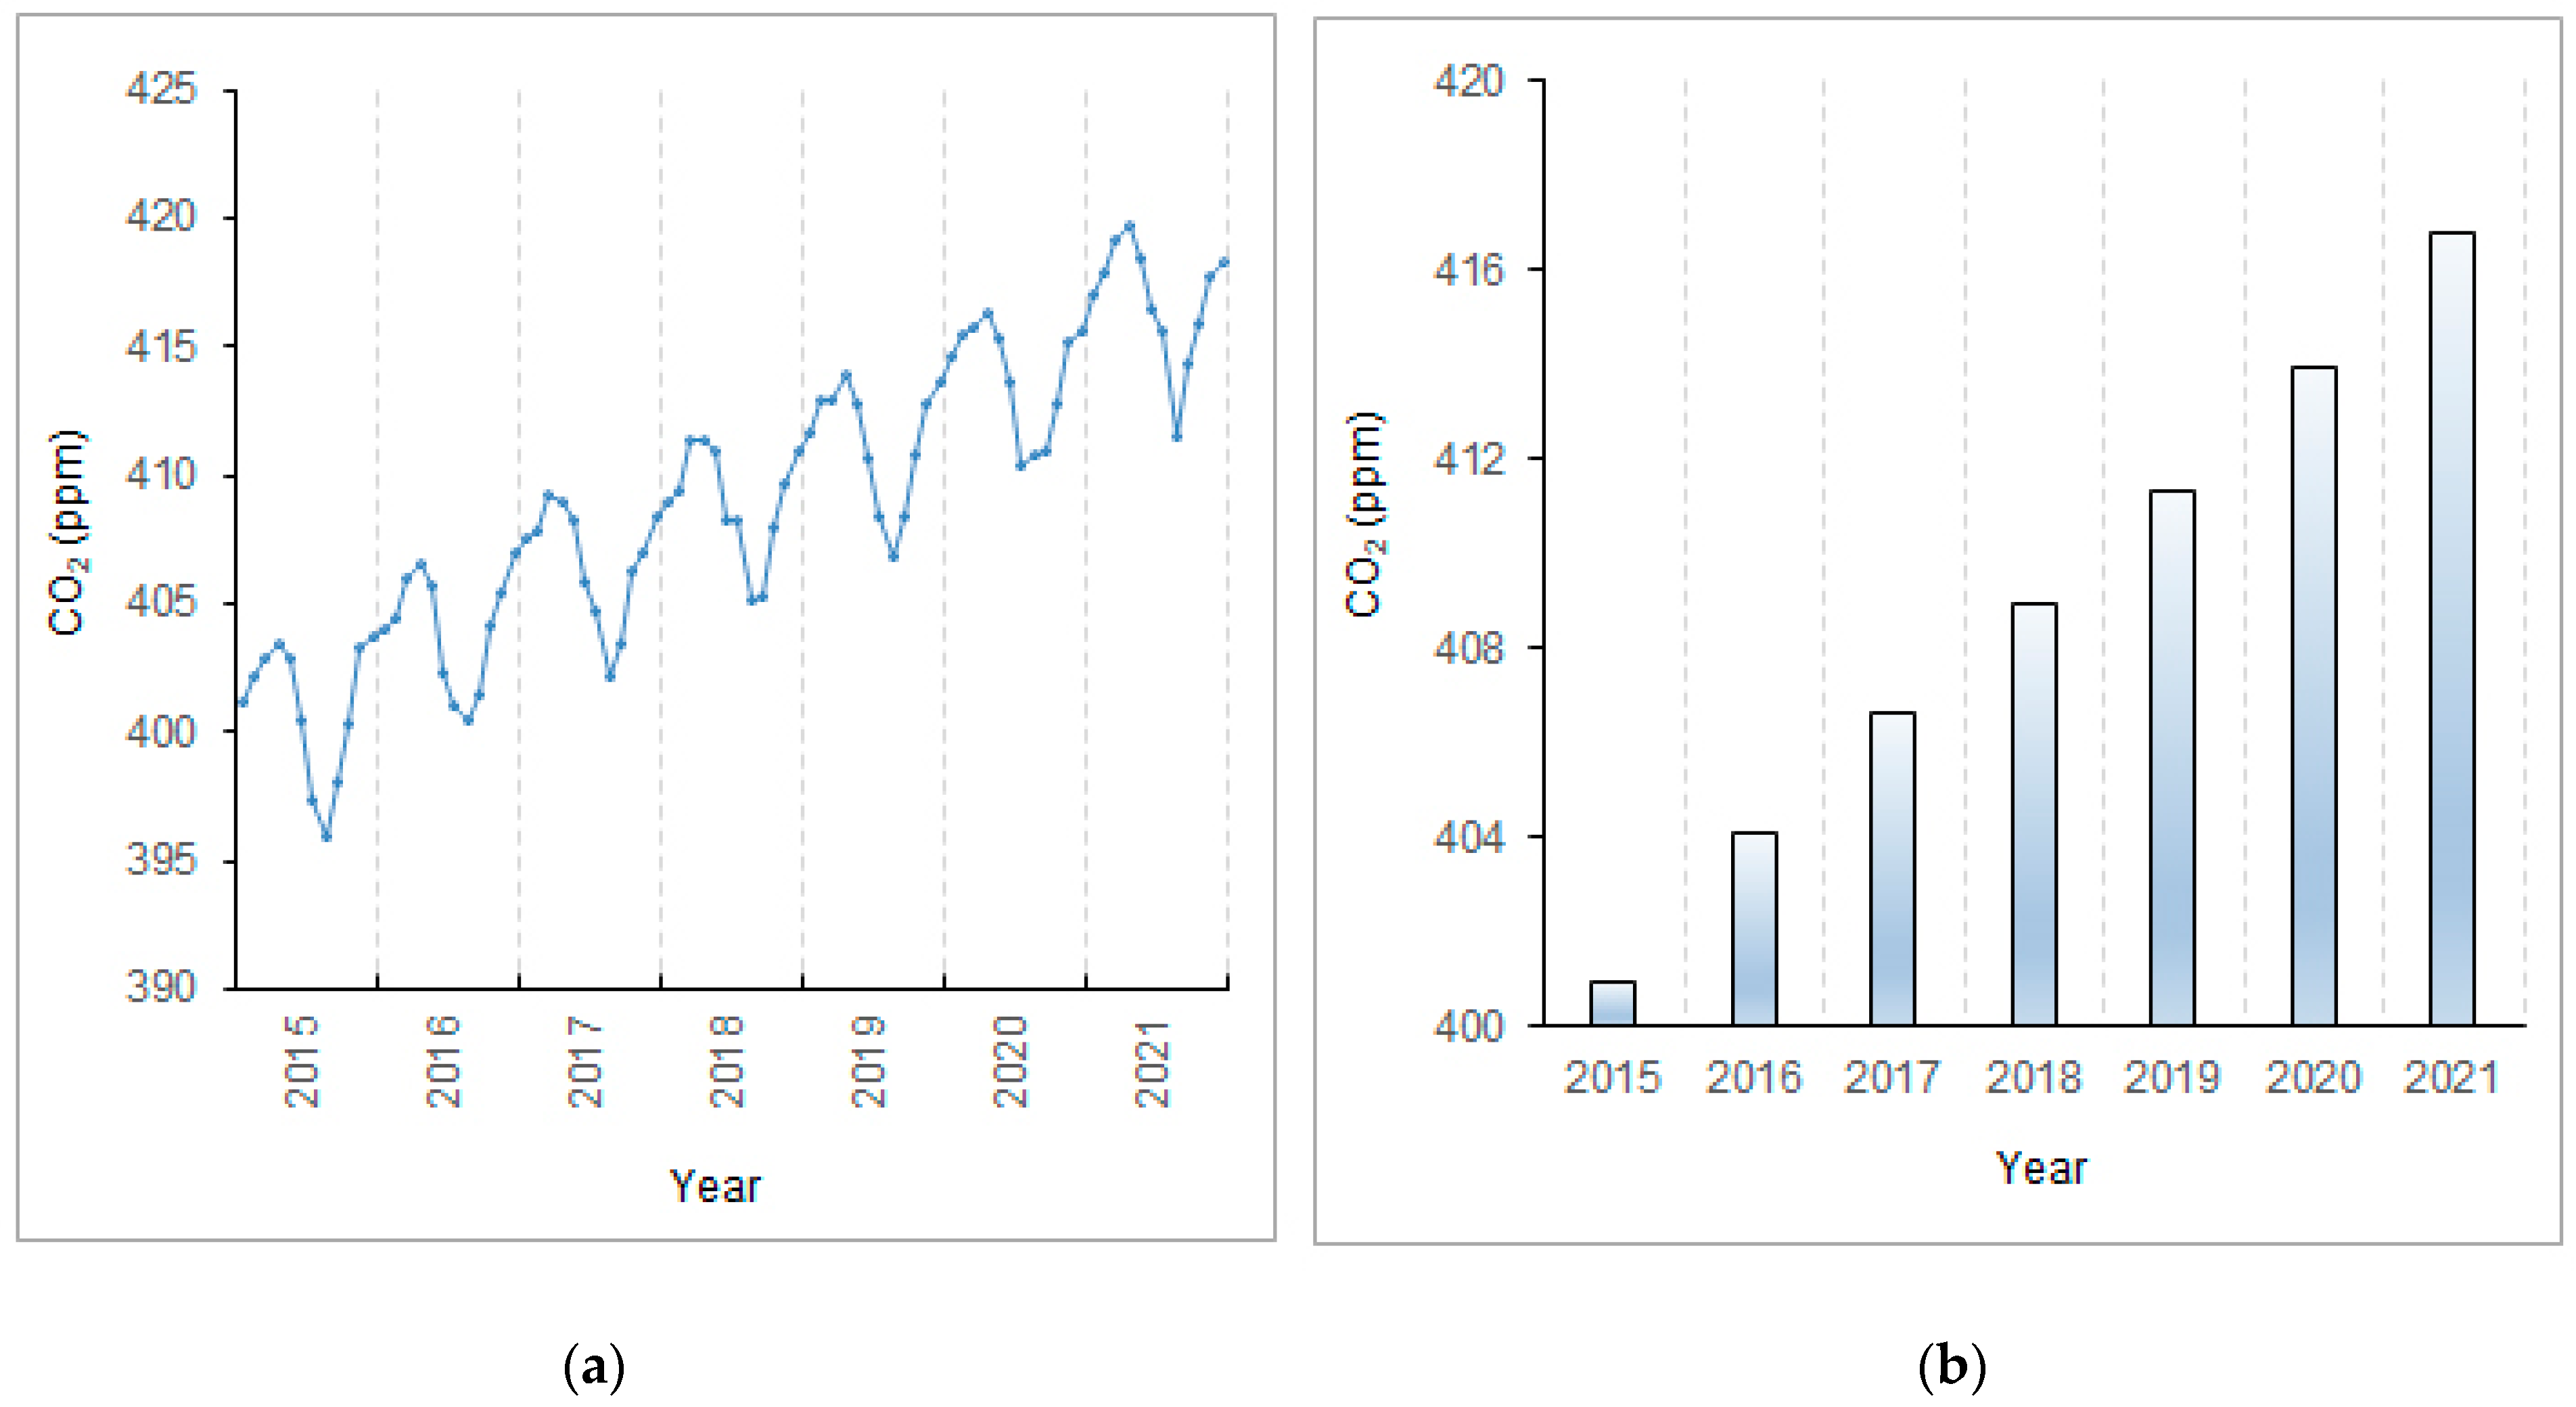
Figure 4a shows the monthly variations in CO2 concentration obtained from OCO-2 over Jing-Jin-Ji from January 2015 to December 2021. Seasonal cycle characteristics are significant; the highest values occur in spring and the lowest in summer, and the annual averages of CO2 concentration for the years 2015–2021 over Jing-Jin-Ji are presented in Figure 4b. Yearly variations in the CO2 concentration over Jing-Jin-Ji are prominent, and the trend in the average annual value of CO2 appears to increase year by year. The yearly averaged CO2 concentration over Jing-Jin-Ji based on satellite data grows from 400.97 ppm in 2015 to 416.81 ppm in 2021; the annual growth rate is 2.63 ppm year−1.
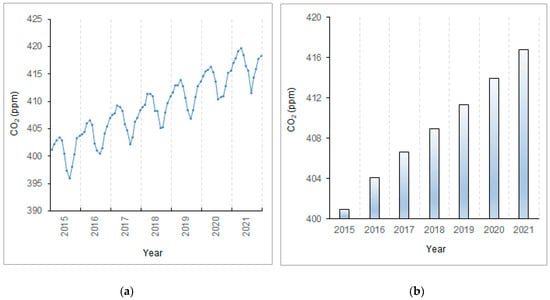
Figure 4.
(a) Monthly variations in CO2 concentration obtained from OCO-2 over Jing-Jin-Ji during January 2015 to December 2021; (b) annual averages of CO2 concentration for the years 2015–2021 over Jing-Jin-Ji.
3.3. Regional Differences in CO2 Concentration at the City Level
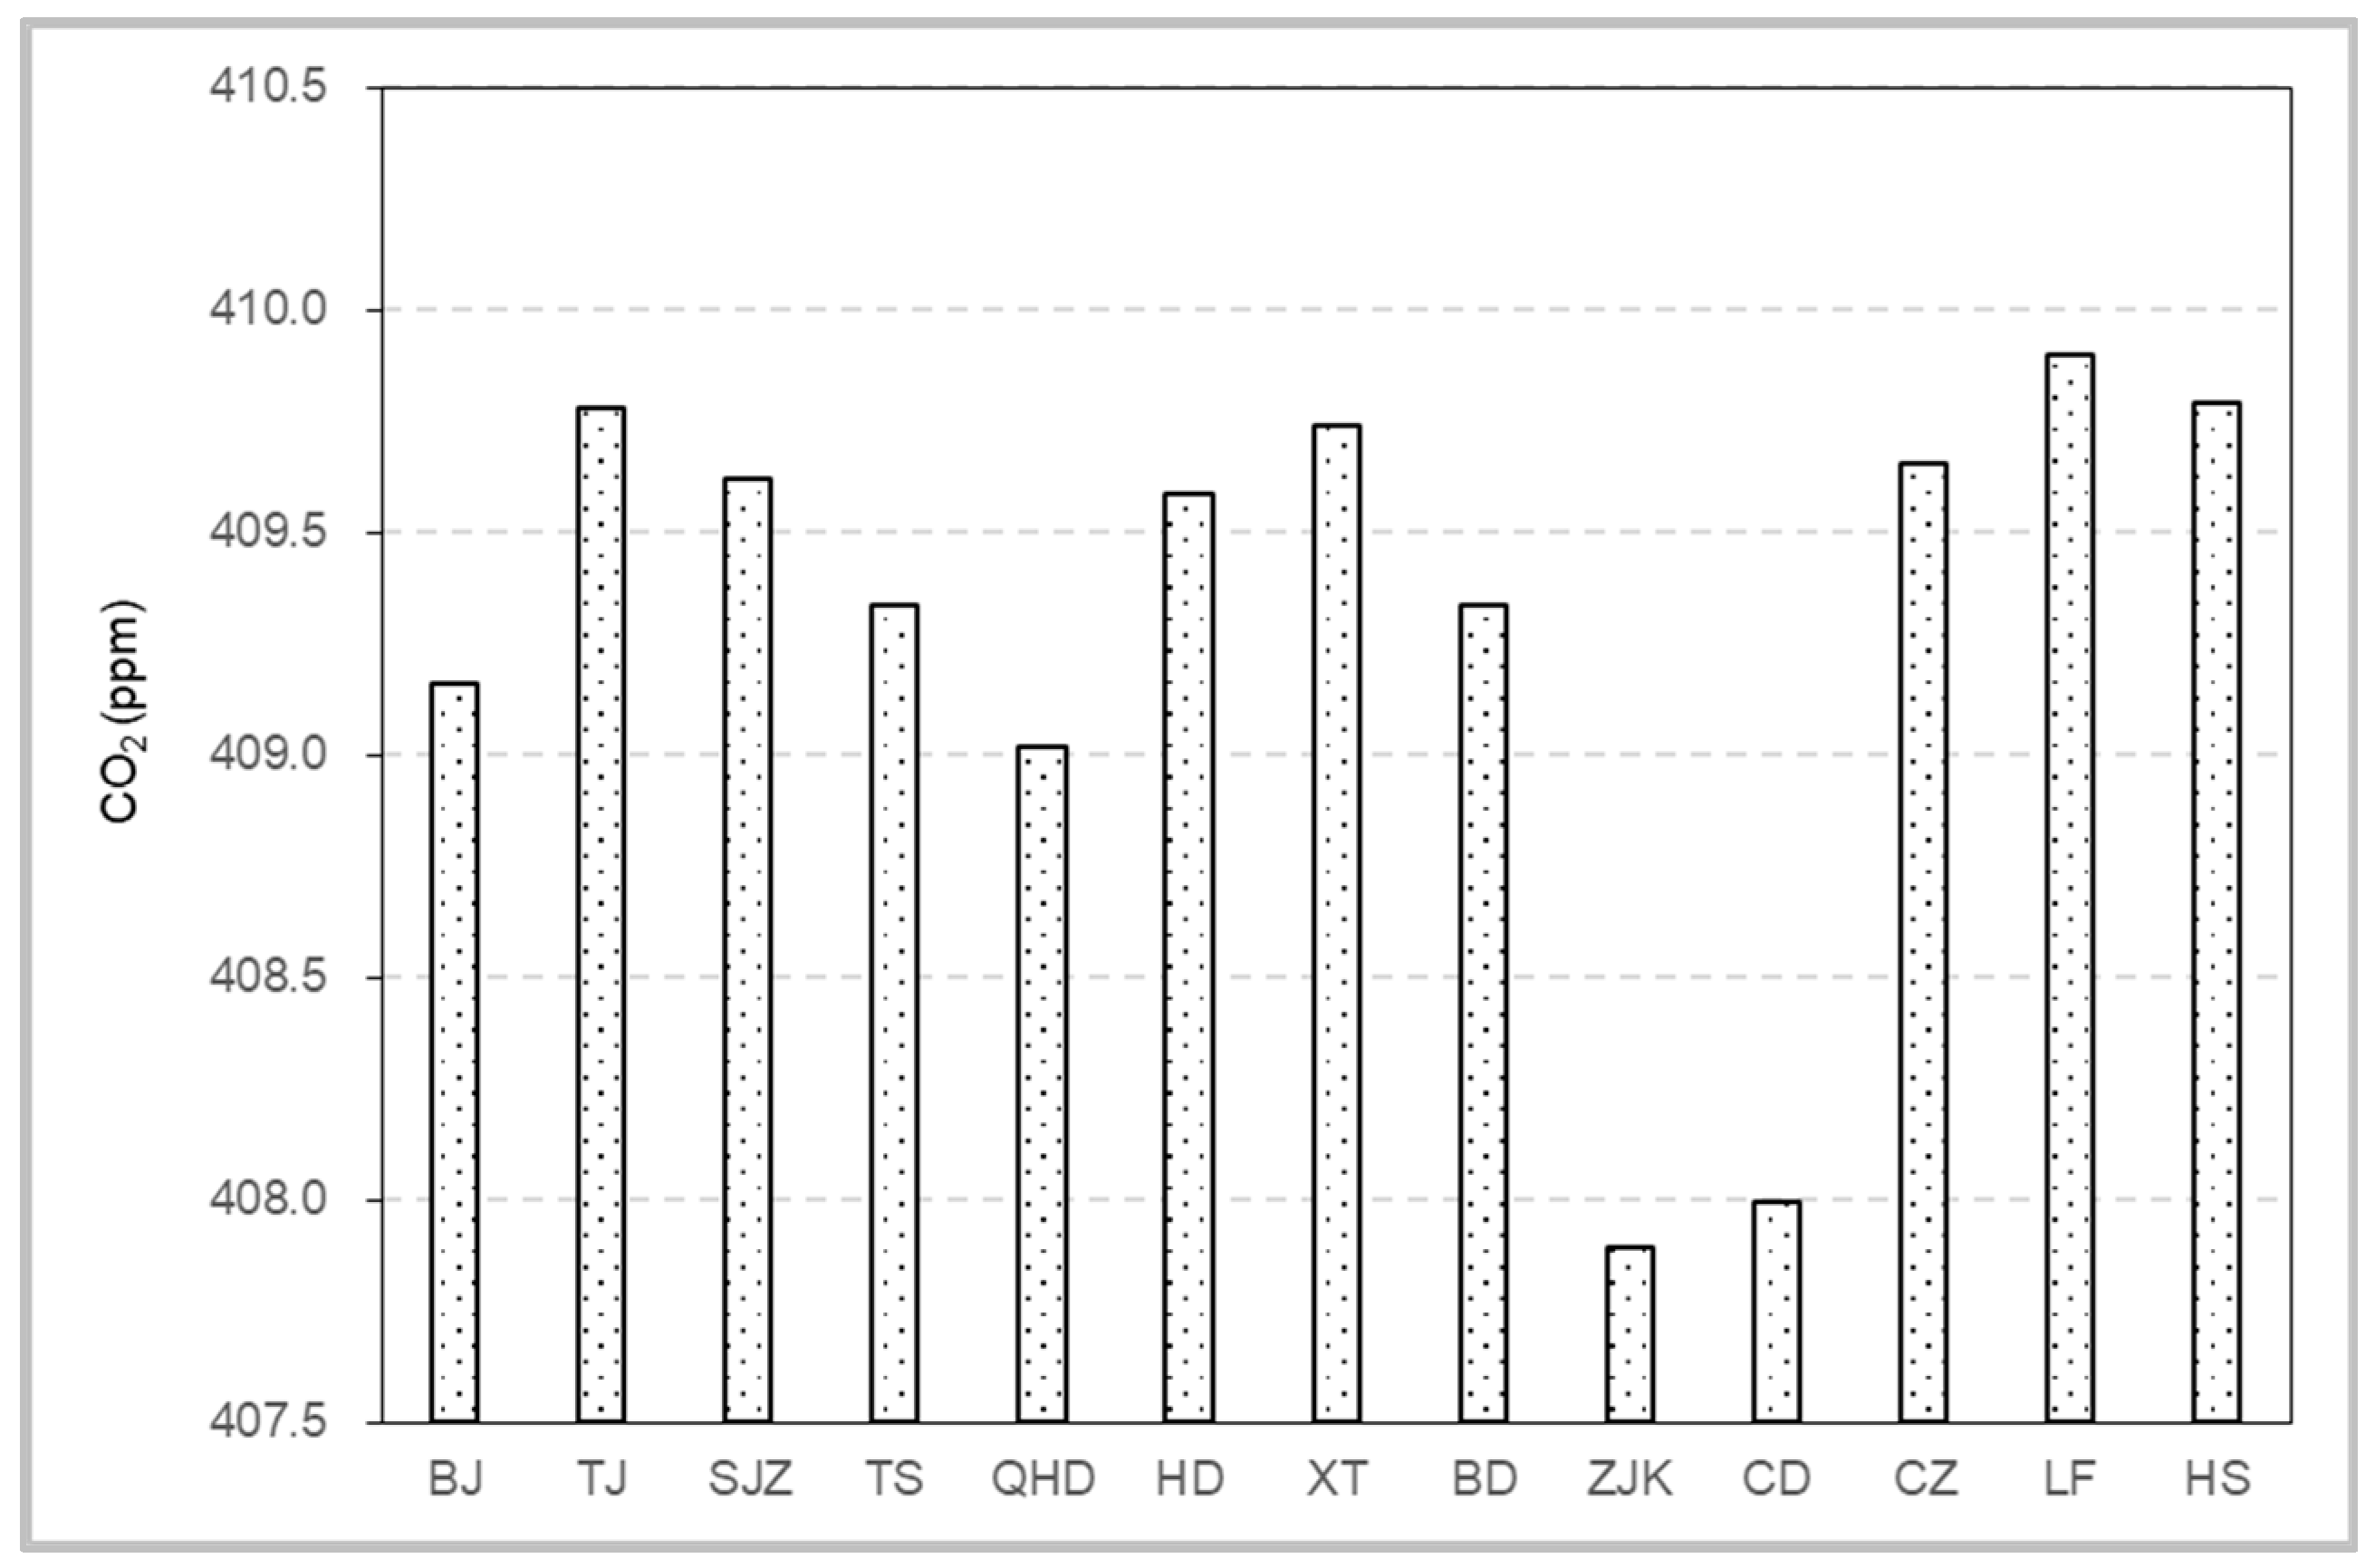
Figure 5 shows the annual mean CO2 concentration over Jing-Jin-Ji region at the city level based on OCO-2 data during the period 2015–2021; the yearly variations in the CO2 concentration over 13 regions are prominent; LF and HS have higher CO2 concentration, and ZJK and CD have lower CO2 concentration. The regions with a CO2 concentration higher than 409.5 ppm are TJ, SJZ, HD, XT, CZ, LF, and HS, and the regions with the CO2 concentration lower than 408 ppm are ZJK and CD.

Figure 5.
Annual mean CO2 concentration over Jing-Jin-Ji region at the city level based on OCO-2 data during the period 2015–2021.
Table 1 shows the regional differences in CO2 concentration over Jing-Jin-Ji at the city level during 2015–2021, as well as the statistics are yearly changes characteristics of each region. The regions with higher multi-year average CO2 concentration are LF, HS, TJ, and XT; and the regions with lower CO2 concentration are ZJK and CD. The annual average CO2 concentration in ZJK, CD, QHD, and BJ is lower than that in the whole of Jing-Jin-Ji. There is little difference in the CO2 growth rate of each region, which is basically between 1.97 and 2.0; HD has the highest annual growth rate, with a value of 2.0 ppm.

Table 1.
Regional differences in CO2 concentration over Jing-Jin-Ji at the city level during 2015–2021.
3.4. Correlation between Land-Type Structure and CO2 Concentration in Different Cities
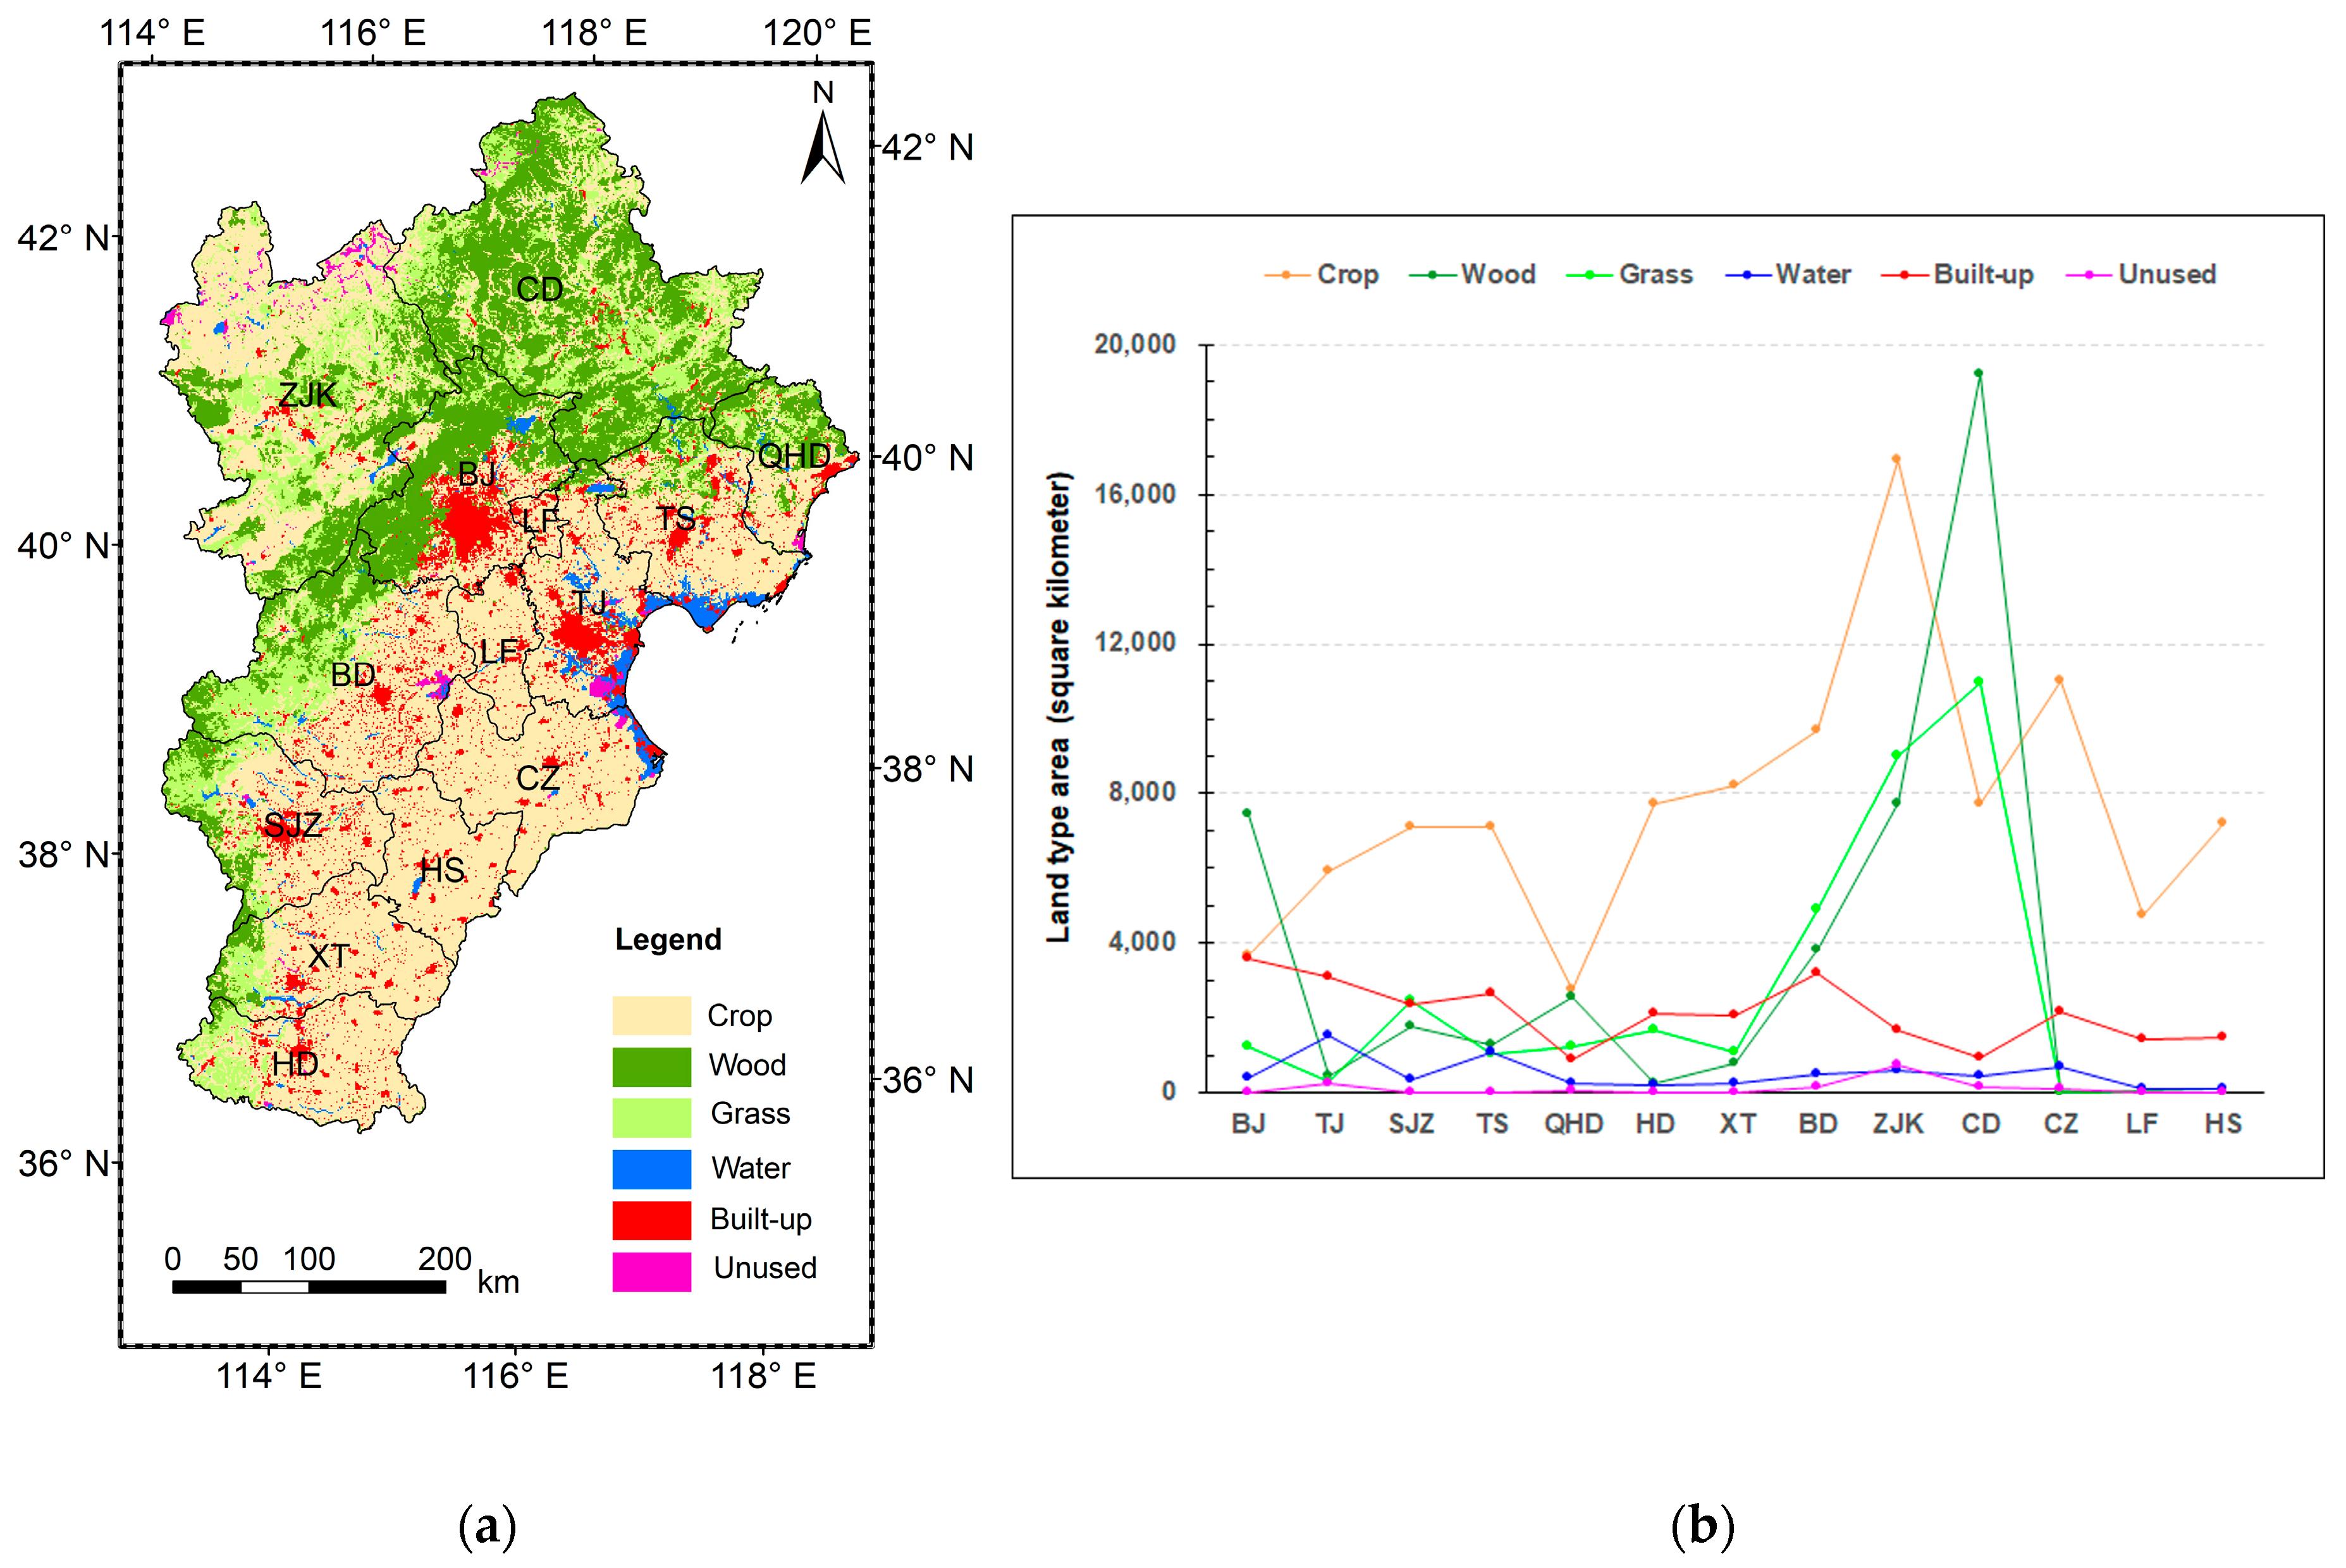
Land-type structure is the factor affecting CO2 concentration. This paper quantitatively analyzes the relationship between land-type structure and CO2 concentration over Jing-Jin-Ji. Figure 6a presents the land cover type map of Jing-Jin-Ji in 2020; the regions with high vegetation coverage are concentrated in the northwest of Jing-Jin-Ji region, such as ZJK, CD, northwest of BJ, northwest of BD, north of QHD, west of SJZ, west of XT, and west of HD. Cropland is concentrated in the southeast of the Jing-Jin-Ji region, such as CZ, HS, XT, HD, east of SJZ, southeast of BD, LF, south of QHD. Built-up land is mainly distributed in the BJ and TJ. Figure 6b presents a quantitative analysis of the area of each land surface type in each city; the regions with more cropland are ZJK, CZ, and BD; and CD has the largest woodland, followed by ZJK and BJ. CD and ZJK have more grassland, followed by BD. regions with built-up land area of more than 3000 square kilometers include BJ, TJ, and BD. ZJK has the most unused land.
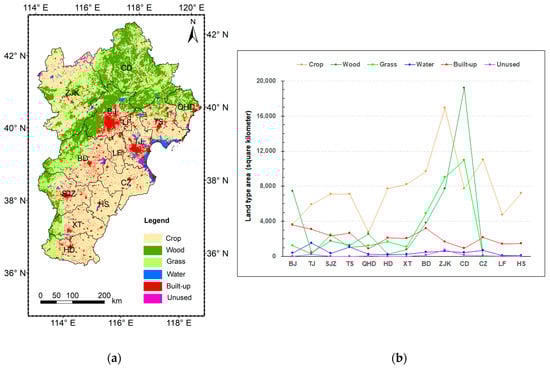
Figure 6.
(a) Land cover type map of Jing-Jin-Ji in 2020; (b) area of each land type at the city level in 2020.
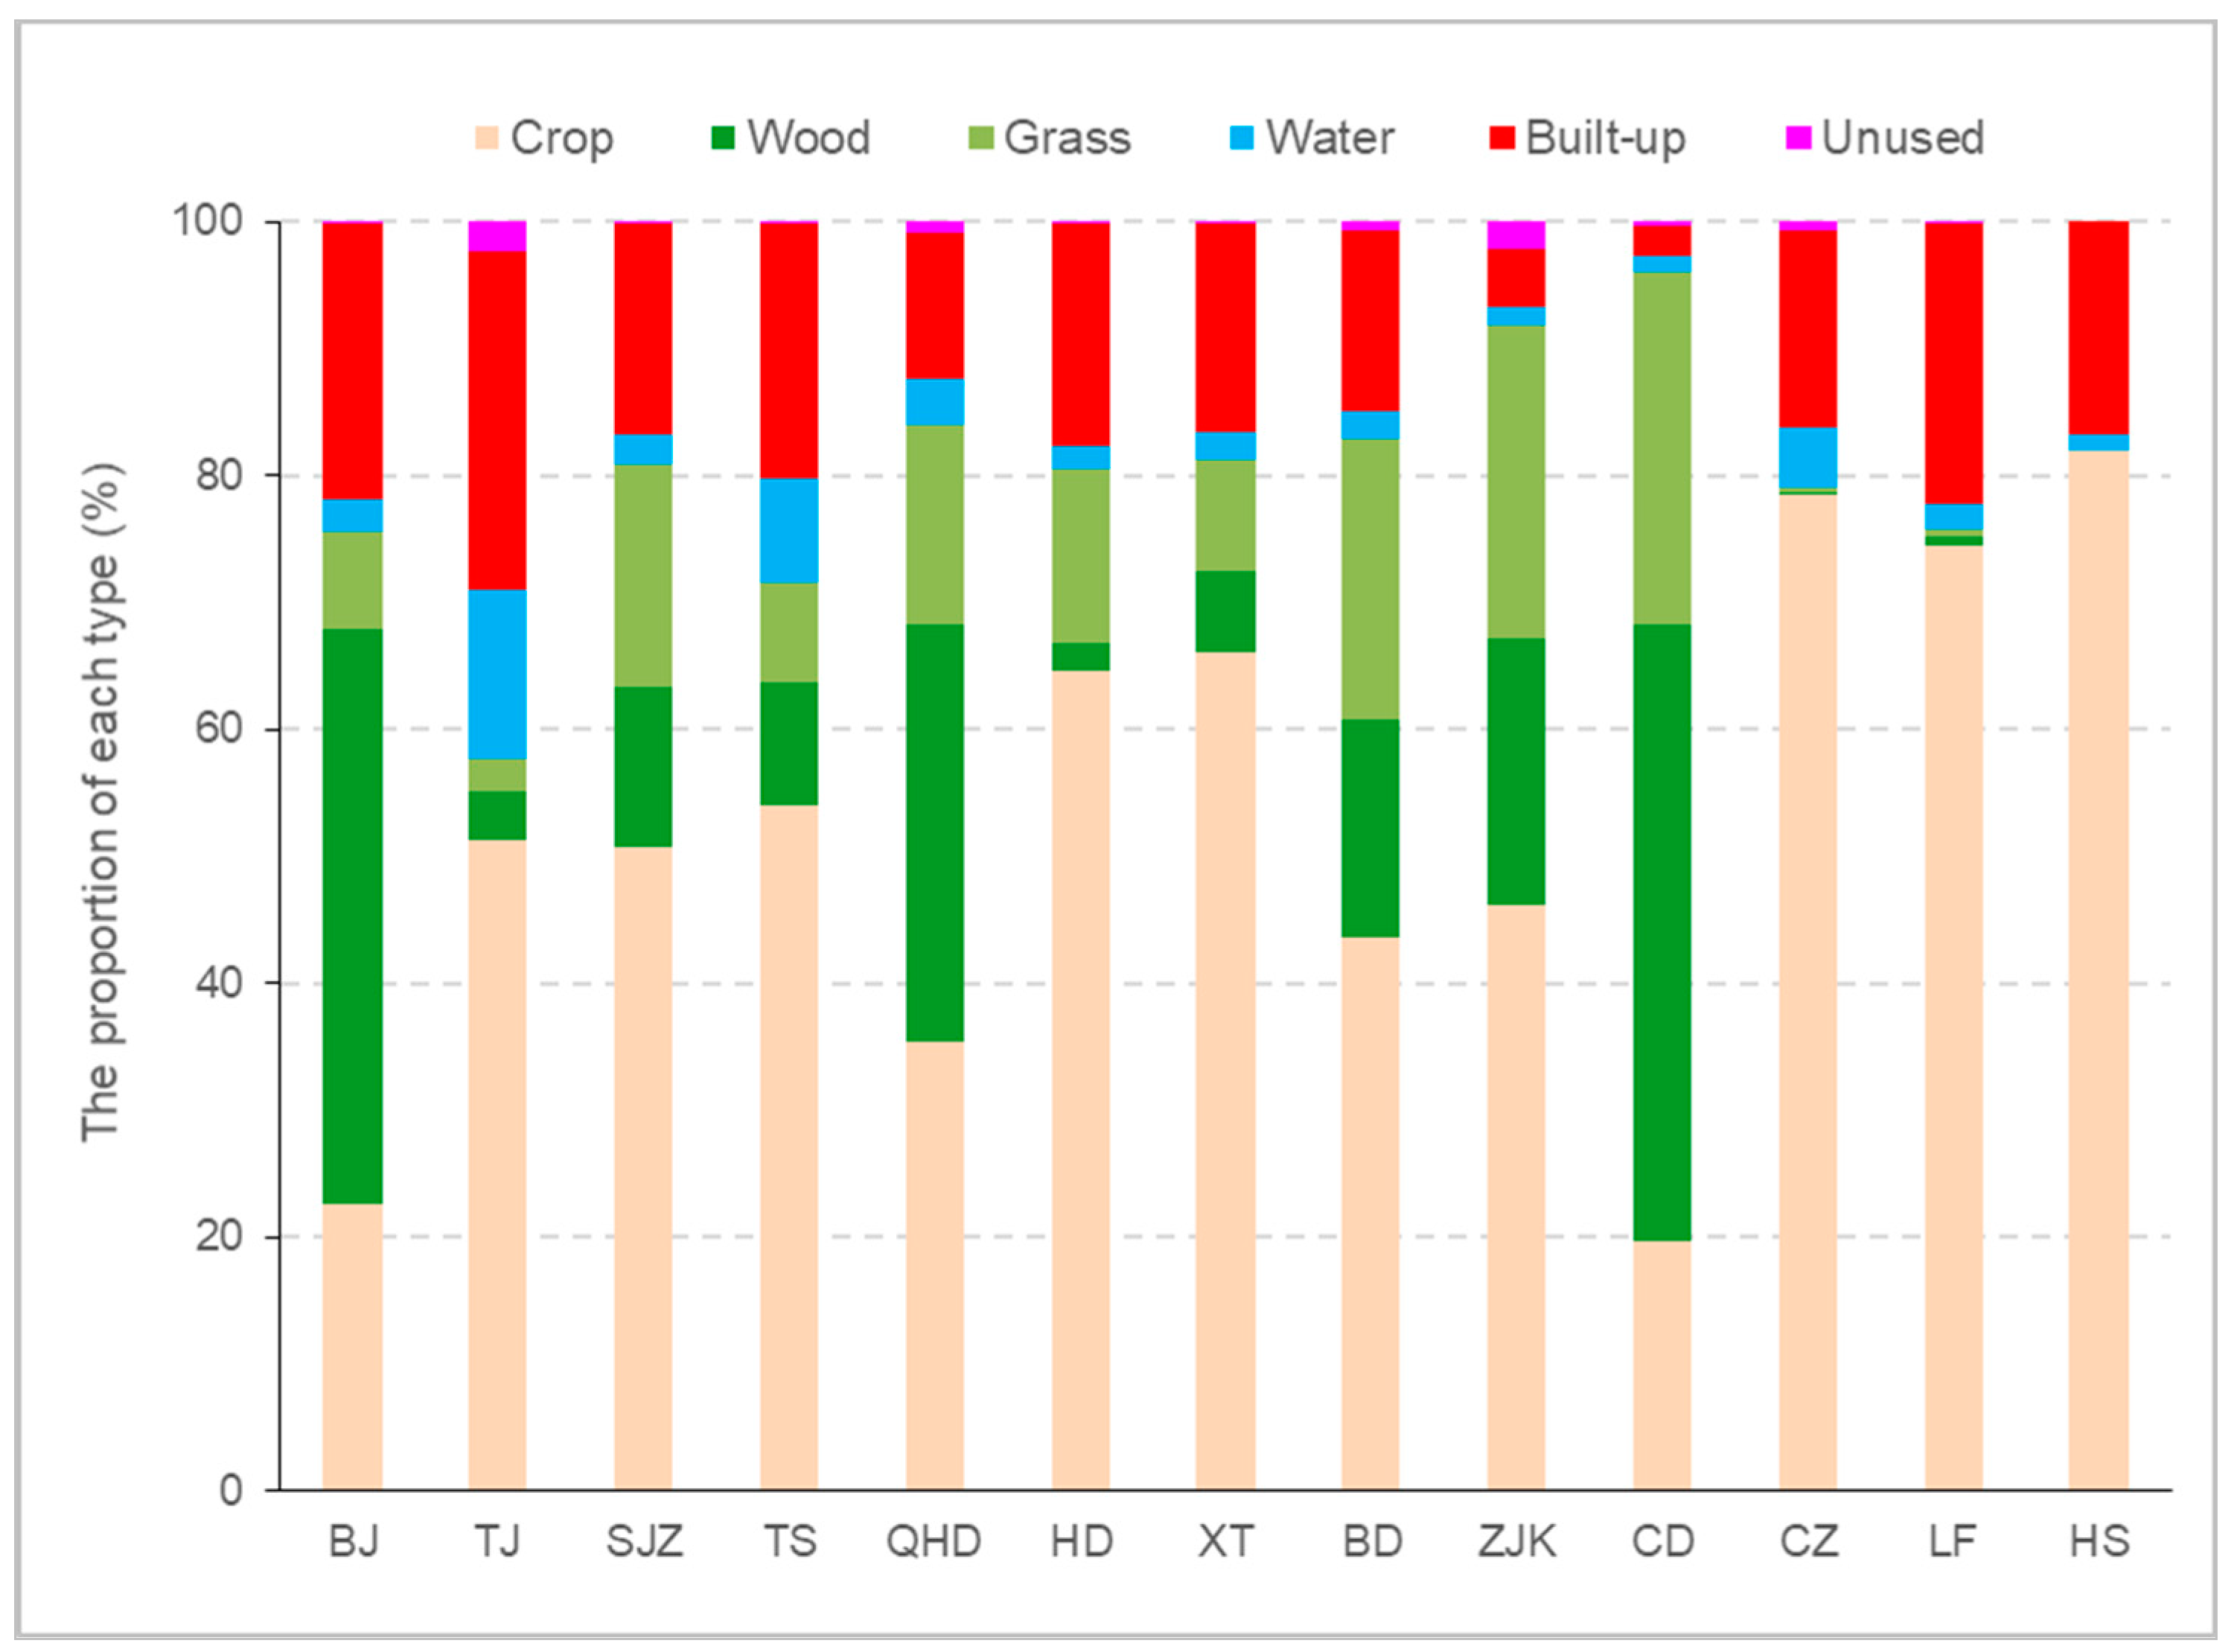
Figure 7 presents the land-type composition over Jing-Jin-Ji region at the city level in 2020; different cities have different land-type compositions, and cropland is the main land type in each city. Among them, regions with a proportion of cropland greater than 60% include HD, XT, CZ, LF, and HS. The regions with a proportion of woodland greater than 20% include BJ, QHD, CD, and ZJK; the proportion of woodland in CD is the highest, with a value of 48.6%. The regions with a proportion of grassland greater than 20% include BD, CD, and ZJK, the proportion of grassland in CD is the highest, with a value of 27.8%. The regions with a proportion of built-up land greater than 20% include BJ, TJ, TS, and LF; the proportion of built-up land in TJ is the highest, with a value of 26.6%. Crop, wood, and grass (CWG) are the main land-type structures in each region; the proportion of CWG in ZJK and CD has reached 92% and 96%, respectively.
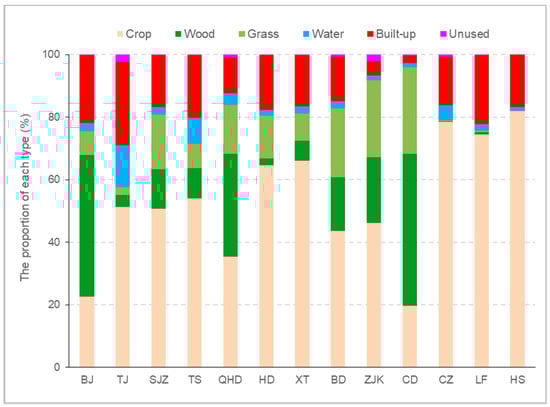
Figure 7.
Land-type composition over Jing-Jin-Ji region at the city level in 2020.
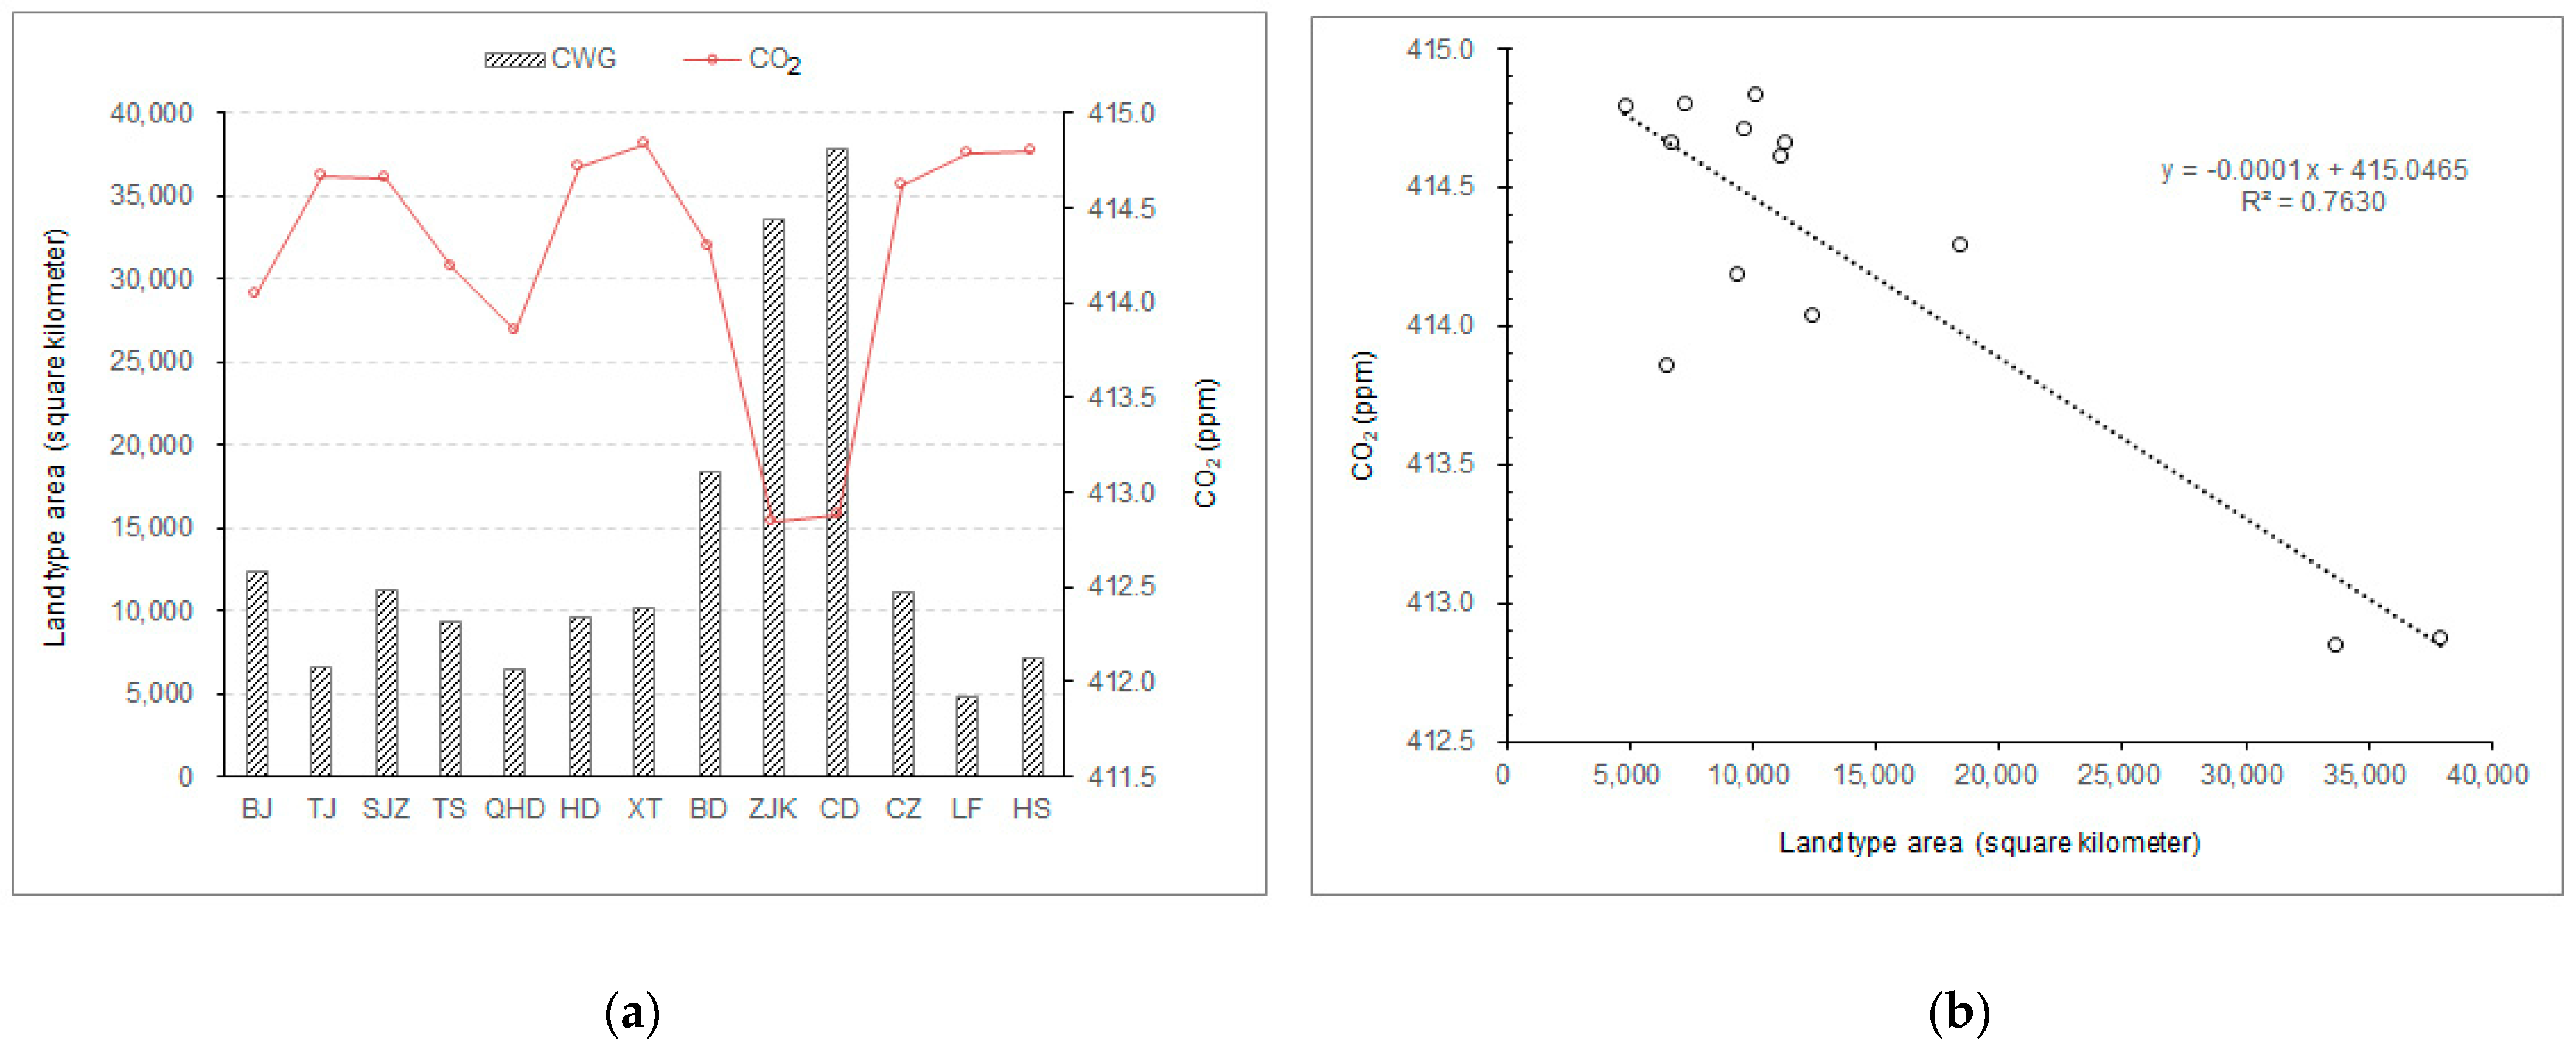
A comparison between the CO2 and CWG areas over Jing-Jin-Ji in 2020 is presented in Figure 8. Changes in CO2 are negatively correlated with the CWG areas (Figure 8a); the regions with higher CWG areas have lower CO2 concentration (like ZJK and CD). The CO2 concentration shows a high negative correlation (R2 = 0.76) to the CWG areas over Jing-Jin-Ji in 2020 (Figure 8b). Therefore, there is a relationship between land-type structure and CO2 concentration.
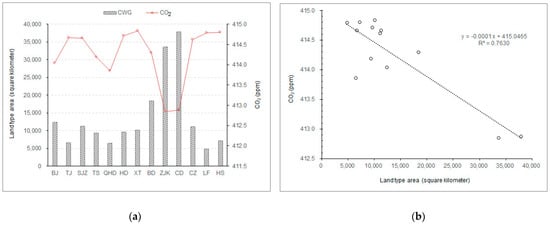
Figure 8.
Comparison between CO2 and CWG areas over Jing-Jin-Ji in 2020: (a) changes in CO2 and CWG areas; (b) correlation between CO2 and CWG areas.
3.5. Correlation between Population Economy and CO2 Concentration in Different Cities
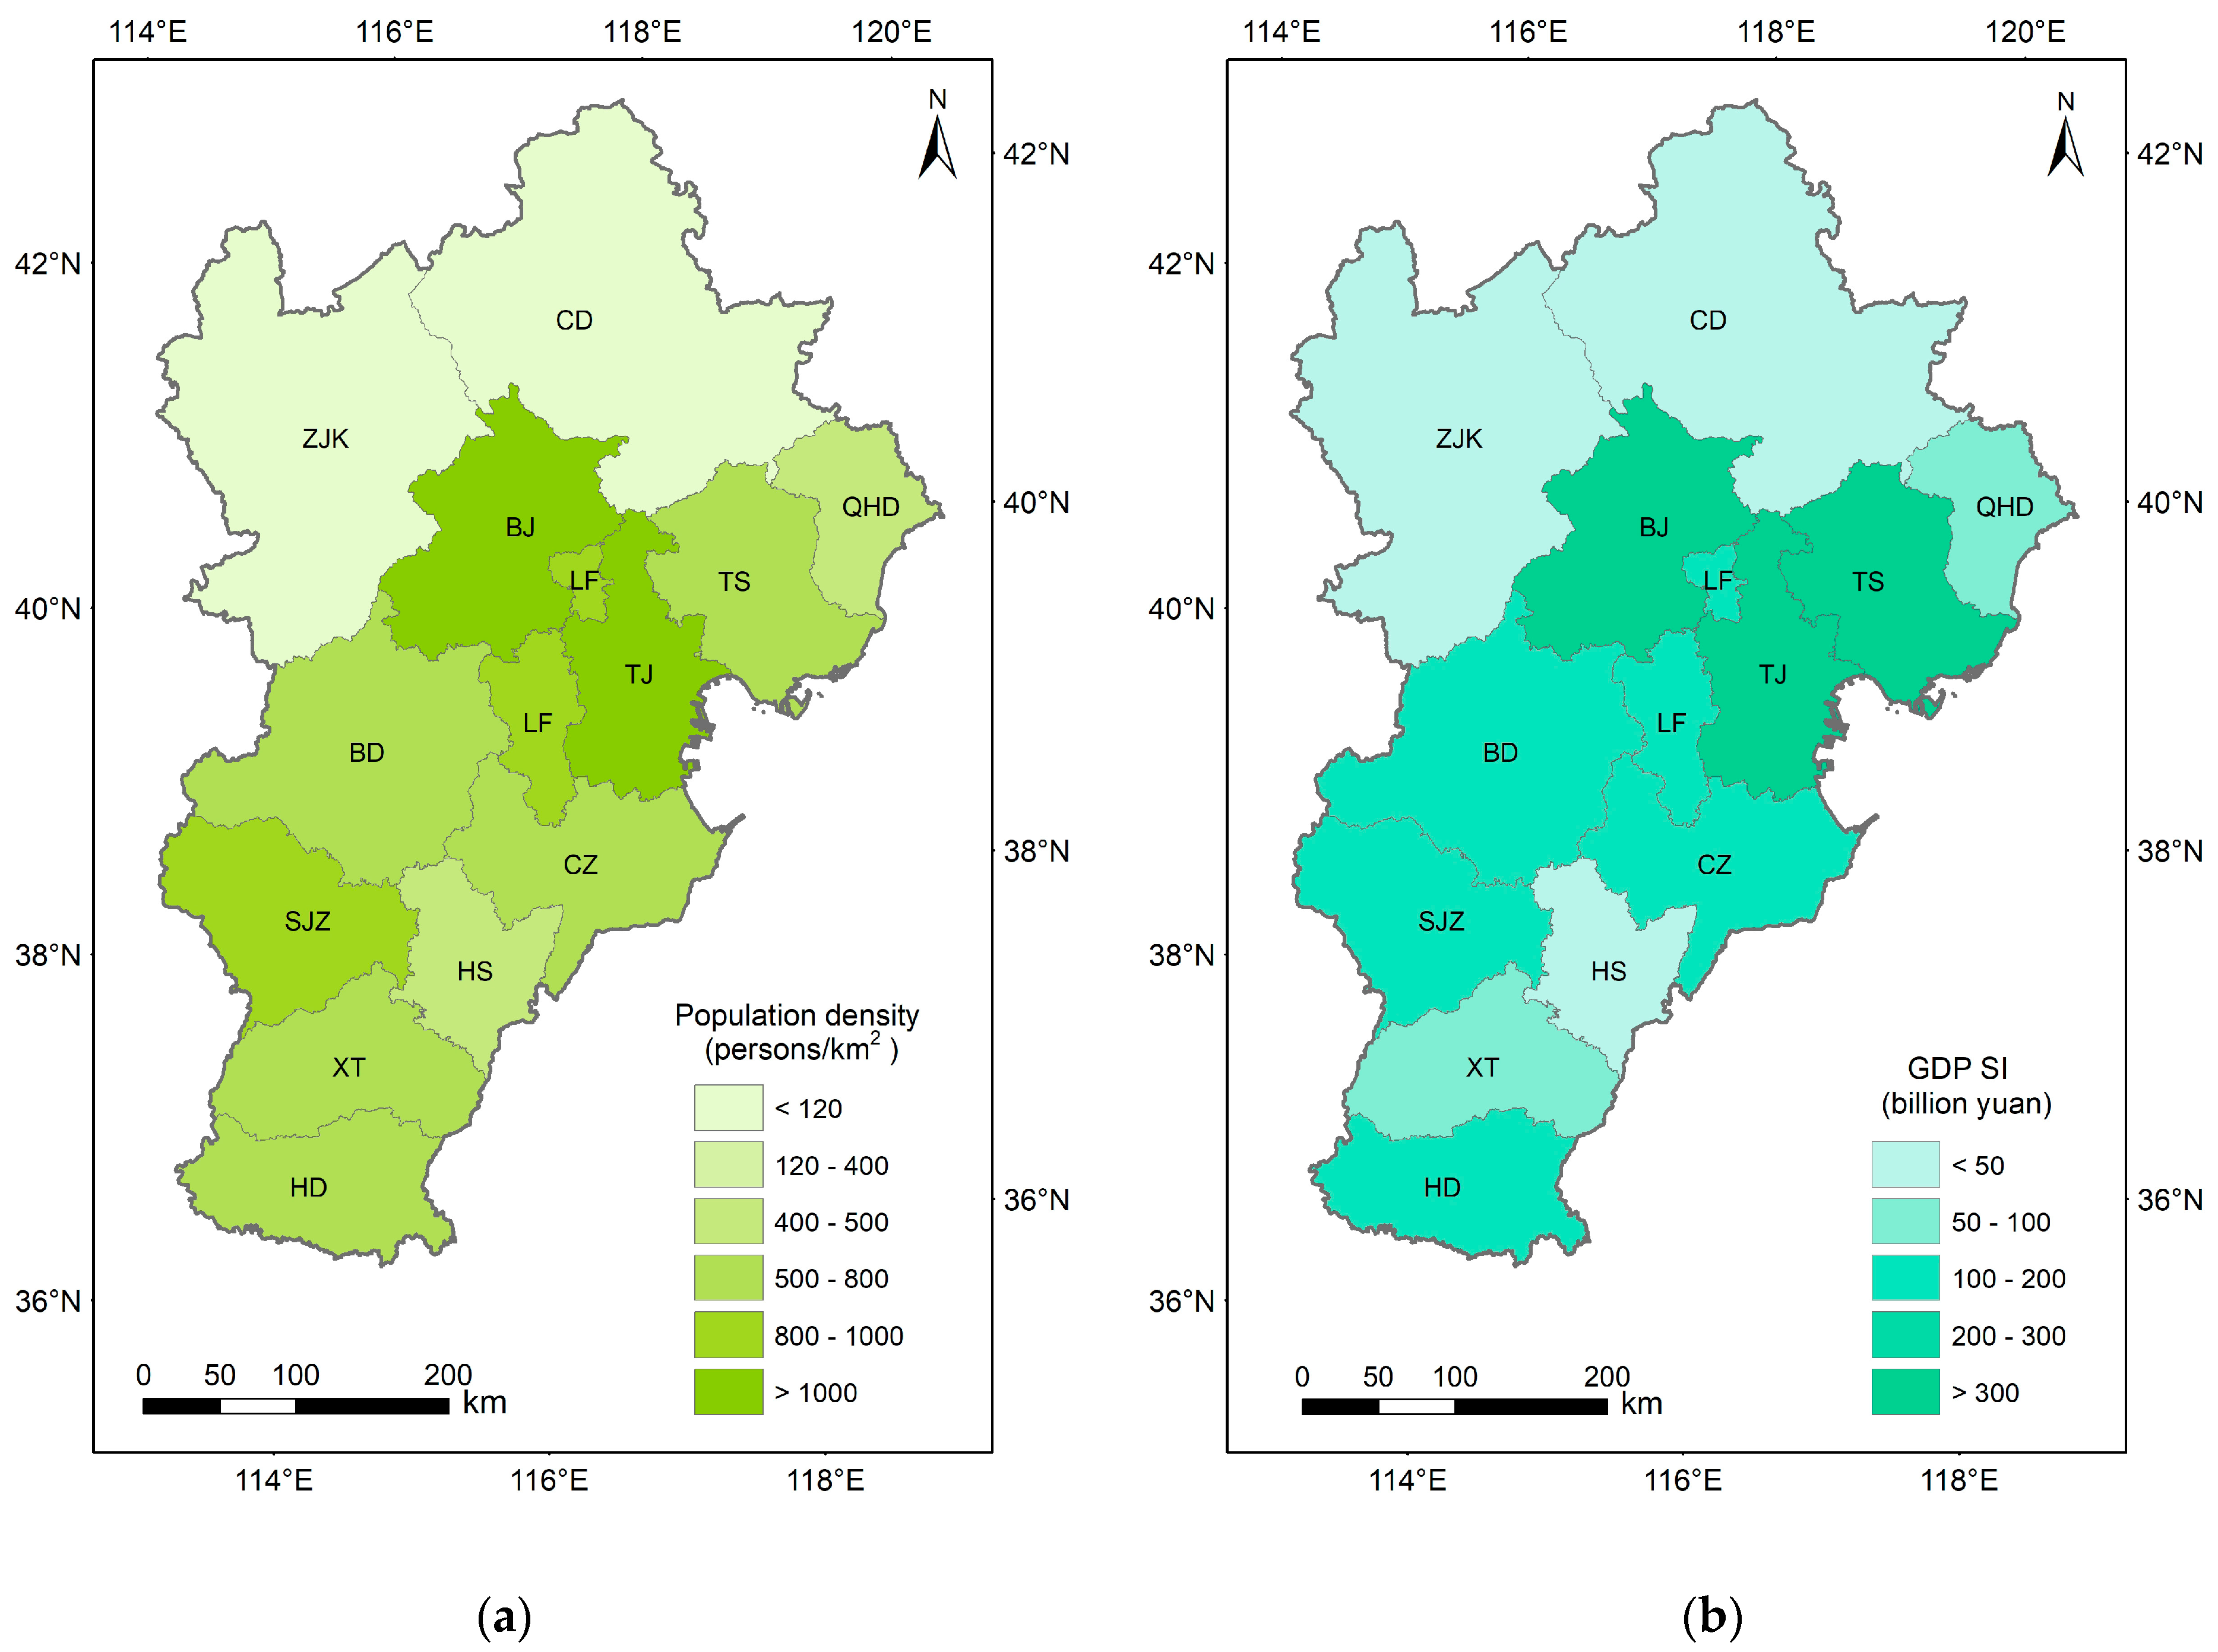
Population density and gross domestic product (GDP) distribution are the key factors affecting CO2 concentration. This paper quantitatively analyzes the relationship between population density, GDP density, and CO2 concentration over Jing-Jin-Ji. Figure 9a presents the spatial distribution of population density over Jing-Jin-Ji at the city level in 2020; regions with a population density greater than 1000 persons/km2 include BJ and TJ, and regions with a population density of less than 120 persons/km2 include ZJK and CD.
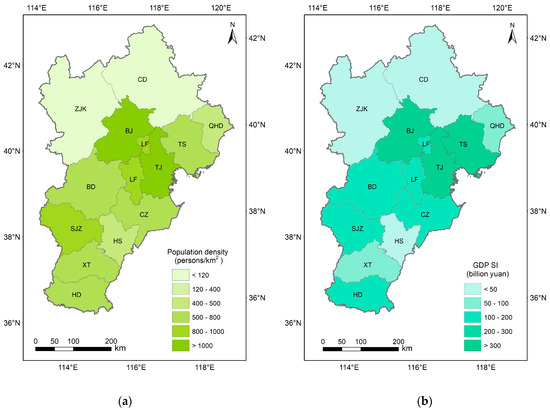
Figure 9.
(a) Spatial distribution of population density over Jing-Jin-Ji at the city level in 2020; (b) spatial distribution of GDP SI over Jing-Jin-Ji at the city level in 2020.
The GDP of China is divided into three kinds of industries: the primary industry (PI), the secondary industry (SI), and the tertiary industry (TI). The PI includes only agriculture and its related activities: farming, forestry, husbandry, secondary production, and fishing. The SI includes mining, manufacturing, water supply, electricity generation and supply, steam, hot-water and gas sectors, and construction. The remainder are included in the TI [23]. The GDP SI is a high-energy-consuming and high-pollution-generating industry, and it is also the most significant source of anthropogenic CO2 emission. Figure 9b presents the spatial distribution of GDP SI over Jing-Jin-Ji at the city level in 2020; BJ and TJ have high value in the GDP SI, followed by TS. The regions with a GDP SI value below 50 billion yuan include ZJK, CD, and HS.
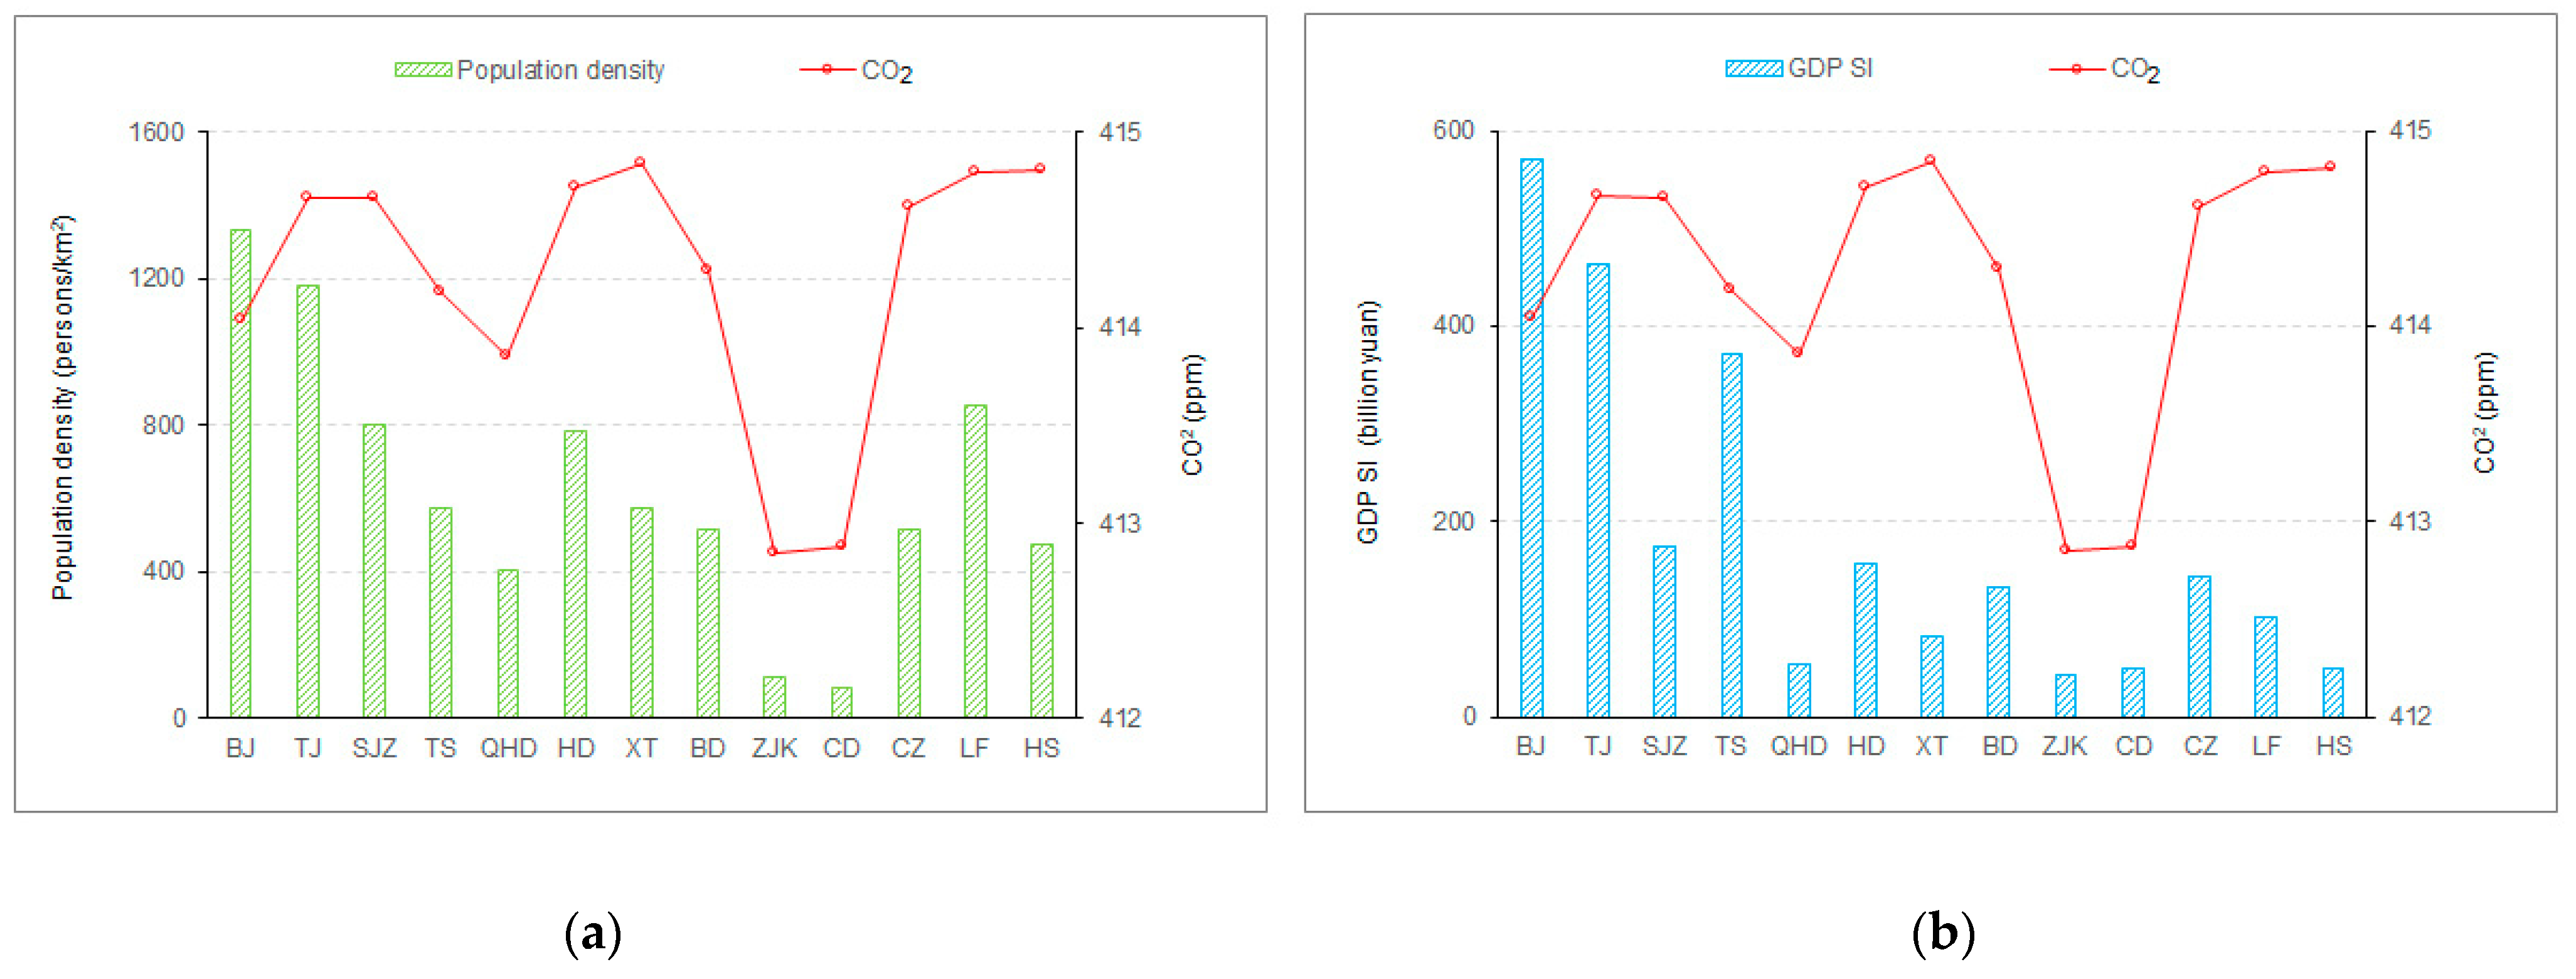
Figure 10a shows the correlation between CO2 and population density in 2020; there is a certain relationship between population density and CO2 concentration in spatial distribution. The regions with lower population density also have lower CO2 concentration (like ZJK, CD, and QHD); the difference in CO2 concentration among other regions is not significant as they are all located in areas with relatively high population density in the southeastern part of the Jing-Jin-Ji region. The correlation between CO2 and GDP SI in 2020 is presented in Figure 10b; the regions with lower GDP SI also have lower CO2 concentration (like ZJK, CD, and QHD), which is similar to changes in population density.
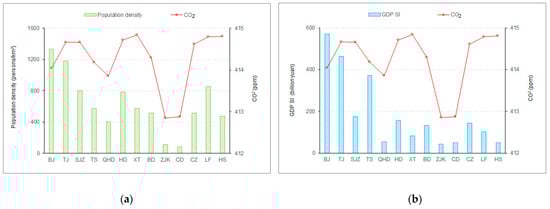
Figure 10.
(a) Correlation between CO2 and population density in 2020; (b) correlation between CO2 and GDP SI in 2020.
4. Conclusions
This article describes the regional differences in CO2 variations over Jing-Jin-Ji during 2015–2021 using remote sensing data obtained from OCO-2. The results can be summarized as follows: (1) the CO2 shows an annual increase and a seasonal cycle; the annual growth rate was about 2.63 ppm year−1, with the highest value being in spring and the lowest in summer; (2) the regional differences in the CO2 over different regions are prominent, and the CO2 concentration is lower in the north of the Jing-Jin-Ji region (like ZJK, CD and QHD); (3) the land-type structure is the natural factor affecting changes in CO2 concentration; cropland, woodland, and grassland (CWG) are the main land cover types in Jing-Jin-Ji, and the proportion of these three types is about 83.3%; CO2 concentration variation shows a high negative correlation with CWG land areas (coefficient of determination (R2) > 0.76); (4) population and GDP SI distributions are the key factors affecting CO2 concentration; changes in CO2 concentration are consistent with the population and GDP SI density; the regions with higher population and GDP density also have higher CO2 concentration (like the southeastern part of the Jing-Jin-Ji region), and the regions with lower population and GDP SI density also have lower CO2 concentration (like ZJK, CD, and QHD).
Author Contributions
Conceptualization, Y.H. and W.L.; validation, Y.H.; resources, L.W., F.W., J.Z. and S.W.; writing—original draft preparation, Y.H.; writing—review and editing, Y.H. All authors have read and agreed to the published version of the manuscript.
Funding
This research was funded by the Science and Technology Fundamental Resources Investigation Program (Grant No. 2023FY101003) and the National Key R&D Program of China (No. 2022YFC3006400, 2022YFC3006402).
Institutional Review Board Statement
Not applicable.
Informed Consent Statement
Not applicable.
Data Availability Statement
The OCO2_GEOS_L3CO2_MONTH data products were obtained from NASA’s Earth Observing System Data and Information System (EOSDIS) (https://earthdata.nasa.gov/) (accessed on 24 January 2024). The land use remote sensing monitoring data were available from the Resource and Environmental Science Data Platform (https://www.resdc.cn/) (accessed on 1 March 2024). The Shangdianzi background CO2 datasets from the surface monitoring station were available from the World Data Centre for Greenhouse Gases (WDCGG) (https://gaw.kishou.go.jp/) (accessed on 1 March 2024). The Xianghe CO2 datasets were available from the Total Carbon Column Observing Network (TCCON) (https://tccondata.org/) (accessed on 18 May 2024).
Acknowledgments
We would like to thank NASA/EOSDIS for providing OCO-2 CO2 data. We also thank China’s Resource and Environmental Science Data Platform for land use remote sensing monitoring data.
Conflicts of Interest
The authors declare no conflicts of interest.
References
- Kunchala, R.K.; Patra, P.K.; Kumar, K.N.; Chandra, N.; Attada, R.; Rama Karumuri, R.K. Spatio-temporal variability of XCO2 over Indian region inferred from Orbiting Carbon Observatory (OCO-2) satellite and Chemistry Transport Model. Atmos. Res. 2022, 269, 106044. [Google Scholar] [CrossRef]
- Das, C.; Kunchala, R.K.; Chandra, N.; Chhabra, A.; Pandya, M.R. Characterizing the regional XCO2 variability and its association with ENSO over India inferred from GOSAT and OCO-2 satellite observations. Sci. Total Environ. 2023, 902, 166176. [Google Scholar] [CrossRef]
- WMO. Greenhouse Gas Bulletins: The State of Greenhouse Gases in the Atmosphere Based on Global Observations through 2021, No. 18, 26 October 2022. Available online: https://gaw.kishou.go.jp/ (accessed on 9 March 2024).
- Schneising, O.; Buchwitz, M.; Reuter, M.; Heymann, J.; Bovensmann, H.; Burrows, J.P. Long-term analysis of carbon dioxide and methane column-averaged mole fractions retrieved from SCIAMACHY. Atmos. Chem. Phys. 2011, 11, 2863–2880. [Google Scholar] [CrossRef]
- Cai, B.F.; Li, W.X.; Dhakal, S.; Wang, J.H. Source data supported high resolution carbon emissions inventory for urban areas of the Beijing-Tianjin-Hebei region: Spatial patterns, decomposition and policy implications. J. Environ. Manag. 2018, 206, 786–799. [Google Scholar] [CrossRef] [PubMed]
- Wang, Z.; Zhou, K.; Fan, J. County-level carbon emission accounting and Major Function Oriented Zones in western regions: Taking Sichuan Province as an example. Acta Ecol. Sin. 2022, 42, 8664–8674. [Google Scholar]
- Jin, J.; Ma, J.; Lin, W.; Zhao, H.; Shaiganfar, R.; Beirle, S.; Wagner, T. MAX-DOAS measurements and satellite validation of tropospheric NO2 and SO2 vertical column densities at a rural site of North China. Atmos. Environ. 2016, 133, 12–25. [Google Scholar] [CrossRef]
- Bovensmann, H.; Burrows, J.P.; Buchwitz, M.; Frerick, J.; Noäel, S.; Rozanov, V.V.; Chance, K.V.; Goede, A.P.H. SCIAMACHY: Mission objectives and measurement modes. J. Atmos. Sci. 1999, 56, 127–150. [Google Scholar] [CrossRef]
- Buchwitz, M.; de Beek, R.; Burrows, J.P.; Bovensmann, H.; Warneke, T.; Notholt, J.; Meirink, J.F.; Goede, A.P.H.; Bergamaschi, P.; Körner, S.; et al. Atmospheric methane and carbon dioxide from SCIAMACHY satellite data: Initial comparison with chemistry and transport models. Atmos. Chem. Phys. 2005, 5, 941–962. [Google Scholar] [CrossRef]
- Barkley, M.P.; Monks, P.S.; Hewitt, A.J.; Machida, T.; Desai, A.; Vinnichenko, N.; Nakazawa, T.; Yu Arshinov, M.; Fedoseev, N.; Watai, T. Assessing the Near Surface Sensitivity of SCIAMACHY atmospheric CO2 Retrieved Using (FSI) WFM-DOAS. Atmos. Chem. Phys. 2007, 7, 3597–3619. [Google Scholar] [CrossRef]
- Yokota, T.; Yoshida, Y.; Eguchi, N.; Ota, Y.; Tanaka, T.; Watanabe, H.; Maksyutov, S. Global concentrations of CO2 and CH4 retrieved from GOSAT: First preliminary results. Sola 2009, 5, 160–163. [Google Scholar] [CrossRef]
- Gonsamo, A.; Chen, J.M.; He, L.M.; Sun, Y.; Rogers, C.; Liu, J. Exploring SMAP and OCO-2 observations to monitor soil moisture control on photosynthetic activity of global drylands and croplands. Remote Sens. Environ. 2019, 232, 111314. [Google Scholar] [CrossRef]
- Kiel, M.; Eldering, A.; Roten, D.D.; Lin, J.C.; Feng, S.; Lei, R.X.; Lauvaux, T.; Oda, T.; Roehl, C.M.; Blavier, J.F.; et al. Urban-focused satellite CO2 observations from the Orbiting Carbon Observatory-3: A first look at the Los Angeles megacity. Remote Sens. Environ. 2021, 258, 112314. [Google Scholar] [CrossRef]
- Chen, X.; Wang, J.; Liu, Y.; Xu, X.G.; Cai, Z.N.; Yang, D.X.; Yan, C.X.; Feng, L. Angular dependence of aerosol information content in CAPI/TanSat observation over land: Effect of polarization and synergy with A-train satellites. Remote Sens. Environ. 2017, 196, 163–177. [Google Scholar] [CrossRef]
- Zhang, X.Y.; Wang, L.; Wang, W.H.; Cao, D.J.; Wang, X.; Ye, D.X. Long-term trend and spatiotemporal variations of haze over China by satellite observations from 1979 to 2013. Atmos. Environ. 2015, 119, 362–373. [Google Scholar] [CrossRef]
- Wang, Y.; Jiang, H.; Zhang, S.; Xu, J.; Lu, X.; Jin, J.; Wang, C. Estimating and Source Analysis of Surface PM2.5 Concentration in the Beijing–Tianjin–Hebei Region Based on MODIS Data and Air Trajectories. Int. J. Remote Sens. 2016, 37, 4799–4817. [Google Scholar] [CrossRef]
- Han, P.F.; Zeng, N.; Oda, T.; Zhang, W.; Lin, X.H.; Liu, D.; Cai, Q.X.; Ma, X.L.; Meng, W.J.; Wang, G.C.; et al. A city-level comparison of fossil-fuel and industry processes-induced CO2 emissions over the Beijing-Tianjin-Hebei region from eight emission inventories. Carbon Balance Manag. 2020, 15, 25. [Google Scholar] [CrossRef] [PubMed]
- Lei, R.X.; Feng, S.; Danjou, A.; Broquet, G.; Wu, D.; Lin, J.C.; O’Dell, C.W.; Lauvaux, T. Fossil fuel CO2 emissions over metropolitan areas from space: A multi-model analysis of OCO-2 data over Lahore, Pakistan. Remote Sens. Environ. 2021, 264, 112625. [Google Scholar] [CrossRef]
- Morgan, K.; Savtchenko, A. README Document for OCO-2 GEOS L3 XCO2 Products; Goddard Space Flight Center: Greenbelt, MD, USA, 2022.
- Zeng, C.Q.; Zhou, Y.; Wang, S.X.; Yan, F.L.; Zhao, Q. Population spatialization in China based on night-time imagery and land use data. Int. J. Remote Sens. 2011, 32, 9599–9620. [Google Scholar] [CrossRef]
- Wang, L.T.; Wang, S.X.; Zhou, Y.; Liu, W.L.; Hou, Y.F.; Zhu, J.F.; Wang, F.T. Mapping population density in China between 1990 and 2010 using remote sensing. Remote Sens. Environ. 2018, 210, 269–281. [Google Scholar] [CrossRef]
- Han, X.D.; Zhou, Y.; Wang, S.X.; Wang, L.T.; Hou, Y.F. Spatialization Approach to 1km grid GDP Based on Remote Sensing. In Proceedings of the IEEE 2011 International Conference on Multimedia Technology (ICMT), Hangzhou, China, 26–28 July 2011; pp. 739–742. [Google Scholar] [CrossRef]
- Zhang, M.; Mu, H.L.; Ning, Y.D. Accounting for energy-related CO2 emission in China, 1991–2006. Energy Policy 2009, 37, 767–773. [Google Scholar] [CrossRef]

Disclaimer/Publisher’s Note: The statements, opinions and data contained in all publications are solely those of the individual author(s) and contributor(s) and not of MDPI and/or the editor(s). MDPI and/or the editor(s) disclaim responsibility for any injury to people or property resulting from any ideas, methods, instructions or products referred to in the content. |
© 2024 by the authors. Licensee MDPI, Basel, Switzerland. This article is an open access article distributed under the terms and conditions of the Creative Commons Attribution (CC BY) license (https://creativecommons.org/licenses/by/4.0/).