Article

Long-Term and Seasonal Changes in Emission Sources of Atmospheric Particulate-Bound Pyrene and 1-Nitropyrene in Four Selected Cities in the Western Pacific

by
Kazuichi Hayakawa
Institute of Nature and Environmental Technology, Kanazawa University, Kakuma-machi, Kanazawa City 920-1192, Ishikawa, Japan
Atmosphere 2024, 15(6), 634; https://doi.org/10.3390/atmos15060634
Submission received: 8 April 2024 / Revised: 18 May 2024 / Accepted: 22 May 2024 / Published: 24 May 2024
(This article belongs to the Special Issue Novel Insights into Air Pollution over East Asia)

Abstract

:
Estimating the source contribution to polycyclic aromatic hydrocarbons (PAHs) and nitropolycyclic aromatic hydrocarbons (NPAHs) in the atmosphere is necessary for developing effective disease control and pollution control measures. The NPAH-PAH combination method (NP method) was used to elucidate the contributions of vehicles and coal/biomass combustion to seasonal and long-term urban atmospheric particulate matter (PM)-bound Pyr and 1-NP concentrations in Kanazawa, Kitakyushu, Shenyang and Shanghai in the Western Pacific region from 1997 to 2021. Among the four cities, Kanazawa demonstrated the lowest Pyr concentration. The contribution of vehicles to Pyr before and after 2010 was 35% and 5%, respectively. The 1-NP concentration was reduced by a factor of more than 1/10. These changes can be attributed to the emission control from vehicles. Kitakyushu revealed the second-lowest Pyr and the lowest 1-NP concentrations. Coal combustion was found to be the main contributor to Pyr, while its contribution to 1-NP increased from 9% to 19%. The large contribution of coal combustion is attributed to iron manufacturers. Shenyang demonstrated the highest atmospheric Pyr concentration with its largest seasonal change. Vehicles are the largest contributors to 1-NP. However, coal combustion, including winter coal heating, contributed 97% or more to Pyr and more than 14% to 1-NP. Shanghai revealed the second-highest Pyr and 1-NP concentrations, but the former was substantially lower than that in Shenyang. Coal combustion was the major contributor, but the contribution of vehicles to Pyr was larger before 2010, which was similar to Kanazawa.

1. Introduction

Air pollution causes millions of deaths every year in the world [1]. Particulate matter (PM) and several types of harmful pollutants, including polycyclic aromatic hydrocarbons (PAHs) and their nitro-, hydroxy- and quinoid derivatives, can be attributed to the incomplete combustion of organic matter. A variety of combustion sources, including vehicles, factories, power stations, incinerators, home heaters and ovens, postharvest field burning and forest fires, emit several PAHs such as benzo[a]pyrene and nitropolycyclic aromatic hydrocarbons (NPAHs) such as dinitropyrenes (DNPs), demonstrating carcinogenicity/mutagenicity. Most of these toxic hydrocarbons are contained in fine inhalable particles with a diameter of 2.5 µm and smaller (PM2.5) in the air and are implicated in respiratory and cardiovascular diseases [2,3].
The Western Pacific is one of the most air-polluted regions in the world. The rapid increase in the number of vehicles intensified urban air pollution in Japan in the 1980s to 1990s. As a result, the number of respiratory disease patients increased. The Japanese government lowered allowable PM and nitrogen oxide (NOx) emissions from new vehicles to improve air quality [4]. To clarify the trends in air pollution due to PAHs and NPAHs in the Western Pacific, total suspended particulates (TSPs) were collected in Tokyo, Sagamihara, Sapporo and Kanazawa (Japan); Shenyang, Beijing and Shanghai (China); Vladivostok (Russia); and Busan (Korea) in summers and winters from 1997 to 2014 [5,6]. Atmospheric concentrations of PAHs and NPAHs significantly decreased in Japanese commercial cities in the 2000s. By contrast, northern Chinese and far-eastern Russian cities showed PAH concentrations higher by one order or more due to a considerable amount of coal combustion. Thus, vehicles and coal combustion were found to be the main sources of urban atmospheric PAHs and NPAHs in this region. However, although PAH and NPAH concentrations and their long-term and seasonal changes varied greatly from city to city [7], contributions of vehicles and coal combustion in each city are still unknown. This is a limit of the previous study on air pollution. It is necessary to determine the contribution of each source exactly to develop effective measures against air pollution, not only in the Western Pacific but also in other regions of the world.
Chemical mass balance (CMB) methods, including positive matrix factor analysis (PMF) and principal component analysis (PCA), have been reported for source appointment of environmental pollutants [8]. However, the application of these methods to PAHs and NPAHs is limited because of the necessity of many combustion source datasets. On the other hand, the diagnostic ratio (DR) method has also been reported for approximating the source of PAHs. This method is simple, based on PAH combinations such as [fluoranthene]/[fluoranthene + pyrene], [benz[a]anthracene]/[benz[a]anthracene + chrysene], [benz[a]pyrene]/[benzo[ghi]perylene] or [indeno[1,2,3-cd]pyrene]/[indeno[1,2,3-cd]pyrene + benzo[ghi]perylene] [9,10,11,12,13,14]. However, different sources are often identified depending on PAH species, and the contribution of each source to the mixed sources is unknown. Furthermore, this method cannot be applied for NPAHs at all.
Recently, we developed the NPAH-PAH combination method (NP method), a new calculation approach for the major source contributions to atmospheric combustion-derived PM (Pc), PAHs and NPAHs, using 1-nitropyrene (1-NP) and pyrene (Pyr) as representative markers for NPAHs and PAHs, respectively [15,16]. Using this method, the Pc concentration in the atmosphere and the long-term and seasonal contributions of vehicles and coal combustion to Pc in the above 10 cities were calculated [17]. These cities were then divided into two groups with high and low Pc concentrations. The former group included Shenyang, Beijing and Vladivostok. Atmospheric concentrations of Pc in the three cities were quantified by using the NP method. It is surprising that the Pc concentrations were much higher in winters than those in summers by a factor of 4 to 33 times and that this seasonal difference was due to substantial amounts of coal consumption for winter heating. The latter group included Tokyo, Sagamihara, Sapporo, Kanazawa, Kitakyushu, Shanghai and Busan, whose annual Pc concentrations were one order or more lower than those in the cities of the above group. Seven cities in the latter group were thoroughly divided into two groups based on emission source types. The first group included Tokyo, Sagamihara, Sapporo, Kanazawa, Shanghai and Busan, whose contributions of vehicles to Pc were over 52%. The second group included Kitakyushu, whose contribution of coal combustion to Pc was 66%, mainly attributed to coke oven plants in steel manufacturers.
The above report was the first study in the world to clarify the contributions (%) of vehicles and coal combustion, which are major emission sources, to urban atmospheric PM in the Western Pacific region. On the other hand, since the health effects of PAHs and NPAHs on humans are estimated using their relative toxicity factors, it is also important to know the contributions of those sources to atmospheric PAHs and NPAHs to develop effective health measures and environmental measures. From the 10 aforementioned cities, Kanazawa, Kitakyushu, Shenyang and Shanghai, which demonstrated distinctive source contributions to Pc, were selected to address the above issues. To clarify the causes of long-term and seasonal changes in the atmospheric PAH and NPAH concentrations, this paper calculated the contributions of vehicles and coal combustion using the NP method.

2. Materials and Methods

2.1. Airborne Particulate Samples

TSP or PM2.5 samples were collected in residential areas in Kanazawa, Kitakyushu, Shenyang and Shanghai (Figure S1). The fundamental characteristics (locations, populations, temperatures and main industries) of the four cities are summarized in Table S1. A high-volume air sampler equipped with a quartz fiber filter (8 × 10 in, 2500QAT-UP, Tokyo Dylec, Tokyo, Japan) was set, and 24 h sampling was continued for two consecutive weeks in each season [5,6].
As described above, the relations between the urban atmospheric concentration of Pc and sources in the Western Pacific cities were analyzed by using the NP method [17]. The characteristics of the four cities can be summarized as follows: Kanazawa, which is a typical local commercial city, uses electricity or kerosene for winter heating. This city showed the lowest Pc concentration, and vehicles were the largest source. Kitakyushu is an iron-manufacturing city. A considerable amount of coal consumed in steel manufacturing was the major contributor to Pc. Shenyang is an agricultural and industrial megacity. A large amount of coal consumption for winter heating is responsible for the much higher Pc concentration than that in Japanese cities. Shanghai is a business and commercial megacity. Because, unlike Shenyang, this city does not use winter heating, the atmospheric concentration of Pc was much lower.

2.2. Data of PAH and NPAH Concentrations

Table 1 shows sampling cities, periods, cities and sizes of PM samples used in this study with references. Analytical results of TSP collected in Kanazawa, Kitakyushu, Shenyang and Shanghai from summer 1997 to winter 2014; PM (PM≤2.1 + PM>2.1) in Kanazawa in summer 2017 and winter 2018; and PM2.5 in Shanghai from summer 2015 to winter 2018, autumn 2018 and spring 2019 were used. Additionally, PM2.5 in Kanazawa from winter 2020 to winter 2021 was collected in this study. After the previous report concerning Pc [17], PM samples collected in Kanazawa in summer 2017 and winter 2018 and in Shenyang in autumn 2018 and spring 2019 were newly added to this study.
A high-performance liquid chromatography (HPLC) instrument equipped with a fluorescence detector was used in accordance with the USEPA standard method to quantify nine PAHs: fluoranthene, Pyr, benz[a]anthracene (BaA), chrysene (Chr), benzo[b]fluoranthene, benzo[k]fluoranthene, benzo[a]pyrene (BaP), benzo[ghi]perylene and indeno[1,2,3-cd]pyrene [18]. An HPLC instrument equipped with a reducing column packed with platinum/rhodium-coated particles and a chemiluminescence detector was used to quantify six NPAHs, namely 9-nitroanthracene, 1-NP, 6-nitrocrysene (6-NC), 7-nitrobenz[a]anthracene (7-NBaA), 3-nitroperylene and 6-nitrobenzo[a]pyrene (6-NBaP) [19,20]. Fundamental HPLC conditions for analyses of PAHs and NPAHs are described in Text S1 in the Supplementary Materials. Instead of the chemiluminescence detection system, the same HPLC equipped with a fluorescence detector was also used for several samples.
Table 1. Sampling cities and periods of PM samples used in this study.
City (Period)PM SizeRef.
Kanazawa, Kitakyushu, Shenyang, Shanghai (summer 1997–winter 2014)TSP[5]
Kanazawa (summer 2017 and winter 2018)PM≤2.1 + PM >2.1[21]
Kanazawa (winter 2020–winter 2021)PM2.5This study
Shanghai (summer 2015–winter 2018)PM2.5[22]
Shenyang (autumn 2018 and spring 2019)PM2.5[23]

2.3. Calculation of Source Contributions

Nine PAHs including Pyr and six NPAHs including 1-NP were determined using HPLC with fluorescence and chemiluminescence detection systems, respectively (Text S1). Among the PAH and NPAH concentrations in PM samples, datasets of Pyr and 1-NP were used for the NP method analysis. The NP method to calculate source contributions to Pyr and 1-NP in the atmosphere [15] is outlined below: PM-bound Pyr in the atmosphere is divided into the high-temperature combustion-derived Pyr (Pyrh) and low-temperature combustion-derived Pyr (Pyrl). PM-bound 1-NP in the atmosphere is also categorized into high-temperature combustion-derived 1-NP (1-NPh) and low-temperature combustion-derived 1-NP (1-NPl). Let the fractions of 1-NPh in 1-NP (=1-NPh + 1-NPl) and Pyrh in Pyr (=Pyrh + Pyrl) in the atmosphere be a (0 < a < 1) and b (0 < b < 1), respectively. Thus, Equations (1) and (2) can be obtained.
[1-NPh] = [1-NP]a and [1-NPl] = [1-NP](1 − a)
[Pyrh] = [Pyr]b and [Pyrl] = [Pyr](1 − b)
Equations (3) and (4) can be obtained by dividing Equation (1) by Equation (2).
[1-NPh]/[Pyrh] = [1-NP]a/[Pyr]b
[1-NPl]/[Pyrl] = [1-NP](1 − a)/[Pyr](1 − b)
The nitration reaction of organic compounds is temperature-dependent, and a substantial increase in the yield of NPAHs from mother PAHs with temperature is observed [24]. As described above, the two major contributors to PAHs and NPAHs are vehicles and coal combustion around the sampling sites in the four cities. The combustion temperatures of vehicle engines and coal combustion were 2700–3000 °C and 1100–1200 °C, respectively, and the molar concentration ratio of 1-NP to Pyr ([1-NP]/[Pyr]) of vehicles (=0.425) was substantially larger than that of coal combustion (=0.0013) [7]. The values of a (=[1-NPh]/[1-NP]) and b (=[Pyrh]/[Pyr]), which correspond to the contributions of vehicles to atmospheric 1-NP and Pyr, respectively, can be calculated by introducing these ratios into Equations (3) and (4). The values of a and b with atmospheric concentrations of Pyr and 1-NP for all samples are presented in Table S2. Therefore, concentrations of Pyrh, Pyrl, 1-NPh and 1-NPl are represented by the following equations: [Pyrh] = b[Pyr], [Pyrl] = (1 − b)[Pyr], [1-NPh] = a [1-NP] and [1-NPl] = (1 − a)[1-NP].

3. Results

3.1. Long-Term and Seasonal Changes in Pyr and 1-NP

The long-term trends in atmospheric concentrations of PM-bound Pyr and 1-NP collected in summers and winters in Kanazawa, Kitakyushu, Shenyang and Shanghai are shown in Figure 1, Figure 2, Figure 3 and Figure 4 (A) and (B), respectively. Furthermore, the contributions (%) of combustion sources with high and low temperatures to Pyr and 1-NP, quantitatively analyzed using the NP method, are shown in (C) and (D), respectively. As shown in the figures, considerable differences in not only atmospheric Pyr and 1-NP concentrations but also source contributions were observed in the four cities. First, the difference in Pyr profiles was very big (Figure 1A, Figure 2A, Figure 3A and Figure 4A), showing the same tendency as that in our previous studies [5,6,17]. To clarify the differences in long-term changes, Table 2 compares the mean concentration ± standard deviation (SD) of Pyr and Pyrh, divided into the first period (≤2008) and the second period (≥2010), in the four cities. Shenyang demonstrated the highest mean annual Pyr concentrations (at 16,900 pg/m3 before 2010 and 7430 pg/m3 after 2010), while Kanazawa showed the lowest concentrations (338 and 154 pg/m3, respectively) (Table 2). The long-term and seasonal changes in the four cities also demonstrated substantial differences. The decreasing factor (d/c) of the mean annual Pyr concentration ratio (c) before 2010 and (d) after 2010 in Kanazawa and Shenyang were 0.46 and 0.44, respectively, indicating a decreasing tendency. However, Kitakyushu, whose d/c was 1.3, did not reveal such a decreasing tendency. By contrast, Shanghai, whose d/c was 2.6, demonstrated an increasing tendency despite an insufficiently short monitoring period. This finding can be attributed to the continuous increase in the winter Pyr concentration by 2014. A seasonal difference (winter > summer) in the Pyr concentration in all cities was also observed. To clarify the differences in the seasonal changes and causes in the four cities, Table 2 compares the mean concentration ± SD of Pyr and Pyrl in summer and winter in the four cities. Among them, Shenyang revealed the largest winter/summer ratio (=25), which was more than one order of magnitude larger than that of the other cities (Table 3).
Second, Figure 1B, Figure 2B, Figure 3B and Figure 4B show the long-term and seasonal variations in 1-NP concentrations in the four cities. To clarify the difference in long-term changes, Table 4 compares the mean concentration ± SD of 1-NP and 1-NPl in the four cities, divided into the first period (≤2008) and the second period (≥2010). Shanghai demonstrated the highest 1-NP concentration (371 pg/m3) in summer 2007 (Table S2). However, the mean annual 1-NP concentrations were highest in Shenyang in both periods (88 and 85 pg/m3 before and after 2010, respectively) and lowest in Kitakyushu (8.3 and 5.2 pg/m3 before and after 2010, respectively). Despite the lowest mean annual 1-NP concentrations among the four cities, Kanazawa demonstrated a decreasing tendency of the 1-NP concentration (d/c = 0.08), which was substantially clearer than that of the Pyr concentration. It should be noted that Shenyang and Kitakyushu had larger fractions of 1-NPl to 1-NP (1-NPl/1-NP) than the other two cities. However, the decreasing tendency of the 1-NP concentration was absent in Shenyang (d/c = 0.97) (Table 4). All cities revealed seasonal changes (winter > summer) in the 1-NP concentration. To clarify the difference in seasonal changes and the causes in the four cities, Table 5 compares the mean concentration ± SD of 1-NP and 1-NPl in summer and winter in the four cities. Among them, Shenyang showed the largest winter-to-summer ratio of 1-NPl (W/S = 5.1). However, this ratio was substantially smaller than that of Pyr in this city described above, indicating that the seasonal change in the 1-NP concentration was considerably weaker.

3.2. Long-Term and Seasonal Change in Source Contributions

The contribution of the two combustion sources to the atmospheric Pyr and 1-NP were examined using the NP method. First, the equations in Section 2.3 were used to calculate fractions of Pyrh in Pyr (=b) and Pyrl in Pyr (=1 − b). As shown in Figure 1C, Figure 2C, Figure 3C and Figure 4C, Pyrl was constantly more than 50% of the atmospheric Pyr in all cities over the monitoring period. However, the fraction of Pyrh markedly varied from city to city and from time to time. In Kanazawa, regardless of the lowest Pyr concentration among the four cities, the fraction (%) of Pyrh in Pyr (Pyrh/Pyr) was over 35% in the 1990s (Figure 1C). The fraction of Pyrh in Pyr was 35% before 2010, which was the highest among the four cities (Table 2). However, the fraction of Pyrh in Pyr was 5% with a decrease in the Pyrh concentration to the lowest (=7.4 ng/m3) among the four cities after 2010. The fraction of Pyrh in Pyr in Kitakyushu remained at a low level of not more than 4% over the periods. The Pyr concentration abruptly increased in the winter of 2014 (Figure 2C). But the fraction of Pyrh was less than 1% (Table 2). The rise in the Pyl concentration contributed to the aforementioned increase in the Pyr concentration. Shenyang revealed the highest Pyr concentration among the four cities with a decreasing tendency (Figure 3C). The fraction of Pyrl in Pyr was considerably large (more than 97%) over the period, while the fraction of Pyrh was not more than 3% (Table 2). The seasonal difference in the Pyrl concentration (winter/summer ratio = 26) was also the largest among the four cities (Table 3), contributing to the remarkable seasonal change in the Pyr concentration as described above. In Shanghai, the fraction of Pyrh in Pyr (=18%) was the second largest before 2010 among the four cities in 1-NP (Figure 4C). But the fraction of Pyrh sharply decreased to 3% after 2010 (Table 2). This decreasing tendency in Shanghai was similar to Kanazawa, but the phase was later by several years.
Second, the fractions of 1-NPh in 1-NP (=a) and 1-NPl in 1-NP (=1 − a) were calculated using the equations in Section 2.3. The contributions of the two sources to 1-NP were completely different from those to Pyr considering the values of a and b of all samples in the four cities. From Table S2, the fraction of 1-NPh in 1-NP was always larger than that of 1-NPl. By contrast, the fraction of 1-NPl in 1-NP was larger than 35% several times in Shenyang and Kitakyushu, but not more than 8% in Kanazawa and Shanghai over the period. The fractions of 1-NPl in 1-NP were 27% and 14%, respectively, in Shenyang before and after 2010 and 19% in Kitakyushu after 2010 (Table 4). Notably, among the four cities, Shenyang revealed the largest seasonal difference (W/S ratio = 23) in the 1-NPl concentration. However, such a considerable seasonal difference was not found in 1-NP in all cities (Table 5). These results indicated that the increase in the 1-NPl concentration caused by large amounts of coal combustion for winter heating was observed only in Shenyang.

4. Discussion

The combustion of organic materials emits PAHs and NPAHs. The production of high-molecular-weight PAHs increases with the combustion temperature [25]. The nitration reaction is also temperature-dependent, which increases the concentration ratio of NPAH to its corresponding PAH. In exhaust PM, concentration ratios of [1-NP]/[Pyr], [6-NC]/[Chr], [7-NBaA]/[BaA] and [6-NBaP]/[BaP] were larger from vehicle engines with higher combustion temperatures than in coal combustion facilities with lower combustion temperatures [7]. Therefore, several NPAHs have become exposure markers for diesel vehicles [26].
For gasoline engine vehicles, three-way catalyst systems that could reduce carbon monoxide (CO), hydrocarbon (HC) and NOx in emission gas were developed. The installation of this system has progressed since the 1970s. The emission rate of PAHs from gasoline engine vehicles was reduced to less than 10% by introducing catalysts [27]. However, urban air pollution has not improved in Japan at all. As mentioned above, its health effects became a major problem in the 1980s. The reason for this was the rapid increase in the number of vehicles equipped with diesel engines, which produce far more PM and NOx than gasoline engines [28]. Therefore, technological improvements were made to diesel engines and fuel, and the government’s PM and NOx emission regulations for diesel vehicles were gradually tightened. In response to the Japanese governmental control values, atmospheric concentrations of BaP and 6-NBaP in Kanazawa, which were high in the 1990s, were dramatically reduced in the 2000s [29]. Therefore, vehicles were identified as the major contributor to the atmospheric 1-NP. A similar reduction in the atmospheric PAH and NPAH concentrations was also observed in other Japanese commercial cities [5]. By contrast, the fraction of Pyrh in Pyr (=b) was over 35% in Kanazawa in the 1990s, indicating that a mixture of coal combustion and vehicles contributed to Pyr. However, as described above, the emission control against vehicles effectively reduced their atmospheric concentrations after the 2000s.
Kitakyushu is a typical steel manufacturing city, where coke oven plants consume considerable amounts of coal. The air sampling site is located 6 to 17 km west–southwest of steel mills and is on the leeward side of the westerly wind that blows from the Asian continent to the Japan Islands. This finding indicated the strong effects of iron manufacturers on the atmospheric PAHs and NPAHs. A previous report revealed that combustion sources with low temperatures contributed more to Pc emission in this city than in Kanazawa [17]. A major contributor to Pyr involved the combustion of large amounts of coal, especially in iron manufacturing. Meanwhile, vehicles were the major contributors to 1-NP.
Coal energy in Shenyang used for winter heating is 70% of the primary energy [30]. Coal combustion was reported to contribute more to the atmospheric Pc than vehicles in this city [17]. Moreover, the atmospheric Pyr concentration demonstrated a large seasonal difference (winter > summer). Therefore, coal combustion, especially for winter heating, was identified as the major contributor to Pyr. Although the major contributor to 1-NP was vehicles, coal heating also contributed to the atmospheric 1-NP to some extent.
The contribution of vehicles to the atmospheric Pc in Shanghai was larger than that of coal combustion [17]. The contribution of vehicles to Pyr was over 30% in Shanghai in the summer of 2007, although the contribution of coal combustion to Pyr was much larger than that of vehicles over this period. Subsequently, it decreased gradually, similar to Kanazawa. These results indicated that the effects of technological innovations in vehicle engines and oils emerged several years later in this city than in Kanazawa.
For 47 samples in Table S1, the correlations between Pyr and nine PAHs and 1-NP and two NPAHs (=1-NP + 6-NBaP) were 0.963 and 1.00, respectively. The strong relations indicated the above results of Pyr and 1-NP are regarded as the results of the primary emitted PAHs and NPAHs, respectively [20]. Here, the fact that the NP method quantified the contribution (%) of each source to PAHs and NPAHs is revolutionary. The fraction of Pyrh to Pyr (=b) differed dramatically from city to city and between summer and winter (Table 2 and Table 3). These results are useful in understanding the contribution of not only vehicles but also coal heating to PAHs. In addition, the NP method analyzes the sources of NPAHs, to which the DR method could not be applied. As a result, the fraction of 1-NPh in 1-NP (=a) was much larger than that of 1-NPl in 1-NP (=1 − a) in all cities (Table 4). This result indicates that, unlike PAHs, vehicles are the major source of NPAHs. Recent reports researching the sources of atmospheric PAHs and PAHs have described that the main source is vehicles, or a mixture of vehicles and coal/biomass combustion in the Western Pacific as well as other regions [21,22,23,24,31,32,33,34], but quantitative analysis has not been conducted. This report is the first study that breaks through the limitations of the previous source appointment methods for the first time. As a result, this study showed that sources of atmospheric PAHs and NPAHs as well as Pc differed greatly depending on the city, time period and season.
It has been reported that the total emission of PAHs in East Asia is the largest in the world and that the world’s PAH generation has already peaked and will decline in the future as total energy consumption decreases [35]. The proportion of electric and hybrid engine vehicles is expected to increase, and the energy transition from fossil fuels to nuclear power and renewable energy is expected to progress. On the other hand, health damages caused by outdoor and indoor vegetation fires are still serious [25]. These facts suggest that emission sources other than vehicles and coal combustion should be considered [36]. It is important to predict future trends of contributions of emission sources to atmospheric PAHs and NPAHs with changes in social structures.

5. Conclusions

In our previous report, urban atmospheric Pc concentrations showed different long-term and seasonal variations in ten Western Pacific cities, and the contributions of vehicles and coal combustions to Pc differed greatly depending on the city [17]. However, the effects of the two sources on long-term and seasonal changes in atmospheric concentrations of PAHs and NPAHs have not been clarified. Therefore, among the ten cities, the four cities that showed characteristic long-term and seasonal Pc concentrations and source changes were selected in this study to clarify the source effects on atmospheric PAH and NPAH concentrations. As two major combustion sources, the contributions of vehicles and coal combustion to long-term and seasonal changes in atmospheric PM-bound Pyr and 1-NP concentrations in Kanazawa, Kitakyushu, Shenyang and Shanghai in the Western Pacific region were elucidated using the NP method.
(1)
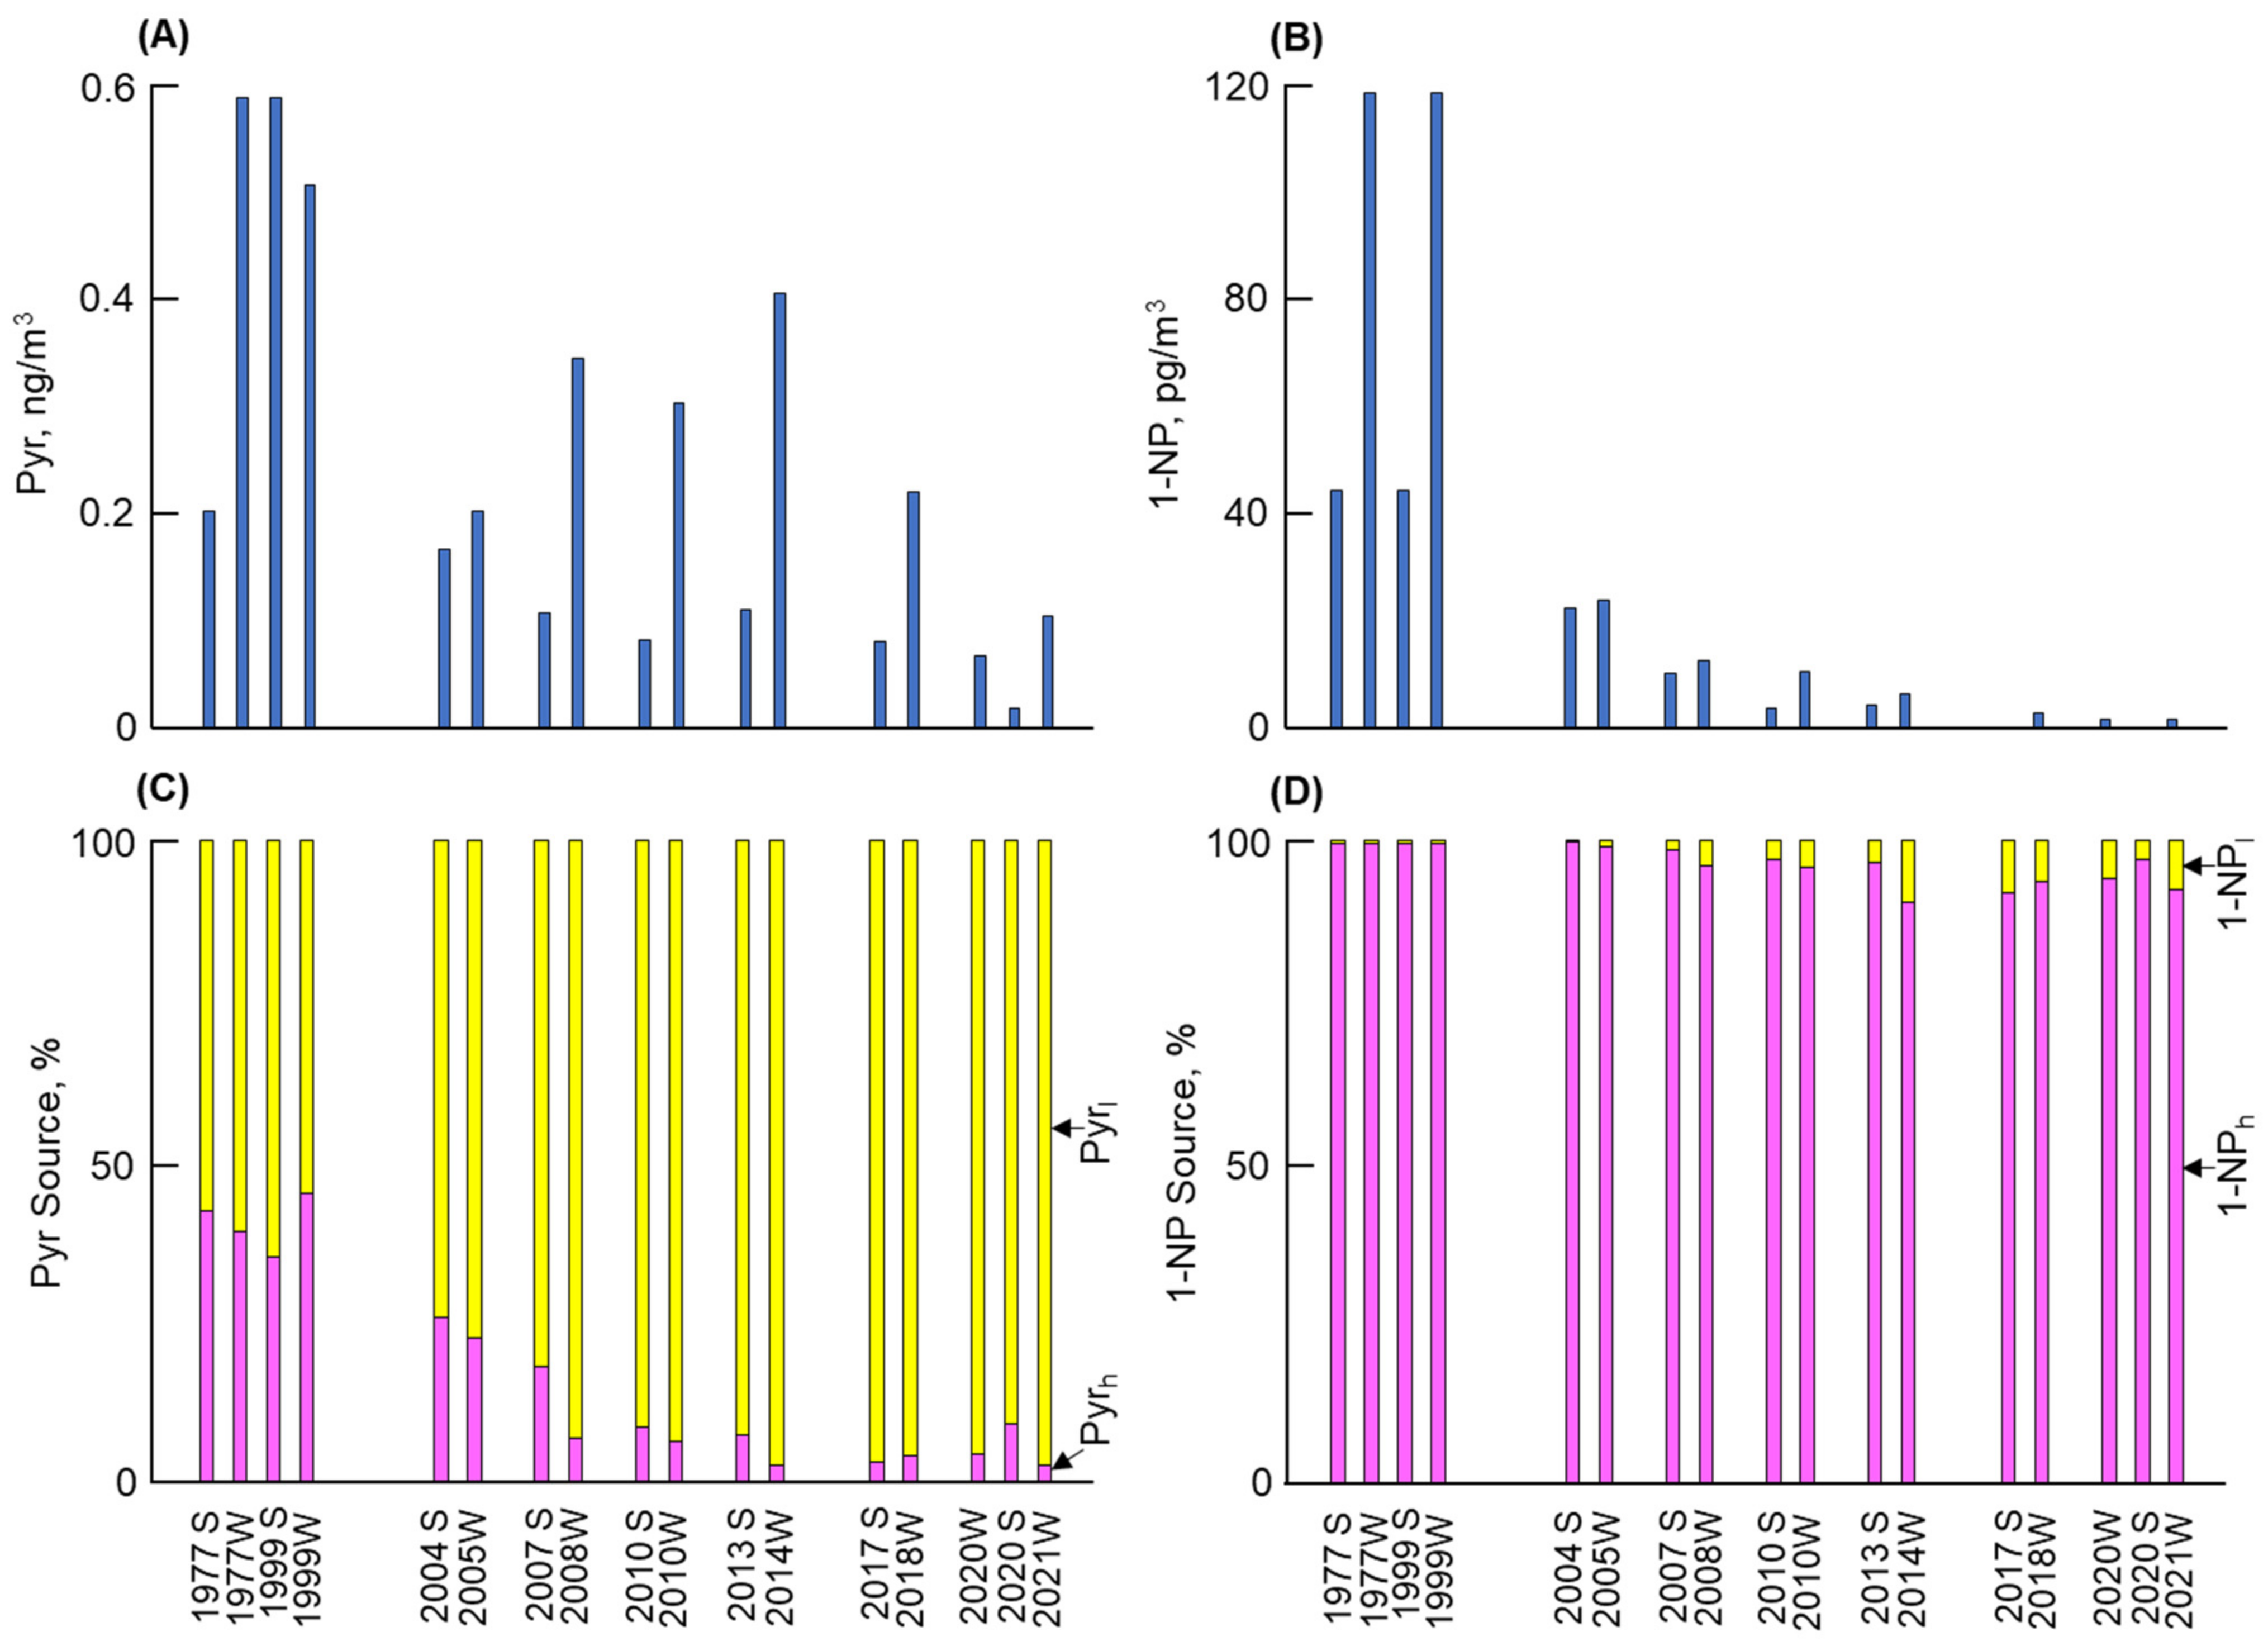
Kanazawa demonstrated the lowest Pyr concentration among the four cities. The contributions of vehicles to Pyr before and after 2010 were 35% and 5%, respectively. By contrast, the atmospheric 1-NP concentration, of which more than 95% was emitted from vehicles, markedly decreased after 2010 by a factor of more than 1/10. These changes can be attributed to the effective control of PM/NOx emissions from vehicles.
(2)
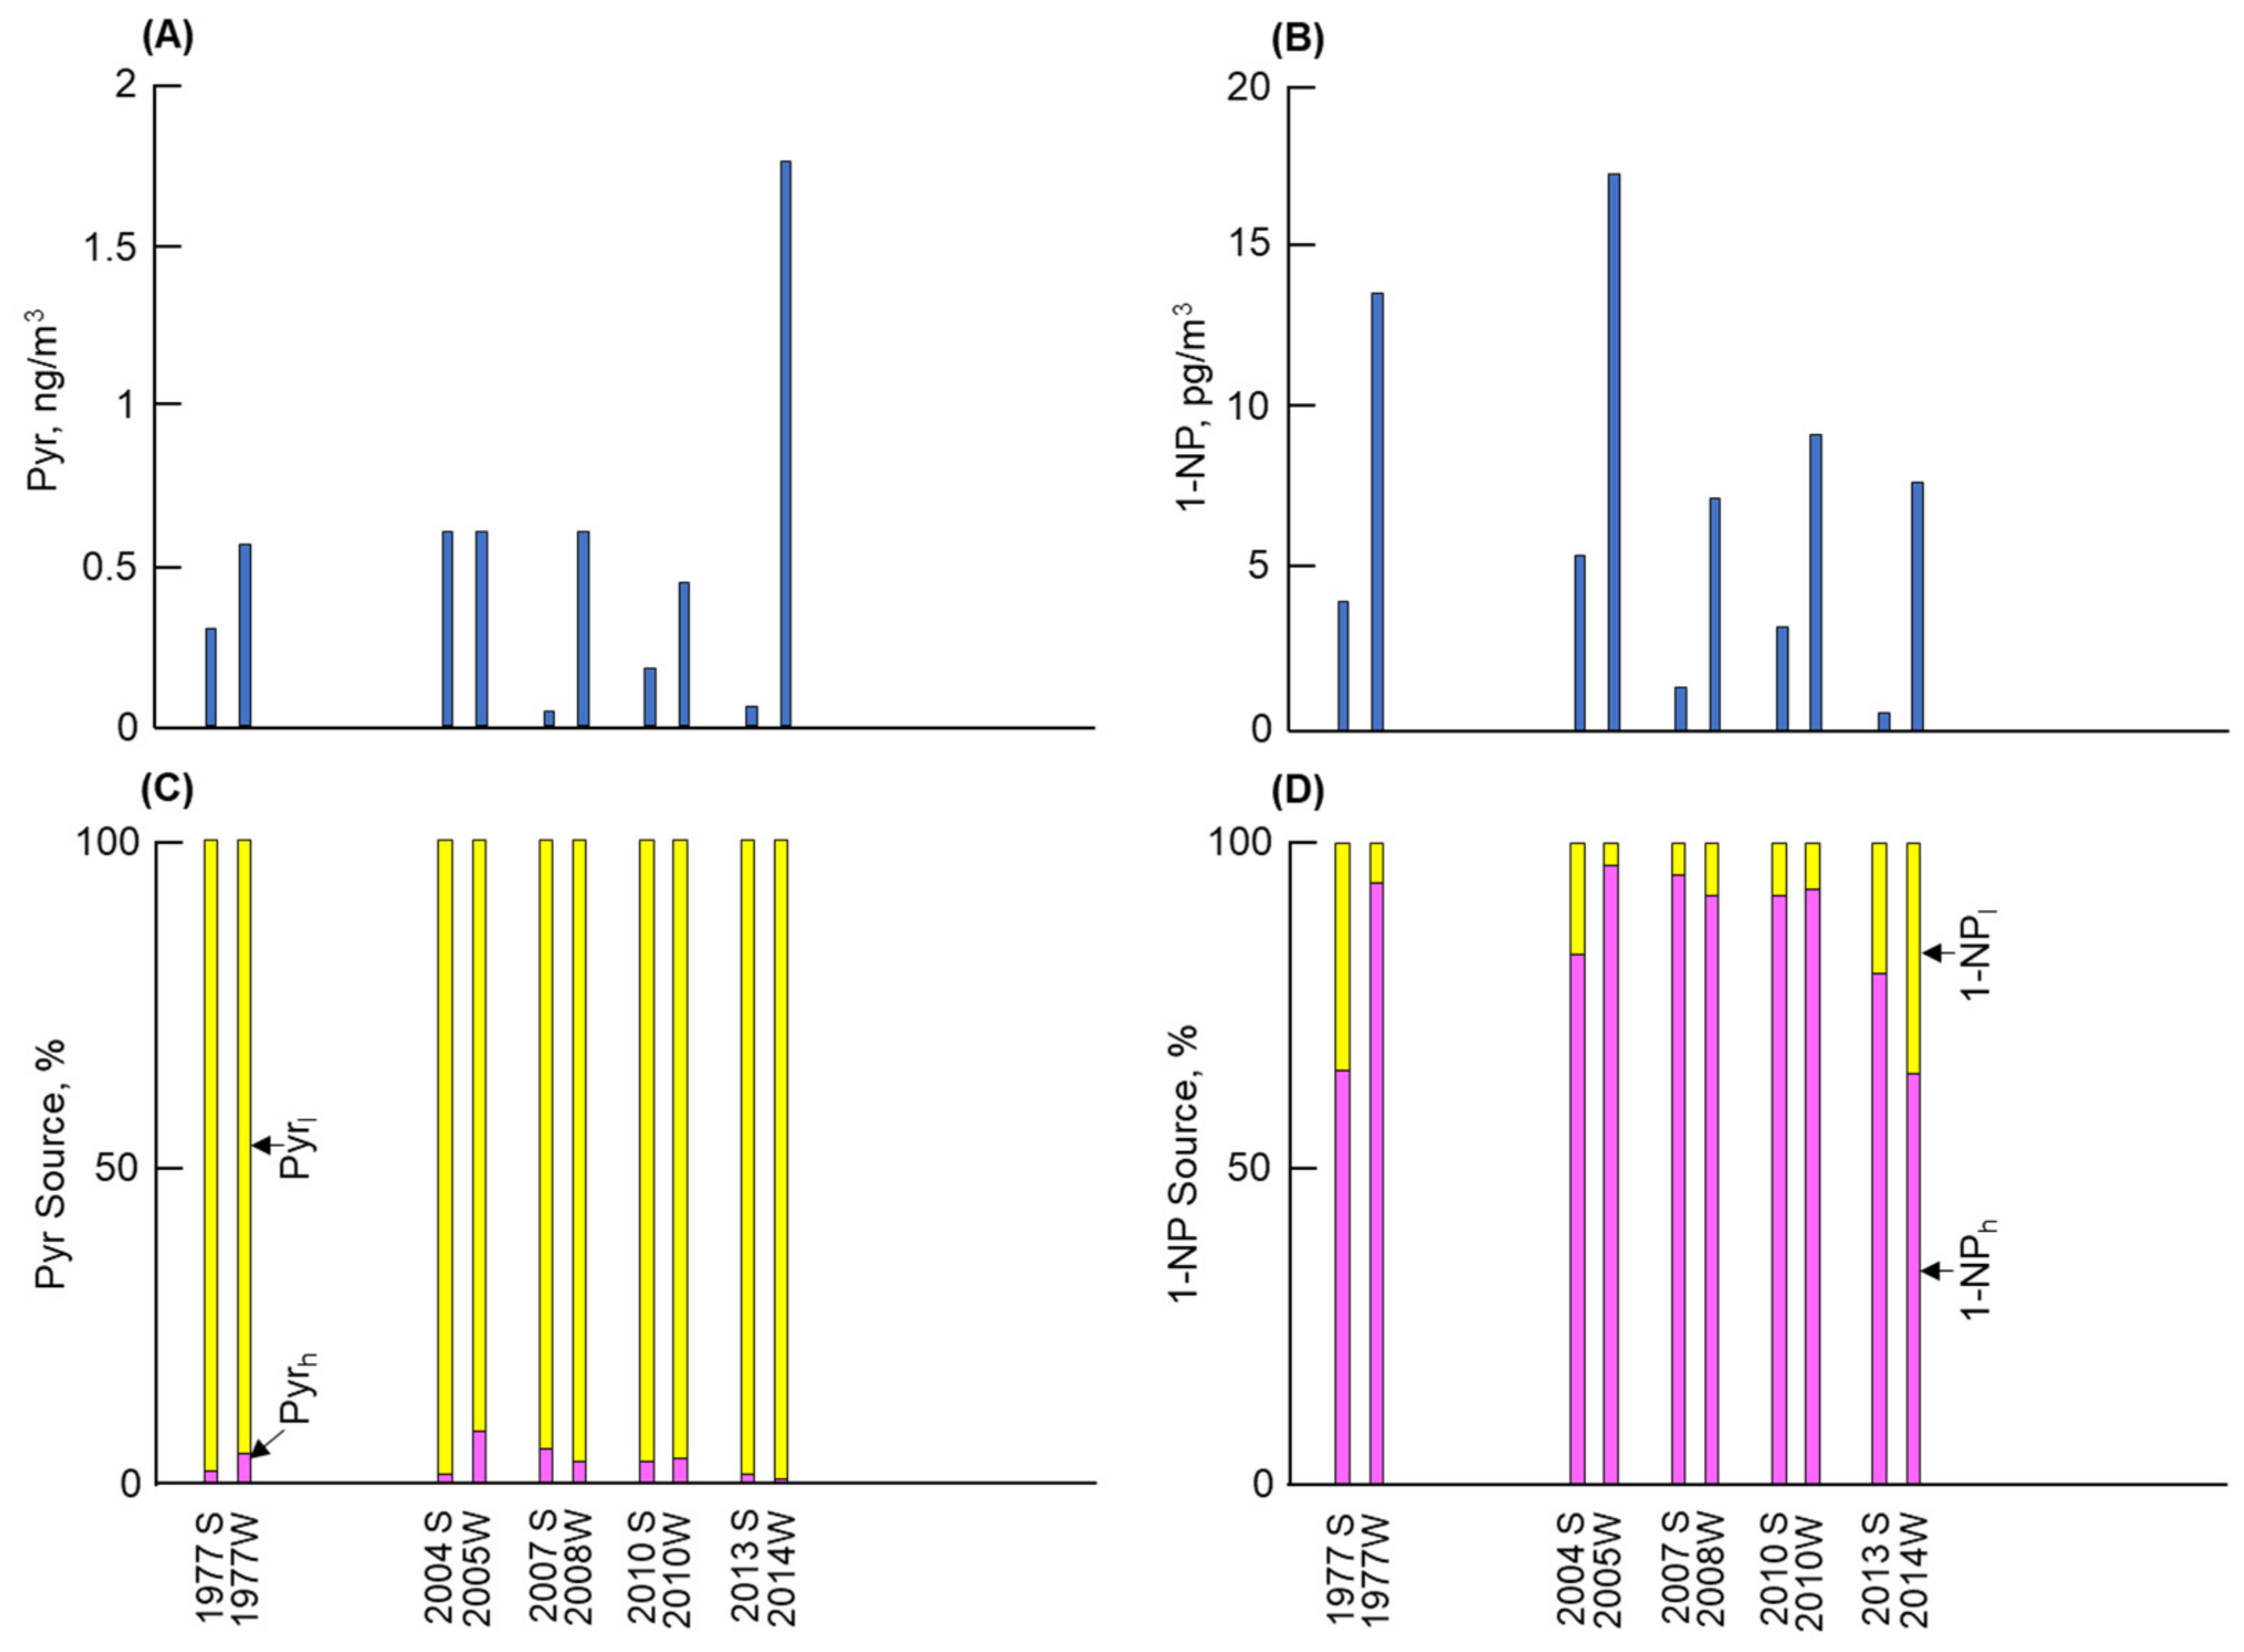
The second-lowest Pyr concentration and the lowest 1-NP concentration were observed in Kitakyushu. The contribution of coal combustion was more than 96% to the atmospheric Pyr, while that to 1-NP before and after 2010 was 9% and 19%, respectively. The large contribution of coal combustion to Pyr and 1-NP can be attributed to iron manufacturers, where a large amount of coal was consumed in coke oven plants.
(3)
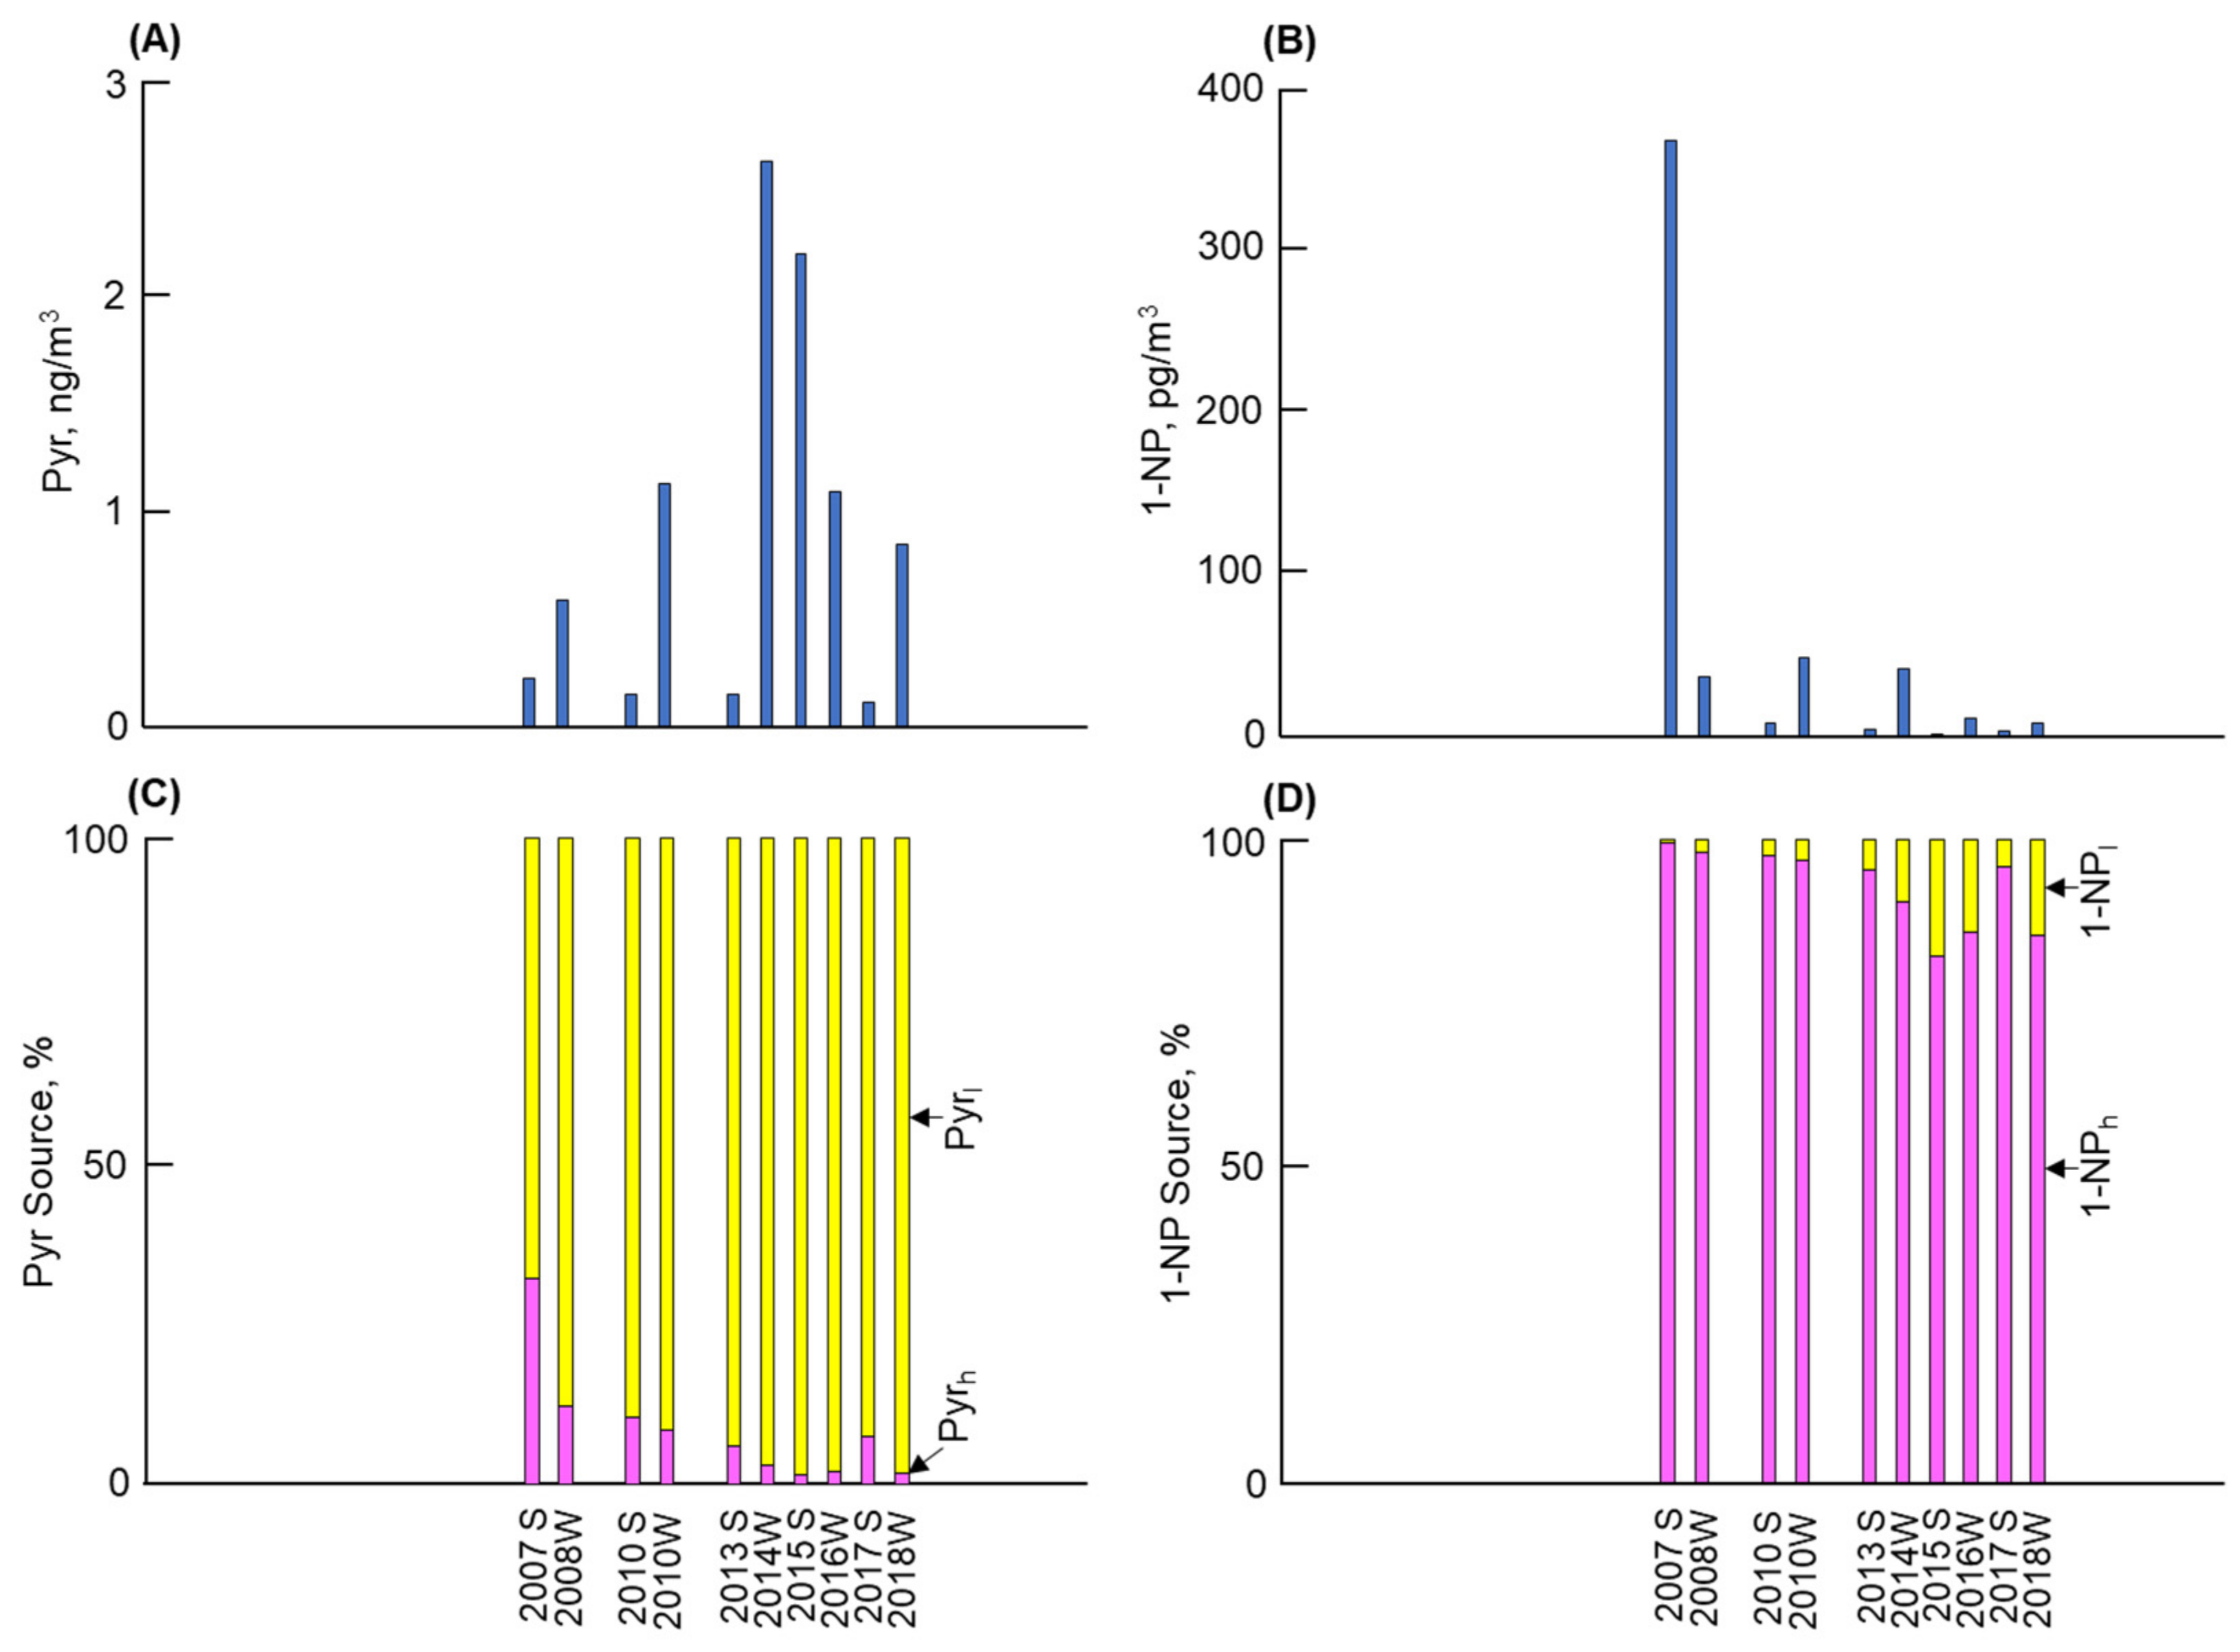
The highest Pyr concentration with the largest seasonal change (winter/summer) was found in Shenyang. Although vehicles were the major contributor to 1-NP, coal combustion, including winter coal heating, contributed 97% or more to the atmospheric Pyr and around 14–27% to the atmospheric 1-NP.
(4)
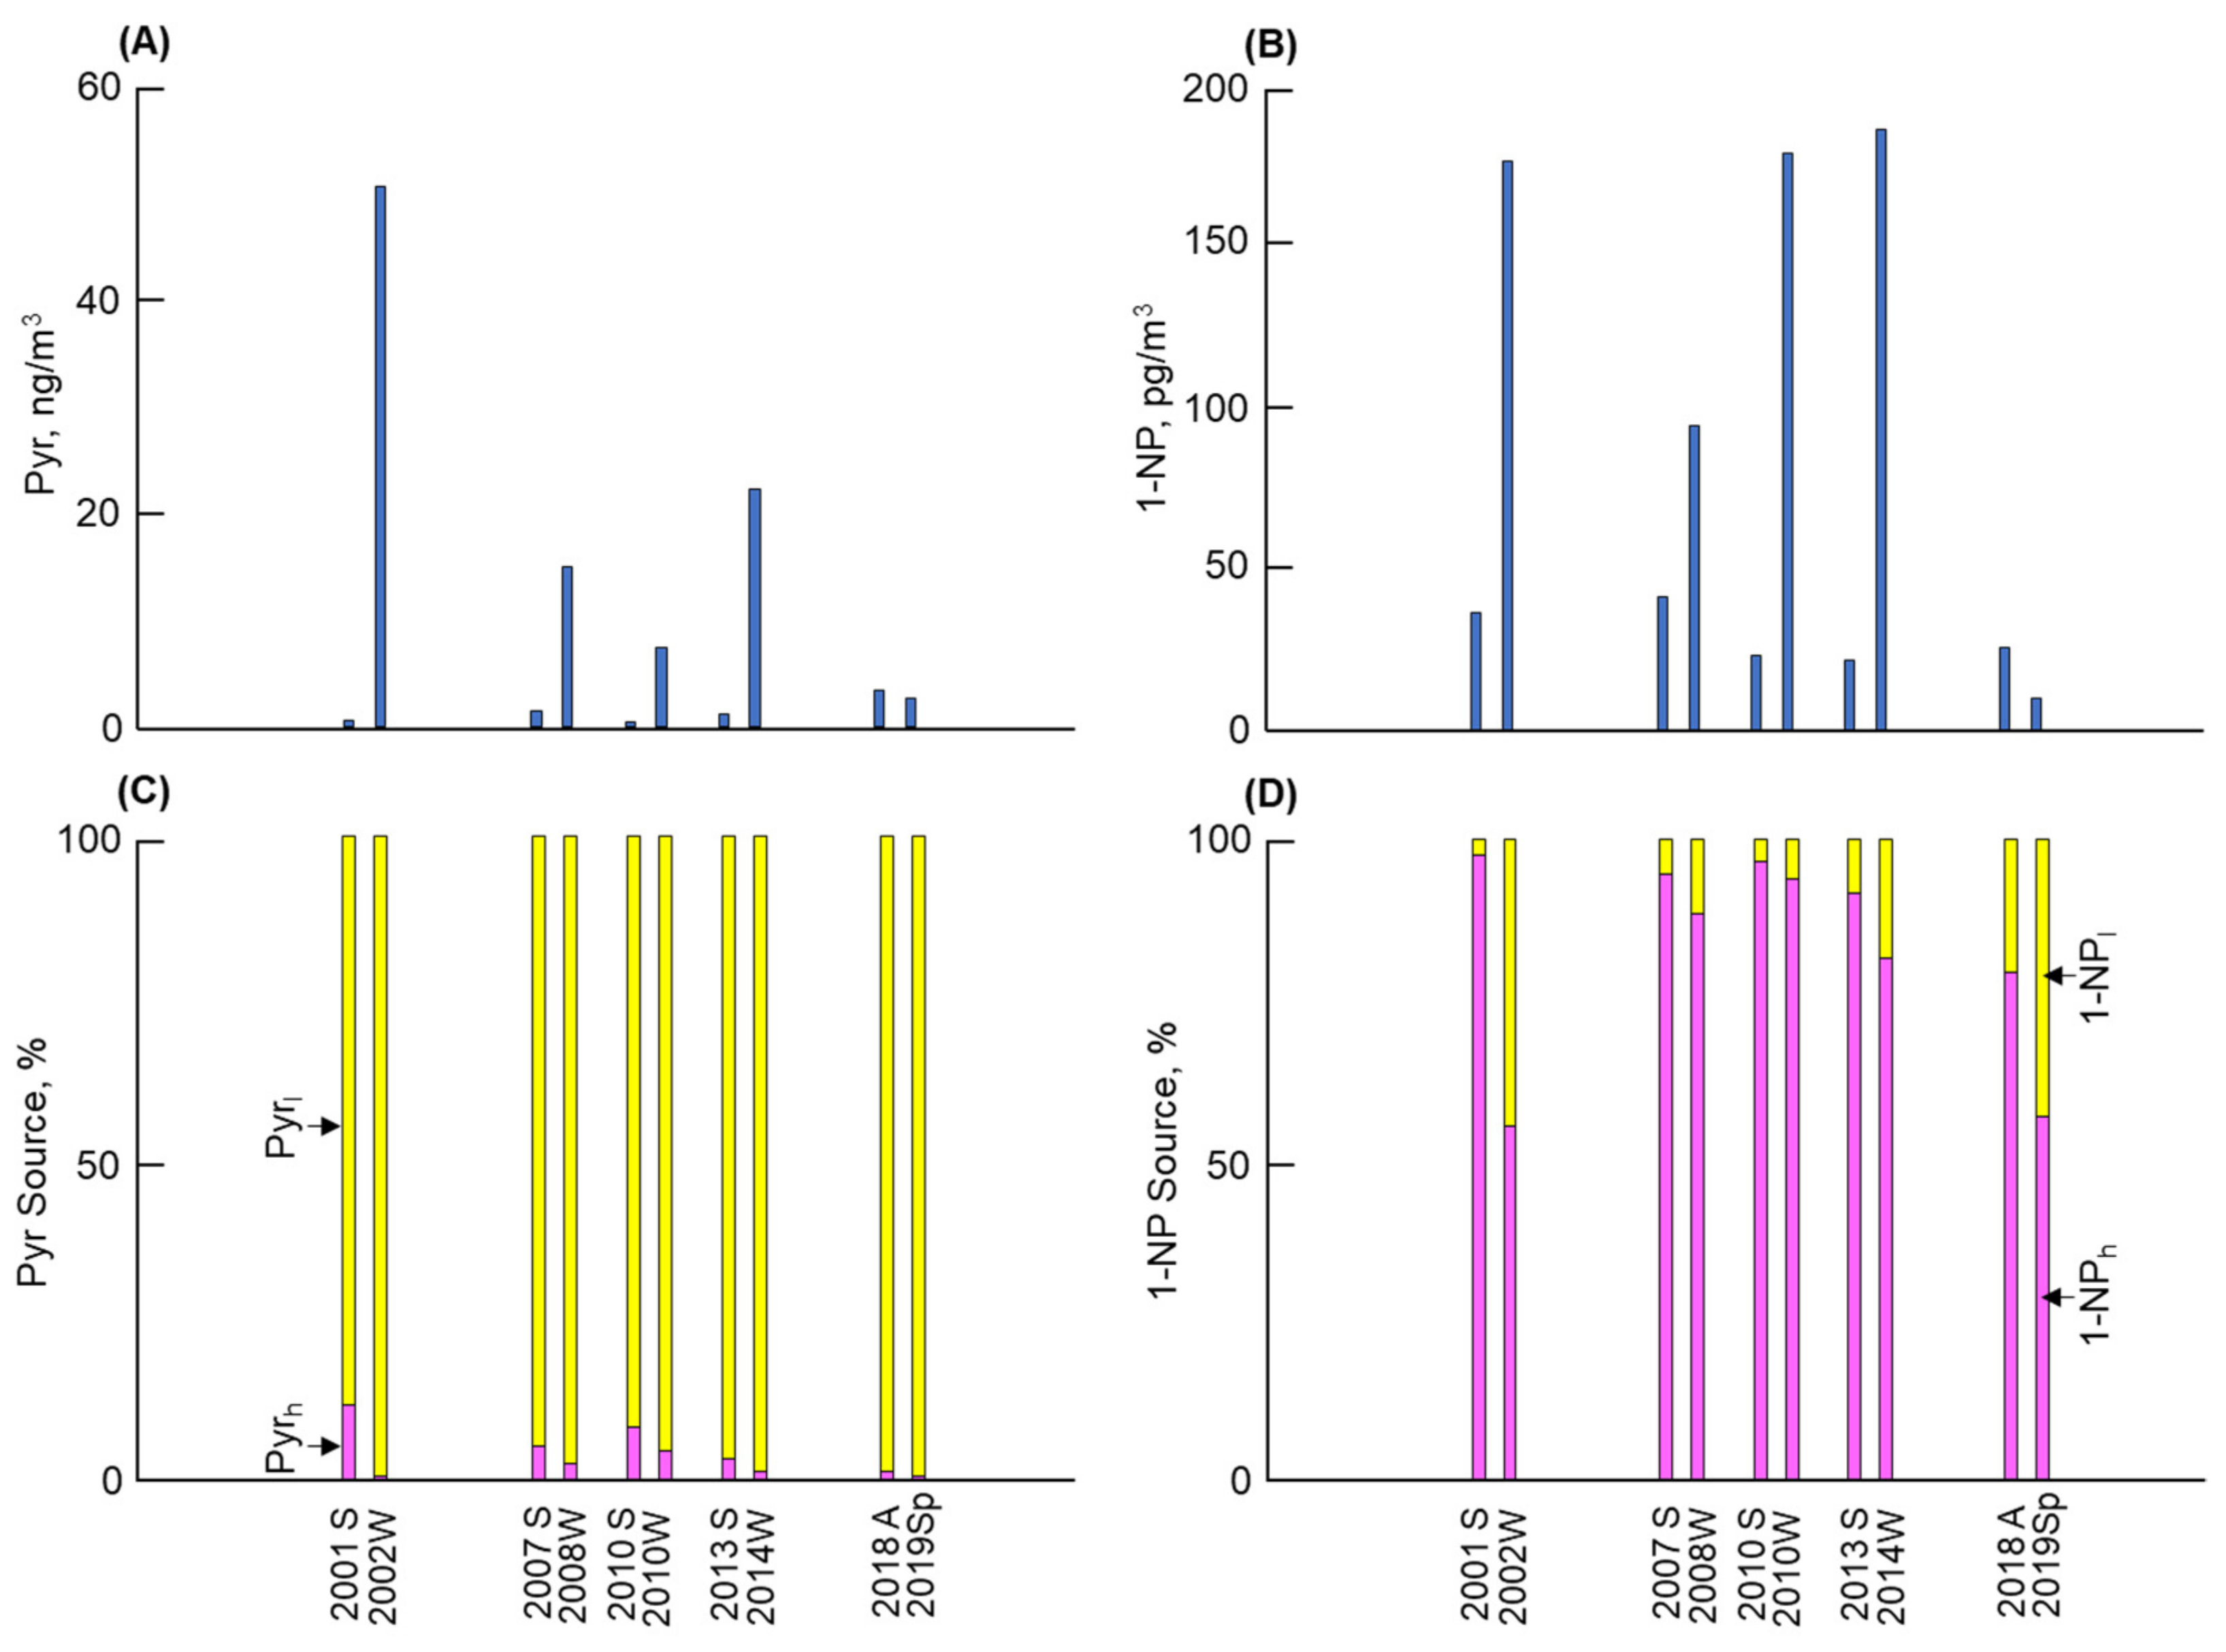
Shanghai revealed the second-highest atmospheric Pyr and 1-NP concentrations, but the former concentration was substantially lower than that in Shenyang. Coal combustion was the major contributor to Pyr and 1-NP, but vehicles still contributed 18% to the atmospheric Pyr before 2010. However, their contribution decreased to 1% after 2010 due to the development of technology for vehicle emissions.
(5)
Strong correlations between the Pyr and PAH concentrations and between the 1-NP and NPAH concentrations in the four cities indicate that the above results for Pyr and 1-NP can be considered in terms of the contributions of vehicles and coal combustion to PAHs and NPAHs, respectively.
It will be important to predict future trends of contributions of emission sources to atmospheric PAHs and NPAHs with social structure changes in the world. This paper shows that the emission sources of not only PM but also PAHs and NPAHs in the atmosphere can be analyzed using the NP method in not only the Western Pacific but also other regions.

Supplementary Materials

The following supporting information can be downloaded at https://www.mdpi.com/article/10.3390/atmos15060634/s1: Figure S1: Sampling cities in Western Pacific Region; Table S1: Characteristics of the sampling cities; Table S2: Values a and b with atmospheric concentrations of Pyr and 1-NP in four cities from 1997 to 2021; Text S1: Determination of PAHs and NPAHs. References [5,18,19,20,37] are cited in the Supplementary Materials.

Funding

This research was financially supported in part by the research fund from the Japan Automobile Research Institute.

Institutional Review Board Statement

Not applicable.

Informed Consent Statement

Not applicable.

Data Availability Statement

The data presented in this study are available in this article.

Acknowledgments

We would like to thank Tang. N. and students belonging to Kanazawa University for their contribution to analyzing PAHs and NPAHs. We would like to thank Nagato, G. E., Shimane University, Japan, for the English language editing.

Conflicts of Interest

The author declares no conflicts of interest.

References

  1. World Health Organization. Air Pollution and Child Health: Prescribing Clean Air. WHO Reference Number: WHO/CED/PHE/18.01.2018. Available online: https://who.int/bitstraam/handle/10665/275545/WHO-CED-PHE-18.1-erg.pdf (accessed on 2 April 2024).
  2. International Agency for Research on Cancer. Diesel and Gasoline Engine Exhausts and Some Nitroarenes. In IARC Monographs on the Evaluation on Carcinogenic Risks to Humans; International Agency for Research on Cancer: Lyon, France, 2014; Volume 105, ISBN 978-92-832-01434. [Google Scholar]
  3. Hayakawa, K. Chapter 22, Polycyclic aromatic hydrocarbons. In Handbook of Air Quality and Climate Change; Akimoto, H., Tanimoto, H., Eds.; eBook; Springer: Berlin/Heidelberg, Germany, 2022; ISBN 978-981-15-2527-8. [Google Scholar] [CrossRef]
  4. Japan Society of Atmospheric Environment. History of Atmospheric Pollution in Japan (Jpn: Nippon No Taikiosen No Rekishi); Kouken-Kyokai: Tokyo, Japan, 2000; ISBN 978484420101. [Google Scholar]
  5. Hayakawa, K.; Tang, N.; Nagato, E.G.; Toriba, A.; Sakai, S.; Kano, F.; Goto, S.; Endo, O.; Arashidani, K.; Kakimoto, H. Long term trends in atmospheric concentrations of polycyclic aromatic hydrocarbons and nitropolycyclic aromatic hydrocarbons: A study of Japanese cities from 1997 to 2014. Environ. Pollut. 2018, 233, 474–482. [Google Scholar] [CrossRef] [PubMed]
  6. Hayakawa, K.; Tang, N.; Nagato, E.; Toriba, A.; Lin, J.M.; Zhao, L.; Zhou, Z.; Qing, W.; Yang, X.; Mishukov, V.; et al. Long-term trends in urban atmospheric polycyclic aromatic hydrocarbons and nitropolycyclic aromatic hydrocarbons: China, Russia and Korea from 1999 to 2014. Int. J. Environ. Res. Public Heath 2020, 17, 431. [Google Scholar] [CrossRef] [PubMed]
  7. Hayakawa, K. Review: Environmental behaviors and toxicities of polycyclic aromatic hydrocarbons and nitropolycyclic aromatic hydrocarbon. Chem. Pharm. Bull. 2016, 64, 83–94. [Google Scholar] [CrossRef] [PubMed]
  8. Brown, S.G.; Eberly, S.; Paatero, P.; Norris, G.A. Methods for estimating uncertainty in PMF solutions: Examples with ambient air and water quality data and guidance on reporting PMF results. Sci. Total Environ. 2015, 518, 626–635. [Google Scholar] [CrossRef] [PubMed]
  9. Davis, E.; Walker, T.R.; Adams, M.; Willis, R. Estimating PAH sources in harbor sediments using diagnostic ratios. Remediat. J. 2019, 29, 51–62. [Google Scholar] [CrossRef]
  10. Masclet, P.; Bresson, M.A.; Mouvier, G. Polycyclic aromatic hydrocarbons emitted by power stations and influence of combustion conditions. Fuel 1987, 66, 556–562. [Google Scholar] [CrossRef]
  11. Manoli, E.; Kouras, A.; Samura, C. Profile analysis of ambient and source emitted particle-bound polycyclic aromatic hydrocarbons from three cites in northern Greece. Chemosphere 2004, 56, 867–878. [Google Scholar] [CrossRef] [PubMed]
  12. Schauer, J.J.; Rogge, W.F.; Hildemann, L.M.; Mazurek, M.A.; Cass, G.R.; Simoneit, B.T. Source appointment of airborne particulate matter using organic compounds as tracers. Atmos. Environ. 1996, 30, 3837–3855. [Google Scholar] [CrossRef]
  13. Yunker, M.B.; Macdonald, R.W.; Vingarzan, R.; Mitchell, R.H.; Goyette, D.; Sylvestre, S. PAHs in the Fraser River basin: A critical appraisal of PAH ratios as indicators of PAH source and composition. Org. Geochem. 2002, 33, 489–515. [Google Scholar] [CrossRef]
  14. Tobiszewski, M.; Nimiesnik, J. PAH diagnostic ratios for the identification of pollution emission sources. Environ. Pollut. 2012, 162, 110–119. [Google Scholar] [CrossRef]
  15. Hayakawa, K.; Tang, N.; Toriba, A.; Nagato, E.G. Calculating sources of combustion-derived particulates using 1-nitropyrene and pyrene as markers. Environ. Pollut. 2020, 265, 114730. [Google Scholar] [CrossRef] [PubMed]
  16. Hayakawa, K.; Tang, N.; Matsuki, A.; Inomata, Y.; Toriba, A.; Nagato, E.G. Calculating source contributions to urban atmospheric polycyclic aromatic hydrocarbons and nitropolycyclic aromatic hydrocarbons using 1-nitropyrene and pyrene: An application to an Asian dust event. Chemosphere 2021, 280, 130662. [Google Scholar] [CrossRef] [PubMed]
  17. Hayakawa, K.; Tang, N.; Toriba, A. Long-term and seasonal changes in sources of urban atmospheric particulates in the Western Pacific. Appl. Sci. 2022, 12, 2149. [Google Scholar] [CrossRef]
  18. Wise, S.A.; Phinney, K.W.; Sander, L.C.; Schantz, M.M. Review: Role of chromatography in the development of standard reference materials for organic analysis. J. Chromatogr. A 2012, 1261, 3–22. [Google Scholar] [CrossRef] [PubMed]
  19. Hayakawa, K.; Murahashi, T.; Butoh, M.; Miyazaki, M. Determination of 1,3-, 1,6-, and 1,8-dinitropyrenes and 1-nitropyrene in urban air by high-performance liquid chromatography using chemiluminescence detection. Environ. Sci. Technol. 1995, 29, 928–932. [Google Scholar] [CrossRef] [PubMed]
  20. Tang, N.; Taga, R.; Hattori, T.; Toriba, A.; Kizu, R.; Hayakawa, K. Simultaneous determination of twenty-one mutagenic nitropolycyclic aromatic hydrocarbons by high-performance liquid chromatography with chemiluminescence detection. In Proceedings of the 13th International Symposium, Bioluminescence and Chemiluminescence Progress and Perspective, Pacifico Yokihama, Japan, 2–6 August 2004; Tsuji, A., Maeda, M., Matsumoto, M., Krica, L., Stanley, P., Eds.; World Science: London, UK, 2005; pp. 441–444. [Google Scholar] [CrossRef]
  21. Hayakawa, K.; Tang, N.; Xing, W.; Oanh, P.K.; Hara, A.; Nakamura, H. Concentrations and sources of atmospheric PM, polycyclic aromatic hydrocarbons and nitropolycyclic aromatic hydrocarbons in Kanazawa, Japan. Atmosphere 2021, 12, 256. [Google Scholar] [CrossRef]
  22. Yang, L.; Zhang, X.; Xing, W.; Zhou, Q.; Zhang, L.; Wu, Q.; Zhou, Z.; Chen, R.; Toriba, A.; Hayakawa, K.; et al. Yearly variation in characteristics and health risk of polycyclic aromatic hydrocarbons and nitro-PAHs in urban Shanghai from 2010–2018. J. Environ. Sci. 2021, 99, 72–79. [Google Scholar] [CrossRef] [PubMed]
  23. Zhang, L.; Yang, L.; Kashiwakura, K.; Zhao, L.; Chen, L.; Han, C.; Nagao, S.; Tang, N. Autumn and spring observations of PM2.5-bound polycyclic aromatic hydrocarbons and nitro-polycyclic aromatic hydrocarbons in China and Japan. Environ. Pollut. 2024, 343, 123139. [Google Scholar] [CrossRef] [PubMed]
  24. Zajemska, M.; Poskart, A.; Musial, D. The kinetics of nitrogen oxides formation in the flame gas. Econ. Environ. Stud. 2015, 15, 445–460. Available online: https://www.econstor.eu/bitstream/10419/178898/1/ees_15_4_08.pdf (accessed on 2 April 2024).
  25. Hayakawa, K. Review: Recent research progress on nitropolycyclic aromatic hydrocarbons in outdoor and indoor environments. Appl. Sci. 2022, 12, 12544. [Google Scholar] [CrossRef]
  26. Miller-Schulze, J.P.; Paulsen, M.; Kameda, T.; Toriba, A.; Hayakawa, K.; Cassidy, B.; Naeher, L.; Villalobos, M.A.; Simpson, C.D. Nitro-PAH exposures of occupationally-exposed traffic workers and associated urinary 1-nitropyrene metabolite concentrations. J. Environ. Sci. 2016, 49, 213–221. [Google Scholar] [CrossRef] [PubMed]
  27. Rogge, W.F.; Hildemann, L.M.; Mazurek, M.A.; Cass, G.R. Sources of fine organic aerosol. 2. Noncatalyst and catalyst-equipped automobiles and heavy-duty diesel trucks. Environ. Sci. Technol. 1993, 27, 636–651. [Google Scholar] [CrossRef]
  28. Ministry of Health, Labour and Welfare (MHLW), Japan. Demographic Statistics. 2022. Available online: https://www.mhlw.go.jp/toukei/saikin/hw/jinkou/geppo/nengai03/index.html (accessed on 2 April 2024).
  29. Hama, H.; Tokuda, T.; Izaki, A.; Ohno, T.; Watanabe, Y.; Kanda, T.; Tang, N.; Kameda, T.; Toriba, A.; Hayakawa, K. Variation in polycyclic aromatic hydrocarbons and nitropolycyclic aromatic hydrocarbons in airborne particulates collected in urban Kanazawa, Japan, in last 12 years. J. Jpn. Soc. Atmos. Environ. 2012, 47, 1–8. [Google Scholar] [CrossRef]
  30. Yasuhiro, M. District heating in China and Japan: What both sides should learn. Dist. Heat. Coolong 2018, 119, 18–23. Available online: https://www.dhcjp.or.jp/cms_admin/wp-content/uploads/2018/03/119.pdf (accessed on 3 March 2024).
  31. Zhang, H.; Yang, L.; Zhang, X.; Xing, W.; Wang, Y.; Bai, P.; Zhang, L.; Li, Y.; Hayakawa, K.; Toriba, A.; et al. Characteristics and health risks of polycyclic aromatic hydrocarbons and nitro-PAHs in Xinxiang, China in 2015 and 2017. Int. J. Environ. Res. Public Health 2021, 18, 3017. [Google Scholar] [CrossRef] [PubMed]
  32. Kalisa, E.; Nagato, E.; Bizuru, E.; Lee, K.; Tang, N.; Pointing, S.; Hayakawa, K.; Archer, S.; Lacap-Bugler, D. Characterization and risk assessment of atmospheric PM2.5 and PM10 particulate-bound PAHs and NPAHs in Rwanda, Central-East Africa. Environ. Sci. Technol. 2018, 52, 12179–12187. [Google Scholar] [CrossRef] [PubMed]
  33. Yang, L.; Zhou, Q.; Zhang, H.; Zhang, X.; Xing, W.; Wang, Y.; Bai, P.; Yamaguchi, M.; Choji, T.; Zhang, L.; et al. Atmospheric behaviour of polycyclic and nitro-polycyclic aromatic hydrocarbons and water-soluble inorganic ions in winter in Kirishima, a typical Japanese commercial city. Int. J. Environ. Res. Public Health 2021, 18, 688. [Google Scholar] [CrossRef] [PubMed]
  34. Kalisa, E.; Nagato, E.; Bizura, E.; Lee, K.; Tang, N.; Pointing, S.; Hayakawa, K.; Archer, S.; Lacap-Bugler, D. Pollution characteristics of ambient PM2.5-bound PAHs and NPAHs in typical Japanese and New Zealand cities and rural sites. Atmos. Pollut. Res. 2019, 10, 1396–1403. [Google Scholar] [CrossRef]
  35. Shen, H.; Huang, Y.; Wang, R.; Zhu, D.; Li, W.; Shen, G.; Wang, B.; Zhang, Y.; Chen, Y.; Lu, Y.; et al. Global atmospheric emissions of polycyclic aromatic hydrocarbons from 1960 to 2008 and future predictions. Environ. Sci. Technol. 2013, 47, 6415–6424. [Google Scholar] [CrossRef] [PubMed]
  36. Hayakawa, K. Polycyclic aromatic hydrocarbons from vegetation burning and health effects: Special Issue “Air Pollution from vegetation fire and its health effects in Asia”. Glob. Environ. Res. 2023, 27, 13–20. [Google Scholar]
  37. Hayakawa, K.; Kitamura, R.; Butoh, M.; Imaizumi, N.; Miyazaki, M. Determination of diamino- and aminopyrenes by high-performance liquid chromatography with chemiluminescence detection. Anal. Sci. 1991, 7, 573–577. [Google Scholar] [CrossRef]
Figure 1. Atmospheric concentrations of Pyr and 1-NP and their sources in Kanazawa. (A) Pyr concentration, (B) 1-NP concentration, (C) sources of Pyr, (D) sources of 1-NP. S, summer; W, winter. The x-axis in (C,D) indicates the seasons and years of the samples collected. The y-axis in (C,D) shows the fraction (%) from combustion sources with high (h) and low (l) temperatures. Pyrh and Pyrl represent b[Pyr] and (1 − b)[Pyr], respectively. 1-NPh and 1-NPl represent a[1-NP] and (1 − a)[1-NP], respectively, calculated by the equations in Section 2.3.
Atmosphere 15 00634 g001
Figure 2. Atmospheric concentrations of Pyr and 1-NP and their sources in Kitakyushu. (A) Pyr concentration, (B) 1-NP concentration, (C) sources of Pyr, (D) sources of 1-NP. S, W, x- and y-axes in (C,D), Pyrh, Pyrl, 1-NPh and 1-NPl, the same as in Figure 1.
Atmosphere 15 00634 g002
Figure 3. Atmospheric concentrations of Pyr and 1-NP and their sources in Shenyang. (A) Pyr concentration, (B) 1-NP concentration, (C) sources of Pyr, (D) sources of 1-NP. S, summer; W, winter; A, autumn, Sp, spring. x- and y-axes in (C,D), Pyrh, Pyrl, 1-NPh and 1-NPl, the same as in Figure 1.
Atmosphere 15 00634 g003
Figure 4. Atmospheric concentrations of Pyr and 1-NP and their sources in Shanghai. (A) Pyr concentration, (B) 1-NP concentration, (C) sources of Pyr, (D) sources of 1-NP. S, W, x- and y-axes in (C,D), Pyrh, Pyrl, 1-NPh and 1-NPl, the same as in Figure 1.
Atmosphere 15 00634 g004
Table 2. Comparison of mean annual concentrations of Pyr and Pyrh before and after 2010 in four cities.
CityPyrPyrhPyrh/Pyr
(c) ≤2008
pg/m3
(d) ≥2010
pg/m3
d/c(e) ≤2008 pg/m3(f) ≥2010 pg/m3f/e≤2008
%
≥2010
%
Kanazawa338 ± 197154 ± 1280.46119 ± 887.4 ± 7.30.06355
Kitakyushu456 ± 234611 ± 7831.318 ± 178.0 ± 6.30.4441
Shenyang16,900 ± 23,4007430 ± 86000.44173 ± 129193 ± 1181.113
Shanghai4051040 ± 9502.67133 ± 320.46183
Monitoring periods are the same as in Table 1. Mean annual concentrations were calculated as mean ± SD of summer and winter concentrations of the period.
Table 3. Comparison of summer and winter concentrations of Pyr and Pyrl in four cities.
CityPyrPyrl
S, pg/m3W, pg/m3W/SS, pg/m3W, pg/m3W/S
Kanazawa169 ± 178304 ± 1761.8122 ± 110240 ± 1152.0
Kitakyushu239 ± 231797 ± 5423.3234 ± 228774 ± 5503.3
Shenyang971 ± 4732380 ± 188025913 ± 4682360 ± 188026
Shanghai567 ± 9141260 ± 7972.2540 ± 9111200 ± 7872.2
W and S denote winter and summer, respectively. Monitoring periods are the same as in Table 1. Summer and winter concentrations were calculated as mean ± SD of all summer and winter seasons, respectively.
Table 4. Comparison of annual concentrations of 1-NP and 1-NPl before and after 2010 in four cities.
City1-NP1-NPl1-NPl/1-NP
(c) ≤2008
pg/m3
(d) ≥2010
pg/m3
d/c(e) ≤2008
pg/m3
(f) ≥2010
pg/m3
f/e≤2008
%
≥2010
%
Kanazawa55 ± 454.5 ± 3.20.080.29 ± 0.210.24 ± 0.190.8315
Kitakyushu8.3 ± 6.15.2 ± 4.00.630.76 ± 0.420.98 ± 1.241.3919
Shenyang88 ± 6685 ± 900.9724 ± 3812 ± 140.502714
Shanghai 16 ± 18 1.2 ± 1.3 8
Monitoring periods are the same as in Table 1. Annual concentrations before 2008 (≤2008) and after 2010 (≥2010) were calculated as mean ± SD of all annual concentrations in the period.
Table 5. Comparison of summer and winter concentrations of 1-NP and 1-NPl in four cities.
City1-NP1-NPl
S, pg/m3W, pg/m3W/SS, pg/m3W, pg/m3W/S
Kanazawa22 ± 3933 ± 491.50.13 ± 0.080.36 ± 0.212.8
Kitakyushu2.9 ± 2.011 ± 4.33.80.6 ± 0.61.1 ± 1.02.0
Shenyang31 ± 9.8161 ± 445.11.5 ± 0.734 ± 3223
Shanghai4.8 ± 2.730 ± 186.20.23 ± 0.051.9 ± 1.38.3
W and S denote winter and summer, respectively. Monitoring periods are the same as in Table 1. Summer and winter concentrations were calculated as mean ± SD of all summer and winter seasons, respectively.
Disclaimer/Publisher’s Note: The statements, opinions and data contained in all publications are solely those of the individual author(s) and contributor(s) and not of MDPI and/or the editor(s). MDPI and/or the editor(s) disclaim responsibility for any injury to people or property resulting from any ideas, methods, instructions or products referred to in the content.

